Embed Size (px)
Citation preview

OCCAS IONAL PAPER SER IESNO. 51 / AUGUST 2006
MACROECONOMIC IMPLICATIONS OF DEMOGRAPHIC DEVELOPMENTS IN THE EURO AREA
by Angela Maddaloni, Alberto Musso, Philipp Rother, Melanie Ward-Warmedinger and Thomas Westermann
ISSN 1607148-4
9 7 7 1 6 0 7 1 4 8 0 0 6
In 2006 all ECB publications
feature a motif taken
from the €5 banknote.
OCCAS IONAL PAPER SER IE SNO. 51 / AUGUST 2006
MACROECONOMIC IMPLICATIONS OF
DEMOGRAPHIC DEVELOPMENTS IN
THE EURO AREA 1
by Angela Maddaloni, Alberto Musso, Philipp Rother,
Melanie Ward-Warmedinger and Thomas Westermann
This paper can be downloaded without charge from http://www.ecb.int or from the Social Science Research Network
electronic library at http://ssrn.com/abstract_id=922678.
1 We would like to thank Francesco Drudi, Neale Kennedy, Hans-Joachim Klöckers, Gerard Korteweg, Philippe Moutot, Ad van Riet, Wolfgang Schill, Ludger Schuknecht and an anonymous referee for useful comments and discussions on
previous versions of this paper.

© European Central Bank, 2006
AddressKaiserstrasse 2960311 Frankfurt am MainGermany
Postal addressPostfach 16 03 1960066 Frankfurt am MainGermany
Telephone+49 69 1344 0
Websitehttp://www.ecb.int
Fax+49 69 1344 6000
Telex411 144 ecb d
All rights reserved. Any reproduction, publication or reprint in the form of a different publication, whether printed or produced electronically, in whole or in part, is permitted only with the explicit written authorisation of the ECB or the author(s).
The views expressed in this paper do not necessarily reflect those of the European Central Bank.
ISSN 1607-1484 (print)ISSN 1725-6534 (online)

3ECB
Occasional Paper No. 51August 2006
CONTENTS
ABSTRACT 4
EXECUTIVE SUMMARY 5
1 INTRODUCTION 6
2 DEMOGRAPHIC DEVELOPMENTS 72.1 Demographic projections 72.2 Assumptions 102.3 Uncertainty 12
3 MECHANICAL IMPACT ON LONG-TERM GROWTH 143.1 The contribution to growth from
demographic developments (1960-2005) 16
3.2 Forward-looking scenarios for the euro area 17
4 LABOUR MARKET POLICIES 214.1 Labour market participation
and the unemployment rate of young people (aged 15-24) 21
4.2 Participation and employment of the prime-aged population (aged 25-54) 22
4.3 Early retirement and the participation rate of the 55-64 age group 23
4.4 Migration 24
5 EFFECTS ON FINANCIAL MARKETS 255.1 Changes in saving/investment
balances and the likely rise of saving for retirement 26
5.2 Changes in the structure of savings’ portfolios 27
5.3 Population ageing and the importance of f inancial intermediaries 29
6 PUBLIC FINANCES 326.1 Effects on public f inances 32
6.1.1 Pensions 326.1.2 Health and long-term care 336.1.3 Other direct f iscal effects 34
6.2 Reform options 356.2.1 Pension reform 356.2.2 Reform of health care systems 36
6.3 EU institutions and structural coordination 36
7 CONCLUSION 38
ANNEX 1GLOSSARY AND DATA SOURCES 41
ANNEX 2DEMOGRAPHIC DEVELOPMENTS IN EUROPE: THE EURO AREA VERSUS THE EUROPEAN UNION 43
ANNEX 3UN PROJECTIONS FOR INDIVIDUAL EURO AREA COUNTRIES 47
ANNEX 4DECOMPOSITION OF THE BROAD FACTORS OF GROWTH 50
ANNEX 5ADDITIONAL DETAILED DEMOGRAPHIC PROJECTIONS 51
REFERENCES 57
CONTENTS

4ECB Occasional Paper No. 51August 2006
ABSTRACT
This paper examines the macroeconomic consequences of future demographic trends for economic growth, f inancial markets and public f inances. It shows that in the absence of reforms and responses by economic agents, the currently projected demographic trends imply a decline in average real GDP growth and a severe burden in terms of pay-as-you-go pension and health care systems. Population ageing will change the f inancial landscape, with a potentially larger role for f inancial intermediaries and asset prices. All this points to a need to closely monitor demographic change also from a monetary policy perspective. While population projections are surrounded by considerable uncertainty and the effects of demographic change tend to be drawn out, the magnitude of the potential effects calls for an early recognition of this issue. This paper provides some input to the examination of possible policy issues.

5ECB
Occasional Paper No. 51August 2006
EXECUTIVE SUMMARY
In recent years, there has been an increased interest by policy-makers in future demographic trends and their macroeconomic consequences. In the European and euro area context, these trends are likely to be driven by lower fertility rates and a rising life expectancy. On the basis of corresponding assumptions, the projections available from Eurostat and the United Nations suggest that all euro area countries face the prospect of declining population growth, but that there are considerable differences with regard to the pace of this decline. For the euro area as a whole, the projections imply that after 2020 the population will start to shrink in absolute terms and that by 2050 every third person will be older than 64. Taken together, these developments would have important consequences for economic growth, f inancial markets and public f inances.
These trends and their consequences need to be explicitly taken into account when devising and pursuing the f iscal and economic policies that are necessary to foster sustainable economic growth and sound public f inances, in line with the requirements and targets set in the Stability and Growth Pact and in the Lisbon agenda. At the same time, the various macroeconomic consequences associated with changes in demographic trends would also have an impact on the equilibrium real rate of interest or the relative strength of the various channels of the monetary transmission mechanism, and thus point to a need for closely monitoring and assessing these consequences also from a monetary policy perspective. The main findings of the paper with regard to the consequences of changes in demographic trends for economic growth, labour markets, f inancial markets and public f inances are as follows.
First, under the assumption of an unchanged rate of change of labour utilisation and productivity growth, the projected demographic trends imply a decline in average real GDP growth to around 1% in the period from 2020 to 2050. The rise in the old age dependency
ratio implies that there would also be a decline in per capita growth. Scenario analysis conducted in a growth accounting framework portrays how the adverse demographic developments could be offset by improvements in labour utilisation and labour productivity. Individual measures to raise labour utilisation, such as increasing participation rates or reducing unemployment rates, partly face natural limits and a combination of offsetting factors is thus likely to be needed to sustain economic growth.
Second, the Employment Guidelines, which are part of the so-called EU Integrated Guidelines, provide a policy framework for mitigating or counteracting the adverse impact of future demographic trends on labour supply. It will be of particular importance to increase the participation of women of prime working age and thus to close the apparent gender gap in the group aged 25-54. Moreover, a number of euro area countries have a large potential to increase labour supply by raising average hours worked and the effective retirement age. In a number of cases, this implies a need to change progressive tax systems and early retirement schemes that often discourage labour market entry, particularly of women and older workers.
Third, the paper identif ies a number of direct and indirect linkages between population dynamics and f inancial market developments. Population ageing will prompt changes in the saving/investment balance of households. Simulations based on dynamic general equilibrium models predict a decline in real interest rates due to an increase in the capital intensity of production and a decrease in the investment needed to maintain the capital stock. At the same time, individuals belonging to different generations tend to choose a different mixture of assets in terms of risk. This will translate into lower asset prices when a larger generation of retired people sell their assets to a smaller generation of middle-aged people. All in all, the predictions arising from theoretical models about the size of these effects are subject to a number of caveats and highly uncertain. At
EXECUT IVE SUMMARY

6ECB Occasional Paper No. 51August 2006
the same time, it appears relatively safe to predict that population ageing and the implied increase in overall funds used to f inance pensions and retirement will increase the role of f inancial intermediaries within the f inancial system.
Fourth, the ageing of the population and the possible consequence in terms of lower growth in per capita incomes will have implications for pay-as-you-go (PAYG) pension and health care systems. Simulations suggest that in the absence of reforms – and even under favourable assumptions with regard to labour market developments – expenditures on pensions and health will in future take up a considerably higher share of national income. Reform options include the introduction of partially funded pension arrangements, possibly in combination with a transformation of PAYG systems into so-called notional defined-contribution schemes, as well as the setting of appropriate economic incentives for the supply and demand of health care services.
This paper does not assess explicitly the macroeconomic consequences of demographic change for monetary policy. Changes in demographic trends take place only slowly and the effects might hence have only modest implications for monetary policy over the relevant medium-term horizons. At the same time, the discussion in this paper of the impact of demographic change on different markets and other policy areas can be seen as an initial necessary step towards an assessment of implications for monetary policy. For instance, the impact of demographic developments on economic growth and f inancial markets will affect the equilibrium real interest rate or the relative importance of the channels through which interest rates affect economic activity and prices. For monetary policy, this points at a minimum to a need to be aware of the various macroeconomic effects that can be associated with demographic change.
1 INTRODUCTION
In recent years, there has been an increased interest by policy-makers in future demographic trends and their macroeconomic consequences. In the European and euro area context, this reflects a rising awareness that the combination of low fertility rates and rising life expectancy will inevitably imply declines in population growth and a gradual ageing of the population in coming decades. These trends will have far-reaching implications with regard to issues such as longer-term growth prospects, f inancial market developments and the f inancing of social security systems. Explicitly taking into account future demographic trends is thus, for instance, important in devising and pursuing the f iscal and economic policies that are necessary to foster sustainable economic growth and sound public f inances, in line with the requirements and targets set in the Stability and Growth Pact and in the Lisbon agenda.
Against this background, this paper reviews the major demographic trends in the euro area implied by currently available projections and discusses the potential implications for three main policy areas, namely labour markets, f inancial markets and public f inances. The analysis is conditional in a number of respects. First, while the major trends in population dynamics form slowly and can thus be relatively confidently projected, they are based on specific assumptions with regard to fertility, mortality and migration, and are thus inevitably surrounded by considerable uncertainty. Second, the impact that demographic developments have on the performance in the different policy areas is largely discussed in a ceteris paribus context, abstracting to a large extent from the interactions between different effects and policy measures that would be ground out in a general equilibrium context.
In view of the secular nature, uncertainty and complexity of the effects of changes in demographic trends on different markets, a discussion of concrete implications for a
7ECB
Occasional Paper No. 51August 2006
medium-term-oriented monetary policy would inevitably entail highly speculative elements and is not part of this paper. At the same time, the focus in this paper on the impact of demographic change on different markets and other policy areas can be seen as a necessary initial step towards any further discussion of potential implications for monetary policy paradigms. For instance, with regard to the equilibrium real rate of interest, it is important to assess the dampening impact on economic growth associated with declining population growth and the ageing of the population. Similarly, to understand the monetary transmission mechanism it is important to assess the possibility of a rising importance of wealth effects if older persons have a higher propensity to consume out of wealth than younger ones.
The remainder of the paper is organised as follows. Section 2 reviews the available projections and their underlying assumptions for demographic trends in the euro area and compares them with those in the United States. While all euro area countries face the prospect of declining population growth, there are considerable differences with regard to the pace of the decline and to the possibility that populations might shrink in absolute terms. Section 3 uses a growth accounting framework to discuss the implications of the future demographic trends for economic growth. A scenario analysis is conducted to portray how the adverse demographic developments could be offset by improvements in labour utilisation and labour productivity. Section 4 underpins this scenario analysis by outlining the scope for euro area countries to increase participation and reduce unemployment in line with the Employment Guidelines which are part of the so-called EU Integrated Guidelines. Section 5 discusses the direct and indirect linkages between population dynamics and f inancial market developments, ranging from effects on the saving/investment balance, on the allocation of wealth and thus on asset prices, to effects on f inancial structures via an increasing role for f inancial intermediaries. Section 6 examines
the impact that an ageing population can have on public expenditures on pension systems and health care. Section 7 concludes.
2 DEMOGRAPHIC DEVELOPMENTS
2.1 DEMOGRAPHIC PROJECTIONS
This section provides an overview of past and projected demographic developments for the euro area and the United States (US). Using data from Eurostat1 and the United Nations (UN), it is possible to cover a sample period spanning from 1950 to 2050 for both economic areas. While the main focus is on the euro area, it is likely that several, or even all, non-EMU members of the European Union (EU) will have joined Economic and Monetary Union (EMU) before 2050. Therefore, a comparison with the current EU aggregate can provide useful indications on developments in the future (enlarged) euro area (see Annex 2). The US represents a natural reference, due to its geographical and economic similarities to the euro area, and a comparison of European and US developments can provide lessons for both areas on how to cope with the macroeconomic implications of demographic projections. Annex 1 provides more details on the data sources and def initions of the variables discussed.
Projections from Eurostat and the UN, based on specific assumptions for fertility, life expectancy and migration, point to a gradual decline in euro area total population growth in the period up to 2050, albeit with some differences
1 For the euro area the demographic projections prepared by Eurostat for the Ageing Working Group of the Economic Policy Committee of the EU and released in February 2006 are taken as main reference (see EPC and European Commission (2006) for more details). However, also the projections released by Eurostat in April 2005 (available in the New Cronos database, revision 2005) are taken into account as they also provide useful complementary information, such as alternative scenarios based on different assumptions for fertility, mortality and migration. The two sets of projections (the one of 2006 and the baseline scenario of 2005) provide a very similar picture for the euro area as a whole.
2 DEMOGRAPHIC DEVELOPMENTS

8ECB Occasional Paper No. 51August 2006
regarding the pace of decline (see Chart 1).According to the most likely scenario (referred to as the “baseline variant” by Eurostat or the “medium variant” by the UN), the euro area population will start to decline after 2020 and by 2050 the rate of decline will be between ¼% and ½% per annum. A very similar pattern is projected for the EU (see Chart A in Annex 2). However, aggregate f igures for the EU conceal diverse developments at the country level. The heterogeneity at the country level can be illustrated by the ranges of projections for specific factors. For example, in some euro area countries, the total population is projected by the UN (see Annex 3) to decline within the next 5 to 10 years (e.g. in Germany, Greece and Italy). In others, the decline in total population is not predicted to begin for at least another 20 years (including Belgium, France, the Netherlands, Austria, Portugal and Finland) or not at all over the period considered (notably in Ireland and Luxembourg). In contrast to European developments and despite a declining pattern, for the US, total population growth is projected to remain positive and by 2050 it is projected to be between ¹/³% and ²/³% per annum.
Thus, in the euro area, total population is projected to increase from the current level of about 310 million to about 320 million in 2025 and to gradually decrease thereafter to just below 310 million in 2050. The EU projections follow a similar pattern, increasing from the current level of about 460 million to almost 470 million in 2025 and subsequently decreasing to about 450 million in 2050. The US total population, by contrast, would increase gradually from the current level of about 295 million to about 350 million in 2050 and to about 395 million in 2050.
With regard to the growth in potential labour supply, the negative trend in population growth in Europe is aggravated by the fact that the decline in population growth is not balanced across age groups but reflects mainly lower growth in the working age population (defined as persons aged 15 to 64). As regards the euro area, for instance, working age population is projected by both Eurostat and the UN to start to decline after 2010, at a rate of 0.2% to 0.3% per annum in the period up to 2020, and at a rate of 0.4% to 0.8% thereafter up to 2050 (see Chart 2). At the same time, the number of
Chart 1 Past and projected total population growth in the euro area and the United States
(percentages)
Sources: ECB calculations based on Eurostat and UN data and projections.Note: Eurostat: euro area projections prepared by Eurostat for the Ageing Working Group of the Economic Policy Committee of the EU and released in February 2006. UN: UN’s World Population Database (2004 revision).
United States
-1.0
-0.5
0.0
0.5
1.0
1.5
2.0
-1.0
-0.5
0.0
0.5
1.0
1.5
2.0
-1.0
-0.5
0.0
0.5
1.0
1.5
2.0
-1.0
-0.5
0.0
0.5
1.0
1.5
2.0
EurostatUN
Euro area
1 2 3 4 5 6 7 8 9 10 11 12 13 14 15 16 17 18 19 20 1 2 3 4 5 6 7 8 9 10 11 12 13 14 15 16 17 18 19 20
4 1965-705 1970-756 1975-80
1 1950-552 1955-603 1960-65
7 1980-858 1985-909 1990-95
10 1995-200011 2000-0512 2005-10
19 2040-4520 2045-50
13 2010-1514 2015-2015 2020-25
16 2025-3017 2030-3518 2035-40

9ECB
Occasional Paper No. 51August 2006
persons not of working age is expected to increase by more than ½% per annum up to 2020, by rates close to 1% subsequently up to 2040 and only thereafter to decelerate. This implies a gradual rise in the overall dependency ratio, which is projected to accelerate after 2020, reaching levels close to 80% by 2050
from the current levels of about 50% (see Chart 3). The rise in the overall dependency ratio is essentially due to a rise in the dependency ratio for those older than 64 rather than for those younger than 15. More precisely, the old age dependency ratio is projected to continue to increase, reaching a level close to 55% by 2050
Chart 2 Past and projected working age population growth in the euro area and the United States(percentages)
Sources: ECB calculations based on Eurostat and UN data and projections.Note: Eurostat: euro area projections prepared by Eurostat for the Ageing Working Group of the Economic Policy Committee of the EU and released in February 2006. UN: UN’s World Population Database (2004 revision).
United States
-1.0
-0.5
0.0
0.5
1.0
1.5
2.0
-1.0
-0.5
0.0
0.5
1.0
1.5
2.0
-1.0
-0.5
0.0
0.5
1.0
1.5
2.0
-1.0
-0.5
0.0
0.5
1.0
1.5
2.0
EurostatUN
Euro area
1 2 3 4 5 6 7 8 9 10 11 12 13 14 15 16 17 18 19 20 1 2 3 4 5 6 7 8 9 10 11 12 13 14 15 16 17 18 19 20
4 1965-705 1970-756 1975-80
1 1950-552 1955-603 1960-65
7 1980-858 1985-909 1990-95
10 1995-200011 2000-0512 2005-10
19 2040-4520 2045-50
13 2010-1514 2015-2015 2020-25
16 2025-3017 2030-3518 2035-40
Chart 3 Past and projected dependency ratios in the euro area and the United States
(percentages)
Sources: ECB calculations based on Eurostat and UN data and projections.Note: Eurostat: euro area projections prepared by Eurostat for the Ageing Working Group of the Economic Policy Committee of the EU and released in February 2006. UN: UN’s World Population Database (2004 revision).
United States
EurostatUN
Euro area
45
50
55
60
65
70
75
80
85
45
50
55
60
65
70
75
80
85
45
50
55
60
65
70
75
80
85
45
50
55
60
65
70
75
80
85
1950 198019701960 20001990 20202010 2030 2040 2050 1950 198019701960 20001990 20202010 2030 2040 2050
2 DEMOGRAPHIC DEVELOPMENTS

10ECB Occasional Paper No. 51August 2006
from the current level of about 26% (see Chart 4). By contrast, the young age dependency ratio is expected to stabilise at levels close to 24%, after having declined gradually from almost 40% in 1970.
Projected developments for the EU are very similar to those for the euro area, although the dependency ratio is anticipated to increase at slightly lower rates, reaching levels of about 3% lower than the euro area by 2050, essentially due to the slightly lower increase in the old age dependency ratio (see Charts B to D in Annex 2). All countries of the euro area are expected to experience an increase (decrease) in the percentage of their population aged 65 and over (aged 15-64) and therefore an increase in their old age dependency ratios over the projection horizon (see Chart A in Annex 3). Again, the extent of this increase varies considerably across countries, ranging from an increase of over 40 percentage points (for Greece, Spain and Italy) down to under 20 percentage points (for Luxembourg). In 2050, the two highest projected old age dependency ratios stand at 65% (Italy) and 68% (Spain) and the lowest at 35% (Luxembourg).
By contrast, for the US, projected developments differ substantially in several respects. Working
age population growth is projected to decline gradually from the current levels of about 1% per annum to about 0.2% in 2020, and subsequently to recover and stabilise at about 0.5% per annum. The dependency ratio is also expected to increase between 2010 and 2030, from about 50% to levels between 60% and 65%, and stabilise thereafter. While these levels are not unprecedented, as they are not higher than those recorded in the 1960s, they result from divergent patterns in age-specif ic dependency ratios: similar to Europe, the young age dependency ratio is anticipated to stabilise, while the old age dependency ratio is expected to increase. However, the increase in the old age dependency ratio in the US is projected to be signif icantly lower than in the euro area. Thus, the main difference between the euro area (and the EU) and the US is that, while both areas face a process of gradual ageing, in Europe it is more marked: the gap in old age dependency ratios is projected to increase from about 7% in the current period to more than 15% by 2050.
2.2 ASSUMPTIONS
Populations grow through the interaction of three factors: fertility, mortality (or life expectancy) and migration. Projections such as
Chart 4 Past and projected age-specific dependency ratios in the euro area and the United States(percentages)
Sources: ECB calculations based on Eurostat and UN data and projections.Note: Eurostat: euro area projections prepared by Eurostat for the Ageing Working Group of the Economic Policy Committee of the EU and released in February 2006. UN: UN’s World Population Database (2004 revision).
United States Euro area
05
1015202530354045505560
051015202530354045505560
05
1015202530354045505560
051015202530354045505560
old age dependency ratio (Eurostat)old age dependency ratio (UN)
young age dependency ratio (Eurostat)young age dependency ratio (UN)
1950 198019701960 20001990 20202010 2030 2040 2050 1950 198019701960 20001990 20202010 2030 2040 2050

11ECB
Occasional Paper No. 51August 2006
those published by Eurostat and the UN are based on specif ic assumptions with regard to these factors. The projection assumptions are formulated on the basis of past demographic trends and their likely future dynamics, but it should be borne in mind that the projections simply illustrate conditional future changes. Moreover, the projections take into account only to a limited extent an assessment of non-demographic factors such as possible major policy decisions with regard to the three factors mentioned above.
Fertility denotes the number of children per woman. In 2000, the fertility rate in the euro area was on average below 1.6 (ranging from 1.3 in Greece, Spain and Italy to 2.0 in Ireland). The euro area countries are thus within the group of so-called low-fertility countries, i.e. fertility rates below the replacement rate of 2.1 children per woman. As regards the baseline variants of the projections, the UN projections assume a gradual increase in the average euro area fertility rate to around 1.8 in 2050, while Eurostat assumes a broadly unchanged fertility rate at the current levels (see Chart 5). For the EU a gradual increase is assumed from the
current level of 1.5 to about 1.6 (by Eurostat) or 1.8 (by the UN). North-American fertility rates, currently at about 2.0, are higher than in Europe (on average), but in the US they are projected (by the UN) to gradually decrease to 1.9 by 2050. Under the medium variant, fertility rates are thus expected to remain too low to ensure a natural replacement of the population or to stabilise the population’s age structure in all economic areas under analysis.
Life expectancy (at birth) is assumed to increase over the projection period up to 2050 in both Europe and the US. Projections across institutions and for all economic areas considered tend to be very similar. Overall, total life expectancy is projected to increase from the current level of about 78 years to about 83 years in 2050 (see Chart 6). Male life expectancy would increase from about 75 years to about 81 years, while female life expectancy would reach a level of about 86 years from the current approximately 81 years.
Migration is generally assumed to develop in line with past flows, but to some extent also the policy stance of countries with regard to
Chart 5 Past and projected fertility rates in the euro area and the United States
(percentages)
Sources: ECB calculations based on Eurostat (New Cronos database) and UN (UN’s World Population Database, 2004 revision) data and projections.
United States Euro area
0.0
0.5
1.0
1.5
2.0
2.5
3.0
3.5
4.0
0.0
0.5
1.0
1.5
2.0
2.5
3.0
3.5
4.0
0.0
0.5
1.0
1.5
2.0
2.5
3.0
3.5
4.0
0.0
0.5
1.0
1.5
2.0
2.5
3.0
3.5
4.0
total fertility rate (UN)total fertility rate (Eurostat)teplacement fertility rate
1 2 3 4 5 6 7 8 9 10 11 12 13 14 15 16 17 18 19 20 1 2 3 4 5 6 7 8 9 10 11 12 13 14 15 16 17 18 19 20
4 1965-705 1970-756 1975-80
1 1950-552 1955-603 1960-65
7 1980-858 1985-909 1990-95
10 1995-200011 2000-0512 2005-10
19 2040-4520 2045-50
13 2010-1514 2015-2015 2020-25
16 2025-3017 2030-3518 2035-40
2 DEMOGRAPHIC DEVELOPMENTS

12ECB Occasional Paper No. 51August 2006
migration is taken into account. Available projections assume net inward migration to the euro area, but they do not expect an increase in the net migration ratio (as a percentage of the population) in the period up to 2050. In fact, the net migration rate is expected to fall up to 2010 and thereafter to stabilise in the euro area (and the EU) (see Chart 7). In the US a gradual decrease is projected but the level of the net migration rate is assumed to remain well above European levels. The different net migration
rates across economic areas also explain the different fertility rates and dependency ratios, as migrants tend to be, for example, relatively young and increase average birth rates.
2.3 UNCERTAINTY
When assessing projected demographic trends, it should be borne in mind that the uncertainty surrounding population projections is fairly
Chart 7 Past and projected net migration rates in the euro area and the United States
(percentages)
Sources: ECB calculations based on Eurostat (New Cronos database) and UN (UN’s World Population Database, 2004 revision) data and projections.Note: Eurostat averages for 2000-2005 (dashed segments) are based on data for 2004 and 2005 only.
United States
net migration rate (UN)net migration rate (Eurostat)
1995-2000
2000-2005
2005-2010
2010-2015
2015-2020
2020-2025
2025-2030
2030-2035
2035-2040
2040-2045
2045-2050
1995-2000
2000-2005
2005-2010
2010-2015
2015-2020
2020-2025
2025-2030
2030-2035
2035-2040
2040-2045
2045-2050
Euro area
0
1
2
3
4
5
0
1
2
3
4
5
0
1
2
3
4
5
0
1
2
3
4
5
Chart 6 Past and projected life expectancy in the euro area and the United States
(percentages)
Sources: ECB calculations based on Eurostat (New Cronos database) and UN (UN’s World Population Database, 2004 revision) data and projections.
United States
life expectancy at birth (Eurostat)life expectancy at birth (UN)
Euro area
60
65
70
75
80
85
90
60
65
70
75
80
85
90
60
65
70
75
80
85
90
60
65
70
75
80
85
90
1 2 3 4 5 6 7 8 9 10 11 12 13 14 15 16 17 18 19 20 1 2 3 4 5 6 7 8 9 10 11 12 13 14 15 16 17 18 19 20
4 1965-705 1970-756 1975-80
1 1950-552 1955-603 1960-65
7 1980-858 1985-909 1990-95
10 1995-200011 2000-0512 2005-10
19 2040-4520 2045-50
13 2010-1514 2015-2015 2020-25
16 2025-3017 2030-3518 2035-40

13ECB
Occasional Paper No. 51August 2006
high. Typically, the uncertainty increases with the length of the projection period, but projection errors can occur even over relatively short horizons. The degree of uncertainty characterising demographic projections can be gauged in various ways. First of all, all
institutions adopt alternative scenarios for each of the three main factors underlying the projections, i.e. fertility, mortality and migration. These alternative sets of assumptions lead to alternative variants of projections, the range of which is often large. For example,
Chart 9 Past projection errors for the euro area
(percentages)
Sources: ECB calculations based on Eurostat (New Cronos database) data and projections.
0.0
0.1
0.2
0.3
0.4
0.5
0.6
0.7
0.0
0.1
0.2
0.3
0.4
0.5
0.6
0.7
2000 2001 2002 2003 2004
2005 estimates 1999 projections
Total population growth
Working age population growth
Dependency ratio
0.0
0.1
0.2
0.3
0.4
0.5
0.6
0.7
0.0
0.1
0.2
0.3
0.4
0.5
0.6
0.7
2000 2001 2002 2003 2004
48.0
48.5
49.0
49.5
50.0
48.0
48.5
49.0
49.5
50.0
2000 2001 2002 2003 2004
Chart 8 Alternative scenarios for projected population growth in the euro area
(percentages)
Sources: ECB calculations based on Eurostat (New Cronos database) data and projections.
-1.0
-0.5
0.0
0.5
1.0
-1.0
-0.5
0.0
0.5
1.0
Eurostat baselineEurostat highEurostat lowEurostat no migrationEurostat high fertility
-1.5
-1.0
-0.5
0.0
0.5
1.0
1.5
-1.5
-1.0
-0.5
0.0
0.5
1.0
1.5
45
50
55
60
65
70
75
80
85
90
45
50
55
60
65
70
75
80
85
90
Total population growth
Working age population growth
Dependency ratio
1950 198019701960 20001990 20202010 2030 2040 2050
1 2 3 4 5 6 7 8 9 10 11 12 13 14 15 16 17 18 19 20
1 2 3 4 5 6 7 8 9 10 11 12 13 14 15 16 17 18 19 20
6 1975-807 1980-858 1985-909 1990-9510 1995-2000
1 1950-552 1955-603 1960-654 1965-705 1970-75
11 2000-0512 2005-1013 2010-1514 2015-2015 2020-25
16 2025-3017 2030-3518 2035-4019 2040-4520 2045-50
2 DEMOGRAPHIC DEVELOPMENTS

14ECB Occasional Paper No. 51August 2006
Eurostat releases four variants of projections in addition to the baseline: one based on relatively optimistic assumptions (“high” variant), another derived from a relatively pessimistic scenario (“low” variant) and two obtained by assuming high fertility rates and no migration, respectively. As regards the euro area, these variants lead to projections for total population growth gradually decreasing to between 0.1% and -0.8% in 2050
(see Chart 8). Thus, according to the “high” population variant, the euro area population would increase to more than 350 million by 2050, while the “no migration” variant would lead to a reduction of the population to about 265 million by 2050 (i.e. even less than the “low” population variant, signalling that the migration assumption plays a fundamental role). All variants lead to a gradual increase of the total dependency ratio to about 80% by 2050, except the “no migration” variant, according to which this ratio would increase even more, to about 85% by 2050.
The uncertainty which affects all assumptions on which demographic projections are based leads inevitably to forecast errors. According to 2005 Eurostat estimates, actual population growth in the period 2000-2004 was around 0.4% per annum, twice as strong as previously anticipated in the Eurostat 1999 revision of projections (see Chart 9).
The uncertainty of projections is also reflected by the revisions to the projections over time. These can be signif icant both at short time horizons and at long horizons. For example, according to the 1999 revision of the projections by Eurostat, euro area total population growth was anticipated to increase by about 0.2% per year between 2000 and 2005, while it is now estimated to have increased by about 0.5% per year (see Chart 10). While, in the short run, previous projections proved to be overly pessimistic, for the long run projections have become more pessimistic. For example, according to Eurostat the euro area total dependency ratio is now projected to reach a level of about 80% by 2050 (2005 revision), while previously it was expected to increase to less than 75% (1999 revision).
3 MECHANICAL IMPACT ON LONG-TERM GROWTH
The assessment of the impact of demographic developments on economic growth can be undertaken from different perspectives. Model-
Chart 10 Revisions of projections for the euro area
(percentages)
Sources: ECB calculations based on Eurostat data and projections.Note: The 1999 and 2004 vintages of projections are from the New Cronos database while the 2006 vintage consists of the projections prepared by Eurostat for the Ageing Working Group of the Economic Policy Committee of the EU and released in February 2006.
-0.6
-0.4
-0.2
0.0
0.2
0.4
0.6
-0.6
-0.4
-0.2
0.0
0.2
0.4
0.6
Eurostat 1999Eurostat 2004Eurostat 2006
1995-2000
2000-2005
2005-2010
2010-2015
2015-2020
2020-2025
2025-2030
2030-2035
2035-2040
2040-2045
2045-2050
Total population growth
Working age population growth
Dependency ratio
1995-2000
2000-2005
2005-2010
2010-2015
2015-2020
2020-2025
2025-2030
2030-2035
2035-2040
2040-2045
2045-2050
-1.0
-0.8
-0.6
-0.4
-0.2
0.0
0.2
0.4
-1.0
-0.8
-0.6
-0.4
-0.2
0.0
0.2
0.4
45
50
55
60
65
70
75
80
85
45
50
55
60
65
70
75
80
85
2000 2005 2010 2015 2020 2025 2030 2035 2040 2045 2050

15ECB
Occasional Paper No. 51August 2006
based approaches have the advantage of allowing for (at least some of) the interactions of the factors of growth to be explicitly taken into account. However, such approaches have the disadvantage that often results depend critically on the specif ication of the model, which is very diff icult to assess. An alternative approach, adopted in this section, is to examine the contributions of the factor inputs from an accounting perspective. Growth accounting frameworks have the advantage of not depending on specif ic assumptions regarding behavioural and technology functions. However, it has to be borne in mind that growth accounting exercises should only represent a starting-point for an exhaustive analysis of the impact of demographic developments on growth, as they cannot disentangle the interactions among the factors of growth and only allow for the role of the immediate, or proximate, sources of growth to be quantif ied, while being silent on the ultimate, or fundamental, sources of growth.
In this section, first a backward-looking growth accounting exercise is carried out for the euro area and the US with reference to the period 1960-2005. A lack of data for some labour utilisation components for a number of non-EMU EU member countries over the whole period does not allow a similar exercise to be undertaken also for the EU. Second, in a forward-looking part a number of simulations for the euro area are discussed, considering a time horizon up to 2050. In particular, the impact on real GDP and real GDP per capita of alternative assumptions for the developments in the factors of growth, given the demographic projections, is simulated.2
2 A similar exercise for the euro area is included in A. Musso and T. Westermann (2005), “Assessing potential output growth in the euro area – a growth accounting perspective”, ECB Occasional Paper No 22. Compared with that study, which focuses on the period 1980-2020, the calculations of the present section refer to a longer time period and provide more details on the specif ic demographic components. Moreover, the present analysis also includes a comparison with the US. At the same time, the discussion of the specific labour utilisation components is less detailed and therefore the current exercise can be seen as complementary to that of Musso and Westermann.
Table 1 Growth accounting for the euro area, 1960-2005 (percentages)
Sources: ECB calculations based on Eurostat, Groningen Growth and Development Centre (GGDC) and The Conference Board’s Total Economy Database (May 2006) and European Commission data.Notes: Labour productivity is measured in terms of output per hour worked. Labour utilisation is measured in terms of hours worked per head of the working age population. Percentages refer to the relative contribution of the factor to real GDP growth. Trough-to-trough cycles delimited on the basis of the turning-points published by the Centre for Economic Policy Research’s Euro Area Business Cycle Dating Committee, except the 2003 one, which is assumed on the basis of real GDP growth.
Average contribution to real GDP growth Average growth in
Total Age Working age Labour Labour Real GDP Real GDP population structure population productivity utilisation per capita
(a) (b) (a)+(b) (c) (d) sum (a-d) sum (b-d)
By decade1961-1970 0.8 -0.3 0.6 (11%) 5.7 (108%) -1.0 (-19%) 5.3 4.51971-1980 0.5 0.2 0.8 (23%) 3.9 (120%) -1.4 (-43%) 3.3 2.71981-1990 0.3 0.5 0.8 (32%) 2.3 (97%) -0.7 (-29%) 2.4 2.11991-2000 0.3 -0.1 0.3 (13%) 1.9 (86%) 0.0 (1%) 2.2 1.9
Past three cycles1975-1982 0.4 0.5 0.9 (42%) 3.1 (142%) -1.8 (-84%) 2.2 1.71982-1993 0.3 0.3 0.7 (30%) 2.3 (103%) -0.7 (-32%) 2.2 1.91993-2003 0.3 -0.1 0.3 (13%) 1.5 (79%) 0.2 (8%) 1.9 1.6
Recent periods1991-1995 0.4 0.0 0.4 (23%) 2.3 (134%) -1.0 (-57%) 1.7 1.31996-2000 0.3 -0.1 0.2 (6%) 1.5 (56%) 1.0 (38%) 2.7 2.42001-2005 0.5 -0.1 0.4 (31%) 0.8 (62%) 0.1 (7%) 1.3 0.8
Longer periods1961-2005 0.5 0.1 0.6 (19%) 3.2 (103%) -0.7 (-22%) 3.1 2.61971-2005 0.4 0.2 0.6 (24%) 2.4 (100%) -0.6 (-24%) 2.4 2.01981-2005 0.4 0.1 0.5 24%) 1.9 (88%) -0.2 (-12%) 2.1 1.71991-2005 0.4 -0.1 0.3 (17%) 1.5 (80%) 0.1 (3%) 1.9 1.51995-2005 0.4 -0.1 0.3 (14%) 1.3 (61%) 0.5 (26%) 2.1 1.7
3 MECHANICAL IMPACT ON LONG-TERM
GROWTH

16ECB Occasional Paper No. 51August 2006
3.1 THE CONTRIBUTION TO GROWTH FROM DEMOGRAPHIC DEVELOPMENTS (1960-2005)
Table 1 reports the contribution to euro area growth of demographic factors, labour productivity and labour utilisation from 1960 to 2005 and for different sub-periods. Demographic factors are divided between total population growth and the change in the age structure, approximated by the ratio of the working age population to total population, which can also be expressed as a function of the dependency ratio (see Annex 4 for more details on growth accounting). Labour productivity is measured in terms of output per hour worked. Finally, labour utilisation is def ined here as hours worked per head of the working age population. Labour utilisation can change following variations in average hours worked per employed person, changes in the unemployment rate and
varying participation rates. Table 2 reports similar calculations for the US.
Over the whole sample period considered, the contribution to growth from demographic factors was much more substantial in the US than in the euro area. More precisely, working age population growth contributed to real GDP growth more than twice as much in the US as in the euro area, reflecting higher contributions from both total population growth and from changes in the age structure. In the euro area, a broad decreasing trend in the contribution to growth from demographic factors can be observed from about 1980 onwards. For example, over the past three business cycles the contribution to real GDP growth has decreased from more than 40% in the 1975-1982 cycle to about 30% in the 1982-1993 cycle to less than 15% in the most recent cycle (1993-2003). This reflected especially the increasing dependency
Table 2 Growth accounting for the United States, 1960-2005
(percentages)
Sources: ECB calculations based on the UN (UN’s World Population Database, 2004 revision), Groningen Growth and Development Centre (GGDC) and The Conference Board’s Total Economy Database (May 2006) and European Commission data.Notes: Labour productivity is measured in terms of output per hour worked. Labour utilisation is measured in terms of hours worked per head of the working age population. Percentages refer to the relative contribution of the factor to real GDP growth. Trough-to-trough cycles delimited on the basis of the turning-points published by the National Bureau of Economic Research. The cycle 1980-1982 is not considered for the comparisons due to its very short duration.
Average contribution to real GDP growth Average growth in
Total Age Working age Labour Labour Real GDP Real GDP population structure population productivity utilisation per capita
(a) (b) (a)+(b) (c) (d) sum (a-d) sum (b-d)
By decade 1961-1970 1.3 0.4 1.6 (39%) 2.4 (58%) 0.1 (3%) 4.2 2.91971-1980 1.1 0.7 1.7 (53%) 1.8 (56%) -0.3 (-9%) 3.2 2.21981-1990 0.9 0.0 0.9 (28%) 1.5 (48%) 0.7 (23%) 3.1 2.21991-2000 1.2 0.1 1.3 (39%) 1.5 (46%) 0.5 (15%) 3.3 2.0
Past three cycles1975-1980 1.1 0.6 1.7 (55%) 1.4 (47%) -0.1 (-2%) 3.0 2.01982-1991 1.0 -0.1 0.9 (30%) 1.4 (49%) 0.6 (21%) 2.9 1.91991-2001 1.2 0.1 1.3 (42%) 1.5 (51%) 0.2 (7%) 3.0 1.8
Recent periods1991-1995 1.3 -0.1 1.2 (47%) 1.2 (50%) 0.1 (3%) 2.5 1.21996-2000 1.2 0.2 1.4 (34%) 1.8 (43%) 0.9 (23%) 4.1 2.92001-2005 0.9 0.2 1.1 (43%) 2.5 (98%) -1.1 (-41%) 2.6 1.6
Longer periods1961-2005 1.1 0.2 1.4 (40%) 1.9 (56%) 0.1 (3%) 3.4 2.21971-2005 1.1 0.2 1.3 (41%) 1.7 (56%) 0.1 (4%) 3.1 2.11981-2005 1.1 0.0 1.1 (35%) 1.7 (56%) 0.3 (9%) 3.1 2.01991-2005 1.1 0.1 1.2 (40%) 1.8 (61%) 0.0 (-1%) 3.0 1.91995-2005 1.1 0.2 1.3 (39%) 1.9 (60%) 0.1 (2%) 3.2 2.2

17ECB
Occasional Paper No. 51August 2006
ratio over this period. Over the same periods, also the contribution from labour productivity growth decreased gradually, while labour utilisation diminished to a lower extent and partially compensated for the decreasing contributions from the other factors. As a result, real GDP growth diminished only slightly in the most recent cycle. Given the broadly unchanged total population growth during these three periods, real GDP per capita growth followed a similar pattern, with a decrease recorded only in the most recent cycle.
By contrast, in the US the contribution to growth from demographic factors during the corresponding periods initially decreased, from more than half in the 1975-1980 cycle to less than one-third in the 1982-1991 cycle, due to changes in the age structure since the early 1980s. During the 1980s cycle labour productivity growth remained broadly unchanged, but the contribution from labour utilisation growth increased substantially. During the most recent cycle (1991-2001), however, the contribution to growth from
working age population growth recovered, increasing to more than 40%, and labour productivity accelerated. Thus, despite a signif icant fall in labour utilisation growth, average real GDP growth remained robust and average real GDP per capita growth decreased only marginally. These developments also implied that average real GDP per capita growth in the US, which during the 1980s cycle was similar to euro area levels, during the course of the 1990s cycle became signif icantly higher than in the euro area.
3.2 FORWARD-LOOKING SCENARIOS FOR THE EURO AREA
Given the diff iculties in modelling the interactions between the factors of growth, as a f irst approximation the impact of the projected demographic developments can be assessed on the basis of a ceteris paribus analysis, i.e. assuming that the other factors of growth continue to evolve on average as in the past. Although the scenarios that emerge from such analysis are inevitably of an impractical nature,
3 MECHANICAL IMPACT ON LONG-TERM
GROWTH
Table 3 Scenario for real GDP growth if factor inputs were to grow in line with the 1980-2005 average(percentages)
Sources: ECB calculations based on Eurostat, Groningen Growth and Development Centre (GGDC) and The Conference Board’s Total Economy Database (May 2006) and European Commission data and projections.Notes: Labour productivity is measured in terms of output per hour worked. Labour utilisation is measured in terms of hours worked per head of the working age population.
Average (annual) contribution to growth from change in Average (annual) growth in
Total Age Working Labour Participa- Unemploy- Hours Labour Real GDP Real GDP population structure age productivity tion rate ment rate worked utilisation per capita population per person
Percentages (a) (b) (a)+(b) (c) (d) (e) (f) sum(d to f) sum (a to f) sum (b to f)
Reference period1980-2005 0.4 0.2 0.5 1.9 0.3 -0.1 -0.5 -0.3 2.1 1.7
Eurostat projections Assumptions (same as average over 1980-2005) Outcome
2005-2010 0.4 -0.2 0.2 1.9 0.3 -0.1 -0.5 -0.3 1.8 1.42010-2020 0.2 -0.3 -0.1 1.9 0.3 -0.1 -0.5 -0.3 1.5 1.32020-2030 0.0 -0.5 -0.5 1.9 0.3 -0.1 -0.5 -0.3 1.1 1.12030-2040 -0.1 -0.6 -0.7 1.9 0.3 -0.1 -0.5 -0.3 0.9 1.02040-2050 -0.3 -0.2 -0.5 1.9 0.3 -0.1 -0.5 -0.3 1.1 1.3
End-of-period levels Dep Ratio2005 311,004 49.6 207,922 72.4 8.6 1,5542010 315,198 51.1 208,668 73.5 9.2 1,5192020 320,340 55.8 205,670 75.9 10.4 1,4492030 320,752 63.7 195,955 78.4 11.6 1,3832040 317,191 73.2 183,145 81.0 12.7 1,3202050 308,397 77.0 174,219 83.6 13.9 1,259

18ECB Occasional Paper No. 51August 2006
this exercise can represent a useful starting-point of the analysis.
Table 3 shows the impact on real GDP growth of demographic developments as projected by Eurostat up to 2050, assuming that labour productivity and labour utilisation components evolve on average as in the period 1980-2005. This scenario suggests that projected demographic developments inevitably imply a negative impact on the euro area’s longer-term growth prospects. More precisely, real GDP growth would decline from an average of 2.1% per year observed between 1980 and 2005 to an average of 1.8% per year in the period from 2005 to 2010. Further ahead, the reduction in real GDP growth prospects coming from lower working age population growth amounts to an additional 0.3 percentage point in the period up to 2020, and a similar impact would follow in the period up to 2050. As a result, in the period 2020-2050, real GDP growth would be on average about 1% per year, i.e. less than half of the average during the past two and a half decades. Real GDP per capita growth would
follow a similar pattern and decline from an average of 1.7% per year during the period 1980-2005 to an average of 1.3% in the period ending in 2050. Such a scenario is clearly unrealistic, as for example assuming broadly unchanged average contributions to growth from labour utilisation components implies that by 2050 on average European workers would work about 20% less than in 2005, the unemployment rate would rise to almost 14% and the participation rate would increase gradually to almost 84%, which is about 11 percentage points higher than in 2005 and about 7 percentage points higher than in the US (in 2005).
An alternative scenario analysis can also be useful to illustrate the inevitable adverse impact of demographic developments, in the absence of structural changes or ambitious policy reforms. Taking as a starting-point the average contributions to growth of labour productivity and labour utilisation in the period 1995-2005, let us assume f irst (somewhat optimistically) that labour productivity growth increases
Table 4 Scenario for real GDP growth if factor inputs were to grow in line with more optimistic assumptions(percentages)
Sources: ECB calculations based on Eurostat, Groningen Growth and Development Centre (GGDC) and The Conference Board’s Total Economy Database (May 2006) and European Commission data and projections.Notes: Labour productivity is measured in terms of output per hour worked. Labour utilisation is measured in terms of hours worked per head of the working age population.
Average (annual) contribution to growth from change in Average (annual) growth in
Total Age Working Labour Participa- Unemploy- Hours Labour Real GDP Real GDP population structure age productivity tion rate ment rate worked utilisation per capita population per person
Percentages (a) (b) (a)+(b) (c) (d) (e) (f) sum (d to f) sum (a to f) sum (b to f)
Reference period1995-2005 0.4 -0.1 0.3 1.3 0.6 0.2 -0.3 0.5 2.1 1.7
Eurostat projections Assumptions (gradual improvements up to limits) Outcome
2005-2010 0.4 -0.2 0.2 1.5 0.6 0.2 0.0 0.8 2.5 2.12010-2020 0.2 -0.3 -0.1 1.7 0.6 0.2 0.0 0.8 2.3 2.22020-2030 0.0 -0.5 -0.5 1.9 0.6 0.2 0.0 0.8 2.2 2.22030-2040 -0.1 -0.6 -0.7 2.1 0.0 0.0 0.0 0.0 1.4 1.52040-2050 -0.3 -0.2 -0.5 2.3 0.0 0.0 0.0 0.0 1.8 2.0
End-of-period levels Dep Ratio2005 311,004 49.6 207,922 72.4 8.6 1,5542010 315,198 51.1 208,668 74.6 7.6 1,5542020 320,340 55.8 205,670 79.2 5.7 1,5542030 320,752 63.7 195,955 84.1 3.6 1,5542040 317,191 73.2 183,145 84.1 3.6 1,5542050 308,397 77.0 174,219 84.1 3.6 1,554

19ECB
Occasional Paper No. 51August 2006
gradually from the annual average of 1.3% observed in the period 1995-2005 to 1.5% in the period 2005-2010 and then by about 0.2% in each subsequent decade, such that in the decade 2040-2050 the average growth per year would be 2.3%, which is close to that recorded in the US in the recent “new economy” period. Let us assume then that both the participation rate and the unemployment rate continue to follow a similar pattern to that recorded in the period 1995-2005, until 2030 when the corresponding levels will be close to their natural limit. Thus, by 2030 the participation rate would have reached a level of about 84% and the unemployment rate would be less than 4%. Subsequently, it is assumed that these levels remain unchanged up to 2050. Finally, let us assume that hours worked per person stop declining and remain unchanged at the level of 2005. Clearly, such a scenario is not very likely to materialise but can be taken to represent an upper limit in the absence of major changes. Under such assumptions, real GDP growth would f irst increase to 2.5% per year in the period 2005-2010 and would subsequently start
to decline to 2.3% per year in the period 2010-2020 and would fall below 2% in the period 2020-2050 (see Table 4). Thus, even under optimistic assumptions regarding labour productivity and very optimistic assumptions for labour utilisation, demographic factors would still exert a signif icant negative impact, which would imply a gradual decline in real GDP growth in the medium to long run.
In order to avoid signif icant declines in the average pace of economic activity, which would lead to substantially adverse welfare effects, alternative measures could be implemented, aiming at compensating for the negative impact of demographic developments by increasing contributions to growth from the labour productivity and/or labour utilisation component(s). In order to assess the extent of such requirements, Table 5 reports the average changes in each of these components needed to keep real GDP growth at the average observed during the period 1980-2005, assuming that the other components remain unchanged at their 1980-2005 average. Thus, for example, with
3 MECHANICAL IMPACT ON LONG-TERM
GROWTHTable 5 Scenario for growth in the components labour productivity and labour utilisation if real GDP growth were to be sustained at the 1980-2005 average(percentages)
Sources: ECB calculations based on Eurostat, Groningen Growth and Development Centre (GGDC) and The Conference Board’s Total Economy Database (May 2006) and European Commission data and projections.Notes: Labour productivity is measured in terms of output per hour worked. Labour utilisation is measured in terms of hours worked per head of the working age population.
Average (annual) contribution to growth from change in Average (annual) growth in
Total Age Working Labour Participa- Unemploy- Hours Labour Real GDP Real GDP population structure age productivity tion rate ment rate worked utilisation per capita population per person
Percentages (a) (b) (a)+(b) (c) (d) (e) (f) sum (d to f) sum (a to f) sum (b to f)
Reference period1980-2005 0.4 0.2 0.5 1.9 0.3 -0.1 -0.5 -0.3 2.1 1.7
Eurostat projections Assumptions (same as average 1980-2005, except for one) Outcome
2005-2010 0.4 -0.2 0.2 2.2 0.7 0.2 -0.1 0.8 2.1 1.82010-2020 0.2 -0.3 -0.1 2.5 1.0 0.5 0.2 1.7 2.1 1.92020-2030 0.0 -0.5 -0.5 2.8 1.3 0.9 0.5 2.7 2.1 2.12030-2040 -0.1 -0.6 -0.7 3.1 1.5 1.1 0.7 3.3 2.1 2.22040-2050 -0.3 -0.2 -0.5 2.9 1.4 0.9 0.6 2.8 2.1 2.4
End-of-period levels Dep Ratio2005 311,004 49.6 207,922 72.4 8.6 1,5542010 315,198 51.1 208,668 74.8 7.6 1,5452020 320,340 55.8 205,670 82.4 2.7 1,5742030 320,752 63.7 195,955 93.8 -5.9 1,6572040 317,191 73.2 183,145 109.2 -17.8 1,7832050 308,397 77.0 174,219 124.9 -28.8 1,886

20ECB Occasional Paper No. 51August 2006
labour utilisation as projected in Table 3, average annual labour productivity growth would have to increase from about 2% (on average, with more recent growth rates below 2%, as during the most recent cycle on average) to 2.2% during the rest of the current decade and to about 3% during the period 2020-2050. This compares with an average of about 2% recorded in the US from 1995 to 2005, i.e. during the “new economy” period characterised by accelerating labour productivity (see Table 2). Alternatively, the unemployment rate would have to fall signif icantly, from about 8.6% in 2005 to 7.6% in 2010 and to 2.7% by 2020. Already by then, the requirement would be unrealistic, as frictional unemployment is often estimated to be higher than 3%. After 2020, the natural limit of 0% would be binding, suggesting that the compensatory effect from this factor would be limited in time. Similarly, the participation rate would have to increase gradually, but would reach soon after 2030 the natural limit (of 100%). The potential compensatory impact from average working hours seems to be less unrealistic, as they would
have to fall less over time, and after 2010 start to increase again. Thus, after falling by about 1% from 2005 to 2010 reflecting favourable demographics in the short run, average hours would have to increase by about 2% between 2010 and 2020 and between 5% and 8% during the subsequent decades. This may seem less unrealistic, also considering that under this scenario only during the decade 2040-2050 would the level of hours worked reach that observed in the US in 2005 (of about 1820), but the current declining trend in average hours worked in the euro area may not be easily reversed, to the extent that it reflects changing cultural attitudes, rather than a response to increasing disincentives to work induced for example by the tax systems prevailing in continental Europe.3 The requirements to maintain the average real GDP per capita growth would be slightly less stringent, but in most
3 On the ongoing debate regarding the factors which can explain the gradual decline in average working hours in Europe, see for example A. Alesina, E. Glaeser and B. Sacerdote (2006), “Work and leisure in the U.S. and Europe: why so different?”, NBER Macroeconomics Annual 2005, and references therein.
Table 6 Scenario for growth in the components labour productivity and labour utilisation if real GDP per capita growth were to be sustained at the 1980-2005 average(percentages)
Sources: ECB calculations based on Eurostat, Groningen Growth and Development Centre (GGDC) and The Conference Board’s Total Economy Database (May 2006) and European Commission data and projections.Notes: Labour productivity is measured in terms of output per hour worked. Labour utilisation is measured in terms of hours worked per head of the working age population.
Average (annual) contribution to growth from change in Average (annual) growth in
Total Age Working Labour Participa- Unemploy- Hours Labour Real GDP Real GDP population structure age productivity tion rate ment rate worked utilisation per capita population per person
Percentages (a) (b) (a)+(b) (c) (d) (e) (f) sum (d to f) sum (a to f) sum (b to f)
Reference period1980-2005 0.4 0.2 0.5 1.8 0.3 -0.1 -0.5 -0.3 2.1 1.7
Eurostat projections Assumptions (same as average 1980-2005, except for one) Outcome
2005-2010 0.4 -0.2 0.2 2.2 0.7 0.2 -0.1 0.7 2.1 1.72010-2020 0.2 -0.3 -0.1 2.3 0.8 0.3 0.0 1.1 1.9 1.72020-2030 0.0 -0.5 -0.5 2.5 1.0 0.5 0.2 1.6 1.8 1.72030-2040 -0.1 -0.6 -0.7 2.6 1.1 0.6 0.3 1.9 1.6 1.72040-2050 -0.3 -0.2 -0.5 2.2 0.7 0.3 -0.1 0.9 1.5 1.7
End-of-period levels Dep Ratio2005 311,004 49.6 207,922 72.4 8.6 1,554 2010 315,198 51.1 208,668 74.8 7.7 1,5442020 320,340 55.8 205,670 80.8 4.6 1,5432030 320,752 63.7 195,955 88.9 -0.3 1,570 2040 317,191 73.2 183,145 98.8 -6.6 1,613 2050 308,397 77.0 174,219 106.1 -9.4 1,601

21ECB
Occasional Paper No. 51August 2006
cases would also become unrealistic or even impossible at some point in time (see Table 6). Alternative measures such as shifts in the retirement age will be discussed in more detail in the next section.
Overall, the scenario analysis shows that stronger improvements in labour utilisation can partly compensate for the projected decline in population growth and the ageing of the population. However, “natural” limits in raising participation rates and reducing unemployment rates exist, which limit the possible compensatory effects of these factors over time. Longer working hours and delayed retirement may ultimately be the only labour utilisation components for which compensatory measures to sustain medium to longer-term growth prospects can be made effective. The prospects of higher labour productivity growth are more uncertain. On the one hand, the past trend in the euro area has been of a gradual decrease in labour productivity growth, and an ageing of the workforce could have an additional negative effect (but empirical evidence is scant).4 On the other hand, it cannot be ruled out that recent, current and future reforms in some euro area countries and the recent advances in information and communication technology will lead in coming years to a sustained rise in productivity growth, in a similar way to what the US experienced since the mid-1990s. A combination of compensatory measures would imply less stringent requirements from individual components, and is likely to be necessary given the interactions among the different factors of growth. Beyond the short to medium term, unless the implementation of structural reforms aimed at increasing labour utilisation and labour productivity growth is stepped up signif icantly, projected demographic developments are likely to imply lower sustainable output growth and output per capita growth for the euro area.
4 LABOUR MARKET POLICIES
In light of the above analysis, this section considers how labour utilisation and labour
productivity might be increased in the euro area to compensate for the negative effects of demographic change. The potential to increase participation and employment rates – through a rise in the number of people entering and working in euro area labour markets, an increase in average hours of work and/or longer working lives – varies across different groups of the labour force. Achieving compensatory real GDP growth effects will require a combination of increased participation and employment of the young, older individuals and women, and possibly also increased migration to the euro area. However, the scope for increased participation of each of these groups, and thus the relevant target group(s) for policy, varies signif icantly by country. Furthermore, the potential to increase labour productivity depends both on labour market policies to increase the overall skill levels of the workforce and on the rate at which technology advances in the euro area. Individual euro area countries are responsible for the design of their policies on employment and productivity within the framework of the Integrated Guidelines for Growth and Jobs 2005-2008.5 These Guidelines offer a broad range of suggested policies, which in the face of demographic change will need to be appropriately tailored to the relevant target groups.
4.1 LABOUR MARKET PARTICIPATION AND THE UNEMPLOYMENT RATE OF YOUNG PEOPLE (AGED 15-24)
The labour market participation rate of the 15-24 age group is very low, at 45% on average for the euro area in 2005 and ranging from 29% in Luxembourg to 71% in the Netherlands (see Chart 11). The increased participation of this group may nevertheless offer modest potential as a response to demographic change, given that the low participation rate reflects the
4 For an analysis of euro area long-term labour productivity developments, see R. Gómez-Salvador, A. Musso, M. Stocker and J. Turunen, “Labour productivity developments in the euro area”, ECB Occasional Paper, forthcoming.
5 For more details on these Guidelines, see the box entitled “The Integrated Guidelines for growth and jobs 2005-2008” in the August 2005 issue of the ECB’s Monthly Bulletin.
4 LABOUR MARKET
POL IC IES

22ECB Occasional Paper No. 51August 2006
compulsory minimum school leaving age of 16 in most euro area countries and the high take-up rate of higher education by young adults.
However, there has been some discussion of how to increase the eff iciency of educational systems in some countries, so that young people are educated and available to the labour market in a shorter period of time. Furthermore, those young people that do choose to enter the labour market may be especially productive, holding the most recent and innovative knowledge. The high rate of unemployment of the under-25s, which stood at nearly 18% for the euro area as a whole in 2005, ranging from around 8% in the Netherlands and Ireland to 26% in Greece (see Chart 12), is therefore particularly problematic. In addition to the immediate effect of reducing the level of labour utilisation, periods of youth unemployment may have negative consequences for productivity and for future labour supply, by increasing the probability of labour market withdrawal and/or unemployment of those with experience of unemployment when young.
Policies to tackle youth unemployment against the background of Europe’s ageing populations include a review of national apprenticeship and educational systems to facilitate the transition from education into work. EU leaders adopted the European Youth Pact at the beginning of
2005, which endeavours to “improve the education, training, mobility, vocational integration and social inclusion of young Europeans” through, for example, monitoring policies for the integration of young people into the labour market and encouraging young people to develop entrepreneurship.6 It emphasises both the importance of raising the quality of education, which may help to offset the possible effects of population ageing on total factor productivity, and the importance of increasing the activity and employment rates of young people to help to offset the effects of demographic change on labour supply.
4.2 PARTICIPATION AND EMPLOYMENT OF THE PRIME-AGED POPULATION (AGED 25-54)
The labour force participation rate of prime-aged individuals (25-54) is high, at 83.7% in 2005 for the euro area as a whole, ranging from 77% in Italy to nearly 88% in Finland (Chart 13). At f irst glance, this high rate suggests a moderate potential for the increased participation of the prime-aged population in response to demographic change in most countries. However, the participation rate for females, at 74.6%, is significantly lower than that of males, at 92.7%, which suggests a greater potential for
6 For further details, see http://www.youthforum.org/en/home/downloads/youthpact.html.
Chart 11 Participation rate of 15 to 24-year-olds, 2005
(percentages)
Source: Eurostat.
euro area average
01020304050607080
01020304050607080
1 2 3 4 5 6 7 8 9 10 11 12
1 Belgium 2 Germany 3 Greece 4 Spain
9 Netherlands10 Austria11 Portugal12 Finland
5 France 6 Ireland 7 Italy 8 Luxembourg
Euro area
Chart 12 Unemployment rate of under 25-year-olds, 2005
(percentages)
Source: Eurostat.
1 2 3 4 5 6 7 8 9 10 11 12
1 Belgium 2 Germany 3 Greece 4 Spain
9 Netherlands10 Austria11 Portugal12 Finland
5 France 6 Ireland 7 Italy 8 Luxembourg
0
5
10
15
20
25
30
0
5
10
15
20
25
30
euro area average
Euro area

23ECB
Occasional Paper No. 51August 2006
the increased participation of women. In fact, the main contribution to the average annual rate of output growth in the period since the mid-1990s has come from the increase in the female participation rate, and this trend will need to continue. Policies to increase the utilisation of the 25-54 age group will therefore need to focus specif ically on f irst increasing the female labour market participation rate, particularly in countries where the rate is relatively low (such as Italy and Greece).
Individuals entering the labour market must also be productively employed. However, the employment rate for the 25-54 age group (at 77% in the euro area in 2005) is signif icantly lower than its participation rate, as a signif icant proportion of prime-aged workers are ready to work, but are unemployed. Moreover, these aggregate employment rates are based on the number of people working and do not distinguish between full-time and part-time employment, thus masking a possible under-utilisation of worker-hours. In fact, the average weekly hours worked per worker in the euro area has decreased from about 40 in 1983 to about 37 in 20047 and the involuntary part-time rate in the euro area is about 15% (Eurostat, 2004). These f igures suggest that an increase in both the employment rate and average hours worked would make a signif icant contribution to increasing labour
utilisation in the euro area, particularly in countries with relatively low employment rates (such as Italy and Greece) and low average hours of work (such as France and Germany).
Policy recommendations to increase female labour market participation within the context of the European Employment Strategy stress the need for action to reduce gender pay gaps and to make it easier for women to combine family and work through the provision of accessible and affordable childcare facilities and care for other dependents. The modernisation of social protection systems is also expected to shift incentives towards work. Policies to increase hours of work include a reduction in labour taxes and increased flexibility in the arrangement of working hours and – particularly important for working mothers – of standard school hours. Direct controls on hours of work such as labour laws covering average working weeks and limiting part-time work should be reviewed. A broad range of policies to increase productivity and tackle unemployment are suggested in the Integrated Guidelines for Growth and Jobs 2005-2008, including the active promotion of investment in R&D, innovation and education, the modernisation of employment services and the removal of barriers to labour mobility.
4.3 EARLY RETIREMENT AND THE PARTICIPATION RATE OF THE 55-64 AGE GROUP
The labour market participation rate of the 55-64 age group stood at around 44% in the euro area in 2005 (the employment rate at 40.4%, well below the Lisbon target of a 50% employment rate by 2010), ranging from 56.6% in Finland to less than 33% in Luxembourg and Italy (see Chart 14). The participation rate of this group was also greater for men at 53.6% than women at 34.2% for the euro area as a
Chart 13 Participation rate of 25 to 54-year-olds, 2005
(percentages)
Source: Eurostat.
1 2 3 4 5 6 7 8 9 10 11 12
1 Belgium 2 Germany 3 Greece 4 Spain
9 Netherlands10 Austria11 Portugal12 Finland
5 France 6 Ireland 7 Italy 8 Luxembourg
72747678808284868890
72747678808284868890
euro area average
Euro area
7 For evidence for euro area countries and the US, see N. Leiner-Killinger, C. Madaschi and M. Ward-Warmedinger, “Trends and patterns in working time patterns across euro area countries 1970-2003: causes and consequences”, ECB Occasional Paper, No. 41.
4 LABOUR MARKET
POL IC IES

24ECB Occasional Paper No. 51August 2006
whole in 2005. The legal retirement age in most euro area countries is 65 (increases in the retirement age are currently being considered in a number of countries), but the average effective age of retirement is far lower (at 60.7 in 2004 for the euro area) and has declined over the past decades, despite the increases in longevity identif ied in Section 2.1. These generally very low rates suggest a signif icant potential for the increased labour market participation and employment of the 55-64 age group, which would also contribute towards increasing average working lives. The increased labour market participation of this group may also have important implications for the average productivity of the EU workforce. Some economic studies have explored the proposition that older workers are less adaptable in creating and adopting new technologies.8 The results of such investigations are shrouded by a large degree of uncertainty, but suggest that policies should focus on supporting the continued productivity of workers later in life.
Policies in the EU aiming to boost the employment of the 55-64 age group include increased support for active ageing, including appropriate working conditions, and the modernisation of pension systems to support longer working lives and discourage early retirement. In recent years, steps have been taken to make retirement schemes more
progressive, allowing workers to cut their working hours and receive some form of income support to make up for shortfalls in pay. Although such schemes are normally beneficial in maintaining the working capacity and skills of older workers and reducing the burden on pension systems, they generally operate only for the years leading up to the normal retirement age (and not beyond), therefore increasing the risk of encouraging workers to withdraw from the labour market earlier than they would have done otherwise. A survey by the European Commission (2004b) has found that more than 20% of inactive people aged 55-64 report early retirement as the main reason for leaving their last job.9 It is important that older workers remain attractive to employers. Old age discrimination will need to be tackled, and the provision of part-time or temporary positions for older workers increased. EU leaders have also emphasised the importance of increasing lifelong learning to maintain labour market attachment and help to offset the possible negative effects of population ageing on labour supply and total factor productivity.
4.4 MIGRATION
Increased migration to the euro area offers a further potential avenue through which labour market participation and employment may be increased across all age groups. A number of theoretically positive effects of increased immigration in the face of a shrinking and ageing population can be identif ied. First, immigrants tend to be relatively young and hence have an immediate and positive effect on the average age and composition of the working age population. Second, the fertility rates of immigrant women from developing countries are often relatively high, which may offer a temporary boost to fertility and hence population growth. Third, selective immigration policies may attract highly skilled workers, which may
Chart 14 Participation rate of 55 to 64-year-olds, 2005
(percentages)
Source: Eurostat.
euro area average
1 2 3 4 5 6 7 8 9 10 11 12
1 Belgium 2 Germany 3 Greece 4 Spain
9 Netherlands10 Austria11 Portugal12 Finland
5 France 6 Ireland 7 Italy 8 Luxembourg
0
10
20
30
40
50
60
0
10
20
30
40
50
60
8 See for example European Commission (2004a), “Effects of ageing on long run labour productivity growth: A theoretical and empirical assessment”.
9 European Commission (2004b), “Increasing the employment of older workers and delaying the exit from the labour market”.

25ECB
Occasional Paper No. 51August 2006
increase the average productivity of the working age population. However, a number of recent studies conclude that the stabilisation of old age dependency ratios through migration alone is unlikely, due to the huge number of migrants that would be required. The communication from the European Commission on migration in 200310 for example argues that “maintaining the working age population, and even more so maintaining the old age dependency ratio would require massive increases in immigration until 2030” and that “using migration to fully compensate the impact of demographic ageing on the labour market is not a realistic option”. Indeed, the role of migration in addressing the European demographic challenge is likely to be only complementary to other policies, given natural limits to the feasible number of migrants and political constraints. The Integrated Guidelines for Growth and Jobs 2005-2008 call only for the “appropriate management of economic migration”.
5 EFFECTS ON FINANCIAL MARKETS
Population ageing will also have an impact on f inancial market developments. This issue can be addressed from at least three different points of view. First, population ageing affects the saving/investment balance. Households belonging to different generations typically hold a different amount of securities in their portfolio, i.e. the ratio of people characterised as prime borrowers and prime savers of the economy depends on the generation structure of the population. Second, changes in the ageing structure of the population can have an impact on how savings are actually invested. For example, households belonging to different generations make different choices concerning the risk composition of their investment portfolio. Third, population ageing is supporting several structural and institutional changes which are likely to continue over the medium term. These changes will materialise in particular through pension reforms, especially if they require a move towards more funding. These reforms will enhance the importance of
institutional investors, at least in countries where they are relatively less developed, and thus the impact that their investment strategies can have on asset prices. The sub-sections below address these three effects in detail.
In addition, there are at least two other aspects of the link between ageing and financial markets which should be mentioned: the impact on international capital flows and the link between housing prices and the age structure of the population. Concerning the impact on international capital flows, there have been several attempts to incorporate in a model contemporaneous developments in savings, investments, international capital flows and exchange rates. The conclusions of these models have also been broadly supported by some empirical studies. These models suggest that “young” countries (or countries with a high young age dependency ratio) should show current account def icits, as investments are needed to provide capital to a growing labour force; similarly, “old” countries (or countries with a high old age dependency ratio) should also run current account def icits as retired people withdraw savings to fund consumption. At the same time, “middle-aged” countries should supply capital to the others. These results are however subject to a number of caveats, not least the fact that models calibrated to f it the current ageing structure generally fail to describe current developments – notably the large US current account deficit. These models explicitly assume that households accumulate wealth during their working years to fund consumption when retired and capital is assumed to be perfectly mobile across countries. While this does not impinge on the validity of the qualitative results of the models, it highlights the diff iculty to forecast the size and the quantitative impact of international capital flows over the next decades.11
5 EFFECTS ON F INANC IAL
MARKETS
10 European Commission (2003), “Communication on immigration, integration and employment”.
11 For a study incorporating both a model-based approach and an empirical analysis, see IMF (2004), “How will demographic change affect the global economy?”, World Economic Outlook, September.

26ECB Occasional Paper No. 51August 2006
A significant portion of households’ income is invested in housing. In the long run, demand for housing should depend on the number of households, which is linked to the population growth.12 Given recent developments in the demographics of EU15 countries, the rate of growth of the number of households in the EU as a whole decelerated in the 1990s, but Greece, Spain, Ireland, Italy, Austria and the United Kingdom differed from the other countries in this respect. Studies conducted mainly in the United States and the United Kingdom would suggest that as the population ages and the fraction of people in their “buying years” shrinks, housing demand and consequently house prices would decline as well.13 However, subsequent studies have shown that when the effect of age is disentangled from other characteristics – like income, marital status and education – the demand for housing tends to be stable or rises only slightly with age.14 Recent actual developments in Spanish, US and UK house prices seem to support the belief that other factors (primarily household income and investment in real estate as a source of portfolio diversification) have a stronger impact on housing demand than demographic changes. Cross-country differences in house prices also reflect structural and institutional factors such as mortgage market arrangements and taxation which impinge on the ability to consume out of housing wealth.15 Overall, a number of questions related to housing and ageing remain open due mainly to the lack of detailed data. One question is whether or not ageing induces a mismatch not only in the quantity but also in the quality of houses demanded, which could translate into higher volatility of prices and affect the number of new constructions.
5.1 CHANGES IN SAVING/INVESTMENT BALANCES AND THE LIKELY RISE OF SAVING FOR RETIREMENT
Population ageing will prompt changes in the saving/investment balance of households in most developed countries, including the euro area countries. Households will probably adjust their saving behaviour in the face of rising longevity and specific policies are going to be implemented to increase retirement funds in the context of pension reforms.
From a theoretical point of view, the starting-point to assess these effects is the life cycle theory of savings. The main assumption is that consumers prefer to smooth consumption over their lifetime in order to maximise utility. The typical life cycle savings pattern is then assumed to be hump-shaped: households tend to accumulate assets during working years and tend to spend those same assets during retirement years.16 Young investors do not save; on the contrary, they seek to borrow against their human capital. At the same time, middle-aged households are the economy’s prominent savers and investors; they typically earn higher incomes and are assumed to invest in financial assets to provide for retirement. Retired people gradually sell off their investments to fund consumption. Several studies have been carried out in order to find support for the life cycle investment hypothesis.17 Household surveys in several countries suggest that consumption tends to have a hump-shaped profile across age groups. However, these surveys suffer from important biases arising from the time at which the surveys are conducted and from previous experiences of the generations under scrutiny. For example, people who have experienced financial crises tend to save more than people who have only experienced financial booms. The time at which the survey is conducted can significantly bias the result as well. While most empirical studies unveil important relationships between demographic variables and saving rates, the results tend to be highly dependent on the data and on the estimation techniques used. For example, cross-country studies at the household
12 See D. Capozza, P. Hendershott, C. Mack and C. Mayer (2002), “Determinants of real house price dynamics”, NBER Working Paper No 9262.
13 See N. G. Mankiw and D. N. Weil (1989), “The baby boom, the baby bust, and the housing market”, Regional Science and Urban Economics, 19.
14 See R. Green and P. Hendershott (1995), “Age, housing demand, and real house prices”, Regional Science and Urban Economics, Vol. 26, No 5.
15 See P. Catte, N. Girouard, R. Price and C. André (2004), “Housing markets, wealth and the business cycle”, OECD Economics Department Working Paper No 394.
16 See F. Modigliani (1986), “Life-cycle, individual thrift, and the wealth of nations”, American Economic Review, Vol. 76, No 3.
17 See R. Disney (1996), Can we afford to grow older?, MIT Press, and A. De Serres and F. Pelgrin (2002), “The decline in private saving rates in the 1990s in OECD countries: how much can be explained by non-wealth determinants?”, OECD Economics Department Working Paper No 344.

27ECB
Occasional Paper No. 51August 2006
level have shown that in many countries older people do not comply with the predictions of the theory; in fact, many old-aged households are net savers. Results also suggest that in countries where the social security system is “more generous”, the saving rate among the people in the working age class is lower. Thus, it could be expected that if social security benefits were significantly cut, there would be the reverse effect.
Simulations based on dynamic general equilibrium models have been used to address the impact of population ageing on the equilibrium real interest rate, i.e. the long-term rate which balances savings and investments. Real interest rates prevailing in f inancial markets should then reflect these equilibrium rates. The ageing process is generally predicted to imply a modest decline of the real equilibrium interest rate over the next decades. This would result from a higher capital intensity of production and fewer investments needed to maintain the capital stock. In addition, assuming that pension contribution rates are held constant, retirement ages are increased and benef its decline, consumption levels upon retirement could be sustained only if savings were increased signif icantly over the next twenty years.18
5.2 CHANGES IN THE STRUCTURE OF SAVINGS’ PORTFOLIOS
Demographic changes can also affect the structure of households’ f inancial portfolios, since individuals belonging to different generations are likely to choose a different mixture of assets in terms of risk. These effects have been extensively studied in models based on the framework of overlapping generations (OLG). These models all share the feature that demographic shocks affect asset returns even in economies where rational agents are able to correctly anticipate future population growth and the future sale of financial assets by retired people in order to fund consumption. In this set-up, an ageing population generally implies falling financial asset prices (both equity and bond prices) and an increase in the required equity premium when the currently active population retires. As a large elderly
generation is assumed to sell assets to a smaller-sized middle-aged generation, this will result in a downward pressure on asset prices, or an “asset meltdown”.19 The size and timing of this meltdown are however highly uncertain.
Several studies have simulated calibrated versions of these models. They all suggest that demographic transitions do matter, but the size of the impact largely depends on the specif ics of the model and on the chosen value of the parameters. For example, the relative valuations of equity and bonds differ depending on the calibration of the model and the presence of borrowing constraints. In addition, even simulations resulting in a relatively large impact imply price movements well below the swings usually experienced in f inancial markets, especially over the last few years, suggesting that the overall impact of demography on asset prices is limited compared with other factors.20
18 See for example A. Börsch-Supan, A. Ludwig and J. Winter (2004), “Ageing, pension reform, and capital flows: a multi-country simulation model,” Working Paper 28-2003, Mannheim University, and J. Oliveira Martins, F. Gonand, P. Antolin, C. de la Maisonneuve and K.-Y. Yoo (2005), “The impact of ageing on demand, factor markets and growth”, OECD Economics Department Working Paper No 420. In a general equilibrium framework, T. Saarenheimo (2005), “Ageing, interest rates and f inancial flows”, Bank of Finland Research Discussion Papers 2/2005, shows that saving rates will increase by around one percentage point by 2010. Later on, if replacement rates are held constant, slowing labour force growth pushes saving and investment rates downwards again, to well below the current level by 2050, reflecting the negative impact of a higher retirement age on the saving rates of younger workers.
19 See J. Poterba (2001), “Demographic structure and asset returns”, Review of Economics and Statistics, Vol. 83, Issue 4.
20 In R. J. Brooks (2002), “Asset market effects of the baby boom and social security reforms”, American Economic Review, Papers and Proceedings 92, the model is calibrated to match the US baby boom. The model forecasts that when this generation retires, returns on both stocks and bonds will be driven down by approximately 100 basis points, while the overall effect on the risk premia will be small. Simulations based on the model by J. Geanakoplos, M. Magill and M. Quinzii (2004), “Demography and the long-run predictability of the stock market”, Brooking Papers on Economic Activity, No 1, result in an even larger impact of demographic changes. The effect of demographic changes on asset prices is generally amplif ied if simulations are carried out on models assuming that the younger generations face borrowing constraints. These constraints can substantially increase the risk premia to values closer to observed data and enhance the impact of demographic changes (see also Constantinides et al. (2002), “Junior can’t borrow: a new perspective on the equity premium puzzle”, Quarterly Journal of Economics, 117, which could also explain differences across countries.
5 EFFECTS ON F INANC IAL
MARKETS
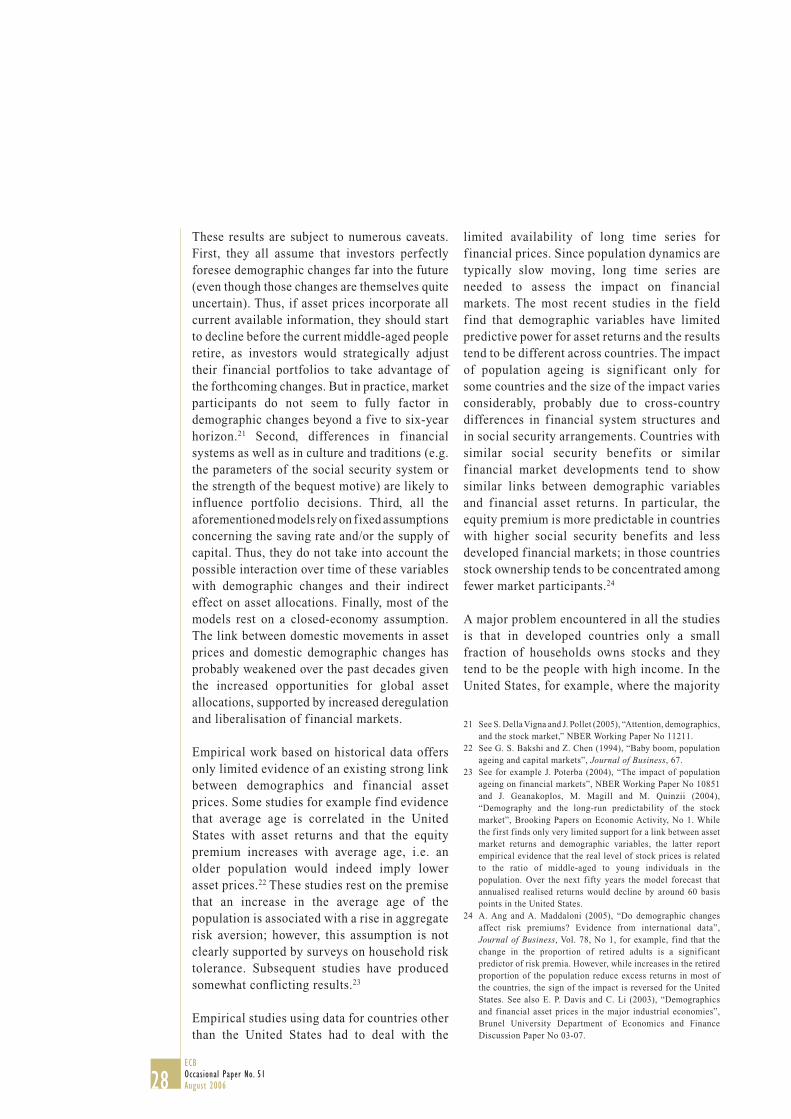
28ECB Occasional Paper No. 51August 2006
These results are subject to numerous caveats. First, they all assume that investors perfectly foresee demographic changes far into the future (even though those changes are themselves quite uncertain). Thus, if asset prices incorporate all current available information, they should start to decline before the current middle-aged people retire, as investors would strategically adjust their f inancial portfolios to take advantage of the forthcoming changes. But in practice, market participants do not seem to fully factor in demographic changes beyond a five to six-year horizon.21 Second, differences in f inancial systems as well as in culture and traditions (e.g. the parameters of the social security system or the strength of the bequest motive) are likely to influence portfolio decisions. Third, all the aforementioned models rely on fixed assumptions concerning the saving rate and/or the supply of capital. Thus, they do not take into account the possible interaction over time of these variables with demographic changes and their indirect effect on asset allocations. Finally, most of the models rest on a closed-economy assumption. The link between domestic movements in asset prices and domestic demographic changes has probably weakened over the past decades given the increased opportunities for global asset allocations, supported by increased deregulation and liberalisation of f inancial markets.
Empirical work based on historical data offers only limited evidence of an existing strong link between demographics and f inancial asset prices. Some studies for example f ind evidence that average age is correlated in the United States with asset returns and that the equity premium increases with average age, i.e. an older population would indeed imply lower asset prices.22 These studies rest on the premise that an increase in the average age of the population is associated with a rise in aggregate risk aversion; however, this assumption is not clearly supported by surveys on household risk tolerance. Subsequent studies have produced somewhat conflicting results.23
Empirical studies using data for countries other than the United States had to deal with the
limited availability of long time series for f inancial prices. Since population dynamics are typically slow moving, long time series are needed to assess the impact on f inancial markets. The most recent studies in the f ield f ind that demographic variables have limited predictive power for asset returns and the results tend to be different across countries. The impact of population ageing is signif icant only for some countries and the size of the impact varies considerably, probably due to cross-country differences in f inancial system structures and in social security arrangements. Countries with similar social security benef its or similar f inancial market developments tend to show similar links between demographic variables and f inancial asset returns. In particular, the equity premium is more predictable in countries with higher social security benefits and less developed f inancial markets; in those countries stock ownership tends to be concentrated among fewer market participants.24
A major problem encountered in all the studies is that in developed countries only a small fraction of households owns stocks and they tend to be the people with high income. In the United States, for example, where the majority
21 See S. Della Vigna and J. Pollet (2005), “Attention, demographics, and the stock market,” NBER Working Paper No 11211.
22 See G. S. Bakshi and Z. Chen (1994), “Baby boom, population ageing and capital markets”, Journal of Business, 67.
23 See for example J. Poterba (2004), “The impact of population ageing on f inancial markets”, NBER Working Paper No 10851 and J. Geanakoplos, M. Magill and M. Quinzii (2004), “Demography and the long-run predictability of the stock market”, Brooking Papers on Economic Activity, No 1. While the f irst f inds only very limited support for a link between asset market returns and demographic variables, the latter report empirical evidence that the real level of stock prices is related to the ratio of middle-aged to young individuals in the population. Over the next f ifty years the model forecast that annualised realised returns would decline by around 60 basis points in the United States.
24 A. Ang and A. Maddaloni (2005), “Do demographic changes affect risk premiums? Evidence from international data”, Journal of Business, Vol. 78, No 1, for example, f ind that the change in the proportion of retired adults is a signif icant predictor of risk premia. However, while increases in the retired proportion of the population reduce excess returns in most of the countries, the sign of the impact is reversed for the United States. See also E. P. Davis and C. Li (2003), “Demographics and f inancial asset prices in the major industrial economies”, Brunel University Department of Economics and Finance Discussion Paper No 03-07.

29ECB
Occasional Paper No. 51August 2006
of the empirical studies were carried out, stock ownership, although it has dramatically increased since 1989, does not involve the majority of people, even when direct and indirect investment, i.e. via mutual funds or retirement savings accounts, are considered. In the EU, the problem is even more pronounced (see Table 7). Direct equity holding is largely a minority phenomenon, although investment in financial instruments provided by intermediaries, primarily investment funds, has increased signif icantly over the last twenty years. These differences may also partly explain why the predictive power of demographic variables is not consistent across countries. This argument also calls for caution in applying conclusions arising from studies based on US data to other countries, although it could be argued that, for example, euro area countries are likely to increase stock market participation over the next few years, approaching in this way the current situation in the United States.
5.3 POPULATION AGEING AND THE IMPORTANCE OF FINANCIAL INTERMEDIARIES
The projected ageing of the population will have important effects on pension savings, namely their size and their composition. As the current working age population saves for retirement, overall pension assets are set to increase. By contrast, when these generations will retire, pension assets will decline. A move towards fully or partially funded pension systems could have large effects on the size of the capital markets involved (see next section). In the EU the value of assets held by private pension schemes has grown in almost all countries over recent years. However, great variation persists among individual countries. While pension fund assets currently total more than 100% of GDP in the Netherlands, their share is between 3% and 5% in Germany and Italy. Hence there seems to be scope for a signif icant growth of the value of pension fund assets, especially in these large countries (see Table 8).
Table 7 Stock market participation (direct and indirect) of households in selected countries
(as a percentage of total households)
Source: L. Guiso, P. Sapienza and L. Zingales (2005), “Trusting the stock market”, NBER Working Paper No 11648. Notes: Total participation includes indirect ownership, via mutual funds or pension funds. Data for euro area countries refer to 2003 and are taken from the Survey of Health, Age and Retirement in Europe (SHARE). Data for the US are drawn from the 1998 Survey of Consumer Finances. Data for the UK are drawn from the 1997-98 Financial Research Survey.
United Kingdom United States Germany France Italy The Netherlands
Equities (direct holding) 22 19 14 14 4 17Total participation 31 49 23 26 8 24
Table 8 Pension fund assets
(as a percentage of GDP)
Source: OECD (2003).
1990 1995 1996 1997 1998 1999 2000 2001
Belgium 2 4 4 5 6 6 6 6Germany 3 3 3 3 3 3 3 3Italy 3 4 3 3 3 5 5 4Japan 12 15 15 16 16 19 19 19Netherlands 72 85 93 101 108 119 114 105Sweden 2 2 2 3 3 3 3 4UK 50 68 69 79 79 88 79 66US 42 57 61 67 71 74 69 63
5 EFFECTS ON F INANC IAL
MARKETS

30ECB Occasional Paper No. 51August 2006
Increased pension saving will also affect the relative importance of f inancial intermediaries in capital markets. Indeed, an important development of the last few decades has been the growing importance of institutional investors, such as insurance companies and pension funds, as collectors of funds, leading to a growing share of “institutionalised savings” (see Table 9).
The growth in the importance of these intermediaries is due to several factors, such as an increasing equity culture among investors and a generally lower level of interest rates, which probably encouraged investors to diversify their portfolio to include instruments offered by f inancial institutions other than banks. At the same time, it also reflects explicit policies to promote institutionalised saving, in particular private pension schemes, related to
Table 9 Composition of selected household assets
(as a percentage of gross f inancial assets)
Sources: Nationale Bank van België/Banque Nationale de Belgique, French Ministry of Finance and Economy, Deutsche Bundesbank, Banca d’Italia, Bank of Japan, De Nederlandsche Bank, Statistics Sweden, UK Office for National Statistics, Board of Governors of the US Federal Reserve.Notes: The term “institutions” refers to pension funds (also “collective” ones as in Sweden), insurance corporations and mutual funds. For France, data from 1970 to 1990 are taken from Byrne and Davis (2003). For Germany, data from 1991 onwards are based on ESA 95 f inancial accounting principles (earlier data corresponding to the categories “other equity” included in “equities” and “mutual fund shares” included in “institutions” were not available). Percentages may not add up to 100 because of the presence of “other f inancial assets” not classif ied in the above four categories.
change 1970 1980 1990 2000 2000-1980 2001 2002 2003
Belgium Deposits .. 41 31 25 -16 27 30 33 Bonds .. 33 34 22 -12 22 22 18 Equities .. 18 22 22 4 19 13 14 Institutions .. 8 13 29 21 31 32 35France Deposits 49 59 38 27 -32 29 31 30 Bonds 6 9 4 2 -7 2 2 2 Equities 26 12 26 34 22 29 24 25 Institutions 6 9 26 34 25 36 39 39Germany Deposits 60 60 47 34 -26 34 36 36 Bonds 8 12 17 10 -2 10 11 11 Equities 11 5 6 16 11 14 9 10 Institutions 15 17 21 39 22 40 42 41Italy Deposits 54 64 34 25 -39 26 27 27 Bonds 19 17 31 18 1 21 23 22 Equities 11 10 25 28 18 25 23 22 Institutions 8 6 10 28 22 28 27 28Japan Deposits .. 59 47 53 -6 55 57 55 Bonds .. 2 2 2 0 2 2 2 Equities .. 13 17 9 -4 7 6 8 Institutions .. 19 29 31 12 31 31 30Netherlands Deposits 24 32 26 19 -14 21 24 24 Bonds 17 7 4 2 -4 3 4 4 Equities 36 22 23 16 -6 12 6 11 Institutions 23 39 47 61 21 62 63 58Sweden Deposits .. 67 46 18 -49 26 32 30 Bonds .. 13 10 4 -9 5 5 5 Equities .. 9 16 18 9 20 16 18 Institutions .. 11 28 60 49 50 47 47United Kingdom Deposits 34 43 30 20 -23 23 27 26 Bonds 7 7 2 1 -6 1 1 1 Equities 24 12 19 22 10 18 15 15 Institutions 23 30 44 53 23 54 53 54United States Deposits 21 23 22 15 -8 17 18 16 Bonds 7 5 10 6 1 6 6 6 Equities 22 13 12 21 7 17 16 18 Institutions 17 19 29 37 18 36 36 38

31ECB
Occasional Paper No. 51August 2006
population ageing. Future pension reforms are likely to change the channelling of funds available for f inancial investments even further. Pressure will increase to move savings from “traditional banking” products (like bank deposits) to f inancial intermediaries offering products suitable for investors wishing to provide for their retirement (individual households) or wishing to transfer risk (institutional investors).
Over recent years there was a shift in the composition of households’ overall portfolios towards assets with longer maturities and away from bank deposits. For example in the euro area, households seem to have channelled more funds towards insurance corporations and pension funds than towards banks, as shown in Table 10. The table shows how much of the total assets of the economy (for both f inancial and non-f inancial sectors) is channelled through the different f inancial intermediaries.
In addition, the related increase in the importance of institutional investors and recent developments in regulatory and accounting frameworks25 are going to affect also the f inancial instruments required by market participants.26 Pension fund managers are emphasizing more and more the need for an additional supply of certain f inancial
instruments, which are needed to better manage market, inflation and longevity risks. The demand for long-term high quality and highly liquid paper, and possibly inflation-indexed paper, is likely to increase.
For example, to meet a rising demand from market participants a handful of European countries recently started to issue very long-dated bonds; f ifty-year bonds were issued by the French and the British governments in February and May 2005 respectively. Although long-dated bonds are also issued by some private corporations, the overall corporate supply remains limited due to a variety of factors, including the lack of benchmarks and tax disincentives. Even in the US market the outstanding amount of bonds with a maturity greater than ten years is relatively small. If institutional investors were to decide to massively move into the market of very long-term bonds, they would most likely overwhelm existing supply, with a significant impact on prices.
Table 10 Euro area acquisitions and holdings of financial assets
(as a percentage of GDP)
Source: ECB.Note: “Total non-financial sectors” does not include the general government sector.
Held with: Held with: Held with: Monetary financial Other financial Insurance corporations institutions intermediaries and pension funds
1998 2000 2002 2004 1998 2000 2002 2004 1998 2000 2002 2004
Acquisitions Households 1.5 1.0 3.1 3.1 4.5 1.4 0.6 0.0 3.5 3.8 3.0 3.3Non-f inancial corporations 0.7 1.0 0.3 1.1 0.5 0.1 0.3 0.3 0.1 0.1 0.1 0.1Total non-f inancial sectors 2.2 2.0 3.4 4.2 5.0 1.6 0.9 0.3 3.6 3.8 3.1 3.4Financial Corporations 4.5 2.1 6.5 7.7 2.1 2.7 1.4 1.2 0.0 0.0 0.1 0.1HoldingsHouseholds 62.4 60.2 60.8 62.9 14.8 16.7 15.0 15.0 43.1 48.2 49.1 53.1Non-f inancial corporations 13.8 14.3 14.8 16.1 3.7 4.0 4.0 5.0 1.4 1.5 1.5 1.6Total non-f inancial sector 76.2 74.4 75.6 79.0 18.5 20.7 18.9 20.0 44.5 49.7 50.7 54.7Financial Corporations 72.7 76.5 81.4 86.6 9.7 14.7 13.6 15.9 1.1 1.2 1.4 1.4
25 In particular, the implementation of new International Accounting Standards (IAS) for all listed companies in Europe and the Dutch reform on pension fund supervision.
26 For a thorough description of the f inancial market implications of population ageing and the need for additional f inancial instruments, see G10 (2005), “Ageing and pension system reform: implications for f inancial markets and economic policies”.
5 EFFECTS ON F INANC IAL
MARKETS

32ECB Occasional Paper No. 51August 2006
Similarly, the market for index-linked bonds remains small compared with potential demand by inflation protection seekers. For example, in the United Kingdom, pension funds and life insurance corporations already hold around 80% of outstanding long-dated and index-linked gilts. This is even more striking if one observes that the average asset allocation of UK funds in bonds is only around 20-30% of the total portfolio.
Finally, population ageing could also support an increase in the size and depth of the derivative markets. Pension fund managers are likely to exploit even more the derivatives market with the aim of transforming risk through time, i.e. matching long-term liabilities with shorter-term assets. This is likely to create a higher demand for more sophisticated f inancial assets and risk transfer products. For example, the interest rate and inflation swap market may provide a great flexibility to help reduce balance sheet mismatches and address the specif ic needs of pension fund managers.
6 PUBLIC FINANCES
6.1 EFFECTS ON PUBLIC FINANCES
The demographic shift will put pressure on public f inances by driving up ageing-related expenditure. The most important expenditure effects are projected for public pension systems and for spending on health and long-term care.
6.1.1 PENSIONSPublic pension systems in Europe are mostly based on the PAYG principle whereby current contributions f inance current expenditure. The rising number of pensioners will put these systems under considerable strain as a diminishing number of workers will have to provide the pension benefits for a growing number of retirees.
A number of studies present projections of the impact of ageing on public pension expenditure. A report by the EPC’s Working Group on Ageing
and the European Commission27 provides projections by national institutions on expenditures for pensions as well as health and long-term care. In addition, the report covers spending for unemployment benef its and education, which may also be affected by the demographic changes (see below). The projections are based on a set of common assumptions regarding macroeconomic and demographic variables. Using an analogous dataset for its member countries, a previous OECD study28 derived comparable results, despite some def initional differences. Furthermore, staff of the European Commission29 presented pension expenditure projections based on a macroeconomic equilibrium model for the EU. The model is calibrated to reflect the most important macroeconomic relationships and is then employed to generate pension expenditure projections and estimates of the impact of various reform scenarios.
The study by EPC and the European Commission and the OECD study f ind a cumulative increase in pension expenditure of more than 3 percentage points of GDP for most euro area countries, with particularly high increases for Spain, Luxembourg and Portugal over the projection period (see Table 11).30 A closer analysis of the time pattern shows that the pressure rises rapidly in the two decades after 2010. While not based on a general equilibrium approach, the macroeconomic framework underlying these results is broadly consistent with the growth effects discussed in Section 3.
27 EPC and European Commission (2006), The impact of ageing on public expenditure: projections for the EU25 Member States on pensions, health care, long-term care, education and unemployment transfers (2004-2050). European Economy Special Report 1/2006.
28 T. Dang, P. Antolin and H. Oxley (2001), “Fiscal implications of ageing: projections of age-related spending”, OECD Economics Department Working Paper No 305.
29 Mc Morrow, K. and W. Roeger (2002), EU pension reform – an overview of the debate and an empirical assessment of the main policy reform options, DG ECFIN Economic Papers No. 162, January.
30 For Greece, numbers are not yet available, but past projections also point to very high increases in pension expenditure.

33ECB
Occasional Paper No. 51August 2006
The projected pension expenditure increases generated by this approach can be converted into a net present value, indicating the incremental implicit f iscal liability due to ageing.31 This number can be compared with the outstanding stock of public debt. Using the same underlying assumptions as the OECD study, Rother et al. (2003, 2004)32 estimate an incremental implicit pension liability of close to 50% of GDP for the four largest euro area countries. This compares with an average explicit public debt ratio of around 72% of GDP in 2005. To balance the additional ageing-induced debt by 2050, revenues would need to rise immediately and permanently by 1.6% of GDP, but even then public pension systems would not be in balance from 2050 onwards.
Computing the additional implicit debt also reveals the importance of the underlying assumptions. The above numbers are derived on the basis of the favourable labour market assumptions of the EPC and OECD studies. In particular, they assume that total employment rates rise strongly over the forecast period, reflecting higher projected labour participation
by women and older workers. Assuming, more prudently, constant employment rates over the forecast horizon drives up the additional ageing-induced burden to some 70% of GDP. Furthermore, reducing the assumed real interest rate from 4% to 3% drives up the additional pension debt further to close to 90% of GDP.
6.1.2 HEALTH AND LONG-TERM CAREPublic health care expenditure is set to rise as the demand for health services tends to increase with the number of old people. However, while the developments in the area of pension systems can be predicted with some accuracy by modelling the mechanics of the pension systems, forecasts for health expenditure are more problematic. This is because the development of health expenditures reflects the interaction of demand and supply of
Table 11 Projected impact of ageing populations on public expenditures
(change from 2004 to 2030 and 2050 as a percentage of GDP)
Source: EPC and EU Commission (2006).Notes: These f igures refer to the baseline projections for social security spending on pensions, education and unemployment transfers. For health care and long-term care, the projections refer to “AWG reference scenarios”.1) Total expenditure for GR is not reported due to missing data.2) Total expenditure for FR and PT does not include long-term care.
Health Long-term Unemployment Total of all Pensions care care benefits Education available items
Change from Change from Change from Change from Change from Change from 2004 to 2004 to: 2004 to: 2004 to: 2004 to: 2004 to: 2030 2050 2030 2050 2030 2050 2030 2050 2030 2050 2030 2050
BE 4.3 5.1 0.9 1.4 0.4 1.0 -0.5 -0.5 -0.6 -0.7 4.5 6.3DE 0.9 1.7 0.9 1.2 0.4 1.0 -0.4 -0.4 -0.8 -0.9 1.0 2.7GR 1) 0.8 1.7 -0.1 -0.1 -0.5 -0.4 ES 3.3 7.1 1.2 2.2 0.0 0.2 -0.4 -0.4 -0.7 -0.6 3.3 8.5FR 2) 1.5 2.0 1.2 1.8 -0.3 -0.3 -0.5 -0.5 1.9 2.9IE 3.1 6.4 1.2 2.0 0.1 0.6 -0.2 -0.2 -0.9 -1.0 3.3 7.8IT 0.8 0.4 0.9 1.3 0.2 0.7 -0.1 -0.1 -0.8 -0.6 1.0 1.7LU 5.0 7.4 0.8 1.2 0.2 0.6 -0.0 -0.1 -0.5 -0.9 5.4 8.2NL 2.9 3.5 1.0 1.3 0.3 0.6 -0.2 -0.2 -0.2 -0.2 3.8 5.0AT 0.6 -1.2 1.0 1.6 0.3 0.9 -0.1 -0.1 -0.9 -1.0 0.9 0.2PT 2) 4.9 9.7 -0.1 0.5 -0.1 -0.1 -0.6 -0.4 4.1 9.7FI 3.3 3.1 1.1 1.4 1.2 1.8 -0.4 -0.4 -0.6 -0.7 4.7 5.2
EU 1.3 2.2 1.0 1.6 0.2 0.6 -0.3 -0.3 -0.7 -0.6 1.6 3.4Euro area 1.6 2.6 1.0 1.5 0.2 0.5 -0.3 -0.3 -0.7 -0.6 1.9 3.7
6 PUBL IC F INANCES
31 It should be noted that the numbers presented here only present the net present value of additional future pension payments. Thus, they are much smaller than the implicit pension debt presented in some studies in this area, which reflect the entire stock of outstanding pension-related f iscal obligations.
32 P. Rother, M. Catenaro and G. Schwab (2003), “Ageing and pensions in the euro area, survey and projection results”, World Bank Social Protection Working Paper No 307 and, by the same authors, (2004), “Ageing and pensions in the euro area”, FinanzArchiv, December.

34ECB Occasional Paper No. 51August 2006
health-related goods and services, which themselves depend on multiple factors including the specific incentive effects resulting form market structures and insurance arrangements. Furthermore, as the entitlement to publicly financed health services is less precisely defined than in the area of pensions, discretionary policy changes can have a larger short-term impact on expenditure, adding to the difficulties of making accurate long-term forecasts.
In view of the problems related to forecasting health care developments, the major cross-country studies apply a mechanistic approach. In a f irst step, health and long-term care expenditure profiles by age and sex are defined on the basis of current observations. In a second step, the derived age and gender-specif ic expenditure levels are matched to demographic projections to generate total future expenditures. In addition, assumptions are made regarding the health status of older people in the future, i.e., whether the additional years gained by increased longevity will be spent in good or bad health. Per capita expenditures for health and long-term care are assumed to rise with GDP per capita or, alternatively, GDP per worker, where the latter is thought to also capture changes in productivity. However, the results for both methods are very similar. This approach generates projected increases in public expenditure for health and long-term care of between 1 and 3 percentage points of GDP by 2050 for most countries (see also Table 11).
However, this approach leaves out other effects that have contributed importantly to rising health care expenditure in the past. For example, the income elasticity of demand for health care has been estimated above unity, so that health care expenditure would tend to rise faster than income. In this regard, it has also been shown that it is rather the demand for quality, i.e. expensive new medical technologies, which is driving expenditure, rather than volume increases in the application of existing procedures. Empirical studies suggest that technological progress has contributed a major part to past expenditure increases.
The impact of other factors needs to be studied in greater detail before reliable quantitative projections can be derived. Empirical studies suggest that a large part of health expenditure for old-aged people can be explained by the proximity to death as health care expenditures in the f inal year of life have been found to be 5 to 7 times the average expenditure per insured person. These “death-related” costs would not increase with rising longevity but would indeed be delayed, offsetting some of the projected expenditure increases. In addition, as referred to above the health status of the elderly population will play a major role. On the one hand, projections of people’s health status suggest that people will not only live longer, but they will also do so in better overall health. On the other hand, some costly chronic diseases, such as dementia, appear to be related to biological age and thus their prevalence could increase strongly with rising longevity. The problem of f inancing long-term care for frail and elderly individuals is also receiving growing attention as projections point to a strongly rising demand for long-term care. At the same time, changing work and life patterns of the working age population are reducing the importance of the intra-family provision of care services.
6.1.3 OTHER DIRECT FISCAL EFFECTS Some effects could in part offset the expenditure-increasing impact of demographic ageing. In particular with a declining number of children, expenditure for public education and for family allowances should decline. However, such offsetting effects are likely to be small, amounting to close to ½ p.p. of GDP or less for most countries (see Table 1), assuming the same mechanical projection method as used for the health cost projections. In addition, it should be noted that with increasingly scarce labour due to low fertility rates, there may be higher pressure on governments to invest in all forms of education, including in particular lifelong learning, so that per capita education expenditures would tend to increase. Finally, the EPC and European Commission study presents estimates for the impact of ageing on

35ECB
Occasional Paper No. 51August 2006
unemployment expenditures, again using the same mechanistic approach (see Table 1). However, the projected numbers are based on the fairly optimistic labour market assumptions discussed above and thus should be considered with caution.
The tax treatment of private pension savings can result in a shift of tax receipts into the future. In many countries, contributions to funded pension arrangements and accumulated returns are tax exempt or taxed at a low rate. By contrast, disbursements are fully taxed. As the importance of funded pension arrangements increases, such tax arrangements can lead to a postponement of tax receipts of an economically meaningful magnitude. During the period of pension accumulation, the government receives lower revenues, but during the decumulation period revenues are higher. This increase can partially offset the decline in public revenues due to the shrinking labour force and thus help to stabilise public f inances over time, although the overall impact of such arrangements on public f inances can only be assessed by looking at the specif ic tax provisions.
6.2 REFORM OPTIONS
6.2.1 PENSION REFORMThe projected demographic changes make parametric reforms of existing pension systems necessary, including changes to retirement ages (see Section 4.3), contributions and replacement rates. However, the impact of the projected demographic shift is very large. Without further reforms, pension contribution rates would need to rise above 40% of wages to keep these systems in balance in many countries; alternatively, benef its from public pension systems would need to fall dramatically. Thus, the necessary extent of parametric reforms to balance PAYG pension systems would probably be politically or economically unfeasible.
Given the intensity of the pressures, the above parametric reforms of PAYG systems need to be complemented by systemic reforms to the f inancing of pension systems. A move towards
greater funding shifts part of the f inancing burden away from labour, which is becoming scarcer, to capital, which can be accumulated before the onset of the major retirement wave. Due to the different economic characteristics of the alternative f inancing arrangements, this diversif ication can reduce the overall vulnerability of the pension arrangements ahead of the upcoming demographic changes. As the contribution of funded pension arrangements to overall pensions rises, the size of the PAYG system can be reduced to alleviate the f iscal burden. During the move towards more funding, existing pension claims have to be considered. The way in which the transition is f inanced is also a political question and can involve some burden-sharing between pensioners and contributors.
A number of EU countries have combined the introduction of partially funded pension arrangements with a transformation of PAYG systems into so-called notional def ined-contribution (NDC) arrangements (Italy, Latvia, Poland, Slovakia and Sweden). In essence, while maintaining the PAYG financing of pensions, such NDC schemes mimic the characteristics of individually funded arrangements. Thus, the future individual pension depends exclusively on own-paid contributions into a “notional” pension account and a commonly applied accrual rate. As there is no intra-generational redistribution through the pension system, the perceived tax burden on labour should fall. This improves the incentives to work and can contribute to achieving the labour market objectives discussed above. At the macro level, balance of the NDC scheme is ensured by limiting the interest rate received on the notional pension account to the rate of growth of the contribution base (e.g. the wage sum of the economy). As balancing these pension schemes generally requires considerable cuts in generosity compared with previous arrangements, current workers are required to build up pension claims by contributing to funded pension arrangements simultaneously. Governments can raise the incentives to contribute to funded arrangements, for example
6 PUBL IC F INANCES

36ECB Occasional Paper No. 51August 2006
by exempting contributions from income tax. With regard to the implementation of reforms of PAYG systems, it should be noted that the equivalence between individual contributions and pensions can generally also be strengthened within existing PAYG systems.
A move towards greater reliance on funded pension arrangements would have f inancial market implications in line with the considerations discussed in the previous section. In this regard, the impact of ageing and pension reforms on the real interest rate level needs to be taken into account for the projection of the necessary contributions to funded arrangements that ensure a sufficient pension level. Indeed, should real returns in funded arrangements fall short of expectations, the resulting lower individual pensions could lead to calls for publicly f inanced bailouts – with an adverse effect on f iscal sustainability. In view of differences in the speed of ageing across countries and regions, pension savings returns will benefit from the international diversification of pension assets. From a policy perspective, policies should be put in place to facilitate the development of the proper infrastructure that will enable managers of retirement savings (e.g. pension funds and insurance companies) to allocate eff iciently retirement savings and risks. In this framework, regulations may need to be implemented to ensure the non-speculative character of retirement savings. Such regulation is also important from a public f inance point of view as abrupt adverse asset price changes could force the government eventually to take over additional pension obligations. Especially in systems where defined-contribution pension funds are more common, a fair degree of monitoring and the eff icient use of risk management techniques should be assured. Finally, the effect of population ageing on financial intermediation is likely to enhance the global importance of institutional investors. This is turn implies that monitoring and supervision of these intermediaries will have to be dealt with at a global level more than at a domestic level.
6.2.2 REFORM OF HEALTH CARE SYSTEMSIn the area of health and long-term care, rising expenditure pressures and declining revenues due to slowing or even negative growth in the working age population impose equally hard choices on many public health systems. To face the future burden, governments may have to raise contribution rates, streamline services and secure private financing and funding. In general, governments have found it diff icult to curtail expenditure permanently by limiting access to some forms of (expensive) treatments. Thus, discussions in the relevant literature point to the importance of setting appropriate incentives for all market participants. On the patient side, this can be achieved through co-payments, as already implemented in a number of countries. Such co-payments could increase eff iciency if they provide the appropriate incentives on the demand side. On the supply side, strengthening market mechanisms in the relationship between medical service providers and insurers can improve overall performance. Contracting and payment structures should reflect true resource costs and hard budget constraints to set the right economic incentives. Benchmarking of the performance of medical service providers can help to raise transparency.
6.3 EU INSTITUTIONS AND STRUCTURAL COORDINATION33
Reflecting the need for comprehensive reforms and to provide more substantial guidance on policies, the EU agreed in 2001 on a three-pronged strategy to cope with the projected pressures of population ageing. This strategy was f irst reflected in the 2001 Broad Economic Policy Guidelines (BEPGs) and comprises three broad objectives: to raise employment rates, to reduce government debt rapidly and to reform pension systems, including moves towards a greater reliance on funding.
33 This section draws on European Central Bank (2003), “The need for comprehensive reforms to cope with population ageing”, Monthly Bulletin, April, pp. 39-52.

37ECB
Occasional Paper No. 51August 2006
The EU’s involvement in the monitoring and assessment of ageing-related policies is taking place at three levels. At the f irst level, the Treaty establishing the European Community (the Treaty) and the Stability and Growth Pact provide a quantitative framework for f iscal policies. At the second level, ageing-related policies are a matter of concern for the EU and are thus covered by the enhanced code of conduct for the stability and convergence programmes and the BEPGs. Finally, the EU’s open method of coordination reflects the principle of subsidiarity by providing a platform for the coordinated peer assessment of pension and health policies. Table 12 provides details of the involvement of the different institutional bodies at the EU level.
The Treaty and the Stability and Growth Pact establish rules for the prudent conduct of f iscal policies. As these rules apply to general government accounts, they also cover the f iscal effects of population ageing. To comply with the Treaty, countries should avoid excessive def icits (Article 104). Compliance with budgetary discipline is examined regularly with reference to numerical values for the budget deficit and public debt, with threshold values of 3% of GDP for the deficit and 60% of GDP for debt. The Stability and Growth Pact aims both to ensure lasting compliance of f iscal policies with the requirement of budgetary prudence and to implement procedures for monitoring f iscal developments. The numerical limits on deficits and debt provided by the Treaty and the
Table 12 EU institutional bodies and their function in the pensions area
European Commission Council of Ministers
– monitors national pension reform processes
– recommends Broad Economic Policy Guidelines
– proposes Employment Guidelines and recommendations
– contributes to joint Council/Commission report assessing national pension strategies
– works with advisory committees on specif ic aspects
– liaises with European social partners and relevant NGOs
ECOFIN
Broad Economic Policy Guidelines and multilateral surveillance process
Stability and Growth Pact
Employment, Social Policy, Health and Consumer Affairs (ESPHCA) Council
Employment process and open method of coordination applied to social protection, social integration and pensions
Economic and Financial Committee (EFC)– assists the Council in its work on the
BEPGs– assists the Council in its work on stability
and convergence programmes
Economic Policy Committee (EPC)– assists the Council and the Commission
in the assessment of national pension strategies, with a focus on the economic and budgetary implications of pension systems as part of the multilateral surveillance process (Article 99 of the Treaty)
– assists the Council in drafting the joint Council/Commission report on pension reforms
– develops indicators, particularly for the long-term f inancial sustainability of pension systems and prepares simulations to be carried out by Member States
– works jointly with the SPC on implementing the open method of coordination with regard to pensions
Employment Committee (EMCO)– assists the Council and the Commission
in the assessment of progress under the European Employment Strategy and in particular the evolution of employment rates
Social Protection Committee (SPC)– assists the Council and the Commission
in the assessment of national pension strategies, with a particular focus on the adequacy of pensions and adaptation to a changing society as part of the open method of coordination
– assists the Council in drafting the joint Council/Commission report on pension reforms
– develops indicators, particularly for the adequacy and adaptability of pension systems
– works jointly with the EPC on implementing the open method of coordination with regard to pensions
European Parliament – is being kept informed by the Council and the Commission
European Council– gives general political guidelines and assesses progress at Spring meeting
Source: European Commission (2001).
6 PUBL IC F INANCES

38ECB Occasional Paper No. 51August 2006
Stability and Growth Pact imply that countries have to undertake sufficient efforts to cope with the f iscal burden of population ageing. In particular, the currently implicit debt arising in public pension systems will turn explicit over time, forcing governments to take offsetting measures in time to ensure compliance with the f iscal framework. For this mechanism to work, it is essential that the numerical limits are observed in a strict manner. In the recent revision of the Stability and Growth Pact, the possible short-term f iscal costs of systemic pension reforms are explicitly acknowledged. Recent ECOFIN Council opinions on stability programmes have put particular emphasis on the assessment of f iscal sustainability.
Turning to the second level for the coordination of ageing-related f iscal policies, the EU has identif ied the impending pressures due to ageing as an area of common concern. As a tool to communicate overall policy orientations, the BEPGs are at the centre of economic policy coordination. The ECOFIN Council may issue a recommendation to countries not complying with the BEPGs. The code of conduct governing the content and format of stability and convergence programmes has also become an important element of monitoring sustainability since it has been revised to reflect the growing awareness of ageing-induced f iscal burdens. Since 2001 countries’ programmes have provided information on the long-term sustainability of public f inances up to 2050 and discussed measures to tackle the budgetary implications of ageing. As with the BEPGs, the submission of stability programmes and the respective Council opinions strengthen transparency and peer pressure.
At the third level of cooperation and in full respect of the exclusive competencies of EU Member States on social security matters, the open method of coordination provides a platform for Member States to discuss their specif ic pension-related policy strategies in a broadly standardised framework. In 2002 the EU Member States prepared national pension strategy reports describing their approaches for
securing the sustainability of pension systems. These reports were discussed in a peer review exercise at the European level.
Overall, the EU’s institutional f iscal framework appears to provide the right incentives for policy-makers to address the ageing-induced challenges in a timely and orderly manner. If the numerical and policy guidelines were fully implemented, the risk of adverse f iscal impacts of the demographic shift would probably be small. To avoid abrupt and drastic reversals of f iscal policies, governments need to implement reforms well ahead of the start of the ageing-induced increase in public expenditures. In this regard, national governments remain exclusively responsible for a large share of the policies involved, making national ownership of reform efforts indispensable.
7 CONCLUSION
Future demographic developments in the euro area are characterised by declining population growth and a gradual increase in the old age dependency ratio. The projections available from Eurostat and the UN suggest that after 2020 the total population will start to shrink in absolute terms and the old age dependency ratio (as a percentage of the total population) will have reached more than 30%. Taken together, these developments can have important consequences for economic growth, f inancial markets and public f inances.
The scenario analysis presented in this paper shows that, under the assumption of an unchanged rate of change of labour utilisation and productivity growth, the projected demographic trends imply a decline in average real GDP growth to around 1% in the period from 2020 to 2050. The rise in the old age dependency ratio implies that there would also be a decline in per capita growth. In order to sustain economic growth at around its average observed since the 1980s, a number of offsetting factors raising labour utilisation and/or productivity are likely to be necessary. As the

39ECB
Occasional Paper No. 51August 2006
much discussed increases in the participation rate or decreases in the unemployment rate will be subject to natural limits, offsetting factors will also have to include increases in average hours worked per person and in the average retirement age.
The paper shows that the European Employment Guidelines imply an action plan that can help to mitigate or counteract the adverse impact of future demographic trends on economic growth. It will be of particular importance to increase the participation of women of prime working age and thus to close the apparent gender gap in the group aged 25-54. Moreover, a number of euro area countries have a large potential to increase labour supply via higher average hours worked and by raising the effective retirement age. In a number of cases, this implies a need to change progressive tax systems and early retirement schemes that often discourage labour market entry, particularly of women and older workers.
The main impact from future demographic trends on f inancial markets would most likely come via the projected ageing of the population. This will prompt changes in the saving/investment balance of households. Simulations based on dynamic general equilibrium models predict a decline in the equilibrium real interest rate due to an increase in the capital intensity of production and a decrease in the investment needed to maintain the capital stock. Concerning the impact on f inancial portfolios, individuals belonging to different generations tend to choose different mixtures of assets in terms of risk. When the current active population will retire (the so-called baby boom generation), there is a potential for downward pressures on asset prices arising from a large generation of retired people selling their assets to a smaller generation of middle-aged people. The predictions arising from theoretical models about the size of these effects are subject to a number of caveats and highly uncertain. At the same time, it appears relatively safe to predict that population ageing and the implied increase in overall funds used to f inance pensions and
retirement will increase the role of f inancial intermediaries within the f inancial system.
The ageing of the population and the possible consequence in terms of lower growth in per capita incomes will also have implications for public expenditures to the extent that European pension and health care systems are based on a PAYG principle. Simulations show that for most euro area countries – even under favourable assumptions with regard to labour market developments – the projected increases in public expenditure on pensions and health care up to 2050 lie above 3 percentage points of GDP and, for some countries, considerably higher. A number of reform options exist. As regards pension systems, a number of EU countries have introduced partially funded pension arrangements in combination with a transformation of PAYG systems into so-called notional def ined-contribution schemes that mimic characteristics of individually funded arrangements. As regards health care, a system of co-payments on the part of the patient, which has been implemented in a number of countries, can reduce costs by providing the appropriate incentives on the demand side.
When assessing the impact of future demographic trends on economic performance and systems, it has to be borne in mind that the analysis presented in this paper is subject to a number of caveats of which policy-makers need to be aware. First, the assumptions underlying the projected demographic trends become increasingly uncertain as the projection period becomes longer. In this respect, it needs to be emphasised that the projected absolute declines in euro area total population would for most countries imply an unprecedented development, making it problematic to project developments on the basis of past experience. Second, the analysis largely abstracts from the complexity in the interaction between demographic trends on the one side and economic and f inancial developments on the other. In this respect, the various consequences on labour markets, f inancial markets and public f inances would need to be examined within a fully encompassing
7 CONCLUS ION

40ECB Occasional Paper No. 51August 2006
framework that takes into account the various offsetting or reinforcing effects that may arise through this interaction.
The implications of all this for monetary policy can be viewed from different angles. On the one hand, changes in demographic trends can be seen against their potential to affect key policy paradigms such as the equilibrium real interest rate or the relative importance of the channels through which interest rates affect economic activity and prices. On the other hand, the secular nature of changes in demographic trends can be seen as suggesting that the materialisation of any effects would be very drawn out and that there would hence be only modest implications for monetary policy over the relevant medium-term horizons. In such an environment, monetary policy-makers need not only to be aware of the possible equilibrium effects of demographic changes, but also to closely monitor the possibility of more abrupt changes along the transition path. For instance, while standard life cycle paradigms suggest that the ageing of the population should ultimately lead to a fall in the aggregate saving ratio, the medium-term implications might point in the opposite direction if expectations of increased longevity and problems surrounding unfunded pension schemes induce agents to step up their saving propensity. At the same time, the strength and the direction of such movements in the saving ratio will also crucially depend on how strongly the life cycle structure of agents’ income changes in response to the reforms in labour markets and social security systems that may inevitably be triggered by demographic developments. Such uncertainty and complexity obviously make it diff icult to gauge concrete implications for monetary policy, but they point at a minimum to a need for additional awareness.

41ECB
Occasional Paper No. 51August 2006
ANNEX 1 GLOSSARY AND DATA SOURCES
GLOSSARY
Dependency ratio, total: Number of persons in the population that are not of working age as a percentage of the working age population.
Employment: Sum of employees and self-employed persons.
Fertility rate: Average number of child births per woman.
Hours worked: Number of paid hours worked per year and per person employed. This includes the hours of persons that have several jobs at the same time. The estimates used in this paper include paid overtime but exclude paid hours that are not worked due to annual leave, sick leave, parental leave, etc.
Life expectancy at birth: Average number of years a person born can expect to live given the prevailing mortality rates in that area and period.
Labour productivity: Real output per hour worked.
Labour utilisation: Hours worked per head of the working age population.
Net migration rate: Net number of migrants (i.e. number of immigrants minus the number of emigrants) as a percentage of the total population.
Old age dependency ratio: Number of persons in the population above the age of 64 as a percentage of the working age population.
Participation rate: Number of persons in the labour force as a percentage of the working age population.
Population, total: Number of people living in the area of reference.
Unemployment rate: Number of unemployed persons (defined according to ILO recommendations) as a percentage of the labour force.
Working age population: Population of age between 15 and 64 years.
Young age dependency ratio: Number of persons in the population below the age of 15 as a percentage of the working age population.
ANNEX

42ECB Occasional Paper No. 51August 2006
DATA SOURCES
All data (for both European countries and the US) come from Eurostat, with the exception of data for annual hours worked. The latter were taken from the Total Economy Database of the Groningen Growth and Development Centre and The Conference Board (May 2006, http://www.ggdc.net). For more details on the construction of euro area and EU aggregates, the same approach as Musso and Westermann (2005) has been used.
Population projections for the EU countries over the period 2005-2050 are based on Eurostat’s demographic projections (see footnote 1 on page 7 for more details) and the United Nations’ World Population projections (2004 revision, released in February 2005). For the US the UN’s World Population projections (2004 revision, released in February 2005) are used.

43ECB
Occasional Paper No. 51August 2006
ANNEX 2 DEMOGRAPHIC DEVELOPMENTS IN EUROPE: THE EURO AREA VERSUS THE EUROPEAN UNION
Chart A Past and projected total population growth in the euro area and the European Union
(percentages)
Sources: ECB calculations based on Eurostat (New Cronos database, 2005 revision) and UN (UN’s World Population Database, 2004 revision) data and projections.
European Union
-1.0
-0.5
0.0
0.5
1.0
1.5
2.0
-1.0
-0.5
0.0
0.5
1.0
1.5
2.0
-1.0
-0.5
0.0
0.5
1.0
1.5
2.0
-1.0
-0.5
0.0
0.5
1.0
1.5
2.0
total population growth (Eurostat)total population growth (UN)
Euro area
1 2 3 4 5 6 7 8 9 10 11 12 13 14 15 16 17 18 19 20 1 2 3 4 5 6 7 8 9 10 11 12 13 14 15 16 17 18 19 20
4 1965-705 1970-756 1975-80
1 1950-552 1955-603 1960-65
7 1980-858 1985-909 1990-95
10 1995-200011 2000-0512 2005-10
19 2040-4520 2045-50
13 2010-1514 2015-2015 2020-25
16 2025-3017 2030-3518 2035-40
Chart B Past and projected working age population growth in the euro area and the European Union(percentages)
Sources: ECB calculations based on Eurostat (New Cronos database, 2005 revision) and UN (UN’s World Population Database, 2004 revision) data and projections.
European Union
-1.0
-0.5
0.0
0.5
1.0
1.5
2.0
-1.0
-0.5
0.0
0.5
1.0
1.5
2.0
-1.0
-0.5
0.0
0.5
1.0
1.5
2.0
-1.0
-0.5
0.0
0.5
1.0
1.5
2.0
working age (15-64) population growth (Eurostat)working age (15-64) population growth (UN)
Euro area
1 2 3 4 5 6 7 8 9 10 11 12 13 14 15 16 17 18 19 20 1 2 3 4 5 6 7 8 9 10 11 12 13 14 15 16 17 18 19 20
4 1965-705 1970-756 1975-80
1 1950-552 1955-603 1960-65
7 1980-858 1985-909 1990-95
10 1995-200011 2000-0512 2005-10
19 2040-4520 2045-50
13 2010-1514 2015-2015 2020-25
16 2025-3017 2030-3518 2035-40
ANNEX

44ECB Occasional Paper No. 51August 2006
Chart C Past and projected dependency ratios in the euro area and the European Union
(percentages)
Sources: ECB calculations based on Eurostat (New Cronos database, 2005 revision) and UN (UN’s World Population Database, 2004 revision) data and projections.
European Union
total dependency ratio (Eurostat)total dependency ratio (UN)
Euro area
45
50
55
60
65
70
75
80
85
45
50
55
60
65
70
75
80
85
45
50
55
60
65
70
75
80
85
45
50
55
60
65
70
75
80
85
1950 198019701960 20001990 20202010 2030 2040 2050 1950 198019701960 20001990 20202010 2030 2040 2050
Chart D Past and projected age-specific dependency ratios in the euro area and the European Union(percentages)
Sources: ECB calculations based on Eurostat (New Cronos database, 2005 revision) and UN (UN’s World Population Database, 2004 revision) data and projections.
European Union
old age dependency ratio (Eurostat)old age dependency ratio (UN)
young age dependency ratio (Eurostat)young age dependency ratio (UN)
Euro area
05
1015202530354045505560
051015202530354045505560
05
1015202530354045505560
051015202530354045505560
1950 198019701960 20001990 20202010 2030 2040 2050 1950 198019701960 20001990 20202010 2030 2040 2050

45ECB
Occasional Paper No. 51August 2006
Chart E Past and projected fertility rates in the euro area and the European Union
(percentages)
Sources: ECB calculations based on Eurostat (New Cronos database, 2005 revision) and UN (UN’s World Population Database, 2004 revision) data and projections.
European Union
total fertility rate (UN)total fertility rate (Eurostat)
replacement fertility rate
Euro area
0.0
0.5
1.0
1.5
2.0
2.5
3.0
3.5
4.0
0.0
0.5
1.0
1.5
2.0
2.5
3.0
3.5
4.0
0.0
0.5
1.0
1.5
2.0
2.5
3.0
3.5
4.0
0.0
0.5
1.0
1.5
2.0
2.5
3.0
3.5
4.0
1 2 3 4 5 6 7 8 9 10 11 12 13 14 15 16 17 18 19 20 1 2 3 4 5 6 7 8 9 10 11 12 13 14 15 16 17 18 19 20
4 1965-705 1970-756 1975-80
1 1950-552 1955-603 1960-65
7 1980-858 1985-909 1990-95
10 1995-200011 2000-0512 2005-10
19 2040-4520 2045-50
13 2010-1514 2015-2015 2020-25
16 2025-3017 2030-3518 2035-40
Chart F Past and projected life expectancy in the euro area and the European Union
(percentages)
Sources: ECB calculations based on Eurostat (New Cronos database, 2005 revision) and UN (UN’s World Population Database, 2004 revision) data and projections.
European Union
life expectancy at birth (Eurostat)life expectancy at birth (UN)
Euro area
60
65
70
75
80
85
90
60
65
70
75
80
85
90
60
65
70
75
80
85
90
60
65
70
75
80
85
90
1 2 3 4 5 6 7 8 9 10 11 12 13 14 15 16 17 18 19 20 1 2 3 4 5 6 7 8 9 10 11 12 13 14 15 16 17 18 19 20
4 1965-705 1970-756 1975-80
1 1950-552 1955-603 1960-65
7 1980-858 1985-909 1990-95
10 1995-200011 2000-0512 2005-10
19 2040-4520 2045-50
13 2010-1514 2015-2015 2020-25
16 2025-3017 2030-3518 2035-40
ANNEX

46ECB Occasional Paper No. 51August 2006
Chart G Past and projected net migration rates in the euro area and the European Union
(percentages)
Sources: ECB calculations based on Eurostat (New Cronos database, 2005 revision) and UN (UN’s World Population Database, 2004 revision) data and projections.Note: Eurostat averages for 2000-2005 (dashed segments) are based on data for 2004 and 2005 only.
European Union
net migration rate (UN)net migration rate (Eurostat)
1995-2000
2000-2005
2005-2010
2010-2015
2015-2020
2020-2025
2025-2030
2030-2035
2035-2040
2040-2045
2045-2050
1995-2000
2000-2005
2005-2010
2010-2015
2015-2020
2020-2025
2025-2030
2030-2035
2035-2040
2040-2045
2045-2050
Euro area
0
1
2
3
4
5
0
1
2
3
4
5
0
1
2
3
4
5
0
1
2
3
4
5

47ECB
Occasional Paper No. 51August 2006
ANNEX 3 UN PROJECTIONS FOR INDIVIDUAL EURO AREA COUNTRIES
Chart
Belgium
population growth rate (%), (left-hand scale)total fertility rate (left-hand scale)life expectancy (years), (right-hand scale)
% of population age 15-64 (left-hand scale)% of population age 65+ (left-hand scale)old age dependency ratio (right-hand scale)
Belgium
-1.5
-1.0
-0.5
0.0
0.5
1.0
1.5
2.0
1990-1995
1995-2000
2000-2005
2005-2010
2010-2015
2015-2020
2020-2025
2025-2030
2030-2035
2035-2040
2040-2045
2045-2050
72
74
76
78
80
82
84
86
01020304050607080
1990 1995 2000 2005 2010 2015 2020 2025 2030 2035 2040 2045 205005101520253035404550
GermanyGermany
-1.5-1.0-0.50.00.51.01.52.02.53.0
1990-1995
1995-2000
2000-2005
2005-2010
2010-2015
2015-2020
2020-2025
2025-2030
2030-2035
2035-2040
2040-2045
2045-2050
72
74
76
78
80
82
84
86
01020304050607080
1990 1995 2000 2005 2010 2015 2020 2025 2030 2035 2040 2045 20500
10
20
30
40
50
60
GreeceGreece
-2.0-1.00.01.02.03.04.05.06.0
1990-1995
1995-2000
2000-2005
2005-2010
2010-2015
2015-2020
2020-2025
2025-2030
2030-2035
2035-2040
2040-2045
2045-2050
74757677787980818283
01020304050607080
1990 1995 2000 2005 2010 2015 2020 2025 2030 2035 2040 2045 20500
10
20
30
40
50
60
SpainSpain
1990-1995
1995-2000
2000-2005
2005-2010
2010-2015
2015-2020
2020-2025
2025-2030
2030-2035
2035-2040
2040-2045
2045-2050
1990 1995 2000 2005 2010 2015 2020 2025 2030 2035 2040 2045 2050-2.0-1.00.01.02.03.04.05.06.07.0
72
74
76
78
80
82
84
86
01020304050607080
0
10
20
30
40
50
60
70
ANNEX

48ECB Occasional Paper No. 51August 2006
Chart
FranceFrance
1990-1995
1995-2000
2000-2005
2005-2010
2010-2015
2015-2020
2020-2025
2025-2030
2030-2035
2035-2040
2040-2045
2045-2050
1990 1995 2000 2005 2010 2015 2020 2025 2030 2035 2040 2045 2050-1.0-0.50.00.51.01.52.02.53.0
72
74
76
78
80
82
84
86
0
10
20
30
40
50
60
70
05101520253035404550
population growth rate (%), (left-hand scale)total fertility rate (left-hand scale)life expectancy (years), (right-hand scale)
% of population age 15-64 (left-hand scale)% of population age 65+ (left-hand scale)old age dependency ratio (right-hand scale)
IrelandIreland
1990-1995
1995-2000
2000-2005
2005-2010
2010-2015
2015-2020
2020-2025
2025-2030
2030-2035
2035-2040
2040-2045
2045-2050
1990 1995 2000 2005 2010 2015 2020 2025 2030 2035 2040 2045 20500.01.02.03.04.05.06.07.08.09.0
10.0
707274767880828486
01020304050607080
05101520253035404550
ItalyItaly
1990-1995
1995-2000
2000-2005
2005-2010
2010-2015
2015-2020
2020-2025
2025-2030
2030-2035
2035-2040
2040-2045
2045-2050
1990 1995 2000 2005 2010 2015 2020 2025 2030 2035 2040 2045 2050-3.0-2.5-2.0-1.5-1.0-0.50.00.51.01.52.02.5
72
74
76
78
80
82
84
86
01020304050607080
01020304050607080
LuxembourgLuxembourg
1990-1995
1995-2000
2000-2005
2005-2010
2010-2015
2015-2020
2020-2025
2025-2030
2030-2035
2035-2040
2040-2045
2045-2050
1990 1995 2000 2005 2010 2015 2020 2025 2030 2035 2040 2045 20500.01.02.03.04.05.06.07.08.0
707274767880828486
01020304050607080
0510152025303540

49ECB
Occasional Paper No. 51August 2006
Chart
NetherlandsNetherlands
1990-1995
1995-2000
2000-2005
2005-2010
2010-2015
2015-2020
2020-2025
2025-2030
2030-2035
2035-2040
2040-2045
2045-2050
1990 1995 2000 2005 2010 2015 2020 2025 2030 2035 2040 2045 2050-1.0-0.50.00.51.01.52.02.53.03.54.0
7475767778798081828384
01020304050607080
05101520253035404550
population growth rate (%), (left-hand scale)total fertility rate (left-hand scale)life expectancy (years), (right-hand scale)
% of population age 15-64 (left-hand scale)% of population age 65+ (left-hand scale)old age dependency ratio (right-hand scale)
AustriaAustria
1990-1995
1995-2000
2000-2005
2005-2010
2010-2015
2015-2020
2020-2025
2025-2030
2030-2035
2035-2040
2040-2045
2045-2050
1990 1995 2000 2005 2010 2015 2020 2025 2030 2035 2040 2045 2050-2.0
-1.0
0.0
1.0
2.0
3.0
4.0
5.0
72
74
76
78
80
82
84
86
01020304050607080
0
10
20
30
40
50
60
PortugalPortugal
1990-1995
1995-2000
2000-2005
2005-2010
2010-2015
2015-2020
2020-2025
2025-2030
2030-2035
2035-2040
2040-2045
2045-2050
1990 1995 2000 2005 2010 2015 2020 2025 2030 2035 2040 2045 2050-1.5-1.0-0.50.00.51.01.52.02.53.0
70
72
74
76
78
80
82
84
01020304050607080
0
10
20
30
40
50
60
FinlandFinland
1990-1995
1995-2000
2000-2005
2005-2010
2010-2015
2015-2020
2020-2025
2025-2030
2030-2035
2035-2040
2040-2045
2045-2050
1990 1995 2000 2005 2010 2015 2020 2025 2030 2035 2040 2045 2050-1.0-0.50.00.51.01.52.02.53.0
707274767880828486
01020304050607080
05101520253035404550
ANNEX
Source: UN (UN’s World Population Database, 2004 revision) projections.

50ECB Occasional Paper No. 51August 2006
ANNEX 4 DECOMPOSITION OF THE BROAD FACTORS OF GROWTH
Often growth accounting exercises are based on a production function and a number of identities (see, for example, Barro and Sala-i-Martin (2003), Economic Growth, MIT Press, 2nd edition). In the current exercise, in order to abstract from issues regarding the form of the production function, which is surrounded by signif icant controversy, only accounting identities are used. On a more general level, real GDP can be decomposed into labour productivity, labour utilisation and demographic factors. The latter can be seen as resulting from the dependency ratio and total population. Real GDP per capita depends on labour productivity, labour utilisation and the dependency ratio. Each component can be seen as resulting from more disaggregated factors. For example, labour utilisation can be expressed as a function of average hours worked, the unemployment rate and the participation rate.
EQUATIONS
Basic decomposition of real GDP (levels):
YY
H
H
P
P
PP
LP
WA
LU
WA
TOTTOT
DF
≡ ⎛⎝⎜
⎞⎠⎟
⋅⎛
⎝⎜
⎞
⎠⎟ ⋅
⎛
⎝⎜
⎞
⎠⎟ ⋅ ≡ LLP LU DF⋅ ⋅
Basic decomposition of real GDP per capita (levels):
Y
P
Y
H
H
P
P
PTOT
LP
WA
LU
WA
TOT
≡ ⎛⎝⎜
⎞⎠⎟
⋅⎛
⎝⎜
⎞
⎠⎟ ⋅
⎛
⎝⎜
⎞
⎠⎟
Basic decomposition of demographic factors (levels):
drP P
P
P
P
P
P drTOT WA
WA
TOT
WA
WA
TOT
≡ − ≡ − ⇒ ≡+
11
1
Labour utilisation:
LUH
P
H
E
E
N
N
PAH ur pr
WAAH ur
WA
pr
≡ ≡ ⋅ ⋅ ≡ ⋅ − ⋅
−( )
( )
1
1
Basic decomposition of real GDP (growth rates):
g g g g g g dr gY LP LU DF LP LU Ptot≡ + + ≈ + − +∆
Basic decomposition of real GDP per capita (growth rates):
g g g g g g drY P LP LU
dr
LP LUtot/ ≡ + + ≈ + −+1
1
∆
Basic decomposition of demographic factors (growth rates):
g g g g drP Ptot
dr
PtotWA≡ + ≈ −
+1
1
∆
VARIABLES
AH = average hours workedDF = demographic factorsdr = dependency ratio E = employmentH = total hours workedLP = labour productivityLU = labour utilisationN = labour force pr = participation ratePWA = working age populationPTOT = total populationur = unemployment rateY = real output

51ECB
Occasional Paper No. 51August 2006
ANNEX 5 ADDITIONAL DETAILED DEMOGRAPHIC PROJECTIONS
Chart A Projected age structure in the euro area, the European Union and the United States (Eurostat and US Census Bureau projections)(percentages)
Sources: ECB calculations based on Eurostat (New Cronos database, 2005 revision) and US Census Bureau (May 2004 release) data and projections.
Euro area
2005 2010 2015 2020 2025 2030 2035 2040 2045 2050
75-65-7455-6445-54
35-4425-3415-240-14
European Union
0102030405060708090
100
0102030405060708090100
2005 2010 2015 2020 2025 2030 2035 2040 2045 2050
2005 2010 2015 2020 2025 2030 2035 2040 2045 2050
United States
0102030405060708090
100
0102030405060708090100
0102030405060708090
100
0102030405060708090100
Chart B Past and projected age structure in the euro area, the European Union and the United States (UN data and projections)(percentages)
Sources: ECB calculations based on UN (UN’s World Population Database, 2004 revision) data and projections.
Euro area
1950 1960 1970 1980 1990 2000 2010 2020 2030 2040 2050
1950 1960 1970 1980 1990 2000 2010 2020 2030 2040 2050
1950 1960 1970 1980 1990 2000 2010 2020 2030 2040 2050
75-65-7455-6445-54
35-4425-3415-240-14
European Union
United States
0102030405060708090
100
0102030405060708090100
0102030405060708090
100
0102030405060708090100
0102030405060708090
100
0102030405060708090100
ANNEX

52ECB Occasional Paper No. 51August 2006
Chart D Past and projected mortality rates in the euro area, the European Union and the United States(percentages)
Sources: ECB calculations based on Eurostat (New Cronos database, 2005 revision) and UN (UN’s World Population Database, 2004 revision) data and projections.
death rate (UN)death rate (Eurostat)
Euro area
European Union
United States
1950-1970 1970-1990 1990-2010 2010-2030 2030-2050
1950-1970 1970-1990 1990-2010 2010-2030 2030-2050
1950-1970 1970-1990 1990-2010 2010-2030 2030-2050
2.0
1.5
1.0
0.5
0.0
2.0
1.5
1.0
0.5
0.0
2.0
1.5
1.0
0.5
0.0
2.0
1.5
1.0
0.5
0.0
2.0
1.5
1.0
0.5
0.0
2.0
1.5
1.0
0.5
0.0
Chart C Past and projected birth rates in the euro area, the European Union and the United States(percentages)
Sources: ECB calculations based on Eurostat (New Cronos database, 2005 revision) and UN (UN’s World Population Database, 2004 revision) data and projections.
birth rate (UN)birth rate (Eurostat)
Euro area
0.0
0.5
1.0
1.5
2.0
2.5
3.0
0.0
0.5
1.0
1.5
2.0
2.5
3.0
European Union
0.0
0.5
1.0
1.5
2.0
2.5
3.0
0.0
0.5
1.0
1.5
2.0
2.5
3.0
United States
0.0
0.5
1.0
1.5
2.0
2.5
3.0
0.0
0.5
1.0
1.5
2.0
2.5
3.0
1950-1970 1970-1990 1990-2010 2010-2030 2030-2050
1950-1970 1970-1990 1990-2010 2010-2030 2030-2050
1950-1970 1970-1990 1990-2010 2010-2030 2030-2050

53ECB
Occasional Paper No. 51August 2006
Chart E Past and projected life expectancy in the euro area, the European Union and the United States(percentages)
Sources: ECB calculations based on Eurostat (New Cronos database, 2005 revision) and UN (UN’s World Population Database, 2004 revision) data and projections.
Euro area
European Union
United States
male life expectancy at birth (Eurostat)male life expectancy at birth (UN)female life expectancy at birth (Eurostat)female life expectancy at birth (UN)
6065707580859095
100
6065707580859095100
6065707580859095
100
6065707580859095100
6065707580859095
100
6065707580859095100
1 2 3 4 5 6 7 8 9 10 11 12 13 14 15 16 17 18 19 20
1 2 3 4 5 6 7 8 9 10 11 12 13 14 15 16 17 18 19 20
1 2 3 4 5 6 7 8 9 10 11 12 13 14 15 16 17 18 19 20
6 1975-807 1980-858 1985-909 1990-9510 1995-2000
1 1950-552 1955-603 1960-654 1965-705 1970-75
11 2000-0512 2005-1013 2010-1514 2015-2015 2020-25
16 2025-3017 2030-3518 2035-4019 2040-4520 2045-50
Chart F Past and projected net migration in the euro area, the European Union and the United States(percentages)
Sources: ECB calculations based on Eurostat (New Cronos database, 2005 revision) and UN (UN’s World Population Database, 2004 revision) data and projections.Note: Eurostat averages for 2000-2005 (dashed segments) are based on data for 2004 and 2005 only.
Euro area
European Union
United States
net migration per year (UN)net migration per year (Eurostat)
500
700
900
1,100
1,300
1,500
500
700
900
1,100
1,300
1,500
500
700
900
1,100
1,300
1,500
500
700
900
1,100
1,300
1,500
500
700
900
1,100
1,300
1,500
500
700
900
1,100
1,300
1,500
1 2 3 4 5 6 7 8 9 10 11
1 2 3 4 5 6 7 8 9 10 11
1 2 3 4 5 6 7 8 9 10 11
1 1995-20002 2000-053 2005-10
4 2010-155 2015-206 2020-25
10 2040-4511 2045-50
7 2025-308 2030-359 2035-40
ANNEX

54ECB Occasional Paper No. 51August 2006
Chart G Alternative scenarios for projected population growth in the euro area (UN projections)(percentages)
Sources: ECB calculations based on UN (UN’s World Population Database, 2004 revision) data and projections.
Total population growth
Working age population growth
Dependency ratio
1950 1980 20402010
UN mediumUN highUN lowUN const fertility
-1.0
-0.5
0.0
0.5
1.0
-1.0
-0.5
0.0
0.5
1.0
-1.0
-0.5
0.0
0.5
1.0
-1.0
-0.5
0.0
0.5
1.0
455055606570758085
455055606570758085
20502020 20301990 20001960 1970
1 2 3 4 5 6 7 8 9 10 11 12 13 14 15 16 17 18 19 20
1 2 3 4 5 6 7 8 9 10 11 12 13 14 15 16 17 18 19 20
6 1975-807 1980-858 1985-909 1990-9510 1995-2000
1 1950-552 1955-603 1960-654 1965-705 1970-75
11 2000-0512 2005-1013 2010-1514 2015-2015 2020-25
16 2025-3017 2030-3518 2035-4019 2040-4520 2045-50
Chart H Revisions of projections for the euro area (UN projections)
(percentages)
Sources: ECB calculations based on UN (UN’s World Population Database, 2002 and 2004 revisions) data and projections.
UN 2002UN 2004
Total population growth
Working age population growth
Dependency ratio
-0.6
-0.4
-0.2
0.0
0.2
0.4
0.6
-0.6
-0.4
-0.2
0.0
0.2
0.4
0.6
-1.0 -1.0-0.8-0.6-0.4-0.20.00.20.4
-0.8-0.6-0.4-0.20.00.20.4
4549535761656973778185
4549535761656973778185
2000 2035 2040 2045 2050201520102005 2020 2025 2030
1 2 3 4 5 6 7 8 9 10 11
1 2 3 4 5 6 7 8 9 10 11
1 1995-20002 2000-053 2005-10
4 2010-155 2015-206 2020-25
10 2040-4511 2045-50
7 2025-308 2030-359 2035-40
55ECB
Occasional Paper No. 51August 2006
Chart I Alternative scenarios for projected dependency ratios in the euro area (Eurostat projections)(percentages)
Sources: ECB calculations based on Eurostat (New Cronos database, 2005 revision) data and projections.
Young age dependency ratio
Eurostat baselineEurostat highEurostat low
Eurostat no migrationEurostat high fertility
1950 1980 2010 2040
Old age dependency ratio
05
101520253035404550556065
05101520253035404550556065
0
5
10
15
20
25
30
35
40
45
0
5
10
15
20
25
30
35
40
45
1960 1970 20502020 20301990 2000 1950 1980 2010 20401960 1970 20502020 20301990 2000
Chart J Alternative scenarios for projected dependency ratios in the euro area (UN projections)
(percentages)
Sources: ECB calculations based on UN (UN’s World Population Database, 2004 revision) data and projections.
Young age dependency ratio
UN mediumUN high
UN lowUN const fertility
Old age dependency ratio
05
101520253035404550556065
05101520253035404550556065
0
5
10
15
20
25
30
35
40
45
0
5
10
15
20
25
30
35
40
45
1950 1980 2010 20401960 1970 20502020 20301990 2000 1950 1980 2010 20401960 1970 20502020 20301990 2000
ANNEX

56ECB Occasional Paper No. 51August 2006
Chart K Revisions of projections for the euro area (Eurostat projections)
(percentages)
Sources: ECB calculations based on Eurostat data and projections.Note: The 1999 and 2004 vintages of projections are from the New Cronos database while the 2006 vintage consists of the projections prepared by Eurostat for the Ageing Working Group of the EPC and released in February 2006 (available from the European Commission).
Young age dependency ratio
Eurostat 1999Eurostat 2004
Eurostat 2006
Old age dependency ratio
2000 2005 2010 2015 2020 2025 2030 2035 2040 2045 2050 2000 2005 2010 2015 2020 2025 2030 2035 2040 2045 205022
26
30
34
38
42
46
50
54
58
22
26
30
34
38
42
46
50
54
58
20
21
22
23
24
25
26
27
28
20
21
22
23
24
25
26
27
28
Chart L Revisions of projections for the euro area (UN projections)
(percentages)
Sources: ECB calculations based on UN (UN’s World Population Database, 2002 and 2004 revisions) data and projections.
Young age dependency ratio
UN 2004 UN 2002
Old age dependency ratio
2000 2005 2010 2015 2020 2025 2030 2035 2040 2045 2050 2000 2005 2010 2015 2020 2025 2030 2035 2040 2045 205022
26
30
34
38
42
46
50
54
58
22
26
30
34
38
42
46
50
54
58
20
21
22
23
24
25
26
27
28
20
21
22
23
24
25
26
27
28

57ECB
Occasional Paper No. 51August 2006
REFERENCES
Alesina, A., E. Glaeser and B. Sacerdote (2006), “Work and leisure in the U.S. and Europe: why so different?”, NBER Macroeconomics Annual 2005.
Ang, A. and A. Maddaloni (2005), “Do demographic changes affect risk premiums? Evidence from international data”, Journal of Business, Vol. 78, No 1.
Bakshi, G. S. and Z. Chen (1994), “Baby boom, population ageing and capital markets”, Journal of Business, 67.
Barro, R. and X. Sala-i-Martin (2003), Economic Growth, MIT Press, 2nd edition.
Börsch-Supan, A., A. Ludwig and J. Winter (2004), “Ageing, pension reform, and capital flows: a multi-country simulation model,” Working Paper 28-2003, Mannheim University.
Bean, C. (2004), “Global demographic change: Some implications for central banks” Speech at the Overview Panel, FRB Kansas City Annual Symposium, Jackson Hole, Wyoming, 28 August 2004.
Brooks, R. J. (2002), “Asset market effects of the baby boom and social security reforms”, American Economic Review, Papers and Proceedings 92.
Byrne and Davis (2003), Financial Structure, Cambridge, Cambridge University Press.
Capozza, D., P. Hendershott, C. Mack and C. Mayer (2002), “Determinants of real house price dynamics”, NBER Working Paper No 9262.
Catte, P., N. Girouard, R. Price and C. André (2004), “Housing markets, wealth and the business cycle”, OECD Economics Department Working Paper No 394.
Constantinides, G. M., J. B. Donaldson and R. Mehra (2002), “Junior can’t borrow: a new perspective on the equity premium puzzle”, Quarterly Journal of Economics, 117.
Dang, T., P. Antolin and H. Oxley (2001), “Fiscal implications of ageing: projections of age-related spending”, OECD Economics Department Working Paper No 305.
Davis, E. P. and C. Li (2003), “Demographics and f inancial asset prices in the major industrial economies”, Brunel University Department of Economics and Finance Discussion Paper No 03-07.
Della Vigna, S. and J. Pollet (2005), “Attention, demographics, and the stock market,” NBER Working Paper No 11211.
De Serres, A. and F. Pelgrin (2002), “The decline in private saving rates in the 1990s in OECD countries: how much can be explained by non-wealth determinants?”, OECD Economics Department Working Paper No 344.
Disney, R. (1996), Can we afford to grow older?, MIT Press.
REFERENCES

58ECB Occasional Paper No. 51August 2006
ECB (2003), “The need for comprehensive reforms to cope with population ageing”, Monthly Bulletin, April, pp. 39-52.
ECB (2005), box entitled “The Integrated Guidelines for Growth and Jobs 2005-2008”, Monthly Bulletin, August.
EPC and European Commission (2006), The impact of ageing on public expenditure: projections for the EU25 Member States on pensions, health care, long-term care, education and unemployment transfers (2004-2050). European Economy Special Report 1/2006.
European Commission (2001). Communication from the Commission to the Council, the European Parliament and the Economic and Social Committee: Supporting national strategies for safe and sustainable pensions through an integrated approach, mimeo.
European Commission (2003), “Communication on immigration, integration and employment”.
European Commission (2004a), “Effects of ageing on long run labour productivity growth: A theoretical and empirical assessment”.
European Commission (2004b), “Increasing the employment of older workers and delaying the exit from the labour market”.
G10 (2005), “Ageing and pension system reform: implications for f inancial markets and economic policies”, supplement to Financial Market Trends, OECD, November.
Geanakoplos, J., M. Magill and M. Quinzii (2004), “Demography and the long-run predictability of the stock market”, Brooking Papers on Economic Activity, No 1.
Gómez-Salvador, R., A. Musso, M. Stocker and J. Turunen, “Labour productivity developments in the euro area”, ECB Occasional Paper, forthcoming.
Green, R. and P. Hendershott (1995), “Age, housing demand, and real house prices”, Regional Science and Urban Economics, Vol. 26, No 5.
Guiso, L., P. Sapienza and L. Zingales (2005), “Trusting the stock market”, NBER Working Paper No 11648.
IMF (2004), “How will demographic change affect the global economy?”, World Economic Outlook, September.
Leiner-Killinger, N., C. Madaschi and M. Ward-Warmedinger, “Trends in working time patterns across euro area countries 1970-2004: causes and consequences”, ECB Occasional Paper, No 41.
Mankiw, N. G. and D. N. Weil (1989), “The baby boom, the baby bust, and the housing market”, Regional Science and Urban Economics, 19.
Mc Morrow, K. and W. Roeger (2002), EU pension reform – an overview of the debate and an empirical assessment of the main policy reform options, DG ECFIN Economic Papers No. 162, January.
59ECB
Occasional Paper No. 51August 2006
Modigliani, F. (1986), “Life-cycle, individual thrift, and the wealth of nations”, American Economic Review, Vol. 76, No 3.
Musso, A. and T. Westermann (2005), “Assessing potential output growth in the euro area – a growth accounting perspective”, ECB Occasional Paper No 22.
OECD (2003), “Institutional investors – Statistical yearbook, 1992-2001”.
Oliveira Martins, J., F. Gonand, P. Antolin, C. de la Maisonneuve and K.-Y. Yoo (2005), “The impact of ageing on demand, factor markets and growth”, OECD Economics Department Working Paper No 420.
Poterba, J. (2001), “Demographic structure and asset returns”, Review of Economics and Statistics, Vol. 83, Issue 4.
Poterba, J. (2004), “The impact of population ageing on f inancial markets”, NBER Working Paper No 10851.
Rother, P., M. Catenaro and G. Schwab (2003), “Ageing and pensions in the euro area, survey and projection results”, World Bank Social Protection Working Paper No 307.
Rother, P., M. Catenaro and G. Schwab (2004), “Ageing and pensions in the euro area”, FinanzArchiv, December.
Saarenheimo, T. (2005), “Ageing, interest rates and f inancial flows”, Bank of Finland Research Discussion Papers 2/2005.
REFERENCES

60ECB Occasional Paper No. 51August 2006
1 “The impact of the euro on money and bond markets” by J. Santillán, M. Bayle andC. Thygesen, July 2000.
2 “The effective exchange rates of the euro” by L. Buldorini, S. Makrydakis and C. Thimann, February 2002.
3 “Estimating the trend of M3 income velocity underlying the reference value for monetary growth” by C. Brand, D. Gerdesmeier and B. Roffia, May 2002.
4 “Labour force developments in the euro area since the 1980s” by V. Genre andR. Gómez-Salvador, July 2002.
5 “The evolution of clearing and central counterparty services for exchange-traded derivatives in the United States and Europe: a comparison” by D. Russo, T. L. Hart and A. Schönenberger, September 2002.
6 “Banking integration in the euro area” by I. Cabral, F. Dierick and J. Vesala, December 2002.
7 “Economic relations with regions neighbouring the euro area in the ‘Euro Time Zone’” by F. Mazzaferro, A. Mehl, M. Sturm, C. Thimann and A. Winkler, December 2002.
8 “An introduction to the ECB’s survey of professional forecasters” by J. A. Garcia, September 2003.
9 “Fiscal adjustment in 1991-2002: stylised facts and policy implications” by M. G. Briotti, February 2004.
10 “The acceding countries’ strategies towards ERM II and the adoption of the euro: an analytical review” by a staff team led by P. Backé and C. Thimann and including O. Arratibel, O. Calvo-Gonzalez, A. Mehl and C. Nerlich, February 2004.
11 “Official dollarisation/euroisation: motives, features and policy implications of current cases” by A. Winkler, F. Mazzaferro, C. Nerlich and C. Thimann, February 2004.
12 “Understanding the impact of the external dimension on the euro area: trade, capital flows and other international macroeconomic linkages“ by R. Anderton, F. di Mauro and F. Moneta, March 2004.
13 “Fair value accounting and f inancial stability” by a staff team led by A. Enria and including L. Cappiello, F. Dierick, S. Grittini, A. Maddaloni, P. Molitor, F. Pires and P. Poloni, April 2004.
14 “Measuring f inancial integration in the euro area” by L. Baele, A. Ferrando, P. Hördahl, E. Krylova, C. Monnet, April 2004.
EUROPEAN CENTRAL BANKOCCASIONAL PAPER SERIES

61ECB
Occasional Paper No. 51August 2006
15 “Quality adjustment of European price statistics and the role for hedonics” by H. Ahnert and G. Kenny, May 2004.
16 “Market dynamics associated with credit ratings: a literature review” by F. Gonzalez, F. Haas, R. Johannes, M. Persson, L. Toledo, R. Violi, M. Wieland and C. Zins, June 2004.
17 “Corporate ‘excesses’ and f inancial market dynamics” by A. Maddaloni and D. Pain, July 2004.
18 “The international role of the euro: evidence from bonds issued by non-euro area residents” by A. Geis, A. Mehl and S. Wredenborg, July 2004.
19 “Sectoral specialisation in the EU: a macroeconomic perspective” by MPC task force of the ESCB, July 2004.
20 “The supervision of mixed f inancial services groups in Europe” by F. Dierick, August 2004.
21 “Governance of securities clearing and settlement systems” by D. Russo, T. Hart, M. C. Malaguti and C. Papathanassiou, October 2004.
22 “Assessing potential output growth in the euro area: a growth accounting perspective” by A. Musso and T. Westermann, January 2005.
23 “The bank lending survey for the euro area” by J. Berg, A. van Rixtel, A. Ferrando, G. de Bondt and S. Scopel, February 2005.
24 “Wage diversity in the euro area: an overview of labour cost differentials across industries” by V. Genre, D. Momferatou and G. Mourre, February 2005.
25 “Government debt management in the euro area: recent theoretical developments and changes in practices” by G. Wolswijk and J. de Haan, March 2005.
26 “The analysis of banking sector health using macro-prudential indicators” by L. Mörttinen, P. Poloni, P. Sandars and J. Vesala, March 2005.
27 “The EU budget – how much scope for institutional reform?” by H. Enderlein, J. Lindner, O. Calvo-Gonzalez, R. Ritter, April 2005.
28 “Reforms in selected EU network industries” by R. Martin, M. Roma, I. Vansteenkiste, April 2005.
29 “Wealth and asset price effects on economic activity”, by F. Altissimo, E. Georgiou, T. Sastre, M. T. Valderrama, G. Sterne, M. Stocker, M. Weth, K. Whelan, A. Willman, June 2005.
30 “Competitiveness and the export performance of the euro area”, by a Task Force of the Monetary Policy Committee of the European System of Central Banks, June 2005.
31 “Regional monetary integration in the member states of the Gulf Cooperation Council (GCC)” by M. Sturm and N. Siegfried, June 2005.
EUROPEAN CENTRAL BANK
OCCAS IONAL PAPER SER IES

62ECB Occasional Paper No. 51August 2006
32 “Managing f inancial crises in emerging market economies: experience with the involvement of private sector creditors” by an International Relations Committee task force, July 2005.
33 “Integration of securities market infrastructures in the euro area” by H. Schmiedel, A. Schönenberger, July 2005.
34 “Hedge funds and their implications for f inancial stability” by T. Garbaravicius and F. Dierick, August 2005.
35 “The institutional framework for f inancial market policy in the USA seen from an EU perspective” by R. Petschnigg, September 2005.
36 “Economic and monetary integration of the new Member States: helping to chart the route” by J. Angeloni, M. Flad and F. P. Mongelli, September 2005.
37 “Financing conditions in the euro area” by L. Bê Duc, G. de Bondt, A. Calza, D. Marqués Ibáñez, A. van Rixtel and S. Scopel, September 2005.
38 “Economic reactions to public f inance consolidation: a survey of the literature” by M. G. Briotti, October 2005.
39 “Labour productivity in the Nordic EU countries: a comparative overview and explanatory factors – 1998-2004” by A. Annenkov and C. Madaschi, October 2005.
40 “What does European institutional integration tell us about trade integration?” by F. P. Mongelli, E. Dorrucci and I. Agur, December 2005.
41 “Trends and patterns in working time across euro area countries 1970-2004: causes and consequences” by N. Leiner-Killinger, C. Madaschi and M. Ward-Warmedinger, December 2005.
42 “The New Basel Capital Framework and its implementation in the European Union” by F. Dierick, F. Pires, M. Scheicher and K. G. Spitzer, December 2005.
43 “The accumulation of foreign reserves” by an International Relations Committee Task Force, February 2006.
44 “Competition, productivity and prices in the euro area services sector” by a Task Force of the Monetary Policy Committee of the European System of Central banks, April 2006.
45 “Output growth differentials across the euro area countries: Some stylised facts” by N. Benalal, J. L. Diaz del Hoyo, B. Pierluigi and N. Vidalis, May 2006.
46 “Inflation persistence and price-setting behaviour in the euro area – a summary of the IPN evidence”, by F. Altissimo, M. Ehrmann and F. Smets, June 2006.
47 “The reform and implementation of the stability and growth pact” by R. Morris, H. Ongena and L. Schuknecht, June 2006.

63ECB
Occasional Paper No. 51August 2006
48 “Macroeconomic and f inancial stability challenges for acceding and candidate countries” by the International Relations Committee Task Force on Enlargement, July 2006.
49 “Credit risk mitigation in central bank operations and its effects on f inancial markets: the case of the Eurosystem” by U. Bindseil and F. Papadia, August 2006.
50 “Implications for liquidity from innovation and transparency in the European corporate bond market” by M. Laganá, M. Peřina, I. von Köppen-Mertes and A. Persaud, August 2006.
51 “Macroeconomic implications of demographic developments in the euro area” by A. Maddaloni, A. Musso, P. Rother, M. Ward-Warmedinger and T. Westermann, August 2006.
EUROPEAN CENTRAL BANK
OCCAS IONAL PAPER SER IES


OCCAS IONAL PAPER SER IESNO. 51 / AUGUST 2006
MACROECONOMIC IMPLICATIONS OF DEMOGRAPHIC DEVELOPMENTS IN THE EURO AREA
by A. Maddaloni, A. Musso, P. Rother, M. Ward-Warmedinger and T. Westermann
ISSN 1607148-4
9 7 7 1 6 0 7 1 4 8 0 0 6