Embed Size (px)
Citation preview
MACROECONOMIC
DEVELOPMENTS
REPORT
JUNE
2015

MACROECONOMIC DEVELOPMENTS REPORT
June 2015
MACROECONOMIC DEVELOPMENTS REPORTJune 2015, No 21
© Latvijas Banka, 2015
The source is to be indicated when reproduced.
Latvijas BankaK. Valdemāra iela 2A, Riga, LV-1050, LatviaTel.: +371 67022300 Fax: +371 67022420http://[email protected]

2
MACROECONOMIC DEVELOPMENTS REPORTJune 2015
CONTENTS
ContentsAbbreviations 3Introduction 41. External Sector and Exports 61.1 External economic environment 61.2 Latvia's competitiveness and dynamics of goods exports 82. Monetary Policy and Financial Markets 122.1 ECB monetary policy decisions, liquidity and money market developments 122.2 Global financial markets and important decisions of other central banks 142.3 Securities market 172.4 Lending and deposit rates 192.5 Dynamics of domestic loans and deposits 213. Domestic Demand 273.1 Private consumption and investment 273.2 Government expenditure and budget 304. Aggregate Supply 334.1 Industry 334.2 Construction and real estate market 364.3 Services 384.4 Labour market 425. Costs and Prices 456. Balance of Payments 477. Conclusions and Forecasts 497.1 Economic developments 497.2 Inflation 51Statistics 52Additional Information 101

3
MACROECONOMIC DEVELOPMENTS REPORTJune 2015
Abbreviations
ABSPP – asset-backed securities purchase programmeAPP – asset purchase programmeCBPP3 – third covered bond purchase programme CIF – cost, insurance and freight at the importer's borderCIS – Commonwealth of Independent StatesCSB – Central Statistical Bureau of LatviaEC – European CommissionECB – European Central BankEONIA – euro overnight index averageESA 2010 – European System of Accounts 2010EU – European UnionEU15 – EU countries before 1 May 2004EU28 – EU countries as of 1 July 2013EURIBOR – Euro Interbank Offered RateEurostat – statistical office of the European UnionFOB – free on board at the exporter's borderFROOPP – frequent out of pocket purchasesFRS – Federal Reserve SystemGDP – gross domestic productHICP – Harmonised Index of Consumer PricesIMF – International Monetary FundJSC – joint stock companyLtd. – limited liability companyLTRO – longer-term refinancing operations MFI – monetary financial institutionOFI – other financial intermediary (other than an insurance corporation or a pension fund)OMXBBGI – OMX Baltic Benchmark Gross indexOMXR – NASDAQ OMX Riga indexPMI – Purchasing Managers IndexSEA – State Employment AgencySJSC – state joint stock companySRS – State Revenue ServiceTLTRO – targeted longer-term refinancing operations UK – United KingdomUN – United Nations OrganisationUS – United States of AmericaVAT – value added taxWTO – World Trade Organisation
ABBREVIATIONS

4
MACROECONOMIC DEVELOPMENTS REPORTJune 2015
INTRODUCTION
IntroductionOverall, the global economy is developing in line with the projections released at the beginning of 2015; consequently, the latest IMF forecast regarding the global economic outlook remained unchanged. However, the contribution of the groups of countries to the projected growth has changed: the outlook for advanced economies gradually improves, while slower growth is predicted for emerging market and developing economies and oil-exporting countries. The latest available data suggest that the euro area also saw accelerated economic growth in early 2015, allowing for a more optimistic outlook for the year overall.
In 2014, the economic growth in Latvia was limited both by the sluggish economic growth in the euro area and the significant deterioration of the economic situation in the nearby regions on account of a weaker demand in Russia and depreciation of the Russian ruble. Although the direct impact of applying the economic sanctions on the Latvian economy was not too pronounced, they had a substantial effect on the overall economic situation: the confidence of the economic agents regarding their future income declined. It should be noted, however, that according to WTO data, in 2014 the Latvian export market share in global imports remained the same as in the previous year.
In 2014, Latvia's economic growth moderated gradually, posting an annual GDP increase of a mere 2.1% in the fourth quarter (2.5% in 2014 overall) and that of 2.0% in the first quarter of 2015. The considerable contribution of exports to GDP growth in the last quarter of 2014 notwithstanding, private consumption was the main source of growth in 2014; in early 2015 the increase in private consumption outpaced that in exports again.
According to the ECB Governing Council's decision made in January, the Eurosystem launched the expanded asset purchase programme (APP) on 9 March 2015; it is expected to contribute positively (although mostly indirectly) to the Latvian economy. Latvijas Banka also took part in the expanded APP by purchasing securities issued by the Latvian government and European cross-national institutions in the amount of 354.8 million euro in March and April. The second and third TLTRO tenders were conducted in December and March. Latvian credit institutions attracted 60.5 billion euro and 75.0 billion euro at the second and third TLTRO respectively. As a result of the accommodative monetary policy implemented by the ECB, borrowing costs of non-financial corporations and households continued on a downward trend in the euro area (also in Latvia).
In Latvia, however, the positive effect of the accommodative monetary policy was partly offset by other factors. As regards lending to non-financial corporations, a significant role is played by the deterioration of the current status and outlook for selected sectors or non-financial corporations in the context of the Russian–Ukrainian conflict, as well as the sluggish economic growth of several major EU trade partners. In the second half of 2014 and at the beginning of 2015, however, lending to households was curbed by the uncertainty associated with the amendments to the Insolvency Law adopted by the Saeima (Parliament) of the Republic of Latvia in September 2014 providing for the introduction of the so-called clause of returned keys in mortgage lending. Amendments to the Insolvency Law adopted in February stipulating the above principle as an option for the borrower, as well as the involvement of the large credit institutions in the state support programme for house purchase gives cause to hope once again that mortgage lending will resume.
In line with the previous forecasts, the decline in unemployment rate is gradually moderating in this country as the cyclical unemployment component having ensured a considerable fall in unemployment in 2010–2013 has already been fully used. Although a sustained increase in remuneration persists, the annual increase in average wages and salaries is expected to moderate to 4%–5% in 2015, as slower GDP growth and, consequently, slower increase in labour productivity will reduce the fundamental basis for remuneration rises.

5
MACROECONOMIC DEVELOPMENTS REPORTJune 2015
INTRODUCTION
In January–April 2015, the annual inflation rate was lower than expected in December on account of a sharp decline in oil prices in the global market. Global food prices also continued on a downward trend. The liberalisation of the electricity market which was the main driver of annual inflation hikes, contributing 0.8 percentage point to annual HICP, could not offset the easing effect of the global factors on inflation.
The previous forecasts of Latvijas Banka were released on 13 January 2015 projecting 2.0% GDP growth for 2015. At this stage the forecast for GDP growth for 2015 remains unchanged at 2.0% since macroeconomic data for the first quarter of 2015 and preliminary data for the second quarter are close to the estimates, thus there is no need to change the forecast. Risks related to the country's economic development are currently balanced.
The current inflation (HICP) estimate for 2015 is revised downwards from 0.9% to 0.7%. Due to energy and food prices, the actual data for the beginning of the year were considerably lower than expected, requiring revision of the overall annual HICP forecast.

6
MACROECONOMIC DEVELOPMENTS REPORTJune 2015
Table 1GDP GROWTH PROJECTIONS FOR LATVIA'S MAJOR TRADE PARTNERS IN 2014 AND 2015(%)
20151 20152 20161 20162
Euro area 1.2 1.5 1.4 1.6Germany 1.3 1.6 1.5 1.7UK 2.7 2.7 2.4 2.3Russia –3.0 –3.8 –1.0 –1.1Denmark 1.8 1.6 1.9 2.0Sweden 2.7 2.7 2.7 2.8Estonia 2.5 2.5 3.5 3.4Lithuania 3.3 2.8 3.7 3.2Poland 3.3 3.5 3.5 3.5
Sources: October 2014 (Denmark, Sweden, Estonia, Lithuania and Poland), January 2015 (euro area, Germany, the UK and Russia) (1) and April 2015 (2) World Economic Outlook (IMF).
1. EXTERNAL SECTOR AND EXPORTS
1. External Sector and Exports1.1 External economic environment
Economic growth remains uneven across different regions of the world. The IMF did not change its forecast in April relative to January 2015, and according to its latest projections global GDP is expected to pick up 3.5% in 2015 overall. Year-on-year, the outlook for advanced countries has gradually improved, while slower growth is predicted for emerging market and developing economies primarily due to weaker prospects for China, Brazil, Russia and some oil-exporting countries.
In April 2015, the IMF revised the GDP forecast for the euro area, Germany and Poland upwards but lowered it for Russia, Denmark and Lithuania (see Table 1). GDP forecast for the UK, Sweden and Estonia remained unchanged.
The US data suggest that economic growth is recovering; the IMF projects the US GDP growth over 3% in 2015 and 2016. Together with diminishing fiscal consolidation even in the face of anticipated gradual interest rate hikes and contracting exports due to stronger US dollar, lower oil prices are likely to give a boost to domestic demand. Meanwhile in Japan, following a decline in 2014, the IMF expects GDP to grow by 1% in 2015 primarily owing to lower oil prices and a weaker Japanese yen. Although vis-à-vis Europe China's GDP growth momentum is currently very high, the IMF projects some slowdown in GDP pace caused by contracting investment in China (in real estate in particular).
The beginning of 2015 saw the euro area economic growth accelerate. In the first quarter of 2015, euro area's GDP expanded by 0.4% quarter-on-quarter (see Chart 1.1). Leading indicators, such as the PMI, amounted to an almost four-year high in March; the economic sentiment indicator (ESI) also improved in the same month. Businesses and consumers anticipate improvements in the economic situation, likely to result from an export-boosting fall of the euro rate. Resulting from the ECB accommodative monetary policy, lower interest rates are to the benefit of borrowers as well.
In the first quarter of 2015, GDP in Germany grew by 0.3% quarter-on-quarter. Despite a somewhat weaker pace in manufacturing and contracting exports in January, the PMI improved in March (see Chart 1.2),
Chart 1.1GDP ANNUAL AND QUARTERLY GROWTH RATE IN LATVIA'S MAJOR TRADE PARTNERS COUNTRIES(Q1 2015; %)

7
MACROECONOMIC DEVELOPMENTS REPORTJune 2015
and consumer confidence indicator stood extremely high in April.
In Estonia, GDP posted a 0.3% quarter-on-quarter fall in the first quarter of 2015. It was on account of some problems in Finland, one of Estonia's major trade partners where elections took place and political situation adversely affected people's expectations, as well as an ongoing contraction of turnover in Estonia's transport sector. It should not be neglected, however, that as a rule Estonia's GDP shrinks in the first quarter of the year, while in the upcoming quarters the fall is revised downwards or even an increase is projected.
Lithuania recorded a 0.6% decline in its GDP in the first quarter of 2015. Being affected by Russia's economic situation, Lithuania's external sector performed worse than before, and this, coupled with consumers' precautionary stances in the first months after the euro changeover, had an adverse impact on the Lithuanian economy. Nevertheless, low energy prices and improving economic outlook in the euro area may offset the effects from weak investment and subdued demand from Russia.
Quarter-on-quarter, Poland's GDP posted a 0.7% pickup in the fourth quarter of 2014. Most recent economic indicators suggest that two initial months of 2015 also excelled in strong growth. Manufacturing got a solid impetus in February, and the PMI still hovers high.
GDP recorded some quarter-on-quarter growth (0.3%) in the UK in the first quarter of 2015. Retail trade expanded significantly in January making consumer sentiments more optimistic in February.
Sweden reported a quarter-on-quarter GDP pickup of 1.1% in the fourth quarter of 2014. Primarily due to recovering private consumption, this dynamics is likely to be in place also in the first quarter of 2015. Export performance, at the same time, will presumably depend on foreign demand and investment growth in export-oriented non-financial corporations.
Denmark's GDP performed by 0.4% better quarter-on-quarter in the fourth quarter of 2014. In March, consumer confidence rose to a nine-year high and unemployment gradually subsided, suggesting an eventual strengthening of private demand, which was also boosted by interest rates and oil prices both being low. In the meantime, business confidence is sluggish, whereas export growth strongly depends on foreign demand from such major trade partners as Germany, Sweden and the UK.
1. EXTERNAL SECTOR AND EXPORTS
Chart 1.2PURCHASING MANAGERS INDEX IN LATVIA'S MAJOR TRADE PARTNERS (total seasonally adjusted indicator)
8
MACROECONOMIC DEVELOPMENTS REPORTJune 2015
In the first quarter of 2015, Russia experienced some shrinking in its GDP on account of geopolitical problems, international sanctions, falling Russian ruble and lower oil prices. In February, the pace of growth in manufacturing dropped to a two-year low, exports were subject to the eighth contraction over the last nine months, and consumer confidence had declined to the lowest level since the first quarter of 2009.
1.2 Latvia's competitiveness and dynamics of goods exports
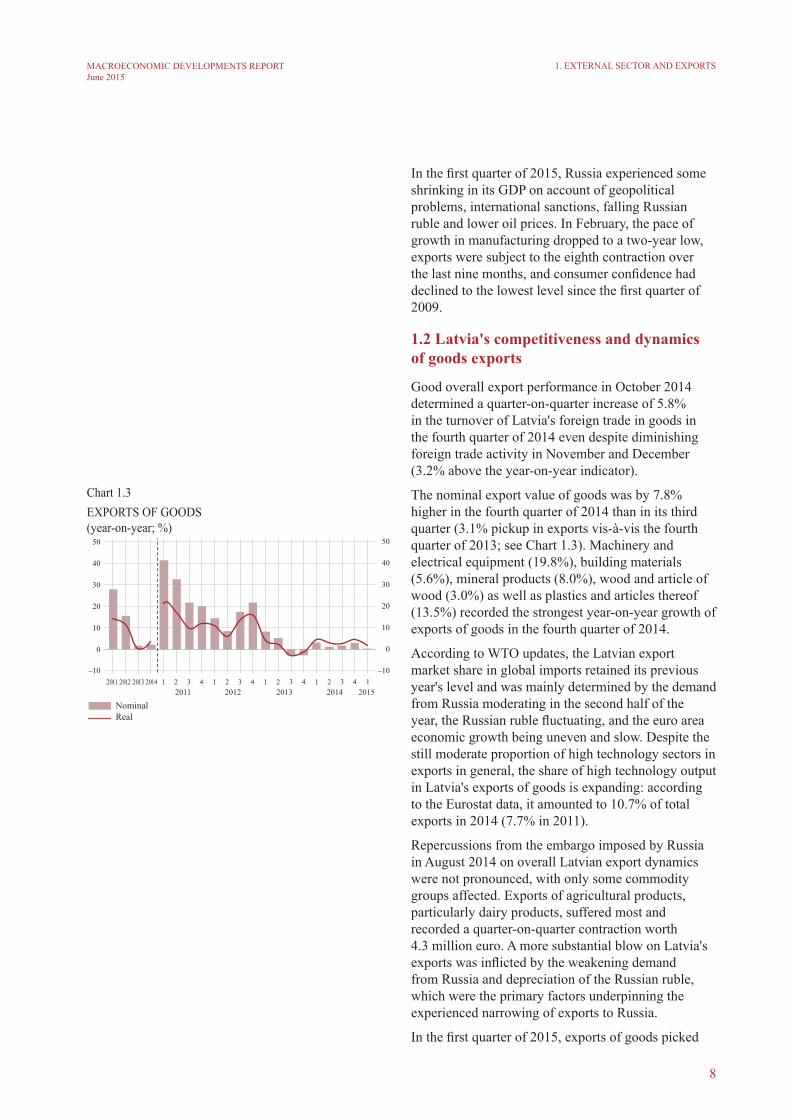
Good overall export performance in October 2014 determined a quarter-on-quarter increase of 5.8% in the turnover of Latvia's foreign trade in goods in the fourth quarter of 2014 even despite diminishing foreign trade activity in November and December (3.2% above the year-on-year indicator).
The nominal export value of goods was by 7.8% higher in the fourth quarter of 2014 than in its third quarter (3.1% pickup in exports vis-à-vis the fourth quarter of 2013; see Chart 1.3). Machinery and electrical equipment (19.8%), building materials (5.6%), mineral products (8.0%), wood and article of wood (3.0%) as well as plastics and articles thereof (13.5%) recorded the strongest year-on-year growth of exports of goods in the fourth quarter of 2014.
According to WTO updates, the Latvian export market share in global imports retained its previous year's level and was mainly determined by the demand from Russia moderating in the second half of the year, the Russian ruble fluctuating, and the euro area economic growth being uneven and slow. Despite the still moderate proportion of high technology sectors in exports in general, the share of high technology output in Latvia's exports of goods is expanding: according to the Eurostat data, it amounted to 10.7% of total exports in 2014 (7.7% in 2011).
Repercussions from the embargo imposed by Russia in August 2014 on overall Latvian export dynamics were not pronounced, with only some commodity groups affected. Exports of agricultural products, particularly dairy products, suffered most and recorded a quarter-on-quarter contraction worth 4.3 million euro. A more substantial blow on Latvia's exports was inflicted by the weakening demand from Russia and depreciation of the Russian ruble, which were the primary factors underpinning the experienced narrowing of exports to Russia.
In the first quarter of 2015, exports of goods picked
1. EXTERNAL SECTOR AND EXPORTS
Chart 1.3EXPORTS OF GOODS(year-on-year; %)

9
MACROECONOMIC DEVELOPMENTS REPORTJune 2015
1. EXTERNAL SECTOR AND EXPORTS
up 0.4% year-on-year, while imports of goods shrank by 4.1%. The rise in exports of goods supported improvements in Latvia's balance of foreign trade in goods at the beginning of 2015. Moderation in Latvia's foreign trade activity was driven by both seasonal effects and sustained weak foreign demand.
According to the CSB's data, most decisive contributors to the annual export growth in the first quarter of 2015 were such sectors as machinery and mechanical appliances, electrical equipment (an increase of 22.4%), manufacture of articles of stone, plaster, cement, glassware and ceramic products (16.6%), mineral products (5.3%) as well as the chemical and allied industries (5.4%). As a rule, January stands out as a month with a more sluggish foreign trade activity relative to the other months of the year, and January of 2015 was no exception at all. In two initial months of 2015, the largest year-on-year export decline was posted by food products, with the decrease in exports to Russia, primarily of strong alcoholic drinks, exerting crucial impact. In February, some contraction in exports of base metals and articles of base metals was mostly driven by falling exports of metal waste and scrap, likely to be associated with the JSC KVV Liepājas metalurgs launching operation and purchasing the needed raw materials from the local metal scrap suppliers that previously exported metal scrap. Vis-à-vis February, growth buoyancy was observed in March in almost all groups of export goods, except electrical machinery and equipment. In March, the strongest export growth was recorded for wood and articles of wood, articles of apparel knitted or crocheted, products of the chemical industry and of base metals (exports to Denmark, Lithuania, Estonia, Sweden, etc.), machinery, articles of plastics, and transport vehicles.
As to destinations in the first quarter of 2015, exports grew most to Lithuania (29.2 million euro), Denmark (19.9 million euro), the UK (15.5 million euro), Turkey (14.9 million euro), and also Saudi Arabia, the US, the Netherlands, Sweden, the Czech Republic, Rumania, China, Cyprus and Singapore. Exports of goods to Russia dwindled by 65.3 million euro year-on-year in the first quarter of 2015.
Imports of goods were stagnating in 2014, and their volume remained almost unchanged for the second consecutive year; in the fourth quarter, however, it picked up 4.3% year-on-year (see Chart 1.4) and 3.2% quarter-on-quarter.
In early 2015, the narrowing in imports of goods was primarily underpinned by seasonal factors. A
Chart 1.4IMPORTS OF GOODS (year-on-year; %)

10
MACROECONOMIC DEVELOPMENTS REPORTJune 2015
fall was recorded in imports of agricultural and food products, building materials, and other groups. The import value of mineral products, including electrical energy, decreased because oil and related energy resources prices were sliding down, the winter was relatively warm, and heat consumption moderated. In January 2015 relative to December 2014, imports of some consumer goods, e.g. wearing apparel, footwear and textile articles, increased basically on account of seasonal price discounts and atypically warm winter with smaller heating bills. In February, imports of goods recorded some narrowing in almost all bigger groups, except the group of products of base metals, which expanded notably. Also, imports of iron and non-alloy steel grew in this month due to the purchases of raw materials from Belarus and Russia to cater for production needs of the JSC KVV Liepājas metalurgs. Despite a month-on-month increase of 14.2% in imports of goods in March, the respective year-on-year import value contracted by 3.7%.
Even though neither the economic sanctions of Russia nor its moderating economic activity has reduced the real volumes of Latvia's manufacturing output or exports so far, both manufacturing and exports are sending signals of some stagnation. The data compiled by the EC also suggest some pessimism among industries, as the estimates of orders placed and export orders have deteriorated overall, implying that the demand is rather sluggish and competition is tightening.
In 2014, the growth in Latvia's exports was achieved by augmenting the export volume and expanding export markets within the EU countries and less explored markets outside the EU. Further stabilisation of the economic situation in the euro area and the Nordic countries (important markets for Latvian exporters) as well as the resumed operation of the JSC KVV Liepājas metalurgs would at least in part offset the eventual effects from the external risks associated with the falling Russian demand. Producers of the Latvian exporting sectors will have to boost their competitiveness by creating products with higher value added and to search for new niche output and new markets.
Although exports are not expected to rise sharply in 2015, attempts of Latvian exporters to diversify output (export supply) and expand market shares would help maintain the positions and stave export volume shrinkages off. Geopolitical crisis in the eastern neighbouring countries coupled with contracting demand in a number of CIS economies are likely to trigger some adjustments to exports in terms
1. EXTERNAL SECTOR AND EXPORTS

11
MACROECONOMIC DEVELOPMENTS REPORTJune 2015
of variety of exported goods and the composition of trade partners, thus minimising business risks. Meanwhile, the depreciating euro would enable euro area exporters, Latvia including, to boost their competitiveness in the global market, thus making export growth sustainable. A stronger external demand may figure as a factor facilitating the investment activity in production, which is so vital for boosting the export potential. Stability of international rating and even its upgrades can act as drivers of investment as well (on 13 February 2015, the international credit rating agency Moody's Investors Service upgraded Latvia's credit rating to A3 from Baa1, with a stable future outlook on the rating, whereas in May the international credit rating agencies Standard & Poor's and Fitch Ratings kept Latvia's credit rating for long-term liabilities in euro and foreign currencies unchanged at A– level, with a stable future outlook).
1. EXTERNAL SECTOR AND EXPORTS

12
MACROECONOMIC DEVELOPMENTS REPORTJune 2015
2. MONETARY POLICY AND FINANCIAL MARKETS
2. Monetary Policy and Financial Markets2.1 ECB monetary policy decisions, liquidity and money market developments
The Governing Council of the ECB at its meetings on monetary issues held in January, March and April 2015 decided to keep the key ECB interest rates unchanged. The interest rate on the main refinancing operations was still 0.05%, on the marginal lending facility – 0.30% and on the deposit facility – –0.20%.
At its meeting on monetary policy issues in January 2015, the Governing Council of the ECB took a decision to launch an expanded asset purchase programme (APP), thus meeting the expectations of market participants. The objective of the expanded APP is to fulfil the ECB task of maintaining price stability and eliminating the risks associated with a too prolonged period of low inflation. The expanded APP eases monetary and financial conditions for credit institutions, thus creating preconditions for non-financial corporations and households in accessing cheaper funding. This in turn promotes investment and consumption, thus contributing to a return of inflation rates towards 2%.
The expanded APP was launched on 9 March 2015, and the Eurosystem will purchase debt securities of the euro area totalling 60 billion euro under this programme on a monthly basis. The expanded APP encompasses the existing ABSPP and CBPP3, and it has been supplemented with the third element, the public sector purchase programme (PSPP), i.e. the purchase of bonds issued by the euro area central governments, agencies and European institutions (e.g. the European Stabilisation Mechanism or the European Investment Bank) has commenced in the secondary market. The expanded APP is intended to last until at least September 2016 or until the Governing Council of the ECB sees a sustained adjustment in the path of inflation which is consistent with its aim of achieving inflation rates below, but close to, 2% over the medium term.
During the first two months of the implementation of the expanded APP, the objectives of monthly purchases were reached, i.e. securities totalling 121 billion euro were bought, including government bonds of the euro area countries amounting to 83.7 billion euro, securities of agencies and European institutions for a total of 11.4 billion euro, but the remaining part consisted of the purchase of covered

13
MACROECONOMIC DEVELOPMENTS REPORTJune 2015
bonds and asset-backed securities. Latvijas Banka also participated in the expanded APP and bought securities issued by the Latvian government and agencies and European institutions for a total amount of 354.8 billion euro.
The second and third TLTRO tenders were conducted in December and March when the Eurosystem allotted 129.8 billion euro and 97.8 billion euro respectively. Latvian credit institutions attracted 60.5 billion euro at the second TLTRO and 75.0 billion euro – at the third one. Within the framework of the first three TLTROs, the Eurosystem granted 310.1 billion euro to credit institutions of the euro area, including 160.5 million euro – to Latvian credit institutions. The next TLTRO will take place in June when the amount of the available resources (as in the third tender) will depend on the lending performance of a credit institution over the past 12 months.
At the end of January, credit institutions of the euro area repaid the financial resources borrowed under LTROs with a maturity of 3 years conducted by the Eurosystem in December 2011, but at the end of February they repaid the funding borrowed under LTROs with a maturity of 3 years in March 2012.Repayment of LTROs with a maturity of 3 years increased the amount of the loans requested and their volatility in the Eurosystem's regular operations. For instance, the amount requested at the tenders of the main refinancing operations augmented to 164 billion euro prior to the repayment of LTROs with a maturity of 3 years at the end of January. The average amount requested between 1 December and 30 April was 130 billion euro. Demand for LTROs with a maturity of 3 months also grew.
When the expanded APP was launched, excess liquidity in the euro area recorded an increase compared to the previous reporting period. The average amount of excess liquidity boosted from the average amount of 108 billion euro in the previous reporting period to 186 billion euro in the current reporting period. Excess liquidity increased considerably in March and stabilised at the level of approximately 250 billion euro when the ECB launched the expanded APP and credit institutions were granted funding under the third TLTRO.
As a result of the ECB accommodative monetary policy and with excess liquidity recording a comfortable level, money market interest rates continued to fall, reaching new historical lows. The average value of the euro overnight index average EONIA decreased to –0.075% in April. Moreover, it
2. MONETARY POLICY AND FINANCIAL MARKETS

14
MACROECONOMIC DEVELOPMENTS REPORTJune 2015
remained negative throughout the reporting period. The 3-month EURIBOR also continued a downward trend, i.e. the average value of the index fell from 0.160% in the previous reporting period to 0.045% in the current reporting period, declining to a negative level (–0.001%; see Chart 2.1) in April.
2.2 Global financial markets and important decisions of other central banks
At the close of 2014 and in early 2015, the financial markets focused on the ECB meeting held on 22 January at which, reflecting market participants' expectations, the ECB announced a further monetary policy accommodation. This decision of the ECB had an upward effect on the financial market sentiment, triggering a securities price hike. Concerns about deceleration in global economy's growth momentum, combined with repercussions from geopolitical conflicts, on the other hand, exerted a downward pressure.
Similar to the ECB, other leading central banks also continued to pursue accommodative monetary policy in December 2014 and in the initial months of 2015, maintaining their refinancing rates close to zero (see Chart 2.2). The FRS and the Bank of England kept their monetary stimuli unchanged, whereas the Bank of Japan launched new measures in support of economic recovery by expanding the lending scheme along with the Quantitative and Qualitative Easing programme (QQE2). The FRS was sending signals about raising the refinancing rate in the second half of 2015, at the same time maintaining a wary tone on account of weak growth of the global economy, appreciating US dollar and low inflation expectations.
Meanwhile, other European central banks entered the year of 2015 with lowering the main refinancing rates and launching additional stimulus measures. On 15 January, the Swiss National Bank took financial markets by surprise, discontinuing the minimum exchange rate (1.20 Swiss francs per euro), which, to protect the national economy, had been introduced at the end of 2011 during a period of exceptional overvaluation of the Swiss franc and high level of uncertainty. The Swiss National Bank, in turn, lowered the interest rate on sight deposit account balances to –0.75%. After this step, the Swiss franc appreciated against the euro by 39%, to stabilise afterwards at between 1.02–1.07 Swiss francs per euro. At the beginning of 2015, Danmarks Nationalbank cut its deposit interest rate on four occasions over three weeks, lowering it into
Chart 2.1MONEY MARKET INTEREST RATES AND EXCESS LIQUIDITY IN THE EURO AREA(%)
Chart 2.2BASE RATES (%)
2. MONETARY POLICY AND FINANCIAL MARKETS

15
MACROECONOMIC DEVELOPMENTS REPORTJune 2015
a negative territory of –0.75%; the main refinancing rate was reduced to 0.05%, and massive interventions were conducted to defend the peg of the Danish krone to the euro. On 12 February, Sveriges Riksbank positioned itself as the first central bank to set a negative repo interest rate, reducing it even further in March (to –0.25%). In addition, Sveriges Riksbank made its monetary policy more expansionary by committing itself to buying government bonds worth 30 billion Swedish krona.
On account of particularly accommodative policies of regional central banks the yields on government bonds went down to historical lows. The number of countries with negative yields on debt securities issued with a maturity of up to (and even over) 5 years increased in April. Yields were negative on 5-year government bonds in Switzerland, Germany, France, the Netherlands, Belgium, Finland, Denmark and Sweden (see Chart 2.3).
In the initial phase of 2015, financial market sentiments were positive in the euro area. The ECB's announcement to launch an expanded APP assured market participants that the ECB would do whatever it takes to promote the euro area recovery by supporting positive sentiments in financial markets and pushing up securities prices. Yields on government bonds continued on a downward trend to historical lows in both core and peripheral euro area countries, except Greece (see Chart 2.4). The assumptions by some market analysts about the Eurosystem-projected demand for government securities as a substantial reducing factor of their availability acted as an additional trigger of lower yields even prior to the launching of the expanded APP.
Whereas the low European yields on debt securities had a downward pressure on debt securities yields in the US, the spread between the respective US and European yields continued to widen, thus capturing the anticipated divergence of central bank monetary policy in the US and Europe. From early December 2014 to end-April 2015, the yield on 10-year German government bonds lost 36 basis points, decreasing to 0.36%; yields on 10-year US government bonds, in turn, fell by 20 basis points (to 2.03%). As a result, the spread between the yields on 10-year US and German government bonds from 151 basis points soared to 167 basis points (see Chart 2.5).
Following the victory of the left-wing Syriza party in the Greek early general election, the focus of international investors was on Greece. With its anti-austerity pledges and determination to re-
Chart 2.35-YEAR GOVERNMENT BOND YIELDS OF EUROPEAN COUNTRIES (%)
Chart 2.410-YEAR GOVERNMENT BOND YIELDS OF EURO AREA PERIPHERAL COUNTRIES (%)
Chart 2.5YIELDS ON GERMAN AND US 10-YEAR GOVERNMENT BONDS AND THEIR SPREADS(basis points)
2. MONETARY POLICY AND FINANCIAL MARKETS

16
MACROECONOMIC DEVELOPMENTS REPORTJune 2015
negotiate Greece's international bailout agreement, the newly elected government ignited concerns about Greece being able to service its debt and access financial support through an economic adjustment programme. These concerns materialised when the new government failed to reach an agreement with international lenders on a new tranche of bailout aid by mid-April. International credit rating agencies downgraded Greece's credit rating several times. For instance, Standard & Poor's lowered its credit rating from B to B– in February and to CCC+ in April, emphasising that the sovereign debt and other financial obligations were not sustainable. As a result, according to credit rating agency Standard & Poor's, Greece is seven notches below the investment grade. With Greece's creditworthiness deteriorating, investors' reaction was prompt: customer funds and deposits with Greek credit institutions contracted, company share prices were exposed to pressure, and risk premiums of government debt securities rose notably. For instance, the yield on 3-year Greek government bonds rose to 28.7% in April, outpacing the yield on 10-year government bonds (13.1%). However, the effects from Greek financial market tension on overall euro area financial market sentiments were insignificant, holding back a decline in interest rates on government debt securities of the euro area peripheral countries.
In the aftermath of dramatic events in the Russian financial market in December 2014 when, due to falling oil prices and effects from the sanctions, the Russian ruble depreciated markedly and the Central Bank of the Russian Federation raised the main refinancing rate to 17%, the Russian ruble partly recovered in the first four months of 2015, appreciating by around 23% against the euro (following a 38% drop against it in 2014). This strengthening of the Russian ruble was facilitated by a weaker demand for foreign currencies (as the needs for funding to repay foreign debt decreased) and oil prices that hiked in early 2015 (following a sharp fall in 2014). In the initial months of 2015, the Central Bank of the Russian Federation, based on the shifts in the balance between the consumer price rise and economic activity deceleration risks, lowered the base rate on two occasions, to stand at 14%. In April, the Central Bank of the Russian Federation implied that on account of the Russian ruble's appreciation more interest rate cuts might follow. At the end of April, the exchange rate of the Russian ruble against the euro was 57.9 (11% increase over the reference period).
The exchange rate of the euro against other currencies
2. MONETARY POLICY AND FINANCIAL MARKETS

17
MACROECONOMIC DEVELOPMENTS REPORTJune 2015
primarily depended on the policy of central banks. From 1.25 US dollars per euro on 1 December it went down to 1.12 US dollars per euro on 30 April, mainly under the impact of monetary easing launched by the ECB, which, in turn, reinforced expectations about the anticipated divergence of the FRS and the ECB monetary policy. The euro depreciated also against other currencies, e.g. by 13.0% against the Swiss franc, 7.8% against the British pound sterling, and 9.2% against the Japanese yen (see Chart 2.6).
2. MONETARY POLICY AND FINANCIAL MARKETS
Chart 2.6EXCHANGE RATE OF US DOLLAR, SWISS FRANC, BRITISH POUND STERLING AND RUSSIAN RUBLE AGAINST EURO (index: 1 January 2015 = 100)
Chart 2.7AUCTIONS OF GOVERNMENT SECURITIES(millions of euro)
2.3 Securities market
The most notable event on the euro area securities market was the ECB Decision of 22 January of 2015 on the expanded APP. In Latvia, Latvian government securities issued in the domestic and external markets are eligible according to the expanded APP requirements. However, considering other expanded APP criteria, e.g. securities' residual maturity should be from 2 to 30 years, securities should be denominated in euro and no purchases larger than 25% of each issue should be made, the amount of Latvian government securities to be purchased under the expanded APP exceeds 0.7 billion euro. With foreign credit institutions being the major holders of Latvian government securities, the direct effect of Eurosystem's purchases of these securities on Latvian credit institutions will not be as pronounced; however, the economic recovery in the euro area will have an essential indirect and positive effect on the Latvian economy. Moreover, having attracted financial recourses, the sellers of securities are interested in looking for new possibilities to invest in other financial assets, lowering both the interest rates on other private sector securities and money market interest rates.
At primary auctions, supply of Latvian government securities was as follows: 20 million euro in December, 50 million euro in January, 30 million euro both in February and March, 50 million euro in April (see Chart 2.7). With credit institutions' demand exceeding supply 5.9 times at the auctions, the entire amount supplied was sold. During this period, the Treasury supplied 3-year and 5-year government bonds as well as Treasury bills with their residual maturity slightly exceeding 6 months. The average yield on 3-year government bonds at primary auctions

18
MACROECONOMIC DEVELOPMENTS REPORTJune 2015
declined from 0.28% in January to 0.18% in April. At the December auction, the average yield on 5-year government bonds was 1.10%, 18 basis points lower than that at the November auction. The average yield on Treasury bills with a maturity of over 6 months was 0.04% in January, turning negative for the first time in April (–0.01%).
In January 2015, the government repaid its external debt in the amount of 1.2 billion euro, thus reducing the government euro deposits with Latvijas Banka and credit institutions. Therefore, a new issue of government bonds in external markets is expected in 2015. The strong domestic demand and the low interest rates also contribute to expanding the amount of issued securities.
In the secondary market, the bid yield on Latvian government eurobonds issued in external market in 2014 and maturing in 2024 decreased from 1.67% at the end of November to 0.47% at the end of April. The spread between the above and that on German government bonds of the respective maturity contracted from 114 basis points to 20 basis points. The bid yield on Latvian government bonds denominated in US dollars and maturing in 2021 declined from 3.08% at the end of November to 2.54% at the end of April (see Chart 2.8); the spread between the above and that on US government bonds of the respective maturity shrank from 128 basis points to 87 basis points. The bid yields on bonds were also indirectly reduced as a result of a fall in oil prices, contributing to a lower inflation and thus also to a further implementation of the accommodative monetary policy, including several asset purchase programmes, by the central banks for longer than initially planned.
The world's leading stock price indices grew notably (see Chart 2.9). From November 2014 to the end of April 2015, the stock market indices in Germany and France increased almost by 15%, the US stock market index S & P rose by 0.9%, while Japan's stock market index Nikkei 225 gained 11.8%. NASDAQ OMX Riga index OMXR increased by 4.1%, whereas the Baltic gross index OMXBBGI grew by 9.4%. Stock prices in the euro area were also affected by the expanded APP due to investors looking for alternative investment options. The risk-free interest rate and the risk premium on shares were also reduced under the expanded APP, thus making shares more attractive to investors. The terms and conditions for loans to non-financial corporations will be eased and/or the interest rate of such loans will be lowered, thus facilitating the development of non-financial corporations.
2. MONETARY POLICY AND FINANCIAL MARKETS
Chart 2.8LATVIAN GOVERNMENT BOND BID YIELDS(%)
Chart 2.9STOCK PRICE INDICES(1 January 2015 = 100)

19
MACROECONOMIC DEVELOPMENTS REPORTJune 2015
2.4 Lending and deposit rates
As a result of the accommodative monetary policy implemented by the ECB, borrowing costs of non-financial corporations and households recorded a further decrease within the euro area (also in Latvia). Between October 2014 and April 2015, interest rates both on MFI loans granted to non-financial corporations and to households fell as the euro money market indices declined and credit institutions granted lower risk loans. Mutual competition of credit institutions increased. The spread between interest rates on loans and deposits remained quite steady (see Chart 2.10), ensuring profits to credit institutions from interest income and expenditure.
Interest rates on loans to non-financial corporations and households tended to go down in the euro area (see Chart 2.11). ECB monetary policy facilitated the development trends (a decline in interest rates on debt securities issued by credit institutions, a fall in interest rates on deposits received from the private sector) in the financial markets of the euro area which led to a decrease in funding costs of credit institutions. TLTRO, the ECB monetary policy instrument designed to enhance lending, also substantially reduced long-term funding costs incurred by credit institutions and promoted the granting of new loans. Lower costs of raising funds made it possible for credit institutions of the euro area to reduce lending rates on loans to non-financial corporations and households without losing profitability. Meanwhile, the willingness of credit institutions of the euro area to grant new loans promoted their mutual competition, which usually has a downward effect on margins (the spread between the lending rate and the relevant market reference rate) on loans granted by credit institutions. The difference between interest rates on loans and deposits across the euro area countries gradually decreased as lending and deposit rates declined particularly sharply in the countries where they used to be comparatively higher.
Lending costs of households and non-financial corporations in Latvia, like elsewhere in the euro area, followed a gradually declining trend (see Chart 2.12). The interest rate on new euro loans to non-financial corporations shrank from 3.8% in October 2014 to 2.7% in April 2015. Meanwhile, the interest rate on new euro loans to households went down from 7.1% to 6.7% respectively.
Since October 2014, Latvian credit institutions saw a relatively sustainable downslide in interest rates on small loans to non-financial corporations (up to 250
2. MONETARY POLICY AND FINANCIAL MARKETS
Chart 2.10SPREAD BETWEEN INTEREST RATES ON NEW LOANS AND NEW DEPOSITS(percentage points)
Chart 2.11INTEREST RATES ON MFI NEW LOANS IN EURO TO NON-FINANCIAL CORPORATIONS(%)
Chart 2.12INTEREST RATES ON MFI NEW SHORT-TERM LOANS IN EURO*(%)
* Floating interest rates and interest rates with an initial interest rate fixation period of up to 1 year.

20
MACROECONOMIC DEVELOPMENTS REPORTJune 2015
thousand euro), while interest rates on medium and large loans were rather volatile, since loans of various types and with different risk levels were granted in varying proportions every month. Between October 2014 and April 2015, the interest rate on new small euro loans to non-financial corporations (up to 250 thousand euro) decreased from 5.1% to 3.9%, on medium loans (250 thousand euro–1 million euro) – from 4.6% to 3.7%, while that on large loans – from 3.4% to 2.5%. The fall in interest rates on euro loans to non-financial corporations was driven by declining interest rates in the euro money market and changes in the structure of loans granted by credit institutions, i.e. relatively more lower risk loans were granted to non-financial corporations. In the fourth quarter of 2014 and the first quarter of 2015, Latvian credit institutions did not change the spread over the market reference rate on medium-risk loans to non-financial corporations, while in certain cases it was increased on risky loans. The downward pressure exerted by credit institutions' mutual competition on margins on loans to non-financial corporations augmented also in Latvia, as in other euro area countries. However, the positive impact of competition was reduced by the deterioration of the current situation and future prospects of individual sectors or non-financial corporations in relation to the Russian–Ukrainian conflict.
The weighted average interest rate on new euro loans to households for house purchase followed a slow downward trend on account of the falling euro money market interest rates. From October 2014 to April 2015, the weighted average interest rate on new loans to households for house purchase edged down from 3.3% to 3.1%. The credit institution lending survey conducted by Latvijas Banka contains the acknowledgement of Latvian credit institutions that during the period from the fourth quarter of 2014 to the first quarter of 2015 the spread over the market reference rate on loans granted to households for house purchase remained unchanged. Initially, in January 2015, when the amendments adopted by the Saeima (Parliament) of the Republic of Latvia in September 2014 to the Insolvency Law came in to force introducing the so-called clause of returned keys (jingle-mail option), credit institutions tightened collateral requirements and increased the necessary loan-to-value ratio. At the same time, new loans to households for house purchase almost halved, reaching their lowest level since 2004 when compilation of relevant statistical data commenced. In February, after reasonable assessment of the possible impact on access to loans, the Saeima of the Republic
2. MONETARY POLICY AND FINANCIAL MARKETS

21
MACROECONOMIC DEVELOPMENTS REPORTJune 2015
2. MONETARY POLICY AND FINANCIAL MARKETS
of Latvia supported the amendments to the Insolvency Law in relation to the opportunity of borrowers to make a free choice, and the previous tightened conditions with regard to loans to households for house purchase were eased; therefore, the volume of loans granted augmented.
The interest rates on new euro deposits received from non-financial corporations and households were volatile throughout the reporting period. At the end of 2014 and in the first months of 2015, they tended to go down, but in March and April they returned to the level of October 2014. Both in October 2014 and April 2015, the weighted average interest rate on fixed-term deposits collected from households in euro was 0.8% and that on relevant fixed-term deposits gathered from non-financial corporations – 0.05%. The initial decrease in interest rates at the end of 2014 and beginning of 2015 was facilitated by the dynamics of the euro money market index, excess liquidity in the euro money market and changes in risk perception in relation to the financial position of credit institutions. Meanwhile, credit institutions as usual offered more favourable terms and conditions of time deposits to households on most important public holidays of the year, and households invested their savings in longer-term (e.g. 1 year) fixed-term deposits around the turn of the year. The weighted average interest rate on time deposits augmented in March and April as the share of long-term deposits expanded in the overall composition of deposits.
No rapid changes in lending and deposit rates are expected over the next couple of years. The accommodative monetary policy implemented by the ECB will continue to exert a downward pressure on lending rates in the future. The willingness of credit institutions to make profit and the necessity to fulfil the TLTRO requirements in relation to granting new loans could lead to increased competition among credit institutions in lending to non-financial corporations. By contrast, geopolitical uncertainties of the region will continue to put an upward pressure on the risk premium incorporated in lending rates.
2.5 Dynamics of domestic loans and depositsThe relative stability of monetary aggregates observed in the third quarter of 2014 was replaced by a substantial upward trend of deposits (5.8% in the fourth quarter) received by credit institutions and a decline (2.9%) in loans. The rise in deposits was supported by a seasonal income growth at the end of the year, including by an increase in state budget expenditure, and certain caution in spending due to uncertainty

22
MACROECONOMIC DEVELOPMENTS REPORTJune 2015
Chart 2.13LATVIA'S CONTRIBUTION TO THE EURO AREA MONEY SUPPLY(billions of euro)
Chart 2.14ANNUAL RATE OF CHANGE IN RESIDENT DEPOSITS(%)
2. MONETARY POLICY AND FINANCIAL MARKETS
surrounding development of the external environment. The contraction of the loan portfolio was driven both by repayment of sizeable short-term loans and write-off of bad loans and by smaller amounts of new loans as the economic situation did not make it possible for entrepreneurs to boost demand for loans, and credit institutions did not ease credit standards in relation to lending to non-financial corporations. In December, deposits received by credit institutions exceeded the level of the respective period of the previous year by 3.4%, but the portfolio of loans granted lagged behind the year-end indicator of 2013 by 7.1%. Meanwhile, the beginning of 2015 saw a usual fall in deposits in January and moderate rise over the following period of three months, but the loan portfolio of credit institutions contracted only by 1.0% within four months. Thus, the annual rate of change in deposits and loans improved reaching 7.4% and –4.4% respectively.
Overnight deposits made by residents of the euro area with Latvian credit institutions in October–April augmented by 8.7%, and deposits redeemable at notice of up to 3 months increased by 29.3%, while deposits with an agreed maturity of up to 2 years declined by 11.5% (see Chart 2.13). Latvia's overall impact on the euro area money supply was on the upside, i.e. Latvia's contribution to M3 went up by 6.1% over the last seven months, and its annual growth rate reached 8.3%.
A pick-up in household deposits was driven both by an upward trend in domestic deposits, which occurred every month from June to December and recurred in February–April as the population's precaution and thus also savings increased, and by a rise in deposits of non-financial corporations in November and December, as well as in February and March. In general, during the past seven months, i.e. between October 2014 and April 2015, household deposits grew by 6.1% (the annual growth rate of deposits was 9.8% in April) and deposits of non-financial corporations picked up by 5.7% respectively (the annual growth rate of deposits reached 5.0% in April; see Charts 2.14–2.16). Lower annual growth of deposits made by non-financial corporations was driven by the high base level seen at the turn of 2013 and 2014 in relation to the euro changeover. In the fourth quarter of 2014 and first quarter of 2015, non-resident non-MFI deposits surged by 16.7% (see Charts 2.17 and 2.18). However, this rise in terms of euro was partly on account of depreciation of the euro against the US dollar (two thirds of non-resident non-MFI deposits were made in US dollars).

23
MACROECONOMIC DEVELOPMENTS REPORTJune 2015
Chart 2.15ANNUAL RESIDENT DEPOSIT DYNAMICS(billions of euro)
Chart 2.16ANNUAL RATE OF CHANGE IN RESIDENT DEPOSITS(%)
Chart 2.17NON-MFI DEPOSIT DYNAMICS(billions of euro)
2. MONETARY POLICY AND FINANCIAL MARKETS

24
MACROECONOMIC DEVELOPMENTS REPORTJune 2015
Chart 2.18CREDIT INSTITUTION FOREIGN LIABILITIES(billions of euro)
Chart 2.19ANNUAL RATE OF CHANGE IN LOANS TO RESIDENTS(%)
Chart 2.20MONTHLY CHANGE IN LOANS TO RESIDENTHOUSEHOLDS AND NON-FINANCIAL CORPORATIONS(millions of euro)
Although accommodative monetary policy measures implemented by the ECB from June 2014 gradually reduced the negative lending trend in the euro area as a whole, a sharp fall in the loan portfolio continued in Latvia as credit institutions placed their excess funds with foreign credit institutions and invested them in debt securities issued by governments and private companies rather than in loans to real economy. Thus, the share of loans in assets of credit institutions recorded a further decrease from 43.9% in September 2014 to 39.8% in April 2015. In absolute terms, the domestic loan portfolio of credit institutions declined by 499.8 million euro in October–April as loans and household deposits were on a downward trend on a monthly basis, while November and January saw a slight increase in loans to non-financial corporations. The annual rate of decrease in loans decelerated from 5.3% in October to 4.4% in April (see Chart 2.19). In October–April as a whole, loans to households and non-financial corporations shrank by 3.4% and 5.1% respectively (see Chart 2.20), while loans to financial institutions went up by 6.0%. In April, the annual rate of decrease in loans to financial institutions and non-financial corporations fell to 3.8% but that of loans to households dropped to 5.2%. The decline in the level of household debt was driven both by the contraction of loans for house purchase and consumer credit. At the end of April, 94.7% of all domestic loans were granted in euro and 5.3% – in foreign currencies.
In October–December 2014, loan investment boosted in several sectors of the economy, including forestry, manufacture of wood and of products of wood, manufacture of chemical substances, water supply, sale of motor vehicles, storage, accommodation and catering services, as well as in financial lease and other services sector. Meanwhile, loan investment
2. MONETARY POLICY AND FINANCIAL MARKETS

25
MACROECONOMIC DEVELOPMENTS REPORTJune 2015
in crop and animal production, manufacture of food products, energy, construction, wholesale, land and water transport, as well as in real estate activities (see Charts 2.21 and 2.22) decreased most notably. In the first three months of 2015, loan investment in construction, crop and animal production, storage, as well as in several manufacturing sub-sectors, such as manufacture of clothing, wood, pharmaceutical preparations, beverages and furniture, considerably increased. Meanwhile, loan investment in manufacture of food products, chemicals and metals, water supply, transport, retail, accommodation and real estate activities declined. The loan portfolio recorded a further decrease in most sectors; however, for instance, in crop and animal production, manufacture of chemicals, fabricated metal products and pharmaceutical preparations, construction, sale of motor vehicles, information and communication services the annual rate of credit growth was positive.
With the loan portfolio shrinking, the credit-to-GDP ratio continued a downward trend contracting from 54.7% in the second quarter of 2014 to 51.5% in the first quarter of 2015 (see Chart 2.23). Since the total resident deposits increased and the loans fell, the ratio of loans to residents and resident deposits dropped from 1.43 in October to 1.31 in April (see Chart 2.24).
2. MONETARY POLICY AND FINANCIAL MARKETS
Chart 2.21STRUCTURE OF CHANGES IN DOMESTIC LOAN PORTFOLIO(millions of euro)
Chart 2.22CHANGES IN LOANS TO RESIDENTS(millions of euro)
Chart 2.23RESIDENT LOANS TO GDP(%)

26
MACROECONOMIC DEVELOPMENTS REPORTJune 2015
As growth remains weaker than expected in most trade partner countries of Latvia, the declining income of exporting non-financial corporations will prevent them from substantially increasing their savings held with credit institutions, but households will continue to boost their security reserve. Although January saw a seasonal decrease in deposits, their rise in February–April suggests that despite the slowdown in economic growth both entrepreneurs and households still remain in a sufficiently comfortable position to expand their savings in accounts with credit institutions. Thus, a moderate increase in deposits (in the household sector in particular) cal also be expected in the coming months.
The geopolitical tension and uncertainty in relation to export opportunities not only to Russia but also to its trade partner countries, including EU countries, are the key factors that will restrict lending recovery in 2015. However, the amendments to laws providing for an opportunity to get a loan for house purchase by using or not using the so-called clause of returned keys (jingle-mail option), as well as accommodative monetary policy measures implemented by the Eurosystem, including the expanded APP launched on 9 March, could ensure more favourable conditions for lending development. Although credit institutions have established slightly stricter credit standards applicable to non-financial corporations and the economic situation prevents entrepreneurs from substantially increasing demand for loans, a small rise in demand for loans by non-financial corporations is expected in the second quarter, meanwhile, with regard to household lending – the easing of credit standards for housing loans following the amendments adopted by the Saeima of the Republic of Latvia to the Insolvency Law and the Law on Consumer Rights Protection. Moreover, the involvement of large credit institutions in the state support programme for house purchase gives cause to hope once again that mortgage lending will resume. Credit institutions also expect a significant rise in demand for loans to households for house purchase in the second quarter. Thus, forecasts for 2015 still project a contraction of the aggregate loan portfolio, with the rate of decline following a gradual downward path, while a slight lending increase might occur in 2016.
2. MONETARY POLICY AND FINANCIAL MARKETS
Chart 2.24RESIDENT LOAN TO DEPOSIT RATIO

27
MACROECONOMIC DEVELOPMENTS REPORTJune 2015
Chart 3.1CHANGES IN GDP(at constant prices; %)
Chart 3.2CONTRIBUTION TO ANNUAL CHANGES IN GDP(demand side; percentage points)
3. Domestic DemandIn 2014, Latvia's economic growth moderated: in the third and fourth quarters, GDP increased in quarterly terms by 0.5% and 0.6% respectively and in annual terms by 2.4% and 2.1% respectively (see Chart 3.1). In the first quarter of 2015, GDP growth rate was slightly slower (0.3% and 2.0% respectively).
In 2014, private consumption remained strong (see Chart 3.2). A relatively buoyant disposable income growth driven by a high annual rate of increase in the average real net wage contributed to an improvement in the purchasing power of the population. The increase could be partially attributed to a decline in the grey economy. Positive developments were also observed at the beginning of 2015 when consumer confidence improved and the purchasing power was positively affected by lower heating expenses, having contracted due to a warmer winter.
In 2014, private consumption was the main contributor to growth; however, in the fourth quarter GDP growth was primarily driven by exports picking up stronger than expected. At the beginning of 2015, private consumption growth exceeded the pick-up in exports. External demand was negatively affected by the Russian–Ukrainian conflict and related economic sanctions as well as the persistently weak economic development of the euro area countries; at the same time, export growth was driven by the businesses' ability to conquer new export markets.
Due to the geopolitical situation, investors remained cautious in 2014. Investors' willingness to invest moderated further on account of the amendments to the Immigration Law and the Insolvency Law, resulting in a weakened activity in the construction and real estate sectors in the second half of the year. In the third and fourth quarters, gross fixed capital formation contracted somewhat year-on-year. Given the declining number of the issued building permits, the activity in the construction sector is expected to remain low.
3.1. Private consumption and investment
In 2014, private consumption continued on an upward trend, rising by 0.4% and 0.6% quarter-on-quarter and by 1.7% and 2.2% year-on-year respectively in the third and fourth quarters, with the annual growth rate declining due to a higher base (see Charts 3.3 and 3.4). Improvement in the purchasing power of the population was supported by a higher-than-projected increase in the average net wage and a fall in oil
3. DOMESTIC DEMAND

28
MACROECONOMIC DEVELOPMENTS REPORTJune 2015
Chart 3.3CHANGES IN GDP AND PRIVATE CONSUMPTION (year-on-year; %)
Chart 3.4INDICATORS CHARACTERISING CONSUMPTION(consumer confidence, net responses; 2010 = 100; %)
Chart 3.5CONSUMER CONFIDENCE AND UNDERLYING FACTORS(net responses; percentage points)
prices minimizing the overall negative impact of rising prices on the purchasing power.
Private consumption remained strong also in the first quarter of 2015, expanding by 0.6% quarter-on-quarter and 2.0% year-on-year, with most of the below factors having facilitated growth:
1. In the first quarter of 2015, retail trade turnover expanded very rapidly.
3. DOMESTIC DEMAND
2. The improvement in consumer confidence observed in the first quarter found its reflection in most of the sub-indexes: the household financial position and country's economic outlook were assessed more positively and the unemployment assessment was less negative (see Chart 3.5). Should no new significant shocks occur, consumer confidence will continue to improve also in the coming months.

29
MACROECONOMIC DEVELOPMENTS REPORTJune 2015
Chart 3.6NUMBER OF VEHICLES NEWLY REGISTERED WITH THE ROAD TRAFFIC SAFETY DIRECTORATE(thousands)
Chart 3.7INDICATORS CHARACTERISING INVESTMENT(at constant prices; 2010 = 100; %)
Chart 3.8CONTRIBUTION OF PRIVATE AND GOVERNMENT INVESTMENT TO GDP(%)
3. The number of registered cars grew further, reaching a new post-crisis record in March (see Chart 3.6). However, this number is still by approximately 50% lower than that recorded during the period of rapid growth, i.e. in 2007 and 2008. The number of registered cars rose primarily on account of an increase in the number of vehicles registered by natural persons, representing a component of private consumption.
4. Although energy prices rose due to the electricity market liberalisation for households, introduced on 1 January 2015, the negative impact on the purchasing power was offset by state benefits intended for persons of moderate means to cover their growing expenses; moreover, heating expenses contracted due to a warmer winter. The costs were also positively affected by low oil prices. However, due to a rise in oil prices observed over the last few months, a further favourable impact on the purchasing power of the population is highly unlikely.
Consumption alone cannot provide for growth in a small, open economy in the long run; an increase in exports is also necessary, with investment being its key precondition.
Due to the geopolitical situation, investors remained cautious. In the second half of 2014 the impact of the amendments to the Immigration Law and the Insolvency Law became more pronounced: the previously observed rapid expansion in construction of buildings slowed down (see Chart 3.7). This was partly offset by projects for schools, roads, bridges and other engineering structures financed from the EU funds. Higher construction-related activity was also observed in selected segments of the private sector. For instance, several large hotels were built or renovated in Latvia in 2014, and several major hotel projects are also planned for the years 2015 and 2016.
In the third and fourth quarters, gross fixed capital formation contracted by 0.9% and 0.6% respectively year-on-year. The dynamics was more volatile quarter-on-quarter, posting a 2.3% decrease and 1.2% increase in the third and fourth quarters respectively. The decline in the third quarter resulted from contracting government investment which rose again in the fourth quarter (see Chart 3.8).
3. DOMESTIC DEMAND

30
MACROECONOMIC DEVELOPMENTS REPORTJune 2015
Chart 3.9NON-FINANCIAL INVESTMENT BY SECTOR(% of total non-financial investment)
Chart 3.10ACCRUED BALANCE OF THE GENERAL GOVERNMENT CONSOLIDATED BUDGET BY LEVEL(millions of euro)
Chart 3.11SELECTED TAX REVENUE(January–March; millions of euro)
A more swift recovery of economic growth is mainly jeopardised by the low level of investment; however, investment in industry increased in 2014, particularly in the third quarter (see Chart 3.9). This gives rise to hopes that GDP growth will maintain an upward trend. 2014 saw a high production capacity utilisation rate, even reaching a nine-year peak of 73.3% in the fourth quarter. Historically, production capacity utilisation in Latvian industry has been below the EU average and it still has a potential for growth; however, new investment is necessary to further boost exports. The need for higher exports, largely supported by EU funding, is likely to facilitate investment in industry in the future as well.
3.2 Government expenditure and budget
According to the estimates of the CSB, the general government consolidated budget balance deteriorated in 2014 on an accrual basis, with its deficit reaching 1.4% of GDP (0.7% of GDP in 2013). According to the official information by the Treasury, the budget deficit was 399.0 million euro in 2014 (see Chart 3.10). The budget deficit estimated by the CSB on an accrual basis (ESA 2010) was smaller by 52.0 million euro or 0.2% of GDP, largely on account of a positive adjustment to ensure balanced foreign financial assistance flows.
In the first quarter of 2015, the general government consolidated budget posted a modest surplus on a cash flow basis (34.5 million euro; 27.0 million euro in the corresponding period of the previous year). The local government consolidated budget posted a 65.6 million euro surplus, while the central government basic and special budgets recorded deficits of 16.3 million euro and 9.2 million euro respectively.
In 2014, the general government consolidated budget revenue grew by 1.9%, on account of a 250.2 million euro or 3.9% increase in tax revenue. Conversely, non-tax revenue and revenue from foreign financial assistance contracted by 61.0 million euro and 42.5 million euro year-on-year respectively. In the first quarter of 2015, the general government consolidated budget revenue grew by 191.1 million euro or 9.5%, with the pick-up in tax revenue accounting for 92.1 million euro, almost half of the increase (see Chart 3.11). In the first quarter, revenue growth was also substantially enhanced by the foreign financial assistance, exceeding the relatively low level of the previous year by 85.3 million euro.
3. DOMESTIC DEMAND

31
MACROECONOMIC DEVELOPMENTS REPORTJune 2015
3. DOMESTIC DEMAND
In 2014, VAT revenue grew by 8.2%, accounting for more than half of the tax revenue increase. In 2014, personal income tax revenue demonstrated positive trends, and the level of mandatory state social insurance contributions remained broadly unchanged vis-à-vis the previous year, despite the measures taken to minimise the tax burden on labour, e.g. raising the monthly untaxed minimum of personal income and lowering the rate of compulsory social security contributions. At the beginning of the first quarter of 2015, a rapid increase was reported for all major types of tax revenue. The growth rate of tax revenue reached 5.9%, representing a 92.1 million euro increase year-on-year. Revenue from taxes on labour posted significant growth, including a 6.2% rise in revenue from the compulsory social security contributions accounting for almost one third of the total increase in revenue from taxes on labour. A 1 percentage point reduction in the personal income tax rate notwithstanding, a substantial increase in the above tax revenue was also observed. It should be taken into account that the rapid increase in revenue from taxes on labour resulted from the low base at the beginning of the previous year when part of wages and salaries and thus also part of taxes were paid in December 2013, before the euro changeover. Therefore, the increase in the above tax revenue is expected to slow down in the future. In the first months of 2015, VAT revenue growth rate decelerated as compared to the high level recorded in the corresponding period of the previous year; nonetheless, VAT revenue made a substantial contribution to the total increase in tax revenue. The excise tax, although in terms of total revenue much less significant, provided a similar contribution on account of a pick-up in consumption of oil products.
In the fourth quarter, the increase in the general government consolidated budget expenditure accelerated significantly (see Chart 3.12): in 2014, the traditional shift of expenditure towards the end of the year was more pronounced than usually. In 2014 overall, expenditure grew by 426.0 million euro or 5.0%, significantly exceeding both the rate of revenue increase and the economic growth. In 2014, subsidy and grant expenditure posted the highest rise year-on-year (13.3%), mainly on account of the EU funds' expenditure growth; an increase was also recorded for health care-related grants. Growth in expenditure on wages and salaries reached 6.8%. The overall rise in expenditure was also significantly affected by the spending on social benefits expanding by 1.9% during the year due to growing expenditure
Chart 3.12RATE OF CHANGE IN GENERAL GOVERNMENT CONSOLIDATED BUDGET EXPENDITURE (year-on-year; %)

32
MACROECONOMIC DEVELOPMENTS REPORTJune 2015
on unemployment benefits and pensions. Expenditure on goods and services increased more rapidly in December, reaching 9.5% in the first quarter of 2015 when Latvia took over the Presidency of the EU Council. In the first quarter, the general government consolidated budget expenditure grew by 183.5 million euro or 9.3% year-on-year. Expenditure on social benefits posted an increase of 77.0 million euro or 13.5%, facilitated by the measures introduced at the beginning of the year, i.e. lifting the ceiling on social insurance benefits and increasing the family state benefit for the second and third child. In the first quarter, a steep pick-up in other key expenditure items was also observed, with the expenditure for compensation of employees recording a particularly significant increase of 42.9 million euro or 11.1%. The growth in expenditure for compensation of employees and the pick-up in revenue from taxes on labour were due to the shift in payment on account of a proportionally smaller share of wages and salaries paid in the first quarter of 2014. Implementation of the EU projects related to the construction of buildings of higher education institutions facilitated a rapid rise in capital spending.
According to ESA 2010 methodology, the general government debt totalled 9 633.2 million euro or 40.0% of GDP at the end of 2014. On account of the external debt expansion, the general government debt increased by 757.3 million euro over the year. In 2014, two bond issues were launched in the amount of 2 billion euro, with historically lowest yields on Latvia's securities in international markets. At the same time, debt in the amount of 1 billion euro was repaid to the EC and bonds in the amount of 400 million euro matured. The rise in the US dollar exchange rate had an increasing effect on the amount of the debt. Funds were also attracted in preparation for the 1.2 billion euro loan repayment to the EC in January 2015. After the repayment was made at the end of the first quarter of 2015, the debt shrank by 821.4 million euro. At the same time, the government borrowing on the domestic market expanded by 122.6 million euro in the course of the quarter; also, as a result of an increasing effect of the US dollar appreciation on the debt value in terms of euro, the latter expanded by 282.2 million euro.
3. DOMESTIC DEMAND

33
MACROECONOMIC DEVELOPMENTS REPORTJune 2015
4. Aggregate SupplyConstruction (annual growth rate – 6.9%), public utilities (3.3%), trade (2.1%) and transportation and storage services (2.3%) were the contributors to the annual GDP growth by sector in the fourth quarter of 2014. Manufacturing (a decline of 1.7%) contributed negatively to GDP since the growth of the former was slowed down due to the sanctions imposed by Russia. Value added also shrank in real estate activities (by 2.3%), as the demand from non-residents declined owing to the amendments to the Immigration Law. In 2014, construction, public utilities, transportation and trade exerted positive impact on an overall GDP growth. The contribution of manufacturing to the growth was neutral. Other sectors of industry as well as real estate activities had an adverse effect on GDP.
In the first quarter of 2015, the GDP growth was attributable to manufacturing (4.3%; sound performance of the subsectors of wood industry, pharmacy and manufacture of basic metals) and financial and insurance activities (14.8%) as well as taxes on products (5.3%). A downturn of the value added in agriculture, forestry and fishing (7.6%), mining and energy sector (4.6%; a weak energy sector's output due to the weather conditions atypically warm for the heating season) as well as the transportation and storage sector (0.7%) had a negative impact on the economic growth.
4.1 Industry
The value added in manufacturing at constant prices decreased by 0.2% (seasonally adjusted data) in the third quarter of 2014 and rose by 0.1% in the fourth quarter. Hence the value added in manufacturing at constant prices remained unchanged in 2014 overall. It means that the period of stagnation has lasted for some time in manufacturing. In the first quarter of 2015, the value added in manufacturing increased at a faster pace (a growth of 2.5%) on account of the successful performance of wood industry and higher output in the sector of the manufacture of basic metals due to the launch of the operation of the JSC KVV Liepājas metalurgs. According to the publicly available information, the sector of the manufacture of pharmaceutical products has also recorded a dynamic development in the first quarter.
Manufacturing output (see Chart 4.1) at constant prices rose by 2.9% (seasonally adjusted data) in the first quarter in comparison with the output recorded in the fourth quarter of 2014. Three sub-sectors: the
4. AGGREGATE SUPPLY

34
MACROECONOMIC DEVELOPMENTS REPORTJune 2015
4. AGGREGATE SUPPLY
manufacture of wood and of products of wood and cork and computer, electronic and optical products (see Chart 4.2) as well as the manufacture of metals accounted for the major positive contribution to an expanding manufacturing output at the beginning of the year. The launch of the operation of the JSC KVV Liepājas metalurgs contributed to the growth of the sector of the manufacture of basic metals. It is impossible to measure precisely the impact of the sector on the total output of manufacturing since information about the sector of the manufacture of basic metals is currently not available due to the confidentiality provisions. If the situation on the construction market across the region is stable, it may be expected that, with the output of the JSC KVV Liepājas metalurgs expanding gradually, the macroeconomic impact of the manufacture of basic metals increases in the coming quarters.
Continuous rise has been observed in the manufacture of wood and of products of wood and cork (a 3.1% quarter-on-quarter rise) over the last year, reporting a new all-time-high output almost on a monthly basis. The situation is somewhat unusual in the subsector currently – raw materials, the shortage of which has hampered growth so far, are freely available due to the depreciation of the Russian ruble. However, an overproduction is observed currently in the region, inventories of finished goods are also expanding in the end use markets and therefore the growth of the sector might be less pronounced.
Growing output in the manufacture of computer, electronic and optical products (17.2%) points to the successful operational results of a number of export-oriented businesses. The subsector has strengthened notably in recent years – new businesses developing certain clusters have been established. The furniture production output also rose by 6.0% in the first quarter.
Sanctions imposed by Russia and the relevant consequences are the main factors contributing negatively to the output of manufacturing. Consequences of the sanctions, weakness of Russia's economy and depreciation of the Russian ruble have substantially affected those sectors which have been historically linked with export market in Russia, such as the manufacture of food products (a 1.0% decline), textile articles (10.6%), wearing apparel (6.7%), electrical equipment (14.4%) and machinery (7.0%). The publicly available information of NASDAQ OMX Riga suggests that the sales turnover of the JSC Olainfarm and JSC Grindeks have edged up substantially in the first quarter of 2015.
Chart 4.1DYNAMICS OF MANUFACTURING OUTPUT(at constant prices; %)
Chart 4.2ANNUAL INDUSTRIAL OUTPUT CHANGES (Q1 2015; working-day adjusted; %)

35
MACROECONOMIC DEVELOPMENTS REPORTJune 2015
In the third quarter 2014, the turnover in manufacturing at current prices narrowed by 1.6% quarter-on-quarter (seasonally adjusted data) and declined by 0.1% in the fourth quarter. In the first quarter of 2015, the turnover rose by 0.1%. The turnover dynamics (expressed in current prices) relative to the output dynamics (expressed in constant prices) confirms a declining sales price of the industrial output. The development is logical, given the consequences of the sanctions. The differences between both indicators may also point to the increasing inventories of finished goods in the company warehouses (since one indicator shows output and other – the sales volume).
The business sentiment indicator, aggregated by the EC for the third quarter of 2014, remained unchanged quarter-on-quarter, albeit shrank by 1.2 points in the fourth quarter and dropped further by 1.7 points in the first quarter of 2015. The deterioration of the above indicator was primarily attributable to a lower assessment of order volume as well as an improving assessment of the inventories of finished goods.
Production capacity utilisation projected in manufacturing for the third quarter decreased somewhat (to 71.5%; see Chart 4.3), that projected for the fourth quarter rose to 73.3% and for the first quarter of 2015 – shrank to 71.3%. In the breakdown by sector, production capacity utilisation was high in the major economic sectors in the first quarter of 2015: the manufacture of wood and of products of wood and cork (79.7%) and basic pharmaceutical products and pharmaceutical preparations (83.3%). At the same time, low production capacity utilisation has been projected for the manufacture of food products (67.1%), fabricated metal products (66.5%) and non-metallic mineral products (55.1%).
In the first quarter of 2015, an insufficient demand has been reported as the major growth-restrictive factor in industry (referred to as significant by 40.9% of respondents; see Chart 4.4). However, the number of respondents reporting no substantial growth-hampering factors is also high (38.2%; a historical high of the above indicator ever observed). Labour shortage has been pointed out as the next constraint (8.9%; a low of the last ten quarters, suggesting that in view of the current economic situation the possible expansion of operation is given less consideration).
According to the business survey data for the quarter, the net profitability of manufacturing has not deteriorated substantially, despite the adverse economic situation on the sales markets. The average
Chart 4.3PRODUCTION CAPACITY UTILISATION IN MANUFACTURING (%)
Chart 4.4GROWTH-RESTRICTIVE FACTORS IN MANUFACTURING(% of replies from respondents reporting the factor as restrictive)
4. AGGREGATE SUPPLY

36
MACROECONOMIC DEVELOPMENTS REPORTJune 2015
4. AGGREGATE SUPPLY
four quarter net profitability amounted to 4.3% in the fourth quarter of 2014, close to the ratio recorded in the previous two quarters and a high of the last four years. This development suggests that although some manufacturing companies have encountered problems due to the economic weakness of Russia and depreciation of the Russian ruble, overall the sector's companies have maintained profitability.
4.2 Construction and real estate market
The slow-down of the construction growth rate notwithstanding, in 2014 an increase in the construction output and value added remained positive year-on-year. The value added of the construction sector (seasonally adjusted) recorded a year-on-year rise of 4.2% and 6.9% in the third and fourth quarters respectively. The value added of construction rose by 10.0% in 2014 overall. In the first quarter 2015, the value added of the construction sector dropped by 1.5% year-on-year. In the third and fourth quarters of 2014 and the first quarter of 2015, construction output at current prices reported a year-on-year increase of 0.2%, 4.9% and 1.1% respectively. The major contributors to the annual growth in construction output were the residential and non-residential buildings, while the construction of engineering structures accounted for a negative contribution to the expansion of construction (see Chart 4.5). The construction of three and more apartment residential houses remained the major contributor to the growth of residential buildings' segment, while an increasing contribution of single residential buildings and two apartment residential buildings was also notable in the second half of 2014. The construction of non-residential buildings was the major contributor to the growth of construction. In this segment, the construction of schools, universities and research institutions was particularly significant due to the financing from the EU funds.
Activity in these segments is also expected to persist in the medium term. As the economic growth strengthens, entrepreneurs are willing to change a lower class office space to a higher class office space. The supply is also expected to increase, with the demand for higher class office space following an upward trend. Several spacious office buildings are planned to be completed until 2018. The segments of warehouses and retail premises, where the utilisation of space is considerable, present a potential for construction. In the medium term, it is planned to expand Spice Home, Alfa, Origo and other shopping centres (such development could result in improved
Chart 4.5CONTRIBUTION OF SOME TYPES OF CONSTRUCTION OBJECTS TO ANNUAL CONSTRUCTION GROWTH AT CURRENT PRICES(percentage points)

37
MACROECONOMIC DEVELOPMENTS REPORTJune 2015
value added in the commercial buildings segment), while the highly utilised warehouse space allows the developers to build new warehouses even without the letters of intent. The SJSC Valsts nekustamie īpašumi has projected roughly three times larger volume of construction in 2015 than in the previous year, primarily associated with the reconstruction works in a number of major construction units. The contribution of the construction of engineering structures is expected to increase in relation to the utilisation of EU funds. Although the subdued pace of economic growth, the declining number of requests for temporary residence permits and depreciation of the Russian ruble still have a negative impact on construction, overall a substantial decrease in industrial output is not expected in this sector, but rather a minor rise.
A rapid expansion of the real estate market is not typical currently in Latvia. In the third quarter of 2014, the value added in real estate (seasonally adjusted) recorded a year-on-year rise of 4.5%, while declining by 2.3% already in the fourth quarter. In 2014, the value added of real estate (seasonally adjusted) shrank by 0.6% year-on-year overall. The growth in the value added of the real estate sector recovered in the first quarter of 2015, however, its annual rate of increase was minor (0.2%). The number of transactions edged up in the real estate sector until August 2014; however, due to the amendments to the Immigration Law, taking effect in September 2014 and stipulating tighter provisions for receiving a temporary residence permit subject to the investment in real estate, the activity declined considerably and the number of transactions with real estate shrank both in Riga and Jūrmala and the country overall.
The number of real estate transactions reached its low in January 2015, albeit started to increase in the monthly composition, with the real estate market recovering gradually. The shrinking demand for real estate by non-residents was more sustainable on account of the amendments to the Immigration Law and depreciation of the Russian ruble.
The residential property price index of Latvia had not declined since 2012; however, with non-resident demand falling, the residential property prices recorded a year-on-year drop of 3.2% in the fourth quarter of 2014. Prices shrank not only because non-residents made transactions with more expensive real estates, but also due to the fact that the prices offered to non-residents and residents for similar quality housing might differ quite frequently. At the same time, minor price changes were observed on the
4. AGGREGATE SUPPLY

38
MACROECONOMIC DEVELOPMENTS REPORTJune 2015
standard apartment market, primarily on account of the low share of non-residents in the above segment (see Chart 4.6 for the average purchase prices of the standard apartments in Riga in accordance with the data provided by Ober Haus Real Estate Latvia Ltd. and Arco Real Estate Ltd.). The rental market activity remained buoyant, as quality housing for rent was much in demand among students, employees of foreign corporations and also residents with limited opportunities to purchase housing. Such developments contribute to the shortage of adequate housing for rent in Riga and hence the rent is continuously going up.
The subdued pace of the economic growth, recent amendments to the Immigration Law and depreciation of the Russian ruble leading to a declining number of requests for temporary residence permits will have a negative impact on the real estate market, as well as on construction. However, there are a number of factors behind the real estate market that may affect its growth prospects positively. The residents' demand for housing is expected to rebound gradually since the economy and disposable income of the population continue to grow. The amendments to the Insolvency Law, adopted in February and stipulating the so-called clause of returned keys (jingle-mail option) as an option for borrowers are to be considered positive. The amendments have not yet accounted for substantial improvements in mortgage market, albeit provide for reaching the level of activity observed prior to the adoption of the previous amendments to the Insolvency Law regarding the implementation of the clause of returned keys (jingle-mail option). The state programme for the first housing purchase may contribute to the lending for house purchase and real estate market positively since a number of credit institutions have already commenced their participation in the programme. Overall, minor growth is expected on the real estate market in the medium term.
4.3 Services
Public utilities, trade and transportation and storage were the major positive contributors to the GDP growth in the fourth quarter (see Chart 4.7 for the changes in value added of the main types of services). In the first quarter of 2015, financial and insurance activities and public utilities were the major positive contributors to the GDP growth.
Retail trade turnover continued on its upward trend in the third and fourth quarters (see Chart 4.8) and in the first quarter of 2015 a very buoyant growth
Chart 4.6AVERAGE PRICE OF STANDARD APARTMENTS IN RIGA, AND ITS ANNUAL RATE OF CHANGE
4. AGGREGATE SUPPLY

39
MACROECONOMIC DEVELOPMENTS REPORTJune 2015
rate was reported year-on-year (7.5%). The increase was primarily on account of the base effect – smaller purchases immediately after the introduction of the euro in 2014. Some of the surge in retail trade could be attributable to a more active purchase of automotive fuel on legal market. Fuel traders confirm such dynamics and estimate that the consumption of legal fuel has increased by 5%, mainly associated with the fall in oil prices minimising the need to purchase cheaper smuggled fuel.
Higher sales volume notwithstanding, merchant confidence was pessimistic at the end of 2014 and beginning of 2015. This might be explained by unrealised expectations – the population was cautious in spending in 2014 overall, and also shopping by foreign visitors declined gradually. Moreover, concern about the sustainability of tourism dynamics aggravated.
Deteriorating purchasing power was on account of a decreasing number of tourists from Russia who particularly favoured brand clothes, jewellery, household utensils and design items and used Tax Free Shopping system quite frequently to get a refund of the overpaid VAT. In 2014, tax refund was used for austerity purposes even more frequently; however, the average value of purchases declined substantially. The number of purchases made by buyers via the Tax Free Shopping system rose by 25% in 2014, while the amount of the purchased goods increased only by 5%. In 2014, the average value of a purchase stood at 288 euro (a 16% decline year-on-year). The number of purchases made by buyers from Russia via the Tax Free Shopping system edged up by 17%, while the total amount of purchases dropped by 4%. The purchases made by tourists from Russia via the above system amounted to 72% of the total amount of purchases. Since tourists from Russia spend more than the majority of foreigners, merchants experience the weakening purchasing power more notably, with the total number of tourists even on the rise. The increase has been attributable to the status of Riga as the European Capital of Culture in 2014 and the Latvian Presidency of the EU Council in the first half of 2015. The decline in the number of tourists from Russia will intensify in the second half of the year.
Despite the deteriorating geopolitical situation, the volume of rail freight rose by 2.5% year-on-year in the major transport sectors in 2014 (see Chart 4.9 for the annual changes in freight volume by main types of freight transport). The value added of transportation and storage (seasonally adjusted) posted a quarter-
4. AGGREGATE SUPPLY
Chart 4.7CHANGES IN VALUE ADDED BY MAIN TYPES OF SERVICES(year-on-year; seasonally non-adjusted data; %)
Chart 4.8BREAKDOWN BY ANNUAL CHANGES IN RETAIL TRADE TURNOVER(in percentage points)
Chart 4.9ANNUAL CHANGES IN FREIGHT VOLUME BY MAIN TYPES OF FREIGHT TRAFFIC (%)

40
MACROECONOMIC DEVELOPMENTS REPORTJune 2015
on-quarter and year-on-year rise of 0.7% and 2.9% respectively in the fourth quarter. The above sector reported a less successful performance in the first quarter of 2015: a quarter-on-quarter fall of 0.9% and a decline of 0.7% in comparison with the first quarter of 2014 (seasonally adjusted data).
In 2014 overall, a more buoyant pickup in cargo volumes was recorded at the ports of Latvia than the total at the ports of the Baltics (5.2% and 3.5% respectively), mainly on account of the successful performance of Riga port. However, cargoes loaded and reloaded at Latvia's ports in the first quarter of 2015 declined by 4.5% year-on-year, while cargo volume shrank even more notably at the ports of the Baltics (5.7%). Of the ports of Latvia, the steepest fall in the cargo volume was observed at Ventspils port (16.7%). Cargo volume shrank in all major product groups, while the largest negative contributor was the decreasing volume of oil products and mineral fertilisers. Declining cargo volume at Ventspils port is partly attributable to the fact that Uralvagonzavod, the owner of Baltic Coil Terminal, is among the EU sanction-affected businesses.
The volume of cargoes loaded and reloaded at Liepāja port shrank by 3.6% in the first quarter of 2015 primarily due to a narrowing volume of cereals loaded and reloaded in March. The volume of crude oil and oil products also decreased. At the same time, the volume of wood products expanded and also that of base metals rose on account of the launch of the operation of the JSC KVV Liepājas metalurgs.
Of the major ports, an expanding volume of cargoes loaded and reloaded was only observed at Riga port, with an increase in volume of coal (the largest cargo group) and mineral fertilisers accounting for the growth of 6.7%. The volume of oil products also rose, albeit the growth rate was substantially lower than in the previous year. Since Riga Fertilizer Terminal (the owner – Uralhim) started to operate at full capacity, a further increase in the volume of mineral fertiliser cargoes is expected. A decline was observed in the segment of the general cargo at Riga port.
Preliminary data for April suggest that the decline in cargo volume has moderated: the volume of cargoes transported at ports has dropped by 2.1% year-on-year. The decrease is observed mainly on account of the shrinking volume of transhipment of oil products at Ventspils port. A narrowing cargo volume at Riga port has been observed for the first time since November 2013. Liepāja port is the only port where an increase in the volume of cargos loaded and
4. AGGREGATE SUPPLY

41
MACROECONOMIC DEVELOPMENTS REPORTJune 2015
reloaded has been recorded (a rise is attributable to a higher volume of grain and metal cargoes).
In 2014, the turnover and volume of rail freight rose by 2.2% overall. The activity has decreased in the first quarter of 2015, but the declining volume of freight should not be considered as very buoyant. In the first quarter, freight turnover (indicator based on the distance covered and freight weight) fell by 4.4% year-on-year since vigorous increase in the turnover of domestic freight could not offset the fall in the turnover of international freightage. The volume of rail freight recorded a 3.9% drop in the first quarter (indicator based on the freight weight only). The above development was on account of a shrinking import and export freight volume. A decline in the freight volume and turnover was observed in Lithuania and Estonia as well. Preliminary data suggest that the decrease in the turnover and volume of rail freight continued in April.
The year 2014 has been fairly successful for the freight transportation by road, accounting for the major share of the sector's value added. Although the weakness of Russia's economy and embargo of food products affected some road carriers of Latvia, the turnover of freight traffic by road increased by 6.7%. In the fourth quarter, the volume and turnover (indicator based on the distance covered and freight weight) of freight traffic by road recorded a year-on-year pickup of 5.6% and 12.8% respectively. In the first quarter of 2015, freight volume rose by 12.9%, while freight turnover shrank by 4.3%. The volume of domestic freight and international freightage has expanded, but freight has been delivered to closer destinations and hence the turnover of freight has declined both domestically and with respect to the international freightage.
The Russian–Ukrainian conflict will continue to weigh on the transport development in 2015, and there is a risk to lose some freight from Russia, if the situation deteriorates. However, the volume of freight from Russia transported via Latvia recorded even a 6.7% growth, reaching 42.9 million tons in 2014. Although the situation has not been very promising since the beginning of the year, currently there is no reason to believe that the freight volume will shrink notably in 2015: the situation in Ukraine is not deteriorating substantially, oil prices have stabilised and after a buoyant fall the Russian ruble has appreciated in recent months. In addition, Latvia is active in attracting new freight also from Belarus and the countries of the Central Asia. Competition, in
4. AGGREGATE SUPPLY

42
MACROECONOMIC DEVELOPMENTS REPORTJune 2015
turn, is increasing in the region: ports in Russia are developing further and also neighbouring countries develop their transport corridors. For instance, two intermodal rail terminals (in Kaunas and Vilnius) were opened in Lithuania at the end of May. The terminal of Kaunas connecting the standard rails of CIS (the width – 1 520 mm) with the European standard rails (the width – 1 435 mm) could take over some freight delivered from Brest (located in Belarus next to the border with Poland). It will also base its operation on new freight flows from Europe to Scandinavia.
As regards transportation by road, Germany's regulation stipulating a requirement that a minimum wage set in Germany (8.5 euro per hour) be paid to foreign carriers (transit motor vehicle drivers driving through Germany) caused concern. Following the objections raised by other EU Member States (including Latvia), a decision was taken to suspend the application of the regulation to foreign carriers while the EC assesses legal aspects of the new regulation. On 19 May, the EC sent an official notification letter to Germany. Such action is the first step of the procedure in the event of an infringement. Although the EC fully supports the setting of a minimum wage in Germany, it, however, considers that the application of Germany's Minimum Wage Law to all transport operations in the territory of Germany unduly limits the freedom to provide services and free movement of goods. Now Germany has to provide information to the EC in reply to its arguments in two months' time.
4.4 Labour market
As previously projected, unemployment in Latvia continues on a downward trend. In early 2015, 10.2% of the economically active population (which is slightly less than the euro area average) were looking for jobs. Over the year, the decline is still notable (1.7 percentage points); however, the rate of jobseekers has posted minor changes over the last three quarters. Consequently, the unemployment rate remained slightly above 10% – close to its natural rate. The cyclical unemployment component ensuring a considerable fall in unemployment in 2010–2013 has already been fully used, while the structural unemployment component cannot decrease swiftly. Moreover, the decline in unemployment has also moderated on account of a slowdown in the rate of economic growth since late 2014.
The employment growth abated as well. The CSB's Labour Force Survey data reflecting both the formal
4. AGGREGATE SUPPLY

43
MACROECONOMIC DEVELOPMENTS REPORTJune 2015
and informal economy demonstrate that the number of employed in the first quarter of 2015 was 0.3% higher year-on-year. The decline in employment observed in 2014 reflects changes in the methodology (in 2013, the Labour Force Survey was based on the number of working age population at the beginning of the year, while in 2014, it was updated on a quarterly basis). However, employment growth will be weak also in 2015, partly reflecting a slower economic growth rate and partly – a decrease in the number of population and a drop in the share of working age population which cannot be offset by a subdued rise in the level of participation and decelerating unemployment. At the same time, this might signal a decrease in shadow employment, with the number of official vacancies in Latvia increasing. The statistical data sources reflecting official economic developments (the CSB business survey data on the number of occupied posts and the SRS data on the number of employees making the mandatory state social insurance contributions) point to somewhat faster employment growth (see Chart 4.10). Pursuant to the SRS data, similar growth rate of employment persisted also in January and February 2015.
The growing number of beneficiaries of the unemployment benefit (up to 41 thousand in April) represents a larger number of registered short-term unemployed. This does not point to a deteriorating situation in the labour market as the number of long-term jobseekers decreased more. The registered unemployment statistics for April 2015 does not indicate a reversal of the trend either. For example, the decrease in the number of registered unemployed in April (0.4 percentage point) was the same as in the corresponding period of the previous year (excluding the updating effect of the number of economically active population1; see Chart 4.11). The number of registered unemployed shrank by 10% during the year, with the rate of decrease similar to that recorded in spring of 2014.
A sustained increase in remuneration persists in the private sector in particular (see Chart 4.12). Coupled with low inflation and the gradual reduction of the tax burden on labour income, it supports private consumption. The increase in the average wage and salary is expected to moderate to 4%–5% in 2015. On the one hand, the GDP growth and, consequently, the labour productivity growth will be slower in 2015 than in the previous years, and this will reduce
1 The SEA updates data on the economically active population once a year. In 2015, the updating was done in March, but in the previous years – in April.
Chart 4.10ANNUAL INCREASE IN THE NUMBER OF EMPLOYED(%)
Chart 4.11REGISTERED UNEMPLOYMENT RATE AND RATE OF JOBSEEKERS (%)
Chart 4.12ANNUAL CHANGE IN THE AVERAGE MONTHLY GROSS NOMINAL WAGE AND SALARY FOR FULL-TIME JOB(%)
4. AGGREGATE SUPPLY

44
MACROECONOMIC DEVELOPMENTS REPORTJune 2015
the fundamental basis for remuneration rises. The assessment of labour shortage by businesses (the EC survey data) is also still moderate (see Chart 4.13), and this will prevent the rise in wages and salaries from exceeding the labour productivity growth also in the future, thus avoiding the risks of creating economic imbalances. Moreover, employment expectations of businesses (the difference between the number of businesses who plan to increase the number of employees and that of businesses who plan to reduce it) are close to zero; therefore, there is no reason to expect increased topicality of the problem of labour shortage. On the other hand, in 2015 the rise in the average wage and salary will be based on inertia (the economic developments are reflected by the wage dynamics with a lag) and the increase in the minimum wage.
Wage rises will still somewhat exceed the labour productivity growth, and this will be mirrored in moderate unit labour cost growth both in nominal and real terms. This will more likely point to structural changes on the income side of the GDP (with the equilibrium level of the wage share in the total value added growing – it is still significantly lower in Latvia than the EU average) rather than deviation from the balance between wages and productivity.
The recent trends in household spending behaviour suggest an increase in the savings rate in 2014. Although gross saving of the disposable income was negative in 2014, the savings ratio which is adjusted by changes in pension fund reserves is positive, with changes in pension fund reserves growing by 50% in comparison with 2013. Changes in pension fund reserves grew on the basis of both the second and third pension pillars. In 2014, the capital accumulated under the second pillar pension schemes increased by 19.5% (the profit earned as a result of successful investing accounted for approximately one third of the rise). Contributions to the third pillar pension schemes rose significantly by 25% in 2014. The total number of participants of the third pillar pension schemes increased by 7% (this is the fastest growth rate of the number of participants within the last five years).
In the short term, under the impact of the escalating Russian–Ukrainian conflict households could increase their precautionary savings, and the household savings as a percentage of the disposable income will remain in a positive territory. The removal of the cap on social benefits and the continued rise in net real wages and salaries in the medium term which is likely to stimulate accumulation of household savings will have a positive impact on total disposable income in 2015.
4. AGGREGATE SUPPLY
Chart 4.13PERCENTAGE OF BUSINESSES WHO FIND LABOUR SHORTAGE AN IMPORTANT OBSTACLE TO BUSINESS GROWTH(%)

45
MACROECONOMIC DEVELOPMENTS REPORTJune 2015
5. Costs and PricesIn January–April 2015, the annual inflation rate was lower than expected during the time when the previous forecasts were produced, and this was on account of a sharp annual decline in oil prices in the global market having further effect on the prices of energy resources related to oil products (mostly heating energy and fuel). Global food prices continued on a downward trend. The liberalisation of the electricity market which was the main driver of annual inflation hikes, contributing 0.8 percentage point to annual HICP, could not offset the easing effect of the global factors on inflation. In January–April, the 12-month average inflation remained at the level of 0.6% (see Chart 5.1).
The annual decline in global oil prices (see Chart 5.2) also contributed to a fall in the prices of energy resources related to oil products in January–April. Gas and heating tariffs decreased according to tariff tables, and heating prices could continue on a downward trend in June and July as, based on the estimates of JSC Latvijas Gāze, natural gas tariffs for business customers are likely to decrease. Although oil prices did not persist at the low level reached at the beginning of February for a long time, they still remain lower than in the corresponding period of 2014 and influence the natural gas and heating market with a lag. At the same time, the fuel market is more reactive to oil price volatility, and fuel prices have already increased somewhat, although they are lower than in the corresponding period of the previous year. In January, Riga municipal company Rīgas satiksme Ltd. announced new public transport fares which, unlike fuel costs, went up; thus, the overall contribution of transportation services to annual inflation exceeded 0.2 percentage point.
In January–April, global food prices continued to shrink in major commodity groups, excluding dairy products with prices rising in February and March mainly on account of lower industrial output in major exporting countries (see Chart 5.3). The lifting of the milk production quotas in the EU countries in April had the opposite effect: the global price index for this commodity group declined, although it was slightly offset by the increasing meat prices. Over a longer period, consumer prices for dairy products in Latvia have been more comparable with the dynamics of global prices of dairy products rather than the seasonal character and dynamics of the domestic commodity market prices, while the prices of some dairy products continued a downslide in February and March 2015
Chart 5.1 CHANGES IN HICP BY COMPONENT(percentage points)
Chart 5.2BRENT CRUDE OIL PRICES ON GLOBAL MARKET(EUR/barrel)
Chart 5.3GLOBAL FOOD PRICES(average monthly indicator of 2002–2004 = 100)
5. COSTS AND PRICES

46
MACROECONOMIC DEVELOPMENTS REPORTJune 2015
as a result of pressures from the local commodity market, with Russian trade restrictions persisting.
The dynamics of the prices of global resources also limited the impact of the sectors of energy and food production on industrial producer prices for domestically sold goods (see Chart 5.4); however, these factors could have reduced costs also in other sectors, including the costs of services.
In January–April, the consumer price annual core inflation decreased as compared to the average level of 2014, which can be partly explained by the one-off effect of the euro changeover and negative inflation in the euro area, reducing pressure on the price level of manufactured goods. The prices of resources also eased cost pressure in groups of goods and services of core inflation. For example, the prices of tourism services, unusual for the season, decreased in February, and this could be explained by cheaper airfares as a result of lower fuel prices; however, the prices of tourism services recorded an increase already in March, unusual for this month, and this could signal both resilient demand and the fact that the effect of the low fuel prices was not long-lasting. The economic development in Latvia has also slightly moderated, thus limiting the effect of income growth. However, income continues to rise, albeit at a slightly slower rate. One of the reasons why price rises of services remain above 2% might be the expenditure allocation in favour of services as the FROOPP prices (food, energy) have decreased in the course of the year. Moreover, heating bills were lower as a result of both lower prices and lower physical consumption due to the mild winter. In January–April, the rate of core inflation remained slightly above 1% on average.
The annual decline in food and energy prices could be one of the reasons why inflation expectations decreased significantly in January–March (see Chart 5.5) as these are the FROOPP groups having an impact on the perception of the overall price level. However, with the rising fuel prices re-emerging, inflation expectations had already slightly increased in April.
5. COSTS AND PRICES
Chart 5.4CONTRIBUTION OF INDIVIDUAL SECTORS IN THE ANNUAL RATE OF INCREASE IN PRODUCER PRICES OF GOODS SOLD ON THE DOMESTIC MARKET(percentage points)
Chart 5.5ASSESSMENT OF HOUSEHOLD CONSUMER PRICE CHANGES(share; %)

47
MACROECONOMIC DEVELOPMENTS REPORTJune 2015
6. Balance of PaymentsIn the fourth quarter of 2014, the current account deficit of Latvia's balance of payments amounted to 88.0 million euro (1.4% of GDP; see Chart 6.1). The decrease observed in the fourth quarter was mostly determined by the improvement in the negative balance of exports of goods (–10.6% of GDP in the third quarter; –8.4% of GDP in the fourth quarter) and the decline in the deficit of the primary income account, with less funds paid out for investments, in comparison with the previous quarter when the deficit was 4.0% of GDP. In the first quarter of 2015, the current account improved, with its deficit decreasing to 23.5 million euro or 0.4% of GDP. The improvement was supported by the decline in the deficit of the primary income account related to inflows of subsidies from EU funds.
In the fourth quarter, the foreign trade deficit in goods amounted to 541.4 million euro (664.0 million euro in the third quarter), and the decrease was on account of a more rapid increase in exports of goods in comparison with imports (see Chart 6.2). Exports of goods grew year-on-year more rapidly than imports also in the first quarter of 2015. The foreign trade surplus in services remained almost unchanged quarter-on-quarter in the fourth quarter (450.6 million euro or 7.0% of GDP). Personal travel services recorded a minor quarter-on-quarter decline due to seasonal factors. In the first quarter of 2015, the foreign trade deficit in goods was 524.4 million euro, and this quarter-on-quarter decrease was attributable to a more rapid narrowing in imports of goods in comparison with exports of goods. In the first quarter, the foreign trade deficit in goods amounted to 9.5% of GDP (8.4% of GDP in the fourth quarter of 2014). In the first quarter, a higher ratio of the foreign trade deficit in goods to GDP could be explained by slower GDP growth. In the first quarter of 2015, the surplus of services (418.0 million euro) deteriorated by 32.6 million euro quarter-on-quarter. The decline was mainly on account of a decrease reported in construction services abroad and personal travel services or lower spending of foreign travellers in Latvia due to seasonal factors. The balance of transportation services posted a slight quarter-on-quarter improvement in the first quarter, and this was mainly driven by freight transportation by sea and freight transportation by rail.
In the fourth quarter, the deficit of the primary income account declined to 1.2% of GDP quarter-on-quarter (1.9% of GDP in the third quarter). The deficit
6. BALANCE OF PAYMENTS
Chart 6.1CURRENT ACCOUNT OF LATVIA'S BALANCE OF PAYMENTS AND ITS COMPONENTS(% of GDP)
Chart 6.2RATE OF CHANGE IN EXPORTS AND IMPORTS OF GOODS AND SERVICES (year-on-year; %)

48
MACROECONOMIC DEVELOPMENTS REPORTJune 2015
decreased due to lower payments for investments in Latvia. In the first quarter of 2015, the primary income account turned positive (105.5 million euro or 1.9% of GDP), and this dynamics was spurred by subsidies from EU funds.
In the fourth quarter, the surplus of the secondary income account decreased somewhat to 77.7 million euro or 1.2% of GDP (83.0 million euro or 1.3% of GDP in the third quarter), and this was driven by a more rapid increase in debit balances in comparison with credit balances. It can be explained by Latvia's contributions to the EU budget, based on the EC projections for adjustments to contributions in 2013 and in the previous years. In the first quarter of 2015, the balance of the secondary income account turned negative (22.6 million euro or 0.4% of GDP). The volatility displayed in some months was caused by flows of subsidies received by Latvia from EU funds, contributions to the EU budget and a drop in the value of incoming personal transfers.
In the first quarter of 2015, the surplus of the capital account was 183.7 million euro or 3.3% of GDP (133.0 million euro or 2.1% of GDP in the fourth quarter of 2014), and this was supported by flows of EU funds intended for investment.
In the fourth quarter, the financial account deficit declined to 0.2% of GDP (4.8% of GDP in the third quarter). The changes were affected by the decreasing amount of transactions in investment portfolio conducted abroad compared with the third quarter (5.7% of GDP in the third quarter; 1.6% of GDP in the fourth quarter) and growing foreign direct investment (0.2% of GDP in the third quarter; 4.0% of GDP in the fourth quarter; see Chart 6.3). In the first quarter of 2015, the balance of the financial account turned positive (27.8 million euro or 0.5% of GDP). The inflows of foreign direct investment in Latvia amounted to 215.7 million euro (3.9% of GDP) in this period. In the first quarter, the ECB launched its expanded APP under which in March, Latvijas Banka purchased securities issued by the Latvian government and the European cross-national institutions in the amount of 190.3 million euro.
Chart 6.3FOREIGN DIRECT INVESTMENT IN LATVIA(% of GDP)
6. BALANCE OF PAYMENTS

49
MACROECONOMIC DEVELOPMENTS REPORTJune 2015
7. Conclusions and Forecasts7.1 Economic developmentsIn 2014, Latvia's real GDP grew by 2.5%, recording an annual low of the post-crisis period. In view of the geopolitical situation, however, it should be considered a positive result. 2014 saw a gradual deceleration of the GDP growth rate on a quarterly basis. In 2013, the quarterly growth averaged 1.1%, while recording a mere 0.5% in 2014. The external environment had a negative effect on Latvia's economy in 2014. On the one hand, economic growth in Latvia was limited by the persistently weak and unsustainable growth of the euro area. On the other hand, already from the beginning of the year the economic situation also grew considerably worse in the nearby regions on account of a weaker demand in Russia and depreciation of the Russian ruble. Although the direct impact of applying the economic sanctions on the Latvian economy was not too pronounced (the products subject to the sanctions accounted for merely a small share in the exports of Latvian goods), they had a substantial effect on the overall economic situation: the confidence of the economic agents regarding their future income declined. The rapid changes in the economic situation and the subsequent impact of the negative sentiment of the economic agents is a key reason underlying the weak dynamics of investment and lending recovery.In the time of extremely complex external environment, sectors supporting domestic consumption were the main drivers of economic growth in Latvia. In 2014, trade, construction and public utilities were the major contributors to the economic growth. Growth in the sectors largely dependent on the domestic economic developments was mostly supported by gradually improving labour market conditions. With unemployment on a downward path and average wages and salaries on the rise, household spending also increased, finding reflection in the operation of the above sectors. The low oil prices and lower-than-usual housing maintenance costs on account of the warm weather conditions also facilitated such household spending in late 2014 and early 2015. Various survey leading indicators suggest that the economic growth rates observed in the euro area at the beginning of 2015 were slightly higher than projected. The monetary policy implemented by the ECB had a positive effect on the economic agents' confidence
7. CONCLUSIONS AND FORECASTS

50
MACROECONOMIC DEVELOPMENTS REPORTJune 2015
regarding the economic outlook; such response, how-ever, may be unsustainable. Robust growth lasting for at least several quarters will be a factor testifying to sustainable recovery of the euro area economy. Un-certainty regarding the question whether the improve-ment in the economic confidence indicators will also find reflection in the real economy data still persists. Moreover, the solvency issue of Greece may also provoke further negative confidence effects any time.
Upon making decisions on purchases, households have also taken account of the high degree of uncertainty: spending dynamics lagging behind the rate of change in wages and salaries and an increase in household savings in 2014 testify to that. Moreover, according to Latvijas Banka's estimates, the expected changes in wages and salaries in 2015 will be more moderate than in 2014, thus also slightly limiting the increase in domestic consumption, the major driver of the economic growth so far.
The previous forecasts of Latvijas Banka were published on 13 January 2015 when, in view of the geopolitical developments, a further depreciation of the Russian ruble and deterioration in the economic situation in Russia, the latest macroeconomic data and the weak growth in the euro area, the forecast for 2015 was revised downwards, from 2.7% to 2.0%. At this stage, the growth forecast for 2015 remains unchanged at 2.0% (see Chart 7.1). Data for the first quarter of 2015 and preliminary statistics for the second quarter suggest that Latvijas Banka's perception regarding the economic growth in 2015 was realistic enough. The beginning of 2015 was quite successful for trade and also manufacturing as the JSC KVV Liepājas metalurgs started its operation; the transport and energy sectors, however, were less successful. In 2016, subject to gradual improvement in the external environment, GDP might record slightly faster growth of approximately 3%.
Risks related to the country's economic development are currently balanced. As regards positive risks, a possibility of a more positive than anticipated pass-through of the low oil prices (the price effect provides additional opportunities for households to buy other goods and services) and the impact of the monetary policy decisions adopted by the ECB (implementation of the expanded APP) on the Latvian economy (mostly indirect effects as a result of the increasing economic activity of the euro area countries). Speaking about negative risks, they are mostly related to the developments associated with the external environment, particularly in the context of the regional geopolitical conflict. Further turmoils in the
Chart 7.1CHANGES IN GDP(year-on-year; %; forecast of Latvijas Banka*)
* The coloured area represents 90% of potential scenarios (the lighter the colour, the lower the scenario's probability).
7. CONCLUSIONS AND FORECASTS

51
MACROECONOMIC DEVELOPMENTS REPORTJune 2015
external environment may result in additional negative confidence effects, thus affecting the household private consumption and the amount of investments made by businesses.
7.2 Inflation
The current inflation (HICP) estimate for 2015 stands at 0.7% (see Chart 7.2), slightly lower than the previous publicly stated estimate of 0.9%. Due to energy and food prices, the actual data for January reduced the base of the overall price index considerably. However, on account of the new public transportation tariffs introduced by Riga municipal company Rīgas satiksme Ltd. and higher prices of oil futures contracts the reduced base effect is fading.
One of the factors likely to sustain the impact of the demand side on inflation is a rise in wages, albeit probably slightly slower in 2015 than initially projected. For example, the positive effect of launching the operation of JSC KVV Liepājas metalurgs on growth and income, Latvia's Presidency of the EU Council (will maintain the hotel and catering prices and probably also cultural services prices) and the Nordic-Baltic Choral Festival to be held in June, albeit a less extensive event than the 8th World Choir Games held in Riga in 2014, are factors likely to maintain the demand side effect on inflation. Part of these factors, however, will not be present in the second half of the year.
An increase in the excise tax on tobacco in the middle of the year and the potential changes in the excise tax on alcoholic beverages might have just a minor effect on inflation.
Risks to the inflation forecast are balanced. More accelerated renewed surges in commodity (oil) prices are possible. A small upside risk to the inflation outlook is also associated with the domestic energy prices if the transmission services tariff raised by the Latvian transmission system operator JSC Augstsprieguma tīkls is incorporated in the energy consumer price; however, it is highly unlikely this risk could materialise in 2015.
A minor downside risk to the price level could be associated with Lithuania's potential connection to Sweden's SE4 bidding area in 2016 where the energy price is slightly lower than in Latvia; however, a decline in price levels on account of price differences is reduced by the costs of transmission services through Lithuania, as well the fact that the contribution of large energy consumers, such as JSC KVV Liepājas metalurgs, is more significant for the economic growth.
Chart 7.2HICP CHANGES(year-on-year; %; forecast of Latvijas Banka*)
* The coloured area represents 90% of potential scenarios (the lighter the colour, the lower the scenario's probability).
7. CONCLUSIONS AND FORECASTS

52
MACROECONOMIC DEVELOPMENTS REPORTJune 2015
STATISTICS
Statistics List of tables
1. Monetary Indicators and Interest Rates 542.ab Real Sector Indicators and Prices 553. Analytical Accounts of the Central Bank 564. Monetary Aggregates and Counterparts in the Euro Area: Latvian Contribution 575. Key ECB Interest Rates 586. Assets and Liabilities of Latvijas Banka 597. Aggregated Balance Sheet of MFIs (excluding Latvijas Banka) 618. Consolidated Balance Sheet of MFIs 629.ab Aggregated Balance Sheet of MFIs (excluding Latvijas Banka) 6310. Monetary Survey MFI's (excluding Latvijas Banka) 6611.ab Foreign Assets and Liabilities of MFIs (excluding Latvijas Banka) 6712. Selected Items in the Monthly Financial Position Report of MFIs (excluding Latvijas Banka) by Group of Countries 6813. Maturity Profile of Deposits of Resident Financial Institutions, Non-Financial
Corporations and Households 6914.a Deposits by Financial Institutions 7014.b Deposits by Non-Financial Corporations 7214.c Deposits by Households 7314.d Deposits by Government and Non-Residents 7315. Maturity Profile of Loans to Resident Financial Institutions, Non-Financial
Corporations and Households 7416.a Loans to Financial Institutions and Non-Financial Corporations 7416.b Loans to Households 7516.c Loans to Government and Non-Residents 7517.ab Loans to Financial Institutions and Non-Financial Corporations in the National
Economy 7618. Lending to Resident Financial Institutions, Non-Financial Corporations and
Households 7719.a Holdings of Securities Other than Shares 7819.b Holdings of Shares and Other Equity 7820.a Currency Breakdown of Resident Deposits 7920.b Currency Breakdown of Non-Resident Deposits 7920.c Currency Breakdown of Loans to Residents 8020.d Currency Breakdown of Loans to Non-Residents 8020.e Currency Breakdown of Holdings of Resident Securities Other than Shares 8120.f Currency Breakdown of Holdings of Non-Resident Securities Other than
Shares 8120.g Currency Breakdown of Debt Securities Issued by MFIs 8221.a Weighted Average Interest Rates Charged by MFIs in Transactions with
Resident Non-Financial Corporations and Households in Euro 8221.b Weighted Average Interest Rates Charged by MFIs in Transactions with
Resident Non-Financial Corporations and Households in US Dollars 8621.c Weighted Average Interest Rates Charged by MFIs in Transactions with Resident
Non-Financial Corporations (new business) 9022. Lending in the Interbank Markets 9123. Interest Rates in the Domestic Interbank Market 9224. Principal Foreign Exchange Transactions (by type, counterparty and currency) 92

53
MACROECONOMIC DEVELOPMENTS REPORTJune 2015
STATISTICS
25. Non-cash Foreign Exchange Transactions 9326. Euro Foreign Exchange Reference Rates Published by the ECB 9327. Weighted Average Exchange Rates (cash transactions) 9428. Structure of Government Securities 9529. Auctions of Government Securities in the Primary Market 9630. Dynamics of GDP 9631. Changes in the Average Monthly Wages and Salaries and Unemployment 9732. Latvian Foreign Trade Balance 9733. Main Export Goods of Latvia 9834. Main Import Goods of Latvia 9835. Latvian Foreign Trade Partners 9936. Convenience and Extended Credit, Revolving Loans and Overdraft to Resident
Non-financial Corporations and Households 9937.a Loans to Resident Non-financial Corporations in the Breakdown
by Residual Maturity and by Interest Rate Reset Period 10037.b Loans to Resident Households in the Breakdown by Residual Maturity and
by Interest Rate Reset Period 100

54
MONETARY INDICATORS AND INTEREST RATES
2014 2015
Q1 Q2 Q3 Q4 Q1
Overnight deposits1 (Latvian contribution to the euro area M1) –0.8 16.0 6.5 7.8 –0.8 12.2
Latvian contribution to the euro area M21 –2.0 7.9 3.7 5.2 –2.0 6.9
Latvian contribution to the euro area M31 x x x x x 6.7
Loans to resident financial institutions, non-financial corporations and households1 –7.1 –8.7 –7.0 –5.6 –7.1 –4.3
Deposits of resident financial institutions, non-financial corporations and households1 3.4 11.4 9.9 10.8 3.4 5.9
Long-term interest rate for convergence assessment purposes2 2.51 3.14 2.69 2.34 1.86 0.81
EURIBOR (3-month loans)3 0.210 0.295 0.299 0.165 0.082 0.046
Weighted average yield on government bonds 1.64 1.84 1.74 1.74 1.34 0.25
OMXR3 436.9 460.3 430.8 435.8 419.1 421.5
1.
2015
I II III IV V VI VII VIII IX X XI XII I II III
Overnight deposits1 (Latvian contribution to the euro area M1)
15.7 14.2 16.0 10.1 7.8 6.5 3.9 3.6 7.8 4.5 1.8 –0.8 8.8 12.3 12.2
Latvian contribution to the euro area M21
7.9 6.3 7.9 4.3 3.5 3.7 1.8 1.4 5.2 2.3 0.7 –2.0 4.3 7.8 6.9
Latvian contribution to the euro area M31
x x x x x x x x x x x x 4.1 7.7 6.7
Loans to resident financial institutions, non-financial corporations and households1 –8.8 –9.0 –8.7 –8.0 –8.3 –7.0 –6.9 –6.6 –5.6 –5.3 –5.5 –7.1 –4.4 –4.5 –4.3
Deposits of resident financial institutions, non-financial corporations and households1 10.0 9.4 11.4 9.1 9.5 9.9 10.6 10.4 10.8 9.1 7.9 3.4 3.8 4.9 5.9
Long-term interest rate for convergence assessment purposes2 3.48 3.07 2.87 2.80 2.74 2.53 2.40 2.35 2.28 2.18 1.77 1.63 1.10 0.78 0.56
EURIBOR (3-month loans)3 0.292 0.288 0.305 0.330 0.325 0.241 0.205 0.192 0.097 0.083 0.081 0.081 0.063 0.048 0.027
Weighted average yield on government bonds – 1.84 – 1.64 1.94 1.84 1.84 – 1.54 1.44 1.24 1.14 0.35 0.35 0.25
OMXR3 474.6 478.4 427.9 421.3 428.6 443.0 450.1 429.3 427.2 420.8 420.0 416.3 418.6 421.6 424.2
1 Year-on-year changes (%). 2 Average secondary market yield of 10-year government bonds. 3 Average of the period. 4 Weighted average primary market yield of 5-year government bonds. 5 Weighted average primary market yield of 3-year government bonds.
2014

55
REAL SECTOR INDICATORS AND PRICES
2014 2015
Q1 Q2 Q3 Q4 Q1
Industrial output1
Increase/decrease2 (at constant prices; working day adjusted data; %) –0.1 0.3 1.8 –0.6 –1.7 4.2
Cargoes loaded and unloaded at ports
Turnover (thousands of tons) 74 175 20 749 18 637 16 206 18 632 19 810
Increase/decrease2 (%) 5.2 9.4 3.6 –2.24 9.6 –4.5
Retail trade turnover 1, 3, 4
Turnover (at current prices; millions of euro)
5 260.4 1 179.9 1 311.9 1 366.3 1 402.3 1 232.6
Increase/decrease2 (at constant prices; %) 4.0 2.2 4.9 3.4 4.0 7.5
Unemployment rate (%) 8.5 9.8 8.9 8.2 8.5 9.2
Producer prices1 (increase/decrease compared with the previous period; %) 0.4 0.2 0 0.5 –0.6 –0.1
Consumer price inflation
Year-on-year basis (%) 0.6 0.4 0.7 0.8 0.6 0
Quarter-on-quarter basis (%) x 0.6 0.7 –0.5 –0.3 0
Financial surplus/deficit in the consolidated general government budget
Surplus/deficit (millions of euro) –399.0 27.0 248.9 38.7 –713.6 34.5
Ratio to GDP (%) 1.7 0.5 4.2 0.6 11.0 0.6
1 Data are calculated according to the Statistical classification of economic activites in the European Community (NACE Rev. 2). 2 Year-on-year basis. 3 Sale of motor vehicles and motorcycles not included. 4 Data have been revised.
2.a

56
ANALYTICAL ACCOUNTS OF THE CENTRAL BANK (at end of period; millions of euro)
2014
I II III
Latvia's contribution to the euro area monetary base 5 831.9 5 905.9 5 852.2
Currency in circulation 3 779.6 3 727.9 3 715.4
Current accounts (covering the minimum reserve system) 1 417.3 1 218.9 1 191.8
Deposit facility and other liabilities related to monetary policy operations 635.0 959.1 945.0
Credit 1 683.9 1 595.5 1 615.8
To MFIs in the euro area 522.8 434.8 451.6
To the General government sector in the euro area 298.6 298.7 283.1
To other euro area residents 862.5 862.0 881.1
Foreign assets outside the euro area 2 768.3 2 734.1 2 752.2
Foreign liabilities outside the euro area 46.5 20.5 3.3
IV V VI VII VIII IX
5 692.5 5 785.1 4 762.3 4 528.9 4 484.6 4 627.5
3 736.3 3 745.6 3 753.7 3 783.0 3 782.4 3 788.6
1 206.2 999.5 1 008.6 745.9 702.2 838.9
750.0 1 040.0 0 0 0 0
1 611.8 1 583.2 1 577.6 1 586.4 1 577.2 1 656.9
487.8 493.3 483.5 497.2 496.2 564.9
273.1 273.6 272.7 272.7 274.1 273.5
850.9 816.3 821.4 816.5 806.9 818.5
2 729.0 2 813.4 2 796.3 2 815.4 2 830.6 2 837.6
28.4 62.0 9.3 5.2 28.9 5.4
2015
X XI XII I II III
4 429.1 4 617.1 6 381.1 5 105.7 5 716.5 5 826.0
3 803.0 3 824.7 3 957.7 3 883.8 3 894.7 3 929.1
626.1 792.4 2 073.4 1 221.9 1 821.8 1 896.9
0 0 350.0 0 0 0
1 628.8 1 634.5 1 670.7 1 987.3 2 069.1 2 285.9
560.7 557.5 570.5 673.8 690.8 730.1
281.2 281.1 306.5 505.6 518.6 597.7
786.9 795.8 793.7 807.9 859.7 958.1
2 798.4 2 764.3 2 867.1 3 296.7 3 183.8 3 237.8
23.2 73.7 24.0 27.3 14.7 10.4
REAL SECTOR INDICATORS AND PRICES
2015
I II III IV V VI VII VIII IX X XI XII I II III
Industrial output1, 2
Increase/decrease3 (at constant prices; working day adjusted data; %) –3.1 –0.2 4.0 5.9 1.9 –2.2 –2.6 –1.0 1.8 1.7 –4.2 –2.8 3.1 1.4 7.6
Cargoes loaded and unloaded at ports
Turnover (thousands of tons) 6 653 6 873 7 223 6 591 6 225 5 820 5 393 5 300 5 513 6 080 6 380 6 172 6 651 6 188 6 972
Increase/decrease2 (%) 1.5 22.4 6.2 5.1 3.2 2.3 –1.8 –7.4 3.9 14.6 19.6 –2.9 0 –10.0 –3.5
Retail trade turnover 1, 2, 4
Turnover (at current prices; millions of euro) 391.4 367.1 421.5 427.4 442.4 442.1 473.2 462.4 430.7 452.9 429.2 520.2 408.4 386.2 438.0
Increase/decrease3 (at constant prices; %) 1.5 1.1 3.9 10.5 2.5 2.3 3.7 3.4 3.2 4.7 4.6 2.9 7.1 8.9 6.5
Unemployment rate (%) 9.8 9.9 9.8 9.6 9.1 8.9 8.6 8.4 8.2 8.2 8.3 8.5 9.0 9.1 9.2
Producer prices1 (increase/decrease compared with the previous period; %) 0.7 0.1 –0.2 0.3 –0.5 0.6 0.2 0 0.1 –0.5 –0.1 –0.4 0.1 –0.1 –0.1
Consumer price inflation
Year-on-year basis (%) 0.4 0.5 0.3 0.7 0.6 0.7 0.6 0.8 1.0 0.7 0.9 0.2 –0.4 –0.1 0.4
Month-on-month basis (%) 0.6 0 0.3 0.5 –0.1 0.3 –0.4 –0.6 0.5 0 –0.3 –0.6 0.1 0.3 0.8
Annual core inflation (%) 1.3 1.4 1.3 1.6 1.6 2.0 1.6 1.7 1.7 1.2 1.7 1.5 1.8 1.4 1.7
Financial surplus/deficit in the consolidated general government budget (millions of euro) 91.3 –21.5 –42.8 –37.7 90.7 195.9 –10.9 47.4 2.2 –74.2 –172.2 –467.2 89.1 –78.8 24.2
1 Data are calculated according to the Statistical classification of economic activites in the European Community (NACE Rev. 2). 2 Data have been revised. 3 Year-on-year basis. 4 Sale of motor vehicles and motorcycles not included.
2014
2.b
3.

57
MONETARY AGGREGATES AND COUNTERPARTS IN THE EURO AREA: LATVIAN CONTRIBUTION (at end of period; millions of euro)
2014
I II III IV V VI VII VIII IX
M3 10 009.1 9 863.2 9 962.3 9 871.2 9 814.7 9 861.3 9 919.8 10 071.4 10 080.3
Repurchase agreements 0 0 0 0 0 0 0 0 0
Money market fund shares and units 67.8 67.0 68.2 70.1 68.7 67.0 64.6 64.6 62.8
Debt securities issued with maturity of up to 2 years 6.0 13.6 13.9 28.6 28.8 26.7 31.6 31.9 32.2
Deposits with agreed maturity of up to 2 years 1 871.5 1 827.4 1 880.2 1 822.1 1 807.0 1 748.5 1 687.0 1 624.7 1 647.2
Deposits redeemable at notice of up to 3 months 484.7 491.3 494.4 502.9 514.0 531.6 541.0 542.4 553.3
Overnight deposits 7 579.0 7 464.0 7 505.6 7 447.5 7 396.3 7 487.6 7 595.5 7 807.7 7 784.8
Counterparts of monetary aggregates and longer-term financial liabilities: Latvian contribution
Deposits of central government 2 312.5 2 283.0 1 337.0 1 942.6 1 599.4 1 506.9 1 513.9 1 532.7 1 615.6
Longer-term financial liabilities 3 834.5 3 860.0 3 786.0 3 822.3 3 908.6 3 932.8 3 965.2 4 010.0 4 003.6
Deposits with agreed maturity of over 2 years 438.3 437.5 442.9 433.1 433.6 428.8 429.0 430.6 432.9
Deposits redeemable at notice of over 3 months 3.5 3.5 3.5 3.5 3.6 4.6 4.7 4.6 4.7
Debt securities issued with maturity of over 2 years 15.0 14.4 14.5 16.9 17.0 17.5 18.1 19.0 19.2
Capital and reserves 3 263.0 3 291.1 3 211.2 3 252.3 3 336.5 3 363.1 3 392.0 3 430.6 3 417.6
Credit to euro area residents 14 745.8 14 689.4 14 579.3 14 556.9 14 539.6 14 493.9 14 481.1 14 499.7 14 543.6
Credit to general government 1 127.0 1 128.9 1 109.7 1 094.8 1 093.8 1 371.0 1 374.0 1 379.5 1 344.9
Credit to other euro area residents 14 466.6 14 390.7 14 305.3 14 257.8 14 112.3 14 083.0 14 142.2 14 165.2 14 132.4
Loans 13 712.3 13 647.5 13 574.7 13 526.9 13 398.2 13 341.2 13 301.6 13 322.4 13 340.5
Net external assets outside euro area –661.8 –900.2 –842.3 –1 130.1 –736.5 –110.5 41.7 129.3 169.5
Monetary aggregates: Latvian contribution
2015
X XI XII I II III
10 081.3 10 236.9 10 599.4 10 418.7 10 617.8 10 627.1
0 0 0 0 0 0
59.7 56.2 40.6 23.4 17.4 15.2
34.8 32.5 36.8 31.1 52.5 48.9
1 578.7 1 593.7 1 532.4 1 421.4 1 451.0 1 440.4
567.2 578.6 687.9 697.6 713.8 698.7
7 840.9 7 975.9 8 301.7 8 245.2 8 383.1 8 424.0
1 613.7 1 561.6 1 283.3 658.6 594.3 625.5
4 144.6 4 173.8 4 017.9 4 073.6 4 130.3 4 000.2
449.3 448.1 440.4 444.4 443.7 445.3
4.7 4.6 4.7 5.0 5.1 5.1
20.4 20.5 40.3 40.8 53.7 59.1
3 534.3 3 563.9 3 532.5 3 583.4 3 627.8 3 490.6
14 479.7 15 386.4 15 115.5 15 639.8 15 604.7 15 471.2
1 326.4 1 257.9 1 198.5 1 611.4 1 675.3 1 681.9
14 114.9 14 128.5 13 917.0 14 028.4 13 929.4 13 789.3
13 309.1 13 295.4 13 005.2 13 103.1 13 004.1 12 983.8
30.1 68.1 –1 574.4 –284.7 –316.6 184.6
4.

58
KEY ECB INTEREST RATES (percentages per annum)
With effect from (dd.mm.yyyy)
Deposit facility Main refinancing operations Marginal lending facility
Fixed rate tenders Variable rate tenders
Fixed rate Minimum bid rate
01.01.1999 2.00 3.00 – 4.50
04.01.1999 2.75 3.00 – 3.25
22.01.1999 2.00 3.00 – 4.50
09.04.1999 1.50 2.50 – 3.50
05.11.1999 2.00 3.00 – 4.00
04.02.2000 2.25 3.25 – 4.25
17.03.2000 2.50 3.50 – 4.50
28.04.2000 2.75 3.75 – 4.75
09.06.2000 3.25 4.25 – 5.25
28.06.2000 3.25 – 4.25 5.25
01.09.2000 3.50 – 4.50 5.50
06.10.2000 3.75 – 4.75 5.75
11.05.2001 3.50 – 4.50 5.50
31.08.2001 3.25 – 4.25 5.25
18.09.2001 2.75 – 3.75 4.75
09.11.2001 2.25 – 3.25 4.25
06.12.2002 1.75 – 2.75 3.75
07.03.2003 1.50 – 2.50 3.50
06.06.2003 1.00 – 2.00 3.00
06.12.2005 1.25 – 2.25 3.25
08.03.2006 1.50 – 2.50 3.50
15.06.2006 1.75 – 2.75 3.75
09.08.2006 2.00 – 3.00 4.00
11.10.2006 2.25 – 3.25 4.25
13.12.2006 2.50 – 3.50 4.50
14.03.2007 2.75 – 3.75 4.75
13.06.2007 3.00 – 4.00 5.00
09.07.2008 3.25 – 4.25 5.25
08.10.2008 2.75 – – 4.75
09.10.2008 3.25 – – 4.25
15.10.2008 3.25 3.75 – 4.25
12.11.2008 2.75 3.25 – 3.75
10.12.2008 2.00 2.50 – 3.00
21.01.2009 1.00 2.00 – 3.00
11.03.2009 0.50 1.50 – 2.50
08.04.2009 0.25 1.25 – 2.25
13.05.2009 0.25 1.00 – 1.75
13.04.2011 0.50 1.25 – 2.00
13.07.2011 0.75 1.50 – 2.25
09.11.2011 0.50 1.25 – 2.00
14.12.2011 0.25 1.00 – 1.75
11.07.2012 0 0.75 – 1.50
08.05.2013 0 0.50 – 1.00
13.11.2013 0 0.25 – 0.75
11.06.2014 –0.10 0.15 – 0.40
10.09.2014 –0.20 0.05 – 0.30
5.

59
ASSETS AND LIABILITIES OF LATVIJAS BANKA (at end of period; millions of euro)
2014 2015
I II III IV V VI VII VIII IX X XI XII I II III
ASSETS
Gold and gold receivables 196.8 205.1 200.3 199.1 196.7 205.1 206.5 208.0 205.2 199.9 202.5 210.8 238.5 228.8 235.4
Claims on non-euro area residents denominated in foreign currency 2 376.0 2 337.6 2 355.5 2 319.5 2 401.4 2 375.0 2 396.7 2 408.1 2 416.4 2 390.9 2 355.7 2 441.4 2 818.3 2 739.2 2 784.8
Claims on euro area residents denominated in foreign currency 465.2 467.0 478.2 504.5 483.1 470.5 469.8 472.0 515.0 500.8 508.7 486.2 598.0 655.8 617.2
Claims on non-euro area residents denominated in euro 195.5 191.3 196.5 210.4 215.3 216.1 212.2 214.4 216.0 207.6 206.1 215.0 239.9 215.8 217.6
Lending to euro area credit institutions related to monetary policy operations denominated in euro 1.0 5.0 4.0 4.0 0 0 6.0 6.0 31.0 25.0 25.0 85.5 85.5 85.5 160.5
Main refinancing operations 1.0 1.0 0 0 0 0 0 0 0 0 0 0 0 0 0
Longer-term refinancing operations 0 4.0 4.0 4.0 0 0 6.0 6.0 31.0 25.0 25.0 85.5 85.5 85.5 160.5
Fine-tuning reverse operations 0 0 0 0 0 0 0 0 0 0 0 0 0 0 0
Structural reverse operations 0 0 0 0 0 0 0 0 0 0 0 0 0 0 0
Marginal lending facility 0 0 0 0 0 0 0 0 0 0 0 0 0 0 0
Credits related to margin calls
0 0 0 0 0 0 0 0 0 0 0 0 0 0 0
Other claims on euro area credit institutions denominated in euro 96.8 1.8 0.4 0 4.0 5.1 4.5 3.1 7.0 0.3 0.2 4.5 23.4 1.1 4.4
Securities of euro area residents denominated in euro 1 120.9 1 121.7 1 133.3 1 103.2 1 096.1 1 102.0 1 106.2 1 096.1 1 103.9 1 102.7 1 100.6 1 095.4 1 280.4 1 326.7 1 503.8
Securities held for monetary policy purposes 0 0 0 0 0 0 0 0 0 0 0 0 0 0 190.3
Other securities 1 120.9 1 121.7 1 133.3 1 103.2 1 096.1 1 102.0 1 106.2 1 096.1 1 103.9 1 102.7 1 100.6 1 095.4 1 280.4 1 326.7 1 313.5
Intra-Eurosystem claims 3 147.2 3 150.5 4 156.1 3 134.6 3 155.7 3 158.2 3 214.5 3 221.9 3 242.0 3 266.9 3 281.3 3 393.3 3 349.8 3 372.7 3 412.2
Other assets 102.0 130.6 104.9 117.5 110.4 117.0 116.7 118.5 121.0 138.7 144.0 92.5 107.0 103.6 117.1
Total assets 7 701.4 7 610.7 8 629.1 7 592.9 7 662.6 7 649.1 7 733.1 7 748.2 7 857.6 7 832.9 7 824.1 8 024.5 8 740.9 8 729.2 9 053.0
6.

60
ASSETS AND LIABILITIES OF LATVIJAS BANKA (CONT.) (at end of period; millions of euro)
2014
I II III IV V VI VII VIII IX
LIABILITIES
Banknotes in circulation 3 669.7 3 626.4 3 615.8 3 636.0 3 643.9 3 650.8 3 680.0 3 684.8 3 684.3
Liabilities to euro area credit institutions related to monetary policy operations denominated in euro 2 052.3 2 178.0 2 136.8 1 956.2 2 039.5 1 008.6 745.9 702.2 838.9
Current accounts (covering the minimum reserve system) 1 417.3 1 218.9 1 191.8 1 206.2 999.5 1 008.6 745.9 702.2 838.9
Deposit facility 0 0 0 0 0 0 0 0 0
Fixed-term deposits 635.0 959.1 945.0 750.0 1 040.0 0 0 0 0
Fine-tuning reverse operations 0 0 0 0 0 0 0 0 0
Deposits related to margin calls 0 0 0 0 0 0 0 0 0
Other liabilities to euro area credit institutions denominated in euro 0 0 0 0 0 0 0 0 0
Liabilities to other euro area residents denominated in euro 1 179.2 1 059.3 641.7 1 265.1 557.3 119.5 129.1 147.0 135.9
General government 1 153.9 1 033.4 606.7 1 219.6 514.0 68.6 69.2 77.0 67.9
Other liabilities 25.3 25.9 35.0 45.4 43.3 50.9 60.0 70.0 68.0
Liabilities to non-euro area residents denominated in euro 46.5 19.8 3.3 27.5 62.0 9.3 5.2 28.9 5.4
Liabilities to euro area residents denominated in foreign currency 138.4 136.2 136.3 136.5 137.4 137.7 138.6 139.3 142.6
Liabilities to non-euro area residents denominated in foreign currency 0 0.7 0 0.9 0 0 0 0 0
Intra-Eurosystem liabilities 0 0 475.0 0 618.1 2 137.9 2 429.6 2 429.8 2 395.1
Other liabilities 141.8 113.0 1 149.4 123.0 141.6 121.5 141.0 143.6 179.3
Capital and reserves 473.6 477.3 470.8 447.6 462.7 463.8 463.7 472.7 476.1
Total liabilities 7 701.4 7 610.7 8 629.1 7 592.9 7 662.6 7 649.1 7 733.1 7 748.2 7 857.6
2015
X XI XII I II III
3 697.5 3 718.3 3 849.2 3 699.2 3 709.8 3 744.8
626.1 792.4 2 423.4 1 221.9 1 821.8 1 896.9
626.1 792.4 2 073.4 1 221.9 1 821.8 1 896.9
0 0 350.0 0 0 0
0 0 0 0 0 0
0 0 0 0 0 0
0 0 0 0 0 0
0 4.4 0.5 0 3.8 0
166.4 180.2 126.9 95.4 83.2 88.6
87.2 103.7 50.9 38.8 28.2 34.0
79.1 76.5 76.0 56.5 55.0 54.6
23.2 73.7 24.0 27.3 14.7 10.4
143.9 142.2 144.6 150.7 152.3 156.9
0 0 0 0 0 0
2 548.7 2 304.5 797.0 2 735.3 2 212.2 2 386.9
143.2 117.9 180.1 314.9 236.9 265.2
483.9 490.5 478.9 496.2 494.5 503.2
7 832.9 7 824.1 8 024.5 8 740.9 8 729.2 9 053.0
6.

61
AGGREGATED BALANCE SHEET OF MFIs (EXCLUDING LATVIJAS BANKA) (at end of period; millions of euro)
2014
I II III
ASSETS
Loans to euro area residents
18 862.1 18 964.8 18 177.0
General government 42.2 42.3 41.7
Other residents 13 712.3 13 647.5 13 574.7
MFIs 5 107.7 5 275.0 4 560.6
Holdings of securities other than shares issued by euro area residents 1 278.4 1 298.8 1 323.8
General government 786.2 787.9 784.9
Other residents 123.7 113.5 124.2
MFIs 368.5 397.4 414.7
Holdings of money market fund shares or units issued by euro area residents 4.3 4.2 4.2
Holdings of shares/other equity issued by euro area residents 650.9 650.0 626.6
External1 assets 7 028.6 7 063.0 6 774.3
Fixed assets 129.4 129.9 129.8
Remaining assets 882.3 837.6 903.1
Total assets 28 836.1 28 948.2 27 938.9
LIABILITIES
Currency in circulation x x x
Deposits of euro area residents 13 925.6 13 660.9 12 890.3
Central government 1 020.3 1 113.4 594.1
MFIs 2 553.5 2 349.7 2 004.6
Money market fund shares or units held by euro area residents 68.3 67.5 68.7
Debt securities issued with a maturity of over 2 years held by euro area residents 15.0 14.4 14.5
Capital and reserves 2 789.4 2 813.8 2 740.3
External1 liabilities 10 412.2 10 676.8 10 365.5
Remaining liabilities 1 625.6 1 714.8 1 859.6
Total liabilities 28 836.1 28 948.2 27 938.9
1 Non-euro area countries.
Other residents 10 351.8 10 197.9 10 291.6
IV V VI VII VIII IX
18 252.6 18 137.7 17 655.5 17 582.5 17 546.9 17 668.8
40.7 39.9 30.5 29.4 29.2 28.6
13 526.9 13 398.2 13 341.2 13 301.6 13 322.4 13 340.5
4 685.0 4 699.5 4 283.8 4 251.5 4 195.4 4 299.7
1 324.9 1 307.2 1 640.8 1 795.7 1 804.0 1 744.2
781.0 780.4 1 067.8 1 071.9 1 076.3 1 042.8
120.3 110.3 147.5 245.4 247.6 180.3
423.6 416.5 425.5 478.5 480.1 521.1
4.2 4.3 4.3 4.3 4.4 4.6
630.9 624.0 614.6 620.5 620.5 636.9
6 669.3 7 065.6 7 521.5 8 112.0 8 161.8 8 540.9
130.3 129.6 126.3 125.4 125.6 125.6
930.2 822.3 833.4 791.3 779.6 753.5
27 942.4 28 090.5 28 396.4 29 031.8 29 042.9 29 474.5
x x x x x x
12 737.3 12 824.4 13 285.1 13 471.6 13 472.1 13 623.5
586.5 948.0 1 300.6 1 306.1 1 316.4 1 405.1
10 163.6 10 111.1 10 150.1 10 197.3 10 340.1 10 354.9
1 987.1 1 765.3 1 834.4 1 968.2 1 815.7 1 863.5
70.7 69.3 67.6 65.2 65.2 63.3
16.9 17.0 17.5 18.1 19.0 19.2
2 804.8 2 873.8 2 899.4 2 928.3 2 957.9 2 941.5
10 500.0 10 553.5 10 419.0 10 880.6 10 834.2 11 203.6
1 812.8 1 752.6 1 707.8 1 668.1 1 694.4 1 623.3
27 942.4 28 090.5 28 396.4 29 031.8 29 042.9 29 474.5
2015
X XI XII I II III
17 789.0 17 796.9 19 600.1 17 872.3 17 836.4 17 766.6
29.8 30.8 58.1 79.0 79.5 79.0
13 309.1 13 295.4 13 005.2 13 103.1 13 004.1 12 983.8
4 450.2 4 470.7 6 536.8 4 690.2 4 752.8 4 703.8
1 723.1 1 696.8 1 764.4 1 981.2 2 022.7 1 786.3
1 015.4 946.0 834.0 1 026.8 1 077.2 1 005.2
177.5 191.1 292.0 280.4 268.7 159.3
530.3 559.8 638.4 674.0 676.7 621.8
4.6 4.6 4.7 5.0 0.5 0.5
653.6 667.2 644.8 713.7 725.4 715.3
8 531.6 8 919.2 7 800.6 9 148.8 9 328.9 9 832.6
124.7 124.1 126.0 125.1 123.9 137.9
796.6 800.6 912.0 918.9 888.3 999.4
29 623.3 30 009.4 30 852.6 30 765.0 30 926.1 31 238.6
x x x x x x
13 547.8 13 638.3 13 941.3 13 342.0 13 343.8 13 540.5
1 382.5 1 315.7 1 087.9 469.1 413.9 434.5
10 361.6 10 524.4 10 891.1 10 761.1 10 941.6 10 958.9
1 803.6 1 798.2 1 962.3 2 111.8 1 988.3 2 147.1
60.2 56.8 45.4 28.5 17.9 15.7
20.4 20.5 40.3 40.8 53.7 59.1
3 050.4 3 073.4 3 053.6 3 087.2 3 133.2 2 987.5
11 276.7 11 541.7 12 217.4 12 703.0 12 814.5 12 875.5
1 667.8 1 678.6 1 554.6 1 563.5 1 563.0 1 760.3
29 623.3 30 009.4 30 852.6 30 765.0 30 926.1 31 238.6
7.

62
CONSOLIDATED BALANCE SHEET OF MFIs (at end of period; millions of euro)
2015
I II III IV V VI VII VIII IX X XI XII I II III
ASSETS
Loans to residents 13 194.3 13 138.4 13 070.4 13 060.3 13 023.7 12 956.6 12 931.4 12 957.2 12 970.6 12 908.9 12 891.3 12 628.2 12 647.1 12 581.2 12 549.6
General government 42.2 42.3 41.7 40.7 39.9 30.5 29.4 29.2 28.6 29.8 30.8 58.1 79.0 79.5 79.0
Other residents 13 152.1 13 096.1 13 028.7 13 019.6 12 983.8 12 926.1 12 902.0 12 928.1 12 942.0 12 879.1 12 860.5 12 570.1 12 568.1 12 501.7 12 470.6
Holdings of securities other than shares issued by other residents 690.2 690.0 686.6 679.9 706.3 737.9 749.9 741.7 758.2 731.8 732.7 719.1 798.0 835.0 927.5
General government 661.6 661.8 658.5 651.3 670.7 702.4 713.5 705.7 721.2 694.7 696.9 682.3 759.0 800.6 892.4
Other residents 28.6 28.2 28.1 28.6 35.6 35.5 36.4 36.0 37.0 37.1 35.8 36.8 39.0 34.4 35.1
Holdings of shares and other equity issued by other residents 562.7 562.3 539.2 543.5 536.1 526.8 527.1 526.7 541.3 557.8 565.9 583.1 572.9 580.0 558.1
Foreign assets 18 644.0 18 793.9 18 892.2 18 058.6 18 355.2 19 640.4 20 622.9 20 702.5 20 999.1 21 477.2 21 696.0 21 264.9 23 083.2 22 744.7 23 155.4
Fixed assets 172.4 172.7 172.4 172.7 171.7 168.2 167.1 167.5 167.3 166.2 165.2 166.2 165.1 163.6 177.4
Remaining assets 456.7 443.8 502.8 538.0 471.0 477.3 446.9 442.3 429.9 424.9 420.4 489.6 425.4 397.0 439.9
Total assets 33 720.3 33 801.0 33 863.7 33 053.1 33 263.9 34 507.1 35 445.3 35 537.9 35 866.5 36 266.7 36 471.5 35 851.0 37 691.7 37 301.5 37 807.9
LIABILITIES
Currency outside MFIs 3 515.6 3 479.2 3 474.8 3 518.4 3 561.9 3 562.3 3 609.4 3 615.6 3 615.3 3 636.4 3 652.6 3 746.3 3 552.6 3 576.6 3 593.6
Deposits of central government 2 312.5 2 282.6 1 336.0 1 941.7 1 598.4 1 505.9 1 513.1 1 531.9 1 614.6 1 612.9 1 560.8 1 282.6 657.7 593.4 624.5
Deposits of other general government and other residents 9 150.2 9 176.0 9 165.8 9 093.5 9 091.7 9 150.1 9 189.4 9 292.0 9 241.2 9 284.7 9 413.1 9 733.0 9 530.4 9 661.2 9 733.0
Money market fund shares and units 67.8 67.0 68.2 70.1 68.7 67.0 64.6 64.6 62.8 59.7 56.2 44.8 28.0 17.4 15.2
Debt securities issued1 331.4 366.3 371.9 386.8 392.2 383.1 440.8 449.9 468.4 516.0 487.3 63.2 60.7 58.0 63.3
Capital and rezerves 3 263.0 3 291.1 3 211.2 3 252.3 3 336.5 3 363.1 3 392.0 3 430.6 3 417.6 3 534.3 3 563.9 3 532.5 3 583.4 3 627.8 3 490.7
External liabilities1 13 648.2 13 671.9 13 546.6 13 203.5 13 709.2 14 981.0 15 808.4 15 719.4 16 022.7 16 199.4 16 248.3 16 092.4 18 746.3 18 231.3 18 566.2
Remaining liabilities 1 439.0 1 474.5 2 697.4 1 585.7 1 513.6 1 502.6 1 435.6 1 441.8 1 437.2 1 436.3 1 501.4 1 372.6 1 546.5 1 535.7 1 721.7
Excess of inter-MFI liabilities –7.3 –7.5 –8.1 1.0 –8.4 –8.1 –8.0 –8.0 –13.4 –12.9 –12.2 –16.4 –13.9 0.1 –0.3
Total liabilities 33 720.3 33 801.0 33 863.7 33 053.1 33 263.9 34 507.1 35 445.3 35 537.9 35 866.5 36 266.7 36 471.5 35 851.0 37 691.7 37 301.5 37 807.9
1 The debt securities issued are presented in accordance with the residence of a holder, i.a. in the position "External liabilities" or "Debt securities issued" starting with December 2014.
2014
8.

63
AGGREGATED BALANCE SHEET OF MFIs (EXCLUDING LATVIJAS BANKA ) (at end of period; millions of euro)
2015
I II III IV V VI VII VIII IX X XI XII I II III
MFI reserves 2 316.2 2 426.2 2 377.3 2 174.1 2 223.2 1 200.0 919.4 876.4 1 012.2 792.7 964.5 2 635.0 1 411.4 1 998.9 2 092.0
Vault cash in euro 264.0 248.7 240.5 217.9 183.6 191.4 173.5 174.3 173.3 166.6 172.1 211.3 189.5 177.1 195.1
Deposits with Latvijas Banka 2 052.3 2 177.5 2 136.8 1 956.2 2 039.5 1 008.6 745.9 702.2 838.9 626.1 792.4 2 423.7 1 221.9 1 821.8 1 896.9
Foreign assets 11 081.9 11 233.4 10 311.6 10 514.2 10 736.8 12 035.3 12 939.5 13 004.2 13 216.3 13 712.8 13 940.1 13 369.4 14 482.5 14 168.8 14 404.8
Claims on the central government 668.9 669.1 665.3 657.6 676.6 708.6 719.6 711.5 726.4 699.6 707.2 718.0 799.5 828.2 846.3
Loans 7.6 7.5 7.1 6.6 6.1 6.4 6.4 6.1 5.5 5.2 10.6 36.6 53.1 52.9 52.6
Holdings of securities other than shares 661.3 661.5 658.2 651.0 670.5 702.2 713.2 705.4 720.9 694.5 696.6 681.3 746.4 775.3 793.7
Claims on the local government 34.9 35.0 34.9 34.4 34.0 24.4 23.3 23.4 23.4 24.9 20.4 21.7 26.2 26.9 26.7
Loans 34.6 34.7 34.6 34.1 33.8 24.1 23.0 23.1 23.1 24.6 20.1 21.4 25.9 26.6 26.4
Holdings of securities other than shares 0.3 0.3 0.3 0.3 0.3 0.3 0.3 0.3 0.3 0.3 0.3 0.3 0.3 0.3 0.3
Claims on the financial institutions 845.5 839.6 856.5 941.2 959.1 958.6 980.0 987.1 1 018.3 1 048.0 1 044.3 1 060.9 1 039.6 1 041.2 1 034.6
Loans 393.6 390.0 417.5 496.9 506.3 515.7 535.5 542.9 566.4 579.6 569.1 569.0 555.8 554.4 568.9
Holdings of securities other than shares 9.8 9.3 9.1 9.6 18.0 17.6 18.5 18.5 20.0 20.0 18.7 20.5 22.7 18.2 18.9
Holdings of shares and other equity 442.1 440.3 429.8 434.7 434.8 425.2 426.0 425.6 431.9 448.4 456.5 471.4 461.2 468.7 446.8
Claims on public non-financial corporations 777.3 768.5 763.3 759.5 756.3 747.6 744.5 743.1 731.6 721.5 709.3 678.3 657.0 655.4 653.5
Loans 774.3 765.4 760.1 756.3 753.1 743.9 740.8 739.8 728.8 718.6 706.5 676.1 654.9 653.3 651.5
Holdings of securities other than shares 3.0 3.1 3.2 3.2 3.2 3.7 3.7 3.3 2.8 2.9 2.9 2.1 2.1 2.1 2.0
Holdings of shares and other equity 0 0 0 0 0 0 0 0 0 0 0 0 0 0 0
Claims on private non-financial corporations 6 159.8 6 147.6 6 080.4 6 033.4 6 013.3 5 988.6 5 966.9 6 016.0 6 020.1 5 974.2 5 995.7 5 828.4 5 865.9 5 832.3 5 797.6
Loans 6 023.4 6 009.9 5 955.1 5 908.7 5 897.6 5 872.9 5 851.6 5 900.7 5 896.4 5 850.5 5 872.0 5 702.5 5 740.0 5 706.7 5 672.1
Holdings of securities other than shares 15.7 15.8 15.8 15.8 14.4 14.2 14.2 14.2 14.2 14.2 14.2 14.1 14.2 14.2 14.2
Holdings of shares and other equity 120.6 121.9 109.4 108.9 101.3 101.6 101.1 101.1 109.4 109.4 109.4 111.7 111.7 111.4 111.3
Claims on households 5 960.8 5 930.8 5 896.0 5 857.7 5 826.8 5 793.5 5 774.1 5 744.7 5 750.4 5 730.3 5 712.9 5 622.5 5 617.4 5 587.3 5 578.1
Loans 5 960.8 5 930.8 5 896.0 5 857.7 5 826.8 5 793.5 5 774.1 5 744.7 5 750.4 5 730.3 5 712.9 5 622.5 5 617.4 5 587.3 5 578.1
Holdings of securities other than shares 0 0 0 0 0 0 0 0 0 0 0 0 0 0 0
Fixed assets 129.4 129.9 129.8 130.3 129.6 126.3 125.4 125.6 125.6 124.7 124.1 126.0 125.1 123.9 137.9
Other assets 455.7 441.2 500.8 535.9 468.9 475.2 444.8 440.2 427.8 422.9 418.4 488.3 423.1 393.9 436.0
Claims on resident MFIs 405.1 326.3 322.6 303.6 265.4 337.8 393.7 370.2 421.9 371.1 372.0 303.7 316.9 268.8 230.5
Holdings of MFI securities other than shares 0 0 0 0 0 0 0 0 0 0 0 0 0 0 0
Money market fund shares and units 0.5 0.5 0.5 0.5 0.5 0.5 0.5 0.5 0.5 0.5 0.5 0.5 0.5 0.5 0.5
Holdings of MFI shares and other equity 0 0 0 0 0 0 0 0 0 0 0 0 0 0 0
TOTAL ASSETS 28 836.1 28 948.2 27 938.9 27 942.4 28 090.5 28 396.4 29 031.8 29 042.9 29 474.5 29 623.3 30 009.4 30 852.6 30 765.0 30 926.1 31 238.6
2014
9.a

64
AGGREGATED BALANCE SHEET OF MFIs (EXCLUDING LATVIJAS BANKA) (at end of period; millions of euro)
2015
I II III IV V VI VII VIII IX X XI XII I II III
Overnight deposits in euro
5 729.9 5 752.3 5 663.9 5 714.3 5 662.9 5 773.0 5 886.6 5 945.4 5 869.3 5 903.8 5 983.4 6 312.7 6 150.6 6 219.8 6 244.4
Financial institutions 323.8 343.5 275.9 281.9 310.3 325.9 346.1 372.3 269.4 265.3 295.9 402.9 375.1 398.8 349.2
Public non-financial corporations 289.6 302.1 330.4 352.7 298.9 298.4 302.5 309.1 314.8 318.6 306.8 283.7 287.2 295.5 333.3
Private non-financial corporations 2 299.1 2 287.1 2 254.5 2 191.7 2 191.3 2 212.9 2 259.5 2 290.3 2 261.6 2 274.8 2 298.6 2 464.5 2 355.3 2 380.5 2 417.9
Households 2 817.4 2 819.6 2 803.1 2 888.1 2 862.3 2 935.8 2 978.5 2 973.7 3 023.5 3 045.1 3 082.0 3 161.6 3 133.0 3 145.0 3 144.1
Time deposits in euro 1 941.5 1 910.2 1 973.2 1 872.6 1 858.3 1 808.7 1 711.0 1 689.0 1 704.8 1 654.1 1 671.5 1 609.8 1 520.8 1 521.6 1 502.4
Financial institutions 350.1 348.7 381.7 328.0 322.5 309.6 301.2 295.0 311.7 283.8 289.5 285.4 284.3 258.6 250.5
Public non-financial corporations 245.9 218.5 235.1 217.5 199.6 187.8 182.2 181.3 175.5 159.5 146.9 120.7 58.9 58.8 80.5
Private non-financial corporations 293.9 285.0 310.9 299.0 313.3 307.0 251.2 236.2 237.5 217.3 252.5 251.4 253.8 296.9 266.5
Households 1 051.6 1 058.0 1 045.5 1 028.0 1 022.9 1 004.3 976.3 976.6 980.0 993.6 982.7 952.2 923.8 907.3 904.9
Deposits redeemable at notice in euro 444.5 450.5 453.7 462.0 471.2 488.4 496.7 499.5 508.2 522.7 536.2 632.8 639.1 655.2 637.7
Financial institutions 16.3 19.9 9.8 5.5 6.8 8.7 4.9 3.1 2.5 7.2 14.4 21.1 21.5 14.8 1.8
Public non-financial corporations 16.1 12.5 12.8 13.0 13.2 13.2 13.4 13.6 13.9 14.1 14.3 13.3 0.8 15.3 15.9
Private non-financial corporations 33.0 29.0 34.7 36.7 37.3 41.2 42.2 38.1 39.1 40.5 36.9 59.1 60.3 56.5 46.8
Households 379.1 389.1 396.4 406.8 413.9 425.3 436.2 444.7 452.8 460.9 470.6 539.3 556.5 568.6 573.1
Repos in euro 0 0 0 0 0 0 0 0 0 0 0 0 0 0 0
Foreign currency deposits of residents 820.8 840.9 826.2 788.1 828.6 813.2 823.8 863.3 876.6 908.2 922.2 921.5 965.3 994.5 1 055.0
Financial institutions 36.1 34.5 39.9 30.4 34.6 36.3 35.5 45.1 38.7 55.7 52.2 60.3 57.1 64.5 51.3
Public non-financial corporations 3.8 3.9 4.0 4.3 3.7 5.6 5.9 5.8 7.4 9.7 9.3 8.0 6.2 7.1 7.8
Private non-financial corporations 275.9 293.6 268.9 243.9 278.2 262.7 265.5 276.6 287.6 290.4 312.6 300.0 314.2 323.8 381.1
Households 504.9 508.8 513.4 509.5 512.2 508.6 516.9 535.8 542.9 552.3 548.1 553.2 587.8 599.1 614.8
Deposits of central government 1 019.3 1 112.2 593.1 585.6 947.0 1 299.6 1 305.3 1 315.6 1 404.0 1 381.8 1 314.9 1 087.2 468.2 412.9 433.6
Overnight deposits in euro 44.4 42.2 32.4 38.0 34.1 28.3 46.9 25.7 136.7 130.5 178.2 204.4 134.6 195.7 214.6
Time deposits in euro 969.2 1 062.7 553.3 541.9 905.9 1 260.4 1 250.1 1 283.1 1 260.5 1 245.5 1 130.7 877.0 315.6 190.5 174.6
Deposits redeemable at notice and repos in euro 0.6 0.6 0.6 2.6 2.6 2.6 2.6 2.6 2.6 2.6 1.9 1.7 13.2 22.2 39.4
Foreign currency deposits 5.1 6.7 6.8 3.1 4.4 8.3 5.7 4.2 4.2 3.2 4.1 4.1 4.8 4.5 5.0
Deposits of local government 188.9 197.9 215.3 213.7 228.3 216.0 212.0 226.1 214.8 218.5 223.2 180.3 198.1 215.1 238.9
Overnight deposits in euro 185.1 193.9 210.9 208.6 223.5 212.5 208.1 222.3 210.7 214.4 219.3 176.4 194.1 211.4 235.3
Time deposits in euro 0.8 0.8 1.1 0.8 0.8 0.5 0.4 0.4 0.4 0.4 0.7 0.7 0.7 0.4 0.3
Deposits redeemable at notice and repos in euro 2.3 2.6 2.7 3.0 3.0 3.0 3.5 3.5 3.7 3.7 3.2 3.2 3.2 3.2 3.2
Foreign currency deposits 0.7 0.6 0.6 1.4 1.0 0 0 0 0.1 0.1 0.1 0.1 0.1 0.1 0.1
2014
9.b
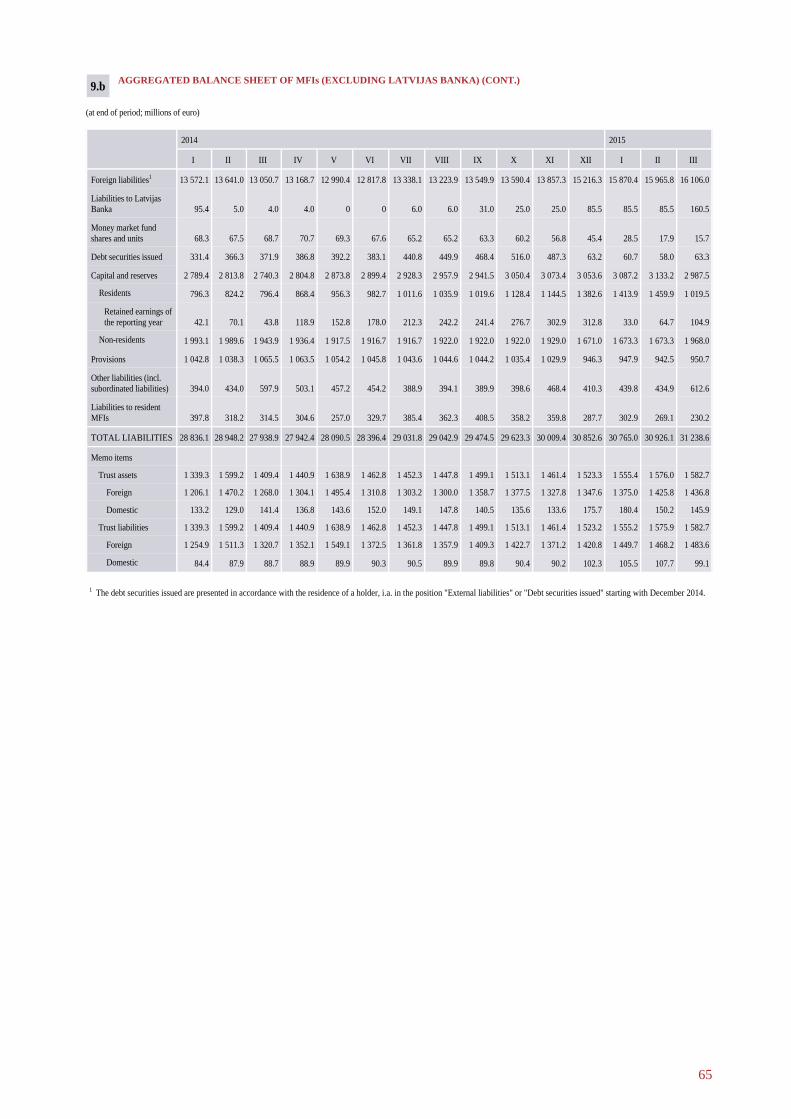
65
AGGREGATED BALANCE SHEET OF MFIs (EXCLUDING LATVIJAS BANKA) (CONT.) (at end of period; millions of euro)
2015
I II III IV V VI VII VIII IX X XI XII I II III
Foreign liabilities1 13 572.1 13 641.0 13 050.7 13 168.7 12 990.4 12 817.8 13 338.1 13 223.9 13 549.9 13 590.4 13 857.3 15 216.3 15 870.4 15 965.8 16 106.0
Liabilities to Latvijas Banka 95.4 5.0 4.0 4.0 0 0 6.0 6.0 31.0 25.0 25.0 85.5 85.5 85.5 160.5
Money market fund shares and units 68.3 67.5 68.7 70.7 69.3 67.6 65.2 65.2 63.3 60.2 56.8 45.4 28.5 17.9 15.7
Debt securities issued 331.4 366.3 371.9 386.8 392.2 383.1 440.8 449.9 468.4 516.0 487.3 63.2 60.7 58.0 63.3
Capital and reserves 2 789.4 2 813.8 2 740.3 2 804.8 2 873.8 2 899.4 2 928.3 2 957.9 2 941.5 3 050.4 3 073.4 3 053.6 3 087.2 3 133.2 2 987.5
Residents 796.3 824.2 796.4 868.4 956.3 982.7 1 011.6 1 035.9 1 019.6 1 128.4 1 144.5 1 382.6 1 413.9 1 459.9 1 019.5
Retained earnings of the reporting year 42.1 70.1 43.8 118.9 152.8 178.0 212.3 242.2 241.4 276.7 302.9 312.8 33.0 64.7 104.9
Non-residents 1 993.1 1 989.6 1 943.9 1 936.4 1 917.5 1 916.7 1 916.7 1 922.0 1 922.0 1 922.0 1 929.0 1 671.0 1 673.3 1 673.3 1 968.0
Provisions 1 042.8 1 038.3 1 065.5 1 063.5 1 054.2 1 045.8 1 043.6 1 044.6 1 044.2 1 035.4 1 029.9 946.3 947.9 942.5 950.7
Other liabilities (incl. subordinated liabilities) 394.0 434.0 597.9 503.1 457.2 454.2 388.9 394.1 389.9 398.6 468.4 410.3 439.8 434.9 612.6
Liabilities to resident MFIs 397.8 318.2 314.5 304.6 257.0 329.7 385.4 362.3 408.5 358.2 359.8 287.7 302.9 269.1 230.2
TOTAL LIABILITIES 28 836.1 28 948.2 27 938.9 27 942.4 28 090.5 28 396.4 29 031.8 29 042.9 29 474.5 29 623.3 30 009.4 30 852.6 30 765.0 30 926.1 31 238.6
Memo items
Trust assets 1 339.3 1 599.2 1 409.4 1 440.9 1 638.9 1 462.8 1 452.3 1 447.8 1 499.1 1 513.1 1 461.4 1 523.3 1 555.4 1 576.0 1 582.7
Foreign 1 206.1 1 470.2 1 268.0 1 304.1 1 495.4 1 310.8 1 303.2 1 300.0 1 358.7 1 377.5 1 327.8 1 347.6 1 375.0 1 425.8 1 436.8
Domestic 133.2 129.0 141.4 136.8 143.6 152.0 149.1 147.8 140.5 135.6 133.6 175.7 180.4 150.2 145.9
Trust liabilities 1 339.3 1 599.2 1 409.4 1 440.9 1 638.9 1 462.8 1 452.3 1 447.8 1 499.1 1 513.1 1 461.4 1 523.2 1 555.2 1 575.9 1 582.7
Foreign 1 254.9 1 511.3 1 320.7 1 352.1 1 549.1 1 372.5 1 361.8 1 357.9 1 409.3 1 422.7 1 371.2 1 420.8 1 449.7 1 468.2 1 483.6
Domestic 84.4 87.9 88.7 88.9 89.9 90.3 90.5 89.9 89.8 90.4 90.2 102.3 105.5 107.7 99.1
2014
9.b
1 The debt securities issued are presented in accordance with the residence of a holder, i.a. in the position "External liabilities" or "Debt securities issued" starting with December 2014.

66
MONETARY SURVEY OF MFIs (EXCLUDING LATVIJAS BANKA) (at end of period; millions of euro)
Overnight deposits (resident) Deposits with agreed maturity and redeemable at notice (resident) Total
Households Financial institutions and private non-financial corporations
Public non-financial corporations
Households Financial institutions and private non-financial corporations
Public non-financial corporations
I 6 295.9 3 099.2 2 903.9 292.9 2 640.7 1 653.7 724.4 262.6 8 936.6
II 6 350.9 3 116.0 2 929.4 305.4 2 603.1 1 659.5 712.1 231.5 8 954.0
III 6 250.6 3 103.9 2 812.9 333.8 2 666.4 1 654.5 763.4 248.4 8 917.0
IV 6 254.3 3 182.9 2 714.5 356.9 2 582.8 1 649.5 702.7 230.6 8 837.0
V 6 240.2 3 158.8 2 779.2 302.1 2 580.9 1 652.6 715.1 213.2 8 821.1
VI 6 344.9 3 236.0 2 805.3 303.6 2 538.3 1 638.1 698.9 201.4 8 883.2
VII 6 454.4 3 286.3 2 861.4 306.7 2 463.8 1 621.7 644.9 197.2 8 918.1
VIII 6 548.0 3 297.2 2 937.5 313.3 2 449.2 1 633.5 619.2 196.5 8 997.2
IX 6 471.9 3 348.6 2 804.4 318.9 2 487.0 1 650.7 643.7 192.6 8 959.0
X 6 542.8 3 379.6 2 838.8 324.4 2 446.0 1 672.3 596.2 177.5 8 988.8
XI 6 631.4 3 417.7 2 901.6 312.2 2 481.9 1 665.9 650.9 165.2 9 113.4
XII 6 959.0 3 492.2 3 179.3 287.6 2 517.7 1 714.1 665.4 138.1 9 476.7
2015
I 6 840.6 3 488.1 3 061.7 290.8 2 435.2 1 712.9 659.9 62.3 9 275.8
II 6 914.0 3 508.8 3 107.5 297.7 2 477.0 1 711.2 686.8 79.0 9 391.0
III 6 990.5 3 516.7 3 137.8 336.0 2 449.0 1 720.2 627.3 101.5 9 439.5
2014
Net foreign assets
Net domestic assets Total
Credit to residents Other items (net)
General government (net)
Households Financial institutions and private non-financial corporations
Public non-financial corporations
I –2 490.2 13 239.0 –504.4 5 960.8 7 005.3 777.3 –1 812.1 11 426.8 8 936.6
II –2 407.6 13 080.5 –606.1 5 930.8 6 987.3 768.5 –1 718.9 11 361.6 8 954.0
III –2 739.1 13 487.8 –108.3 5 896.0 6 936.8 763.3 –1 831.7 11 656.1 8 917.0
IV –2 654.5 13 484.5 –107.3 5 857.7 6 974.6 759.5 –1 993.0 11 491.5 8 837.0
V –2 253.6 13 090.7 –464.7 5 826.8 6 972.3 756.3 –2 016.0 11 074.7 8 821.1
VI –782.5 12 705.7 –782.6 5 793.5 6 947.2 747.6 –3 040.0 9 665.7 8 883.2
VII –398.6 12 691.1 –774.4 5 774.1 6 946.9 744.5 –3 374.4 9 316.7 8 918.1
VIII –219.7 12 683.9 –806.9 5 744.7 7 003.0 743.1 –3 467.0 9 216.9 8 997.2
IX –333.6 12 651.3 –869.0 5 750.4 7 038.3 731.6 –3 358.7 9 292.6 8 959.0
X 122.3 12 598.2 –875.7 5 730.3 7 022.1 721.5 –3 731.7 8 866.5 8 988.8
XI 82.8 12 651.8 –810.4 5 712.9 7 040.0 709.3 –3 621.2 9 030.6 9 113.4
XII –1 847.9 12 662.4 –527.7 5 622.5 6 889.3 678.3 –1 337.8 11 324.6 9 476.7
2015
I –1 388.0 13 339.4 159.5 5 617.4 6 905.5 657.0 –2 675.6 10 663.8 9 275.8
II –1 797.0 13 343.3 227.1 5 587.3 6 873.5 655.4 –2 155.3 11 188.0 9 391.0
III –1 701.1 13 264.3 200.5 5 578.1 6 832.2 653.5 –2 123.7 11 140.6 9 439.5
2014
10.

67
FOREIGN ASSETS AND LIABILITIES OF MFIs (EXCLUDING LATVIJAS BANKA) (at end of period; millions of euro)
2015
I II III IV V VI VII VIII IX X XI XII I II III
Claims on MFIs 7 471.6 7 445.4 6 589.3 6 558.2 6 840.5 7 778.9 8 306.8 8 360.1 8 654.2 8 886.2 9 066.9 8 400.8 9 006.7 8 471.4 8 183.3
Loans
Overnight 4 746.2 4 957.8 4 324.0 4 020.0 4 434.3 4 689.7 4 939.7 4 579.1 5 154.1 5 281.2 5 501.5 5 211.5 5 376.7 4 919.6 4 883.6
Short-term 1 791.9 1 539.6 1 300.3 1 586.0 1 425.8 2 081.0 2 227.4 2 641.7 2 258.5 2 288.3 2 208.3 1 770.9 2 197.2 2 081.3 1 762.5
Long-term 53.8 54.5 42.3 42.2 42.7 42.4 39.0 36.6 42.7 31.3 31.4 41.3 43.4 31.3 23.4
Redeemable at notice
20.2 28.7 20.7 20.7 8.5 8.5 0 0 0 0 0 67.3 0 3.0 0
Holdings of securities other than shares 776.6 782.1 819.3 806.8 846.7 874.7 1 013.1 1 015.0 1 111.0 1 127.9 1 168.2 1 165.8 1 245.1 1 294.3 1 372.5
Holdings of shares and other equity 5.1 5.0 5.0 4.9 4.9 4.9 4.9 5.0 5.2 5.2 5.2 5.3 5.5 1.1 1.2
Other claims 77.7 77.7 77.7 77.7 77.7 77.7 82.7 82.7 82.7 152.3 152.3 138.8 138.8 140.8 140.0
Claims on non-MFIs 3 388.0 3 592.7 3 508.4 3 732.0 3 673.2 4 041.4 4 412.5 4 422.5 4 368.2 4 577.7 4 619.9 4 709.7 5 128.2 5 342.0 5 811.3
Loans
Short-term 675.7 674.6 597.6 665.5 552.7 494.8 655.4 668.8 596.5 717.6 735.9 712.1 787.3 806.8 839.5
Long-term 1 197.9 1 185.2 1 168.2 1 168.9 1 190.4 1 173.9 1 140.8 1 162.1 1 188.2 1 261.5 1 259.7 1 286.6 1 318.5 1 315.5 1 368.9
Holdings of securities other than shares
General govern-ment sector 881.2 1 098.9 1 076.7 1 183.9 1 219.7 1 623.2 1 748.2 1 651.2 1 610.4 1 611.6 1 605.6 1 629.6 1 838.1 2 022.1 2 222.9
Private sector 530.1 529.2 563.0 610.2 604.5 643.2 760.9 832.0 863.0 874.8 901.8 1 005.1 1 072.3 1 084.0 1 253.7
Holdings of shares and other equity 54.0 55.8 53.8 54.5 57.0 57.3 58.3 59.5 60.9 63.0 61.6 28.7 64.4 66.0 69.1
Other claims 49.1 49.0 49.0 49.0 49.0 49.0 49.0 49.0 49.2 49.2 55.4 47.6 47.6 47.6 57.1
Vault cash in foreign currencies 59.6 47.7 52.1 47.6 53.4 48.2 47.1 56.5 41.5 41.8 43.2 45.4 41.2 38.2 42.2
Other assets
Other assets 162.7 147.6 161.8 176.4 169.7 166.8 173.0 165.1 152.4 207.0 210.1 212.5 306.3 317.3 368.0
Total foreign assets 11 081.9 11 233.4 10 311.6 10 514.2 10 736.8 12 035.3 12 939.5 13 004.2 13 216.3 13 712.8 13 940.1 13 368.4 14 482.5 14 168.9 14 404.8
Memo items
Trust assets 1 206.1 1 470.2 1 268.0 1 304.1 1 495.4 1 310.8 1 303.2 1 300.0 1 358.7 1 377.5 1 327.8 1 347.6 1 375.0 1 425.8 1 436.8
2014
11.a

68
SELECTED ITEMS IN THE MONTHLY FINANCIAL POSITION REPORT OF MFIs (EXCLUDING LATVIJAS BANKA) BY GROUP OF COUNTRIES (excluding Latvia; at end of period; millions of euro)
Claims on MFIs Loans to non-MFIs Liabilities to MFIs Deposits by non-MFIs
EU Other countries and international institutions
EU Other countries and international institutions
EU Other countries and international institutions
EU Other countries and international institutions
incl. euro area countries
incl. euro area countries
incl. euro area countries
incl. euro area countries
2014
I 4 785.6 2 650.3 1 826.6 901.4 560.2 972.2 3 174.4 2 060.4 839.1 3 030.3 1 227.2 6 345.5
II 4 799.6 2 771.2 1 781.1 902.4 551.4 957.4 3 333.7 2 026.4 840.5 2 830.3 1 047.2 6 407.5
III 3 949.1 2 101.3 1 738.3 824.6 546.0 941.3 2 898.0 1 686.1 823.8 2 893.8 1 160.2 6 252.8
IV 4 095.4 2 425.2 1 573.4 861.1 507.3 973.3 2 799.4 1 678.6 859.3 2 868.2 1 113.8 6 424.3
V 4 320.7 2 394.6 1 590.6 739.5 414.5 1 003.6 2 560.4 1 508.3 822.4 2 922.9 1 062.6 6 472.3
VI 5 270.6 2 937.4 1 551.0 684.1 415.1 984.6 2 441.0 1 504.8 717.1 3 004.2 1 051.9 6 475.8
VII 5 488.1 3 111.9 1 718.1 762.1 399.7 1 034.1 2 574.4 1 576.8 715.9 3 056.9 1 068.0 6 788.4
VIII 5 562.3 3 123.0 1 695.1 758.7 394.3 1 072.2 2 385.5 1 447.4 720.3 3 153.2 1 117.5 6 742.7
IX 5 509.8 3 039.0 1 945.5 664.5 398.5 1 120.2 2 394.5 1 424.0 725.8 3 273.7 1 182.1 7 001.0
X 5 822.0 3 453.0 1 778.8 817.5 430.0 1 161.6 2 400.9 1 420.4 721.9 3 289.1 1 155.1 6 982.5
XI 5 893.4 3 306.3 1 847.8 811.5 434.9 1 184.1 2 466.1 1 413.4 720.3 3 445.5 1 188.6 7 080.7
XII 5 079.7 3 809.4 2 012.1 796.1 435.2 1 202.7 2 635.7 1 589.2 743.0 3 665.0 1 234.8 7 561.3
2015
I 5 910.9 3 151.4 1 706.4 830.3 535.0 1 275.5 2 784.3 1 723.4 744.6 3 853.1 1 288.1 7 870.5
II 5 308.8 2 662.2 1 726.3 801.5 502.4 1 320.8 2 683.9 1 633.7 740.5 3 935.1 1 336.4 7 932.0
III 4 998.6 2 576.4 1 671.0 823.4 513.2 1 385.0 2 706.9 1 756.4 699.7 3 926.3 1 281.4 8 065.9
FOREIGN ASSETS AND LIABILITIES OF MFIs (EXCLUDING LATVIJAS BANKA) (at end of period; millions of euro)
2014 2015
I II III IV V VI VII VIII IX X XI XII I II III
Overnight 859.4 889.5 615.9 447.9 400.0 287.8 531.4 516.3 553.1 547.5 468.0 384.5 733.5 681.1 642.1
Short-term 392.7 523.3 450.2 587.5 388.7 448.3 409.0 268.1 458.4 482.0 663.8 1 049.1 1 088.0 1 203.6 1 304.7
Long-term 2 761.5 2 761.4 2 655.7 2 623.3 2 594.1 2 421.9 2 349.9 2 321.4 2 108.7 2 093.4 2 054.6 1 945.1 1 707.4 1 539.6 1 459.7
Redeemable at notice 0 0 0 0 0 0 0 0 0 0 0 0 0 0 0
Of which liabilities to associated and affiliated MFIs 3 950.1 4 111.3 3 650.6 3 552.9 3 307.1 3 101.0 3 200.0 3 024.0 3 049.7 3 055.7 3 122.5 3 303.3 3 457.4 3 356.2 3 342.0
Non-MFI deposits
Overnight 8 460.3 8 343.6 8 243.7 8 367.8 8 494.2 8 601.7 8 886.6 8 932.7 9 301.9 9 290.2 9 570.8 10 213.5 10 746.0 10 878.3 10 987.0
Short-term 329.8 315.8 331.7 350.8 324.6 307.5 368.3 356.6 338.9 349.7 322.8 329.1 290.9 295.2 286.7
Long-term 501.5 497.5 488.7 498.4 500.5 496.2 510.6 523.9 540.5 541.5 538.9 556.0 578.0 588.4 615.8
Redeemable at notice 84.1 80.8 82.4 75.4 75.8 74.5 79.7 82.6 93.4 90.3 93.6 127.8 108.6 105.2 102.6
Other liabilities
Other liabilities1 182.8 229.0 182.4 217.7 212.4 179.8 202.5 222.3 155.0 195.9 144.8 611.2 618.0 674.3 707.3
Total foreign liabilities2 13 572.1 13 641.0 13 050.7 13 168.7 12 990.4 12 817.8 13 338.1 13 223.9 13 549.9 13 590.4 13 857.3 15 216.3 15 870.4 15 965.7 16 106.0
Memo items
Trust liabilities 1 254.9 1 511.3 1 320.7 1 352.1 1 549.1 1 372.5 1 361.8 1 357.9 1 409.3 1 422.7 1 371.2 1 420.8 1 449.7 1 468.2 1 483.6
1 Including subordinated liabilities. 2 The debt securities issued are presented in accordance with residence of a holder starting with December 2014.
Liabilities to MFIs
11.b
12.

69
MATURITY PROFILE OF DEPOSITS OF RESIDENT FINANCIAL INSTITUTIONS, NON-FINANCIAL CORPORATIONS AND HOUSEHOLDS (at end of period; millions of euro)
2015
I II III IV V VI VII VIII IX X XI XII I II III
Overnight deposits
Amount 6 295.9 6 350.9 6 250.6 6 254.3 6 240.2 6 344.9 6 454.4 6 548.0 6 471.9 6 542.8 6 631.4 6 959.0 6 840.6 6 914.0 6 990.5
%1 70.5 70.9 70.1 70.7 70.7 71.4 72.4 72.8 72.2 72.8 72.8 73.4 73.7 73.6 74.1
Time deposits
Maturity of 1–6 months
Amount 617.1 598.3 629.5 573.8 548.8 497.2 458.1 417.1 419.9 383.4 428.2 372.4 305.8 346.0 353.1
%1 6.9 6.7 7.1 6.5 6.2 5.6 5.1 4.6 4.7 4.3 4.7 3.9 3.3 3.7 3.7
Maturity of 6–12 months
Amount 923.3 899.2 929.2 916.6 940.9 935.2 892.1 908.1 934.4 899.1 885.5 860.4 831.2 826.1 786.8
%1 10.3 10.1 10.4 10.4 10.7 10.5 10.0 10.1 10.4 10.0 9.7 9.1 9.0 8.8 8.3
Long-term
Amount 618.2 617.0 616.2 591.6 580.0 577.5 576.2 583.6 581.7 599.5 591.6 600.1 602.6 593.4 612.5
%1 6.9 6.9 6.9 6.7 6.6 6.5 6.5 6.4 6.5 6.7 6.5 6.3 6.5 6.3 6.5
Maturity of 1–2 years
Amount 299.3 299.9 293.7 280.7 268.3 268.7 267.6 274.0 268.0 270.9 262.7 267.4 266.8 259.1 278.6
%1 3.3 3.4 3.3 3.2 3.0 3.0 3.0 3.0 3.0 3.0 2.9 2.8 2.9 2.8 3.0
Maturity of over 2 years
Amount 318.9 317.2 322.4 310.9 311.7 308.8 308.5 309.7 313.8 328.6 328.9 332.7 335.7 334.3 333.9
%1 3.6 3.5 3.6 3.5 3.5 3.5 3.5 3.4 3.5 3.7 3.6 3.5 3.6 3.6 3.5
Deposits redeemable at notice
Up to 3 months
Amount 478.6 485.0 487.9 497.3 507.6 523.8 532.8 535.7 546.2 559.3 571.9 679.9 690.5 706.5 691.6
%1 5.4 5.4 5.5 5.6 5.8 5.9 5.9 6.0 6.1 6.1 6.2 7.2 7.4 7.5 7.3
Over 3 months
Amount 3.5 3.5 3.5 3.5 3.6 4.6 4.7 4.6 4.7 4.7 4.6 4.7 5.0 5.1 5.1
%1 0 0 0 0 0 0.1 0.1 0.1 0.1 0.1 0.1 0.1 0.1 0.1 0.1
Repos
Amount 0 0 0 0 0 0 0 0 0 0 0 0 0 0 0
%1 0 0 0 0 0 0 0 0 0 0 0 0 0 0 0
Total deposits 8 936.7 8 953.9 8 917.0 8 837.0 8 821.1 8 883.2 8 918.1 8 997.2 8 959.0 8 988.8 9 113.4 9 476.7 9 275.8 9 391.1 9 439.5
1 As percent of total deposits of resident financial institutions, non-financial corporations and households.
2014
13.

70
DEPOSITS BY FINANCIAL INSTITUTIONS (at end of period; millions of euro)
Overnight With agreed maturity Redeemable at notice Repos
Up to 1 year 1–2 years Over 2 years Up to 3 months Over 3 months In euro
Insurance corporations and pension funds1
2014
I 215.8 84.8 83.1 50.3 0.4 0 0 434.4 411.1
II 233.2 71.6 85.0 50.4 0.4 0 0 440.6 417.1
III 177.4 117.5 89.5 50.8 0.6 0 0 435.9 408.7
IV 192.6 81.8 75.2 47.1 0.5 0 0 397.2 377.9
V 212.2 75.5 74.3 47.1 0.4 0 0 409.4 391.4
VI 241.4 61.4 76.8 46.8 0.4 0 0 426.7 408.4
VII 257.7 51.5 76.8 45.6 0.3 0 0 432.0 412.5
VIII 281.8 53.1 84.2 44.9 0.3 0 0 464.3 430.5
IX 182.5 78.4 79.5 41.8 0.3 0 0 382.5 363.5
X 172.5 60.4 72.4 41.0 0.4 0 0 346.7 319.2
XI 186.2 64.2 65.0 40.8 0.3 0 0 356.5 331.1
Insurance corporations
2014
XII 49.7 45.5 12.8 14.4 0.5 0 0 122.9 115.8
2015
I 54.1 38.7 13.5 14.4 0.4 0 0 121.1 115.3
II 56.4 39.4 13.5 14.4 0.4 0 0 124.0 117.9
III 49.5 37.9 11.4 13.0 0.4 0 0 112.2 106.4
Pension funds
2014
XII 204.4 14.1 36.2 30.2 0 0 0 285.0 272.3
2015
I 180.0 14.1 35.4 29.9 0 0 0 259.5 246.6
II 192.7 14.1 29.8 30.2 0 0 0 266.8 248.2
III 151.4 14.1 14.7 30.2 0 0 0 210.5 202.4
1 Beginning with data for December 2014, the "Insurance corporations and pension funds" sector is broken down in accordance with the ESA 2010.
Total deposits
14.a

71
DEPOSITS BY FINANCIAL INSTITUTIONS (CONT.) (at end of period; millions of euro)
Overnight With agreed maturity Redeemable at notice Repos
Up to 1 year 1–2 years Over 2 years Up to 3 months Over 3 months In euro
OFIs and financial auxiliaries1
2014
I 138.4 52.0 7.0 78.5 16.1 0 0 291.9 279.1
II 139.2 63.0 7.2 77.0 19.7 0 0 306.1 295.0
III 132.6 45.6 6.8 76.9 9.5 0 0 271.4 258.7
IV 114.2 47.6 6.1 75.4 5.3 0 0 248.6 237.5
V 126.7 49.8 5.8 75.2 7.3 0 0 264.8 248.3
VI 119.0 44.2 6.0 75.4 9.1 0 0 253.8 235.8
VII 118.8 51.4 4.6 75.6 5.3 0 0 255.6 239.6
VIII 129.9 37.8 4.1 75.8 3.6 0 0 251.2 239.9
IX 119.7 37.5 5.1 74.6 3.0 0 0 239.8 220.2
X 141.1 36.7 5.2 74.8 7.6 0 0 265.4 237.2
XI 154.2 44.1 6.9 75.4 14.9 0 0 295.4 268.7
OFIs
2014
XII 167.2 45.3 19.4 75.1 21.3 0 0 328.4 302.8
2015
I 151.4 50.0 19.4 74.4 21.2 0 0 316.4 291.8
II 172.4 33.8 18.6 73.3 14.5 0 0 312.7 287.1
III 159.4 25.2 40.2 71.9 1.5 0 0 298.2 272.7
Investment funds, excluding money market funds, and alternative investment funds
2014
XII 32.8 0.7 0 0 0 0 0 33.5 18.6
2015
I 40.1 1.0 0 0 0 0 0 41.0 27.2
II 31.9 1.3 0 0 0 0 0 33.1 18.9
III 30.8 1.1 0 0 0 0 0 31.9 19.9
1 Beginning with data for December 2014, the "OFIs and financial auxiliaries" sector is broken down in accordance with the ESA 2010.
Total deposits
14.a

72
DEPOSITS BY NON-FINANCIAL CORPORATIONS (at end of period; millions of euro)
Overnight With agreed maturity Redeemable at notice Repos
Up to 1 year 1–2 years Over 2 years Up to 3 months Over 3 months In euro
Public non-financial corporations
2014
I 292.9 241.9 3.7 0.8 16.1 0 0 555.4 551.6
II 305.4 215.9 2.3 0.8 12.5 0 0 537.0 533.1
III 333.8 234.7 0.1 0.8 12.8 0 0 582.2 578.2
IV 356.9 216.7 0.1 0.8 13.0 0 0 587.5 583.3
V 302.1 199.1 0.1 0.8 13.2 0 0 515.3 511.7
VI 303.6 187.3 0.1 0.8 13.2 0 0 504.9 499.3
VII 306.7 182.9 0.1 0.8 13.4 0 0 504.0 498.1
VIII 313.3 182.0 0.1 0.8 13.6 0 0 509.8 504.0
IX 319.0 177.9 0.1 0.8 13.9 0 0 511.6 504.1
X 324.4 162.6 0.1 0.8 14.1 0 0 501.9 492.2
XI 312.2 150.6 0.1 0.2 14.3 0 0 477.3 468.0
XII 287.6 124.5 0.1 0.2 13.3 0 0 425.7 417.6
2015
I 290.8 61.3 0.1 0.2 0.8 0 0 353.1 346.9
II 297.7 63.4 0.1 0.2 15.3 0 0 376.7 369.6
III 336.0 85.3 0.1 0.2 15.9 0 0 437.5 429.7
Private non-financial corporations
2014
I 2 549.7 259.8 37.1 21.0 34.3 0 0 2 901.9 2 626.0
II 2 557.0 253.2 33.8 20.4 30.4 0 0 2 894.7 2 601.1
III 2 502.9 280.9 28.7 20.4 36.1 0 0 2 869.1 2 600.1
IV 2 407.6 275.5 31.7 18.3 38.2 0 0 2 771.3 2 527.4
V 2 440.3 302.5 21.1 17.5 38.7 0 0 2 820.2 2 542.0
VI 2 444.9 299.3 21.0 16.1 42.5 0 0 2 823.7 2 561.0
VII 2 484.9 253.7 20.5 16.1 43.5 0 0 2 818.6 2 553.0
VIII 2 525.8 241.5 18.6 15.8 39.3 0 0 2 841.1 2 564.5
IX 2 502.2 251.3 14.6 17.4 40.4 0 0 2 825.8 2 538.3
X 2 525.2 220.8 15.1 20.0 41.7 0 0 2 822.9 2 532.5
XI 2 561.1 269.3 11.7 20.5 38.0 0 0 2 900.6 2 588.0
XII 2 725.2 248.1 20.3 21.1 60.3 0 0 3 075.0 2 775.0
2015
I 2 636.2 241.8 22.9 21.1 61.6 0 0 2 983.6 2 669.4
II 2 654.1 301.0 24.1 20.5 58.0 0 0 3 057.8 2 733.9
III 2 746.8 273.7 23.2 20.3 48.4 0 0 3 112.4 2 731.2
Total deposits
14.b

73
DEPOSITS BY GOVERNMENT AND NON-RESIDENTS (at end of period; millions of euro)
General government Non-residents
Central government
Local government
In euro MFIs Non-MFIs In euro
General government
Other
2014
I 1 019.3 188.9 1 208.2 1 202.4 4 013.5 9 375.8 4.9 9 370.9 13 389.3 6 245.7
II 1 112.2 197.9 1 310.2 1 302.8 4 174.2 9 237.8 11.4 9 226.3 13 411.9 6 315.7
III 593.1 215.3 808.4 801.0 3 721.8 9 146.6 4.9 9 141.6 12 868.3 5 871.9
IV 585.6 213.7 799.3 794.9 3 658.6 9 292.4 5.9 9 286.5 12 951.1 5 879.9
V 947.0 228.3 1 175.3 1 169.9 3 382.8 9 395.2 5.1 9 390.1 12 778.0 5 657.4
VI 1 299.6 216.0 1 515.6 1 507.3 3 158.1 9 479.9 4.9 9 475.1 12 638.0 5 507.4
VII 1 305.3 212.0 1 517.3 1 511.6 3 290.3 9 845.3 10.9 9 834.5 13 135.6 5 721.0
VIII 1 315.6 226.1 1 541.7 1 537.5 3 105.8 9 895.9 10.6 9 885.3 13 001.7 5 620.3
IX 1 404.0 214.8 1 618.8 1 614.5 3 120.3 10 274.7 5.1 10 269.5 13 394.9 5 753.2
X 1 381.8 218.5 1 600.2 1 597.0 3 122.9 10 271.6 5.4 10 266.2 13 394.5 5 814.6
XI 1 314.9 223.2 1 538.1 1 533.9 3 186.3 10 526.2 4.3 10 521.9 13 712.5 5 896.0
XII 1 087.2 180.3 1 267.4 1 263.3 3 378.7 11 226.4 4.6 11 221.8 14 605.1 6 171.9
2015
I 468.2 198.1 666.2 661.4 3 528.9 11 723.6 4.1 11 719.5 15 252.5 6 339.6
II 412.9 215.1 628.0 623.4 3 424.4 11 867.1 4.2 11 862.9 15 291.5 6 384.5
III 433.6 238.9 672.4 667.4 3 406.6 11 992.2 4.8 11 987.4 15 398.8 6 211.8
14.d
DEPOSITS BY HOUSEHOLDS (at end of period; millions of euro)
Overnight With agreed maturity Redeemable at notice Repos
Up to 1 year 1–2 years Over 2 years Up to 3 months Over 3 months In euro
Households
2014
I 3 099.2 901.8 168.5 168.2 411.7 3.5 0 4 753.0 4 248.1
II 3 116.1 893.8 171.6 168.6 421.9 3.5 0 4 775.5 4 266.7
III 3 103.9 880.0 168.5 173.5 429.0 3.5 0 4 758.5 4 245.0
IV 3 182.9 868.8 167.6 169.2 440.3 3.5 0 4 832.4 4 322.9
V 3 158.8 862.9 167.1 171.1 448.0 3.6 0 4 811.4 4 299.2
VI 3 236.0 840.2 164.9 169.7 458.6 4.6 0 4 874.1 4 365.5
VII 3 286.3 810.7 165.6 170.4 470.2 4.7 0 4 907.9 4 391.0
VIII 3 297.2 810.8 167.0 172.4 478.8 4.6 0 4 930.8 4 395.0
IX 3 348.6 809.3 168.7 179.2 488.7 4.7 0 4 999.2 4 456.3
X 3 379.6 802.1 178.1 191.9 495.5 4.7 0 5 051.9 4 499.6
XI 3 417.7 785.6 179.0 192.1 504.5 4.6 0 5 083.5 4 535.4
XII 3 492.2 754.6 178.5 191.7 584.5 4.7 0 5 206.3 4 653.1
2015
I 3 488.1 730.2 175.5 195.7 606.5 5.0 0 5 201.1 4 613.2
II 3 508.8 719.1 173.1 195.7 618.3 5.1 0 5 220.0 4 620.9
III 3 516.7 702.5 189.0 198.3 625.3 5.1 0 5 236.9 4 622.2
Total deposits
14.c

74
LOANS TO FINANCIAL INSTITUTIONS AND NON-FINANCIAL CORPORATIONS (at end of period; millions of euro)
Insurance corporations and pension funds
OFIs and financial auxiliaries Public non-financial corporations Private non-financial corporations
Up to 1 year
In euro Up to 1 year
In euro Up to 1 year
1–5 years
Over 5 years
In euro Up to 1 year
1–5 years
Over 5 years
In euro
2014
I 0.1 0.1 0.1 160.1 393.5 369.7 5.9 77.0 691.3 774.3 539.4 1 469.5 1 932.6 2 621.3 6 023.4 5 813.6
II 0 0 0 159.2 390.0 367.0 5.5 75.6 684.3 765.4 531.2 1 498.7 1 918.9 2 592.4 6 009.9 5 790.0
III 0 0 0 162.6 417.5 392.1 4.9 76.5 678.6 760.1 528.3 1 450.0 1 937.9 2 567.3 5 955.1 5 738.7
IV 0 0 0 184.5 496.9 470.7 5.5 72.3 678.5 756.3 527.1 1 408.2 1 951.7 2 548.7 5 908.7 5 693.0
V 0 0 0 198.0 506.3 480.4 5.6 64.2 683.3 753.1 523.8 1 415.1 1 949.4 2 533.2 5 897.6 5 689.0
VI 0 0 0 200.7 515.7 488.8 5.0 62.7 676.2 743.9 524.8 1 371.9 1 959.6 2 541.5 5 872.9 5 694.4
VII 0 0 0 203.9 535.5 509.9 4.4 76.6 659.8 740.8 522.3 1 384.3 1 930.0 2 537.3 5 851.6 5 662.9
VIII 0 0 0 207.3 542.9 516.7 6.8 75.5 657.4 739.8 520.7 1 397.1 1 963.0 2 540.6 5 900.7 5 706.1
IX 0 0 0 208.2 566.4 538.8 7.5 78.4 643.0 728.8 508.5 1 401.6 1 980.0 2 514.9 5 896.5 5 680.3
X 0 0 0 212.8 579.6 552.5 6.2 79.2 633.3 718.6 501.3 1 389.9 1 966.5 2 494.2 5 850.5 5 639.8
XI 0 0 0 203.8 569.1 544.4 4.7 79.9 621.9 706.5 490.1 1 403.9 1 921.2 2 546.9 5 872.0 5 658.9
XII1 0 0 0 x x x 11.8 69.9 594.4 676.1 471.3 1 245.3 1 847.4 2 609.8 5 702.5 5 503.9
2015
I 0 0 0 x x x 8.8 59.7 586.3 654.9 449.9 1 279.6 1 857.3 2 603.2 5 740.0 5 502.8
II 0 0 0 x x x 15.7 61.3 576.3 653.3 448.0 1 283.4 1 818.4 2 604.9 5 706.7 5 469.7
III 0 0 0 x x x 8.8 61.3 581.5 651.5 444.3 1 288.0 1 797.4 2 586.7 5 672.1 5 427.2
16.a
MATURITY PROFILE OF LOANS TO RESIDENT FINANCIAL INSTITUTIONS, NON-FINANCIAL CORPORATIONS AND HOUSEHOLDS (at end of period; millions of euro)
2015
I II III IV V VI VII VIII IX X XI XII I II III
Short-term
Amount 2 098.0 2 126.2 2 076.8 2 052.7 2 067.0 2 016.3 2 026.3 2 039.4 2 036.0 2 027.3 2 021.2 1 829.1 1 853.5 1 853.6 1 868.8
%1 16.0 16.2 15.9 15.8 15.9 15.6 15.7 15.7 15.7 15.7 15.7 14.6 14.7 14.8 15.0
Maturity of 1–5 years
Amount 2 512.0 2 488.8 2 523.5 2 582.8 2 555.5 2 568.1 2 570.1 2 605.8 2 638.4 2 633.9 2 595.4 2 505.1 2 502.0 2 467.0 2 446.7
%1 19.1 19.0 19.4 19.8 19.7 19.9 19.9 20.2 20.4 20.5 20.2 19.9 19.9 19.7 19.6
Maturity of over 5 years
Amount 8 542.1 8 481.0 8 428.4 8 384.1 8 361.2 8 341.6 8 305.6 8 282.8 8 267.7 8 217.9 8 243.9 8 235.8 8 212.6 8 181.0 8 155.1
%1 64.9 64.8 64.7 64.4 64.4 64.5 64.4 64.1 63.9 63.8 64.1 65.5 65.4 65.5 65.4
Total loans 13 152.1 13 096.1 13 028.7 13 019.6 12 983.8 12 926.1 12 902.0 12 928.1 12 942.0 12 879.1 12 860.5 12 570.1 12 568.1 12 501.7 12 470.6
1 As percent of total loans to resident financial institutions, non-financial corporations and households.
2014
15.
Non-MMF investment funds Other financial institutions
Up to 1 year In euro Up to 1 year
1–5 years Over 5 years
In euro
2014
XII 0 0 0 197.0 284.5 87.4 568.9 541.6
2015
I 0 0 0 189.7 282.8 83.1 555.7 527.6
II 0 0.1 0 185.2 286.3 82.8 554.3 526.1
III 0 0.5 0 201.7 286.4 80.3 568.3 539.2
1 Beginning with data for December 2014, the "OFIs and financial auxiliaries" sector is broken down in accordance with the ESA 2010.

75
LOANS TO HOUSEHOLDS (at end of period; millions of euro)
Households
Consumer credit Lending for house purchase Other lending In euro
Up to 1 year
1–5 years Over 5 years
Up to 1 year
1–5 years Over 5 years
Up to 1 year
1–5 years Over 5 years
2014
VII 509.3 200.9 126.2 182.3 4 847.4 168.0 125.7 4 553.7 417.3 64.8 59.8 292.7 5 774.1 5 608.5
VIII 511.4 201.2 128.8 181.4 4 821.6 163.7 123.6 4 534.3 411.7 63.4 59.7 288.5 5 744.7 5 578.6
IX 513.2 199.5 131.5 182.2 4 803.7 159.0 120.6 4 524.0 433.5 60.2 63.1 310.3 5 750.4 5 581.9
X 517.0 200.2 134.0 182.8 4 782.3 158.7 117.1 4 506.6 431.0 59.6 62.3 309.1 5 730.3 5 562.1
XI 514.9 197.2 135.1 182.7 4 767.7 155.4 114.5 4 497.8 430.3 56.1 61.5 312.7 5 712.9 5 545.6
XII 436.9 152.7 124.5 159.7 4 723.1 149.0 116.2 4 457.9 462.5 73.3 62.6 326.7 5 622.5 5 453.9
2015
I 437.4 154.3 124.7 158.4 4 717.2 147.3 115.2 4 454.7 462.8 73.7 62.2 326.9 5 617.4 5 431.7
II 436.7 152.1 126.1 158.5 4 678.0 145.3 105.5 4 427.2 472.6 71.8 69.5 331.2 5 587.3 5 405.6
III 440.4 150.9 128.9 160.6 4 661.6 143.2 100.3 4 418.1 476.1 75.8 72.5 327.8 5 578.1 5 391.2
I 513.8 207.5 119.7 186.5 4 996.9 187.9 153.3 4 655.6 450.2 66.9 66.9 316.4 5 960.8 5 785.3
II 510.1 205.3 119.5 185.3 4 969.9 187.8 148.7 4 633.4 450.7 69.7 66.2 314.8 5 930.8 5 757.9
III 511.2 205.7 119.6 185.8 4 940.9 184.9 143.4 4 612.5 444.0 68.5 64.5 310.9 5 896.0 5 725.5
IV 509.4 204.5 119.9 185.0 4 913.6 180.6 136.7 4 596.3 434.6 69.5 61.8 303.3 5 857.7 5 689.3
V 510.2 204.9 121.2 184.0 4 889.7 175.9 132.5 4 581.3 427.0 67.6 59.8 299.6 5 826.8 5 659.4
VI 505.9 200.0 122.6 183.2 4 864.0 170.4 128.5 4 565.2 423.6 68.3 59.9 295.5 5 793.5 5 626.9
16.b
LOANS TO GOVERNMENT AND NON-RESIDENTS (at end of period; millions of euro)
General government Non-residents
Central government
Local government
In euro MFIs Non-MFIs In euro
General government
Other
2014
I 7.6 34.6 42.2 42.2 6 612.2 1 873.5 0 1 873.5 8 485.7 3 543.1
II 7.5 34.7 42.3 42.3 6 580.6 1 859.8 0 1 859.8 8 440.4 3 286.0
III 7.1 34.6 41.7 41.7 5 687.4 1 765.8 0 1 765.8 7 453.2 2 501.0
IV 6.6 34.1 40.7 40.7 5 668.8 1 834.4 0 1 834.4 7 503.2 2 501.7
V 6.1 33.8 39.9 39.9 5 911.3 1 743.1 0 1 743.1 7 654.4 2 686.0
VI 6.4 24.1 30.5 30.5 6 821.6 1 668.7 0 1 668.7 8 490.3 3 301.4
VII 6.4 23.0 29.4 29.4 7 206.1 1 796.1 0 1 796.1 9 002.2 3 898.4
VIII 6.1 23.1 29.2 29.2 7 257.4 1 830.9 0 1 830.9 9 088.3 4 112.4
IX 5.5 23.1 28.6 28.6 7 455.3 1 784.7 0 1 784.7 9 240.0 4 270.8
X 5.2 24.6 29.8 29.8 7 600.8 1 979.1 0 1 979.1 9 580.0 4 579.7
XI 10.6 20.1 30.8 30.8 7 741.2 1 995.7 0 1 995.7 9 736.9 4 642.3
XII 36.6 21.4 58.1 58.1 7 091.8 1 998.7 0 1 998.7 9 090.6 3 992.9
2015
I 53.1 25.9 79.0 79.0 7 617.3 2 105.8 0 2 105.8 9 723.1 4 394.8
II 52.9 26.6 79.5 79.5 7 035.1 2 122.3 0 2 122.3 9 157.4 3 922.9
III 52.6 26.4 79.0 79.0 6 669.6 2 208.4 0 2 208.4 8 878.0 3 861.3
16.c

76
LOANS TO FINANCIAL INSTITUTIONS AND NON-FINANCIAL CORPORATIONS IN THE NATIONAL ECONOMY (at end of Q4 2014, millions of euro; structure, %)
With residual maturity of up to 1 year
With residual maturity of over 1 and up to 5 years
With residual maturity of over 5 years
Total loans
Amount % Of which in euro
% Amount % Of which in euro
% Amount % Of which in euro
% Amount % Of which in euro
%
2 118.9 100.0 1 987.9 100.0 3 798.9 100.0 3 645.7 100.0 1 051.6 100.0 905.6 100.0 6 969.3 100.0 6 539.2 100.0
A Agriculture, forestry and fishing 142.6 6.7 124.4 6.3 230.5 6.1 229.9 6.3 44.2 4.2 44.2 4.9 417.3 6.0 398.5 6.1
B Mining and quarrying 9.8 0.5 9.8 0.5 11.6 0.3 11.6 0.3 2.8 0.3 2.8 0.3 24.2 0.3 24.2 0.4
C Manufacturing 325.3 15.4 318.6 16.0 491.0 12.9 477.9 13.1 54.7 5.2 54.7 6.0 870.9 12.5 851.2 13.0
D Electricity, gas, steam and air conditioning supply 104.4 4.9 85.6 4.3 224.9 5.9 174.1 4.8 95.2 9.0 44.0 4.9 424.5 6.1 303.7 4.6
E Water supply; sewerage, waste management and remediation activities 16.1 0.8 16.1 0.8 48.0 1.3 47.9 1.3 26.3 2.5 26.3 2.9 90.4 1.3 90.3 1.4
F Construction 87.9 4.2 87.9 4.4 129.6 3.4 129.6 3.6 220.7 21.0 169.6 18.7 438.2 6.3 387.1 5.9
G Wholesale and retail trade; repair of motor vehicles and motorcycles 419.7 19.8 385.2 19.4 224.1 5.9 216.5 5.9 26.6 2.5 26.5 2.9 670.3 9.6 628.2 9.6
H Transportation and storage 102.0 4.8 99.1 5.0 237.6 6.3 223.4 6.1 213.0 20.3 209.6 23.1 552.6 7.9 532.1 8.1
I Accommodation and food service activities 27.7 1.3 27.7 1.4 92.9 2.4 92.9 2.6 12.1 1.1 12.1 1.3 132.7 1.9 132.7 2.0
J Information and communication 5.6 0.3 5.6 0.3 28.8 0.8 27.6 0.8 5.8 0.5 5.7 0.6 40.2 0.6 38.9 0.6
K Financial and insurance activities 187.2 8.8 177.0 8.9 496.7 13.1 463.8 12.7 5.1 0.5 4.5 0.5 689.1 9.9 645.3 9.9
L Real estate activities 556.0 26.2 539.0 27.1 1 424.2 37.5 1 392.0 38.2 212.0 20.2 172.5 19.1 2 192.3 31.5 2 103.5 32.2
M Professional, scientific and technical activities 4.7 0.2 4.6 0.2 14.9 0.4 14.9 0.4 4.8 0.5 4.8 0.5 24.4 0.4 24.3 0.4
N Administrative and support service activities 69.5 3.3 47.2 2.4 28.4 0.7 28.3 0.8 15.9 1.5 15.9 1.8 113.8 1.6 91.4 1.4
O Public administration and defence; compulsory social security 0.2 0 0.2 0 1.5 0 1.5 0 24.4 2.3 24.4 2.7 26.1 0.4 26.1 0.4
P Education 1.0 0 1.0 0.1 8.7 0.2 8.7 0.2 0.5 0.1 0.5 0.1 10.2 0.1 10.2 0.2
Q Human health and social work activities 4.7 0.2 4.7 0.2 15.1 0.4 15.0 0.4 2.6 0.2 2.6 0.3 22.4 0.3 22.3 0.3
R Arts, entertainment and recreation 5.6 0.3 5.6 0.3 7.3 0.2 7.0 0.2 4.2 0.4 4.2 0.5 17.1 0.2 16.8 0.3
S Other service activities 48.9 2.3 48.6 2.4 83.1 2.2 83.1 2.3 80.7 7.7 80.7 8.9 212.6 3.1 212.4 3.2
Total
17.a

77
LOANS TO FINANCIAL INSTITUTIONS AND NON-FINANCIAL CORPORATIONS IN THE NATIONAL ECONOMY (at end of Q1 2015, millions of euro; structure, %)
With residual maturity of up to 1 year
With residual maturity of over 1 and up to 5 years
With residual maturity of over 5 years
Total loans
Amount % Of which in euro
% Amount % Of which in euro
% Amount % Of which in euro
% Amount % Of which in euro
%
2 141.8 100.0 1 997.2 100.0 3 731.7 100.0 3 525.7 100.0 1 017.9 100.0 887.5 100.0 6 891.3 100.0 6 410.4 100.0
A Agriculture, forestry and fishing 143.4 6.7 122.1 6.1 230.5 6.2 229.7 6.5 51.3 5.0 51.3 5.8 425.2 6.2 403.1 6.3
B Mining and quarrying 10.6 0.5 10.6 0.5 10.3 0.3 10.3 0.3 2.6 0.2 2.6 0.3 23.4 0.3 23.5 0.4
C Manufacturing 312.0 14.6 306.1 15.3 483.6 13.0 467.4 13.3 77.6 7.6 77.6 8.7 873.3 12.7 851.1 13.3
D Electricity, gas, steam and air conditioning supply 48.0 2.2 45.9 2.3 286.6 7.7 217.9 6.2 93.9 9.2 38.9 4.4 428.5 6.2 302.7 4.7
E Water supply; sewerage, waste management and remediation activities 9.0 0.4 9.0 0.4 42.9 1.1 42.9 1.2 26.2 2.6 26.2 2.9 78.2 1.1 78.1 1.2
F Construction 123.0 5.7 123.0 6.2 142.5 3.8 125.2 3.5 197.4 19.4 166.0 18.7 462.9 6.7 414.2 6.5
G Wholesale and retail trade; repair of motor vehicles and motorcycles 398.8 18.6 362.2 18.1 238.2 6.4 224.1 6.3 22.1 2.2 22.1 2.5 659.1 9.6 608.4 9.5
H Transportation and storage 94.3 4.4 91.1 4.6 241.8 6.5 226.3 6.4 217.0 21.3 213.1 24.0 553.1 8.0 530.5 8.3
I Accommodation and food service activities 34.0 1.6 34.0 1.7 83.8 2.2 83.8 2.4 12.3 1.2 12.3 1.4 130.2 1.9 130.1 2.0
J Information and communication 6.0 0.3 6.0 0.3 27.1 0.7 25.9 0.7 6.8 0.7 6.8 0.8 40.0 0.6 38.7 0.6
K Financial and insurance activities 224.1 10.5 213.0 10.7 456.7 12.2 420.4 11.9 3.7 0.4 3.0 0.3 684.5 9.9 636.4 9.9
L Real estate activities 616.6 28.8 597.7 29.9 1 317.7 35.3 1 282.1 36.4 207.5 20.4 168.2 19.0 2 141.7 31.1 2 048.0 31.9
M Professional, scientific and technical activities 5.2 0.3 5.2 0.3 13.6 0.4 13.6 0.4 19.0 1.9 19.0 2.1 37.8 0.5 37.8 0.6
N Administrative and support service activities 80.0 3.7 35.0 1.8 20.3 0.5 20.2 0.6 0.6 0.1 0.6 0.1 100.8 1.5 55.8 0.9
O Public administration and defence; compulsory social security 0.5 0 0.5 0 2.0 0.1 2.0 0.1 20.2 2.0 20.2 2.3 22.8 0.3 22.7 0.4
P Education 0.9 0 0.9 0 11.6 0.3 11.6 0.3 0.6 0.1 0.6 0.1 13.0 0.2 13.1 0.2
Q Human health and social work activities 1.5 0.1 1.5 0.1 16.6 0.4 16.6 0.5 0.4 0 0.4 0 18.5 0.3 18.5 0.3
R Arts, entertainment and recreation 5.3 0.3 5.3 0.3 6.1 0.2 5.8 0.2 4.5 0.4 4.5 0.5 15.9 0.2 15.6 0.2
S Other service activities 28.5 1.3 28.1 1.4 99.9 2.7 99.9 2.8 54.1 5.3 54.1 6.1 182.5 2.7 182.1 2.8
Total
17.b
LENDING TO RESIDENT FINANCIAL INSTITUTIONS, NON-FINANCIAL CORPORATIONS AND HOUSEHOLDS (at end of period; millions of euro)
2013 2014 2015
III VI IX XII III VI IX¹ XII III
Commercial credit 2 359.1 2 309.5 2 305.1 2 412.8 2 212.3 2 269.8 2 339.3 2 200.7 2 254.8
Industrial credit 2 500.3 2 441.1 2 402.4 2 295.2 2 167.9 2 197.7 2 217.0 2 155.1 2 087.6
Reverse repo 0.9 0.9 0.9 1.1 0.6 0.3 0.3 2.1 2.7
Financial leasing 42.4 39.0 43.4 44.5 49.7 50.8 49.3 49.5 51.7
Consumer credit 333.1 330.0 332.1 326.8 324.7 328.3 335.9 329.9 322.7
Mortgage loans 7 884.7 7 609.5 7 451.7 7 359.4 7 024.0 6 946.5 6 859.5 6 757.1 6 676.9
Factoring 2.7 3.7 3.1 2.8 3.3 3.5 2.4 4.3 3.5
Other credit 1 065.0 1 069.3 1 100.6 1 072.0 1 188.0 1 102.8 1 116.2 1 075.1 1 091.2
Total loans 14 188.3 13 802.9 13 639.2 13 514.7 12 970.6 12 899.6 12 920.0 12 573.8 12 491.0
1 Data have been revised.
18.

78
HOLDINGS OF SHARES AND OTHER EQUITY (at end of period; millions of euro)
Shares and other equity
MFIs Other residents Non-residents In euro
2014
VII 0.5 527.1 194.9 722.6 605.2
VIII 0.5 526.7 196.2 723.4 604.7
IX 0.5 541.3 198.0 739.9 615.4
X 0.5 557.8 269.7 828.0 693.3
XI 0.5 565.9 274.4 840.9 707.0
XII 0.5 583.1 220.3 804.0 702.7
2015
I 0.5 572.9 256.3 829.7 734.9
II 0.5 580.0 255.5 836.1 737.5
III 0.5 558.1 267.5 826.2 722.9
I 0.5 562.7 185.9 749.2 621.8
II 0.5 562.3 187.5 750.3 621.3
III 0.5 539.2 185.4 725.2 598.2
IV 0.5 543.5 186.1 730.2 602.5
V 0.5 536.1 188.6 725.2 609.4
VI 0.5 526.8 188.9 716.2 600.1
19.b
HOLDINGS OF SECURITIES OTHER THAN SHARES (at end of period; millions of euro)
Securities other than shares
MFIs General government Other residents Non-residents In euro
incl. long-term incl. long-term incl. long-term incl. long-term
2014
I 0 0 661.6 454.0 28.6 28.6 2 188.0 2 093.0 2 878.1 1 086.7
II 0 0 661.8 475.9 28.2 28.2 2 410.2 2 196.8 3 100.2 1 127.5
III 0 0 658.5 475.7 28.1 28.1 2 459.1 2 372.9 3 145.7 1 170.4
IV 0 0 651.3 469.0 28.6 28.6 2 600.9 2 431.7 3 280.8 1 190.1
V 0 0 670.7 489.6 35.6 35.6 2 670.8 2 529.6 3 377.1 1 184.8
VI 0 0 702.4 506.7 35.5 35.5 3 141.1 2 634.5 3 879.0 1 478.5
VII 0 0 713.5 517.0 36.4 36.4 3 522.2 2 878.9 4 272.1 1 587.7
VIII 0 0 705.7 522.8 36.0 36.0 3 498.2 2 978.7 4 239.9 1 592.6
IX 0 0 721.2 554.5 37.0 37.0 3 584.5 3 134.7 4 342.7 1 519.4
X 0 0 694.7 555.0 37.1 37.1 3 614.3 3 180.1 4 346.1 1 493.3
XI 0 0 696.9 556.1 35.8 35.8 3 675.5 3 265.5 4 408.2 1 443.8
XII 0 0 681.6 571.0 36.8 36.8 3 800.5 3 490.6 4 519.0 1 310.1
2015
I 0 0 746.7 608.9 39.0 39.0 4 155.5 3 539.4 4 941.2 1 422.0
II 0 0 775.6 644.6 34.4 34.4 4 400.4 3 749.7 5 210.5 1 393.2
III 0 0 794.0 676.5 35.1 35.1 4 849.0 4 068.1 5 678.1 1 288.6
19.a

79
CURRENCY BREAKDOWN OF RESIDENT DEPOSITS (at end of period)
MFIs Non-MFIs
Outstanding amount (all currencies; millions of euro)
Structure (%) Outstanding amount (all currencies; millions of euro)
Structure (%)
In euro In foreign currencies In euro In foreign currencies
incl. USD incl. JPY incl. CHF incl. GBP incl. USD incl. JPY incl. CHF incl. GBP
I 493.1 74.0 26.0 25.5 0 0 0.2 10 144.9 91.8 8.2 6.3 0 0.2 0.5
II 323.2 71.5 28.5 27.9 0 0.1 0.3 10 264.1 91.7 8.3 6.4 0 0.2 0.5
III 318.5 50.0 50.0 49.4 0 0 0.3 9 725.4 91.4 8.6 6.7 0 0.2 0.5
IV 308.6 43.5 56.5 49.7 0 0 0.3 9 636.4 91.8 8.2 6.4 0 0.2 0.5
V 257.0 53.5 46.5 45.5 0 0.1 0.5 9 996.4 91.7 8.3 6.6 0 0.2 0.5
VI 329.7 45.6 54.4 49.5 0 0.1 4.6 10 398.8 92.1 7.9 6.1 0 0.2 0.5
X 383.2 42.3 57.7 51.2 0 0.1 6.1 10 589.0 91.4 8.6 6.8 0 0.1 0.5
XI 384.8 41.1 58.9 52.9 0 0.1 5.7 10 651.5 91.3 8.7 6.9 0 0.1 0.5
XII 373.2 49.1 50.9 43.3 0 0.1 5.2 10 744.1 91.4 8.6 6.8 0 0.1 0.5
2015
I 388.5 38.8 61.2 54.2 0 0.1 3.8 9 942.1 90.2 9.8 7.9 0 0.1 0.9
II 354.6 41.6 58.4 54.0 0 0.1 3.9 10 019.0 90.0 10.0 6.9 0 0.1 0.7
III 390.7 54.2 45.8 45.5 0 0.1 0.1 10 112.0 89.5 10.5 8.6 0 0.2 0.7
VII 391.4 33.6 66.4 62.3 0 0.1 3.8 10 435.4 92.1 7.9 6.2 0 0.2 0.5
VIII 368.3 42.3 57.7 53.9 0 0.1 3.6 10 538.9 91.8 8.2 6.5 0 0.1 0.5
IX 439.5 33.7 66.3 63.9 0 0.1 2.0 10 577.8 91.7 8.3 6.6 0 0.1 0.5
2014
20.a
CURRENCY BREAKDOWN OF NON-RESIDENT DEPOSITS (at end of period)
MFIs Non-MFIs
Outstanding amount (all currencies; millions of euro)
Structure (%) Outstanding amount (all currencies; millions of euro)
Structure (%)
In euro In foreign currencies In euro In foreign currencies
incl. USD incl. JPY incl. CHF incl. GBP incl. USD incl. JPY incl. CHF incl. GBP
I 4 013.5 89.8 10.2 2.1 0 1.6 1.3 9 375.8 28.2 71.8 66.8 0.1 0.4 1.1
II 4 174.2 89.6 10.4 2.4 0 1.5 1.3 9 237.8 27.9 72.1 66.8 0.1 0.4 1.3
III 3 721.8 88.4 11.6 2.6 0 1.7 1.4 9 146.6 28.2 71.8 67.3 0.1 0.4 1.4
IV 3 658.6 86.9 13.1 3.5 0 1.7 1.5 9 292.4 29.0 71.0 66.7 0.1 0.4 1.2
V 3 382.8 85.7 14.3 4.4 0 1.9 1.5 9 395.2 29.4 70.6 65.6 0.1 0.4 1.3
VI 3 158.1 87.2 12.8 2.8 0 2.0 1.6 9 479.9 29.0 71.0 66.5 0.1 0.5 1.3
VII 3 290.3 86.9 13.1 3.7 0 1.9 1.6 9 845.3 29.1 70.9 65.0 0 0.5 1.7
VIII 3 105.8 86.6 13.4 3.5 0 2.0 1.7 9 895.9 29.6 70.4 64.8 0.1 0.6 1.6
IX 3 120.3 86.6 13.4 3.4 0 1.9 1.7 10 274.7 29.7 70.3 64.8 0 0.5 1.6
X 3 122.9 86.0 14.0 3.7 0 2.3 1.8 10 271.6 30.4 69.6 64.7 0.1 0.5 1.7
XI 3 186.3 85.9 14.1 4.1 0 2.3 1.7 10 526.2 30.0 70.0 65.1 0.1 0.5 1.7
XII 3 378.7 85.4 14.6 4.3 0 2.3 1.7 11 226.4 29.3 70.7 65.4 0.1 0.5 1.7
2015
I 3 528.9 87.0 13.0 4.3 0 2.3 1.6 11 723.6 27.9 72.1 66.3 0.1 0.5 1.6
II 3 424.4 87.5 12.5 3.8 0 1.9 1.6 11 867.1 28.6 71.4 65.2 0.1 0.4 1.6
III 3 406.6 86.0 14.0 5.2 0 1.9 1.6 11 992.2 27.4 72.6 68.9 0 0.4 1.6
2014
20.b

80
CURRENCY BREAKDOWN OF LOANS TO RESIDENTS (at end of period)
Non-MFIs
Outstanding amount (all currencies; millions of euro)
Structure (%)
In euro In foreign currencies
incl. USD incl. JPY incl. CHF incl. GBP
I 13 194.3 95.1 4.9 2.2 0 0.7 0.5
II 13 138.4 95.1 4.9 2.3 0 0.7 0.5
III 13 070.4 95.1 4.9 2.3 0 0.7 0.5
IV 13 060.3 95.1 4.9 2.3 0 0.7 0.5
V 13 023.7 95.1 4.9 2.2 0 0.7 0.5
VI 12 956.6 95.4 4.6 2.0 0 0.7 0.5
VII 12 931.4 95.4 4.6 2.1 0 0.7 0.5
VIII 12 957.2 95.3 4.7 2.1 0 0.7 0.5
IX 12 970.6 95.1 4.9 2.3 0 0.7 0.5
X 12 908.9 95.2 4.8 2.3 0 0.7 0.5
XI 12 891.3 95.2 4.8 2.3 0 0.7 0.5
XII 12 628.1 95.3 4.7 2.2 0 0.7 0.5
2015
I 12 647.1 94.8 5.2 2.6 0 0.8 0.5
II 12 581.2 94.8 5.2 2.6 0 0.8 0.5
III 12 549.6 94.7 5.3 2.7 0 0.8 0.5
2014
20.c
CURRENCY BREAKDOWN OF LOANS TO NON-RESIDENTS (at end of period)
MFIs Non-MFIs
Outstanding amount (all currencies; millions of euro)
Structure (%) Outstanding amount (all currencies; millions of euro)
Structure (%)
In euro In foreign currencies In euro In foreign currencies
incl. USD incl. JPY incl. CHF incl. GBP incl. USD incl. JPY incl. CHF incl. GBP
I 6 612.2 44.2 55.8 50.1 0.2 0.4 1.1 1 873.5 33.0 67.0 64.0 0 0.1 0.8
II 6 580.6 40.4 59.6 53.9 0.2 0.4 1.2 1 859.8 33.8 66.2 64.1 0 0.1 0.8
III 5 687.4 32.9 67.1 59.7 0.5 0.5 1.8 1 765.8 35.6 64.4 62.0 0 0.1 1.1
IV 5 668.8 33.1 66.9 60.9 0.1 0.5 1.5 1 834.4 34.0 66.0 63.6 0 0.1 1.1
V 5 911.3 34.7 65.3 58.5 0.3 0.6 1.6 1 743.1 36.4 63.6 60.9 0 0.1 1.2
VI 6 821.6 39.4 60.6 55.3 0.4 0.6 1.4 1 668.7 36.6 63.4 60.6 0 0.1 1.4
VII 7 206.1 45.3 54.7 49.1 0.3 0.5 1.7 1 796.1 35.1 64.9 62.5 0 0.1 1.3
VIII 7 257.4 48.0 52.0 45.3 0.4 0.6 2.2 1 830.9 34.3 65.7 63.5 0 0.1 1.0
IX 7 455.3 48.9 51.1 45.2 0.4 0.6 1.7 1 784.7 35.1 64.9 62.8 0 0.1 1.2
X 7 600.8 51.3 48.7 42.9 0.2 0.5 1.8 1 979.1 34.5 65.5 63.5 0 0.1 1.1
XI 7 741.2 51.2 48.8 42.6 0.6 0.5 2.3 1 995.7 34.2 65.8 63.7 0 0.1 1.3
XII 7 090.9 46.5 53.5 46.8 0.6 0.7 2.1 1 998.8 34.6 65.4 63.8 0 0 1.3
2015
I 7 617.3 48.9 51.1 45.8 0.1 0.6 2.0 2 105.8 31.9 68.1 66.4 0 0.1 1.2
II 7 035.1 46.7 53.3 46.8 0.1 1.2 2.2 2 122.3 30.2 69.8 67.8 0 0.1 1.4
III 6 669.6 47.8 52.2 45.1 0.2 1.4 2.6 2 208.4 30.5 69.5 67.7 0 0.1 1.3
2014
20.d

81
CURRENCY BREAKDOWN OF HOLDINGS OF NON-RESIDENT SECURITIES OTHER THAN SHARES (at end of period)
MFIs Non-MFIs
Outstanding amount (all currencies; millions of euro)
Structure (%) Outstanding amount (all currencies; millions of euro)
Structure (%)
In euro In foreign currencies In euro In foreign currencies
incl. USD incl. JPY incl. CHF incl. GBP incl. USD incl. JPY incl. CHF incl. GBP
I 776.6 29.5 70.5 67.4 0 0.8 0.2 1 411.4 17.6 82.4 79.8 0 0 0.5
II 782.1 32.0 68.0 64.9 0 0.8 0.2 1 628.1 16.3 83.7 81.5 0 0 0.3
III 819.3 31.3 68.7 65.3 0 0.7 0.2 1 639.8 18.6 81.4 79.0 0 0 0.3
IV 806.8 31.9 68.1 64.6 0 0.7 0.2 1 794.1 19.1 80.9 78.8 0 0 0.2
V 846.7 30.9 69.1 65.6 0 0.7 0.2 1 824.1 17.6 82.4 79.9 0 0 0.2
VI 874.7 30.8 69.2 65.7 0 0.7 0.2 2 266.4 25.5 74.5 72.6 0 0 0.2
VII 1 013.1 32.1 67.9 65.2 0 0.6 0 2 509.1 24.8 75.2 73.6 0 0 0.2
VIII 1 015.0 30.8 69.2 66.5 0 0.6 0 2 483.1 26.2 73.8 72.2 0 0 0.1
IX 1 111.0 28.4 71.6 69.2 0 0.5 0 2 473.4 23.1 76.9 75.0 0 0 0.2
X 1 127.9 27.7 72.3 69.4 0 0.5 0 2 486.4 23.1 76.9 74.3 0 0 0.2
XI 1 168.2 26.7 73.3 71.6 0 0.2 0 2 507.3 20.9 79.1 77.3 0 0 0.2
XII 1 165.8 26.7 73.3 71.6 0 0.2 0 2 634.7 21.1 78.9 76.7 0 0 0.2
2015
I 1 246.2 24.6 75.4 75.0 0 0.3 0 2 909.3 20.6 79.4 76.8 0 0 0.2
II 1 296.4 23.4 76.6 75.9 0 0.7 0 3 104.0 18.6 81.4 78.5 0 0.1 0.2
III 1 372.4 21.9 78.1 75.1 0 1.3 0 3 476.6 10.0 90.0 88.9 0 0.1 0.2
2014
20.f
CURRENCY BREAKDOWN OF HOLDINGS OF RESIDENT SECURITIES OTHER THAN SHARES (at end of period)
MFIs Non-MFIs
Outstanding amount (all currencies; millions of euro)
Structure (%) Outstanding amount (all currencies; millions of euro)
Structure (%)
In euro In foreign currencies In euro In foreign currencies
incl. USD incl. JPY incl. CHF incl. GBP incl. USD incl. JPY incl. CHF incl. GBP
I 0 0 0 0 0 0 0 690.2 88.3 11.7 11.6 0 0 0
II 0 0 0 0 0 0 0 690.0 88.7 11.3 11.3 0 0 0
III 0 0 0 0 0 0 0 686.6 88.6 11.4 11.3 0 0 0
IV 0 0 0 0 0 0 0 679.9 86.9 13.1 13.0 0 0 0
V 0 0 0 0 0 0 0 706.3 85.2 14.8 14.7 0 0 0
VI 0 0 0 0 0 0 0 737.9 85.5 14.5 14.5 0 0 0
VII 0 0 0 0 0 0 0 749.9 85.3 14.7 14.7 0 0 0
VIII 0 0 0 0 0 0 0 741.7 84.9 15.1 15.1 0 0 0
IX 0 0 0 0 0 0 0 758.2 83.4 16.6 16.6 0 0 0
X 0 0 0 0 0 0 0 731.8 83.0 17.0 17.0 0 0 0
XI 0 0 0 0 0 0 0 732.7 82.9 17.1 17.1 0 0 0
XII 0 0 0 0 0 0 0 718.5 79.6 20.4 20.4 0 0 0
2015
I 0 0 0 0 0 0 0 785.7 78.3 21.7 21.7 0 0 0
II 0 0 0 0 0 0 0 810.0 78.5 21.5 21.5 0 0 0
III 0 0 0 0 0 0 0 829.0 77.4 22.6 22.6 0 0 0
2014
20.e

82
CURRENCY BREAKDOWN OF DEBT SECURITIES ISSUED BY MFIs (at end of period)
Outstanding amount (all currencies; millions of euro) Structure (%)
In euro In foreign currencies
I 331.4 26.5 73.5
II 366.3 27.4 72.6
III 371.9 27.3 72.7
IV 386.8 30.5 69.5
V 392.2 30.2 69.8
VI 383.1 31.0 69.0
VII 440.8 31.6 68.4
VIII 449.9 31.6 68.4
IX 468.4 30.6 69.4
X 516.0 30.2 69.8
XI 487.3 30.7 69.3
XII 513.4 32.7 67.3
2015
I 537.4 30.7 69.3
II 599.2 29.4 70.6
III 628.0 29.3 70.7
2014
20.g
WEIGHTED AVERAGE INTEREST RATES CHARGED BY MFIs IN TRANSACTIONS WITH RESIDENT NON-FINANCIAL CORPORATIONS AND HOUSEHOLDS IN EURO (%) 1. Interest rates on deposits (new business)
2015
I II III IV V VI VII VIII IX X XI XII I II III
Deposits from households
Overnight1 0.10 0.10 0.11 0.14 0.11 0.07 0.07 0.07 0.07 0.07 0.06 0.05 0.05 0.06 0.05
With agreed maturity
Up to 1 year 0.57 0.42 0.29 0.35 0.37 0.32 0.29 0.38 0.30 0.33 0.32 0.61 0.54 0.37 0.31
Over 1 and up to 2 years 1.62 1.24 0.96 1.05 0.94 1.07 0.98 1.09 1.31 1.35 0.95 0.99 1.01 0.95 1.64
Over 2 years 1.41 1.46 2.02 1.79 1.24 1.54 1.47 2.61 3.12 2.51 3.34 1.64 1.92 2.09 1.11
Redeemable at notice2
Up to 3 months 0.14 0.14 0.14 0.14 0.14 0.14 0.14 0.14 0.11 0.09 0.09 0.08 0.09 0.06 0.08
Over 3 months x x x x x x x x x x x x x x x
Deposits from non-financial corporations
Overnight1 0.07 0.07 0.11 0.11 0.09 0.09 0.08 0.07 0.06 0.05 0.06 0.05 0.05 0.05 0.05
With agreed maturity
Up to 1 year 0.14 0.11 0.17 0.24 0.27 0.07 0.08 0.03 0.07 0.05 0.05 0.05 0.03 0.04 0.03
Over 1 and up to 2 years 0.72 1.27 0.59 0.50 0.46 0.95 x 0.40 1.23 x 0.43 1.86 0.10 0.51 1.57
Over 2 years 0.48 0.96 0.58 0.72 0.94 x 0.75 x 0.53 0.12 1.65 0.24 0.28 0.20 0.14
Repos – – – – – – – – – – – – – – –
2014
1 End-of-period. 2 For this instrument category, households and non-financial corporations are merged and allocated to the household sector.
21.a

83
WEIGHTED AVERAGE INTEREST RATES CHARGED BY MFIs IN TRANSACTIONS WITH RESIDENT NON-FINANCIAL CORPORATIONS AND HOUSEHOLDS IN EURO (CONT.) (%)
21.a
2. Interest rates on deposits (outstanding amounts)
2015
I II III IV V VI VII VIII IX X XI XII I II III
Households
Overnight1 0.10 0.10 0.11 0.14 0.11 0.07 0.07 0.07 0.07 0.07 0.06 0.05 0.05 0.06 0.05
With agreed maturity
Up to 2 years 0.87 0.86 0.85 0.85 0.84 0.85 0.84 0.83 0.83 0.83 0.84 0.83 0.82 0.80 0.82
Over 2 years 3.85 3.83 3.87 3.79 3.75 3.66 3.57 3.56 3.62 3.38 3.42 3.19 3.10 3.10 3.08
Redeemable at notice2
Up to 3 months 0.14 0.14 0.14 0.14 0.14 0.14 0.14 0.14 0.11 0.09 0.09 0.08 0.09 0.06 0.08
Over 3 months x x x x x x x x x x x x x x x
Non-financial corporations
Overnight1 0.07 0.07 0.11 0.11 0.09 0.09 0.08 0.07 0.06 0.05 0.06 0.05 0.05 0.05 0.05
With agreed maturity
Up to 2 years 0.45 0.45 0.45 0.46 0.48 0.47 0.48 0.49 0.47 0.55 0.40 0.39 0.41 0.39 0.33
Over 2 years 1.81 1.78 1.51 1.60 1.56 1.53 1.53 1.49 1.32 1.28 1.13 0.93 0.98 0.91 0.91
Repos – – – – – – – – – – – – – – –
2014
1 End-of-period. 2 For this instrument category, households and non-financial corporations are merged and allocated to the household sector.
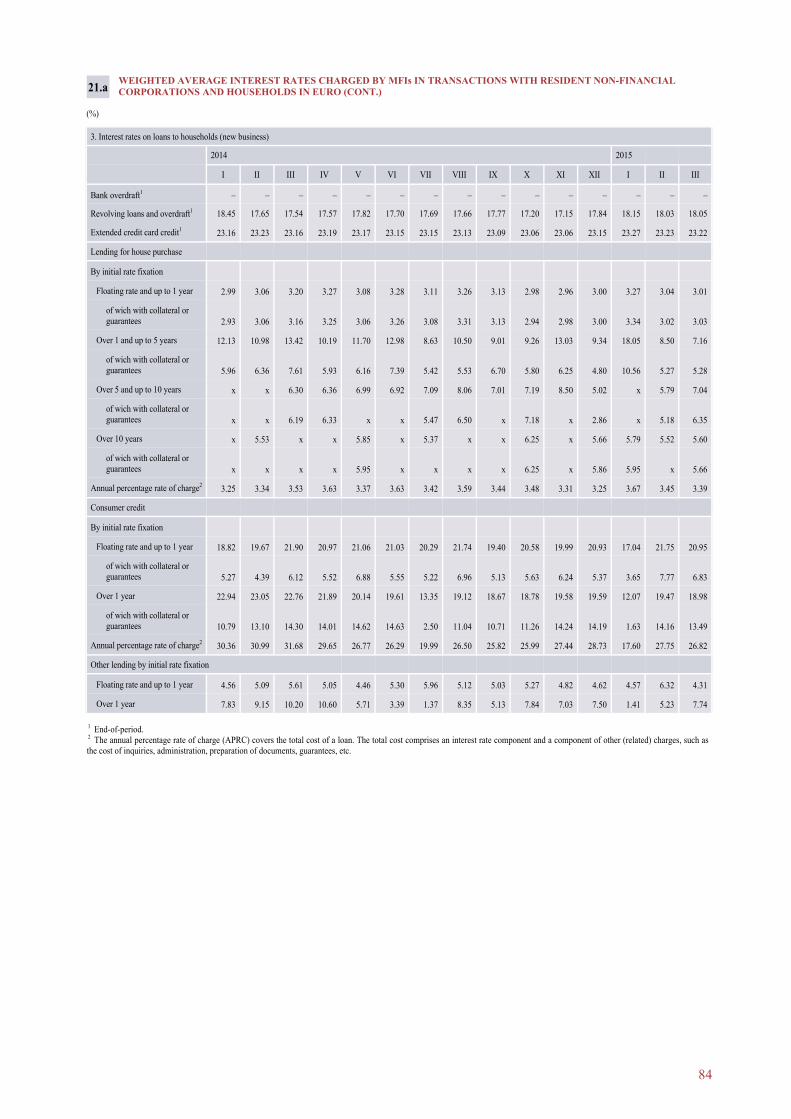
84
WEIGHTED AVERAGE INTEREST RATES CHARGED BY MFIs IN TRANSACTIONS WITH RESIDENT NON-FINANCIAL CORPORATIONS AND HOUSEHOLDS IN EURO (CONT.) (%)
21.a
1 End-of-period. 2 The annual percentage rate of charge (APRC) covers the total cost of a loan. The total cost comprises an interest rate component and a component of other (related) charges, such as the cost of inquiries, administration, preparation of documents, guarantees, etc.
3. Interest rates on loans to households (new business)
2014 2015
I II III IV V VI VII VIII IX X XI XII I II III
Bank overdraft1 – – – – – – – – – – – – – – –
Revolving loans and overdraft1 18.45 17.65 17.54 17.57 17.82 17.70 17.69 17.66 17.77 17.20 17.15 17.84 18.15 18.03 18.05
Extended credit card credit1 23.16 23.23 23.16 23.19 23.17 23.15 23.15 23.13 23.09 23.06 23.06 23.15 23.27 23.23 23.22
Lending for house purchase
By initial rate fixation
Floating rate and up to 1 year 2.99 3.06 3.20 3.27 3.08 3.28 3.11 3.26 3.13 2.98 2.96 3.00 3.27 3.04 3.01
of wich with collateral or guarantees 2.93 3.06 3.16 3.25 3.06 3.26 3.08 3.31 3.13 2.94 2.98 3.00 3.34 3.02 3.03
Over 1 and up to 5 years 12.13 10.98 13.42 10.19 11.70 12.98 8.63 10.50 9.01 9.26 13.03 9.34 18.05 8.50 7.16
of wich with collateral or guarantees 5.96 6.36 7.61 5.93 6.16 7.39 5.42 5.53 6.70 5.80 6.25 4.80 10.56 5.27 5.28
Over 5 and up to 10 years x x 6.30 6.36 6.99 6.92 7.09 8.06 7.01 7.19 8.50 5.02 x 5.79 7.04
of wich with collateral or guarantees x x 6.19 6.33 x x 5.47 6.50 x 7.18 x 2.86 x 5.18 6.35
Over 10 years x 5.53 x x 5.85 x 5.37 x x 6.25 x 5.66 5.79 5.52 5.60
of wich with collateral or guarantees x x x x 5.95 x x x x 6.25 x 5.86 5.95 x 5.66
Annual percentage rate of charge2 3.25 3.34 3.53 3.63 3.37 3.63 3.42 3.59 3.44 3.48 3.31 3.25 3.67 3.45 3.39
Consumer credit
By initial rate fixation
Floating rate and up to 1 year 18.82 19.67 21.90 20.97 21.06 21.03 20.29 21.74 19.40 20.58 19.99 20.93 17.04 21.75 20.95
of wich with collateral or guarantees 5.27 4.39 6.12 5.52 6.88 5.55 5.22 6.96 5.13 5.63 6.24 5.37 3.65 7.77 6.83
Over 1 year 22.94 23.05 22.76 21.89 20.14 19.61 13.35 19.12 18.67 18.78 19.58 19.59 12.07 19.47 18.98
of wich with collateral or guarantees 10.79 13.10 14.30 14.01 14.62 14.63 2.50 11.04 10.71 11.26 14.24 14.19 1.63 14.16 13.49
Annual percentage rate of charge2 30.36 30.99 31.68 29.65 26.77 26.29 19.99 26.50 25.82 25.99 27.44 28.73 17.60 27.75 26.82
Other lending by initial rate fixation
Floating rate and up to 1 year 4.56 5.09 5.61 5.05 4.46 5.30 5.96 5.12 5.03 5.27 4.82 4.62 4.57 6.32 4.31
Over 1 year 7.83 9.15 10.20 10.60 5.71 3.39 1.37 8.35 5.13 7.84 7.03 7.50 1.41 5.23 7.74

85
WEIGHTED AVERAGE INTEREST RATES CHARGED BY MFIs IN TRANSACTIONS WITH RESIDENT NON-FINANCIAL CORPORATIONS AND HOUSEHOLDS IN EURO (CONT.) (%)
21.a
4. Interest rates on loans to non-financial corporations (new business)
2015
I II III IV V VI VII VIII IX X XI XII I II III
Bank overdraft1 – – – – – – – – – – – – – – –
Revolving loans and overdraft1 2.82 2.92 3.01 2.99 2.95 2.75 2.75 2.81 2.76 2.71 2.70 2.97 2.79 2.79 2.87
Extended credit card credit1 28.90 29.14 19.62 19.75 19.58 19.97 19.44 20.14 19.65 19.27 19.39 18.98 19.35 19.43 18.95
Other loans up to 0.25 million euro by initial rate fixation
Floating rate and up to 1 year 4.38 4.75 4.55 4.71 4.63 4.69 4.68 4.73 4.58 4.99 4.63 4.63 4.50 4.53 4.52
of wich with collateral or guarantees 4.26 4.60 4.52 4.60 4.44 4.63 4.62 4.55 4.38 4.81 4.49 4.48 4.33 4.49 4.34
Over 1 year x 4.36 5.88 6.83 7.81 4.71 6.22 7.21 2.94 6.44 6.23 6.20 6.84 8.39 6.81
of wich with collateral or guarantees x x 5.70 6.90 x 5.29 6.60 7.42 5.55 7.47 8.39 8.00 7.48 8.87 7.67
Other loans over 0.25 million euro and up to 1 million euro by initial rate fixation
Floating rate and up to 1 year 4.18 4.59 3.96 4.58 3.70 4.37 4.10 4.58 4.34 4.61 4.02 4.18 4.10 4.51 3.72
of wich with collateral or guarantees 4.22 4.68 3.95 4.61 3.67 4.40 4.08 4.60 4.41 4.65 3.91 4.18 4.01 4.57 3.72
Over 1 year x x 5.90 6.35 x x x 3.54 x x x 3.80 x x x
of wich with collateral or guarantees – x x x x x x x x x – 2.88 – x x
Other loans over 1 million euro by initial rate fixation
Floating rate and up to 1 year 3.14 3.66 3.37 4.24 2.51 2.76 3.35 2.95 4.03 3.30 2.55 3.28 3.32 3.15 3.25
of wich with collateral or guarantees 3.30 3.69 3.40 4.28 2.40 2.68 3.25 2.93 3.95 3.30 2.87 3.32 3.30 3.52 3.25
Over 1 year x x – x x x x x x x x 4.56 2.05 x x
of wich with collateral or guarantees x x – x – x x x x x x 4.56 x x x
2014
1 End-of-period.

86
WEIGHTED AVERAGE INTEREST RATES CHARGED BY MFIs IN TRANSACTIONS WITH RESIDENT NON-FINANCIAL CORPORATIONS AND HOUSEHOLDS IN EURO (CONT.) (%)
21.a
1 Including revolving loans, overdrafts, and extended and convenience credit card credit. 2 Including bank overdraft.
1 End-of-period. 2 For this instrument category, households and non-financial corporations are merged and allocated to the household sector.
WEIGHTED AVERAGE INTEREST RATES CHARGED BY MFIs IN TRANSACTIONS WITH RESIDENT NON-FINANCIAL CORPORATIONS AND HOUSEHOLDS IN US DOLLARS (%)
21.b
5. Interest rates on loans (outstanding amounts)
2015
I II III IV V VI VII VIII IX X XI XII I II III
Loans to households
Lending for house purchase, with maturity
Up to 1 year 3.85 2.66 2.86 9.40 9.30 3.06 7.57 4.06 3.96 3.24 3.63 4.17 4.24 4.41 4.94
Over 1 and up to 5 years 4.13 4.17 4.20 4.24 4.26 4.29 4.27 4.27 4.26 4.22 4.26 4.30 4.25 4.36 4.38
Over 5 years 2.55 2.56 2.56 2.57 2.58 2.57 2.55 2.53 2.49 2.46 2.43 2.43 2.42 2.41 2.40
Consumer credit and other loans, with maturity1
Up to 1 year2 22.86 19.19 19.34 19.29 19.53 19.71 19.60 19.48 19.67 19.66 19.64 20.33 20.36 20.51 20.26
Over 1 and up to 5 years 15.52 15.57 15.68 15.90 16.11 16.07 16.14 15.92 15.89 15.93 15.74 15.63 15.74 15.55 15.37
Over 5 years 6.36 5.44 5.41 5.46 5.48 5.46 5.43 5.45 5.34 5.32 5.28 5.59 5.58 5.52 5.52
Loans to non-financial corporations
With maturity1
Up to 1 year2 3.05 3.23 3.39 3.37 3.32 3.19 3.21 3.13 3.05 2.96 2.77 3.10 2.92 3.01 3.06
Over 1 and up to 5 years 3.34 3.39 3.41 3.46 3.44 3.43 3.36 3.37 3.30 3.25 3.30 3.24 3.32 3.30 3.29
Over 5 years 2.74 2.77 2.75 2.78 2.77 2.73 2.71 2.75 2.67 2.66 2.64 2.64 2.65 2.66 2.65
2014
1. Interest rates on deposits (new business)
2014 2015
I II III IV V VI VII VIII IX X XI XII I II III
Deposits from households
Overnight1 0.20 0.19 0.24 0.24 0.24 0.21 0.27 0.25 0.25 0.24 0.23 0.26 0.26 0.28 0.27
With agreed maturity
Up to 1 year 0.24 0.12 0.13 0.15 0.12 0.16 0.17 0.20 0.16 0.14 0.11 0.23 0.18 0.12 0.12
Over 1 and up to 2 years 1.10 1.39 0.65 1.03 1.25 1.19 0.89 0.96 1.05 1.01 1.21 0.93 1.04 1.04 1.03
Over 2 years 1.11 1.64 2.14 0.86 1.96 1.69 2.03 1.19 2.50 3.36 2.56 2.08 2.19 3.02 5.33
Redeemable at notice2
Up to 3 months 0.16 0.16 0.16 0.16 0.16 0.16 0.16 0.16 0.16 0.14 0.14 0.11 0.10 0.11 0.13
Over 3 months – – – – – – x – x – – – x x x
Deposits from non-financial corporations
Overnight1 0.07 0.09 0.06 0.05 0.07 0.06 0.06 0.06 0.05 0.05 0.04 0.04 0.04 0.05 0.05
With agreed maturity
Up to 1 year 0.07 0.04 0.04 0.05 0.05 0.07 0.08 0.06 0.20 0.14 0.08 0.10 0.08 0.10 0.10
Over 1 and up to 2 years x x – x – – – – x – – x – x –
Over 2 years – x x – – – – – – – – – – – –
Repos – – – – – – – – – – – – – – –

87
WEIGHTED AVERAGE INTEREST RATES CHARGED BY MFIs IN TRANSACTIONS WITH RESIDENT NON-FINANCIAL CORPORATIONS AND HOUSEHOLDS IN US DOLLARS (CONT.) (%)
21.b
1 End-of-period. 2 For this instrument category, households and non-financial corporations are merged and allocated to the household sector.
2. Interest rates on deposits (outstanding amounts)
2014 2015
I II III IV V VI VII VIII IX X XI XII I II III
Deposits from households
Overnight1 0.20 0.19 0.24 0.24 0.24 0.21 0.27 0.25 0.25 0.24 0.23 0.26 0.26 0.28 0.27
With agreed maturity
Up to 2 years 0.84 0.77 0.76 0.78 0.78 0.76 0.75 0.74 0.74 0.75 0.73 0.70 0.73 0.72 0.72
Over 2 years 2.79 2.81 2.84 2.99 3.00 2.97 2.97 2.99 2.99 3.01 2.97 2.98 2.92 2.98 3.21
Redeemable at notice2
Up to 3 months 0.16 0.16 0.16 0.16 0.16 0.16 0.16 0.16 0.16 0.14 0.14 0.11 0.10 0.11 0.13
Over 3 months – – – – – – x – x – – – x x x
Deposits from non-financial corporations
Overnight1 0.07 0.09 0.06 0.05 0.07 0.06 0.06 0.06 0.05 0.05 0.04 0.04 0.04 0.05 0.05
With agreed maturity
Up to 2 years 0.88 0.85 0.84 0.69 0.61 0.58 0.55 0.57 0.58 0.72 0.58 0.60 0.68 0.53 0.55
Over 2 years 0.20 0.32 0.34 0.34 0.34 0.34 0.34 0.34 0.34 0.31 0.34 0.34 0.29 0.29 0.29
Repos – – – – – – – – – – – – – – –

88
1 End-of-period. 2 The annual percentage rate of charge (APRC) covers the total cost of a loan. The total cost comprises an interest rate component and a component of other (related) charges, such as the cost of inquiries, administration, preparation of documents, guarantees, etc.
WEIGHTED AVERAGE INTEREST RATES CHARGED BY MFIs IN TRANSACTIONS WITH RESIDENT NON-FINANCIAL CORPORATIONS AND HOUSEHOLDS IN US DOLLARS (CONT.) (%)
21.b
3. Interest rates on loans to households (new business)
2014 2015
I II III IV V VI VII VIII IX X XI XII I II III
Bank overdraft1 – – – – – – – – – – – – – – –
Revolving loans and overdraft1 7.30 6.67 7.79 7.81 13.63 10.28 14.51 14.62 21.04 17.62 17.32 13.82 14.38 13.86 10.91
Extended credit card credit1 24.80 25.42 24.97 24.29 24.25 24.89 24.66 24.80 24.87 24.92 25.02 25.24 26.32 25.76 26.01
Lending for house purchase
By initial rate fixation
Floating rate and up to 1 year 3.55 2.79 3.22 2.16 2.28 4.20 3.22 2.45 2.13 4.93 x 2.29 2.86 2.84 5.59
of wich with collateral or guarantees 3.99 2.74 3.22 1.98 4.36 4.15 3.80 2.45 x 4.98 x 1.90 3.06 2.84 5.70
Over 1 and up to 5 years x – – – – – – x – – x x – – x
of wich with collateral or guarantees x – – – – – – x – – x x – – –
Over 5 and up to 10 years – – x x x – – – – – – x – x –
of wich with collateral or guarantees – – – – – – – – – – – x – – –
Over 10 years – x – – x – – – – – – x x – –
of wich with collateral or guarantees – x – – – – – – – – – – x – –
Annual percentage rate of charge2 4.01 3.01 3.41 2.31 2.83 4.24 3.48 2.54 2.15 4.98 4.65 4.80 3.18 3.02 6.15
Consumer credit
By initial rate fixation
Floating rate and up to 1 year x x x 14.94 x x 17.27 x x 17.79 x x x x 18.40
of wich with collateral or guarantees – x x x – – – x – – x – – – –
Over 1 year x x x x – – x – x – – – – – –
of wich with collateral or guarantees – – x – – – – – – – – – – – –
Annual percentage rate of charge2 17.77 17.68 16.50 15.22 17.36 17.55 17.35 17.88 17.55 17.87 18.89 17.57 16.91 17.37 18.40
Floating rate and up to 1 year x 3.78 3.59 x x 5.00 4.82 x 4.21 x x 3.76 3.21 4.84 4.11
Over 1 year – – – – – – – x – – x 3.50 – – –
Other lending by initial rate fixation
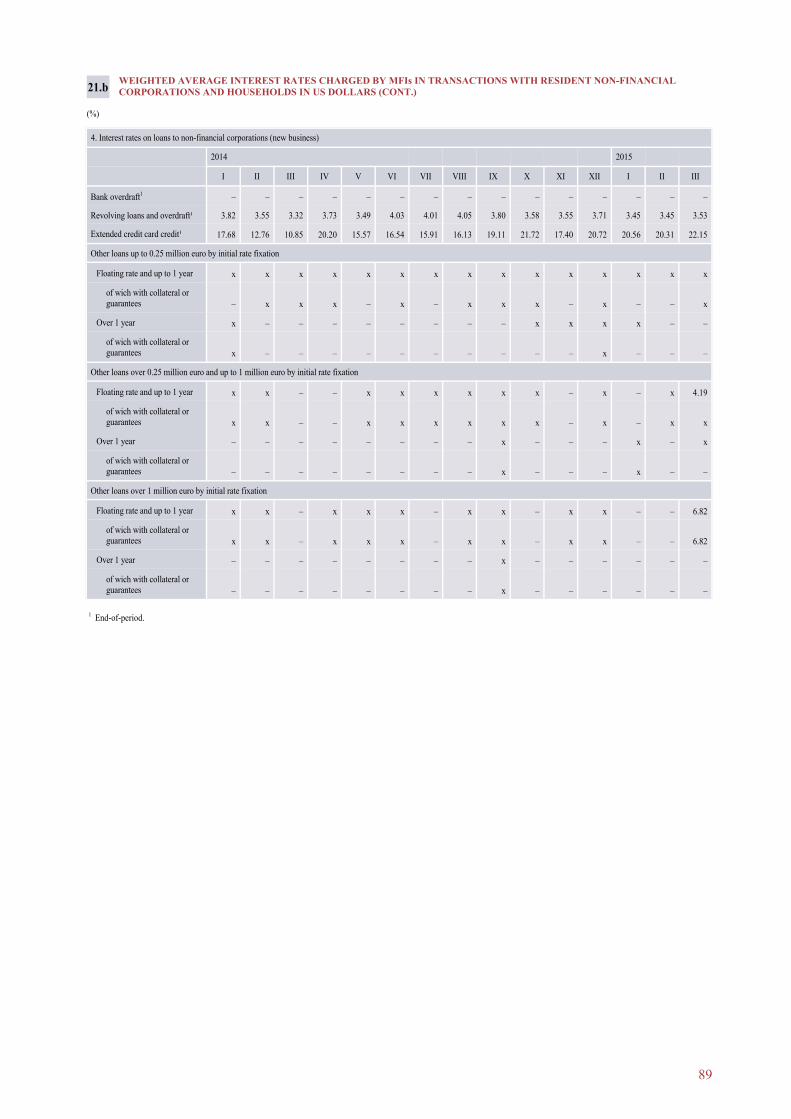
89
WEIGHTED AVERAGE INTEREST RATES CHARGED BY MFIs IN TRANSACTIONS WITH RESIDENT NON-FINANCIAL CORPORATIONS AND HOUSEHOLDS IN US DOLLARS (CONT.) (%)
21.b
1 End-of-period.
4. Interest rates on loans to non-financial corporations (new business)
2014
I II III IV V VI VII VIII IX
Bank overdraft1 – – – – – – – – –
Revolving loans and overdraft¹ 3.82 3.55 3.32 3.73 3.49 4.03 4.01 4.05 3.80
Extended credit card credit¹ 17.68 12.76 10.85 20.20 15.57 16.54 15.91 16.13 19.11
Other loans up to 0.25 million euro by initial rate fixation
Floating rate and up to 1 year x x x x x x x x x
of wich with collateral or guarantees – x x x – x – x x
Over 1 year x – – – – – – – –
of wich with collateral or guarantees x – – – – – – – –
Other loans over 0.25 million euro and up to 1 million euro by initial rate fixation
Floating rate and up to 1 year x x – – x x x x x
of wich with collateral or guarantees x x – – x x x x x
Over 1 year – – – – – – – – x
of wich with collateral or guarantees – – – – – – – – x
Other loans over 1 million euro by initial rate fixation
Floating rate and up to 1 year x x – x x x – x x
of wich with collateral or guarantees x x – x x x – x x
Over 1 year – – – – – – – – x
of wich with collateral or guarantees – – – – – – – – x
2015
X XI XII I II III
– – – – – –
3.58 3.55 3.71 3.45 3.45 3.53
21.72 17.40 20.72 20.56 20.31 22.15
x x x x x x
x – x – – x
x x x x – –
– – x – – –
x – x – x 4.19
x – x – x x
– – – x – x
– – – x – –
– x x – – 6.82
– x x – – 6.82
– – – – – –
– – – – – –

90
WEIGHTED AVERAGE INTEREST RATES CHARGED BY MFIs IN TRANSACTIONS WITH RESIDENT NON-FINANCIAL CORPORATIONS AND HOUSEHOLDS IN US DOLLARS (CONT.) (%)
21.b
1 Including revolving loans, overdrafts, and extended and convenience credit card credit. 2 Including bank overdraft.
5. Interest rates on loans (outstanding amounts)
2014
I II III IV V VI VII VIII IX
Loans to households
Lending for house purchase, with maturity
Up to 1 year 1.68 1.80 1.91 1.89 1.91 2.12 1.88 1.77 1.68
Over 1 and up to 5 years 6.13 5.35 5.33 5.34 5.39 5.34 5.33 5.33 5.39
Over 5 years 2.72 2.76 2.75 2.74 2.74 2.74 2.74 2.74 2.74
Consumer credit and other loans, with maturity1
Up to 1 year2 10.64 10.80 10.91 10.82 11.97 12.02 12.34 12.12 15.96
Over 1 and up to 5 years 7.39 7.42 7.23 7.23 7.27 7.47 7.14 7.14 7.11
Over 5 years 3.82 3.85 3.84 3.73 3.72 3.66 3.64 3.63 3.63
Loans to non-financial corporations
With maturity1
Up to 1 year2 4.38 4.07 4.07 3.93 3.79 4.13 4.21 4.39 3.96
Over 1 and up to 5 years 5.62 5.59 5.86 5.95 6.37 6.45 6.75 6.46 7.24
Over 5 years 5.76 5.71 5.74 5.78 6.05 6.12 6.20 6.11 6.21
2015
X XI XII I II III
1.78 1.85 1.96 1.67 1.87 1.89
5.11 5.09 5.14 5.17 5.20 6.89
2.74 2.75 2.73 2.73 2.73 2.73
16.23 17.23 13.62 13.65 13.63 13.78
7.17 7.12 6.57 6.54 6.72 6.69
3.45 3.47 3.73 3.67 3.79 4.07
3.77 3.75 4.07 3.77 3.79 4.09
7.09 6.69 6.75 5.31 5.27 5.25
6.28 6.30 5.56 5.57 5.51 5.60
2014
I II III IV V VI VII VIII IX
In euro
Loans up to an amount of 0.25 million euro 4.37 4.65 4.53 4.52 4.76 4.62 4.59 4.76 4.38
of wich with collateral or guarantees 4.22 4.48 4.50 4.42 4.61 4.55 4.55 4.65 4.30
Loans over an amount of 0.25 million euro and up to 1 million euro 4.19 4.45 3.62 4.76 4.23 4.41 4.05 4.65 4.15
of wich with collateral or guarantees 4.24 4.47 3.54 4.76 4.33 4.43 4.02 4.68 4.21
Loans over 1 million euro 2.98 3.66 3.47 3.94 2.49 2.76 3.35 2.67 3.93
of wich with collateral or guarantees 3.11 3.70 3.50 3.99 2.33 2.66 3.24 2.65 3.83
In US dollars
Loans up to an amount of 0.25 million euro x x x x x x x x x
of wich with collateral or guarantees – x x x – x – – –
Loans over an amount of 0.25 million euro and up to 1 million euro x – – – x x x x –
of wich with collateral or guarantees x – – – x x x x –
Loans over 1 million euro x – – x x x – x –
of wich with collateral or guarantees x – – x x x – x –
2015
X XI XII I II III
4.63 4.72 4.56 4.45 4.77 4.57
4.54 4.64 4.29 4.10 4.59 4.43
4.25 3.96 4.18 3.88 4.65 3.56
4.29 3.93 4.18 3.87 4.65 3.52
3.26 2.58 3.81 2.54 3.51 3.23
3.26 2.96 3.83 x 3.51 3.23
x x x x x x
– – x – – x
x – x – – –
x – x – – –
– x x – – 6.82
– x x – – 6.82
WEIGHTED AVERAGE INTEREST RATES CHARGED BY MFIs IN TRANSACTIONS WITH RESIDENT NON-FINANCIAL CORPORATIONS (NEW BUSINESS) (with floating interest rate, up to 1 year initial rate fixation and original maturity of over 1 year; %)
21.c

91
Loans to non-resident MFIs Total loans
Overnight Up to 1 month 1–3 months Over 3 months
I 44 792.6 5 596.6 24.2 164.0 50 577.4 53 701.1
II 36 019.2 4 687.7 70.7 19.4 40 797.0 43 379.3
III 39 538.2 3 354.8 27.8 20.7 42 941.5 45 609.9
IV 34 055.7 4 868.6 62.8 24.4 39 011.5 40 665.0
V 29 643.6 5 718.2 16.7 35.6 35 414.1 36 744.1
VI 31 728.6 5 510.7 167.2 340.9 37 747.4 38 907.6
VII 37 444.9 4 329.6 10.0 134.1 41 918.6 43 739.2
VIII 33 004.2 5 373.2 146.7 78.0 38 602.1 40 688.2
IX 36 708.4 4 183.5 132.2 30.8 41 054.9 43 282.8
X 36 497.9 4 819.3 10.4 23.6 41 351.2 43 878.5
XI 37 016.8 4 999.9 175.4 6.4 42 198.5 44 333.6
XII 43 359.7 5 344.8 73.6 27.0 48 805.1 51 161.9
2015
I 46 084.6 4 324.9 186.1 212.4 50 808.0 52 817.6
II 44 231.6 3 923.9 275.4 1.9 48 432.8 50 511.7
III 43 118.7 3 568.7 136.1 2.3 46 825.8 48 887.0
2014
LENDING IN THE INTERBANK MARKETS (transactions; millions of euro)
Loans to resident MFIs
In euro In foreign currencies
Overnight Up to 1 month
1–3 months Over 3 months
Overnight Up to 1 month
1–3 months Over 3 months
I 906.8 348.5 0.5 – 1 255.8 1 500.6 367.3 – – 1 867.9 3 123.7
II 956.0 240.7 0.2 – 1 196.9 1 165.2 220.2 – – 1 385.4 2 582.3
III 911.9 110.3 0.2 – 1 022.4 1 532.5 113.5 – – 1 646.0 2 668.4
IV 200.6 55.6 25.0 – 281.2 883.7 488.6 – – 1 372.3 1 653.5
V 263.5 72.7 0.2 – 336.4 470.8 522.8 – – 993.6 1 330.0
VI 107.0 91.7 0.1 0.2 199.0 492.6 468.6 – – 961.2 1 160.2
VII 5.0 142.7 0.4 – 148.1 1 075.6 596.8 0.1 – 1 672.5 1 820.6
VIII 56.7 144.8 0.2 – 201.7 1 238.1 646.3 – – 1 884.4 2 086.1
IX 140.7 92.4 – – 233.1 1 265.9 728.9 – – 1 994.8 2 227.9
X 230.1 92.2 0.4 – 322.7 1 397.0 807.6 – – 2 204.6 2 527.3
XI 170.0 100.7 0.4 – 271.1 1 131.4 732.6 – – 1 864.0 2 135.1
XII 90.0 47.9 – – 137.9 1 497.4 719.1 1.5 0.9 2 218.9 2 356.8
2015
I – 16.7 0.5 – 17.2 1 475.8 516.6 – – 1 992.4 2 009.6
II – 16.9 0.2 – 17.1 1 540.9 520.9 – – 2 061.8 2 078.9
III 0.1 17.0 – – 17.1 1 308.3 735.8 – – 2 044.1 2 061.2
2014
22. 22.

92
INTEREST RATES IN THE DOMESTIC INTERBANK MARKET (% per annum)
2014
I II III IV V VI VII VIII IX X XI XII I II III
Weighted average interest rates on loans in euro
Overnight 0.1 0.1 0.1 0.1 0.1 0.1 0 0 0 0 0 0 – – –0.2
Up to 1 month 0.1 0.1 0.1 0.1 0.1 0.1 0.03 0.02 0.01 0 0 0.01 0 0 0
1–3 months 0.2 0.1 0.1 0.2 0.2 0.1 0.1 0.2 – –0.02 0.02 – 0 0 –
Over 3 months – – – – – 0.1 – – – – – – – – –
Weighted average interest rates on loans in foreign currencies
Overnight 0.1 0.1 0.1 0.1 0.1 0.1 0.1 0.1 0.1 0.1 0.1 0.1 0.1 0.1 0.1
Up to 1 month 0.1 0.1 0.04 0.03 0.1 0.03 0.04 0.1 0.1 0.1 0.1 0.1 0.1 0.1 0.1
1–3 months – – – – – – 0.02 – – – – 0.03 – – –
Over 3 months – – – – – – – – – – – 0.1 – – –
2015
PRINCIPAL FOREIGN EXCHANGE TRANSACTIONS (BY TYPE, COUNTERPARTY AND CURRENCY)1 (millions of euro)
2014
I II III IV V VI VII VIII IX X XI XII I II III
Type of transaction
Spot exchange transactions 18 767.8 24 116.8 33 654.7 32 783.2 25 429.4 22 735.8 19 735.1 14 935.3 23 141.0 23 092.3 16 121.9 19 749.3 18 736.8 22 507.1 17 479.0
Forward exchange contracts 377.5 306.7 523.5 413.6 467.8 318.8 530.1 346.9 557.1 440.2 315.2 464.3 435.8 280.2 475.6
Currency swap arrangements 55 675.7 51 876.7 59 457.8 60 245.6 55 891.5 51 982.5 46 450.0 41 110.5 38 817.2 30 816.7 17 947.6 27 079.3 28 316.8 30 621.8 32 636.9
Counterparties
Resident MFIs 5 122.8 5 527.8 8 245.0 8 217.9 7 566.4 6 867.8 2 191.4 1 151.3 1 453.2 645.5 590.9 557.3 352.5 329.7 558.4
Resident other financial intermediaries, financial auxiliaries, insurance corporations and pension funds 92.9 43.5 130.6 41.5 44.3 141.4 72.6 47.9 253.5 15.5 27.8 132.3 55.6 24.4 159.2
Resident government, non-financial corporations and non-profit institutions serving households 488.1 379.1 487.4 474.0 414.7 404.3 392.5 315.4 385.5 436.2 239.4 392.4 290.8 242.2 291.6
Non-resident MFIs 43 858.7 43 916.8 52 182.9 54 537.1 48 422.9 40 859.4 34 654.0 33 666.1 37 381.2 32 242.5 20 204.5 25 152.0 26 793.9 33 191.9 31 793.7
Non-resident other financial intermediaries, financial auxiliaries, insurance corporations and pension funds 5 274.4 4 236.8 4 328.1 2 948.0 2 265.7 3 672.8 6 493.3 5 758.0 6 828.9 4 240.3 2 108.4 4 433.0 3 736.7 3 596.1 4 816.1
Non-resident government, non-financial corporations and non-profit institutions serving households 17 925.5 20 331.7 25 379.4 24 510.5 20 561.2 20 049.5 20 133.0 13 572.3 15 206.6 15 149.1 8 902.1 14 594.6 14 340.1 15 196.8 12 174.4
Households 2 058.5 1 864.4 2 882.6 2 713.5 2 513.5 3 041.9 2 778.5 1 881.6 1 006.5 1 620.2 2 311.5 2 031.4 1 919.6 828.1 798.0
Currencies
Total in all currencies 74 821.0 76 300.2 93 635.9 93 442.4 81 788.6 75 037.1 66 715.3 56 392.6 62 515.4 54 349.2 34 384.6 47 292.9 47 489.3 53 409.1 50 591.4
incl. USD for EUR 40 544.4 42 207.6 54 039.7 54 310.5 46 404.3 40 307.2 35 515.6 29 351.1 33 851.0 28 018.3 16 115.4 25 129.7 30 262.5 34 282.3 30 882.0
incl. GBP for EUR 1 497.9 1 399.9 2 726.9 3 833.2 2 203.7 1 223.6 366.3 441.8 468.7 680.6 498.6 233.0 490.8 323.6 1 023.1
incl. other currencies for EUR 3 489.3 3 689.8 3 701.9 3 721.6 3 468.4 2 502.9 2 392.6 2 150.1 2 073.5 2 093.1 2 046.2 1 496.8 2 314.3 2 139.8 2 063.4
1 Including the cash and non-cash transactions performed by credit institutions. The volume of cash and non-cash transactions has been translated into euro applying the exchange rate of the respective foreign currency as set by Latvijas Banka on the last day of the reporting month.
2015
23.
24.

93
NON-CASH FOREIGN EXCHANGE TRANSACTIONS1 (millions of euro)
2014 2015
I II III IV V VI VII VIII IX X XI XII I II III
USD for EUR
Amount 40 524.8 42 189.8 54 021.4 54 292.6 46 384.6 40 290.2 35 492.4 29 329.6 33 829.7 28 000.2 16 103.3 25 111.4 30 246.1 34 267.7 30 867.5
%2 54.2 55.3 57.7 58.1 56.7 53.7 53.2 52.0 54.1 51.5 46.9 53.1 63.5 64.0 61.0
GBP for EUR
Amount 1 493.7 1 396.4 2 723.0 3 828.7 2 199.6 1 218.2 358.8 435.5 463.6 673.5 493.7 221.8 484.6 319.1 1 017.6
%2 2.0 1.8 2.9 4.1 2.7 1.6 0.5 0.8 0.7 1.2 1.4 0.5 1.0 0.6 2.0
Other currencies (except USD and GBP) for EUR
Amount 3 484.2 3 685.4 3 696.9 3 716.6 3 463.0 2 496.9 2 385.5 2 143.4 2 067.3 2 087.7 2 043.1 1 490.3 2 469.3 2 198.4 2 060.3
%2 4.7 4.8 4.0 4.0 4.2 3.3 3.6 3.8 3.3 3.8 5.9 3.2 5.2 4.1 4.1
RUB for USD
Amount 6 440.1 8 578.4 9 386.5 8 827.1 7 636.9 8 506.3 7 804.5 8 534.9 8 747.9 9 006.8 6 994.5 7 041.1 3 882.4 6 073.3 5 930.1
%2 8.6 11.2 10.0 9.5 9.4 11.4 11.7 15.1 14.1 16.6 20.3 14.9 8.1 11.3 11.7
GBP for USD
Amount 12 480.9 11 271.9 12 931.5 14 491.6 13 229.5 13 088.1 9 841.6 6 514.3 9 380.0 5 955.9 3 434.3 6 208.5 3 846.5 5 178.8 4 441.8
%2 16.7 14.8 13.8 15.5 16.2 17.5 14.8 11.6 15.0 11.0 10.0 13.1 8.1 9.7 8.8
SEK for USD
Amount 76.4 209.6 247.8 189.1 202.7 313.1 462.1 416.2 384.5 299.1 20.4 30.6 44.9 49.7 67.9
%2 0.1 0.3 0.3 0.2 0.2 0.4 0.7 0.7 0.6 0.6 0.1 0.1 0.1 0.1 0.1
Other currencies (except EUR, RUB, GBP and SEK) for USD
Amount 7 278.2 6 603.3 8 149.6 6 387.6 6 634.1 6 757.6 8 111.7 7 491.3 6 997.8 7 231.2 4 568.3 6 052.5 4 951.9 3 578.8 4 918.9
%2 9.7 8.7 8.7 6.8 8.1 9.0 12.2 13.3 11.2 13.3 13.3 12.8 10.4 6.7 9.7
Other currencies (except EUR and USD) for other currencies
Amount 3 008.9 2 347.8 2 446.3 1 679.8 2 007.3 2 345.1 2 228.0 1 499.2 619.8 1 061.8 704.8 1 105.2 1 715.0 1 905.6 1 296.6
%2 4.0 3.1 2.6 1.8 2.5 3.1 3.3 2.7 1.0 2.0 2.1 2.3 3.6 3.5 2.6
1 Including non-cash transactions performed by credit institutions, reported by major currency. 2 As per cent of the total.
25.
EURO FOREIGN EXCHANGE REFERENCE RATES PUBLISHED BY THE ECB (end-of-period; foreign currency vs 1 EUR)
2014 2015
I II III IV V VI VII VIII IX X XI XII I II III
USD 1.3516 1.3813 1.3788 1.3850 1.3607 1.3658 1.3379 1.3188 1.2583 1.2524 1.2483 1.2141 1.1305 1.1240 1.0759
GBP 0.8214 0.8263 0.8282 0.8230 0.8131 0.8015 0.7928 0.7953 0.7773 0.7843 0.7953 0.7789 0.7511 0.7278 0.7273
JPY 138.1300 140.6300 142.4200 142.0700 138.3600 138.4400 137.6600 137.1100 138.1100 140.1800 147.6900 145.2300 133.0800 134.0500 128.9500
CHF 1.2220 1.2153 1.2194 1.2200 1.2204 1.2156 1.2169 1.2061 1.2063 1.2067 1.2018 1.2024 1.0468 1.0636 1.0463
26.

94
WEIGHTED AVERAGE EXCHANGE RATES (CASH TRANSACTIONS)1 (foreign currency vs EUR)
2014
I II III IV V VI VII VIII IX X XI XII I II III
USD
Buy 1.3694 1.3723 1.3897 1.3901 1.3815 1.3703 1.3642 1.3432 1.3006 1.2759 1.2568 1.2421 1.1739 1.1419 1.0948
Sell 1.3590 1.3622 1.3757 1.3794 1.3724 1.3595 1.3554 1.3353 1.2893 1.2637 1.2443 1.2324 1.1594 1.1229 1.0771
GBP
Buy 0.8382 0.8343 0.8438 0.8357 0.8280 0.8165 0.8078 0.8094 0.8042 0.7971 0.7978 0.7972 0.7768 0.7529 0.7333
Sell 0.8279 0.8219 0.8289 0.8247 0.8151 0.8049 0.7950 0.7983 0.7913 0.7856 0.7866 0.7868 0.7652 0.7385 0.7177
JPY
Buy 146.0264 143.2043 144.1188 142.9082 143.1593 145.7061 142.3464 143.8699 143.0721 142.4171 146.5523 151.0591 138.6371 138.1045 135.9340
Sell 140.7426 141.6543 139.1933 139.8647 138.5742 136.0955 137.0976 139.0408 139.4604 135.8566 136.4692 143.4504 136.0851 131.9304 127.8662
SEK
Buy 8.9392 9.0262 9.3177 9.1708 9.1994 9.1953 9.5185 9.3027 9.3117 9.2929 9.3453 9.6079 9.6123 9.6325 9.3813
Sell 8.7432 8.7663 8.7881 8.9205 8.8815 8.9293 9.1009 9.0562 9.0882 9.0991 9.1337 9.3204 9.3084 9.3539 9.1350
RUB
Buy 47.1407 48.7524 50.5964 49.8121 48.7251 47.3517 47.6471 48.9239 49.5005 52.2568 56.4581 69.8752 75.5179 73.3908 65.3114
Sell 45.7601 47.4479 49.7964 48.7785 47.1851 46.2444 46.3340 47.7862 48.5698 50.7592 56.2473 67.7851 72.1270 70.7611 63.5742
CHF
Buy 1.2457 1.2350 1.2306 1.2340 1.2345 1.2337 1.2326 1.2316 1.2250 1.2277 1.2208 1.2211 1.0896 1.0813 1.0736
Sell 1.2256 1.2177 1.2125 1.2154 1.2089 1.2127 1.1853 1.2117 1.2045 1.2034 1.2004 1.1978 1.0987 1.0542 1.0559
1 Including the weighted average exchange rates of cash transactions performed by credit institutions and currency exchange bureaus.
2015
27.

95
STRUCTURE OF GOVERNMENT SECURITIES (at end of period; millions of euro)
2014 2015
I II III IV V VI VII VIII IX X XI XII I II III
Stock of government securities outstanding 951.6 972.4 973.9 990.7 1 008.6 1 044.4 1 066.8 1 052.6 1 051.7 1 040.4 1 058.6 1 046.5 1 126.5 1 142.1 1 157.1
Residents 908.7 918.1 918.7 939.3 963.3 998.1 1 018.1 1 004.8 1 007.3 996.2 997.4 981.7 1 061.8 1 087.7 1 100.8
Non-financial corporations 29.3 29.3 29.3 28.8 28.8 30.3 28.8 28.8 28.7 28.7 29.7 29.7 29.7 29.7 29.7
Central bank 0 0 0 0 0 0 0 0 0 0 0 0 0.3 0.3 11.4
Credit institutions 446.7 444.9 438.8 406.5 420.5 444.1 453.7 445.7 448.0 422.8 425.9 397.0 444.1 467.0 474.0
Money market funds 10.4 12.1 12.6 12.4 12.6 12.4 11.5 10.3 10.4 10.4 6.8 6.1 4.4 0.9 0.3
MFIs excluding central banks, credit institutions and money market funds 0 0 0 0 0 0 0 0 0 0 0 0 0 0 0
Other financial intermediaries excluding investment funds 88.5 88.5 88.5 84.9 84.9 84.9 82.9 80.8 77.0 77.0 73.2 69.2 69.2 69.2 66.2
Financial auxiliaries 8.6 8.6 8.6 8.6 8.6 8.6 8.6 8.6 8.6 8.6 8.6 8.6 8.6 8.6 8.6
Insurance corporations and pension funds 317.5 326.7 332.9 390.0 399.9 409.6 424.3 422.3 425.8 440.1 444.2 462.3 496.7 502.9 500.5
Insurance corporations x x x x x x x x x x x 62.9 92.9 94.3 94.0
Pension funds x x x x x x x x x x x 399.4 403.8 408.6 406.5
Central government 0 0 0 0 0 0 0 0 0 0 0 0 0 0 0
Households 4.6 4.6 4.6 4.4 4.3 4.4 4.4 4.5 4.5 4.3 4.4 4.0 4.0 3.9 3.8
Non-profit institutions serving households 3.1 3.4 3.4 3.6 3.6 3.8 3.8 3.8 4.3 4.3 4.7 4.8 4.8 5.3 6.4
Non-residents 42.9 54.2 55.2 51.3 45.3 46.3 48.7 47.8 44.4 44.2 61.2 64.9 64.8 54.4 56.3
Non-financial corporations 0 0 0 0 0 0 0 0 0 0 0 0 0 0 0
Credit institutions 30.9 35.9 34.5 33.9 31.2 31.1 31.3 31.0 26.6 26.0 35.5 36.2 36.4 31.6 32.2
Money market funds 0 0 0 0 0 0 0 0 0 0 0 0 0 0 0
MFIs excluding central banks, credit institutions and money market funds 0 0 0 0 0 0 0 0 0 0 0 0 0 0 0
Other financial intermediaries excluding investment funds 0 0 0 0 0 0 0 0 0 0 0 0 0 0 0
Financial auxiliaries 11.9 18.2 20.5 17.3 14.0 15.1 17.3 16.7 17.6 18.0 25.6 28.6 28.2 22.6 24.0
Insurance corporations and pension funds 0 0 0 0 0 0 0 0 0 0 0 0 0 0 0
Central government 0 0 0 0 0 0 0 0 0 0 0 0 0 0 0
Households 0.1 0.1 0.1 0.1 0.1 0.1 0.1 0.1 0.1 0.1 0.1 0.1 0.1 0.1 0.1
Non-profit institutions serving households 0 0 0 0 0 0 0 0 0 0 0 0 0 0 0
28.

96
AUCTIONS OF GOVERNMENT SECURITIES IN THE PRIMARY MARKET (Q4 2014 and Q1 2015)
Date (dd.mm.) Initial maturity (months) Supply (thousands of euro) Demand (thousands of euro) Purchase (thousands of euro) Weighted average discount rate (%)
Competitive multi-price auctions
22.10. 60 16 000 75 650 16 000 1.437
05.11. 12 12 000 49 000 12 000 0.068
26.11. 60 16 000 101 550 16 000 1.218
10.12. 60 16 000 80 715 16 000 1.099
14.01. 6 24 000 100 000 24 000 0.041
21.01. 36 16 000 131 425 16 000 0.280
04.02. 36 24 000 136 410 24 000 0.257
18.03. 36 24 000 135 800 24 000 0.194
Primary placement of government securities via outright sales of securities
22.10. 60 4 000 12 010 4 000 1.437
05.11. 12 3 000 9 010 3 000 0.068
26.11. 60 4 000 16 000 4 000 1.218
10.12. 60 4 000 16 000 4 000 1.099
14.01. 6 6 000 65 010 6 000 0.041
21.01. 36 4 000 18 801 4 000 0.280
04.02. 36 6 000 49 010 6 000 0.257
18.03. 36 6 000 51 750 6 000 0.194
29.
DYNAMICS OF GDP
20141 2015
Q1 Q2 Q3 Q4 Q1
At current prices (millions of euro) 24 059.7 5 370.2 5 942.1 6 288.6 6 458.8 5 509.6
At constant prices2 (millions of euro) 21 333.4 5 285.1 5 320.8 5 343.6 5 370.8 5 388.2
Annual growth rate (%) 2.4 2.3 3.3 2.3 2.0 2.0
Gross value added 2.0 3.0 2.0 1.7 1.5 1.4
1 Data have been revised. 2 Chain-linked; average prices in 2010. Quarterly data seasonally adjusted.
30.

97
LATVIAN FOREIGN TRADE BALANCE (millions of euro; exports – in FOB prices, imports – in CIF prices)
20141 2015
Q1 Q2 Q3 Q4 Q1
Exports 10 253.7 2 412.4 2 448.9 2 595.1 2 797.3 2 421.6
Imports 12 676.9 3 020.4 3 061.4 3 228.5 3 366.6 2 897.4
Balance –2 423.1 –608.1 –612.4 –633.4 –569.3 –475.8
CHANGES IN THE AVERAGE MONTHLY WAGES AND SALARIES AND UNEMPLOYMENT
2014 2015
I II III IV V VI VII VIII IX X XI XII I II III
EUR per month 744 723 753 766 756 765 802 757 758 772 761 824 778 766 812
Year-on-year changes (%) 107.7 106.9 107.5 107.2 105.5 107.0 106.8 106.1 108.0 106.9 107.2 106.3 104.7 106.0 107.7
Real net wage index (year-on-year basis; %) 109.3 108.3 109.2 108.5 107.0 108.3 107.5 106.5 108.3 108.0 108.1 108.0 105.7 106.7 108.1
Number of registered unemployed persons
At end of month 96 762 97 736 96 696 92 010 87 780 85 296 83 163 80 938 79 104 79 183 79 869 82 027 86 246 87 873 86 604
Year-on-year changes (%) 90.0 90.8 90.3 89.5 89.8 90.0 89.4 88.7 88.4 88.4 87.2 87.9 89.1 89.9 89.6
1 Data have been revised.
Average gross wages and salaries1
20141
I II III IV V VI VII VIII IX
Exports 745.7 799.7 867.0 844.6 820.7 783.7 848.3 815.2 931.6
Imports 947.3 975.6 1 097.5 1 076.7 995.3 989.4 1 080.3 999.8 1 148.4
Balance –201.7 –175.9 –230.5 –232.1 –174.6 –205.7 –232.0 –184.6 –216.7
1 Data have been revised.
2015
X XI XII I II III
1 061.7 911.9 823.7 786.2 770.7 864.7
1 183.1 1 084.1 1 099.3 914.7 925.6 1 057.2
–121.4 –172.2 –275.6 –128.5 –154.9 –192.5
31.
32.

98
MAIN EXPORT GOODS OF LATVIA (in FOB prices)
2015
Q1 Q2 Q3 Q4 Q1
Millions of euro
% Millions of euro
% Millions of euro
% Millions of euro
% Millions of euro
% Millions of euro
%
Total 10 253.7 100.0 2 412.4 100.0 2 448.9 100.0 2 595.1 100.0 2 797.3 100.0 2 421.6 100.0
Agricultural and food products 1 983.7 19.3 481.2 19.9 398.8 16.3 462.9 17.8 640.8 22.9 383.9 15.9
Mineral products 849.6 8.3 182.8 7.6 197.8 8.1 235.9 9.1 233.1 8.3 192.4 7.9
Products of the chemical and allied industries 700.5 6.8 158.3 6.6 177.4 7.2 175.2 6.8 189.6 6.8 167.0 6.9
Plastics and articles thereof; rubber and articles thereof 320.0 3.1 67.6 2.8 79.9 3.3 86.9 3.4 85.6 3.1 73.1 3.0
Wood and articles of wood 1 699.7 16.6 418.7 17.4 441.3 18.0 426.1 16.4 413.6 14.8 437.7 18.1
Pulp of wood; paper and paperboard 214.7 2.1 51.1 2.1 49.7 2.0 55.6 2.1 58.3 2.1 57.7 2.4
Textiles and textile articles 418.8 4.1 106.0 4.4 93.6 3.8 105.0 4.0 114.1 4.1 103.8 4.3
Articles of stone, plaster, cement, glassware and ceramic products 228.0 2.2 52.9 2.2 60.4 2.5 61.4 2.4 53.2 1.9 61.7 2.5
Base metals and articles of base metals 926.4 9.0 221.9 9.2 262.8 10.7 234.3 9.0 207.5 7.4 218.8 9.0
Machinery and mechanical appliances; electrical equipment 1 728.9 16.9 377.3 15.6 400.5 16.4 447.6 17.3 503.5 18.0 461.8 19.1
Transport vehicles 528.9 5.2 136.4 5.7 132.7 5.4 133.0 5.1 126.7 4.5 107.8 4.4
Miscellaneous manufactured articles 320.9 3.1 73.3 3.0 78.3 3.2 82.2 3.2 87.1 3.1 88.9 3.7
Other goods 333.7 3.3 84.9 3.5 75.6 3.1 88.9 3.4 84.3 3.0 67.1 2.8
1 Data have been revised.
20141
33.
MAIN IMPORT GOODS OF LATVIA (in CIF prices)
20141
Q1 Q2 Q3
Millions of euro
% Millions of euro
% Millions of euro
% Millions of euro
%
Total 12 676.9 100.0 3 020.4 100.0 3 061.4 100.0 3 228.5 100.0
Agricultural and food products 1 997.8 15.7 495.3 16.4 481.4 15.7 498.7 15.4
Mineral products 1 843.1 14.5 456.7 15.1 426.8 13.9 447.9 13.9
Products of the chemical and allied industries 1 199.8 9.5 300.7 10.0 306.6 10.0 288.8 8.9
Plastics and articles thereof; rubber and articles thereof 735.2 5.8 164.4 5.4 181.1 5.9 209.3 6.5
Wood and articles of wood 331.9 2.6 74.0 2.5 90.5 3.0 76.7 2.4
Pulp of wood; paper and paperboard 305.5 2.4 72.8 2.4 73.4 2.4 81.9 2.5
Textiles and textile articles 586.8 4.6 152.0 5.0 136.4 4.5 157.4 4.9
Articles of stone, plaster, cement, glassware and ceramic products 237.4 1.9 51.4 1.7 61.0 2.0 65.4 2.0
Base metals and articles of base metals 1 047.9 8.3 263.1 8.7 262.0 8.6 273.5 8.5
Machinery and mechanical appliances; electrical equipment 2 547.2 20.1 562.0 18.6 581.1 19.0 669.3 20.7
Transport vehicles 974.6 7.7 216.9 7.2 264.4 8.6 231.1 7.2
Miscellaneous manufactured articles 299.6 2.4 66.7 2.2 67.4 2.2 80.2 2.5
Other goods 570.1 4.5 144.4 4.8 129.2 4.2 148.2 4.6
1 Data have been revised.
2015
Q4 Q1
Millions of euro
% Millions of euro
%
3 366.6 100.0 2 897.4 100.0
522.6 15.5 430.4 14.8
511.7 15.2 352.6 12.2
303.7 9.0 324.5 11.2
180.4 5.4 169.6 5.9
90.6 2.7 90.0 3.1
77.4 2.3 73.0 2.5
141.0 4.2 136.7 4.7
59.5 1.8 50.3 1.7
249.3 7.4 244.1 8.4
734.7 21.8 615.9 21.3
262.1 7.8 212.1 7.3
85.3 2.5 71.2 2.5
148.2 4.4 127.0 4.4
34.

99
LATVIAN FOREIGN TRADE PARTNERS (exports – in FOB prices, imports – in CIF prices)
Q4 Q1
Millions of euro % of the total Millions of euro % of the total Millions of euro % of the total
Exports Imports Balance Exports Imports Exports Imports Balance Exports Imports Exports Imports Balance Exports Imports
Total 10 253.7 12 676.9 –2 423.1 100.0 100.0 2 797.3 3 366.6 –569.3 100.0 100.0 2 421.6 2 897.4 –475.8 100.0 100.0
Euro area countries 3 119.1 5 144.6 –2 025.5 30.4 40.6 809.0 1 351.9 –543.0 28.9 40.2 1 193.9 1 610.6 –416.7 49.3 55.6
EU28 countries 7 449.9 10 118.1 –2 668.2 72.6 79.8 1 990.7 2 686.4 –695.7 71.2 79.8 1 830.0 2 242.5 –412.5 75.6 77.4
incl. Germany 703.8 1 448.3 –744.5 6.9 11.4 174.4 355.7 –181.3 6.2 10.6 167.0 307.7 –140.7 6.9 10.6
Sweden 549.6 397.9 151.7 5.4 3.1 154.4 109.1 45.2 5.5 3.2 141.0 98.4 42.6 5.8 3.4
UK 510.1 248.6 261.4 5.0 2.0 131.6 61.7 69.9 4.7 1.8 128.7 50.7 78.0 5.3 1.7
Finland 202.7 761.6 –558.9 2.0 6.0 41.4 210.2 –168.8 1.5 6.2 47.6 142.3 –94.7 2.0 4.9
Denmark 383.6 283.4 100.1 3.7 2.2 107.1 65.5 41.6 3.8 1.9 111.4 63.0 48.3 4.6 2.2
Netherlands 214.5 459.3 –244.7 2.1 3.6 66.0 118.9 –52.9 2.4 3.5 65.4 108.9 –43.5 2.7 3.8
Lithuania 1 917.7 2 230.5 –312.8 18.7 17.6 549.7 596.3 –46.6 19.7 17.7 435.6 484.6 –48.9 18.0 16.7
Estonia 1 216.5 972.3 244.3 11.9 7.7 317.1 263.8 53.3 11.3 7.8 281.1 229.5 51.6 11.6 7.9
Poland 668.5 1 439.1 –770.6 6.5 11.4 145.8 389.8 –244.0 5.2 11.6 167.2 327.3 –160.1 6.9 11.3
CIS 1 524.7 1 504.0 20.7 14.9 11.9 442.3 389.3 52.9 15.8 11.6 253.0 363.0 –110.0 10.4 12.5
incl. Russia 1 099.4 1 021.7 77.7 10.7 8.1 320.7 288.4 32.3 11.5 8.6 163.8 255.9 –92.1 6.8 8.8
Other countries 1 279.0 1 054.7 224.3 12.5 8.3 364.3 290.9 73.5 13.0 8.6 338.5 291.8 46.7 14.0 10.1
incl. USA 117.3 72.7 44.6 1.1 0.6 33.2 22.0 11.2 1.2 0.7 34.9 27.6 7.3 1.4 1.0
Norway 244.9 60.4 184.5 2.4 0.5 63.6 16.3 47.3 2.3 0.5 54.9 13.9 41.0 2.3 0.5
China 105.9 352.9 –247.0 1.0 2.8 34.3 94.6 –60.3 1.2 2.8 34.4 108.8 –74.4 1.4 3.8
2014 2015
35.
CONVENIENCE AND EXTENDED CREDIT, REVOLVING LOANS AND OVERDRAFT TO RESIDENT NON-FINANCIAL CORPORATIONS AND HOUSEHOLDS (at end of period; millions of euro)
Non-financial corporations Households
Revolving loans and overdraft
Convenience credit Extended credit Revolving loans and overdraft
Convenience credit Extended credit
2014
I 917.9 1.7 1.2 65.6 13.0 125.7
II 927.2 1.6 1.2 68.0 12.7 124.0
III 930.2 1.8 1.3 68.1 13.0 123.9
IV 931.7 1.8 1.3 66.2 12.9 123.4
V 936.6 1.8 1.3 66.2 13.0 123.5
VI 919.4 1.7 1.3 64.4 12.9 121.8
VII 904.2 1.8 1.3 64.1 12.9 121.9
VIII 961.6 1.6 1.3 64.6 13.0 121.7
IX 951.9 1.8 1.3 64.0 11.3 122.1
X 966.0 1.9 1.2 66.0 11.3 121.1
XI 974.3 1.7 1.2 64.4 11.1 119.1
XII 761.8 1.6 1.0 57.4 7.2 114.8
2015
I 767.6 1.6 1.0 58.0 7.2 112.7
II 770.7 1.6 1.0 56.7 7.3 110.8
III 768.2 1.8 1.0 56.9 7.5 111.6
36.

100
LOANS TO RESIDENT NON-FINANCIAL CORPORATIONS IN THE BREAKDOWN BY RESIDUAL MATURITY AND BY INTEREST RATE RESET PERIOD (at end of period; millions of euro)
In euro
With original maturity of over 1 year With original maturity of over 2 years
with a residual maturity of up to 1 year
with a residual maturity of over 1 year and interest rate reset period ≤1 year
with a residual maturity of up to 2 years
with a residual maturity of over 2 years and interest rate reset period ≤2 years
2014
III 4 930.8 898.1 3 572.2 4 681.5 1 297.2 3 239.4
VI 4 923.2 943.7 3 492.5 4 654.7 1 384.4 3 123.9
IX 4 905.4 1 055.2 3 344.5 4 631.9 1 610.7 2 891.7
XII 4 812.8 769.6 3 853.1 4 558.9 1 426.9 2 987.2
2015
III 4 705.7 841.5 3 639.0 4 485.5 1 502.4 2 817.9
37.a
LOANS TO RESIDENT HOUSEHOLDS IN THE BREAKDOWN BY RESIDUAL MATURITY AND BY INTEREST RATE RESET PERIOD (at end of period; millions of euro)
In euro
With original maturity of over 1 year With original maturity of over 2 years
with a residual maturity of up to 1 year
with a residual maturity of over 1 year and interest rate reset period ≤1 year
with a residual maturity of up to 2 years
with a residual maturity of over 2 years and interest rate reset period ≤2 years
2014
III 5 277.2 237.9 4 288.1 5 211.1 423.3 4 303.3
VI 5 199.1 232.5 4 237.8 5 144.0 423.2 4 265.9
IX 5 173.2 227.3 4 195.7 5 118.0 415.6 4 243.2
XII 5 089.9 210.0 4 220.7 5 044.4 317.2 4 227.5
2015
III 5 033.0 223.3 4 128.9 4 986.6 337.0 4 176.0
37.b

Additional InformationGeneral notesThe cut-off date for the information used in this report is 4 June 2015.
The Macroeconomic Developments Report published by Latvijas Banka is based on data provided by the CSB, ECB, the Treasury, NASDAQ OMX Riga, Euribor-EBF and Latvijas Banka.
Data sources for charts are EC (Charts 1.1, 3.4, 3.5, 4.3, 4.4, 4.10, 4.13 and 5.5), Datastream (Chart 1.1), Reuters (Charts 1.2 and 5.2), CSB (Charts 1.3, 1.4, 2.23, 3.1–3.4, 3.7–3.9, 4.1, 4.2, 4.5, 4.7–4.12, 5.1, 5.4, 6.2 and 6.3), Bloomberg (Charts 2.1–2.6, 2.8 and 2.9), the Treasury (Charts 2.7 and 3.10–3.12), Latvijas Banka (Charts 2.10–2.24, 4.11, 5.1, 6.1– 6.3, 7.1 and 7.2), ECB (Chart 2.11), Road Traffic Safety Directorate (Chart 3.6), Ober Haus Real Estate Latvia Ltd. and Arco Real Estate Ltd. (Chart 4.6), SRS (Chart 4.10) and Food and Agriculture Organization of the United Nations (Chart 5.2).
Data sources for Statistics tables are Latvijas Banka (Tables 1, 3, 4, 6–25, 27, 28, 36 and 37), NASDAQ OMX Riga (Table 1), the Treasury (Tables 1, 2ab and 29), Euribor-EBF (Table 1), CSB (Tables 2ab and 30–35) and ECB (Tables 5 and 26).
Details may not add because of rounding-off.
FOB value is the price of a commodity on the border of the exporting country, including the transportation and insurance costs only up to the border.
CIF value is the price of a commodity on the border of the importing country, including the transportation and insurance costs only up to the border.
"–" – no transactions in the period; "x" – no data available, no computation of indicators possible or insufficient number of respondents to publish information.
Money and banking sectorCalculation of monetary aggregates includes the balance sheet data of Latvijas Banka and information from the financial position reports of other MFIs, prepared using methodology of Latvijas Banka (see Latvijas Banka Regulation No. 132 "Regulation for Compiling the 'Monthly Financial Position Report' of Monetary Financial Institutions" of 16 May 2014).
In the publication, the following terms have been used:
MFIs – financial institutions forming the money-issuing sector. In Latvia, MFIs include Latvijas Banka, credit institutions and other MFIs in compliance with the List of Monetary Financial Institutions of the Republic of Latvia compiled by Latvijas Banka. In the EU, MFIs include the ECB, the national central banks of the euro area, credit institutions and other MFIs (money market funds) in compliance with the original List of MFIs published by the ECB.
Non-MFIs – entities other than MFIs.
Financial institutions – other financial intermediaries, excluding insurance corporations and pension funds, (hereinafter, OFIs), financial auxiliaries, insurance corporations and pension funds.
OFIs – financial corporations that are primarily engaged in financial intermediation by incurring liabilities in forms other than currency, deposits and close substitutes for deposits from their customers other than MFIs, or insurance technical reserves. OFIs are corporations engaged in lending (e.g. financial leasing companies, factoring companies, export/import financing companies), investment funds, investment brokerage companies, financial vehicle corporations, financial holding corporations, and venture capital corporations. OFIs data include also financial auxiliaries' data.
101
ADDITIONAL INFORMATIONMACROECONOMIC DEVELOPMENTS REPORTJune 2015

Financial auxiliaries – financial corporations that are primarily engaged in auxiliary financial activities, i.e. activities that are closely related to financial intermediation but are not financial intermediation themselves, e.g. investment brokers who do not engage in financial intermediation services on their own behalf, corporations that provide infrastructure for financial markets, central supervisory institutions of financial institutions and the financial market provided that they are separate institutional units. In Latvia, the FCMC and the NASDAQ OMX Riga shall also be regarded as financial auxiliaries. Financial auxiliaries' data are included in OFIs data.
Non-financial corporations – economic entities producing goods or providing non-financial services with the aim of gaining profit or other yield.
Households – natural persons or groups of natural persons whose principal activity is consumption and who produce goods and services exclusively for their own consumption, as well as non-profit institutions serving households. The following are also regarded as households in the Republic of Latvia: persons engaged in individual entrepreneurship provided that they have not registered their activity with the Commercial Register of the Enterprise Register of the Republic of Latvia.
Holdings of securities other than shares – financial assets, which are instruments of the holder, usually negotiable and traded or compensated on secondary markets and which do not grant the holder any ownership rights over the issuing institutional unit.
The following information is published in accordance with the ECB methodology:
1) Assets and liabilities of Latvijas Banka (Table 6), expanding the range of reported financial instruments;
2) Aggregated balance sheet of MFIs (excluding Latvijas Banka), i.e. the sum of the harmonised balance sheets of Latvia's MFIs, excluding Latvijas Banka (Table 7);
3) monetary aggregates and their components (Table 4) reflect Latvia's contributions to the euro area monetary aggregates and their counterparts. These are obtained from the consolidated balance sheet of MFIs. Latvia's contributions to the following monetary aggregates are calculated and published:– overnight deposits in all currencies held with MFIs; – deposits redeemable at a period of notice of up to and including 3 months (i.e. short-term savings deposits) made in all currencies and deposits with an agreed maturity of up to and including 2 years (i.e. short-term time deposits) in all currencies held with MFIs.– repurchase agreements, debt securities with a maturity of up to and including 2 years issued by MFIs, and money market fund shares and units.
The monetary aggregates of Latvijas Banka (Table 3) are also published comprising the national contribution to the euro area monetary base and the counterparts, as well as a monetary survey of Latvia's MFIs (excluding Latvijas Banka; Table 10).
In view of the fact that Latvijas Banka collects more comprehensive information, the following is also published:
1) consolidated balance sheet of MFIs obtained by netting out inter-MFI positions in the aggregated balance sheet of Latvia's MFIs (Table 8). Due to slight accounting methodology differences, the sum of the inter-MFI positions is not always zero; therefore, the balance is reported under the item Excess of inter-MFI liabilities.
2) Aggregated balance sheet of Latvia's MFIs (excluding Latvijas Banka) which is the sum of the harmonised balance sheets (Tables 9ab);
3) Information characterising foreign assets and foreign liabilities of MFIs (excluding Latvijas Banka; Tables 11ab), including selected items in the monthly financial position report of MFIs (excluding Latvijas Banka) by group of countries (Table 12);
102
ADDITIONAL INFORMATIONMACROECONOMIC DEVELOPMENTS REPORTJune 2014

4) Information characterising the maturity profile and types of deposits (including repo agreements) of Latvia's financial institutions, non-financial corporations and households with MFIs (excluding Latvijas Banka; Tables 13 and 14abc) as well as government and non-resident deposits (Table 14d). Deposits redeemable at notice have been grouped by period of notice. Long-term deposits include deposits with the original maturity of over 1 year. The breakdown of MFI (excluding Latvijas Banka) deposits by currency is provided in Tables 20ab;
5) Information characterising the maturity profile and types of MFI (excluding Latvijas Banka) loans to Latvia's financial institutions, non-financial corporations and households (Tables 15, 16ab, 17, 18, 36 and 37) as well as government and non-resident loans (Table 16c). The breakdown of MFI (excluding Latvijas Banka) loans by currency is provided in Tables 20cd;
6) Information characterising MFI (excluding Latvijas Banka) securities holdings (Tables 19ab and 20ef);
7) Information characterising debt securities issued by MFIs (excluding Latvijas Banka; Table 20g).
Interest ratesThe interest rates calculation includes information from MFI reports prepared in compliance with Latvijas Banka Regulation No. 133 "Regulation for Compiling Interest Rate Reports of Monetary Financial Institutions" of 16 May 2014. Based on the methodology laid out in the above Regulation, credit institutions, branches of foreign credit institutions and particular credit unions registered in the Republic of Latvia have to provide information on interest rates on deposits and loans applied in transactions with resident non-financial corporations and households.
Information on interest rates on deposits and loans applied in transactions with non-financial corporations and households provided by credit institutions, branches of foreign credit institutions and credit unions registered in the Republic of Latvia is collected (Table 21). Interest rate statistics is collected on new business and outstanding amounts. All rates included in the interest rate statistics are weighted average rates. When preparing the interest rate statistics, credit institutions use annualised agreed rates (AAR) or narrowly defined effective rates (NDER) and annual percentage rate of charge (APRC). Credit institutions have to select the calculation of the AAR or the NDER based on the terms and conditions of the agreement. The NDER can be calculated on any deposit or loan. In addition to the AAR or the NDER, the APRC is reported for loans to households for house purchase and consumer credits.
The interest rates on new business with overnight deposits and deposits redeemable at notice and on their outstanding amounts coincide.
Interest rates on new loans are reported on the basis of the initial rate fixation period set in the agreement, whereas overdraft interest rates are reported on loan balances.
When reporting the interest rates on consumer credit and other credit to households with the maturity of up to 1 year and loans to non-financial corporations with the maturity of up to 1 year, interest rates on overdraft are included.
Interbank market lending interest rates (Table 23) are reported as weighted average interest rates on new business, aggregating the information submitted by credit institutions, prepared based on the methodology of Latvijas Banka (see Latvijas Banka Regulation No. 102 "Regulation for Compiling the 'Report on Monetary Market Transactions'" of 16 May 2013).
103
ADDITIONAL INFORMATIONMACROECONOMIC DEVELOPMENTS REPORTJune 2014

Foreign exchange and exchange ratesInformation characterising the foreign currency selling and buying transactions is reported based on the methodology of Latvijas Banka (see Latvijas Banka Regulation No. 36 "Regulation for Purchasing and Selling Cash Foreign Currency" of 13 May 2009 and Latvijas Banka Regulation No. 101 "Regulation for Compiling Reports on Foreign Currency Purchases and Sales" of 16 May 2013). The principal foreign exchange transactions (Table 24) comprise the cash and non-cash transactions conducted by credit institutions and branches of foreign credit institutions, reported by transaction type and counterparty, and currency. Non-cash foreign exchange transactions (Table 25) comprise non-cash transactions performed by credit institutions and branches of foreign credit institutions, reported by major currency.
The euro reference rates published by the ECB (Table 26) are reported as monthly mathematical averages. Weighted average exchange rates (cash transactions; Table 27) are reported based on the information provided by credit institutions and branches of foreign credit institutions as well as currency exchange bureaus.
104
ADDITIONAL INFORMATIONMACROECONOMIC DEVELOPMENTS REPORTJune 2014