Embed Size (px)
Citation preview

CPB Netherlands Bureau for Economic Policy Analysis
Macroeconomic developments in the Netherlands
Investment briefing: The Dutch residential market
Dutch embassy in London
Wim Suyker
22 January 2014
CPB Netherlands Bureau for Economic Policy Analysis
Content presentation
• The Dutch economic development since early 2008 in European perspective
• The most recent Dutch developments
• The short-term outlook
• Structural characteristics of the Dutch economy

CPB Netherlands Bureau for Economic Policy Analysis
Netherlands lagging euro area in 2012 & 2013
94
95
96
97
98
99
100
101
2008Q1 2009Q1 2010Q1 2011Q1 2012Q1 2013Q1
GDP volume (2008Q1=100)
Euro area (17 countries) Netherlands

CPB Netherlands Bureau for Economic Policy Analysis
Netherlands lagging its peers from 2011 onwards
94
95
96
97
98
99
100
101
2008Q1 2009Q1 2010Q1 2011Q1 2012Q1 2013Q1
GDP volume (2008Q1=100)
Euro area "north" Netherlands
• “north”: Belgium, France, Germany, Netherlands, Austria, Finland

CPB Netherlands Bureau for Economic Policy Analysis
Showing up in unemployment
0
1
2
3
4
5
6
7
8
9
2008 2009 2010 2011 2012 2013
Unemployment rate
Euro area "north" Netherlands

CPB Netherlands Bureau for Economic Policy Analysis
Lagging behind not due to exports ....
84
89
94
99
104
109
114
2008Q1 2009Q1 2010Q1 2011Q1 2012Q1 2013Q1
Exports of goods and services volume (2008Q1=100)
Euro area "north" Netherlands

CPB Netherlands Bureau for Economic Policy Analysis
... but due to investments and ....
74
79
84
89
94
99
104
2008Q1 2009Q1 2010Q1 2011Q1 2012Q1 2013Q1
Gross fixed capital formation volume (2008Q1=100)
Euro area "north" Netherlands

CPB Netherlands Bureau for Economic Policy Analysis
.... and private consumption
92
94
96
98
100
102
104
2008Q1 2009Q1 2010Q1 2011Q1 2012Q1 2013Q1
Private consumption volume (2008Q1=100)
Euro area "north" Netherlands
CPB Netherlands Bureau for Economic Policy Analysis
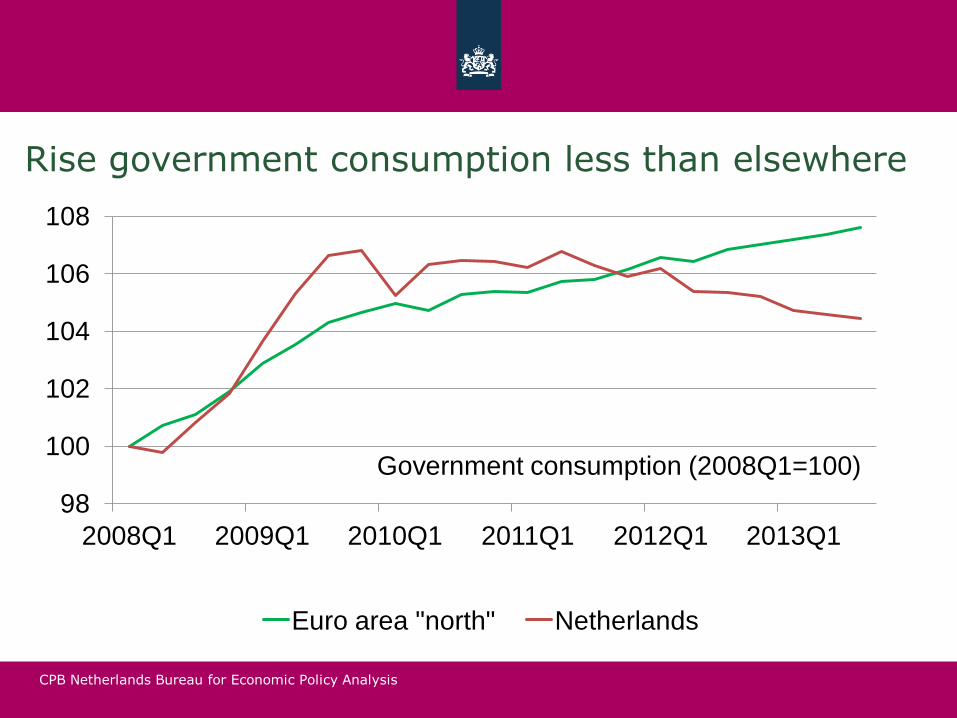
Rise government consumption less than elsewhere
98
100
102
104
106
108
2008Q1 2009Q1 2010Q1 2011Q1 2012Q1 2013Q1
Government consumption (2008Q1=100)
Euro area "north" Netherlands

CPB Netherlands Bureau for Economic Policy Analysis
Causes of the relative weak Dutch development?
1. Housing market?
2. Pension fund?
3. Fiscal policy?
4. Mood of consumers and producers?

CPB Netherlands Bureau for Economic Policy Analysis
4. Mood of consumers and producers
• No major difference. Moreover hard to say whether pessimism caused weak development or weak development caused pessimism.
60
70
80
90
100
110
2008 2009 2010 2011 2012 2013
Economic sentiment (January 2008=100)
Euro area "north" Netherlands
CPB Netherlands Bureau for Economic Policy Analysis
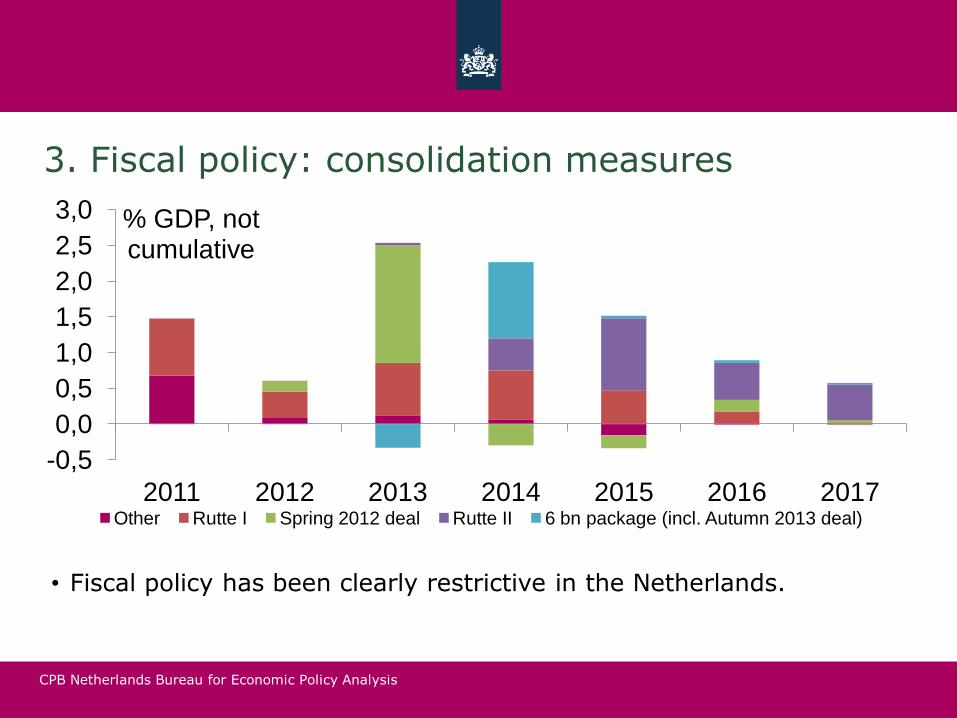
3. Fiscal policy: consolidation measures
• Fiscal policy has been clearly restrictive in the Netherlands.
-0,5
0,0
0,5
1,0
1,5
2,0
2,5
3,0
2011 2012 2013 2014 2015 2016 2017
% GDP, not cumulative
Other Rutte I Spring 2012 deal Rutte II 6 bn package (incl. Autumn 2013 deal)
CPB Netherlands Bureau for Economic Policy Analysis
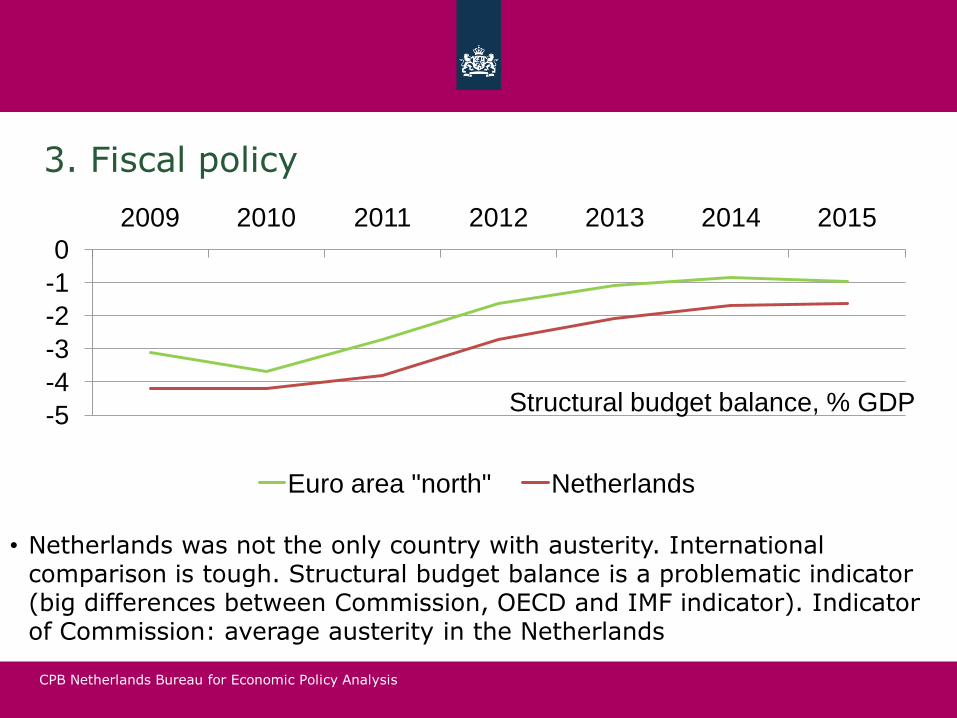
3. Fiscal policy
• Netherlands was not the only country with austerity. International comparison is tough. Structural budget balance is a problematic indicator (big differences between Commission, OECD and IMF indicator). Indicator of Commission: average austerity in the Netherlands
-5
-4
-3
-2
-1
0
2009 2010 2011 2012 2013 2014 2015
Structural budget balance, % GDP
Euro area "north" Netherlands

CPB Netherlands Bureau for Economic Policy Analysis
2. Pension funds
• Pension funds bigger in the Netherlands. There are no international comparable data on pension premiums and pensions received. Pension premiums have been a drag on growth in the Netherlands.
14,0
14,5
15,0
15,5
16,0
2009 2010 2011 2012 2013 Pension premium, % of gross wage

CPB Netherlands Bureau for Economic Policy Analysis
2. Pension funds
• Pension funds bigger in the Netherlands. There are no international comparable data on pension premiums and pensions received. Pension payments have clearly been a drag on growth in NL.
-6
-4
-2
0
2
2009 2010 2011 2012 2013
Real disposable income, % change
Retired couple with small 2nd-pillar pension
CPB Netherlands Bureau for Economic Policy Analysis
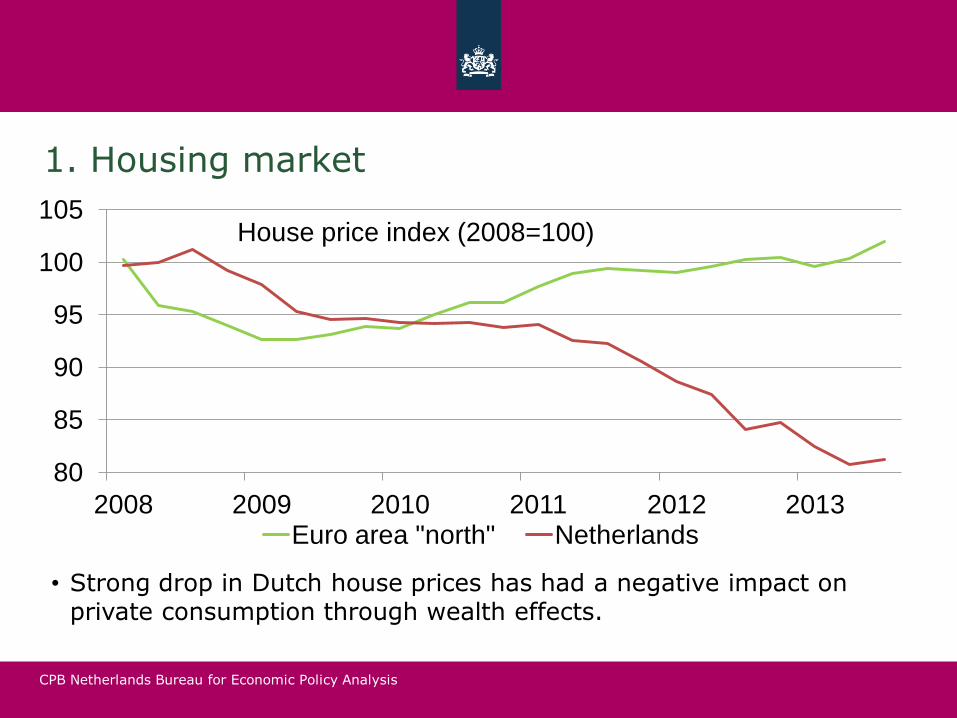
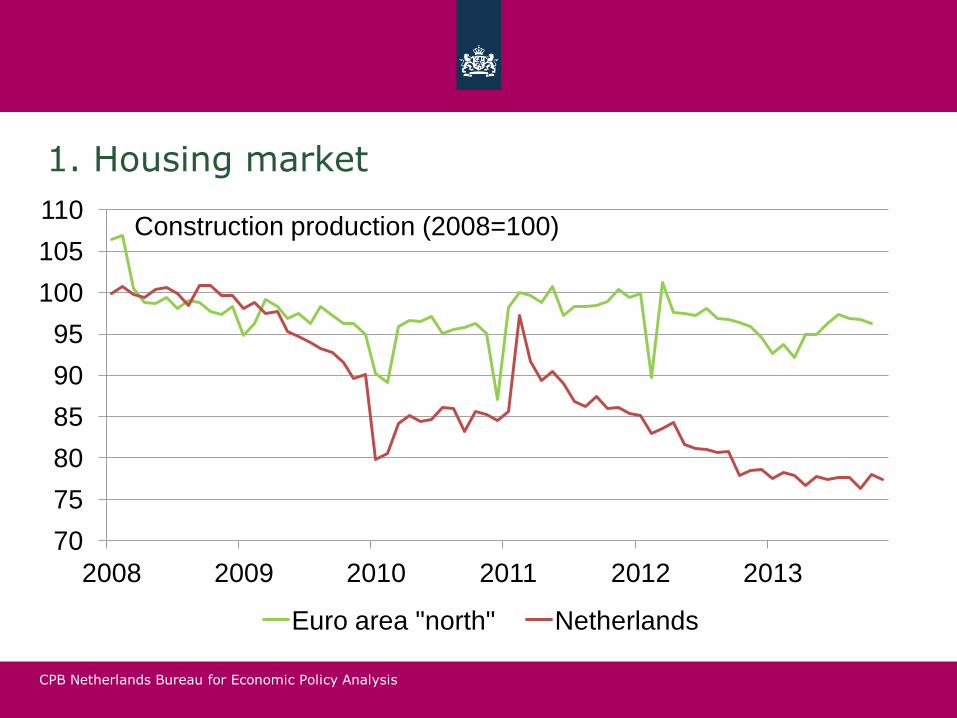
1. Housing market
• Strong drop in Dutch house prices has had a negative impact on private consumption through wealth effects.
80
85
90
95
100
105
2008 2009 2010 2011 2012 2013
House price index (2008=100)
Euro area "north" Netherlands
CPB Netherlands Bureau for Economic Policy Analysis
1. Housing market
70
75
80
85
90
95
100
105
110
2008 2009 2010 2011 2012 2013
Construction production (2008=100)
Euro area "north" Netherlands

CPB Netherlands Bureau for Economic Policy Analysis
Content presentation
• The Dutch economic development since early 2008 in European perspective
• The most recent Dutch developments
• The short-term outlook
• Structural characteristics of the Dutch economy

CPB Netherlands Bureau for Economic Policy Analysis
Content presentation
• The Dutch economic development since early 2008 in European perspective
• The most recent Dutch developments: on its way up
• The short-term outlook
• Structural characteristics of the Dutch economy

CPB Netherlands Bureau for Economic Policy Analysis
Recession has ended 2013 Q1
-1,5
-1,0
-0,5
0,0
0,5
1,0
2011Q1 2012Q1 2013Q1
Netherlands GDP volume growth (q/q)
Netherlands GDP volume growth (q/q)
2013Q3
CPB Netherlands Bureau for Economic Policy Analysis
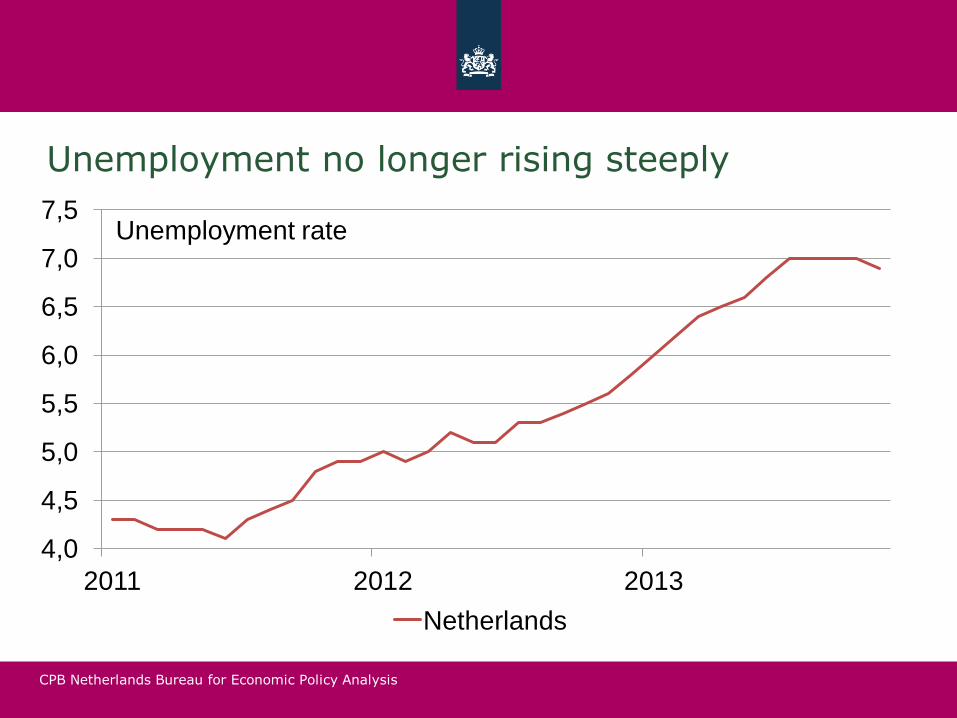
Unemployment no longer rising steeply
4,0
4,5
5,0
5,5
6,0
6,5
7,0
7,5
2011 2012 2013
Unemployment rate
Netherlands

CPB Netherlands Bureau for Economic Policy Analysis
Housing market is bottoming out
40
60
80
100
120
1995 1998 2001 2004 2007 2010 2013
Existing home sales (2007=100; s.a)
Existing home sales (2007=100; s.a)
-4
-3
-2
-1
0
1
2
2008 2009 2010 2011 2012 2013
House prices (3m/3m %)
House prices (3m/3m %)

CPB Netherlands Bureau for Economic Policy Analysis
Consumer sentiment up
-35
-30
-25
-20
-15
-10
-5
0
2013M01 2013M04 2013M07 2013M10
Netherlands Consumer confidence indicator
Netherlands Consumer confidence indicator

CPB Netherlands Bureau for Economic Policy Analysis
Purchasing managers index very strong
40 50 60
France
Spain
Italy
Ireland
Austria
Germany
Netherlands
UK
PMI manufacturing December 2013

CPB Netherlands Bureau for Economic Policy Analysis
After 4 years drop, a purchasing power rise in 2014
-3 -2,5
-2 -1,5
-1 -0,5
0 0,5
1 1,5
2
2009 2010 2011 2012 2013 2014
Purchasing power (all households, median, %)
CPB Netherlands Bureau for Economic Policy Analysis
Content presentation
• The Dutch economic development since early 2008 in European perspective
• The most recent Dutch developments
• The short-term outlook
• Structural characteristics of the Dutch economy

CPB Netherlands Bureau for Economic Policy Analysis
Content presentation
• The Dutch economic development since early 2008 in European perspective
• The most recent Dutch developments
• The short-term outlook: slow growth out of recession
• Structural characteristics of the Dutch economy
CPB Netherlands Bureau for Economic Policy Analysis
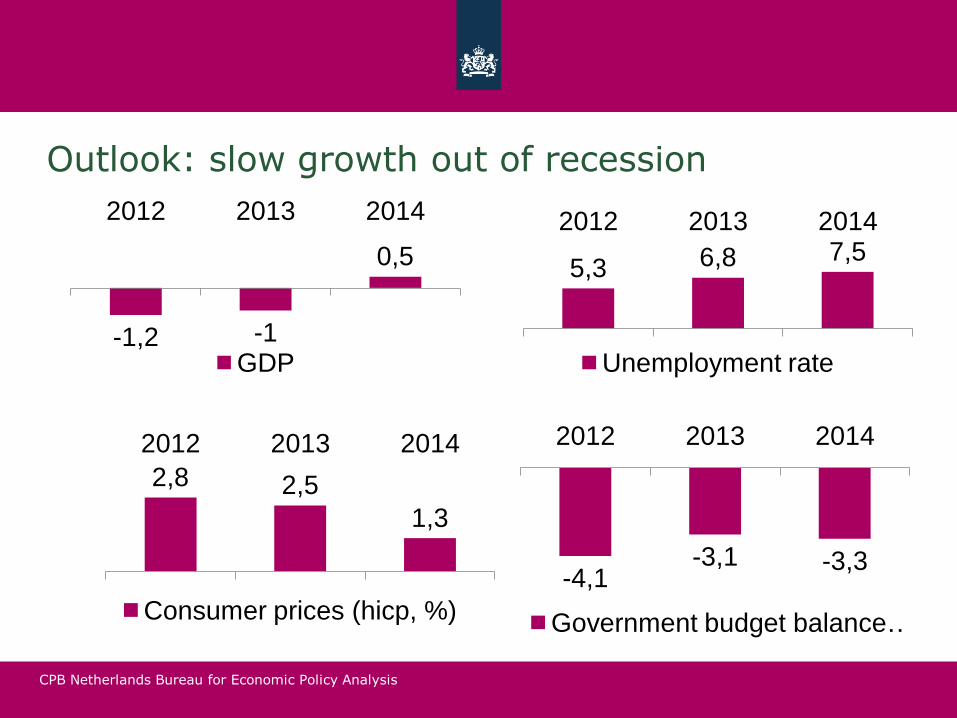
Outlook: slow growth out of recession
-1,2 -1
0,5
2012 2013 2014
GDP
5,3 6,8 7,5 2012 2013 2014
Unemployment rate
2,8 2,5
1,3
2012 2013 2014
Consumer prices (hicp, %)
-4,1 -3,1 -3,3
2012 2013 2014
Government budget balance …
CPB Netherlands Bureau for Economic Policy Analysis
Content presentation
• The Dutch economic development since early 2008 in European perspective
• The most recent Dutch developments
• The short-term outlook
• Structural characteristics of the Dutch economy

CPB Netherlands Bureau for Economic Policy Analysis
Content presentation
• The Dutch economic development since early 2008 in European perspective
• The most recent Dutch developments
• The short-term outlook
• Structural characteristics of the Dutch economy: strong

CPB Netherlands Bureau for Economic Policy Analysis
Strong economy but long balance sheets households ...
0
50
100
150
200
250
300
350
Netherlands Euro area "north" United Kingdom
Financial assets households, Percentage of GDP, 2012
Financial liabilities households, Percentage of GDP, 2012

CPB Netherlands Bureau for Economic Policy Analysis
... and vulnerable due to big banking sector ...
0
100
200
300
400
500
600
Netherlands Euro area "north" UK
Size banking sector (%GDP, 2011)
Size banking sector (%GDP, 2011)
CPB Netherlands Bureau for Economic Policy Analysis
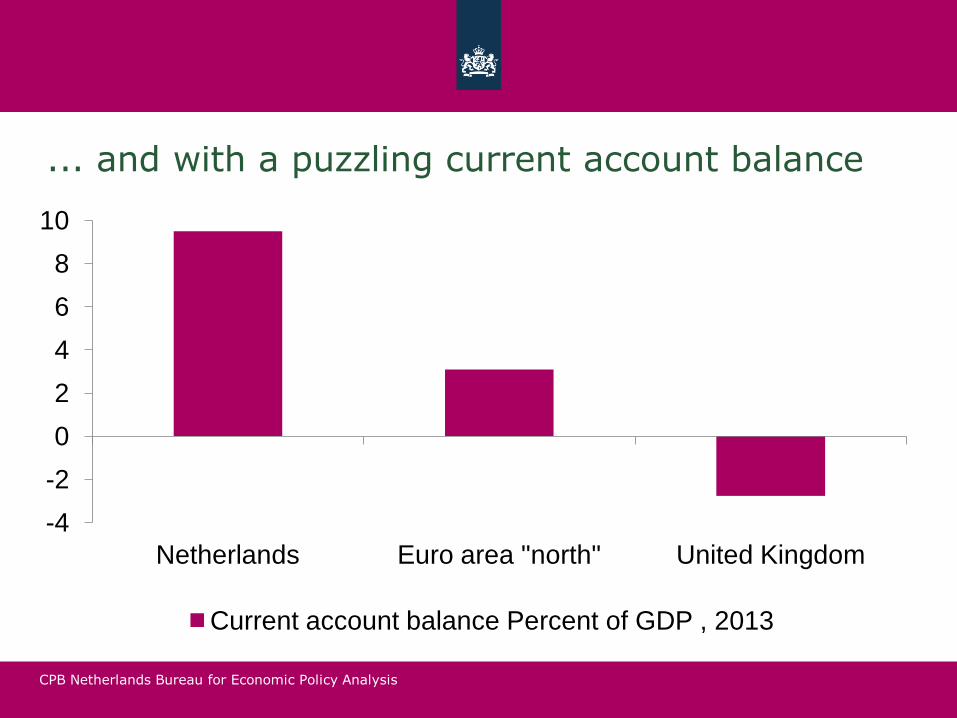
... and with a puzzling current account balance
-4
-2
0
2
4
6
8
10
Netherlands Euro area "north" United Kingdom
Current account balance Percent of GDP , 2013

CPB Netherlands Bureau for Economic Policy Analysis
Strong competitive position
0
2
4
6
8
10
12
14
Netherlands Euro area "north" United Kingdom
Global competitiveness index 2013 ranking
Global competitiveness index 2013 ranking

CPB Netherlands Bureau for Economic Policy Analysis
Strong institutions and good infrastructure
0
5
10
15
20
25
Netherlands Euro area "north" United Kingdom
Institutions, 2013, ranking
0
1
2
3
4
5
6
7
8
9
Netherlands Euro area "north" United Kingdom
Infrastructure, 2013, ranking

CPB Netherlands Bureau for Economic Policy Analysis
Efficient market and education, highly innovative
0
2
4
6
8
10
12
14
Netherlands Euro area "north" United Kingdom
Efficiency, 2013, ranking
0
2
4
6
8
10
12
Netherlands Euro area "north" United Kingdom
Innovation, 2013, ranking

CPB Netherlands Bureau for Economic Policy Analysis
As a result: High productivity
35
36
37
38
39
40
41
42
Netherlands Euro area "north" United Kingdom
Gross domestic product based on purchasing-power-parity (PPP) per capita GDP ,1000 $, 2013
CPB Netherlands Bureau for Economic Policy Analysis
Thank you
• For more information see www.cpb.nl
• Sources used: – Eurostat (GDP, unemployment,
house price, financial assets and liabilities, construction production)
– ECFIN (economic sentiment, consumer confidence)
– Ameco (structural budget balance)
– Markit (PMI)
– IMF WEO (GDP per capita)
– CPB (forecast December 2013; Dutch consolidation measures).
– GCI Global Competitiveness Report 2013-2014.