Embed Size (px)
Citation preview

MACROECONOMIC DEVELOPMENTS AND PROSPECTS IN
LOW-INCOME DEVELOPING COUNTRIES: 2015
EXECUTIVE SUMMARY
This paper examines macroeconomic developments and prospects in low-income
developing countries (LIDCs) against the back-drop of a sharp fall in international
commodity prices. The focus here—by contrast with IMF (2014a)—is on recent
developments and the near-term outlook, recognizing that the new price environment
is likely to remain in place for several years to come. The paper also includes a section
examining the experience of LIDCs with capital inflows over the past decade.
Key messages in the report include: 1) many commodity-dependent exporters have
been hit hard by export price declines, experiencing a significant growth slow-down
in 2015 that will largely carry on into 2016; 2) countries less dependent on commodity
exports benefited from the price movements (e.g., through reduced oil import bills),
with growth continuing at the robust pace of recent years; 3) short-term economic
vulnerabilities among LIDCs have increased steadily over the past two years, due mainly,
but not exclusively, to weaker conditions in commodity exporters—underscoring the
need for policy adjustments to strengthen fiscal and external positions; 4) most LIDCs
are especially vulnerable to the projected effects of climate change, and will need
significant support in the form of concessional climate finance to support adaptation
efforts; and 5) capital inflows to LIDCs, including portfolio inflows, have grown sharply in
recent years, augmenting domestic resources—but the usage of these resources, for
consumption or investment, depends on national policy choices.
Recent Macroeconomic Developments: The Varied Impact of Falling Commodity
Prices
The external economic environment facing LIDCs has weakened over the past eighteen
months, with slowing global growth, sharp declines in commodity prices, and tighter
external funding conditions. For most LIDCs, the key development has been the drop in
commodity prices, which has adversely affected commodity-dependent exporters
(especially oil exporters) but benefited many LIDCs less dependent on commodity
exports (“diversified exporters”).
Most commodity exporters have experienced slowing growth, widening fiscal and
external deficits, and some combination of exchange rate depreciation and declines in
reserves (in terms of months of import cover). Most diversified exporters have
November 19, 2015

MACROECONOMIC DEVELOPMENTS AND PROSPECTS IN LIDCS: 2015
2 INTERNATIONAL MONETARY FUND
continued to record robust economic growth, averaging in excess of 6 percent per
annum, albeit with some widening of fiscal deficits (often, but not always, linked to
rising public investment levels); current account positions have deteriorated in some
larger economies, while deficit levels remaining elevated in many countries, financed in
some cases through significant increases in public external debt. Several countries have
suffered setbacks from natural disasters (including Ebola) or from internal conflicts, a
few others from adverse spillovers from Russia’s recession.
Looking ahead, with commodity prices expected to show little recovery for the
foreseeable future, commodity exporters are projected to experience a small pick-up in
growth in 2016, alongside some policy-driven improvements in fiscal positions. The
strong growth performance among diversified exporters looks set to continue, unless
global performance disappoints, with some countries planning further debt-financed
increases in public investment.
Key policy messages include: a) the need for commodity exporters to adjust fiscal
positions and domestic competitiveness to align with sustained lower export prices; and
b) the importance of building fiscal and external buffers, where eroded, to handle
adverse future shocks. International financial institutions, including the IMF, can provide
support for these efforts.
Growing Vulnerabilities
Analysis of the vulnerability of LIDCs to macroeconomic shocks, using established
methodologies, points to a significant increase in estimated vulnerability levels across
regions and country subgroups, most marked in the case of oil exporters. Some
40 percent of LIDCs are now classified as being highly vulnerable to shocks—the
highest level since the global financial crisis. Vulnerable commodity exporters have little
option but to move ahead with macroeconomic adjustment programs—or place
macroeconomic stability in jeopardy. Fast-growing diversified exporters have the
opportunity to strengthen fiscal and external positions while maintaining strong
growth—and, where vulnerabilities are a concern, should take it.
The ongoing process of climate change is expected, over time, to have significant
adverse effects on LIDCs, with more frequent natural disasters and adverse pressures on
productivity in agriculture—the largest employer in LIDCs. LIDCs are already more
prone to natural disasters than better-off countries—a feature expected to intensify
with global warming. LIDCs contribute only marginally to global greenhouse gas
emissions, but will need significant financial support in the form of climate finance if
they are to handle adaptation challenges without compromising on development goals.

MACROECONOMIC DEVELOPMENTS AND PROSPECTS IN LIDCS: 2015
INTERNATIONAL MONETARY FUND 3
Capital Inflows and Macroeconomic Implications
Capital inflows to LIDCs rose sharply in the years prior to the global crisis, largely taking
the form of foreign direct investment. Inflows have picked up again since the crisis
period, and now include a significant amount of portfolio inflows to frontier market
economies. The surge in portfolio flows (from a low base) has been facilitated by
exceptionally low interest rates in the advanced economies, but has also been attracted
by strong economic performance and improved macroeconomic fundamentals in many
LIDCs. Several frontier LIDCs also took important steps to liberalize capital accounts in
the mid-2000s and are now typically as open as emerging markets in de jure terms.
Statistical analysis indicates that capital inflows, by making more resources available,
have boosted domestic spending levels—albeit with portfolio inflows being more
strongly correlated with consumption levels than with domestic investment. The
selected case studies include examples where sovereign bond issues have been more
strongly associated with rising public consumption outlays than higher public
investment.
Empirical analysis also shows that the ability of LIDCs to access external capital markets,
and the terms at which they obtain funding, depend on both external and domestic
factors—with the latter including solid external and fiscal positions, sustainable debt
levels, and higher foreign reserve positions. Countries that are increasing their reliance
on access to external funding thus face an additional risk factor—shifts in the external
environment—and need to place a high premium on maintaining solid economic
fundamentals, including strong public debt management capacity.

MACROECONOMIC DEVELOPMENTS AND PROSPECTS IN LIDCS: 2015
4 INTERNATIONAL MONETARY FUND
Approved By Siddharth Tiwari
Prepared by an SPR staff team led by Chris Papageorgiou and
Hans Weisfeld, under the overall guidance of Seán Nolan,
Rupa Duttagupta, and Chris Lane. Production assistance was provided
by Dilcia Noren, Nazma Nunhuck, and Merceditas San Pedro-Pribram.
The paper includes inputs from staff in the African Department, Asia
and Pacific Department, Fiscal Affairs Department, and the Finance
Department.
CONTENTS
ACRONYMS AND ABBREVIATIONS ____________________________________________________________ 6
RECENT MACROECONOMIC DEVELOPMENTS: THE VARIED IMPACT OF FALLING
COMMODITY PRICES ____________________________________________________________________________ 7
A. Introduction ___________________________________________________________________________________ 7
B. Evolving External Environment _________________________________________________________________ 7
C. Developments in LIDCs _______________________________________________________________________ 10
D. The Near-Term Outlook ______________________________________________________________________ 19
E. Policy Challenges______________________________________________________________________________ 21
GROWING VULNERABILITIES __________________________________________________________________ 22
A. Current Vulnerabilities ________________________________________________________________________ 22
B. Scenario Analysis: Vulnerability of LIDCs to Global Shocks ____________________________________ 27
C. Climate Change: A Growing and Lasting Source of Vulnerability ______________________________ 30
CAPITAL INFLOWS AND MACROECONOMIC IMPLICATIONS _______________________________ 34
A. The Facts: Trends in Capital Inflows and Capital Account Openness __________________________ 35
B. Capital Flows, Domestic Demand, and Policy Challenges _____________________________________ 41
REFERENCES ____________________________________________________________________________________ 53
BOXES
1. LIDC Subgroups ________________________________________________________________________________ 8
2. 2015 PRGT Loan Demand: Recent Trends and Near-Term Outlook* __________________________ 18
3. Methodology for Scenario Analysis ___________________________________________________________ 29
4. Measuring Capital Flows ______________________________________________________________________ 36
5. Determinants of LIDC Sovereign Spreads—Push versus Pull Factors __________________________ 45
MACROECONOMIC DEVELOPMENTS AND PROSPECTS IN LIDCS: 2015
INTERNATIONAL MONETARY FUND 5
FIGURES
1. Evolving Global Environment ___________________________________________________________________ 9
2. Country-Specific Net Commodity Price Index by LIDC Subgroup: June 2004–June 2015 ______ 11
3. Country-Specific Net Commodity Price Index for LIDCs by Country: June 2004–June 2015 ___ 11
4. Real GDP Growth ______________________________________________________________________________ 12
5. Fiscal Sector Developments ___________________________________________________________________ 14
6. External Sector Developments ________________________________________________________________ 16
7. Inflation Developments _______________________________________________________________________ 19
8 Growth Decline Vulnerability Index, 2011–16 __________________________________________________ 23
9. Growth Decline Vulnerability Index by Country Groups, 2011–16 _____________________________ 23
10. Growth Decline Vulnerability Index by Country Groups, 2016 ________________________________ 24
11. Evolution of Risk of Debt Distress ____________________________________________________________ 24
12. Frontier Markets’ z-Scores 1/
_________________________________________________________________ 26
13. Eurobonds Maturity Amount ________________________________________________________________ 27
14. Shock Scenarios: Global Growth and Inflation _______________________________________________ 28
15. Impact of Financial Volatility Shock __________________________________________________________ 29
16. Impact of Geopolitical Shock ________________________________________________________________ 29
17. Impacts in Sub-Saharan African ______________________________________________________________ 31
18. Frequency of Natural Disasters in LIDCs and the Rest of the Rest of the World, 1985–2015 _ 32
19. Climate Change Exposure Index, 2015 _______________________________________________________ 33
20. Climate Change Exposure Index, 2015 _______________________________________________________ 33
21. Capital Flows to LIDCs, 2000–2014 ___________________________________________________________ 35
22. Capital Inflows to LIDCs Versus EMs _________________________________________________________ 37
23. Capital Inflows to Frontier Versus Other Non-Frontier LIDCs_________________________________ 38
24. Syndicated Loans to LIDCs ___________________________________________________________________ 39
25. Capital Account Liberalization in LIDCs ______________________________________________________ 40
26. Capital Flows and Domestic Demand ________________________________________________________ 41
27. Evolution of Macroeconomic Aggregates in Frontier LIDCs, 2000–14 ________________________ 44
TABLES
1. Comparison of Projection Vintages ____________________________________________________________ 7
2. Selected Macroeconomic Indicators __________________________________________________________ 20
3. Financial Vulnerability Index __________________________________________________________________ 26
APPENDIX
I. The Role of Macroeconomic and Structural Factors in Vulnerability ___________________________ 52
ANNEXES
I. LIDCs and Subgroups __________________________________________________________________________ 46
II. Capital Account Liberalization: De Jure Index __________________________________________________ 47
III. Experience with Capital Flows in Selected Countries __________________________________________ 48

MACROECONOMIC DEVELOPMENTS AND PROSPECTS IN LIDCS: 2015
6 INTERNATIONAL MONETARY FUND
Acronyms and Abbreviations
AMs Advanced Markets
CPIA Country Policy and Institutional Assessment
CRED Centre for Research on the Epidemiology of Disasters
DSA Debt Sustainability Analysis
DSF Debt Sustainability Framework
EMs Emerging Markets
EMBI Emerging Market Bond Index
EM-DAT Emergency Events Data Base
EMDCs Emerging Market and Developing Countries
EMDE Emerging Market and Developing Economies
FDI Foreign Direct Investment
GDVI Growth Decline Vulnerability Index
IFS International Financial Statistics
IPCC Intergovernmental Panel on Climate Change
LIC Low Income Countries
LIDCs Low-Income Developing Countries
NCPI Net Commodity Price Index
PPP Purchasing Power Parity
PPPs Public-Private Partnerships
PRGT Poverty Reduction Growth and Trust
SSA Sub-Saharan Africa
VIX CBOE Volatility Index
WEO World Economic Outlook

MACROECONOMIC DEVELOPMENTS AND PROSPECTS IN LIDCS: 2015
INTERNATIONAL MONETARY FUND 7
RECENT MACROECONOMIC DEVELOPMENTS: THE
VARIED IMPACT OF FALLING COMMODITY PRICES
A. Introduction
1. The global economic environment facing low income developing countries (LIDCs) has
weakened over the past year, with the most noteworthy development being the sharp
declines in commodity prices. While many LIDCs rely heavily on commodity exports, most are also
significant importers of commodities (notably oil and foodstuffs), implying that the net impact of
these price developments has varied quite markedly across countries. While growth in LIDCs as an
aggregate has slowed significantly—from 6 percent in 2014 to 4.8 percent in 2015—the story at the
country level involves both winners and losers, a story we seek to explore further below.
2. For analysis purposes, we use two distinct classification systems in decomposing the
universe of LIDCs: a decomposition into a) frontier markets, b) fragile states, and c) developing
markets (the last a residual category) that draws on the classification in IMF (2014a);1 and a second
breakdown into (i) commodity exporters—countries where at least half of export earnings come from
commodities—and (ii) diversified exporters (Box 1).
B. Evolving External Environment
3. Global economic performance weakened significantly with output growth declining from
3.4 percent in 2014 to 3.1 percent in 2015—in
contrast with expectations of a pick-up in
growth to 3.8 percent in IMF (2014b) (see
Table 1).2 Slowing growth in emerging market
economies was an important contributory
factor, with a number of large economies
(including Brazil and Russia) moving into
recession and the rebalancing of demand
contributing to growth deceleration in China
(Figure 1, Panel A).
1 This decomposition is a simplification of the approach employed in IMF (2014a); one country, Cote d’Ivoire, is
included in both the “frontier market” and “fragile state” groupings.
2 For analysis of the factors explaining the shifting global outlook, see IMF (2015a).
Table 1. Comparison of Projection Vintages
Sources: World Economic Outlook (October 2014, October 2015).
2014 2015 2016
Global Growth (Percent)
October 2014 3.3 3.8 4.0
October 2015 3.4 3.1 3.6
Petroleum Price (APSP; US$)
October 2014 106.1 102.8 98.5
October 2015 96.2 58.9 64.2
Nonfuel Price (Index, 2005=100)
October 2014 163.7 157.2 155.8
October 2015 162.3 136.9 134.6

MACROECONOMIC DEVELOPMENTS AND PROSPECTS IN LIDCS: 2015
8 INTERNATIONAL MONETARY FUND
Box 1. LIDC Subgroups*
Frontier markets are those countries closest to resembling emerging markets in terms of depth and
openness of financial markets and access to international sovereign bond markets.
Fragile states are countries where a) institutional capacity is weak, measured by a three-year average Country
Policy and Institutional Assessment (CPIA) score below 3.2 or b) there has been/is significant internal conflict.
Developing markets are all LIDCs that are neither fragile nor frontier economies.
Commodity exporters are those
countries where at least 50 percent of
export earnings come from fuels and
primary commodities—27 countries in
all.
Oil exporters are countries that are net
exporters of oil; those include Cameroon,
Chad, Ghana, Republic of Congo, Niger,
Nigeria, Papua New Guinea, South
Sudan, and Yemen.
Diversified exporters are LIDCs that do
not belong to the commodity exporter
group—33 countries in all. While several
of the countries in this group do export
commodities, these account for less than
50 percent of total exports.
* See Annex I for a full list of countries under the classification systems.
4. A combination of slowing global growth, falling demand for minerals in China, and
supply side developments have resulted in a sharp drop in commodity prices to levels that are
expected to persist for the foreseeable future. From a peak in June 2014, energy prices declined
by 55 percent through September 2015, while non-energy prices declined by some 23 percent over
the same period (Figure 1, Panel B).3 IMF commodity price projections point to little, if any, rebound
from current levels in the near term—a very different trajectory from the strong rebound recorded in
the wake of the Great Recession of 2008–09.
5. Global inflation has remained low due to weak demand and falling commodity prices.
Global inflation declined in 2014 and is set to fall further in 2015, helped by the drop in commodity
prices and weak demand in major advanced economies (Figure 1, Panel C). Prices for exports of
manufactures have been on a declining trend since 2012, contributing to wider deflationary
pressures in importing countries.
6. External financing conditions facing emerging market and frontier economies have
started to tighten. While monetary policies in the advanced economies have remained
accommodative, sovereign spreads for emerging market economies have been increasing over the
past year (Figure 1, Panel D), albeit with significant discrimination across regions (with commodity
3 See IMF (2015b), for a detailed analysis of the factors behind the decline in oil prices.
0
500
1,000
1,500
2,000
2,500
GN
I per ca
pit
a (U
S$)
All LIDCs
Population: 1.3 billion
No. of countries: 60
Frontier markets
Population: 665 million
No. of countries: 14
Fragile states
Population: 402 million
No. of countries: 28
Developing markets
Population: 283 million
No. of countries: 19
Commodity exporters
Population: 580 million
No. of countries: 27
Diversified exporters
Population: 747 million
No. of countries: 33
By financial development1By export
1 Cote d'Ivoire is included in both the "Frontier" and the "Fragile" groups.
LIDC Sub-Groups by GNI per Capita and Population, 2014

MACROECONOMIC DEVELOPMENTS AND PROSPECTS IN LIDCS: 2015
INTERNATIONAL MONETARY FUND 9
exporters hit hardest). Sovereign spreads have also increased for many frontier market LIDCs,4 with
increases again most marked among commodity exporters. Widening spreads have also reflected
weak domestic economic policies in many cases.5
Figure 1. Evolving Global Environment
Panel A. Real GDP Growth
( Percent, PPP-GDP weighted averages)
Panel B. Commodity Price Indices1
( Index, 2005=100)
Sources: World Economic Outlook and IMF staff estimates. Source: IMF Primary Commodity Price System.
Panel C. Inflation2
(Percent, PPP-GDP weighted averages)
Panel D. EMBI Sovereign Spreads
(Basis points, quarterly averages)
Sources: World Economic Outlook and IMF staff estimates.
Source: Bloomberg. 1 Energy price index includes crude oil, natural gas, and coal prices; Non-energy price index includes food, beverage, and
industrial input prices. 2 The median for LIDCs is estimated at 5.7 percent in 2015.
4 See Figure 6, Panel D.
5 See IMF (2015a) and IMF (2015c), for a comprehensive discussion on financing conditions in emerging and
developing countries.
0
1
2
3
4
5
6
7
World Advanced
Economies
Emerging
Economies
LIDC
2010-2012
2013
2014
2015
0
2
4
6
8
10
12
14
2010 2011 2012 2013 2014 2015
World
Advanced Economies
Emerging Economies
LIDC
80
100
120
140
160
180
200
220
240
260
2012Q
1
2012Q
2
2012Q
3
2012Q
4
2013Q
1
2013Q
2
2013Q
3
2013Q
4
2014Q
1
2014Q
2
2014Q
3
2014Q
4
2015Q
1
2015Q
2
2015Q
3
Total
Non-energy
Energy
Crude Oil (US$ per barrel)

MACROECONOMIC DEVELOPMENTS AND PROSPECTS IN LIDCS: 2015
10 INTERNATIONAL MONETARY FUND
C. Developments in LIDCs
7. Changes in the external environment affect LIDCs through several channels: the trade
channel includes the impact of commodity price changes on both exports and imports, along with
the impact of softening external demand on diversified exports;6 the key financing channel is the
impact of higher external financing costs on those countries (primarily frontier economies) seeking
new funding from international capital markets; the main investment channel is the impact of
changing global conditions on foreign direct investment, particularly in resource sectors. The
importance of these channels varies markedly across LIDCs, albeit with the commodity price channel
being important in almost all cases.
Commodity terms of trade: some lose, some gain.
8. Analysis of the first-round effects of the drop in commodity prices indicates that, on
balance, there have been more winners than losers among the 60 LIDCs—although the scale of
the losses experienced by some of the losers, particularly oil exporters, is very large. The first-round
impact on national income of the shift in commodity prices can be assessed using the country-
specific net commodity price index (NCPI) developed by Gruss (2014);7 we focus on the movements
in commodity prices from June 2014 to June 2015, given data availability. Results of this analysis are
shown in Figures 2 and 3. Key conclusions are that:
Countries heavily dependent on energy exports, such as Nigeria, and Bolivia, suffered large
losses, ranging from 6 to 12 percent of GDP—with the Republic of Congo and South Sudan
suffering even larger income declines.
Most non-energy commodity exporters experienced a net gain from the commodity price
shocks, with savings on imports of commodities such as oil more than offsetting revenue losses
on the export side.
Diversified exporters saw a sizable net gain of almost 2 percent of GDP from the commodity
price decline, with only a handful experiencing a negative impact (e.g., Myanmar).
6 This second trade channel is of significance for countries that have succeeded in establishing themselves as
exporters of manufactures (either stand-alone or as part of global value chains) or services (such as tourism).
7 This index weights each commodity price change by the country’s net exports of the corresponding commodity,
expressed as a share of GDP: it measures the impact of the shift in prices on the net income earned from/paid for
commodities, expressed as a share of GDP. The index includes a large number (33) of commodities, with weights
derived from the latest three years of trade data. See Gruss (2014) for details and data sources.

MACROECONOMIC DEVELOPMENTS AND PROSPECTS IN LIDCS: 2015
INTERNATIONAL MONETARY FUND 11
Figure 2. Country-Specific Net Commodity Price Index
by LIDC Subgroup: June 2014–June 2015
(Percent of GDP,1 PPP-GDP weighted averages)
Sources: IMF staff estimates, based on Gruss (2014). 1 As commodity terms of trade are weighted by the share of commodity
net-exports in GDP, a one percent increase can be interpreted
approximately as an income gain of one percent of GDP.
Figure 3. Country-Specific Net Commodity Price Index for LIDCs by Country: June 2014–June 20151
(Percent of GDP)2
Panel A. Oil Exporters Panel C. Diversified Exporters
Panel B. Commodity Exporters Excluding Oil
Exporters
Source: IMF staff estimates, based on Gruss (2014). 1 Due to data availability, Democratic Republic of Congo, Haiti, Liberia, Somalia, South Sudan, and Uzbekistan are excluded.
2 As commodity terms of trade are weighted by the share of commodity net-exports in GDP, a one percent increase can be
interpreted approximately as an income gain of one percent of GDP.
* Cameroon and Ghana are net-oil exporters while being classified as diversified exporters.
-12 -9 -6 -3 0 3
Oil exporters
Commodity exporters
Diversified exporters
-32 -28 -24 -20 -16 -12 -8 -4 0 4
Congo, Rep.
Nigeria
Ghana*
Yemen
Cameroon*
Papua New Guinea
Chad
Niger
-6 -4 -2 0 2 4 6 8 10
Ghana*
Myanmar
Côte d'Ivoire
Cameroon*
Lao PDR
Vietnam
Comoros
Rwanda
Djibouti
Benin
Bangladesh
Tajikistan
Togo
Uganda
Madagascar
Cambodia
Ethiopia
Nepal
Lesotho
Honduras
Moldova
Kenya
Nicaragua
Tanzania
Bhutan
Senegal
Gambia
São Tomé & Príncipe
Kiribati
Kyrgyz Republic
-8 -6 -4 -2 0 2 4 6 8 10
Bolivia
Sudan
Zambia
Mongolia
Central African Republic
Mauritania
Solomon Islands
Guinea-Bissau
Burkina Faso
Malawi
Mozambique
Eritrea
Zimbabwe
Mali
Sierra Leone
Afghanistan
Burundi
Guinea

MACROECONOMIC DEVELOPMENTS AND PROSPECTS IN LIDCS: 2015
12 INTERNATIONAL MONETARY FUND
9. Analysis of the full impact of price changes on commodity exporters would generate a
richer and less sanguine assessment in many cases. The NCPI analysis looks only at the net
income effect of price changes, ignoring second-round effects. These second-round effects on
income, as producers cut back export volumes (and employment) and suspend or terminate new
investments, can be large, affecting both current output and medium-term growth prospects (as in
Liberia and Sierra Leone). That said, the NCPI analysis can also overstate the losses to national
income in cases where resource exports are produced by multinational enterprises: here, much of
the loss in export revenues affects the incomes of foreign shareholders, with the impact on domestic
incomes dependent on the effectiveness of the domestic tax system in capturing economic rents
(typically high in the oil sector, often much lower in other mineral sectors).
Output developments
10. The overall pace of economic growth
in LIDCs slowed noticeably in 2015, driven by
export price shocks to commodity exporters
and adverse domestic developments in several
countries. Growth in LIDCs has been robust since
the global crisis, remaining at 6 percent in 2014,
but is projected to fall to 4.8 percent in 2015
(Figure 4).
The slowdown in 2015 has been concentrated
among commodity exporters (such as Nigeria),
with domestic shocks an important additional
contributory factor in countries hit by the
Ebola epidemic (Guinea, Sierra Leone) and by security disruptions (Burundi, Yemen, South Sudan).
Some commodity exporters continued to record strong output growth as new mineral projects
came on stream (Democratic Republic of Congo, Mozambique, Papua New Guinea).
Growth has remained robust among diversified exporters in 2015, helped by strong performance
in some large frontier market economies (Bangladesh, Vietnam, Kenya). But several countries
suffered from adverse supply shocks in the form of natural disasters (Haiti, Liberia, Nepal,
Nicaragua), while countries with close economic links to Russia (Kyrgyz Republic, Moldova,
Tajikistan) suffered from adverse spillovers from Russia’s recession.8
8 See IMF (2015d, Chapter 7), and IMF (2015e) for further discussions on Russia’s spillovers to neighboring countries.
Figure 4. Real GDP Growth
(Percent, simple averages)
Sources: World Economic Outlook and IMF staff estimates.
0.0
1.0
2.0
3.0
4.0
5.0
6.0
7.0
Commodity Exporters Diversified Exporters
2010-2012 2013 2014 2015 2016

MACROECONOMIC DEVELOPMENTS AND PROSPECTS IN LIDCS: 2015
INTERNATIONAL MONETARY FUND 13
Fiscal positions have weakened in many, but not all, cases…
11. Fiscal deficits are estimated to have risen in 2015, driven in the main by revenue
declines among commodity exporters.
Among commodity exporters, fiscal deficits in 2015 are projected to have increased from 2014
levels by some 1½ percentage points of GDP, driven by a drop in budgetary revenues that
averaged some 2½ points of GDP (Figure 5, Panel A). Many countries (including Chad and
Mozambique) cut back on spending levels in the face of revenue erosion while some (Nigeria)
took revenue measures, but these were typically not commensurate with the revenue losses.
Fiscal deficits increased by an average of 0.4 points of GDP in 2015 among diversified exporters,
notwithstanding the favorable headwinds of continued high growth and favorable (net)
commodity price developments. Among the larger countries, Myanmar and Kenya feature as
cases where fiscal deficits increased significantly in 2015—to 5 and 8 percent of GDP,
respectively—linked to a fall off in receipts from state-owned energy companies and a public
wage increase (Myanmar) and rising expenditure levels (Kenya). Among the smaller economies,
some achieved a net improvement in fiscal positions, helped by lower fuel costs, elimination of
fuel subsidies, and improved revenue mobilization (Honduras, Rwanda).
12. Public debt burdens have also risen across LIDCs, albeit with substantial cross-country
variation—reflecting both price shocks and divergences in domestic budgetary policies.
Among commodity exporters, the average increase in general government debt has been
relatively modest (Figure 5, Panel B)—helped in part by the large weight of Nigeria (where public
debt rose only marginally, with fiscal financing facilitated by depleting government deposits).
But several countries have experienced more severe stresses, with Republic of Congo (oil), Mali
(fragility), Yemen (fragility/conflict), Zambia (loose fiscal policies), and Zimbabwe among the
countries where the public debt/GDP ratio increased by at least 10 points of GDP from 2013 to
2015.9
For diversified exporters, public debt burdens are also on an upward trend, notwithstanding
modest fiscal deficits in the aggregate. Among the larger countries, public debt levels increased
by more than 10 percentage points of GDP from 2013 to 2015 in Ghana (where fiscal deficits
have been high since 2012), Kenya (with its strategy of scaling-up public investment through
borrowing), and Cameroon (where deficits have increased and inflation, anchored on the euro,
has been low). Smaller countries where public debt burdens have increased sharply from 2013
through 2015 include Moldova (up 21 points of GDP, linked to banking sector bailouts), The
Gambia (up 24 points of GDP on Ebola-hit growth and large fiscal deficits), Liberia (up 14 points
of GDP on Ebola-related shocks to growth and the budget), and Kyrgyz Republic (up 14 points of
GDP on public sector investment).
9 Large exchange rate depreciations have contributed to rising public debt/GDP ratios in many cases, including
Kyrgyz Republic and Zambia.

MACROECONOMIC DEVELOPMENTS AND PROSPECTS IN LIDCS: 2015
14 INTERNATIONAL MONETARY FUND
… while external positions show a mixed picture.
13. The divergent impact of commodity price changes on commodity and diversified
exporters is reflected in the evolution of external positions in 2015. For commodity exporters:
The (weighted) average of current account deficits for the group as a whole is projected to have
increased from 2.6 to 4.0 percentage points of GDP during 2015 (Figure 6, Panel A)—but current
account positions have been improving, for example, in the Democratic Republic of Congo as
new projects shift from the investment stage to production. Nigeria and Bolivia provide cleaner
examples of the impact of resource price shocks, with current account deficits widening by 5 and
8 points of GDP, respectively, during 2013–15.10
External debt levels are assessed to have increased moderately (Figure 6, Panel C), with the
aggregate increase partly contained by Nigeria’s minimal level of public external debt.11
But
group averages—an unweighted increase of 3½ points of GDP in 2015—hide significant
country-level variations. Countries where debt levels are projected to rise significantly in 2015
include Republic of Congo and Niger (both up 17 points of GDP), Zimbabwe (up 15 points of
GDP), and Zambia and Mozambique (both up 9 points of GDP, assisted by large exchange rate
depreciations (Figure 6, Panel E)).
10
Interpreting current account developments in countries where there are large investment projects underway,
financed externally, is difficult without a detailed disaggregation of the balance of payments. In countries such as
Mozambique (current account deficit of 40 percent of GDP in 2015), attention is often best focused on the evolution
of government external borrowing and foreign reserve levels.
11 Nigeria accounts for about one-half of the PPP-measured GDP of commodity exporters.
Figure 5. Fiscal Sector Developments
Panel A. Government Fiscal Balance
(Percent of GDP, PPP-GDP weighted averages)
Panel B. Public Debt
(Percent of GDP, PPP-GDP weighted average)
Sources: World Economic Outlook and IMF staff estimates.
-30
-20
-10
0
10
20
30
2010-2012
2013
2014
2015
2010-2012
2013
2014
2015
Commodity Exporters Diversified Exporters
Government Revenue Government Grants Current Expenditure
Capital Expenditure Overall Fiscal Balance
0
5
10
15
20
25
30
35
40
45
50
20
10
-20
12
20
13
20
14
20
15
20
10
-20
12
20
13
20
14
20
15
Commodity Exporters Diversified Exporters

MACROECONOMIC DEVELOPMENTS AND PROSPECTS IN LIDCS: 2015
INTERNATIONAL MONETARY FUND 15
Reserve levels (measured in months of import coverage) have declined in 2015—most markedly
in the case of countries defending fixed exchange rates (Figure 6, Panel F). Declines are
projected to be particularly sharp in the cases of Republic of Congo (five months) and, among
the larger countries, Yemen (three months) and Nigeria (0.9 months).
Countries with fixed exchange rate regimes are set to experience a median decline in reserves of
1½ months of import cover. By contrast, reserve coverage is set to move only marginally in
Zambia and Mozambique, where large exchange rate depreciation facilitated adjustment
(Figure 6, Panel E). Intermediary cases include Malawi and Nigeria, where the balance of
payments shock was accommodated through a mix of reserve depletion and exchange rate
depreciation.
14. Developments among diversified exporters also involved significant variation across
countries:
Current account positions are estimated to have deteriorated significantly for diversified
exporters as a group in 2015, led by Vietnam (up a projected 4 points of GDP), Myanmar (up
3 points of GDP), and Ethiopia (up 4 points of GDP) among the larger economies.12
But reserve
coverage ratios are expected to show only marginal changes in each of these three cases (rising
slightly in Ethiopia, falling slightly in Myanmar and Vietnam), pointing to the offsetting role of
capital inflows in financing these imbalances.13
Increases in external debt burdens in the three
countries are expected to be modest (1–2 points of GDP), helped by strong trend growth and
non-debt creating inflows.
Current account positions are expected to move only modestly among other large economies in
this group, some recording improvements, others minor declines. But current account deficit
levels remain elevated (a projected 8–10 points of GDP per annum) in several cases, including
Ghana and the East African Community—with external debt levels increasing significantly in
2015 in Uganda (10 points of GDP) and Tanzania (7 points of GDP). Import coverage is expected
to show generally modest changes in 2015, with significant declines (0.5 months or more) only
in Uganda, Cameroon, and Kenya (in the latter two cases, reversing increases in 2014).
Among the smaller diversified exporters, current account positions should show relatively
modest movements in 2015 (an exception being Ebola-hit Liberia), but deficit levels remain high
in many cases, reflecting large investment projects (public and private). External debt levels are
set to rise sharply in Djibouti (infrastructure projects), and Kygrz Republic (banking system
bailouts), with import cover declining significantly (at least one month of imports) in Comoros,
The Gambia, and Moldova.
12
The weighted-average change in the current account position for the 12 largest diversified exporters excluding
Ethiopia, Myanmar, and Vietnam is a slight deterioration of 0.1 percent of GDP.
13 The (unweighted) average change in import cover across the ten largest diversified exports, excluding Uganda, is
estimated to have been about -0.3 months in 2015, and about 0.1 months during 2014–15. By contrast, Uganda is
estimated to have experienced a decline of almost one month of reserve import coverage in 2015.

MACROECONOMIC DEVELOPMENTS AND PROSPECTS IN LIDCS: 2015
16 INTERNATIONAL MONETARY FUND
Figure 6. External Sector Developments
Panel A. Current Account Balance
(Percent of GDP, PPP-GDP weighted averages)
Panel B. Capital Flows to LIDCs
(US$ billions)
Sources: World Economic Outlook and IMF staff estimates.
Sources: World Economic Outlook and IMF staff estimates.
Panel C. External Debt
(Percent of GDP, PPP-GDP weighted averages)
Panel D. EMBIG Sovereign Spread
(Basis points, USD-denominated, as of 9/23/2015)
Sources: World Economic Outlook and IMF staff estimates.
Source: Bloomberg.
Panel E. Depreciation of Currencies
(Selected LIDCs, June 2014–September 2015,
percentages)
Panel F. Reserve Coverage
(Months of imports, percentiles)
Sources: World Economic Outlook and Bloomberg.
Sources: World Economic Outlook and IMF staff estimates.
-60
-40
-20
0
20
40
60
80
100
120
2000 2001 2002 2003 2004 2005 2006 2007 2008 2009 2010 2011 2012 2013 2014 2015
(Est.)
FDI
Portfolio
Official flows
Other non-official flows
Gross capital inflows
Gross capital inflows, Frontier Markets
-10
-5
0
5
10
2010-2012 2013 2014 2015
Trade balance
Income and current transfers
Current account balance
2010-2012 2013 2014 2015
Commodity Exporters Diversified Exporters
-40
-30
-20
-10
0
Zam
bia
Mala
wi
Mo
zam
biq
ue
Nig
eri
a
Mau
rita
nia
Mo
ng
olia
Afg
han
ista
n
Pap
ua N
ew
Gu
inea
Ug
an
da
Mad
ag
ascar
Mo
ldo
va
Tan
zan
ia
Gh
an
a
Rw
an
da
Gam
bia
, Th
e
Commodity Exporters Diversified Exporters
0
5
10
15
20
25
30
35
20
10
-20
12
20
13
20
14
20
15
20
10
-20
12
20
13
20
14
20
15
Commodity Exporters Diversified Exporters
0
1
2
3
4
5
6
7
8
9
10
2014
2015
2016
2017-2019
2014
2015
2016
2017-2019
2014
2015
2016
2017-2019
2014
2015
2016
Floating Fixed Floating Fixed
Commodity Exporters Diversified Exporters
Medians
75 percentile
25 percentile

MACROECONOMIC DEVELOPMENTS AND PROSPECTS IN LIDCS: 2015
INTERNATIONAL MONETARY FUND 17
15. Aggregate capital inflows to LIDCs eased in 2014 but are projected to partially recover
in 2015, helped by an increase in official flows (Figure 6, Panel B); private capital flows look to have
fallen in both years, with FDI remaining somewhat more robust. Movements in the LIDC aggregates
are closely linked to flows to frontier markets, suggesting that flows to non-frontier markets have
been broadly stable in the aggregate, albeit with higher official flows partially offsetting weaker
private flows (likely FDI). For countries with outstanding sovereign bond issues, yields have generally
increased in 2014–15 (Figure 6, Panel D)—most notably for Mozambique, Zambia, and Ghana—but
the cross-country variations are large (see Section 3 for further analysis).
16. Fund financial support for LIDCs has increased significantly in 2015, boosted by
requests from frontier market economies and from Ebola-affected countries in West Africa
(Box 2). New programs with Ghana and Kenya—the latter a precautionary arrangement aimed at
providing contingent support in the face of uncertain external financing conditions—accounted for
three-quarters of the new commitments of financial support. Indications are that there will be
additional demand for new funding commitments in 2016.
Currency depreciations have partially offset the downward trend in inflation in LIDCs.
17. Despite a declining trend, some LIDCs face inflation pressures linked to currency
depreciation (Figure 7). Helped by low global inflation, inflation in LIDCs has been on downward
trajectory since the double-digit peak in 2011, averaging 7½ percent in 2014, but is projected to
have picked up slightly to 7¾ percent in 2015.
For LIDCs with fixed exchange rate regimes, average inflation is estimated to decline marginally
in 2015, from 5.1 percent to 4.9 percent—excluding countries where domestic inflation has
surged (above 30 percent) due to conflict situations (Yemen, South Sudan). Euro-pegged
countries have generally seen inflation contained at low levels (such as Cote d’Ivoire, Republic of
Congo), but often at the expense of declining international reserves.
For LIDCs with flexible exchange rate systems, average inflation is assessed to rise in 2015 from
7.6 to 8.5 percent—with exchange rate depreciations in response to adverse terms of trade
shocks an important contributory factor in some cases. But initial pass-through pressures have
been contained in several countries, supported by monetary tightening: large depreciations in
Mozambique, Nigeria, Uganda, and Zambia (Figure 6, Panel E) are expected to produce only
modest increases (1–2 percentage points) on single-digit inflation rates. Among the larger
diversified exporters, Myanmar, uniquely, saw a projected doubling of inflation in 2015 (to
12 percent), with Ghana containing already elevated inflation to some 15 percent.

MACROECONOMIC DEVELOPMENTS AND PROSPECTS IN LIDCS: 2015
18 INTERNATIONAL MONETARY FUND
Box 2. 2015 PRGT Loan Demand: Recent Trends and Near-Term Outlook*
IMF concessional financing has increased
sharply in 2015. Total new commitments
(excluding program augmentations) up to
September have already largely exceeded the
total annual amount in 2014. About 77 percent
of the 2015 PRGT commitments was accounted
for by two programs: an ECF for Ghana and a
precautionary SBA-SCF for Kenya. In addition,
there were five ECF augmentations which
amounted to SDR 158 million. Based on staff
surveys and pending requests, total
commitments (including augmentations) in 2015
are estimated to increase to about
SDR 1.7 billion, the highest level since the global
financial crisis.
Greater Fund financial support to low-
income countries (LICs) is a direct
response to adverse global conditions as
well as domestic pressures. The
slowdown in commodity prices and tighter
global liquidity conditions are key drivers
of higher demand this year. For example,
Ghana’s ECF is expected to help address
financing gaps from a decline in oil
revenues and difficulties in accessing
international financial markets; Kenya’s
SCF-SBA also aims to address difficulties
related to tightening global liquidity
conditions and possible worsening of the
security situation. Other factors include the
Ebola epidemic, security-related issues, and natural disasters.
Recent reforms unlocked additional resources for LICs. The 50 percent increase in access to the Fund’s
concessional facilities under the reform in July 2015 provides a timely enhancement of the financial safety net for
LICs. Since the reform, several augmentations, and new program requests—including Mozambique (decline in
commodity prices); Niger (security-related issues); and Sierra Leone (for Ebola and lower commodity prices)—have
been either approved or are in the pipeline for the remainder of 2015.
PRGT subsidy resources remain adequate to accommodate a temporary period of high demand. The 2015
increase in demand is not unusual by historical standards and illustrates the volatile nature of demand for
concessional resources. The PRGT’s subsidy endowment can accommodate such temporary increases in demand,
with the PRGT’s three-pillar strategy targeting an average lending capacity of SDR 1¼ billion which is robust under
a wide range of demand scenarios. At the same time, mobilization of new loan resources for the PRGT of SDR
11 billion from current and prospective new lenders, has started to secure adequate financing beyond 2016.
* Prepared by Gilda Fernandez and Iza Rutkowska.
11
13
10 10
7 8
10
4
18
13
16
10
15
0
9
17
0
500
1,000
1,500
2,000
2,500
3,000
2000 2001 2002 2003 2004 2005 2006 2007 2008 2009 2010 2011 2012 2013 2014 2015
ECF commitments
Augmentations/Reductions
ESF commitments
RCF and SCF commitments
Number of new commitments (excluding augmentations)
New PRGT Commitments, 2000–2015
(In millions of SDRs; actual commitments as of October 31, 2015, projections thereafter)
0
10
20
30
40
50
60
0
200
400
600
800
1,000
1,200
1,400
1,600
Ebola Natural
disasters
Decline in
commodity
prices
Tighter
global
liquidity
Security Other
RCF
ECF
SCF
Number of requests
1/ Includes expected new programs and augmentations. Sum of categories exceeds 100 percent since some countries fall
under more than one category.
External Drivers of Demand for Fund Concessional Assistance in 2015
(In millions of SDRs, assistance approved as of October 31, 2015, projections thereafter)

MACROECONOMIC DEVELOPMENTS AND PROSPECTS IN LIDCS: 2015
INTERNATIONAL MONETARY FUND 19
Figure 7. Inflation Developments
Panel A. Inflation by Exchange Rate Regime (Percent, annual period average, PPP-GDP weighted
averages)
Panel B. Inflation by LIDC Subgroups (Percent, annual period average, PPP-GDP weighted
averages)
Sources: World Economic Outlook and IMF staff estimates.
D. The Near-Term Outlook
18. The global outlook confronting LIDCs in 2016 is expected to involve a modest pick-up
in aggregate growth, with only marginal movements in commodity prices from 2015 levels.
The envisaged pick-up in growth is contingent on major advanced economies continuing to benefit
from supportive monetary conditions and some improvement in conditions in emerging market
economies in economic distress.14
Transitions weighing on the outlook include the expected gradual
tightening of U.S. monetary policy and the ongoing rebalancing of the Chinese economy: capital
flows to emerging and frontier markets are also expected to fall significantly. More generally, the
balance of risks to the outlook is assessed as being titled to the downside.
19. The implications for individual LIDCs, again, depends heavily on the composition of
trade and, in some cases, the extent of reliance on commercial external financing:
For commodity exporters, a further deterioration of the terms of trade is not expected—but
rather maintenance into the medium-term of low export prices, as compared with the levels
prevailing in 2011–13. Countries that used fiscal space and foreign reserves to limit the adverse
impact of low export prices in 2015 will be operating with reduced policy space.
For diversified exporters, the prospects for a limited pick-up in global demand, coupled with
broad constancy of commodity prices, offer a relatively benign external environment—
simplistically, a repeat of 2015—although those dependent on external financing look set to face
higher borrowing costs.
14
See IMF (2015a) and IMF (2015f).
0.0
2.0
4.0
6.0
8.0
10.0
12.0
14.0
2010 2011 2012 2013 2014 2015
All LIDCs
Float
Fixed
Float w/o Sudan
Fixed w/o South Sudan and Yemen
0.0
2.0
4.0
6.0
8.0
10.0
12.0
14.0
2010 2011 2012 2013 2014 2015
LIDC
Frontier markets
Fragile states
Developing markets

MACROECONOMIC DEVELOPMENTS AND PROSPECTS IN LIDCS: 2015
20 INTERNATIONAL MONETARY FUND
20. Against this backdrop, staff projections
for 2016 envisage some rebound in growth for
commodity exporters and some pick-up in
already-robust growth for diversified
exporters (see Table 2).
The headline growth figures for commodity
exporters—with (weighted) average growth
increasing from 3.0 percent to 4.8 percent—
are distorted by a huge swing in output levels
in conflict-affected Yemen: the experience of
Nigeria, with growth falling from 6.3 percent
in 2014 to 4.0 percent in 2015 and then
increasing slightly to 4.3 percent in 2016 is
more representative.
Diversified exporters are expected to record strong growth, with the six largest countries all
recording growth in the range of 6½–8½ percent, only marginally changed from 2015 levels.15
Growth is set to pick up in countries affected by natural disasters in 2015 (Liberia, Nepal),
emerging from political instability (Madagascar), or with close linkages to Russia (Krygyz
Republic).
Inflation is expected to show little movement across countries recording single-digit levels, while
declining from elevated levels in conflict-afflicted countries (South Sudan, Yemen) and countries
pursuing stabilization programs (Ghana, Malawi).
21. Fiscal positions are expected to improve somewhat across commodity exporters,
reflecting policy efforts to adjust to more constrained revenue situations and reduce the elevated
deficits recorded in 2015. But projected adjustment efforts are expected, on average, to reverse less
than half the increase of 1.5 points of GDP recorded in 2015 (Table 2)—with levels of fiscal deficits
exceeding 6 percent of GDP in several cases (including Mongolia, Zambia, and conflict-hit Yemen
and South Sudan). There is no clear trend in fiscal positions across diversified exporters, with
Bangladesh and Uganda increasing outlays to finance public investment, Ghana and Kenya pursuing
fiscal consolidation. There are no significant shifts in external current account positions envisaged
for 2016, except in countries where large investment projects are scaling up (or down); reserve
coverage measures are expected to show little movement, albeit with some erosion among a few of
the larger commodity exporters (Mongolia, Nigeria).
22. The outlook is subject to downside risks, both external (discussed above) and domestic in
nature. Key domestic risks include policy slippages, particularly in countries facing tight financing
constraints; natural disasters (the frequency of which is increasing (Section 2); and political instability
15
Bangladesh, Vietnam, Myanmar, Ethiopia, Kenya, and Tanzania.
Table 2. Selected Macroeconomic Indicators
(PPP-GDP weighted averages)
Sources: World Economic Outlook and IMF staff estimates.
2014 2015 2016 2017-2019
Est.
Growth (Percent)
Average LIDCs 6.0 4.8 5.8 6.0
Commodity Exporters 5.7 3.0 4.8 5.2
Diversified Exporters 6.3 6.3 6.6 6.6
Inflation (Percent)
Average LIDCs 7.5 7.7 7.3 6.3
Commodity Exporters 9.4 9.6 8.7 7.1
Diversified Exporters 5.9 6.1 6.1 5.6
Fiscal Balance (Percent of GDP)
Average LIDCs -3.3 -4.2 -4.0 -3.5
Commodity Exporters -2.4 -3.9 -3.2 -2.9
Diversified Exporters -4.1 -4.5 -4.6 -3.9
Current Account Balance (Percent of GDP)
Average LIDCs -3.1 -4.5 -4.7 -4.1
Commodity Exporters -2.6 -4.0 -4.2 -3.9
Diversified Exporters -3.5 -5.0 -5.1 -4.2
Projections

MACROECONOMIC DEVELOPMENTS AND PROSPECTS IN LIDCS: 2015
INTERNATIONAL MONETARY FUND 21
and conflict. Adverse external shocks to countries with already eroded policy space could trigger
significant contractions, augmented by (forced) pro-cyclical adjustments. Incoming high-frequency
data suggest that some downside risks to growth are materializing for a number of LIDCs.
E. Policy Challenges
23. A recurrent theme in the preceding discussion has been the diversity of country
situations, including variations in income levels, balance of payments structures, fiscal positions,
capacity levels, and the role of mega-projects (scaled relative to GDP). There is a corresponding
diversity in messages for policy-makers which, in LIDCs more than in richer/larger economies,
cannot be easily deduced from a review of the macroeconomic accounts. But, some general
messages emerge from developments (national and international) over the past 18 months.
24. First, the era of high commodity prices has likely ended for the foreseeable future,
implying that countries dependent on commodity exports must adjust to a new less favorable
environment. The declines of commodity prices in 2014–15 are rooted in fundamental shifts in
supply conditions (oil) and demand patterns (for many minerals), rather than cyclical factors, and
hence will likely not be soon reversed. In the near-term, the pace of adjustment (to budgetary
policies, real exchange rates) in commodity exporters may be tempered by the use of existing policy
space to support domestic demand (borrowing room, reserve levels) or by accessing financial
support from multilateral financial institutions. Over the medium term, adjustment cannot be
avoided and, if development objectives are to be achieved, will need to include strong efforts to
boost domestic revenue mobilization and achieve diversification into new export products that can
replace lost commodity revenues—policy messages that are forcefully articulated in the Addis
Ababa Action Agenda (see United Nations, 2015).
25. Second, the large shocks experienced by commodity exporters, with the ensuing
domestic economic fallout, offer a reminder of the merits of building macroeconomic policy
space: fiscal positions (including public debt levels) that provide countries with room to avoid pro-
cyclical adjustment in downturns, foreign reserve levels that allow a smoothing of external
adjustments, grounded inflation expectations that provide space for monetary easing. Judgment as
to the appropriate timing for building policy space (rather than, say, accelerating public investment)
will depend on country circumstances—but the general prescription of preparing for a rainy day is
sound. The rising vulnerability levels discussed in Section 2 point to the need for early action in
many cases. For LIDCs facing difficult trade-offs between boosting development spending and
building buffers, the multilateral financial institutions represent an important potential source of
policy space, through their role in providing counter-cyclical financial support.
26. Finally, the concerns about repricing risk and limits on market access articulated
during the recent period of surging sovereign bond issuances by LIDCs have materialized in
some cases (Figure 6, Panel D). This is not an argument against tapping commercial markets when
funds are cheap—rather a reminder of the importance of sound debt management strategies in
situations where investor sentiment can quickly sour.

MACROECONOMIC DEVELOPMENTS AND PROSPECTS IN LIDCS: 2015
22 INTERNATIONAL MONETARY FUND
GROWING VULNERABILITIES
27. The first section of this report noted that lower commodity prices and tightening of
external financing conditions has adversely affected many LIDCs, although the effects have
been far from uniform: many commodity exporters have been hit hard, but growth has held up
well across diversified exporters.
28. This section explores the following issues:
How have macroeconomic and financial vulnerabilities in LIDCs evolved in recent years, given
changing domestic and external conditions?
How would the near-term outlook for LIDCs be affected by plausible adverse shocks to the
global economy, drawing on scenarios in line with recent World Economic Outlook and Global
Financial Stability Reports.
How is the process of climate change likely to affect LIDC’s vulnerabilities over the longer term?
A. Current Vulnerabilities
29. The analysis here draws on methodologies outlined in previous IMF assessments of
vulnerabilities in low income countries.16
We first look at the risk of experiencing a sharp decline
in economic growth (measured by a Growth Decline Vulnerability Index (GDVI)): vulnerability is
assessed on the basis of external sector, fiscal, growth, and institutional factors, with countries being
ranked as low, medium, or highly vulnerable.17
We then look at recent developments in regard to
debt vulnerabilities across LIDCs and at macro-financial vulnerabilities in frontier market countries.
Trends in LIDCs’ Macroeconomic Vulnerabilities
30. The vulnerability of LIDCs to an adverse growth shock has increased significantly
across regions and subgroups over the past two years:
The share of LIDCs deemed to be highly vulnerable has risen substantially (see Figure 8),
reaching 40 percent as of 2016.18
This is a level not seen since the immediate aftermath of the
global financial crisis in 2008–09.
16
See, in particular, IMF (2013a), and IMF 2014a, Box 2 for further discussion.
17 The GDVI methodology is built on assessment of vulnerabilities at the sectoral level, focusing on the external,
fiscal, and “real economy” sectors (the last reflecting a composite of growth performance, institutional capacities and
income inequality). Recent analytical work to strengthen the methodology is described in Appendix I.
18 The assessment of vulnerability at the outset of 2016 is based on 2015 data.

MACROECONOMIC DEVELOPMENTS AND PROSPECTS IN LIDCS: 2015
INTERNATIONAL MONETARY FUND 23
0
20
40
60
80
100
2011 2012 2013 2014 2015 2016
High Medium Low
The increase in vulnerability levels
(measured by the share of countries
deemed medium or highly vulnerable)
has occurred across all country
groupings (fragile states, frontier
markets, developing markets) and
among both commodity exporters and
diversified exporters (Figure 9). The
increase in vulnerabilities has been
especially marked among commodity
exporters, with oil exporters most
severely hit.
Sources of vulnerability differ across
exporter groupings (Figure 10). Weak external sector positions are now the primary source of
vulnerability among commodity exporters; fiscal positions are the lead source of vulnerability in
diversified exporters (although the share of this grouping at medium/high risk from fiscal
positions is much lower than for commodity exporters).
31. The evolution of vulnerabilities in 2014–15 is largely accounted for by two factors: (i) a
weakening in fiscal and external buffers over time, and (ii) the 2014–15 drop in commodity
prices. Expansive policy stances, initiated in many LIDCs during the global financial crisis, were
maintained as the global environment improved, supporting growth but also producing a gradual
weakening of fiscal and external positions that was reflected in the upward drift in vulnerabilities
through 2014 (Figure 9, left panel). The 2014–15 commodity price shocks then hit many commodity
exporters hard, with marked increases in fiscal and current account deficits (see Section 1) that boost
vulnerability ratings. Diversified exporters did not fare as badly in the recent period, with
vulnerability ratings helped by continued strong growth performance but still rising in some
countries due to wider fiscal deficits.
Figure 9. Growth Decline Vulnerability Index by Country Groups, 2011–16
(Share of LIDCs with medium or high vulnerability, in percent, unweighted)
Sources: WEO; IFS; DSA; and IMF staff reports, World Bank and EM-DAT.
0
10
20
30
40
50
60
70
80
90
100
2011 2012 2013 2014 2015 2016
Commodity ExportersOil ExportersDiversified Exporters
0
10
20
30
40
50
60
70
80
90
100
2011 2012 2013 2014 2015 2016
Fragile states Frontier markets
Developing markets
Figure 8. Growth Decline Vulnerability Index, 2011–16
(LIDCs with Low, Medium, and High Vulnerabilities; in percent of total, unweighted)
Sources: WEO; IFS; DSA; and IMF staff reports, World Bank; and EM-
DAT.

MACROECONOMIC DEVELOPMENTS AND PROSPECTS IN LIDCS: 2015
24 INTERNATIONAL MONETARY FUND
50%
20%
30%
10%
30%
60%
0%
20%
80%
62%13%
25%
19%
47%
34%
Low Medium High
44%
15%
41%
48%
5%
47%
10%
37%53%
32%
21%
47%
Div
ers
ifie
d E
xpo
rte
rO
ilEx
po
rte
rC
om
mo
dit
y Ex
po
rte
rs
Real Sector Fiscal SectorExternal Sector
Figure 10. Growth Decline Vulnerability Index by Country Groups, 2016 (Share of LIDCs, in percent, unweighted)
Sources: WEO; IFS; DSA; and IMF staff reports, World Bank; and EM-DAT.
32. Debt sustainability assessments
(DSAs) for LIDCs point to a weakening of
debt positions in some countries in 2014–
15, reversing the steady improvement
recorded for LIDCs as a whole over the past
decade (Figure 11).19
The number of countries
involved is modest, but the changes are
reflective of the general shift in economic
conditions discussed in Section 1.
Some thirty percent of LIDCs are currently
deemed to be at low risk of encountering
external debt distress, with over one-fifth
assessed as being at high risk of, or
already in, debt distress.20
The remaining
LIDCs are classified as being at moderate risk.
19
For a discussion of the evolution of public debt vulnerabilities in low income countries during the 2007–14 period,
see IMF (2015g); the focus here is on developments since 2014.
20 DSAs for low-income countries are conducted on a regular basis (ideally annually) by the staffs of the IMF and the
World Bank, using the Low Income Country Debt Sustainability Framework (LIC-DSF). DSAs yield a rating on the risk
of the country encountering external debt distress: low, moderate, high risk, or “in debt distress”.
Figure 11. Evolution of Risk of Debt Distress
(In percent of total number of LIDCs with DSAs)
24 26 27 2934 33 37 35 34 31
31 31 2932
32 3335
44 4547
44 43 44 3934 33
2821 21 22
0
10
20
30
40
50
60
70
80
90
100
2006 2007 2008 2009 2010 2011 2012 2013 2014 2015
High / in debt distress Moderate Low
Sources: LIC DSF database and staff calculations.
Notes: 1. The number of LIDCs for which DSAs have been prepared grew from 54 in 2006 to 58 in 2015. No DSAs have
been prepared so far for Somalia and Uzbekistan.
2. If a DSA was not conducted in a particular year, the previous risk rating was used. As of end -September 2015, 31 new
DSAs had been conducted in 2015.

MACROECONOMIC DEVELOPMENTS AND PROSPECTS IN LIDCS: 2015
INTERNATIONAL MONETARY FUND 25
During 2014 and the first nine months of 2015, there were eight rating downgrades and five
upgrades (with six downgrades and three upgrades in 2015).
Among downgrades, four countries (Cameroon, Ethiopia, Republic of Congo and Zambia) moved
from low to moderate risk; four (Central African Republic, Ghana, Mauritania and Mongolia) from
moderate to high risk. The downgrades have in most cases resulted from higher levels of
external borrowing.
Of the five upgrades, two countries (Nepal and Tajikistan) moved from moderate to low risk,
three countries (Comoros, Democratic Republic of Congo and Haiti) improved from high to
moderate risk. Several of the upgrades resulted from a change in the DSA methodology.21
33. The discussion above has pointed to a significant increase in macroeconomic
vulnerabilities in LIDCs in the wake of the 2014–15 commodity price shocks. Key policy
messages from these developments include:
Policy space has been seriously eroded in many commodity exporters (Figure 10), implying that
slow adjustment to the new external environment would leave countries severely exposed to
new adverse shocks (see sub-section B below), putting macroeconomic stability itself at risk.
Countries that have moved into “high vulnerability” territory should focus on accelerating
adjustment to the new commodity price environment through a mix of fiscal tightening (cutting
non-priority outlays and untargeted subsidies, “quick-win” tax measures, possibly slowing
implementation of public investment plans) and accepting greater exchange rate depreciation
(where relevant), buttressed by monetary tightening to contain any sustained jump in inflation.
Vulnerabilities continue to drift upwards in diversified exporters. With strong growth remaining
the norm in this grouping, countries have room to re-calibrate macroeconomic policies towards
strengthening fiscal and external positions—an option that should be exercised in countries
where vulnerabilities have reached, or are approaching, elevated levels.
Macrofinancial Vulnerabilities in Frontier Markets
34. Financial vulnerabilities in LIDCs are evaluated in IMF (2014a), where it was concluded
that vulnerabilities had abated since the global financial crisis, with financial sector stability
typically supported by a strong domestic funding base and limited reliance on external
financing. That said, it was noted that asset quality was a key risk factor, particularly in countries
where bank lending is politicized and/or credit is growing rapidly; that credit growth in some
countries was a cause for concern; and that developments in financially evolving frontier markets
warranted close attention. This broad assessment is unchanged.
21
The discount rate used to calculate the present value of future payments in the LIC-Debt Sustainability Framework
was increased from 3 percent to 5 percent in September 2013.

MACROECONOMIC DEVELOPMENTS AND PROSPECTS IN LIDCS: 2015
26 INTERNATIONAL MONETARY FUND
Number of Countries Share of Countries
2009 2010 2011 2012 2013 2014 2009 2010 2011 2012 2013 2014
Low 3 2 4 4 5 5 21 14 29 29 36 36
Medium 0 1 2 3 0 1 0 7 14 21 0 7
High 11 11 8 7 9 8 79 79 57 50 64 57
Total 14 14 14 14 14 14 100 100 100 100 100 100
-0.4
-0.2
0.0
0.2
0.4
0.6Return on Assets
Bank credit to bank
deposit ratio
Cross border loans to
GDP
Cross border deposits
to GDP
Growth rate of M2 to
GDP
Growth rate of private
credit to GDP
2010
2013
2014
35. We look here at the evolution of macrofinancial vulnerabilities in frontier markets,
drawing on the financial vulnerability index and z-score methodology utilized in IMF (2014a) and
looking at the macroeconomic risks from rising interest rates on sovereign bonds.22
36. As in 2014, the financial vulnerability index suggests that financial systems in more than
half of the frontier market economies face sizeable risks, typically stemming from the rapid pace of
credit growth and the sizeable share of bank lending denominated in foreign currency (Table 3). For
the eight countries
classified as being at
“high risk,”23
vulnerabilities reflect
some combination of
high shares of domestic
credit in foreign
currency (seven cases),24
fast credit growth over the last three years (five cases),25
and low bank capital buffers (three cases).
37. Use of the z-score methodology points
to a broadly similar set of risks in frontier
market economies as a group, while also
suggesting that these risks have been increasing
(Figure 12).26
Risk factors that have been
increasing over time include the scale of cross-
border lending, the ratio of bank credit to
deposits, and the (falling) average rate of return
on assets.
22
The financial vulnerability index for frontier markets is based on five variables: capital adequacy ratio, return on assets,
the ratio of bank loans to bank deposits, cumulative three-year growth of the credit-GDP ratio, and the ratio of foreign
liabilities (cross border loans and deposits) to domestic credit. For further discussion of the methodology, see
IMF 2014a, Appendix III.
23 The assessment of “high risk” should be seen as flagging potential vulnerabilities rather than providing an assessment
of immediate risk to banking systems.
24 Substantial shares of credit in foreign currency constitute a source of fragility even if banks avoid incurring net open
foreign exchange positions: foreign currency loans pose a risk to asset quality if borrowers are not hedged. The large
currency depreciations recently recorded in several LIDCs may impair asset quality via this route.
25 Distinguishing between “rapid” and “excessive” credit growth is difficult; a recent staff analysis of credit growth in
sub-Saharan Africa did not find compelling evidence of excessive growth (IMF 2015h).
26 The z-scores are standardized measures of how close an observation is to the historical mean of a given variable, with
a smaller score indicating lower risk (IMF 2014a, Section 2). The frontier market group includes 14 countries, with z-
scores first derived for each country from common means and standard deviations of frontier LICs, and a group score
being calculated as a simple average of country scores. The indicators used seek to capture both domestic and foreign
influences on financial stability.
Table 3. Financial Vulnerability Index
Source: IMF staff estimates.
Figure 12. Frontier Markets’ z-Scores 1/
Source: Bankscope, BIS, and IMF staff estimates.
1/ Unweighted averages

MACROECONOMIC DEVELOPMENTS AND PROSPECTS IN LIDCS: 2015
INTERNATIONAL MONETARY FUND 27
0
1
2
3
4
5
6
7
2015 2017 2019 2021 2023 2025 2027 2029
Maturity Year
38. Rising yields for frontier market government debt pose a risk for sovereigns that are
reliant on foreign borrowing. As noted in Section 1, spreads on sovereign bonds have increased
markedly for several frontier market economies
over the past year—albeit with large variations
across countries that, in the main, reflect
differences in country fundamentals and prospects
(Figure 6, Panel D). Rollover risks on debt already
issued (whether re-pricing risk or lack of access)
should remain limited in the near term, as only
modest volumes of Eurobonds will be falling due
in the next few years (Figure 13). But rising yields
pose a threat to countries where new external
commercial financing is an important element of
near-term spending plans. These countries face
difficult choices, trading off the merits of domestic
versus external borrowing and/or adjusting fiscal
plans to fit the envelope of financing available on terms consistent with maintaining debt
sustainability.
39. Taken together, the preceding analysis points to concerns about financial stability and
external financing risks in several, but not all, frontier market economies. The methodologies
used here serve to identify potential risk factors. National agencies responsible for financial system
stability need to conduct detailed assessments of these risks to identify the specific nature of the
problems at play and the remedial measures needed. Similarily, public debt managers need to re-
assess fiscal financing plans in light of rising external funding costs, with a view to containing any
adverse debt dynamics. Technical support from external agencies, including the Fund, can provide
assistance in these exercises.
B. Scenario Analysis: Vulnerability of LIDCs to Global Shocks27
40. LIDCs remain vulnerable to global shocks. Trade continues to be the main spillover
channel from advanced and emerging economies both through volume and price effects, but there
are also important linkages via investment flows and remittances.
41. The effects of two global shock scenarios on LIDCs are examined here, drawing on
scenarios from recent World Economic Outlook and Global Financial Stability Reports:28
27
The scenario analysis was prepared jointly with Andrew Edward Hodge, Marialuz Moreno Badia, and
Aiko Mineshima (all FAD).
28 The methodology employed in fleshing out these scenarios is discussed in Box 3.
Figure 13. Eurobonds Maturity Amount
(In billions US dollar)
Source: Dealogic.

MACROECONOMIC DEVELOPMENTS AND PROSPECTS IN LIDCS: 2015
28 INTERNATIONAL MONETARY FUND
0.0
0.5
1.0
1.5
2.0
2.5
3.0
3.5
4.0
4.5
2014 2015 2016 2017 2018 2019
Inflation
0.0
2.0
4.0
6.0
2014 2015 2016 2017 2018 2019
Growth
Geopolitical fragmentation
Financial volatility
Baseline
Source: WEO.
A global financial volatility scenario involves a reassessment by investors of underlying risks
and growth prospects, amplified by low market liquidity and reemergence of financial stress in
systemic advanced countries. The heightened volatility delays monetary policy normalization
and limits economic risk-taking worldwide. Global output falls by 2.7 percentage points relative
to baseline during the three-year period 2015–17, with the sharpest difference in 2016,
temporarily depressing oil prices by 22 percent and non-oil commodity prices by 11 percent.29
A prolonged geopolitical tensions scenario considers the consequences of a series of regional
conflicts. In this scenario, global output falls by 1.5 percentage points relative to baseline during
the three-year period 2015–17, oil prices are 8 percent above the baseline in 2016, while other
commodity prices soften slightly.
Figure 14. Shock Scenarios: Global Growth and Inflation
(In percent per year)
42. The financial volatility scenario entails significant macroeconomic effects for many
LIDCs and creates sizeable external financing needs (Figure 15). Due to weaker foreign demand,
LIDC output would be lower by 1.2 percentage points relative to baseline by the end of the three-
year period; with slower GDP growth and a drop in commodity export revenues, fiscal positions
would deteriorate by a cumulative 1.5 percent of GDP; and public debt ratios would rise by
2.4 percent of GDP relative to baseline (reflecting the combined effect of lower GDP and higher
fiscal deficits). Current account deficits would deteriorate by a cumulative 4.6 percent of GDP, with
reserve coverage declining by about one month of imports. Given the shock to commodity prices,
commodity exporters would be more adversely affected than diversified exporters. The resulting
cumulative external financing gap by end-2017 is estimated at about US$51 billion. The effects
could be larger if global financial volatility were to result in sudden stops or reversals in capital
inflows to frontier countries.
29
The financial volatility scenario is a short to medium-run scenario where output levels (rather than growth rates)
are negatively affected in the early years before catching up with baseline forecasts in later years (hence the high
GDP growth rates in outer years). The analysis of the impact on LIDCs focuses on the period 2015–17.

MACROECONOMIC DEVELOPMENTS AND PROSPECTS IN LIDCS: 2015
INTERNATIONAL MONETARY FUND 29
43. The geopolitical fragmentation scenario yields a more limited impact on LIDCs’ output
levels, fiscal positions, and financing needs (Figure 16), given the smaller decline in global output
and mixed impact on international commodity prices. Output in LIDCs would be lower by
0.8 percentage points relative to the baseline, fiscal positions would deteriorate by a cumulative
0.2 percent of GDP, and public debt ratios would rise by 1 percent of GDP by end-2017. In the
aggregate, current account balances would deteriorate by a cumulative 0.6 percent of GDP, but oil
exporters would see current account balances helped by somewhat higher oil prices. The cumulative
external financing needed to maintain adequate reserves in LIDCs is estimated to be US$19 billion.
Figure 15. Impact of Financial Volatility Shock
(Cumulative deviation from baseline over three years)
Figure 16. Impact of Geopolitical Shock
(Cumulative deviation from baseline over three years)
Source: WEO and IMF staff estimates.
Box 3. Methodology for Scenario Analysis
Scenario analysis is a tool for evaluating the macroeconomic impact on LIDCs of global economic shocks. It
allows an assessment of the adequacy of external buffers and fiscal positions in the aftermath of global
shocks. The scenarios analyse the transmission of changes in commodity prices, remittances, and demand
shifts in major economies upon the economic growth, external balances and fiscal balances of LIDCs, which
have been developed using various econometric estimations (IMF, 2013a).
The impact of a global shock on LIDCs’ economic growth is determined via change in external demand
(assumed to evolve in line with partner countries’ growth) and terms of trade. To assess the impact on
external balances, changes in exports, imports, remittances, and FDI are taken into account. With respect to
the fiscal sphere, the impact on fiscal revenue is estimated as a weighted average of revenue from general
economic activity, assumed to evolve in line with nominal GDP, and revenue from natural resources where
relevant, incorporating country-specific historical elasticities of commodity revenue with respect to
commodity prices. Following a “passive approach,” nominal primary expenditure is assumed to remain
unchanged at the baseline level.
All changes in the current account are assumed to be financed out of reserves, and broadly, a country is
assessed to have an additional external financing need if the post-shock reserve coverage ratio is less than
the minimum adequate level, set uniformly at three months of imports for simplicity. More precisely, for
countries whose pre-shock reserve coverage exceeded three months of imports, the external financing need
is the amount of financing needed to bring the reserve coverage ratio back to three months; and for
countries where pre-shock reserve levels were less than three months of imports, the external financing
need is the amount of financing needed to restore the stock of reserves to its pre-shock level.
-5.0-4.5-4.0-3.5-3.0-2.5-2.0-1.5-1.0-0.50.00.5
GDP growth (in percent)
(LHS)
Cumulative Fiscal
Balance(in percent of GDP)
(LHS)
Commodity Exporter
LIDCs
0
10
20
30
40
50
60
-5.0-4.5-4.0-3.5-3.0-2.5-2.0-1.5-1.0-0.50.0
Cumulative
Financing Gap
(in US dollars
billions)
(RHS)
-5.0-4.5-4.0-3.5-3.0-2.5-2.0-1.5-1.0-0.50.00.5
GDP growth (in percent)
(LHS)
Cumulative Fiscal Balance(in
percent of GDP) (LHS)
Commodity Exporter
LIDCs
0
10
20
30
40
50
60
-5.0-4.5-4.0-3.5-3.0-2.5-2.0-1.5-1.0-0.50.0
Cumulative Financing
Gap
(in US dollars billions)
(RHS)

MACROECONOMIC DEVELOPMENTS AND PROSPECTS IN LIDCS: 2015
30 INTERNATIONAL MONETARY FUND
C. Climate Change: A Growing and Lasting Source of Vulnerability30
44. The process of climate change is expected to exacerbate vulnerabilities and could over
time have a significant adverse impact on many LIDCs. “Climate change” refers here to the
gradual increase in global mean temperature and related developments such as rising sea levels and
increased frequency of extreme weather events. There is a broad scientific consensus that man-
made emissions of greenhouse gases are a key driver of ongoing climate change.31
45. The international community aims to limit the global mean temperature increase to
2°C by containing greenhouse gas emissions, but this goal appears increasingly at risk.32
The
scale of global warming realized over time will depend on the vigor with which countries implement
mitigation measures, in line with commitments made at the UN climate change conference in
December. Absent such intervention, indications are that the global mean temperature increase
could reach 4°C or more by the end of this century—producing a severe change in climate
conditions in many parts of the world.
Physical Impact
46. Proximity to the equator is expected to be associated with greater exposure to the
adverse effects of climate change:
While temperature increases are projected to be smaller closer to the equator, these come on
top of higher baseline temperatures, yielding above-average increases in the frequency and
duration of extreme heat. Under a 2°C warming scenario, the share of the land surface affected
by extreme heat is projected to be 30 percent in the Middle East and North Africa, 30–
40 percent in Latin America/Caribbean, and 45 percent in Sub-Saharan Africa (SSA), as
compared, for example, with 10–15 percent of land in Europe and Central Asia.33
Sea-level rise for countries nearer to the equator will be higher than the global mean—with a
strong impact on small island states and low-lying countries (such as Bangladesh).
Water sustainability. Projected global warming is expected to lead to higher precipitation
variability and increased evapotranspiration in warmer climates: in a 2°C warming scenario,
water runoff is expected to fall by 30–50 percent in SSA and 10–30 percent in Latin America.
47. The projected effects of climate change on Sub-Saharan Africa—the region containing
more than one-half of LIDCs—are severe. Figure 17 highlights seven transmission channels,
30
Parts of this section draw on World Bank 2012, 2013, and 2014.
31 See Intergovernmental Panel on Climate Change (IPCC, 2014), World Bank 2012, 2013, and 2014, and Stern (2008).
32 See IPCC (2014).
33 Land areas subject to extreme heat would more than double under a 4°C global warming scenario.

MACROECONOMIC DEVELOPMENTS AND PROSPECTS IN LIDCS: 2015
INTERNATIONAL MONETARY FUND 31
illustrating i) how impact cumulates over time and ii) the non-linear relationship between mean
global temperature increases and impact, notably on land affected by highly unusual heat.
Figure 17. Impacts in Sub-Saharan African
Source: Based on World Bank (2013), Tables 3.1 and 3.4.
Note: Warming levels are relative to pre-industrial temperatures. The arrows indicate the range of
warming levels assessed in the study. Adaptation measures are not assessed in these tables.

MACROECONOMIC DEVELOPMENTS AND PROSPECTS IN LIDCS: 2015
32 INTERNATIONAL MONETARY FUND
48. LIDCs already experience greater
frequency and severity of natural disasters
than better-off countries. Over the period
2006–15, after controlling for country size, LIDCs
are hit about one and a half times as often by
climate-related disasters (droughts, floods, and
storms combined) than more developed
countries (Figure 18). This frequency is seen as
part of a longer-term trend increase,
notwithstanding some stabilization in recent
years. Droughts in particular appear to affect
LIDCs more frequently than other countries.
Also, the share of the population affected by
natural disasters is substantially higher in LIDCs
than elsewhere.34
49. Cross-country assessments of vulnerability to the effects of climate change indicate
that LIDCs are typically at greater risk than more developed countries. Drawing on the changes
to climate parameters over the next 30 years predicted by the Intergovernmental Panel on Climate
Change, Maplecroft (2015) develops a climate change vulnerability index, reflecting the likely
frequency and intensity of extreme climate-related events and changes in major climate parameters
(Figures 19–20). More than three-quarters of LIDCs are assessed as being either highly or extremely
vulnerable to climate change, compared to some two-fifths of other countries.
Economic and Social Impact
50. Climate change is expected to adversely affect output levels, particularly in LIDCs with
weak institutions and weak infrastructure: an influential study by Dell et al. (2012) concludes that
output in poor countries falls by 1.3 percent relative to baseline for each 1°C rise above the national
mean temperature.35
34
During the period 2006–15, on average 1.5 percent of LIDCs’ populations were affected by natural disasters. The
share of the population affected by climate-related disasters is higher in LIDCs than elsewhere—some two times
higher than in EMs and ten times higher than in AMs, based on data from Emergency Events Data Base. A disaster is
registered if at least one of these conditions is met: (i) 10 or more fatalities; (ii) 100 or more people “affected;” (iii) a
call for international assistance; and (iv) declaration of a state of emergency. People “affected” by a disaster include
those injured, homeless/displaced, or requiring immediate assistance, but exclude fatalities.
35 See Farid et al. (2015), forthcoming, for further discussion and references.
Figure 18. Frequency of Natural Disasters in
LIDCs and the Rest of the World, 1985–2015
(Average Annual Number of Droughts, Floods,
Storms per million square kilometers)
Source: EM-DAT and IMF estimates.
0.0
0.5
1.0
1.5
2.0
2.5
3.0
3.5
1985-95 1996-2005 2006-2015
LIDC
EM
AM

MACROECONOMIC DEVELOPMENTS AND PROSPECTS IN LIDCS: 2015
INTERNATIONAL MONETARY FUND 33
53%
24%
19%
5%
extreme
high
medium
low 20%
23%
29%
29%
Figure 19. Climate Change Exposure Index, 2015
LIDCs (Percent share of countries with
vulnerability)
Rest of the World (Percent share of countries with
vulnerability)
Source: Maplecroft 2015.
Note: The Climate Change Exposure Index evaluates the vulnerability of human populations to the frequency and
intensity of extreme climate events and to changes in baseline climate parameters over the next 30 years.
Figure 20. Climate Change Exposure Index, 2015
Source: Maplecroft 2015.
51. The impact on output and labor productivity in agriculture—the dominant source of
employment in LIDCs—is expected to be particularly marked. Rising temperatures and greater
rainfall volatility, coupled with more frequent droughts, have sizeable adverse effects on agricultural
output and incomes, with the impact being significantly greater in countries where crop land is
typically not irrigated.36
Increased vulnerability of the agricultural sector will inevitably imply
heightened risks to food security.37
36
See Barrios et al. (2008, 2010), Dell and others (2014), Lanzafame (2014), and Garcia-Verdu et al. (forthcoming).
37 Beyond slowing growth, e.g. by lowering agricultural output, climate change-related natural disasters can generate
large costs by destroying infrastructure and other capital stock. There is substantial uncertainty regarding the size of
these costs, however. (The leading Emergency Events Data Base does not account for uninsured losses associated
with recurrent, extensive disasters, particularly in LICs.) This makes it difficult to compare these costs to fiscal buffers.

MACROECONOMIC DEVELOPMENTS AND PROSPECTS IN LIDCS: 2015
34 INTERNATIONAL MONETARY FUND
52. The stresses placed on LIDCs subject to severe climate change will likely translate into
significant migration pressures and heightened risk of conflict.38
Increasing fragility along these
lines can be expected to have a significant adverse impact on medium-term growth (as analyzed in
IMF 2014a, Box 1).
Strengthening LIDCs’ Resilience to Climate Change
53. Containing climate change will require a global effort to limit carbon emissions to
levels consistent with an acceptable increase in mean global temperatures. The COP-21
conference in December seeks to produce agreement on national targets for emissions containment
that collectively achieve this objective, with countries then facing the challenge of implementing
measures sufficient to achieve these targets.
54. LIDCs contribute only marginally to global carbon emissions, but will need to devote
significant resources to building resilience to climate change. Support from the international
community in the form of concessional climate finance will play a key role in helping LIDCs tackle
adaptation challenges without compromising on developmental objectives.
55. National policies to enhance resilience to climate change in LIDCs will need to contain
several components. Key elements include: (i) risk identification and adaptation assessments,
integrated into budget planning; (ii) self insurance, by building fiscal and reserve buffers; (iii) risk
reduction through targeted investments in infrastructure; (iv) risk transfer through multilateral risk-
sharing mechanisms and precautionary instruments; and (v) enhanced disaster management
capacity.39
Support from development partners to build domestic capacity and from multilateral
actions to develop affordable hedging and catastrophe insurance markets will be an essential
ingredient if national efforts to build resilience are to succeed.
CAPITAL INFLOWS AND MACROECONOMIC
IMPLICATIONS
56. This section examines the recent experience of LIDCs with capital inflows and capital
account policies, and analyzes the economic impact of these inflows. Although capital inflows
can mobilize external savings to boost domestic investment, allow for technology transfer and
efficiency gains, and promote financial sector deepening, they can also pose risks when underlying
economic policies are weak; and debt-creating flows are also generally associated with higher
macroeconomic and financial volatility (see for example, IMF 2012, Bluedorn and others, 2013, Rodrik
and Subramanian, 2009).
38
See World Bank (2014).
39 See Cabezon et al. (2015) and Farid et al. (2015), forthcoming, for a full discussion.

MACROECONOMIC DEVELOPMENTS AND PROSPECTS IN LIDCS: 2015
INTERNATIONAL MONETARY FUND 35
57. The section is organized as follow. It starts by presenting stylized facts on the nature of
capital inflows to LIDCs and looks at trends in LIDCs’ policies on capital account liberalization.40
It
then analyzes the impact of capital inflows to LIDCs on domestic demand—investment and
consumption—using case studies to augment the statistical analysis, concluding with some key
policy messages that can be drawn from analysis.
A. The Facts: Trends in Capital Inflows and Capital Account Openness
Level, Composition and Pace
58. Capital inflows to LIDCs increased sharply during the 2000s, reflected in two waves
before and after the global financial crisis.41
In the period preceding the crisis, total capital inflows
rose from some 2 percent of GDP in the early 2000s to 7 percent of GDP in 2007; after a temporary
decline during the crisis, inflows rebounded, reaching 6 percent of GDP in 2012 (Figure 21). Box 4
reviews the measures of capital flows and its composition that are used here.
Figure 21. Capital Flows to LIDCs, 2000–2014
(Percent of GDP, weighted averages)
Sources: World Economic Outlook; International Finance Statistics, and IMF staff estimates.
40
See IMF 2011 and IMF 2013b for an examination of capital flows to sub-Saharan Africa.
41 The sample of LIDCs includes 52 countries (with eight countries excluded due to limited data availability). The
sample of emerging markets (EMs) used in the analysis here includes 38 countries: all emerging market and
developing economies (WEO definition) except a) LIDCs, b) small states (population less than 1.5 million) and c) G-20
member countries, whose capital and financial markets are typically much deeper and more developed than other
EMDEs.
-4
-2
0
2
4
6
8
2000 2001 2002 2003 2004 2005 2006 2007 2008 2009 2010 2011 2012 2013 2014
FDI Portfolio Debt Portfolio Equity Other Non-Official Flows
Total Inflows Total Outflows Net Flows
Post-Crisis WavePre-Crisis Wave

MACROECONOMIC DEVELOPMENTS AND PROSPECTS IN LIDCS: 2015
36 INTERNATIONAL MONETARY FUND
Box 4. Measuring Capital Flows1
This section uses the following concepts of capital flows and its components:
Total capital inflows refer to the net changes in domestic resident liabilities to foreigners (e.g., a positive sign
denoting a net increase in liabilities and a negative sign denoting a net decrease in liabilities). Total capital
outflows refer to the net changes in foreign assets owned by domestic residents.
Net capital flows refer to the difference between total inflows and total outflows. With many LIDCs still
maintaining substantial restrictions on residents’ investments abroad, net capital flows to LIDCs are typically
driven by total inflows—that is, by the activities of non-residents.
The analysis here focuses on the behavior of total capital inflows and the following components: (i) direct
investment; (ii) portfolio investment; (iii) other non-official investment.
(i) Direct investment refers to cross-border investment associated with a resident in one economy having
control (more than 50 percent of the voting power) or a significant degree of influence (10 percent or more
of the voting power) on the management of an enterprise that is resident in another economy. Direct
investment can include both equity and debt investment (for example, inter-company loans).
(ii) Portfolio investment is defined as cross-border transactions and positions involving debt or equity
securities. This category also includes domestically issued securities that are bought by non-residents (e.g.
domestic government bonds).
(iii) Other non-official investment includes bank deposits, corporate and bank loans and trade credit; “non-
official” refers to the recipient. Transactions relating to the government or monetary authority in capital
inflow recipient LIDCs are therefore excluded from this category.2
We use the case of Zambia to
illustrate the concepts above. Total
capital inflows averaged around
8 percent of GDP in 2000–2007 and
almost 9 percent of GDP during
2011–14. FDI accounted for some
70 percent of inflows, mostly
directed to the mining sector (which
accounted for two-thirds of the stock
of FDI at end-2014).
While non-FDI inflows averaged
about 30 percent of total inflows to
Zambia before and after the crisis,
the composition of these inflows has changed over time.
Portfolio debt inflows were close to nil in early 2000s, increasing slightly to 0.5 percent of GDP in the pre-crisis
period of 2004–2007 (mainly foreign investment in the domestic bond market). Post-crisis, these inflows
averaged 2 percent of GDP through 2014, boosted by two Eurobond issuances.
Portfolio equity inflows have been of minimal significance, averaging 0.1 percent of GDP in 2011–12.
Other non-official investment inflows were significant in the pre-global crisis period, accounting for one-
quarter of total inflows, and accounted for about 6 percent of total inflows in 2011–14. The quality of data on
these flows is not high.
_________________ 1
Contributors: Juliana Araujo, Byung Kyoon Jang and Tobias Rasmussen. 2
The definition adopted excludes other investment flows to the official sector (the general government and monetary authorities),
whether or not originating from official or private sources (the underlying data source provides a breakdown by debtor but not by
creditor). There is no distinction between official flows and nonofficial flows for FDI and portfolio flows.
-5
-1
3
7
11
15
2000 2001 2002 2003 2004 2005 2006 2007 2008 2009 2010 2011 2012 2013 2014
FDI Portfolio Equity Portfolio Debt Other Non-official flows Total inflows
Capital Inflows to Zambia

MACROECONOMIC DEVELOPMENTS AND PROSPECTS IN LIDCS: 2015
INTERNATIONAL MONETARY FUND 37
59. The post-crisis wave of inflows to LIDCs has been more broad-based, with sharp
increases across all components of inflows (Figure 22). Unlike the first wave, the second wave was
characterized by a rise in the level of portfolio inflows to LIDCs, with an increase in Eurobond
issuances and domestic debt purchases by non-residents, reflecting both more favorable global
financial conditions and stronger domestic economic conditions (see below). LIDCs typically
experienced a sharper rise in FDI inflows post crisis compared to EMs (Figure 22, Panel 1), owing in
part to the upswing in commodity prices during this period and LIDCs’ higher dependency on
commodity exports.42
In contrast, although portfolio inflows to LIDCs rose in the post-crisis wave,
they still lagged behind EM levels, and while non-official inflows to LIDCs were typically at levels
similar to EMs post crisis (Figure 22, panels 2–3; Araujo and others (2015)).
Figure 22. Capital Inflows to LIDCs Versus EMs
Sources: World Economic Outlook; International Finance Statistics, and IMF staff estimates.
60. Among LIDCs, the uptick in portfolio inflows has been driven by a handful of, mostly
frontier, LIDCs (Figure 23, Panel 1, see also IMF 2013b, 2014c and 2014d). Of the 13 LIDCs that have
42
The correlation between capital inflows (both FDI and non-FDI) to LIDCs in the past two decades and commodity
prices has been around 0.7–0.8.
0
2
4
6
8
EM LIDC EM LIDC EM LIDC
2000-03 2004-07 2011-14
Perc
en
t o
f G
DP
FDI Inflows
50 Percentile
75 Percentile
0
2
4
6
8
EM LIDC EM LIDC EM LIDC
2000-03 2004-07 2011-14
Perc
en
t o
f G
DP
Other Non-official Inflows
50 Percentile
75 Percentile
0
1
2
3
EM LIDC EM LIDC EM LIDC
2000-03 2004-07 2011-14
Perc
en
t o
f G
DP)
Portfolio Inflows
50 Percentile
75 Percentile

MACROECONOMIC DEVELOPMENTS AND PROSPECTS IN LIDCS: 2015
38 INTERNATIONAL MONETARY FUND
issued sovereign bonds since 2005, 10 are frontier economies, with the number of issuances
increasing post-crisis. Examples of recent issuers include Mongolia (with a 2012 issue equivalent to
20 percent of GDP) and Kenya (with a debut issue of more than 3 percent of GDP in 2014). Côte
d’Ivoire, Ethiopia, Ghana, Senegal, Vietnam, and Zambia also issued sovereign bonds in 2014.
Although foreign investor participation in domestic debt markets is confined to a handful of LIDCs, it
has become an important feature in a few countries: for example, in Ghana, non-resident holdings
accounted for about one third of domestic debt in the last five years, in Zambia close to 15 percent
in 2014 (IMF 2015i, 2015g). Other non-official inflows are of growing importance in frontier
economies, while less so in other LIDCs (Figure 23, Panel 2).
Figure 23. Capital Inflows to Frontier Versus Other Non-Frontier LIDCs
Sources: World Economic Outlook; International Finance Statistics, and IMF staff estimates.
61. The rise in other non-official inflows in part reflects the sizeable increase in LIDCs’
cross-border bank exposure vis-à-vis syndicated loans, particularly after the crisis (Figure 24,
left panel). These loans amounted to more than US$73 billion over the period 2000–2014, and were
directed more broadly across all LIDCs (Figure 24, right panel). Most of these loans went to private
sector financial and non-financial enterprises (including public sector enterprises), with some
US$6 billion going directly to governments.43
Private sector loans went primarily to oil and gas,
mining, telecommunications, construction, transportation, and financial service sectors. While
Nigeria, Ghana and Vietnam attracted a large share of these bank loans, in some cases cross-border
bank loans have been significant in relation to GDP—4.6 percent of GDP in Cambodia in 2011,
3 percent of GDP in Mongolia in 2012, and 1.2 percent of GDP in Kenya in 2014.
43
Data on syndicated loans are taken from Dealogic’s Loan Analytics on a loan-by-loan basis. The aggregate figures
reported in the section refer to cross-border lending to the private sector, comprising financial and non-financial
entities, to public entities and to the government (excluding lending by multilateral banks and institutions); see
Cerutti and others (2015) for details. Volumes on syndicated loans are not directly comparable to other non-official
flows (as recorded in the balance of payments), covering only bank lending and new loans. Syndicated loans to
governments have been concentrated in eight LIDCs (for example, Ghana, Kenya, Tanzania, and Vietnam).
0.0
0.2
0.4
0.6
0.8
1.0
1.2
1.4
F-LIDCs Others F-LIDCs Others F-LIDCs Others
2000-03 2004-07 2011-14
Perc
en
t o
f G
DP
Portfolio inflows
50 Percentile
75 Percentile
0
1
2
3
4
F-LIDCs Others F-LIDCs Others F-LIDCs Others
2000-03 2004-07 2011-14
Perc
en
t o
f G
DP
Other Non-official Inflows
50 Percentile
75 Percentile

MACROECONOMIC DEVELOPMENTS AND PROSPECTS IN LIDCS: 2015
INTERNATIONAL MONETARY FUND 39
Figure 24. Syndicated Loans to LIDCs
Sources: Dealogic's Loan Analytics.
Capital Account Policies
62. Capital account policies in LIDCs have not changed significantly in recent years,
except in frontier economies. An index of de jure capital account liberalization44
suggests that,
while LIDCs are typically more closed than EMs, frontier LIDCs have opened their capital accounts at
a faster pace and are now typically as open in de jure terms as EMs, both in terms of overall capital
account openness—see Figure 25, Panel B, where the index ranges from zero (closed) to one (fully
open)—and across most asset classes (Figure 25, Panel A).
63. Among frontier LIDCs, the trend towards more open capital accounts also masks
country-specific differences (Figures 25, Panels C–D). Some countries have long had quite open
capital accounts (Bolivia, Uganda and Zambia); others have remained moderately open over time,
with little net change in the last decade (Kenya, Nigeria); some have remained with almost closed
capital accounts even now (Tanzania, Mozambique). In contrast, Ghana and Papua New Guinea and,
to a lesser extent, Senegal, have made significant changes to their capital account policies over the
past decade. Papua New Guinea completely liberalized almost all asset categories in 2007; Ghana
passed a new Foreign Exchange Act in 2006, allowing non-residents to purchase certain types of
domestic government securities; Senegal undertook liberalization in gradual steps—first eliminating
capital controls on inward FDI and foreign borrowing by residents, and then harmonizing capital
account rules with other WAEMU members in 1999.
44
See Annex II for details.
0
2000
4000
6000
8000
10000
12000
14000
200020012002200320042005200620072008200920102011201220132014
Private sector
Public sector
Government
Syndicated Loans by Sector(Millions of U.S. dollars over the period 2000-2014)
0
20
40
60
80
100
120
BG
DBO
LC
IVC
MR
CO
GD
JIETH
GH
AG
INH
ND
HTI
KEN
KG
ZK
HM
LAO
MD
AM
DG
MLI
MM
RM
NG
MO
ZM
WI
NER
NG
AN
ICN
PL
SEN
SLE
TG
OTZA
UG
AV
NM
YEM
ZA
RZM
B
Private sector
Public sector
Government
Syndicated loans by countries(Number of loans over the priod 2000-2014)

MACROECONOMIC DEVELOPMENTS AND PROSPECTS IN LIDCS: 2015
40 INTERNATIONAL MONETARY FUND
Figure 25. Capital Account Liberalization in LIDCs
0.0
0.2
0.4
0.6
0.8
1.0
2000 2002 2004 2006 2008 2010 2012
LIDC Developing Markets
EMs
Frontier LIDCs
Panel B. Total Capital Account Liberalization Index
(Median)
0.0
0.2
0.4
0.6
0.8
1.0
2000 2002 2004 2006 2008 2010 2012
Ghana
Papua New Guinea
Senegal
Panel C. Total Capital Account Liberalization in
Selected Frontier LIDCs2
HND
KGZ
LBR
NIC
RWA
BGD
BOL
CIV
GHA KEN
MNG
MOZ
NGA
PNG
SEN
TZA
UGA
VNM
ZMB
0.0
0.2
0.4
0.6
0.8
1.0
0.0 0.2 0.4 0.6 0.8 1.0
Ind
ex
(2013)
Index (2000)
Non-Frontier
Frontier
Panel D. Overall Capital Account Liberalization Index,
2000 vs. 20133
y = 4.2648x + 6.3197
R² = 0.053
0
5
10
15
20
25
30
35
0.0 0.2 0.4 0.6 0.8 1.0
To
tal v
alu
e o
f in
flo
ws
and
outf
low
s
(Perc
en o
f G
DP)
Capital Account Liberalization (overall) index
Panel E. De Facto Capital Flows and De Jure Capital
Account Liberalization4
(Inflows and outflows, average 2000-2013)
Sources: Wang-Jahan index, and IMF staff estimates.
Notes:1The range shows the top and bottom quartile for frontier economies. For definitions of the various asset categories, see Annex 1.
Financial market liberalization indicates the average liberalization of equity, bonds, money market, collective investment, and derivatives2 Higher index indicates greater liberalization3 The first available data point was used if the country did not have an index in 2000.4 Total flows is the sum of the absolute value of inflows and the absolute value of outflows, in percentage of GDP.
0.0
0.2
0.4
0.6
0.8
1.0C
ap
ital a
cco
unt
libera
lizatio
n (
To
tal)
Cap
ital i
nflo
ws
ind
ex
Cap
ital o
utf
low
s in
dex
No
n-r
esi
dent
libera
lizatio
n
Resi
dent
libera
lizatio
n
Dir
ect
inve
stm
ent
libera
lizatio
n
Eq
uity
libera
lizatio
n
Bo
nd
lib
era
lizatio
n
Mo
ney
Mark
et
libera
lizatio
n
Co
llect
ive inve
stm
ent
libera
lizatio
n
Deri
vative
lib
era
lizatio
n
Co
mm
erc
ial cr
ed
it
libera
lizatio
n
Financi
al
cred
it
libera
lizatio
n
Guara
nte
e lib
era
lizatio
n
Real e
state
cap
ital
libera
lizatio
n
Pers
onal c
ap
ital
libera
lizatio
n
Liq
uid
atio
n o
f FD
I
Financi
al
Mark
et
Lib
era
lizatio
n
Panel A. Capital Account Openness by Subcategories, 2013 (Median)1
Frontier
(median)
EM (median)
LIDC
Developing
markets
(medians)
Inflows vs. outflows Res. vs. Non-res. Types of Capital flows
Cap
ital
acco
un
t
lib
era
lizati
on
(to
tal)

MACROECONOMIC DEVELOPMENTS AND PROSPECTS IN LIDCS: 2015
INTERNATIONAL MONETARY FUND 41
64. Most non-frontier LIDCs continue to maintain relatively closed capital accounts, with a
few exceptions. Liberia and Nicaragua have been relatively open since the early 2000s, while
Rwanda undertook sweeping liberalization policies across all asset types in the late 2000s. A few
countries have moved in the opposite direction—for example, Honduras and Kyrgyz Republic
introduced capital flow management measures on equity and money markets during the global
financial crisis.
65. There is a very weak association between the scale of capital inflows and de jure
measures of capital account openness (Figure 25, Panel E). This likely reflects the central
importance of foreign direct investment in capital flows to LIDCs—a form of investment that is
typically welcomed in many countries, including among non-frontier LIDCs, with otherwise tightly
controlled capital accounts. Moreover, capital inflows are generally driven by both domestic and
external factors, and more open economies need not attract more capital inflows, particularly if
domestic economic conditions are not attractive for foreign investors (see the next sub-section).
B. Capital Flows, Domestic Demand, and Policy Challenges
66. Having documented the capital
inflow experience in LIDCs, this
subsection assesses to what extent
inflows have supported domestic
demand in LIDCs—focusing on the
relative association between such inflows
and investment and consumption. It ends
with a brief discussion of the policy
challenges relating to inflows that LIDCs
are likely to face in the current global
environment.
67. A statistical analysis for a
sample of 41 LIDCs during 1990–2014
reveals a significant association
between capital inflows and both
consumption and investment (Figure 26).45
A 1 percentage point of GDP increase in capital inflows
is associated with a 0.25 point increase in the investment-to-GDP ratio, which partly reflects the
45
The relationship between gross capital flows (CF) and the different components of domestic demand is estimated
using the following empirical specification:
DEMANDi,t = αDEMANDi,t-1 + βCFi,t + γXi,t + δi + Θt + ei,t
where DEMAND is either investment or consumption as a share of GDP, the vector Xi,t includes a set of standard
control variables (real per capita GDP, GDP growth, the real interest rate and the ratio of credit to the private sector
over GDP), δi are country fixed effects, and Θt are year fixed effects. The coefficient α measures the persistence of
investment and consumption. The results are also robust to including additional control variables, such as the
prevalence of fixed versus flexible exchange rate regime. The effect of capital inflows on investment are also
(continued)
Figure 26. Capital Inflows and Domestic Demand
0.25
0.31
0.06
0.12
0.24
0.10
0.35
0.25
Other Inflows
Portfolio Inflows
FDI Inflows
Capital Inflows
-0.2 -0.1 0 0.1 0.2 0.3 0.4 0.5 0.6
Investment Consumption
Source: IMF staff estimates.
Note: The chart plots the estimated coefficients and the associated 90% confidence intervals, of
a set of regressions in which the dependent variable is, alternatively, investment and
consumption (as a share of GDP) and the set of control variables include: the four capital flows
variable (as a share of GDP, included one at the time), the lagged value of the dependent
variable, the log of real per capita GDP, real GDP growth, the domestic real interest rate, the
ratio of credit to the private sector over GDP and year and country fixed effects.
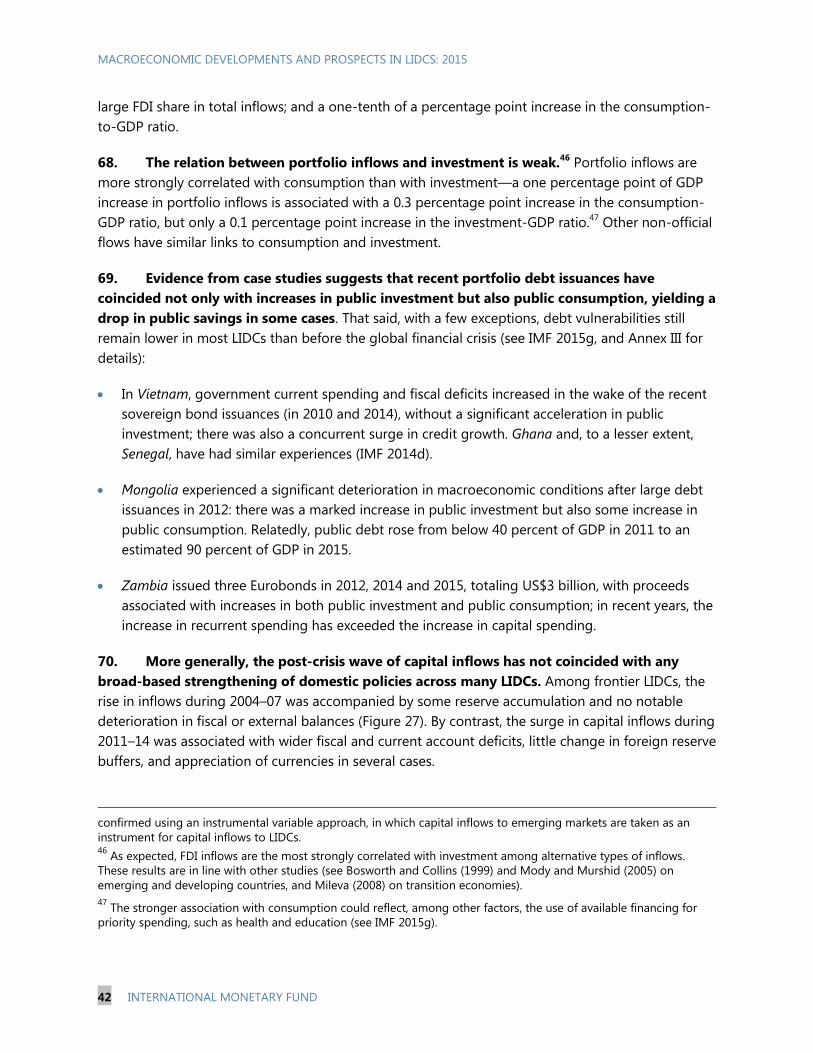
MACROECONOMIC DEVELOPMENTS AND PROSPECTS IN LIDCS: 2015
42 INTERNATIONAL MONETARY FUND
large FDI share in total inflows; and a one-tenth of a percentage point increase in the consumption-
to-GDP ratio.
68. The relation between portfolio inflows and investment is weak.46
Portfolio inflows are
more strongly correlated with consumption than with investment—a one percentage point of GDP
increase in portfolio inflows is associated with a 0.3 percentage point increase in the consumption-
GDP ratio, but only a 0.1 percentage point increase in the investment-GDP ratio.47
Other non-official
flows have similar links to consumption and investment.
69. Evidence from case studies suggests that recent portfolio debt issuances have
coincided not only with increases in public investment but also public consumption, yielding a
drop in public savings in some cases. That said, with a few exceptions, debt vulnerabilities still
remain lower in most LIDCs than before the global financial crisis (see IMF 2015g, and Annex III for
details):
In Vietnam, government current spending and fiscal deficits increased in the wake of the recent
sovereign bond issuances (in 2010 and 2014), without a significant acceleration in public
investment; there was also a concurrent surge in credit growth. Ghana and, to a lesser extent,
Senegal, have had similar experiences (IMF 2014d).
Mongolia experienced a significant deterioration in macroeconomic conditions after large debt
issuances in 2012: there was a marked increase in public investment but also some increase in
public consumption. Relatedly, public debt rose from below 40 percent of GDP in 2011 to an
estimated 90 percent of GDP in 2015.
Zambia issued three Eurobonds in 2012, 2014 and 2015, totaling US$3 billion, with proceeds
associated with increases in both public investment and public consumption; in recent years, the
increase in recurrent spending has exceeded the increase in capital spending.
70. More generally, the post-crisis wave of capital inflows has not coincided with any
broad-based strengthening of domestic policies across many LIDCs. Among frontier LIDCs, the
rise in inflows during 2004–07 was accompanied by some reserve accumulation and no notable
deterioration in fiscal or external balances (Figure 27). By contrast, the surge in capital inflows during
2011–14 was associated with wider fiscal and current account deficits, little change in foreign reserve
buffers, and appreciation of currencies in several cases.
confirmed using an instrumental variable approach, in which capital inflows to emerging markets are taken as an
instrument for capital inflows to LIDCs. 46
As expected, FDI inflows are the most strongly correlated with investment among alternative types of inflows.
These results are in line with other studies (see Bosworth and Collins (1999) and Mody and Murshid (2005) on
emerging and developing countries, and Mileva (2008) on transition economies).
47 The stronger association with consumption could reflect, among other factors, the use of available financing for
priority spending, such as health and education (see IMF 2015g).

MACROECONOMIC DEVELOPMENTS AND PROSPECTS IN LIDCS: 2015
INTERNATIONAL MONETARY FUND 43
71. The implications for capital flows to LIDCs of a general cutback of flows to emerging
market and developing economies (EMDEs) will very much depend on country circumstances:
The ability of LIDCs to successfully issue sovereign bonds over the past several years has been
associated with both external factors—for example, lower global interest rates and lower global
financial volatility—but also domestic income levels and macroeconomic conditions (see
Presbitero and others, forthcoming; IMF 2015g).
The pricing of new external funding for LIDCs is also influenced by both international and
domestic factors. An analysis of push and pull factors driving sovereign bond yields in LIDC and
EMs confirms the role of both external factors and the quality of domestic macroeconomic
policies in influencing yields (Box 5): higher yields are significantly correlated with higher current
account and fiscal deficits, elevated public debt levels, and lower foreign reserve levels.
Combining these two perspectives, a wider cutback of capital flows to EMDEs is unlikely to
sharply squeeze access to funding for all LIDCs. Countries with stronger domestic fundamentals
may experience some upward movement in funding costs on bond issues and, potentially, on
project funding costs. Countries with weaker domestic fundamentals could see much sharper
movements in external funding costs (as seen in Section I), potentially requiring significant re-
calibration of fiscal policies and investment plans.
72. Policy messages from the preceding discussion include:
Linkage of sovereign bond issues to boosting public investment does not imply that funds raised are
used to boost public investment on a one-to-one basis. Given fungibility of general budgetary
resources, bond issues can instead contribute to a rise in public consumption (and a fall in public
savings) alongside higher public investment—with the former effect having the potential to
dominate the latter. A wider assessment of national borrowing and spending plans is needed to
form a view on the merits of specific issuance plans.48
Domestic fundamentals play a key role in determining both the access to and pricing of external
funding. This has a benign implication: LIDCs with solid macroeconomic and institutional
fundamentals and political stability can augment domestic savings with external funds at
manageable financing costs. But there is also a less benign corollary: slippages in domestic
macroeconomic management and/or serious political shocks can produce a sharp deterioration
in both access to, and pricing of, external funding, yielding a potentially significant adverse shock
to fiscal and external positions and to debt dynamics.
The discussion here has not examined the wider policy challenges surrounding the management of
non-FDI inflows into LIDCs, including the appropriate pace and sequencing of capital account
liberalization. The general issues involved, focused on emerging market economies, are looked at
in detail in IMF 2012 and various related papers, including Ostry (2011) and IMF (2015j).
48
This is the view underpinning the Fund’s approach to assessing borrowing plans in the context of the new Debt
Limits Policy (DLP, see IMF 2014e).

MACROECONOMIC DEVELOPMENTS AND PROSPECTS IN LIDCS: 2015
44 INTERNATIONAL MONETARY FUND
Figure 27. Evolution of Macroeconomic Aggregates in Frontier LIDCs, 2000–14
(Changes in percent)
Sources: World Economic Outlook; International Finance Statistics, and IMF staff estimates.
Notes: First column corresponds to the difference between the 2004–2007 and 2000–2003 period averages;
second column corresponds to the difference between the 2011–2014 and 2007–2010 period averages.
-30
-20
-10
0
10
20
Ban
gla
desh
Bo
livia
Cô
te d
'Ivo
ire
Gh
an
a
Ken
ya
Mo
ng
olia
Mo
zam
biq
ue
Nig
eri
a
PN
G
Sen
eg
al
Tan
zan
ia
Ug
an
da
Vie
tnam
Zam
bia
Fro
nti
er
Ave.
2004-2007/2000-2003
2011-2014/2007-2010
Changes in the Current Account to GDP
-8
-4
0
4
8
Ban
gla
desh
Bo
livia
Cô
te d
'Ivo
ire
Gh
an
a
Ken
ya
Mo
ng
olia
Mo
zam
biq
ue
Nig
eri
a
PN
G
Sen
eg
al
Tan
zan
ia
Ug
an
da
Vie
tnam
Zam
bia
Fro
nti
er
Ave.
2004-2007/2000-2003
2011-2014/2007-2010
Changes in the Fiscal Balance to GDP
-40
-30
-20
-10
0
10
20
30
40
Ban
gla
desh
Bo
livia
Cô
te d
'Ivo
ire
Gh
an
a
Ken
ya
Mo
ng
olia
Mo
zam
biq
ue
Nig
eri
a
PN
G
Sen
eg
al
Tan
zan
ia
Ug
an
da
Vie
tnam
Zam
bia
Fro
nti
er
Ave.
2004-2007/2000-2003
2011-2014/2007-2010
Changes in the REER
-8
-4
0
4
8
12
Ban
gla
desh
Bo
livia
Cô
te d
'Ivo
ire
Gh
an
a
Ken
ya
Mo
ng
olia
Mo
zam
biq
ue
Nig
eri
a
PN
G
Sen
eg
al
Tan
zan
ia
Ug
an
da
Vie
tnam
Zam
bia
Fro
nti
er
Ave.
2004-2007/2000-2003
2011-2014/2007-2010
Changes in Reserves to GDP
-6
-4
-2
0
2
4
6
Bang
lad
esh
Bo
livi
a
Cô
te d
'Ivo
ire
Ghana
Kenya
Mo
ng
olia
Mo
zam
biq
ue
Nig
eri
a
PN
G
Seneg
al
Tanza
nia
Ug
and
a
Vie
tnam
Zam
bia
Fro
nti
er A
ve.
2004-2007/2000-2003
2011-2014/2007-2010
Changes in Public Consumption to GDP
-6
-4
-2
0
2
4
6
8
Bang
lad
esh
Bo
livi
a
Cô
te d
'Ivo
ire
Ghana
Kenya
Mo
ng
olia
Mo
zam
biq
ue
Nig
eri
a
PN
G
Seneg
al
Tanza
nia
Ug
and
a
Vie
tnam
Zam
bia
Fro
nti
er A
ve.
2004-2007/2000-2003
2011-2014/2007-2010
Changes in Public Investment to GDP

MACROECONOMIC DEVELOPMENTS AND PROSPECTS IN LIDCS: 2015
INTERNATIONAL MONETARY FUND 45
Box 5. Determinants of LIDC Sovereign Spreads—Push Versus Pull Factors1
We examine here the determinants of international bonds spreads for a sample of LIDCs and the relative
importance of global versus domestic factors. The analysis is based on a panel study of 57 frontier and
middle-income countries over 2009–15. The estimated specification is as follows:2
refers to the J.P. Morgan EMBIG spread, is a country-specific dummy, while is a period dummy.
Among the global marker variables, is the VIX index of volatility, is the U.S. term premium
approximated by the difference between the 10-year and the three-month yield, refers to the
three-month Libor-OIS (overnight indexed swap) spread and is the change in the price of Brent.
The vector of macroeconomic fundamental variables includes the lagged values of real GDP per capita
levels, international reserves, primary balance, public debt, the current account, a dummy for oil exporters
and its interaction term with oil-price shocks.,
The standardized coefficients of most determinants are
presented in Figure 1. The results suggest that, among
global factors, higher global risk aversion (VIX index), higher
funding costs and the U.S. term premium are positively
associated with spreads, while oil prices, possibly reflecting
the impact of stronger global demand conditions, are
negatively correlated. As expected, stronger country-specific
macroeconomic fundamentals are associated with lower
sovereign spreads—beyond GDP per capita, country spreads
are most sensitive to changes in reserves and the public
debt-to-GDP ratio. In an alternative specification, it is shown
that an increase in oil prices is associated with lower
sovereign spreads for both oil exporters and importers (the latter
possibly reflecting the fact that non-oil commodity prices and global
liquidity levels have tended to move with oil prices in recent years), but
the effects are twice as strong for oil exporters.
Using these estimates, we compare fitted and actual spreads for a
number of LIDCs to analyze if their market bond prices are in line with
“fundamentals”. The first panel of Figure 2 presents this comparison
for sovereign spreads in 2014, the second panel for July 2015.
Misalignments are generally small, confirming that LIDCs’ spreads tend
to respond to both global and domestic economic and financial
conditions. The exceptions are Ghana in 2014, and Ghana,
Mozambique and Zambia in 2015, which experienced higher than
predicted spreads, possibly reflecting greater than usual investor
concerns.
1 The box was prepared by Emmanouil Kitsios and Francisco Roch.
2 For details on the estimation methodology and results see IMF (2015k).
-0.3
-0.2
-0.1
0.0
0.1
0.2
0.3
VIX U.S. term
premium
LIBOR-
OIS
Current
account
balance
Reserves Gross
public
debt
Inflation Primary
balance
Sources: Bloomberg, L.P.; and IMF staff calculations.
Note: LIBOR-OIS = the three-month London interbank offered
rate-overnight index swap; VIX = Chicago Board Options Exchnage
Volatility Index.
Standardized Coefficients of the Determinants
of Sovereign Spreads
Sources: Bloomberg, L.P.; and IMF staff calculations.
Note: Actual and predicted spreads are average
values for the periods to which they refer. Lines
denote the distance from the minimum and
maximum.
Sovereign Spreads
0
100
200
300
400
500
600
700
800
900
Cô
te d
'Ivo
ire
Gab
on
Ghana
Kenya
Mo
zam
biq
ue
Nam
ibia
Nig
eri
a
Seneg
al
So
uth
Afr
ica
Tanza
nia
Zam
bia
Predicted
Maximum
2014
0
200
400
600
800
1000
1200
Côt
e d'
Ivoi
re
Gab
on
Gha
na
Ken
ya
Moz
ambi
que
Nam
ibia
Nig
eria
Sen
egal
Sou
th A
fric
a
Tan
zani
a
Zam
bia
Jul-2015 Predicted
Actual

MACROECONOMIC DEVELOPMENTS AND PROSPECTS IN LIDCS: 2015
46 INTERNATIONAL MONETARY FUND
Annex I. LIDCs and Subgroups
Frontier Markets (14) Fragile States (28) Developing Markets (19)
Commodity
Exporters
(27)
Bolivia
Mongolia
Mozambique
Nigeria
Papua New Guinea
Zambia
(6)
Afghanistan
Burundi
Central African Rep.
Chad
Congo, Dem. Rep.
Congo, Rep.
Eritrea
Guinea
Guinea-Bissau
Malawi
Mali
Sierra Leone
Solomon Islands
South Sudan
Sudan
Yemen, Rep.
Zimbabwe
(17)
Burkina Faso
Mauritania
Niger
Uzbekistan
(4)
Diversified
Exporters
(33)
Bangladesh
Cote d’Ivoire1
Ghana
Kenya
Senegal
Tanzania
Uganda
Vietnam
(8)
Comoros
Cote d’Ivoire1
Djibouti
Haiti
Kiribati
Liberia
Madagascar
Myanmar
Sao Tome and Principe
Somalia
Togo
(11)
Benin
Bhutan
Cambodia
Cameroon
Ethiopia
Gambia, The
Honduras
Kyrgyz Republic
Lao PDR
Lesotho
Moldova
Nepal
Nicaragua
Rwanda
Tajikistan
(15)
Note: see IMF (2014a) for the details of the classification. The number of countries are shown in the parentheses.
1 Cote d’Ivoire is included in both the “frontier market” and “fragile state” groups.

MACROECONOMIC DEVELOPMENTS AND PROSPECTS IN LIDCS: 2015
INTERNATIONAL MONETARY FUND 47
Annex II. Capital Account Liberalization: De Jure Index
The Wang-Jahan index of capital account liberalization index is based on openness policies on
12 categories of the capital account. For each category a value of 0 (closed) or 1 (open) is assigned
based on a country’s de jure policy on capital inflows or outflows, and the overall index is a simple
average of the capital inflows and capital outflows index. The various categories include:
1. Equity. Transactions involving shares and other securities of a participating nature, excluding
those investments for the purpose of acquiring a lasting economic interest which are addressed
as a foreign direct investment.
2. Bond. Bonds or other debt securities with an original maturity of more than one year. The term
other debt securities includes notes and debentures.
3. Money market. Securities with an original maturity of one year or less, including short-term
instruments like certificates of deposits and bills of exchange, among others.
4. Collective Investment. Share certificates and registry entries or other evidence of investor in an
institution for collective investment such as mutual funds and investment trusts.
5. Derivatives and other instruments. Operations in rights, warrants, financial options and
futures, secondary market operations in other financial claims (including sovereign loans,
receivables, and discounted bills of trade), forward operations, swaps of bonds and other debt
securities, and operations in foreign exchange without any other underlying transaction (spot or
forward trading on the foreign exchange markets, forward cover operations).
6. Commercial Credit. Operations directly linked with international trade transactions or with the
rendering of international services.
7. Financial Credit. Credits other than commercial credits granted by all residents, including banks
to nonresidents or vice versa.
8. Direct Investment. Investments for the purpose of establishing lasting economic relations both
abroad by residents and domestically by non residents (for example, for the purpose of
producing goods and services, and, to allow investor participation in the management of an
enterprise).
9. Direct Investment Liquidation. The transfer of principal, including the initial capital and capital
gains of a foreign direct investment as defined above.
10. Guarantees. Guarantees, sureties, and financial backup facilities provided by residents to
nonresidents and vice versa. It also includes securities pledged for payment or performance of a
contract—such as warrants, performance bonds, and standby letters of credit—and financial
backup facilities that are credit facilities used as a guarantee for independent financial
operations.
11. Real Estate. The acquisition of real estate not associated with direct investment, including, for
example investment of a purely financial nature in real estate or the acquisition of real estate for
personal use.
12. Personal capital transaction. Transfers initiated on behalf of private persons and intended to
benefit other private persons. It includes transactions involving property to which the promise of
a return to the owner with payments of interest is attached (e.g., loans or settlements of debt in
their country of origin by immigrants) and transfers effected free of charge to the beneficiary
(for example, gifts and endowments, loans, inheritances and legacies, and emigrants' assets).

MACROECONOMIC DEVELOPMENTS AND PROSPECTS IN LIDCS: 2015
48 INTERNATIONAL MONETARY FUND
Annex III. Experience with Capital Inflows in Selected
Countries1
Vietnam. FDI flows have dominated net external capital flows since the 1990s. Most of the FDI flows
traditionally came from the neighboring region
and targeted the manufacturing sector, textile
and clothing sectors at first and most recently
electronics assembly. However, non-FDI
inflows have also picked up, particularly in
2007–08, when Vietnam joined the World
Trade Organization, but also in recent years—
as authorities increased borrowing from
international capital markets in 2010 and 2014.
The issuance of Eurobonds has coincided with periods of relatively large budget deficits without a
significant acceleration in public investment. In fact, public investment to GDP ratio has declined
since the bond issuance in 2010. Non-FDI flows have also posed significant challenges in terms of a
large pick up in credit growth. This coupled with weak regulatory controls, particularly in the stock
market, compounded a credit boom in the second half of 2000s. The authorities implemented some
early measures before the financial crisis to tighten stock market regulation and supervision and
limit risks for the banking system but they were not sufficient. The economic situation deteriorated
sharply in 2008 weighted further down by the global financial crisis. Capital flows contributed to a
second credit boom which briefly boosted growth until the bursting of the real estate bubble in
2011. Subsequently, credit growth has been relatively muted, until a recent acceleration since mid-
2015.
1 Prepared by Dafina Glaser, Sarwat Jahan, Klaus Hellwig, Byung Kyoon Jang, Koshy Mathai, Svitlana Maslova, Tobias
Rasmussen, and Jiangyan Yu.
0
1
2
3
4
5
6
7
8
9
0
10
20
30
40
50
60
2002 2003 2004 2005 2006 2007 2008 2009 2010 2011 2012 2013 2014
Fis
cal d
efi
cit
(%G
DP
)
Cre
dit
gro
wth
(p
erc
en
t, y
/y)
Credit Growth and Fiscal Deficit
Credit growth (percent, y/y) Fiscal deficit (% of GDP, RHS)
Sources: IMF staff estimates.
Note: The vertical lines indicate Eurobond issuances in Vietnam (2005, 1.3% of GDP;
2010, 0.9% of GDP and 2014, 0.5% of GDP).
6
7
8
9
10
11
12
13
5.3
5.5
5.7
5.9
6.1
6.3
6.5
2002 2003 2004 2005 2006 2007 2008 2009 2010 2011 2012 2013 2014
Pu
blic
invest
men
t (%
GD
P)
Go
vern
men
t C
on
sum
pti
on
(%
GD
P)
Government Consumption and Public Investment
Government consumption (% GDP) Public investment (% GDP)
Sources: IMF staff estimates.
Notes: the event study is based on the issuances in Vietnam (2005, 1.3% of GDP;
2010, 0.9% of GDP and 2014, 0.5% of GDP).
Vietnam: Consumption, Investment, Credit Growth, and Fiscal Deficit
0
5
10
15
20
25
1992 1996 2000 2004 2008 2012
Vietnam: Net Capital Flows(Percent of GDP)
Other Flows
Portfolio Flows
FDI
Sources: IMF staff estimates.

MACROECONOMIC DEVELOPMENTS AND PROSPECTS IN LIDCS: 2015
INTERNATIONAL MONETARY FUND 49
Zambia. Foreign direct investment and, since 2012,
portfolio flows via Eurobond issuances have been the
main sources of capital inflows to Zambia. Grants and
official lending have declined over time, although there
have been some increases in official lending since 2011,
mainly due to increased disbursements from China.
Other capital flows such as private equity inflows and
commercial banks’ foreign borrowing have been
relatively minor, the latter particularly in recent years.
There have been no capital controls, and measures
regulating portfolio investments or banks’ cross-border
funding were abolished in the 1990s.
FDI has been a key driver of Zambia’s mining industry, enabling a tripling of copper production and
laying the foundation for a broader economic rebound. The surge in FDI, along with a pickup in
domestic private investment, helped keep overall investment levels high at close to 30 percent of
GDP despite a reduction in donor-financed capital spending.
Although proceeds from Zambia’s entry on the Eurobond market were earmarked for specific
investment projects, mainly in transport and energy they have also been associated with higher
public consumption. In recent years, government’s spending on recurrent items has increased more
than its capital spending, among others as a result of an almost 45 percent average increase in civil
servants wages in late 2013. With revenue only increasing slightly, higher overall expenditure has led
to a widening deficit.
-500
0
500
1,000
1,500
2,000
2,500
3,000
2000 2002 2004 2006 2008 2010 2012 2014
Direct investment, net
Portfolio investment, net
Equity and investment fund shares
Official disbursements
Zambia: Capital Inflows (Millions of U.S. dollars)
Sources: WEO; IFS; and IMF staff estimates.
0
100
200
300
400
500
600
700
800
900
0
500
1,000
1,500
2,000
2,500
3,000
2000 2002 2004 2006 2008 2010 2012 2014
Direct Investment, net (left axis)
Copper Production (right axis)
Zambia: FDI and Copper Production (Millions of U.S. dollars, and metric tons)
Sources: WEO; IFS; country authorities, and IMF staff estimates.
0
2
4
6
8
2007 2008 2009 2010 2011 2012 2013 2014 2015
Eurobond proceeds
Government deficit
Zambia: Government Deficit and Eurobond Procceds(Percent of GDP)
proj.

MACROECONOMIC DEVELOPMENTS AND PROSPECTS IN LIDCS: 2015
50 INTERNATIONAL MONETARY FUND
Ethiopia. Capital inflows are dominated
by public sector borrowing, of which an
increasing share is by state-owned
enterprises (SOE). However, FDI has been
playing a growing role in financing
investment, particularly in
manufacturing, agriculture and real
estate. In December 2014, the
government issued its first Eurobond,
raising US$1 billion. Beyond the
Eurobond, portfolio investment has been absent due to the government’s tight control over the
capital account (the country has no stock market and foreigners are not allowed to purchase
domestic financial instruments).
Capital inflows have been associated with sharp increases in public investment. Indeed, the share of
capital spending in central government expenditure increased from 51 percent in 2008/09 to an
average of 57 percent between 2010 and 2015. Foreign borrowing has also been instrumental in
financing SOE investment. The share of capital goods in imports increased from 32 percent in 2009
to 42 percent in 2015 while that of consumer goods decreased from 31 percent to 27 percent. The
Eurobond proceeds are intended to finance imports related to export-oriented projects such as
investments in the power transmission infrastructure, sugar factories, and the development of
industrial parks. As the proceeds are only being used gradually to finance such imports (with less
than half used by mid-2015), there has been a temporary buildup in foreign exchange reserves (with
the excess amounting to US$ 450 million in June 2015, or 15 percent higher than before the
Eurobond was issued).
However, the growing amount of non-concessional borrowing has increased Ethiopia’s external
vulnerability. With agricultural commodity
exports as its main source of foreign
exchange, the country is highly exposed to
terms of trade shocks. Ethiopia’s low
export base overall (as a share of GDP) also
presents repayment risks. As a result,
Ethiopia’s risk of external debt distress is
assessed as “moderate.” And with an
external debt level of 26 percent of GDP, a
growing share of which is non-
concessional, additional borrowing may be
less readily available once global credit conditions begin to tighten.
Mongolia. Capital inflows to Mongolia are dominated by FDI, which is highly correlated with global
commodity prices given its large commodity endowment. However, in 2012, against the backdrop of
a period of abundant global liquidity, Mongolia successfully issued more than 20 percent of GDP of
0
2
4
6
8
10
12
14
2005 2006 2007 2008 2009 2010 2011 2012 2013 2014 2015
Ethiopia: Sources of External Financing (Flows, percent of GDP)
FDI
SOE Disbursements
Government Disbursements (offical loans)
Eurobond
0
2000
4000
6000
8000
10000
12000
14000
16000
18000
2007/08 2008/09 2009/10 2010/11 2011/12 2012/13 2013/14 End-Dec
2014
Sources: Country authorities; and IMF staff estimates.
Ethiopia: Public Sector External Debt Outstanding (By concessionality, millions of U.S. dollars)
TOTAL (Concessional)
TOTAL (Non-concessional)

MACROECONOMIC DEVELOPMENTS AND PROSPECTS IN LIDCS: 2015
INTERNATIONAL MONETARY FUND 51
public debt in its debut issuance (sovereign bonds of US$1.5 billion and quasi-sovereign bonds of
US$0.6 billion at the global markets). Meanwhile, public debt increased from below 40 percent of
GDP in 2011 to a projected 90 percent of GDP in 2015. Moreover, some private entities, notably the
Trade and Development Bank (TDB) and Mongolia Ming Corporation (MMC), also took this
opportunity to issue Eurobonds.
Although proceeds from Mongolia’s bonds were earmarked for specific investment projects, they
were also associated with a sharp increase in government consumption expenditure. The overall
fiscal deficit rose to 9.1 percent of GDP in 2012 (5 percent of GDP higher than in 2011) in part due to
an increase in on-budget expenditures by 20 percent, driven by large increases in civil servants’
wages. Off-budget spending by the government-owned Development Bank of Mongolia (DBM) also
increased as proceeds from the sovereign and quasi-sovereign bonds was used to finance public
investment in roads as well as the loss-making state-owned coal producer. In fact, total government
spending substantially increased in 2013 due to the increase in DBM’s spending. The sovereign
bond proceeds helped to raise reserves to a record high at end-2012. But, reserves subsequently fell
as a result of persistent sales of foreign exchange in the spot and forward market in response to
downward pressures on the currency.
Economic and financial conditions have deteriorated dramatically since the sovereign placement in
2012. With FDI and commodity prices sharply down in a loose macro policy environment, Mongolia
has undergone an exchange rate depreciation of over 40 percent and lost more than 70 percent of
its gross reserves. Mongolia’s sovereign spread has risen to around 600 basis points, from just above
400 basis points at the time of issuance, and is now one of the highest in the group of frontier
economies. Rating agencies have recently changed Mongolia’s outlook from “stable” to “negative,”
and the authorities suspended their ambitious plan to raise US$5 billion via sovereign bond
issuance. To fill the financing gap, Mongolia increasingly relies on external borrowing by the quasi-
fiscal entity (i.e. the DBM) as well as drawing down the swap line with foreign central banks.
-10
0
10
20
30
40
50
60
70
2005 2006 2007 2008 2009 2010 2011 2012 2013 2014
Perc
en
t o
f G
DP
Capital Flows, 2005–2014(Percent of GDP)
FDI
Portfolio Equity
Portfolio Debt
Other Non-Official Flows
0
500
1000
1500
2000
2500
3000
3500
4000
4500
Jan-11 Jul-11 Jan-12 Jul-12 Jan-13 Jul-13 Jan-14 Jul-14 Jan-15 Jul-15
International Reserves, 2011–2015(Millions of U.S. dollars)
Mongolia: Capital Flows and International Reserves

MACROECONOMIC DEVELOPMENTS AND PROSPECTS IN LIDCS: 2015
52 INTERNATIONAL MONETARY FUND
Appendix I. The Role of Macroeconomic and Structural
Factors in Vulnerability
A new approach to understanding sources of vulnerability. The GDVI explains vulnerability to
shocks as originating in either the fiscal, external, or real sectors. It aggregates information from
vulnerability indicators, both in a short-term macroeconomic perspective, such as fiscal balances,
and in a longer-term structural one, such as income inequality and institutional capacity.1
To better identify the contribution of slow-moving structural characteristics to vulnerability,
staff developed an extended GDVI by enriching the set of structural variables. The added
structural factors are: (i) key governance variables—measures of voice and accountability, control of
corruption, government effectiveness, political/security stability, regulatory quality, and rule of law;
(ii) a measure of economic liberalization (the Heritage Foundation’s “Economic Freedom Index”); and
(iii) a composite risk rating, drawn from the International Country Risk Guide of the PRS Group. Use
of this richer set of measures of institutional capacity and political stability/security moderately
improves the model’s overall predictive accuracy.2
The extended GDVI decomposes sources of vulnerability into macroeconomic and structural
factors. A macroeconomic vulnerability index aggregates information from all variables in the GDVI
except for the Gini coefficient of income inequality and instutional capacity.3 And a structural
vulnerability index summarizes information from the Gini coefficient, institutional capacity and all
new structural variables.
Plotting the macroeconomic and structural indices
provides an intuitive representation of vulnerabilities.
The figure to the right shows the index of structural
vulnerability on the horizontal axis and the index of
macroeconomic vulnerability on the vertical axis. Bubble
size is proportional to overall vulnerability. Depicting the
evolution of vulnerabilities over 2009–15, the figure
suggests that (i) vulnerabilities have generally grown in
recent years; (ii) lower structural vulnerability is associated
with less macroeconomic vulnerability; (iii) vulnerability
from structural sources is highest in fragile states and
lowest in frontier markets; and (iv) as would be expected,
structural factors move more slowly than macroeconomic factors.
1 The GDVI is based on the estimation of threshold values for the vulnerability indicators, above or below which one
could identify a signal of increased vulnerability to crisis (e.g. low reserve coverage would raise a flag), and aggregating signals based on their explanatory power (see IMF 2011).
2 The methodological innovations presented here are exploratory in nature and have not been used in this report’s e
main text. Staff also developed an alternative estimation framework to analyze the non-linear interactions between macroeconomic conditions and institutional quality. However, the gains in accuracy from considering these interactions were found to be limited, and the approach was not pursued further. 3 These variables are: real GDP growth, real GDP per capita growth, reserve coverage, real export growth, an
exchange market pressure index, change in export prices, fiscal balance as a share of GDP, public debt as a share of GDP, fiscal revenue as a share of GDP, and real growth in government revenue.
2009
2011
2013
2015
2009
2011
2013
2015
2009
20112013
2015
Direction of increased vulnerability
Fragile
Other developing
Frontier
.25
.3.3
5.4
.45
Ma
cro
econ
om
ic v
uln
era
bili
ty in
de
x
0 .2 .4 .6Institutional vulnerability index
Evolution of Vulnerability in LIDCs, 2009-15

MACROECONOMIC DEVELOPMENTS AND PROSPECTS IN LIDCS: 2015
INTERNATIONAL MONETARY FUND 53
References
Adedeji, Olumuyiwa, Jana Gieck, and Vera Kehayova, forthcoming, “Food Shortages in Low-Income
Countries: Macroeconomic Dimensions,” Working Paper, Washington, International
Monetary Fund.
Arezki, Rabah, and Akito Matsumoto, 2015, “Commodity Market Developments and Forecast, with a
Focus on Metals in the World Economy,” World Economic Outlook, World Economic and
Financial Survey, October, Washington, International Monetary Fund.
Araujo, Juliana., A. C. David, C. van Hombeeck, and C. Papageorgiou, 2015, “Capital Flows in Low-
Income Developing Countries: Catching the Wave?,” Working Paper No. 15/86, Washington,
International Monetary Fund.
Baldwin, Richard, 2011, “Trade and Industrialisation After Globalisation's 2nd Unbundling: How
Building and Joining A Supply Chain Are Different And Why It Matters,” NBER Working Paper
No. 17716, December, Massachusetts.
Barrios, S., Bertinelli, L., and Strobl, E., 2008, “The Impact of Climatic Change on Agricultural
Production: Is It Different for Africa?” Food Policy, Vol. 33, 287–298.
_______, 2010, “Trends in Rainfall and Economic Growth in Africa” A Neglected Cause of the African
Growth Tragedy,” The Review of Economic and Statistics, Vol. 32, No. 2, pp. 350–366.
Bluedorn, John C., Rupa Duttagupta, Jaime Guajardo, and Petia Topalova, 2013, “Capital Flows are
Fickle: Anytime, Anywhere,” Working Paper 13/183, Washington, International Monetary
Fund.
Bosworth, Barry B., and Susan M. Collins, 1999, “Capital Flows to Developing Economies: Implications
for Saving and Investment,” Brookings Papers on Economic Activity, Vol. 30, pp. 143–180.
Cabezon, E., Hunter, L., Tumbarello, P., Washimi, K., and Wu, Y., 2015, “Enhancing Macroeconomic
Resilience to Natural Disasters and Climate Change in the Small States of the Pacific,”
Working Paper 15/125, Washington, International Monetary Fund.
Cerutti, Eugenio, Galina Hale, and Camelia Minoiu, 2015, “Financial Crises and the Composition of
Cross-Border Lending,” Journal of International Money and Finance, Vol. 52, pp. 60–81.
Center for Research on the Epidemiology of Disasters (CRED), Emergency Events Data Base (EM-
DAT).
Dell, M., Jones, B., and Olken, B., 2014, “What Do We learn from the Weather? The New Climate-
Economic Literature,” Journal of Economic Literature, Vol. 52, No. 3, pp. 740–798.

MACROECONOMIC DEVELOPMENTS AND PROSPECTS IN LIDCS: 2015
54 INTERNATIONAL MONETARY FUND
_______, 2012, “Temperature Shocks and Economic Growth: evidence from the Last Half Century,”
American Economic Journal: Macroeconomics,” Vol. 4, No. 3, pp. 66–95.
Farid, Mai, Mick Keen, Michael Papaioannou, Ian Parry, Catherine Pattillo, Anna Ter-Martirosyan,
forthcoming, “Fiscal, Macroeconomic and Financial Aspects of Global Warming,” Staff
Discussion Note, Washington, International Monetary Fund.
Garcia-Verdu, R., Meyer-Cirkel, A., Sasahara, A., and H. Weisfeld, H., forthcoming, “The Impact of
Climate Change on Agricultural Productivity,” Working Paper, Washington, International
Monetary Fund.
Ghosh, Atish R., Mahvash S. Qureshi, Jun Il Kim, and Juan Zalduendo, 2014, “Surges,” Journal of
International Economics, Vol. 92, pp. 266–285.
Gruss, Bertrand, 2014, “After the Boom–Commodity Prices and Economic Growth in Latin America
and the Caribbean,” Working Paper No. 14/154, Washington, International Monetary Fund.
Intergovernmental Panel on Climate Change, 2014, “Climate Change 2014: Synthesis Report,
Summary for Policymakers.”
International Monetary Fund, 2011, “Regional Economic Outlook: Sub-Saharan Africa,” April,
Washington.
_______, 2012, “The Liberalization and Management of Capital Flows: An Institutional View,”
November, Washington.
———, 2013a, “Low-Income Countries Global Risks and Vulnerabilities Report,” Washington.
———, 2013b, Sub-Saharan Africa: Keeping the Pace, Regional Economic Outlook,” October,
Washington.
_______, 2014a, “Macroeconomic Developments in Low-Income Developing Countries,” Washington.
_______, 2014b, “Legacies, Clouds, and Uncertainties,” World Economic Outlook, World Economic and
Financial Survey, October, Washington.
———, 2014c, “Managing Volatile Capital Flows. Experiences and Lessons for Sub-Saharan African
Frontier Markets,” Departmental African Paper 14/01, Washington.
———, 2014d, “Issuing International Sovereign Bonds, Opportunities and Challenges for Sub-
Saharan Africa,” Departmental African Paper 14/02, Washington.
_______, 2014e, “Reform of the Policy on Public Debt Limits in Fund-Supported Programs,” December,
Washington.

MACROECONOMIC DEVELOPMENTS AND PROSPECTS IN LIDCS: 2015
INTERNATIONAL MONETARY FUND 55
_______, 2015a, “Adjusting to Lower Commodity Prices,” World Economic Outlook, World Economic
and Financial Survey, October, Washington.
_______, 2015b, “Uneven Growth: Short- and Long-Term Factors,” World Economic Outlook, World
Economic and Financial Survey, April, Washington.
_______, 2015c, “Vulnerabilities, Legacies, and Policy Challenges: Risks Rotating to Emerging Markets,
Global Financial Stability Report, October, Washington.
_______, 2015d, Middle East and Central Asia, Regional Economic Outlook, World Economic and
Financial Survey, October, Washington.
_______, 2015e, “IMF 2015 Spillover Report,” June, Washington.
_______, 2015f, “Global Prospects and Policy Challenges,” The Group of Twenty, November, Antalya,
Turkey.
_______, 2015g, “Public Debt Vulnerabilities in Low-Income Countries – The Evolving Landscape,”
November, Washington.
_______, 2015h, Sub-Saharan Africa: Dealing with the Gathering Clouds, Regional Economic Outlook,
World Economic and Financial Surveys, October, Washington.
_______, 2015i, “Eligibility to Use the Fund’s Facilities for Concessional Financing, 2015,” July,
Washington.
_______, 2015j, “Policy Considerations for Handling Capital Outflows,” Washington.
_______, 2015k, “Regional Economic Outlook, Sub-Saharan Africa: Navigating Headwinds,” April,
Washington.
Lanzafame, M., 2014, “Temperature, Rainfall and Economic Growth in Africa”, Empirical Economics,
Vol. 46, No. 1, pp. 1–18.
Mileva, Elitza, 2008, “The impact of capital flows on domestic investment in transition economies,”
ECB Working Paper 871, Frankfurt: European Central Bank.
Mlachila, Montfort, and Misa Tabeke, 2011, “FDI from BRICs to LICs: Emerging Growth Driver?”
Working Paper 13/183, Washington: International Monetary Fund.
Mody, Ashoka, and Antu P. Murshid, 2005, “Growing Up with Capital Flows,” Journal of International
Economics, Vol. 65, pp. 249–266.

MACROECONOMIC DEVELOPMENTS AND PROSPECTS IN LIDCS: 2015
56 INTERNATIONAL MONETARY FUND
Nguyen, Anh D.M., Jemma Dridi, Filiz D. Unsal, and Oral H. Williams, 2015, “On the Drivers of
Inflation in Sub-Saharan Africa,” Working Paper 15/189, Washington: International Monetary
Fund.
Presbitero, Andrea F., Dhaneshwar Ghura, Olumuyiwa S. Adedeji, and Lamin Njie, 2015,
“International Sovereign Bonds by Emerging Markets and Developing Economies: Drivers of
Issuance and Spreads,” Working Paper (forthcoming), Washington, International Monetary
Fund.
Rodrik and Subramanian, 2009, “Why Did Financial Globalization Disappoint?” IMF Economic Review,
Vol. 56, pp 112-138, Washington, International Monetary Fund.
Stern, Nicholas, 2008, “The Economics of Climate change,” American Economic Association, Vol. 92,
No. 2, 1–37.
Sutton, John, 2015, Competing in Capabilities: The Globalization Process, Clarendon Lectures in
Economics (Oxford University Press).
United Nations Department of Economic and Social Affairs, 2015, Addis Ababa Action Agenda of the
Third International Conference on Financing for Development, July (New York).
Verisk Maplecroft, Maplecroft Climate Change Vulnerability Index.
World Bank, 2012, “Turn Down the Heat: Why a 4°C Warmer World Must Be Avoided,” Washington.
_______, 2013, “Turn Down the Heat: Climate Extremes, Regional Impact and the Case for Resilience,”
Washington.
_______, 2014, “Turn Down the Heat: Confronting the New Climate Normal,” Washington.