Embed Size (px)
Citation preview
Abstract—L-moments are based on the linear combinations
of order statistics. The question of L-moments presents a general
theory covering the summarization and description of sample data
sets, the summarization and description of theoretical distributions,
but also the estimation of parameters of probability distributions and
hypothesis testing for parameters of probability distributions. L-
moments can be defined for any random variable in the case that its
mean exists. Within the scope of modeling income or wage
distribution we currently use the method of conventional moments,
the quantile method or the maximum likelihood method. The theory
of L-moments parallels to the other theories and the main advantage
of the method of L-moments over these methods is that L-moments
suffer less from impact of sampling variability. L-moments are more
robust and they provide more secure results mainly in the case
of small samples.
Common statistical methodology for description of the statistical
samples is based on using conventional moments or cumulants. An
alternative approach is based on using different characteristics which
are called the L-moments. The L-moments are an analogy to the
conventional moments, but they are based on linear combinations
of the rank statistics, i.e. the L-statistics. Using the L-moments is
theoretically more appropriate than the conventional moments
because the L-moments characterize wider range of the distribution.
When estimating from a sample, L-moments are more robust to the
existence of the outliers in the data. The experience shows that
in comparison with the conventional moments the L-moments are
more difficult to distort and in finite samples they converge faster to
the asymptotical normal distribution. Parameter estimations using the
L-moments are especially in the case of small samples often more
precise than estimates calculated using the maximum likelihood
method.
This text concerns with the application of the L-moments in the
case of larger samples and with the comparison of the precision of the
method of L-moments with the precision of other methods (moment,
quantile and maximum likelihood method) of parameter estimation
in the case of larger samples. Three-parametric lognormal
distribution is the basis of these analyses.
Keywords—Income distribution, L-moments, lognormal
distribution, wage distribution.
Manuscript received October xx, 2011: Revised version received March xx,
2011. This work was supported by grant project IGS 24/2010 called “Analysis
of the Development of Income Distribution in the Czech Republic since 1990
to the Financial Crisis and Comparison of This Development with the
Development of the Income Distribution in Times of Financial Crisis −
According to Sociological Groups, Gender, Age, Education, Profession Field
and Region” from the University of Economics in Prague.
D. Bílková is with the University of Economics in Prague, Faculty
of Informatics and Statistics, Department of Statistics and Probability, Sq. W.
Churchill 1938/4, 130 67 Prague 3, Czech Republic (corresponding author to
provide phone: +420 224 095 484; e-mail: [email protected]).
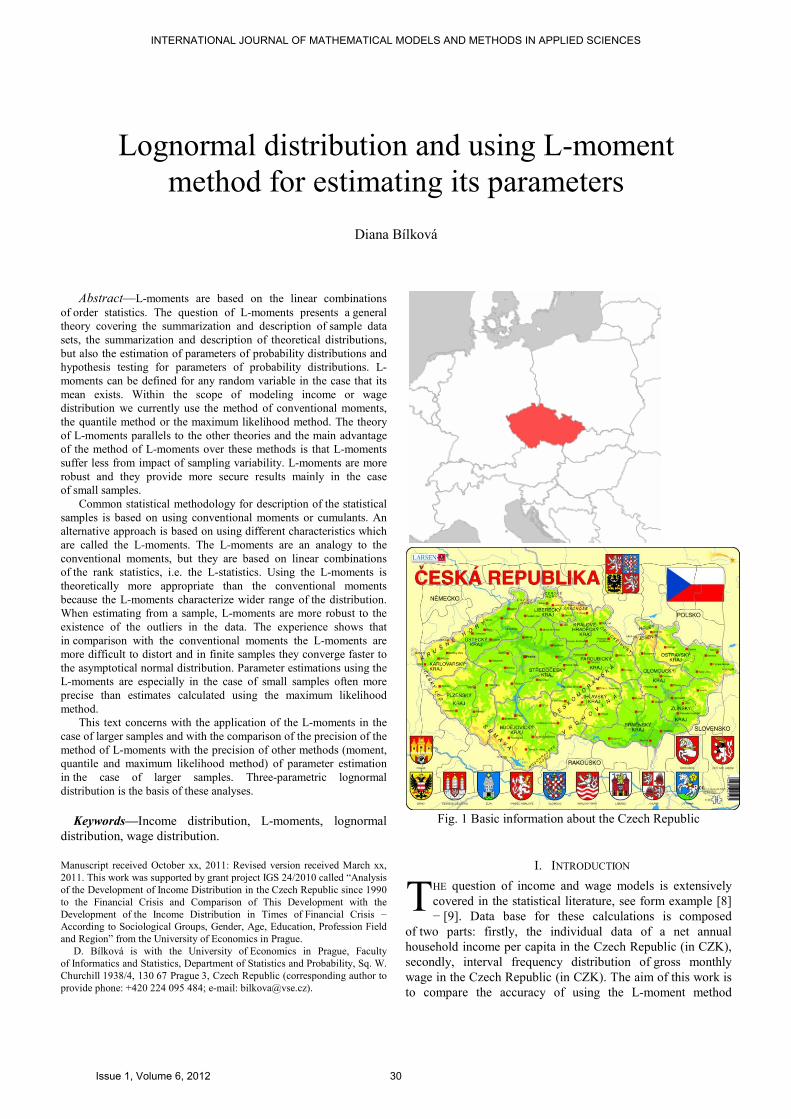
Fig. 1 Basic information about the Czech Republic
I. INTRODUCTION
HE question of income and wage models is extensively
covered in the statistical literature, see form example [8]
− [9]. Data base for these calculations is composed
of two parts: firstly, the individual data of a net annual
household income per capita in the Czech Republic (in CZK),
secondly, interval frequency distribution of gross monthly
wage in the Czech Republic (in CZK). The aim of this work is
to compare the accuracy of using the L-moment method
Lognormal distribution and using L-moment
method for estimating its parameters
Diana Bílková
T
INTERNATIONAL JOURNAL OF MATHEMATICAL MODELS AND METHODS IN APPLIED SCIENCES
Issue 1, Volume 6, 2012 30

of parameter estimation to the individual data with the
accuracy of using this method to the data ordered to the form
of interval frequency distribution. Another aim of this paper is
to compare the accuracy of different methods of parameter
estimation with the accuracy of the method of L-moments.
Three-parametric lognormal distribution was a fundamental
theoretical distribution for these calculations. Individual data
on net annual household income per capita come from the
statistical survey Microcensus (years 1992, 1996, 2002) and
from the statistical survey EU-SILC − European Union
Statistics on Income and Living Conditions (years 2005, 2006,
2007, 2008) organized by the Czech Statistical Office. The
data in the form of interval frequency distribution come from
the website of the Czech Statistical Office. Fig. 1 presents
current basic information about the location of the Czech
Republic in Europe and about the Czech Republic itself.
II. METHODS
A. Three-Parametric Lognormal Distribution
The essence of lognormal distribution is treated in detail for
example in [2]. Use of lognormal distribution in connection
with income or wage distributions is described in [1] or [2].
Random variable X has three-parametric lognormal
distribution LN(µ,σ2,θ) with parameters µ, σ2
and θ, where
− ∞ < µ < ∞, σ2 > 0 and − ∞ < θ < ∞, if its probability density
function f(x; µ,σ2,θ) has the form
f x( ; , , )2µ σ θ
,,2)(
12 2
])([ln 2
θ>πθ−σ
= σ
µ−θ−− xe
x
x
(1)
.else,0=
Random variable
Y = ln (X − θ) (2)
has a normal distribution N(µ,σ2) and random variable
U =− −ln ( )X θ µ
σ
(3)
has a standardized normal distribution N (0, 1). The parameter
µ is the expected value of random variable (2) and the
parameter σ2 is the variance of this random variable.
Parameter θ is the theoretical minimum of random variable X.
Figs. 2 and 3 represent the probability density functions
of three-parametric lognormal curves depending on the values
of their parameters.
The expected value (4) is the basic moment location
characteristic of a random variable X having three-parametric
lognormal distribution
E( ) = + .+2
2X eθ µσ
(4)
100 P% quantile is the basic quantile location characteristic
of a random variable X
,exuP
Pσ+µ+θ=
(5)
where 0 < P < 1 and uP is 100·P% quantile of the standardized
normal distribution. Substituting into the relation (5) P = 0.5,
we get 50% quantile of three-parametric lognormal
distribution, which is called median
~x e= +θ µ.
(6)
0
0,02
0,04
0,06
0,08
0,1
1 3 5 7 9 11 13 15 17 19x
f(x)
µ = 1
µ = 2
µ = 3
µ = 4
µ = 5
Fig. 2 Probability density function for the values of parameters
σ = 2, θ = −2
0
0,01
0,02
0,03
0,04
0,05
-4 0 4 8 12 16 20 24 28 32 36 40 44x
f(x)
σ = 1
σ = 2
σ = 3
σ = 4
σ = 5
Fig. 3 Probability density function for the values of parameters
µ = 3, θ = −2
The Median (6) divides the range of values of random variable
X on the two equally likely parts. The mode (7) of random
variable X is another often used location characteristic
of three-parametric lognormal distribution
ɵ .x e= + −θ µ σ2 (7)
The variance (8) of random variable X is a basic variability
characteristic of three-parametric lognormal distribution
INTERNATIONAL JOURNAL OF MATHEMATICAL MODELS AND METHODS IN APPLIED SCIENCES
Issue 1, Volume 6, 2012 31

D( ) = ( )22 + 2
X e e .µ σ σ − 1
(8)
Standard deviation (9) is the square root of the variance and it
represents another moment variability characteristic of the
considered theoretical distribution
.eeXD 1)(2
2
2
−= σσ+µ
(9)
The coefficient of variation (10) is a characteristic of relative
variability of this distribution and we get it by dividing the
standard deviation to the expected value of the distribution
Ve e
e
( )X .=−
+
+
+
µσ
σ
µσ
θ
2
22
2
2
1
(10)
It is a dimensionless characteristic of variability.
The coefficient of skewness (11) and the coefficient
of kurtosis (12) belong to basic moment shape characteristic
of the distribution
,12)+(=)(22
1−β σσ eeX
(11)
.332=)(2 23 24 2
2−++β σσσ
eeeX
(12)
B. Methods of Point Parameter Estimation
Question of parameter estimation of three-parametric
lognormal distribution is already well developed in statistical
literature, see for example [3]. We can use various methods to
estimate the parameters of three-parametric lognormal
distribution. We give as an example: moment method, quantile
method, maximum likelihood method, method of L-moments,
Kemsley's method, Cohen's method or graphical method.
Moment method
The essence of moment method of parameter estimation
lies in the fact that we put the sample moments and the
corresponding theoretical moments into equation. We can
combine the general and the central moments. This method
of estimating parameters is indeed very easy to use, but it is
very inaccurate. In particular, the estimate of theoretical
variance by its sample counterpart is very inaccurate.
However, in the case of income and wage distribution we work
with large sample sizes, and therefore the use of moment
method of parameter estimation may not be a hindrance
in terms of efficiency of estimators.
In the case of moment method of parameter estimation
of three-parametric lognormal distribution we put the sample
arithmetic mean x equal to the expected value of random
variable X and we put the sample second central moment equal
to the variance of random variable X. Furthermore, we put
equal the sample third central moment m3 with a theoretical
third central moment of random variable X and we get the third
equation. We obtain a system of moment equations
x e= + +~ ~~
θ µσ2
2 ,
(13)
2
22 2m e= −+~ ~ ~
eµ σ σ( 1) ,
(14)
33
3
22 2 2
m e e e= −+~ ~ ~ ~µ σ σ σ( 1) ( + 2) .
2
(15)
We obtain from equations (14) and (15)
12
32
23 2
b m m= ⋅ = −−( 1) ( + 2) ,
2 2~ ~e eσ σ
(16)
and therefore we also gain the moment parameter estimations
of three-parametric lognormal distribution from the system
of equations (13) to (15)
+−
+++= 3 21
2
21
2 12
11
2
11ln~ bbσ
,112
11
2
113 2
1
2
21
−−
+−++ bb
(17)
~ m
e e~ ~µσ σ
=−
1
2 2ln
( 1),
2
2
(18)
~e~
~
θ µσ
= − +x2
2 .
(19)
Quantile method and Kemsley's method
Quantile method of parameter estimation of three-
parametric lognormal distribution is based on the use of three
sample quantiles, namely there are 100⋅P1% quantile, 100⋅P2%
quantile and 100⋅P3% quantile, where P2 = 0,5 and
P3 = 1 − P1, and thus
2 10P Pu u= = −a .
3Pu
We create a system of quantile equations by substituting to (5)
11P
V Pux = +∗ ∗ + ∗θ µ σe ,
(20)
0,5 ,Vx e= +∗ ∗θ µ
(21)
(1 1) ,−∗ ∗ − ∗
= +PV Pux eθ µ σ
1
(22)
where
1PV Vx x, a0,5 (1 1)
VPx −
are the corresponding sample quantiles. We obtain quantile
parameter estimations of three-parametric lognormal
distribution from the system of quantile equations (20) to (22)
INTERNATIONAL JOURNAL OF MATHEMATICAL MODELS AND METHODS IN APPLIED SCIENCES
Issue 1, Volume 6, 2012 32

∗ −=
−
−
2
2
1
1
σ
ln
,
0,5
0,5 ( 11 )
PV
PV
P
x
x
u
V
V
x
x
(23)
∗ −
∗ − ∗=−
−µ
σ σln ,
1 ( 11 )P
VPx
e e
V
Pu Pu
x
1 1
(24)
∗ ∗= −θ µ
0,5 .Vx e
(25)
The sample median can be replaced by the sample
arithmetic mean. Then we solve a similar system of equations
as in the case of quantile method. This method is called
Kemsley's method.
Maximum likelihood method and Cohen's method
If the value of the parameter θ in known, the likelihood
function is maximized when the likelihood parameter
estimations of three-parametric lognormal distribution have the
form
ɵ
xiµ
θ=
−=∑ ln ( )
,i
n
n
1
(26)
2
2
1ɵ
x ɵi
σθ µ
=− −
=∑[ln ( ) ]
.i
n
n
(27)
If the value of parameter θ is not known, this problem is
considerably more complicated. If the parameter θ is estimated
based on its sample minimum
ɵ xVθ = min ,
(28)
the likelihood function is unlimited. Maximum likelihood
method is therefore sometimes combined with the Cohen's
method. In this procedure, we put the smallest sample value
to the equality with 100 ⋅ (n + 1)− 1
% quantile
min( ) .V ɵ ɵ nx ɵ e= + + −+θ µ σ 11u
(29)
Equation (29) is then combined with a system of equations
(26) and (27).
L-moment method
Question of L-moment is described in detail for example
in [10]. We will assume that X is a real random variable with
the distribution function F(x) and quantile function x(F) and
X1:n ≤ X2:n ≤ … ≤ X n:n are the rank statistics of the random
sample of the size n selected from the distribution X. Then the
r-th L-moment of the random variable X is defined as
....,3,2,1,1
1)( :
1
0
1 =
−∑ −=λ −−
=
− rEXk
rr rkr
r
k
kr
(30)
The letter ‘L’ in the name ‘L-moments’ is to stress the fact that
r-th L-moment λr is a linear function of the expected rank
statistics. Natural estimate of the L-moment λr based on the
observed sample is furthermore a linear combination of the
ordered values, i.e. the so called L-statistics. The expected
value of the rank statistic is of the form
.)(d)]([1)]([!)(!1)(
! 1: xFxFxFx
jrj
rEX jrj
rj −⋅⋅−⋅−
= −−∫
(31)
If we plough the equation (31) in the equation (30), we get
after some operations
,...,3,2,1,d)()(1
1
0
=∗=λ −∫ rFFPFxrr
(32)
where
∑==
∗∗r
k
kkrr FpFP
0,)(
(33)
and
,)1(,
+
−= −∗
k
kr
k
rp
krkr
(34)
where )(FPr∗ represents the r-th shifted Legender's polynom
which is related to the usual Legender’s polynoms. Shifted
Legender's polynoms are orthogonal on the interval (0,1) with
a constant weight function. The first four L-moments are of the
form
,d)(1
0
1 FFxEX ∫==λ
(35)
,d)12()()(2
11
0
2 2:12:2 FFFxXXE −⋅=−=λ ∫ (36)
=+−=λ )2(3
13:13:23:33 XXXE
,d)166()(2
1
0
FFFFx +−⋅= ∫
(37)
=−+−=λ )33(4
14:14:24:34:44 XXXXE
.d)1123020()(23
1
0
FFFFFx −+−⋅= ∫
(38)
INTERNATIONAL JOURNAL OF MATHEMATICAL MODELS AND METHODS IN APPLIED SCIENCES
Issue 1, Volume 6, 2012 33

Details about the L-moments can be found in [4] or [5]. The
coefficients of the L-moments are defined as
....,5,4,3,2
=λλ=τ rr
r
(39)
L-moments λ1, λ2, λ3, …, λr and coefficients of L-moments
τ 1, τ 2, τ 3, …, τr can be used as the characteristics of the
distribution. L-moments are in a way similar to the
conventional central moments and coefficients of L-moments
are similar to the moment ratios. Especially L-moments λ1 and
λ2 and coefficients of the L-moments τ3 and τ4 are considered
to be characteristics of the location, variability and skewness.
Using the equations (35) to (37) and the equation (39), we
get the first three L-moments of the three-parametric
lognormal distribution LN(µ, σ2, ξ), which is described e.g.
in [5]. The following relations are valid for these L-moments
,2
exp2
1
σ+µ+ξ=λ
(40)
,2
erf2
exp2
2
σ⋅
σ+µ=λ
(41)
,d)(exp3
erf
2erf
62
0
23
21
∫ −⋅
⋅
σπ
=τσ−
xxx
(42)
where erf(z) is the so called error function defined as
.d2
)(erf
0
2tez
zt∫⋅
π= −
(43)
Now we will assume that x1, x2, …, xn is a random sample and
x1:n ≤ x 2:n ≤ … ≤ x n:n is the ordered sample. The r-th sample
L-moment is defined as
.,...,2,1,1)1(
:
1
0
11
211
nrk
rr
r
nl x n
r
k
k
r i krni r...ii
...=⋅
−⋅−⋅⋅
=
−∑∑ ∑ ∑
−
=
−−
≤≤≤≤≤
(44)
We can write specifically for the first four sample L-moments
,11 ∑⋅= −
i
ixnl (45)
,)(22
1::
1
2xx
ji
nl njni −
>⋅
⋅= ∑∑
− (46)
,)2(33
1:::
1
3xxx
kji
nl nknjni +−
>>⋅
⋅= ∑∑∑
− (47)
.)33(44
1::::
1
4xxxx
lkji
nl nlnknjni −+−
>>>⋅
⋅= ∑∑∑∑
−
(48)
Sample L-moments can be used similarly as the
conventional sample moments because they characterize basic
properties of the sample distribution and estimate the
corresponding properties of the distribution from which were
the data sampled. They might be also used to estimate the
parameters of this distribution. In these cases L-moments are
of then used instead of the conventional moments because as
linear functions of the data they are less sensitive on the
sample variability or on the error size in the case of the
presence of the extreme values in the data than the
conventional moments. Therefore it is assumed that the L-
moments provide more precise and robust estimates of the
characteristics of parameters of the population probability
distribution.
Let us denote the distribution function of the standard
normal distribution as Φ, then Φ−1
represents the quantile
function of the standard normal distribution. The following
relation holds for the distribution function of the three-
parametric lognormal distribution LN(µ, σ2, ξ)
.)(ln
σ
µ−ξ−Φ=
xF (49)
The coefficients of L-moments (39) are then commonly
estimated using the following estimates
....,5,4,3,2
== rl
lt
rr
(50)
The estimates of the three-parametric lognormal distribution
can then be calculated as
,2
1
3
8 31
+Φ⋅= − t
z
(51)
,z127,0000z1180,006281,999053
+−≈σ zˆ (52)
,2
2erf
2
2ln σ−
σ=µ ˆ
ˆlˆ
(53)
.2
exp
2
1
σ+µ−=θ ˆˆlˆ (54)
More on L-moments is for example in [6], [11] or [12].
INTERNATIONAL JOURNAL OF MATHEMATICAL MODELS AND METHODS IN APPLIED SCIENCES
Issue 1, Volume 6, 2012 34

C. Appropriateness of the Model
It is also necessary to assess the suitability of the
constructed model or choose a model from several
alternatives, which is made by some criterion, which can be
a sum of absolute deviations of the observed and theoretical
frequencies for all intervals
S n ni ii
k
= − =∑ π
1
(55)
or known criterion χ2
∑= π
π−=χk
i n i
n ini
1
,)( 2
2
(56)
where ni are observed frequencies in individual intervals, πi are
theoretical probabilities of membership of statistical unit into
the i-th interval, n is the total sample size of corresponding
statistical file, n ⋅ πi are the theoretical frequencies in individual
intervals, i = 1, 2, ..., k, and k is the number of intervals.
The question of the appropriateness of the given curve for
model of the distribution of income and wage is not entirely
conventional mathematical-statistical problem in which we test
the null hypothesis “H0: The sample comes from the supposed
theoretical distribution” against the alternative hypothesis
“H1: non H0 ”,because in goodness of fit tests in the case
of income and wage distribution we meet frequently with the
fact that we work with large sample sizes and therefore the test
would almost always lead to the rejection of the null
hypothesis. This results not only from the fact that with such
large sample sizes the power of the test is so high at the chosen
significance level that the test uncovers all the slightest
deviations of the actual income or wage distribution and
model, but it also results from the principle of the construction
of test. But, practically we are not interested in such small
deviations, so only gross agreement of the model with reality is
sufficient and we so called “borrow” the model (curve). Test
criterion χ2 can be used in that direction only tentatively.
When evaluating the suitability of the model we proceed to
a large extent subjective and we rely on the experience and
logical analysis. More is for example in [2].
D. Another Characteristics of Differentiation
There are various characteristics of variability of incomes
and wages (or differentiation of incomes and wages) –
variance, standard deviation, coefficient of variation or Gini
index. In this article, only variance, standard deviation and
a coefficient of variation are used. As L-moments are
of interests, we give a few comments on the relation between
the two- and three-parametric lognormal distribution and
characteristics of differentiation.
If we substitute θ = 0 into the formulas of three-parametric
lognormal distribution, we obtain two-parametric lognormal
distribution. It follows from the formula (10) that the
coefficient of variation depends only on one parameter σ2
in the case of two-parametric lognormal distribution
.eXV 1)(2−= σ
(57)
Formulas for Gini coefficient can be found in the form
σ=
2erfG
(58)
or equivalently in the form
.12
2 −
σΦ=G (59)
Unfortunately, in the case of the three-parametric lognormal
distribution it is not true and both characteristics depend on all
three parameters, see (10) for the case of coefficient of
variation. We substitute r = 2 into the formula (30) and we
obtain
XXEXXE 212
1)(
2
11:2:222
−=−=λ (60)
and we conclude that Gini mean difference equals 2λ2 (see
[5]). Gini coefficient can be evaluated as .λ
λ
1
2 We obtain for
the Gini coefficient G of the three-parametric lognormal
distribution a formula
.
e
eG
+θ
σ⋅
=σµ
σ+µ
2
2
2
2
+
2erf
(61)
In this text, Gini coefficients are not included but from
previous considerations the usefulness of L-moments
in evaluating these characteristics is clear.
E. Four-Parametric Lognormal Distribution
Random variable X has four-parametric lognormal
distribution LN(µ,σ2,θ,τ) with parameters µ, σ2
, θ and τ,
where − ∞ < µ < ∞, σ2 > 0 and − ∞ < θ < τ < ∞, if its
probability density function f(x; µ,σ2,θ,) has the form
),,,;( 2 τθσµxf
=−
− −< <−
−
−−
( )
( ) ( ) 2, ,
ln
22
τ θ
σ θ τ πθ τ
θ
τµ
σx
e
x
xx
x
2
(62)
.else,0=
Random variable
INTERNATIONAL JOURNAL OF MATHEMATICAL MODELS AND METHODS IN APPLIED SCIENCES
Issue 1, Volume 6, 2012 35

Y =−
−lnX
X
θ
τ
(63)
has a normal distribution N(µ,σ2) and random variable
U =
−
−−ln
X
X
θ
τµ
σ
(64)
has a standardized normal distribution N (0, 1). The parameter
µ is the expected value of random variable (63) and the
parameter σ2 is the variance of this random variable.
Parameter θ is the theoretical minimum of random variable X
and parameter τ is the theoretical maximum of this variable.
Figs. 4 and 5 represent the probability density functions
of four-parametric lognormal curves depending on the values
of their parameters.
0
0,2
0,4
0,6
0,8
1
1,2
1E-1
00,
40,
81,
21,
6 22,
42,
83,
23,
6 44,
44,
85,
25,
6 6
x
f(x)
µ = -2
µ = -1,5
µ = -1
µ = -0,5
µ = 0
Fig. 4 Probability density function for the values of parameters
σ = 0,8, θ = 0,5, τ = 6
0
0,1
0,2
0,3
0,4
0,5
0,6
0 0,4 0,8 1,2 1,6 2 2,4 2,8 3,2 3,6 4 4,4 4,8 5,2 5,6 6x
f(x)
σ^2 = 0,49
σ^2 = 1,24
σ^2 = 2
σ^2 = 3,24
σ^2 = 5
Fig. 5 Probability density function for the values of parameters
µ = 0,5, θ = 0,5, τ = 6
III. ANALYSIS AND RESULTS
Tabs. 1 to 14 present the estimated parameters of three-
parametric lognormal curves using various methods of point
parameter estimation (method of L-moments, moment method,
quantile method and maximum likelihood method) and the
sample characteristics on the basis of these the parameters
were estimated. We can see from Tables 7, 11 and 13 that the
value of the parameter θ (theoretical beginning of the
distribution) is negative in many cases. This means that
Tab. 1 Sample L-moments − Income
Sample L-moments
Year l1 l2 l3
1992 35,246.51 7,874.26 2,622.14
1996 66,121.92 16,237.54 5,685.46
2002 105,029.89 27,978.40 10,229.62
2005 111,023.71 28,340.18 9,113.57
2006 114,945.08 28,800.68 9,286.18
2007 123,806.49 30,126.11 9,530.57
2008 132,877.19 31,078.96 9,702.45
Tab. 2 Parameter estimations of three-parametric lognormal
distribution obtained using the L-moment method − Income
Parameter estimation
Year µ σ2
θ
1992 9.696 0.490 14,491.687
1996 10.343 0.545 25,362.753
2002 10.819 0.598 37,685.637
2005 11.028 0.455 33,738.911
2006 11.040 0.458 36,606.903
2007 11.112 0.440 40,327.610
2008 11.163 0.428 45,634.578
Tab. 3 Sample characteristics (arithmetic mean ,x standard
deviation s and coefficient of skewness b1) − Income
Sample characteristics
Year
x s b1
1992 35,247 19,364 7.815
1996 68,286 51,102 17.606
2002 105,030 83,598 17.142
2005 111,024 77,676 14.907
2006 114,945 74,503 10.395
2007 123,806 74,578 7.727
2008 132,877 73,982 6.979
Tab. 4 Parameter estimations of three-parametric lognormal
distribution obtained using the moment method − Income
Parameter estimation
Year µ σ2
θ
1992 8.883 1.173 22,284.335
1996 9.154 1.780 45,269.967
2002 9.668 1.760 66,925.879
2005 9.710 1.656 73,299.950
2006 9.976 1.386 71,936.249
2007 10.242 1.165 73,575.417
2008 10.328 1.089 80,180.795
INTERNATIONAL JOURNAL OF MATHEMATICAL MODELS AND METHODS IN APPLIED SCIENCES
Issue 1, Volume 6, 2012 36

Tab. 5 Sample quartiles − Income
Sample quartiles
Year x~ ,250
x~ ,500
x~ ,750
1992 25,900 31,000 39,298
1996 47,550 57,700 76,550
2002 73,464 89,204 115,966
2005 79,600 97,050 124,068
2006 82,998 100,640 128,000
2007 90,000 108,744 138,000
2008 97,160 117,497 148,937
Tab. 6 Parameter estimations of three-parametric lognormal
distribution obtained using the quantile method − Income
Parameter estimation
Year
µ
σ2
θ
1992 9.490 0.521 17,766.792
1996 9.998 0.842 35,708.333
2002 10.551 0.619 50,986.446
2005 10.805 0.420 47,774.906
2006 10.813 0.423 50,970.817
2007 10.862 0.436 56,577.479
2008 10.961 0.417 59,909.386
Tab. 7 Parameter estimations of three-parametric lognormal
distribution obtained using the maximum likelihood method −
Income
Parameter estimation
Year
µ
σ2
θ
1992 10.384 0.152 -0.342
1996 10.995 0.180 52.236
2002 11.438 0.211 73.525
2005 11.503 0.206 -2.050
2006 11.542 0.199 -8.805
2007 11.623 0.190 -42.288
2008 11.703 0.177 -171.167
Tab. 8 Sample L-moments − Wage
Sample quartiles
Year l1 l2 l3
2002 17,437.49 4,251.48 1,267.44
2003 18,663.18 4,524.95 1,251.90
2004 19,697.57 5,001.34 1,586.09
2005 20,738.14 5,262.93 1,636.67
2006 21,803.28 5,454.74 1,738.23
2007 23,882.83 6,577.65 2,627.93
2008 25,477.59 6,993.72 2,737.94
Tab. 9 Parameter estimations of three-parametric lognormal
distribution obtained using the L-moment method − Wage
Parameter estimation
Year
µ
σ2
θ
2002 9.238 0.388 4,952.259
2003 9.402 0.332 4,364.869
2004 9.313 0.442 5,872.138
2005 9.392 0.424 5,908.390
2006 9.393 0.447 6,795.207
2007 9.222 0.724 9,349.280
2008 9.319 0.693 9,719.297
Tab. 10 Sample characteristics (arithmetic mean ,x standard
deviation s and coefficient of skewness b1) − Wage
Sample characteristics
Year
x s b1
2002 17,437 8,321 1.817
2003 18,663 8,657 1.354
2004 19,698 9,804 1.614
2005 20,738 10,180 1.481
2006 21,803 10,477 1.419
2007 23,883 13,776 2.338
2008 25,478 14,485 2.191
Tab. 11 Parameter estimations of three-parametric lognormal
distribution obtained using the moment method − Wage
Parameter estimation
Year µ σ2
θ
2002 9.492 0.264 2,311.688
2003 9.837 0.166 -1,681.293
2004 9.779 0.221 -25.695
2005 9.906 0.193 -1,339.601
2006 9.979 0.180 -1,805.527
2007 9.734 0.377 3,509.924
2008 9.851 0.345 2,920.381
Tab. 12 Sample quartiles − Wage
Sample quartiles
Year x~ ,250
x~ ,500
x~ ,750
2002 11,944 15,545 20,215
2003 12,728 16,735 22,224
2004 13,416 17,709 23,077
2005 14,063 18,597 24,470
2006 14,717 19,514 25,675
2007 15,769 20,910 27,545
2008 16,853 22,225 29,404
INTERNATIONAL JOURNAL OF MATHEMATICAL MODELS AND METHODS IN APPLIED SCIENCES
Issue 1, Volume 6, 2012 37

Tab. 13 Parameter estimations of three-parametric lognormal
distribution obtained using the quantile method − Wage
Parameter estimation
Year
µ
σ2
θ
2002 9.663 0.149 -185.316
2003 9.605 0.218 1,899.151
2004 9.974 0.110 -3,742.702
2005 9.897 0.147 -1,283.306
2006 9.983 0.138 -2,144.719
2007 10.036 0.143 -1,919.373
2008 9.968 0.185 887.792
Tab. 14 Parameter estimations of three-parametric lognormal
distribution obtained using the maximum likelihood method −
Wage
Parameter estimation
Year
µ
σ2
θ
2002 8.977 0.828 6,364.635
2003 9.024 0.615 6,679.910
2004 9.363 0.306 3,090.038
2005 9.400 0.329 4,134.624
2006 9.159 0.742 8,070.167
2007 9.487 0.369 2,586.616
2008 9.593 0.341 3,324.455
lognormal curve gets into negative territory at the beginning
of its course.
Because of a very tight contact of the lower tail of the
lognormal curve with the horizontal axes, this fact does not
have to be a problem for a good fit of the model.
The advantage of the lognormal models is that the parameters
have an easy interpretation. Also some parametric functions
of these models have straight interpretation. In the case that the
estimated value of parameter θ is negative, we can not really
interpret this value.
Figs. 6 to 13 show the probability density functions
of three-parametric lognormal curves, whose parameters were
estimated using different methods of parameter estimation. We
can also see from these figures the development of theoretical
income distribution in the years in 1992, 1996, 2002, 2005 to
2008 (Figs. 6 to 9) and the development of theoretical wage
distribution in the years 2002 to 2008 (Figs. 10 to 13).
Although the shapes of probability density function of three-
parametric lognormal curves differ considerably between the
used methods of point parameter estimation, we can observe
certain trends in their development. We can see form Figs. 6
to 13 that as in the case of income, so in the case of wage
distribution, characteristics of the level of these distributions
increase gradually and characteristics of income and wage
differentiation increase gradually, too. Therefore, data can not
be considered homoskedastic in terms of the same variability
in the same distributions as the characteristics of absolute
variability grow in time. We see also from Figs. 6 to 13 the
gradual decline of characteristics of shape of the distribution
(skewness and kurtosis).
Figs. 14 to 20 represent the histograms of observed interval
frequency distribution of net annual household income per
capita in 1992, 1996, 2002, 2005 to 2008. Histograms
of observed interval frequency distribution of gross monthly
wage in 2002 to 2008 could not be constructed due to non-
uniform width of the individual intervals. The interval
frequency distributions with unequal wide of intervals were
taken from the official website of the Czech Statistical Office
and the frequency distribution histogram would lose any visual
informative about the shape of the frequency distribution
in this case. Figs. 21 to 24 also provide approximate
information about the accuracy of the used methods
of parameter estimation. Figs. 21 and 23 represent the
development of the sample arithmetic mean and the
development of theoretical expected values of three-parametric
lognormal distribution with parameters estimated using
different methods of parameter estimation. Figs. 22 and 24
represent the development of the sample median and the
development of theoretical medians of three-parametric
lognormal distribution with parameters estimated using
different methods of parameter estimation. It is important to
note, however, that Figs. 21 and 23 give nothing about the
accuracy of moment method of parameter estimation, because
equality of the sample arithmetic mean and theoretical
expected value represents one of three moment equations.
In this case, the course of development of sample arithmetic
mean coincides with the course of development of theoretical
expected value of three-parametric lognormal distribution with
0
0,000005
0,00001
0,000015
0,00002
0,000025
0,00003
0,000035
0,00004
0,000045
0,00005
5000
2500
0
4500
0
6500
0
8500
0
1050
00
1250
00
1450
00
1650
00
1850
00
2050
00
2250
00
2450
00
2650
00
2850
00
net annual income per capita (in CZK)
probability density function
Year 1992
Year 1996
Year 2002
Year 2005
Year 2006
Year 2007
Year 2008
Fig. 6 Probability density function of net annual household
income per capita − L-moment method
0
0,00001
0,00002
0,00003
0,00004
0,00005
0,00006
0,00007
0,00008
0,00009
0,0001
5000
2500
0
4500
0
6500
0
8500
0
1050
00
1250
00
1450
00
1650
00
1850
00
2050
00
2250
00
2450
00
2650
00
2850
00
net annual income per capita (in CZK)
probability density function Year 1992
Year 1996
Year 2002
Year 2005
Year 2006
Year 2007
Year 2008
Fig. 7: Probability density function of net annual household
income per capita − Moment method
INTERNATIONAL JOURNAL OF MATHEMATICAL MODELS AND METHODS IN APPLIED SCIENCES
Issue 1, Volume 6, 2012 38

0
0,00001
0,00002
0,00003
0,00004
0,00005
0,00006
5000
2500
0
4500
0
6500
0
8500
0
1050
00
1250
00
1450
00
1650
00
1850
00
2050
00
2250
00
2450
00
2650
00
2850
00
net annual income per capita (in CZK)
probability density function
Year 1992
Year 1996
Year 2002
Year 2005
Year 2006
Year 2007
Year 2008
Fig. 8 Probability density function of net annual household
income per capita − Quantile method
0
0,000005
0,00001
0,000015
0,00002
0,000025
0,00003
0,000035
0,00004
5000
2500
0
4500
0
6500
0
8500
0
1050
00
1250
00
1450
00
1650
00
1850
00
2050
00
2250
00
2450
00
2650
00
2850
00
net annual income per capita (in CZK)
probability density function
Year 1992
Year 1996
Year 2002
Year 2005
Year 2006
Year 2007
Year 2008
Fig. 9 Probability density function of net annual household
income per capita − Maximum likelihood method
0
0,00001
0,00002
0,00003
0,00004
0,00005
0,00006
0,00007
0,00008
0
6000
1200
0
1800
0
2400
0
3000
0
3600
0
4200
0
4800
0
5400
0
6000
0
6600
0
7200
0
7800
0
8400
0
9000
0
9600
0
1020
00
1080
00
1140
00
gross monthly wage (in CZK)
probability density function
Year 2002
Year 2003
Year 2004
Year 2005
Year 2006
Year 2007
Year 2008
Fig. 10: Probability density function of gross monthly wage −
L-moment method
0
0,00001
0,00002
0,00003
0,00004
0,00005
0,00006
0,00007
080
00
1600
0
2400
0
3200
0
4000
0
4800
0
5600
0
6400
0
7200
0
8000
0
8800
0
9600
0
1040
00
1120
00
gross monthly wage (in CZK)
probability density function Year 2002
Year 2003
Year 2004
Year 2005
Year 2006
Year 2007
Year 2008
Fig. 11 Probability density function of gross monthly wage −
Moment method
0
0,00001
0,00002
0,00003
0,00004
0,00005
0,00006
0,00007
0,00008
080
00
1600
0
2400
0
3200
0
4000
0
4800
0
5600
0
6400
0
7200
0
8000
0
8800
0
9600
0
1040
00
1120
00
gross monthly wage (in CZK)
probability density function Year 2002
Year 2003
Year 2004
Year 2005
Year 2006
Year 2007
Year 2008
Fig. 12 Probability density function of gross monthly wage −
Quantile method
0
0,00001
0,00002
0,00003
0,00004
0,00005
0,00006
0,00007
0,00008
0,00009
0
8000
1600
0
2400
0
3200
0
4000
0
4800
0
5600
0
6400
0
7200
0
8000
0
8800
0
9600
0
1040
00
1120
00
gross monthly wage (in CZK)
probability density function
Year 2002
Year 2003
Year 2004
Year 2005
Year 2006
Year 2007
Year 2008
Fig. 13 Probability density function of gross monthly wage −
Maximum likelihood method
0
1000
2000
3000
4000
5000
3500
1050
0
1750
0
2450
0
3150
0
3850
0
4550
0
5250
0
5950
0
6650
0
7350
0
8050
0
8750
0
9450
0
1015
00
1085
00
1155
00
1225
00
1295
00
1365
00
1435
00
1505
00
1575
00
1645
00
1715
00
Interval middle
Absolute frequency
Fig. 14 Interval frequency distribution of net annual household
income per capita in 1992
0
1500
3000
4500
6000
7500
4500
1350
0
2250
0
3150
0
4050
0
4950
0
5850
0
6750
0
7650
0
8550
0
9450
0
1035
00
1125
00
1215
00
1305
00
1395
00
1485
00
1575
00
1665
00
1755
00
1845
00
1935
00
2025
00
2115
00
2205
00
Interval middle
Absolute frequency
Fig. 15 Interval frequency distribution of net annual household
income per capita in 1996
INTERNATIONAL JOURNAL OF MATHEMATICAL MODELS AND METHODS IN APPLIED SCIENCES
Issue 1, Volume 6, 2012 39

0
300
600
900
1200
1500
6000
1800
0
3000
0
4200
0
5400
0
6600
0
7800
0
9000
0
1020
00
1140
00
1260
00
1380
00
1500
00
1620
00
1740
00
1860
00
1980
00
2100
00
2220
00
2340
00
2460
00
2580
00
2700
00
2820
00
2940
00
Interval middle
Absolute frequency
Fig. 16 Interval frequency distribution of net annual household
income per capita in 2002
0
200
400
600
800
1000
1200
8000
2400
0
4000
0
5600
0
7200
0
8800
0
1040
00
1200
00
1360
00
1520
00
1680
00
1840
00
2000
00
2160
00
2320
00
2480
00
2640
00
2800
00
2960
00
3120
00
3280
00
3440
00
3600
00
3760
00
3920
00
Interval middle
Absolute frequency
Fig. 17 Interval frequency distribution of net annual household
income per capita in 2005
0
300
600
900
1200
1500
8000
2400
0
4000
0
5600
0
7200
0
8800
0
1040
00
1200
00
13600
0
15200
0
16800
0
18400
0
2000
00
2160
00
2320
00
2480
00
2640
00
2800
00
2960
00
31200
0
32800
0
34400
0
3600
00
3760
00
3920
00
Interval middle
Absolute frequency
Fig. 18 Interval frequency distribution of net annual household
income per capita in 2006
0
500
1000
1500
2000
2500
1000
0
3000
0
5000
0
7000
0
9000
0
1100
00
1300
00
1500
00
1700
00
1900
00
2100
00
2300
00
2500
00
2700
00
2900
00
3100
00
3300
00
3500
00
3700
00
3900
00
4100
00
4300
00
4500
00
4700
00
4900
00
Interval middle
Absolute frequency
Fig. 19 Interval frequency distribution of net annual household
income per capita in 2007
0
500
1000
1500
2000
2500
3000
1000
0
3000
0
5000
0
7000
0
9000
0
1100
00
1300
00
1500
00
1700
00
1900
00
2100
00
2300
00
2500
00
2700
00
2900
00
3100
00
3300
00
3500
00
3700
00
3900
00
4100
00
4300
00
4500
00
4700
00
4900
00
Interval middle
Absolute frequency
Fig. 20 Interval frequency distribution of net annual household
income per capita in 2008
parameters estimated using the moment method of parameter
estimation. Similarly situation is for Figs. 22 and 24 in the case
of quantile method of parameter estimation, where equality
of sample and theoretical median is one of three quantile
equations and so the course of the development of sample
median coincides with the course of development
of theoretical median of three-parametric lognormal
distribution with the parameters estimated using the quantile
method of parameter estimation. Figs. 21 to 24 show a high
accuracy of all four methods used to estimate parameters
on these data.
Using moment parameter estimation has some unpleasant
specifics in the case of the distribution of income and wage.
The moments of higher order including the moment
characteristic of skewness are very sensitive to inaccuracies on
0
20000
40000
60000
80000
100000
120000
140000
1992 1994 1996 1998 2000 2002 2004 2006 2008Year
Arithmetic mean (in CZK)
L-moment
Moment
Quantile
Maximum likelihood
Sample
Fig. 21 Development of sample average net annual income per
capita and the theoretical expected value (in CZK)
0
20000
40000
60000
80000
100000
120000
140000
1992 1994 1996 1998 2000 2002 2004 2006 2008Year
Median (in CZK)
L-moment
Moment
Quantile
Maximum likelihood
Sample
Fig. 22 Development of sample median of net annual income
per capita and the theoretical median (in CZK)
INTERNATIONAL JOURNAL OF MATHEMATICAL MODELS AND METHODS IN APPLIED SCIENCES
Issue 1, Volume 6, 2012 40

0
5000
10000
15000
20000
25000
30000
2002 2003 2004 2005 2006 2007 2008Year
Arithmetic mean (in CZK)
L-moment
Moment
Quantile
Maximum likelihood
Sample
Fig. 23 Development of sample average gross monthly wage
and the theoretical expected value (in CZK)
0
5000
10000
15000
20000
25000
2002 2003 2004 2005 2006 2007 2008Year
Median (in CZK)
L-moment
Moment
Quantile
Maximum likelihood
Sample
Fig. 24 Development of sample median of gross monthly wage
and the theoretical median (in (CZK)
Tab. 15 Sum of absolute deviations of the observed and
theoretical frequencies for all intervals − net annual household
income per capita
Method
Year
L-moment
Moment
Quantile Maximum
likelihood
1992 2,661.636 5,256.970 3,880.846 2,933.275
1996 5,996.435 15,673.846 9,677.446 7,181.322
2002 2,181.635 3,888.523 3,206.585 2,236.348
2005 1,158.556 2,261.200 1,331.944 1,237.170
2006 2,197.016 3,375.662 2,984.503 2,217.975
2007 2,359.258 3,654.637 2,995.680 2,585.448
2008 2,251.531 4,282.314 3,277.620 2,889.890
Tab. 16 Sum of absolute deviations of the observed and
theoretical frequencies for all intervals − gross monthly wage
Method
Year
L-moment
Moment
Quantile Maximum
likelihood
1992 134,846.633 314,497.134 292,479.483 289,279.267
1996 135,772.928 356,423.157 303,335.493 283,469.483
2002 252,042.801 357,087.483 335,019.202 295,900.939
2005 260,527.847 426,062.444 345,954.758 306,785.789
2006 277,661.535 448,632.374 372,420.681 357,828.202
2007 229,525.420 432,745.341 338,552.122 250,114.480
2008 255,510.389 441,371.539 372,924.579 289,621.287
Time Sequence Plot for Income_1stS-curve trend = exp(11,9932 + -1,55335 /t)
0 2 4 6 8 10
0
3
6
9
12
15
18(X 10000)
Inco
me_
1st
actualforecast95,0% limits
Fig. 25 The trend function in the development of the first
sample L-moment of net annual household income per capita
(forecasts: 133,122.0; 136,026.0)
Time Sequence Plot for Income_2ndS-curve trend = exp(10,626 + -1,65801 /t)
0 2 4 6 8 10
0
1
2
3
4
5(X 10000)
Inco
me_
2n
d
actualforecast95,0% limits
Fig. 26 The trend function in the development of the second
sample L-moment of net annual household income per capita
(forecasts: 33,482.6; 34,262.6)
Time Sequence Plot for Income_3rdS-curve trend = exp(9,49536 + -1,58932 /t)
0 2 4 6 8 10
0
3
6
9
12
15
18(X 1000)
Inco
me_
3rd
actualforecast95,0% limits
Fig. 27 The trend function in the development of the third
sample L-moment of net annual household income per capita
(forecasts: 10,901.9; 11,145.3)
Time Sequence Plot for Wage_1stQuadratic trend = 16879,3 + 631,353 t + 84,7654 t^2
0 2 4 6 8 10
17
20
23
26
29
32(X 1000)
Wag
e_1
st
actual
forecast
95,0% limits
Fig. 28 The trend function in the development of the first
sample L-moment of gross monthly wage
(forecasts: 27,355.1; 29,427.5)
INTERNATIONAL JOURNAL OF MATHEMATICAL MODELS AND METHODS IN APPLIED SCIENCES
Issue 1, Volume 6, 2012 41

Time Sequence Plot for Wage_2ndQuadratic trend = 4155,33 + 94,1457 t + 45,31 t^2
0 2 4 6 8 10
4200
6200
8200
10200
12200
Wag
e_2nd
actualforecast95,0% limits
Fig. 29 The trend function in the development of the second
sample L-moment of gross monthly wage
(forecasts: 7,808.34; 8,672.75)
Time Sequence Plot for Wage_3rdQuadratic trend = 1291,11 + -72,7498 t + 41,7531 t^2
0 2 4 6 8 10
0
1
2
3
4
5
6(X 1000)
Wag
e_3rd
actualforecast95,0% limits
Fig. 30 The trend function in the development of the third
sample L-moment of gross monthly wage
(forecasts: 3,381.31; 4,018.36)
Tab. 17 Extrapolations of sample L-moments
Set
Year
Sample L-moments
l1 l2 l3
Incom
e
2009 133,122 33,483 10,902
2010 136,026 34,263 11,145
Wage 2009 27,355 7,808 3,381
2010 29,428 8,673 4,018
Tab. 18 Extrapolations of parameter estimations of three-
parametric lognormal distribution obtained using the L-
moment method
Set
Year
Parameter estimation
µ σ2
θ
Incom
e
2009 11.176 0.467 42,913.996
2010 11.201 0.466 43,631.177
Wage 2009 9.247 0.864 11,384.492
2010 9.217 1.004 12,794.380
the both ends of the distribution. Registration errors, from
which these inaccuracies arise, are just typical for the survey
of income and wage. Moment method of parameter estimation
does not guarantee maximum efficiency of the estimation,
nevertheless it may not be a hindrance when working with the
income and wage distributions due to a usually high sample
size.
Tabs. 15 and 16 provide more accurate information about
the used methods of parameter estimation. These tables
contain the sum of absolute deviations of the observed and
Tab. 19 Extrapolations of the interval distribution of relative
frequencies (in %) of net annual household income per capita
for 2009 and 2010
Interval
Year
2009 2010
0
20,001
40,001
60,001
80,001
100,001
120,001
140,001
160,001
180,001
200,001
220,001
240,001
260,001
280,001
300,001
320,001
340,001
360,001
380,001
400,001
− 20,000
− 40,000
− 60,000
− 80,000
− 100,000
− 120,000
− 140,000
− 160,000
− 180,000
− 200,000
− 220,000
− 240,000
− 260,000
− 280,000
− 300,000
− 320,000
− 340,000
− 360,000
− 380,000
− 400,000
− ∞
0.00
0.00
1.82
15.07
20.27
17.29
12.89
9.19
6.47
4.56
3.24
2.32
1.68
1.23
0.91
0.68
0.51
0.39
0.30
0.25
0.93
0.00
0.00
1.42
13.88
19.82
17.37
13.16
9.49
6.75
4.79
3.42
2.47
1.80
1.32
0.98
0.74
0.56
0.42
0.33
0.26
1.02
Total 100.00 100.00
Tab. 20 Extrapolations of the interval distribution of relative
frequencies (in %) of gross monthly wage for 2009 and 2010
Interval
Year
2009 2010
0
5,001
10,001
15,001
20,001
25,001
30,001
35,001
40,001
45,001
50,001
55,001
60,001
65,001
70,001
75,001
80,001
85,001
90,001
95,001
100,001
− 5,000
− 10,000
− 15,000
− 20,000
− 25,000
− 30,000
− 35,000
− 40,000
− 45,000
− 50,000
− 55,000
− 60,000
− 65,000
− 70,000
− 75,000
− 80,000
− 85,000
− 90,000
− 95,000
− 100,000
− ∞
0.00
0.00
12.84
29.25
19.43
12.03
7.66
5.06
3.45
2.43
1.75
1.29
0.97
0.74
0.57
0.45
0.35
0.28
0.23
0.17
1.05
0.00
0.00
6.49
30.44
20.69
12.74
8.14
5.44
3.76
2.69
1.97
1.48
1.13
0.88
0.69
0.55
0.44
0.36
0.30
0.25
1.56
Total 100.000 100.000
INTERNATIONAL JOURNAL OF MATHEMATICAL MODELS AND METHODS IN APPLIED SCIENCES
Issue 1, Volume 6, 2012 42

0
5
10
15
20
25
1000
0
3000
0
5000
0
7000
0
9000
0
1100
00
1300
00
1500
00
1700
00
1900
00
2100
00
2300
00
2500
00
2700
00
2900
00
3100
00
3300
00
3500
00
3700
00
3900
00
Interval middle
Relative frequency (in %)
income 2009income 2010
Fig. 31 Extrapolations of the interval distribution of relative
frequencies (in %) of net annual household income per capita
for 2009 and 2010
0
5
10
15
20
25
30
35
2500
7500
1250
0
1750
0
2250
0
2750
0
3250
0
3750
0
4250
0
4750
0
5250
0
5750
0
6250
0
6750
0
7250
0
7750
0
8250
0
8750
0
9250
0
9750
0
Interval middle
Relative frequency (in %)
wage 2009wage 2010
Fig. 32 Extrapolations of the interval distribution of relative
frequencies (in %) of gross monthly wage for 2009 and 2010
theoretical frequencies for all intervals and therefore they
serve as an objective criterion for evaluating the accuracy
of used methods of parameter estimation. It should be noted
here that in the case of income distribution on the one hand,
and in the case of wage distribution on the other hand, we used
the same number of intervals, whose width is expanded in time
due to the rising level of the distributions. We can see from
Tabs. 15 and 16 that the method of L-moments provides the
most accurate results, which are even more accurate than
results obtained using the maximum likelihood method.
Already mentioned maximum likelihood method ended in the
terms of accuracy of the estimations as the second best.
Quantile method of parameter estimation follows as the third
best (second worst). As expected, moment method
of parameter estimation provides the least accurate results.
Values of test criterion (56) were also calculated for each
income distribution or for each wage distribution. As it was
mentioned, the tested hypothesis on the expected shape of the
distribution is rejected even at 1% significance level in the
case of each income or wage distribution. This situation is
caused by large sample sizes, with whom we work in the case
of income and wage distribution. Values of test criterion χ2 are
not therefore listed.
Interestingly in addition, Figs. 25 to 30 represent the trend
functions for the development of sample L-moments
in corresponding monitored periods, including their forecasts
for the years 2009 and 2010 in parentheses. Tab. 17 represents
the extrapolations of sample L-moments created on the basis
of the trend functions from Figs. 25 − 30. Table 18 shows the
extrapolations of parameter estimations of three-parametric
lognormal curves obtained using the L-moment method based
on the values from Table 17. Tabs. 19 and 20 and Figs. 31 and
32 show the extrapolations of income and wage distribution
for the years 2009 and 2010 based on the parameter values
from Table 18.
IV. CONCLUSION
Importance of lognormal curve as a model for the
empirical distribution is indisputable, and it has found
application in many areas from the sociology to astronomy.
Characteristic features of the process described by this model
are: successive appearances of interdependent factors;
tendency to develop in a geometric sequence; overgrowth
of random variability to the systematic variability −
differentiation. Incomes and wages are among the many
economic phenomena that lognormal model allows
to interpret, which is confirmed by numerous practical
experiences.
Three-parametric lognormal distribution (Johnson\s curve
of the type SL) was used in the modelling of incomes and
wages in this study. Various methods of parameter estimation
were used in estimating the parameters of this distribution −
moment method, quantile method, maximum likelihood
method and finally the method of L-moments. In the case
of small sample size, L-moment method usually provides
markedly more accurate results than other methods
of parameter estimation, including the maximum likelihood
method, see for example [5]. However, it appears that even
in the case of large samples tahat the L-moment method gives
more accurate results than the other methods of parameter
estimation (and again, including the maximum likelihood
method). When calculating the sum of the absolute deviations
of the observed and theoretical frequencies and also
in calculating the value of test criterion χ2, it showed that
inaccuracies arise especially at the both ends of the
distribution in the case of method of L-moment. If we
abstracted from inaccuracies on both ends of the distribution,
the results based on L-moment method would be much more
accurate compared to other methods of parameter estimation
in the case of large samples, too.
In addressing the question which method of parameter
estimation of three-parametric lognormal distribution is most
suitable, it was the high dependency of the value of χ2 criterion
due to the sample size. As it is usual with such a large sample
size, all tests led to the rejection of the null hypothesis on the
expected distribution. From the results it is clear that all four
used methods of parameter estimation yielded relatively
accurate results at such large samples, which were used in this
research and which are typical of the income and wage
distribution. Despite some differences in the accuracy
INTERNATIONAL JOURNAL OF MATHEMATICAL MODELS AND METHODS IN APPLIED SCIENCES
Issue 1, Volume 6, 2012 43

of parameter estimation methods used were discovered. As it is
evident from the outputs, the L-moment method gives again
the most accurate results of parameter estimation. The method
of maximum likelihood follows as the second most accurate.
Quantile method of parameter estimation follows and method
of moments has brought at least accurate results of parameter
estimation, as expected. Notwithstanding the foregoing, the
differences in accuracy between parameter estimation methods
used are not relatively too high in the case of such large
sample sizes, see outputs above.
REFERENCES
[1] J. Bartošová, “Logarithmic-Normal Model of Income Distribution in the
Czech Republic”, Austrian Journal of Statistics, vol. 35, no. 23, 2006,
pp. 215 − 222.
[2] D. Bílková, “Application of Lognormal Curves in Modelling of Wage
Distributions”, Journal of Applied Mathematics, vol. 1, no. 2, 2008, pp.
341 − 352.
[3] A.C. Cohen and J.B. Whitten, “Estimation in the Three-parameter
Lognormal Distribution”, Journal of American Statistical Association,
vol. 75, 1980, pp. 399 − 404.
[4] N.B. Guttman, “The Use of L-moments in the Determination
of Regional Precipitation Climates”, Journal of Climate, vol. 6, 1993,
pp. 2309 − 2325.
[5] J.R.M. Hosking, “L-moments: Analysis and Estimation of Distributions
Using Linear Combinations of Order Statistics”, Journal of the Royal
Statistical Society (Series B), vol. 52, no. 1, 1990, pp. 105 – 124.
[6] J. Kyselý and J. Picek, “Regional Growth Curves and Improved design
Value Estimates of Extreme Precipitation Events in the Czech
Republic”, Climate Research, vol. 33, 2007, pp. 243 – 255.
[7] I. Malá, “Conditional Distributions of Incomes and their
Characteristics”, in ISI 2011, Dublin, Ireland, 2011, pp. 1− 6.
[8] I. Malá, “Distribution of Incomes Per Capita of the Czech Households
from 2005 to 2008”, in Aplimat 2011 [CD-ROM], Bratislava, Slovakia,
2011, pp. 1583 − 1588.
[9] I. Malá, “Generalized Linear Model and Finite Mixture Distributions”,
in AMSE 2010 [CD-ROM], Demänovská Dolina, Slovakia, 2010, pp.
225 − 234.
[10] I. Malá, “L-momenty a jejich použití pro rozdělení příjmů domácností”,
in MSED 2010 [CD-ROM], Prague, Czech Republic, 2010, pp. 1 − 9.
[11] J.C. Smithers and R.E. Schulze, “A Methodology for the Estimation
of Short Duration Design Storms in South Africa Using a Regional
Approach Based on L-moments”, J. Hydrol., vol. 241, 2001, pp. 42 –
52.
[12] T.J. Ulrych, D.R. Velis, A.D. Woodbury and M.D. Sacchi, “L-moments
and C-moments”, Stoch. Environ. Res. Risk Asses, vol. 14, 2000, pp. 50
− 68.
[13] http://www.czso.cz/
[14] http://puzzle.heureka.cz
[15] http://search.seznam.cz/
INTERNATIONAL JOURNAL OF MATHEMATICAL MODELS AND METHODS IN APPLIED SCIENCES
Issue 1, Volume 6, 2012 44