Embed Size (px)
Citation preview

67
CHAPTER – III
LOCALE OF STUDY AND SOCIAL PROFILE OF
RESPONDENTSI. LOCALE OF STUDY
For the present study Patiala district of Punjab was
selected. The Patiala city was founded near about 1762 AD by
Ala Singh, the founder of Patiala state. Its name was compound
of two words "Patti" and "ala" meaning tract of domain of Ala.
This was the capital state of princely state of Patiala. Forming
the south-eastern part of state, it lies between 29°-49' and 76°-
54' east longitude. The Estate is also called Phulkian Estate
because Ala Singh was son of Phul Singh. In 1948, Patiala
became the capital of PEPSU (Patiala and East Punjab States
Union) which was merged with Punjab in the year 1966. The
neighbouring areas of Patiala district are Ambala district now in
(Haryana state) in the east, and Fatehgarh Sahib, Mohali,
Ludhiana in the north-east and Sangrur district in the south-
west.
Patiala is a city of gardens, palaces, and magnificent
buildings. The Pucca Fort with its Burj of Baba Ala Singh is the
principal palace of historical interest. The mud wall which
surrounded the city was demolished in 1935 Bikrimi but quite
a number of gates with various names still stand. The Fort now
house a number of offices, the state 'Museum'. Another
historical place is Gurudwara Dukhniwaran Sahib which is
associated with the ninth Guru of Sikhs, Shri Guru Teg
Bahadur. The Baradari Gardens is another attraction of the
city. The Baradari Palace, the Rajendra Gymkhana Club, the
Mahendra Maharani Club and Rest House are all important

68
buildings situated within the Baradari Gardens. The other
buildings of Princely City worth mentioning in the city are the
Yadvindra Stadium, the Army Headquarters and the Old Moti
Bagh Palace, which now houses Netalji Subhash National
Institute of Sports. The temple of 'Kali Devi' is an important
place of worship in the city. The city is known for its works of
Gota, Kanari, Zari and Sitara for the manufacture of silk,
Azardands and Parandas. Its main industries are across the
railway station.
Patiala is an important educational centre. There are
number of colleges like Mahendra College, Government College
for Girls, Bikram College of Commerce, Prof. Gursewak Singh,
College of Physical Education, State College of Education,
Khalsa College, Multani Mal Modi College, Gurmat College,
Government Medical College, Dental College, Thapar University
of Engineering and Technology, Ayruvedic College etc. and a
university which is known as Punjabi University Patiala, which
is situated on the Patiala-Rajpura road. Another new university
named Rajiv Gandhi Law Universities situated in the Choti
Baradari. There are so many junior and senior model schools in
the Patiala city. The city also has Headquarters of Punjab State
Electricity Board, State Bank of Patiala, Pollution Control Board
of Punjab and Central State Library is situated on the Mall
Road in Patiala city. The city was expanded after independence
a number of new colonies like Model Town, Phulkian Enclave,
Urban Estate, Sanctuary Enclave, Majithia Enclave, Preet
Nagar, Anand Nagar, Raghbir Nagar, Ghuman Nagar, Partap
Nagar, Badungar, Deep Nagar, Prem Nagar, Deshmesh Nagar,
Officers Colony, S.S.T. Nagar, Mathura Colony, Blossom
Enclave, D.C.W. Colony, Power Colony, Bachittar Nagar, Ajit

69
Nagar, Passy Road, Bhupindra Nagar, Punjabi Bagh, Mansahia
Colony, Bank Colony, Rajpura Colony, Guru Nanak Nagar,
Bishan Nagar, Gurbax Colony, Malwa Colony, Kesar Bagh, Tej
Bagh Colony, Harinder Nagar, Tripuri, Raghomajra, etc. have
come up.
II. SOCIAL PROFILE OF RESPONDENTS
In social research, it is not only important but equally
essential to explain the social profile of the respondents,
because they have an important bearing on the attitudes,
behavior and activities of the individuals. Men belonging to
different socio-economic background are likely to perceive
various social aspects differently; their behavior is bound to be
different. The information of the background of respondents is
essential for the further analysis of the data which is collected
and presented in the ensuing chapters. The special
characteristics of the respondents such as age, sex, caste,
religion, education, occupation, income, marital status, type of
family, educational score of the family, etc. are to be discuss in
order to know the truth or their exact social profile. These
features are discussed below:
1. Age
We are fully aware that the factor of age is a matter of
universal concern. It is significant to find out the age
distribution of division of respondents of our sample. In order to
get a clear picture or idea, the entire sample has been classified
into three broad categories. The first category includes
respondents from the age 20 to 40 years; the second, category
includes respondents from the age of 41 to 60 years; and the
third one includes respondents above the age 61 years. The
distribution the respondents in these three age categories are
shown in the Table 3.1.

70
Table 3.1
Distribution of the respondents according to their age
categories
Age Frequency Percentage
20 to 40 years 187 65.15
41 to 60 years 84 29.25
61 years & above 16 5.60
Total 287 100.00
The above table clearly shows that a vast majority of the
respondents were quite young at the time of data collection.
Further as shown in the given table, it becomes clear that the
majority of respondents are placed in the age category of 20 to
40 years of age i.e. 65.15 percent of the total sample taken;
secondly the 29.26% respondents were placed in the second
category i.e. 41 to 60 years and rest 5.6% belongs to the third
category i.e. above 61 years of age.
2. Sex
The sex structure is the second characteristic of the
respondents. The proportion/ ratio of males and females race
constitute their sex structure, is absolutely true that the
human is composed of two types of beings i.e. male and female.
And, it is one of the fundamental facts of life. It is a fact that at
the very first glance, it may seem obvious to mention this fact
that, yet it is often ignored or overlooked in our efforts to raise
the plane of satisfaction in living, Out of this fact of sexual
dimorphism (two forms) grows much of the world's beauty in
art, literature, drama, and human relations. Out of it, also grow
some of life's most tiring problems, bitterest disappointments,
deepest/serious hurts, and most distasteful ugliness. Human

71
beings can choose to utilize the potentialities of sexual
difference as one of the most fruitful means of overcoming the
essential loneliness in the individual life, or instead of
establishing meaningful and enduring relationship- they can
choose to use sexual difference to widen the gulf between self
and others. There is no wider gulf between one individual and
the other than that created when one considers the other a
material thing. Sexual difference is one of the inescapable
which everyone must face and to which everyone must in some
way orient himself. Members of the opposite sex, with their
attributes, their roles, and their expectation are part of the
environment in response to which personality develops. Each of
these two types of beings male and female, must in some way
take into account the existence of the others (Bowman 1974) He
wants that both must respect each other. The table given below
shows the data regarding the sex composition of the
respondents related to the present study.
Table 3.2
Distribution of respondents according to their sex
Sex Frequency Percentage
Male 179 62.4
Female 108 37.6
Total 287 100.00
The above table establishes that majority of the
respondents were males that comes to 62.4% and females were
37.6%. The table also reveals that a large majority of the
respondents came forward were males. This may be due to the
fact that when male members are at home, the women hesitate
to respond. 108 females who respond were not scare of their

72
better half because they were not at home at the time of
researcher visits to their house.
3. Caste
Caste too has been considered as an important factor for
social stratification (Ghurye. 1961, D'Souza, 1972). According
to these studies the status and role of the members in Indian
society are influenced by their respective castes to which they
belong.
The caste system is a very deep rooted and mighty
institution in the Indian society. It has important impact on all
other institutions such as social, economic, political, religious
and also educational. As caste system is very powerful in all
aspects of life, therefore, it was considered essential to collect
information about the caste background of the respondents.
This information was necessary because one of the hypotheses
of the present study is that caste background of an individual is
likely to influence/ his /her performance in all works, of life.
Srinivas has dealt with the concept of ritual status as the
determinant of caste in a little more analytical way. He
describes caste system as consisting of groups which are also
autonomous communities, but are united in a hierarchy. When
he states time it brings that community into relation with
numerous other communities all going to form a hierarchy"
(Srinivas 1952, 31). But according to him, the caste hierarchy is
a unique one, as it is based on the concept of ritual status that,
"caste guarantees autonomy to a community, and at the same.
This concept is absolutely fundamental to the system, and
along with the concepts of Karma and Dharma, it contributes to
make caste the unique institution; it is, "The caste system is
present both among the Sikhs and Hindus and even in the

73
Muslims, though this segment of he society, being in quite
minority has not been included in the present study. However,
reference to their existence in various regions of the Punjab is
very essential. This community is also not free from the caste
taboos.
In the present study the castes have categorized according
to traditional occupations linked to various castes groups.
Therefore, here it is pertinent as well as worth mentioning that
the present study clearly shows that the Jats and Kambojs, etc.
have been placed in the category of agricultural castes, Khatri,
Verma, Aggarwal, Gupta Arora, Sodhi, Walia, etc. all are placed
the category of commercial castes; Brahmins in priestly castes;
Barbers (Nai), Washerman (Dhobi), Ramadasia, Sweepers,
Mahjbi Sikhs in Backward and Schedules Castes respectively
stated above, the category which includes Muslims and
Christians in not applicable in the present study. Respondents
according to the above mentioned categories is shown in table
given below.
Table 3.3
Distribution of the respondents according to their caste
category
Caste Frequency PercentageAgricultural caste 65 22.7Commercial caste 98 34.2Priestly cast 47 16.40Backward caste 25 8.7Schedules caste 45 15.6Not applicable 7 2.4Total 287 100.00

74
Therefore the distribution of the respondents in the
preceding table shows that a higher number of respondents fall
in the category of commercial caste followed by agricultural
castes. If the categories of commercial and priestly castes are
clubbed the Hindu Castes will comprise almost half of the
sample. In the present study 15.6% and mentioned that they
belong to scheduled castes while only 8.7% mentioned that they
belong to Backward caste category. Only 2.4% fall in the
category of Not-applicable
4. Religion
'Religion' when we utter the word as soft and delicate
feeling comes to our mind because directly or indirectly, it
makes us attached to God. It is a mean to join the distorted
hearts together. Religion in one of the oldest serving social
institutions of humanity. It appears to be peculiar to only
human beings, no other specious of the world living in groups
or an organized society has anything similar to religion. It is
one of the most important facets of human being viz. birth,
education, marriage, death, etc. It is very sensitive and private
matter of human life, touches every temporal aspect of social
and cultural life of human. No one can bear even a very healthy
criticism of his/her religion. As Karl Marx says, 'religion is the
opium for the masses' an individuals' attitudes, beliefs, faith
and action pattern are considered to be influenced by the
religion to which the individual is attached. According the
Census Report of 2001 that is, the total population of Punjab is
2458999 and the household population by religion 14592385
(59.91%) in Punjab belong to Sikhs, the number of Hindus are
8997942 (36.94%) and Muslims are 300000 (1.57%). However,
other religious groups living in Punjab are Christians, their

75
number is 292800 (1.20%), Buddhists are 41487 (0.17%), Jains
are 39256 (0.16%) and others are 8494 (0.04%). But
particularly in the Patiala district of Punjab the majority of the
population belongs to the Sikhs. They constitute 56% whereas
the Hindus are 42% of the total population of Patiala, according
to the Punjab Census Report, 2001. The proportion of the
religious affiliation of the respondents in the presents study is
given in the table cited below:
Table 3.4
Distribution of respondents according to their religious
affiliation
Religion Frequency Percentage
Sikhs 160 55.8
Hindus 120 41.8
Others 7 2.4
Total 287 100.00
The data presented in the foregoing table reveals that the
distribution of the respondents according to their religion
shows that majority of the respondents i.e. 55.8 percent belong
to the Sikh religion and 41.81 percent belong to the Hindu
religion of the total sample taken. Only 24 percent fall in the
category of other which includes Christians and Muslims.
5. Education
Education is considered as a very important factor in
present day society. Education induces not simple changes
rather brings absolute transformation in attitude of the
individuals and helps in modernizing values. As Sheppard
stated, Education of course may affect the individual's chances

76
for bringing in a given occupation, which in turn predetermines
other life chances, including health, status and job security
(Sheppard 1976).
The educational level of respondents has been classified
into four major categories-uneducated upto middle and
secondary, higher secondary & graduates and postgraduate and
professionals. Here especially note should be taken that at
present more emphasis have been given on the technical and
professional education. It may be substantiated by the fact that
large numbers of such institutions have been established by the
private agencies to deliver this kind of education. The interest of
the young scholars is lessening day by day in the subject of
social sciences. The distribution of the respondents has been
shown in the table given below.
Table 3.5
Distribution of respondents to according to their education
Education Frequency Percentage
Uneducated 56 19.52
Upto Middle and Secondary 30 90.45
Higher Secondary & Graduates 69 24.4
Post Graduate & Professionals 132 45.99
Total 287 100.00
The distribution of the respondents in the table given
above clearly indicates that 45.9 percent respondents were well
qualified followed by 24.01 percent who were higher secondary
Graduates. While 19.51 percent were totally uneducated and
only 10.4 percent were educated upto middle class. If the data
of first two categories is clubbed, then it becomes clear that

77
19.9 percent of respondents were educated at the low level and
20.04 percent upto middle level and the remaining are highly
educated. This level of education may affect in the
environmental degradation differently. This kind of poor
percentage of the literate may prove differently. This kind of
poor percentage of the literate may prove harmful for the rising
buds in city Patiala which may not help in the overall
development of individuals and the city.
6. Occupation
It serves as an indicator of socio-economic status and
stature of the family. It affects life style behavior, conduct and
even morale as well as one's roles in society. Varying degree of
honour and prestige is attached with each occupation. The
occupational status of the respondents has been classified into
four broad categories such as Agriculture, Business service and
Labour class. The distribution of the respondents according to
the type of their occupation has been shown in the following
table. However a few categories have not been included because
the respondents were not available of this category to the
scholar, despite her best efforts.
Table 3.6
Distribution of respondents to according to their
occupation
Occupation Frequency Percentage
Agriculture 46 16.02
Business class 82 28.51
Service class 117 40.76
Households 18 6.27
Daily wages and labour 24 8.36
Total 287 100.00

78
The distribution of the respondents in the Table 3.6
clearly indicates that 16.02 percent of the respondents engaged
in the agriculture, 28.51 percent of the respondents engaged in
business, 40.76 percent engaged in service, 6.27 percent
engaged in household work and only 8.36 percent of the
respondents engaged in daily wages and labour class.
7. Income
In the present day materialistic word economic condition
of an individual or the family plays an important role in getting
higher education or achieving social status. In the present
study the respondents have been divided into four categories
relating to their income. The first group constitute of those
whose monthly income is less than Rs. 10000 per month; the
second category is with income Rs. 10000 to Rs. 20,000; the
third with income of above Rs. 20000. There were some
respondents who mentioned that they do not have any income
of their own. They are included in the category of not
applicable. This category included the housewives, the young
children below the age of 18 years etc. The distribution of the
respondents in this regard is presented in the form of a table
given below:
Table 3.7
Distribution of respondents according to their income
Monthly Income Frequency Percentage
Less than Rs. 10,000 72 25.08
Rs. 10001-20000 136 47.38
Above Rs. 20,000 62 21.62
Not applicable 17 5.92
Total 287 100.00
79
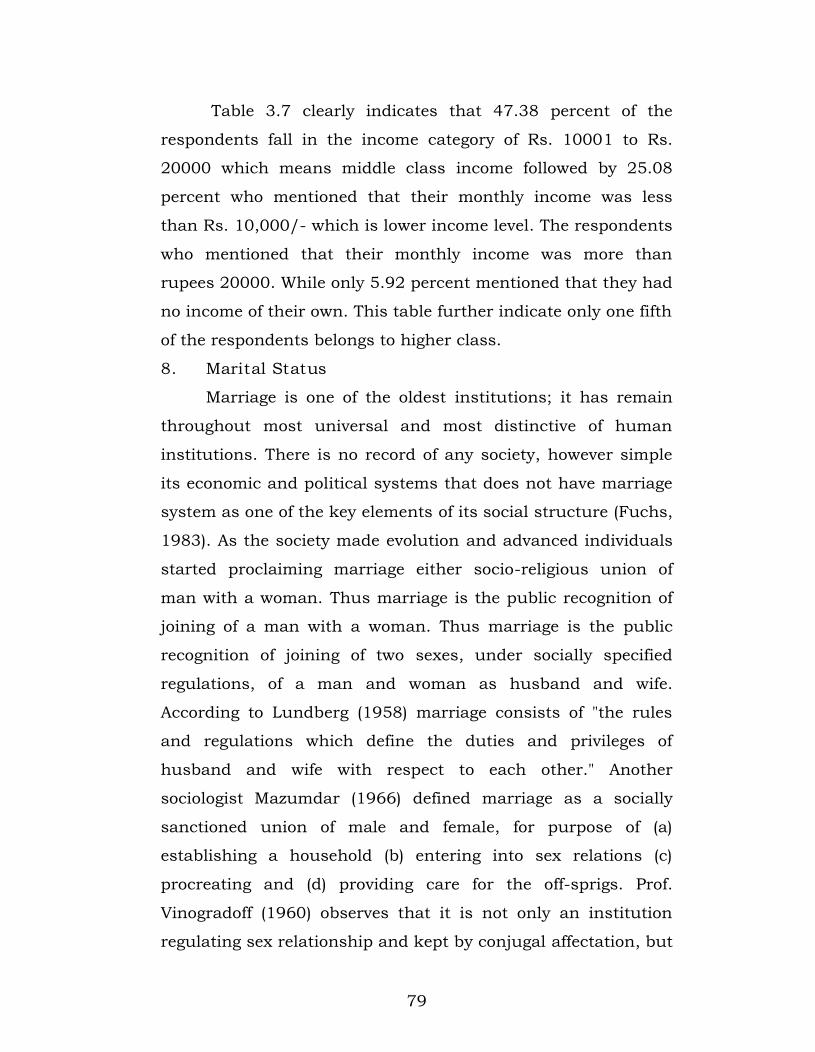
Table 3.7 clearly indicates that 47.38 percent of the
respondents fall in the income category of Rs. 10001 to Rs.
20000 which means middle class income followed by 25.08
percent who mentioned that their monthly income was less
than Rs. 10,000/- which is lower income level. The respondents
who mentioned that their monthly income was more than
rupees 20000. While only 5.92 percent mentioned that they had
no income of their own. This table further indicate only one fifth
of the respondents belongs to higher class.
8. Marital Status
Marriage is one of the oldest institutions; it has remain
throughout most universal and most distinctive of human
institutions. There is no record of any society, however simple
its economic and political systems that does not have marriage
system as one of the key elements of its social structure (Fuchs,
1983). As the society made evolution and advanced individuals
started proclaiming marriage either socio-religious union of
man with a woman. Thus marriage is the public recognition of
joining of a man with a woman. Thus marriage is the public
recognition of joining of two sexes, under socially specified
regulations, of a man and woman as husband and wife.
According to Lundberg (1958) marriage consists of "the rules
and regulations which define the duties and privileges of
husband and wife with respect to each other." Another
sociologist Mazumdar (1966) defined marriage as a socially
sanctioned union of male and female, for purpose of (a)
establishing a household (b) entering into sex relations (c)
procreating and (d) providing care for the off-sprigs. Prof.
Vinogradoff (1960) observes that it is not only an institution
regulating sex relationship and kept by conjugal affectation, but

80
also an arrangement for bringing up of children and a
partnership for economic ends and social co-operation. In the
present study the respondents have been classified into three
categories, that is, married, widow/widower and unmarried.
The following table presents the distribution of the respondents
on the basis of their marital status.
Table 3.8
Distribution of respondents according to their marital
status
Marital status Frequency Percentage
Married 160 55.74
Unmarried 100 38.84
Widow/Widower 27 9.42
Total 287 100.00
The above table indicates that more than half of the
respondents that constitutes 55.74 percent fall in the category
of married. While another good proportion of the respondents
mentioned that they were still un-married. Only 27 respondents
i.e. 9.42 percent fall in the category of widows/widowers.
9. Type of Family
Family is the most significant instituting in the
socialization process of the individual. Moreover, the family
ascribes an initial status to the individual prior to his achieving
status on his own. In India can find various types of families.
However, for the present study the classification of families as
given by Morrison (1959).He mentioned three major categories
of family i.e. the nuclear, quasi-joint by taking the conjugal pair
as a basic unit. Accordingly, the nuclear family consists of one
conjugal pair with or without other relations and the joint

81
families consists of two or more conjugal pairs with or without
other relatives and further if the husbands in the two parties
are related as father and son, this type of family has been
termed as quasi-joint by Morison. Classification of Morrison
has-been followed in present study because of its suitability for
empirical research. The type of family in which an individual
lives has significant influence on his personal joint life. The
distribution in this regard is presented in the following table:
Table 3.9
Distribution of the respondents according to type of family
Family Type Frequency Percentage
Nuclear 156 54.36
Quasi-joint 82 28.57
Joint 49 17.07
Total 287 100.00
It is evident from the above given table that a large
proportion of the respondents that is 54.36 percent were living
in the nuclear families and 28.57 percent were living in quasi-
joint families, while only 17.07 percent were living in joint
families. This indicates that the traditional joint family is
breading sharply in the urban areas and made a continuum
like joint family, quasi joint family and nuclear family.
10. Educational Score of the Family
Before we discuss the educational status and stature of
the family it will be useful if the development and spread of
education is very briefly narrated here because this will make
the things more clear that the development of education has

82
definitely help each and every family to acquire more education
and raise their living standards as well as their mental eye-cue.
In the present study, educational score of the family has
also been taken into account. The educational score of the
family can also be good indicator regarding the general
background of the family, its status and living style. Due to the
availability of various educational institutions in the city has
more influence of the individuals which opens various channels
for earnings. This study shows that majority of the respondents
are highly educated in Patiala. Accordingly, it is decided to
assign educational score to each family with reference to the
number of educated persons in the family. Average educational
score for each family was worked out and the score classified
into three broad categories. These educational score categories
were upto 10(low), 11-20 (middle) and above 20(High). Table
3.10 will show the distribution of families according to their
educational scores.
Table 3.10
Distribution of families according to their educational score
Educational score Frequency Percentage
Upto 10 (Low) 45 15.69
11-20 (Medium) 41 14.2
Above 20 (High) 201 7.03
Total 287 100.00
The data given in the above table shows that on
overwhelming majority of the respondents families came under
the last category i.e. above 20 which come in a higher
educational score of the families consisting of

83
11. Type of House
House is dwelling it serves as a living place for one or
more families. The nature of the atmosphere in the house where
people live has a profound effect not only on their physical
health but also on their mind. It was therefore, becomes
essential to get details of the houses in which the respondents
were living. The type of houses were devised into three main
categories i.e. Kacha, Pucca & Semi Pucca houses. Their
responses in this regard are vividly shown in the following
table.
Table 3.11
Distribution of respondents according to type of their house
Types of house Frequency Percentage
Kacha 6 2.09
Pucca 271 94.43
Semi Pucca 10 3.48
Total 287 100.00
The table given above reveals that the majority of them
were living in Pucca houses. This may be due to the growth of
urbanization. In cities people are more aware about the type of
house they are living in. It plays a vital role in determining the
living standard of the people in a particular area. It was observe
that every respondent whose income is even less than Rs.
10000 also live in Pucca house. Even in rural area one can see
Pucca houses. This change is due to the growth of urban
centers. In the present study we can safely say that very few
respondents were living in Kacha and Semi Pucca houses. They
were those who were doing labour and had not much wealth
and the property. It is worth mentioning here that a large

84
number of them live in slum areas. These respondents faced
certain difficulties due to their Kacha houses and kacha floor
like dust nuisance of rats dampness and heaps of waste near
there houses. However, despite of those problems many of them
could not afford to get the floors plastered. They were also
asked to mention the frequency of cleaning the floors, which
had Pucca or plastered floors were cleaning daily with
detergents and other cleaners and periodical readjustments
have been made. But those who have Kacha floors mentioned
that they clean the floor with cow dung weekly or fortnightly. It
was found that very few of them change their kacha floors with
pucca one. It was also noticed that most of them clean the
floors of their houses once in a month. This shows that they
were aware of the necessity of keeping their houses clean.
Moreover, it is found that most of the respondents who were
having Pucca houses got their houses whitewashed after two or
three years. This shows that most of the respondents were
aware to keep their house atmosphere should remain hygienic
to make their life smooth and jovial.
Those respondents who have pacca houses further
mentioned that they were also aware about the ventilation of
their houses. They know about the advantage of windows and
ventilators. Only those who did not only have pucca houses
were not aware. This may be due to their poor economic
conditions. The respondents were also asked whether sunlight
passes through their houses. Even they know the importance of
sunlight. They mentioned that sunlight is not only useful for
health, rather it is essential for purifying the air and also for
removal of dampness, the elimination of mosquitoes, flies, and
many other kind of insects.

85
Further the respondents were asked to mention that
whether they have a separate kitchen or not because the
women folk have to spend most of their time in the kitchen. So,
it is therefore, considered of some interest to find out how many
houses had separate kitchen.
Table 3.12
Distribution of respondent according to the type of their
kitchen
Whether kitchen separate Frequency Percentage
Yes 271 94.43
No 16 5.57
Total 287 100.00
The table given above shows that a vast majority of the
respondents have separate kitchen in their houses. It is found
that the respondents who have pucca houses had separate
kitchens. But who had semi pucca house and kaccha houses
did not have separate kitchen because they could not afford to
build a separate kitchen. Most of them made their kitchen in
the courtyard which is open and commonly called (Chaunka),
which had no roof and made their kitchen temporarily.
Further the respondents asked to mention that what kind
of fuel they use in the kitchen. Because it is a matter of concern
that if they use such kind of fuels which are harmful to their
health and environment. Their responses are given in the Table
3.13.

86
Table 3.13
Distribution of respondents according to the type of fuel
they use
Type of fuel Frequency Percentage
LPG 257 89.54
Cow dung cakes & wood 18 6.27
Kerosene oil 12 4.19
Total 287 100.00
The table given above reveals that majority of respondents
were using LPG in their kitchen. Only 6.27 percent of the
respondent mentioned that they were using wood and cow dung
cakes in their "Chaunka". Only 4.19 percent were using
kerosene oil. If we club these two categories, that constitute
10.46% of the total sample. Who were either poor they
mentioned that they did not afford LPG because it is very
expensive and they have to use such type of fuels which is
cheaper and harmful for their health. Some of them mentioned
that sometime they feel suffocation because of the smoke. This
indicates that though their number is small but they are
degrading the environment in a bigger way.
After that the respondent were asked to mention where
they dump the domestic waste. According to Laurent Hodges
that the domestic wastes in urban areas must also be
considered. Generally the waste waters are disposed of in the
ground through the use of pit privies, cesspools, or septic
tanks, some times the absorptive capacity of the soil is
inadequate for proper disposal. The main concern is to prevent
contamination of ground water supplies (Laurent Hodges). To
analyze the data wastage is categorize in three broad categories

87
i.e. solid waste, raw waste and liquid waste. Solid waste
consists plastic, polythene, kitchen waste etc. Raw waste
consist wood husk, burning of leaves, cow dung cake's husk
etc. Liquid waste consist kitchen liquid waste, dying liquid
water, industrial liquid waste etc.
Table 3.14
Distribution of respondents according to dumping the
wastage near the house or not
Dumping of wastage near the
house
Frequency Percentage
Solid Waste 185 64.45
Raw Waste 80 27.87
Liquid Waste 22 7.68
Total 287 100.00
The table given above depicts that most of the
respondents keep the wastage from their houses or from other
activities of their house, some respondents hesitatingly
mentioned that they use dustbins to keep the waste but throws
this dustbin near to the house or in the remote corner of the
area. Some respondents mentioned that they use polybags and
throw on roadside or near the house. In the same way they
used to do with raw material from their house like when they
cut the grass of their lawns and the dead leaves they used to
throw this kind of raw material near their house and the stray
cattle eat that grass, and it is harmful for them because they
use pesticides in their lawns. This reveals that the people were
aware about the harms from the wastage but do not bother
about it and do not bother about environment. They used to
clean their house only but not their outskirts and near by

88
place. It is really shocking to note that there are some who
throw their wastage from windows and roofs in the streets and
the vacant plots. This kinds of the solid waste comprising many
harmful chemicals. The people who were running small scales
industry at their homes like dairy, dying, shoe making, poultry
like to make jaggary (Gachak) etc. always used drains for
disposal of their liquid waste. One of the respondent who was a
resident of Mohindra Colony had a small industry of making
Rewari and Gachak mentioned that he use to dispose the liquid
waste in the drain adjacent to his house. In the same manner
who had dairies dying work, Poultry etc. at their home have no
such facilities to dispose the waste, so they used drains which
chokes the drains. And people used to throw the dead leaves in
the vacant land and burn it which causes smoke which
contributes a lot in environmental degradation.
Further the researcher asked the respondents to mention
that is their any open roadside toilets near to your house or
adjoining to your house. The table given below shows that how
many respondents had open toilets near to their house.
Table 3.15
Distribution of the respondents according to their response
about the roadside open toilets near to the houses
Toilets near the houseRoadside open
toilets Yes No
Total
Near the house 92 (48.67)
(74.19)
97 (51.32)
(59.50)
189 (65.85)
Adjoining the
house
32 (32.65)
(25.80)
66 (67.34)
(40.49)
98 (34.15)
Total 124 (43.20) 163 (56.79) 287 (100.00)

89
The preceding table depicts that about 43.20 percent of
the respondents had near or adjoining the open toilets to their
houses. The respondents further mentioned that they had a big
problem from that open toilets because there was no
cleanliness and that toilets are stinking. Respondents also
mentioned that Municipal Corporation is responsible for it.
There is no sweeper or toilet cleaner appoint to clean that
toilets. Respondents said that the stinking smell from that open
toilets harmful their health and environment. They also
mentioned that flies and mosquitoes and some insects come
from there and which prove very harmful for them.
The researcher further asked to mention that have they
proper sanitation facilities or not, because in Patiala city some
colonies are unplanned like Bains colony near Bhadson Road,
Ranjit Nagar, Adarash Colony etc. These colonies don’t' have
sewerage system. Sivarama Krishana stated in his study that as
for consumption, 300 million people in India have no access to
safe drinking water, while 700 million people have no access to
elementary sanitation (Sivarana Krishana). Even it can be said
that if people don’t have sanitation facility at their home they
used to go their excreta disposal on roads, near the public
places, gardens etc. The poor people who don’t have basic
amentias like toilets mostly used roads, railways tracks for
excreta disposal. The distribution of the respondent in this
regard is presented in the Table 3.16.

90
Table 3.16
Distribution of the respondents whether they have
sanitation facilities
Whether the sanitation facilities at
their house
Frequency Percentage
Yes 220 76.65
No 67 23.35
Total 287 100.00
The table given above reveals that majority of the
respondents has sanitation facilities. But at the same time they
also mentioned that they have a sanitation facility but it is not
properly maintained by Municipal Corporation. They mentioned
that the sewerage pipes are frequently blocked because the size
of the popes is small and they can not bear the load. In the
rainy season the sewerage gutters used to blocked and
overflowing when it rains and the stinking smell occurs which
causes environmental degradation. The respondents who
mentioned that they had not proper sanitation facilities. They
said that the Municipal Corporation is responsible for it,
because it does not bother about their sanitation facilities. They
also mentioned that they use pits for toilets disposal.
Sometimes they made drain for the disposal of water from
kitchen, bathing, washing etc. This toxic water is quite
dangerous and harmful for environment and it too degrades the
ground water quality.

91
References
Fuchs, V.R. (1983) How We Live, Cambridge MA: Harvard
University Press, pp.23-24.
Geeta, “A Critical Analysis of Offences Relating to Religion in
India”, LL.M. Dissertation (unpublished), pp.1-3.
Henry A. Bowman (1974) Marriage for Moderns, United States of
America: Library of Congress Cataloging in Publication
Dart, pp.1-3.
Lundberg (1958) Lundberg on Sociology, New Delhi: Harper and
Bros., pp.13-14.
Mazumdar (1966) Grammar of Sociology, Asia Publishing
House, pp.1-3.
Punjab Census Handbook, No. 18, Patiala District, 2001.
Srinivas, M.N. (1952) Religion and Society among the Coorgs of
South India, Oxford: Oxford University Press, pp.135-185.