Embed Size (px)
Citation preview

International Journal of Multidisciplinary Approach
and Studies ISSN NO:: 2348 – 537X
Volume 03, No.1, Jan - Feb 2016
Pag
e : 2
37
Socio-Economic Profile of the Respondents in Retail Sector
(A Case Study of Selected Retail Establishments in
Visakhapatnam City)
Prof. D.M. Sheaba Rani
Department of Commerce and Management Studies, Andhra University, Visakhapatnam, Andhra Pradesh
ABSTRACT:
The retail industry is one of the biggest employers in the world. In India, it is second largest
employment provider after agriculture. The retail sector has been growing very fast with
several national and international associations. Even the large scale business enterprises
have also been entering into retailing activity. An attempt has been made in this paper to
study about socio-economic profile of the respondents in selected retail establishments in
Visakhapatnam city. The results show that majority of the respondents belonging to the age
group of 20-29 years and belonging to Hindu religion. The size of the family is small with one
or two children. About 45.6 per cent of the total sample respondents are migrants and they
migrated in search of livelihood. The household income and expenditure of general business
respondents is high followed by electronics and electrical and textiles. As far as the financial
position is concerned most of them are at comfortable level because they are residing in
small rented houses without any comforts. The permanent settled families are having more
assets than temporary migrants. Due to low wages and weak financial position of the
respondents made them to borrow money to meet their requirements.
Key words: retail industry, establishments, general business, electronics and electrical,
textiles, jewellery.
PRELUDE:
In recent years, there has been a sea change in the employment scenario all over the globe.
The retail industry is one of the biggest employers in the world. In India, it is second largest
employment provider after agriculture. The retail sector has been growing very fast with
several national and international associations. Even the large scale business enterprises have
also been entering into retailing activity. They have provided employment to millions and it
is expected that these enterprises will generate more number of jobs in the future.
India‟s retail sector is wearing new clothes and with a three-year compounded annual growth
rate of 46.64 per cent, retail is the fastest growing sector in the Indian economy. Traditional
markets are making way for new formats such as departmental stores, hypermarkets,
supermarkets and specialty stores. Western-style malls have begun appearing in metros and
second-rung cities alike, introducing the Indian consumer to an unparalleled shopping
experience.

International Journal of Multidisciplinary Approach
and Studies ISSN NO:: 2348 – 537X
Volume 03, No.1, Jan - Feb 2016
Pag
e : 2
38
OBJECTIVE OF THE STUDY:
To study about the socio economic dimensions of the employees in the retail establishments
in Visakhapatnam city.
HYPOTHESIS:
1. There is no significant association between gender and working category of the
respondents.
2. Migration status has no significant impact due to working category of the respondents
RESEARCH METHODOLOGY:
The study is designed as a descriptive case study based on primary and secondary data. The
presents study has been undertaken in selected retail establishments in Visakhapatnam city.
Questionnaire method has been used.
SELECTION OF SAMPLE:
The study has taken into consideration employees in the broad line of commercial activity,
namely shops in general business, textiles, jewellery and electronics and electrical. The
employees working in these establishments are designated as sales girls and salesmen. The
sample is drawn from the shops which are spread over in all eight circles (Suryabagh,
Kurupam market, Dwaraka Nagar, Gajuwaka, Anakapalli, Steel Plant, China Waltair,
Dabagardens) as notified by the commercial tax office of Visakhapatnam city. In total 180
shop which include 103 general business shops, 15 textile shops, 15 jewellery shops and 47
electronics and electrical shops have been chosen by using proportionate stratified random
sampling technique. Keeping in view of the objectives of the study the shops which have
been employing both male and female employees are brought under the preview of the study.
STATISTICAL TOOLS USED:
The primary data have been interpreted with the help of simple statistical tools such as
Simple percentages, ranking method; Chi-square test of significance is administered to know
the association between different variables in the questionnaire with different categories of
shops.
At the outset an attempt is made in this paper to discuss the socio economic profile of the
selected respondents in Visakhapatnam city. It mostly covered, age of the respondents,
gender wise classification of the respondents, social status, marital status, educational status,
household composition, size of the family, family structure, migration, purpose of migration,
families‟ financial position, expenditure, assets, indebtedness and sources of liability of the
respondents.
DATA ANALYSIS AND INTERPRETATION:
A. Personal Data:
1. Age of the respondents:
Productivity is said to be a function of age. During youth, achievement level of productivity
at workplace is naturally high. In other words as age advances, normally, productivity per
person decreases and vice-versa.
International Journal of Multidisciplinary Approach
and Studies ISSN NO:: 2348 – 537X
Volume 03, No.1, Jan - Feb 2016
Pag
e : 2
39
Table 1 Age of the respondents
Category Age (in years)
Below 20 20-29 30-39 40-49 Above 50 Total
General 13
(4.2)
216
(69.7)
40
(12.9)
38
(12.3)
3
(1.0)
310
(100.0)
Textiles 2
(4.4)
21
(46.7)
11
(24.4)
6
(13.3)
5
(11.1)
45
(100.0)
Jewellery 0
(0.0)
6
(13.3)
18
(40.0)
19
(42.2)
2
(4.4)
45
(100.0)
Electronics &
Electricals
3
(2.1)
66
(47.1)
38
(27.1)
29
(20.7)
4
(2.9)
140
(100.0)
Total 18
(3.3)
309
(57.2)
107
(19.8)
92
(17.0)
14
(2.6)
540
(100.0)
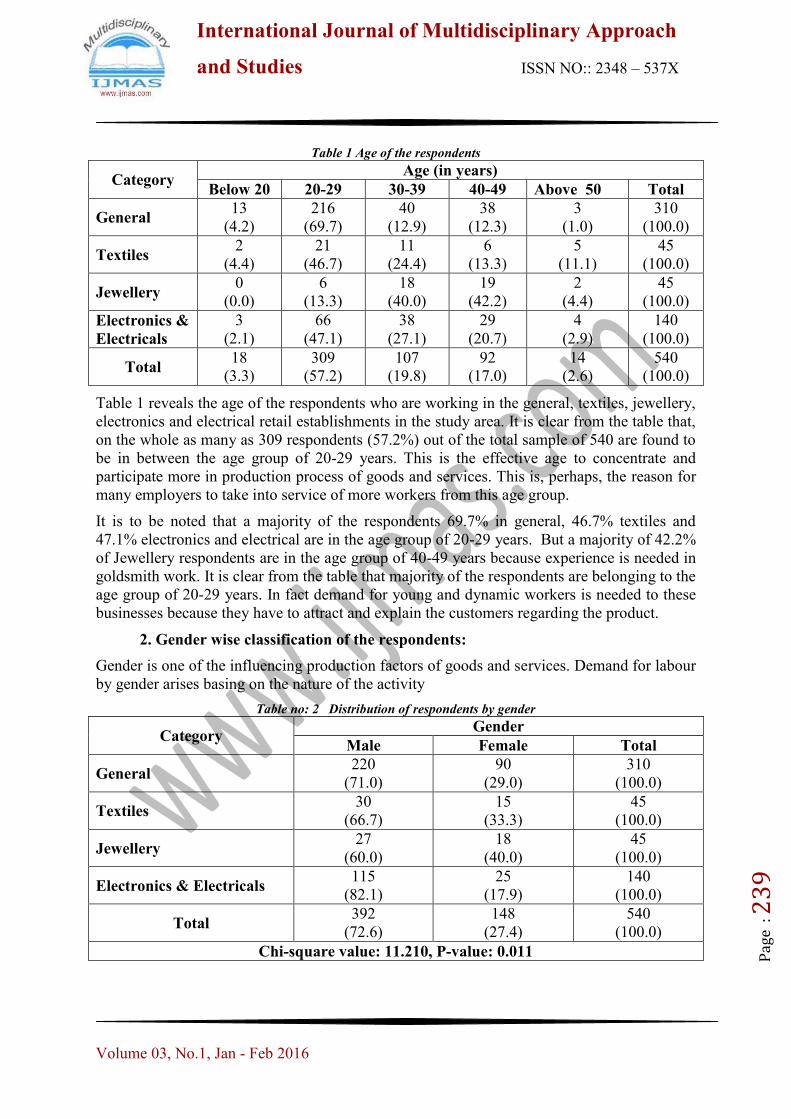
Table 1 reveals the age of the respondents who are working in the general, textiles, jewellery,
electronics and electrical retail establishments in the study area. It is clear from the table that,
on the whole as many as 309 respondents (57.2%) out of the total sample of 540 are found to
be in between the age group of 20-29 years. This is the effective age to concentrate and
participate more in production process of goods and services. This is, perhaps, the reason for
many employers to take into service of more workers from this age group.
It is to be noted that a majority of the respondents 69.7% in general, 46.7% textiles and
47.1% electronics and electrical are in the age group of 20-29 years. But a majority of 42.2%
of Jewellery respondents are in the age group of 40-49 years because experience is needed in
goldsmith work. It is clear from the table that majority of the respondents are belonging to the
age group of 20-29 years. In fact demand for young and dynamic workers is needed to these
businesses because they have to attract and explain the customers regarding the product.
2. Gender wise classification of the respondents:
Gender is one of the influencing production factors of goods and services. Demand for labour
by gender arises basing on the nature of the activity
Table no: 2 Distribution of respondents by gender
Category Gender
Male Female Total
General 220
(71.0)
90
(29.0)
310
(100.0)
Textiles 30
(66.7)
15
(33.3)
45
(100.0)
Jewellery 27
(60.0)
18
(40.0)
45
(100.0)
Electronics & Electricals 115
(82.1)
25
(17.9)
140
(100.0)
Total 392
(72.6)
148
(27.4)
540
(100.0)
Chi-square value: 11.210, P-value: 0.011

International Journal of Multidisciplinary Approach
and Studies ISSN NO:: 2348 – 537X
Volume 03, No.1, Jan - Feb 2016
Pag
e : 2
40
It is seen from the table 2 that a majority of the respondents are males recorded by 72.6 per
cent to the total sample respondents. The percentage of female in the general business,
textiles, jewellery and electronic and electrical business are recorded by 29 per cent, 33.3 per
cent, 40 per cent and 17.9 per cent respectively.
It can be observed from the table that women participation in the four business categories is
lower than the male. In India, it is the fact that women participation rate in the total
workforce is less compared to male. It is because women are treated as secondary and
unskilled in Indian traditional society. Moreover, they have to confine to house hold duties
and as a house wife she has to perform multiple roles at home. Thus, women participation in
different jobs is less as observed in the study area.
The above Chi-square value (11.21) and its corresponding significance value (0.011)
describes that there is a significant association between category of business and their gender.
Hence the hypothesis is rejected. (i.e., both the variables are dependent).
3. Religious status of the Respondents:
Table no: 3 Religious status of the respondents
Category Religion
Hindu Muslim Christian Total
General 251
(81.0)
19
(6.1)
40
(12.9)
310
(100.0)
Textiles 34
(75.6)
5
(11.1)
6
(13.3)
45
(100.0)
Jewellery 39
(86.7)
4
(8.9)
2
(4.4)
45
(100.0)
Electronics &
Electricals
127
(90.7)
12
(8.6)
1
(0.7)
140
(100.0)
Total 451
(83.5)
40
(7.4)
49
(9.1)
540
(100.0)
It is to be noted from the table 3 that a majority of 83.5 per cent of the total sample
respondents are belonging to Hindu religion, followed by Christians by 9.1 per cent and 7.4
per cent by Muslims. The table concludes that the predominant Hindu population in this state
has been reflected in all the business categories of the employees
4. Caste of the Respondents: Caste system is the most important and utmost universal basis
of social stratification of Hindu Society. Though its binding force is diminishing in social
communication and outward behavior, still it is a potent factor in influencing social values,
custom, marriage relations, etc. The economic and cultural life of people has roots in their
caste and social background1.
Table no: 4 Distribution of respondents by caste
Category Caste
S.C S.T B.C O.C Total
General 68
(21.9)
20
(6.5)
80
(25.8)
142
(45.8)
310
(100.0)
International Journal of Multidisciplinary Approach
and Studies ISSN NO:: 2348 – 537X
Volume 03, No.1, Jan - Feb 2016
Pag
e : 2
41
Textiles 27
(60.0)
0
(0.0)
7
(15.6)
11
(24.4)
45
(100.0)
Jewellery 11
(24.4)
0
(0.0)
28
(62.2)
6
(13.3)
45
(100.0)
Electronics &
Electricals
28
(20.0)
0
(0.0)
42
(30.0)
70
(50.0)
140
(100.0)
Total 134
(24.8)
20
(3.7)
157
(29.1)
229
(42.4)
540
(100.0)
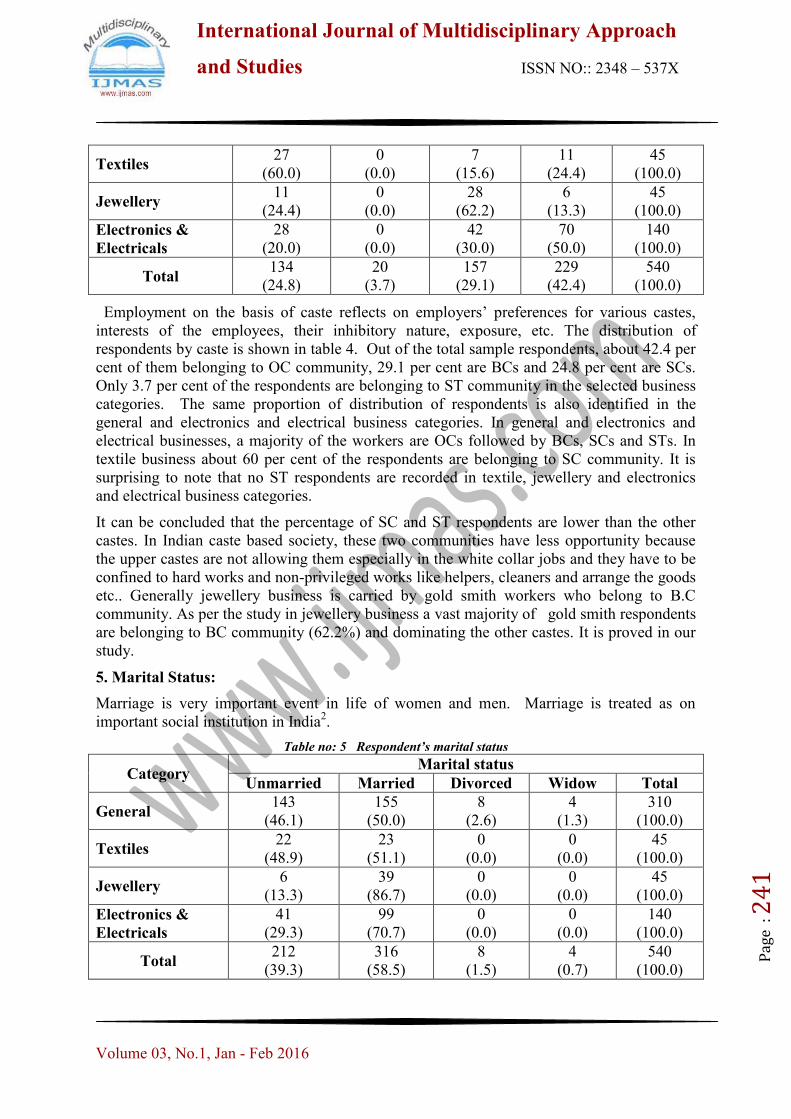
Employment on the basis of caste reflects on employers‟ preferences for various castes,
interests of the employees, their inhibitory nature, exposure, etc. The distribution of
respondents by caste is shown in table 4. Out of the total sample respondents, about 42.4 per
cent of them belonging to OC community, 29.1 per cent are BCs and 24.8 per cent are SCs.
Only 3.7 per cent of the respondents are belonging to ST community in the selected business
categories. The same proportion of distribution of respondents is also identified in the
general and electronics and electrical business categories. In general and electronics and
electrical businesses, a majority of the workers are OCs followed by BCs, SCs and STs. In
textile business about 60 per cent of the respondents are belonging to SC community. It is
surprising to note that no ST respondents are recorded in textile, jewellery and electronics
and electrical business categories.
It can be concluded that the percentage of SC and ST respondents are lower than the other
castes. In Indian caste based society, these two communities have less opportunity because
the upper castes are not allowing them especially in the white collar jobs and they have to be
confined to hard works and non-privileged works like helpers, cleaners and arrange the goods
etc.. Generally jewellery business is carried by gold smith workers who belong to B.C
community. As per the study in jewellery business a vast majority of gold smith respondents
are belonging to BC community (62.2%) and dominating the other castes. It is proved in our
study.
5. Marital Status:
Marriage is very important event in life of women and men. Marriage is treated as on
important social institution in India2.
Table no: 5 Respondent’s marital status
Category Marital status
Unmarried Married Divorced Widow Total
General 143
(46.1)
155
(50.0)
8
(2.6)
4
(1.3)
310
(100.0)
Textiles 22
(48.9)
23
(51.1)
0
(0.0)
0
(0.0)
45
(100.0)
Jewellery 6
(13.3)
39
(86.7)
0
(0.0)
0
(0.0)
45
(100.0)
Electronics &
Electricals
41
(29.3)
99
(70.7)
0
(0.0)
0
(0.0)
140
(100.0)
Total 212
(39.3)
316
(58.5)
8
(1.5)
4
(0.7)
540
(100.0)
International Journal of Multidisciplinary Approach
and Studies ISSN NO:: 2348 – 537X
Volume 03, No.1, Jan - Feb 2016
Pag
e : 2
42
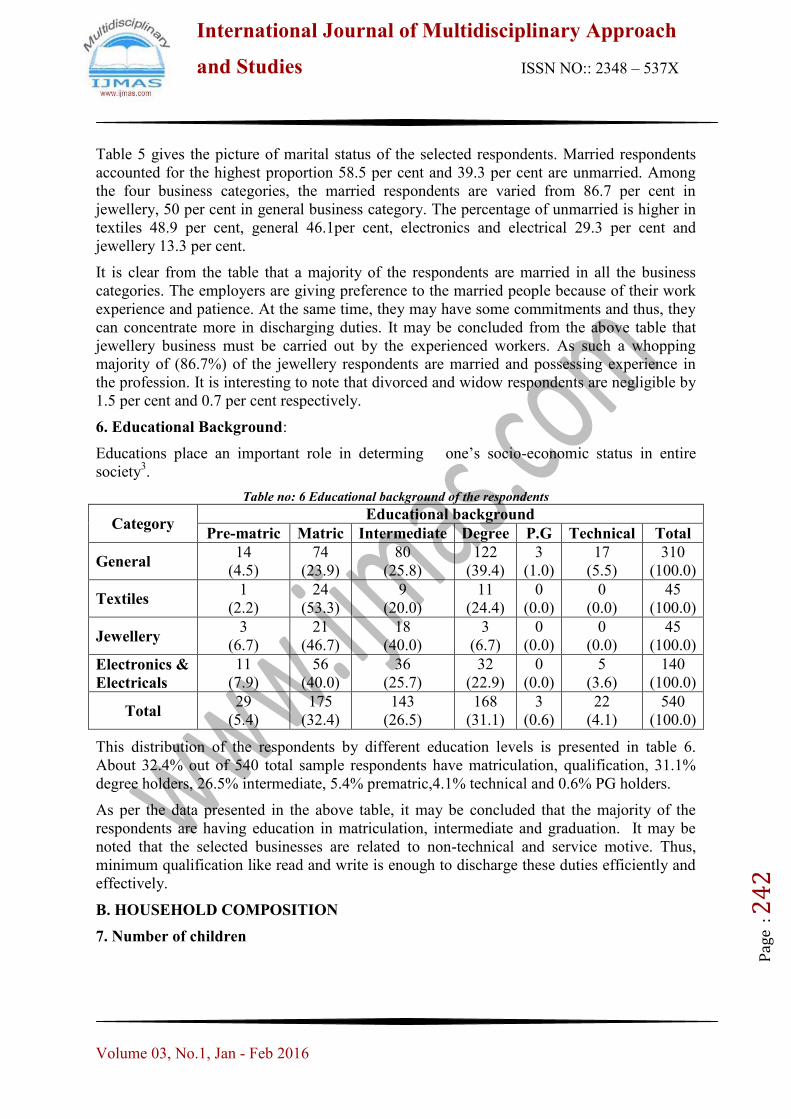
Table 5 gives the picture of marital status of the selected respondents. Married respondents
accounted for the highest proportion 58.5 per cent and 39.3 per cent are unmarried. Among
the four business categories, the married respondents are varied from 86.7 per cent in
jewellery, 50 per cent in general business category. The percentage of unmarried is higher in
textiles 48.9 per cent, general 46.1per cent, electronics and electrical 29.3 per cent and
jewellery 13.3 per cent.
It is clear from the table that a majority of the respondents are married in all the business
categories. The employers are giving preference to the married people because of their work
experience and patience. At the same time, they may have some commitments and thus, they
can concentrate more in discharging duties. It may be concluded from the above table that
jewellery business must be carried out by the experienced workers. As such a whopping
majority of (86.7%) of the jewellery respondents are married and possessing experience in
the profession. It is interesting to note that divorced and widow respondents are negligible by
1.5 per cent and 0.7 per cent respectively.
6. Educational Background:
Educations place an important role in determing one‟s socio-economic status in entire
society3.
Table no: 6 Educational background of the respondents
Category Educational background
Pre-matric Matric Intermediate Degree P.G Technical Total
General 14
(4.5)
74
(23.9)
80
(25.8)
122
(39.4)
3
(1.0)
17
(5.5)
310
(100.0)
Textiles 1
(2.2)
24
(53.3)
9
(20.0)
11
(24.4)
0
(0.0)
0
(0.0)
45
(100.0)
Jewellery 3
(6.7)
21
(46.7)
18
(40.0)
3
(6.7)
0
(0.0)
0
(0.0)
45
(100.0)
Electronics &
Electricals
11
(7.9)
56
(40.0)
36
(25.7)
32
(22.9)
0
(0.0)
5
(3.6)
140
(100.0)
Total 29
(5.4)
175
(32.4)
143
(26.5)
168
(31.1)
3
(0.6)
22
(4.1)
540
(100.0)
This distribution of the respondents by different education levels is presented in table 6.
About 32.4% out of 540 total sample respondents have matriculation, qualification, 31.1%
degree holders, 26.5% intermediate, 5.4% prematric,4.1% technical and 0.6% PG holders.
As per the data presented in the above table, it may be concluded that the majority of the
respondents are having education in matriculation, intermediate and graduation. It may be
noted that the selected businesses are related to non-technical and service motive. Thus,
minimum qualification like read and write is enough to discharge these duties efficiently and
effectively.
B. HOUSEHOLD COMPOSITION
7. Number of children
International Journal of Multidisciplinary Approach
and Studies ISSN NO:: 2348 – 537X
Volume 03, No.1, Jan - Feb 2016
Pag
e : 2
43
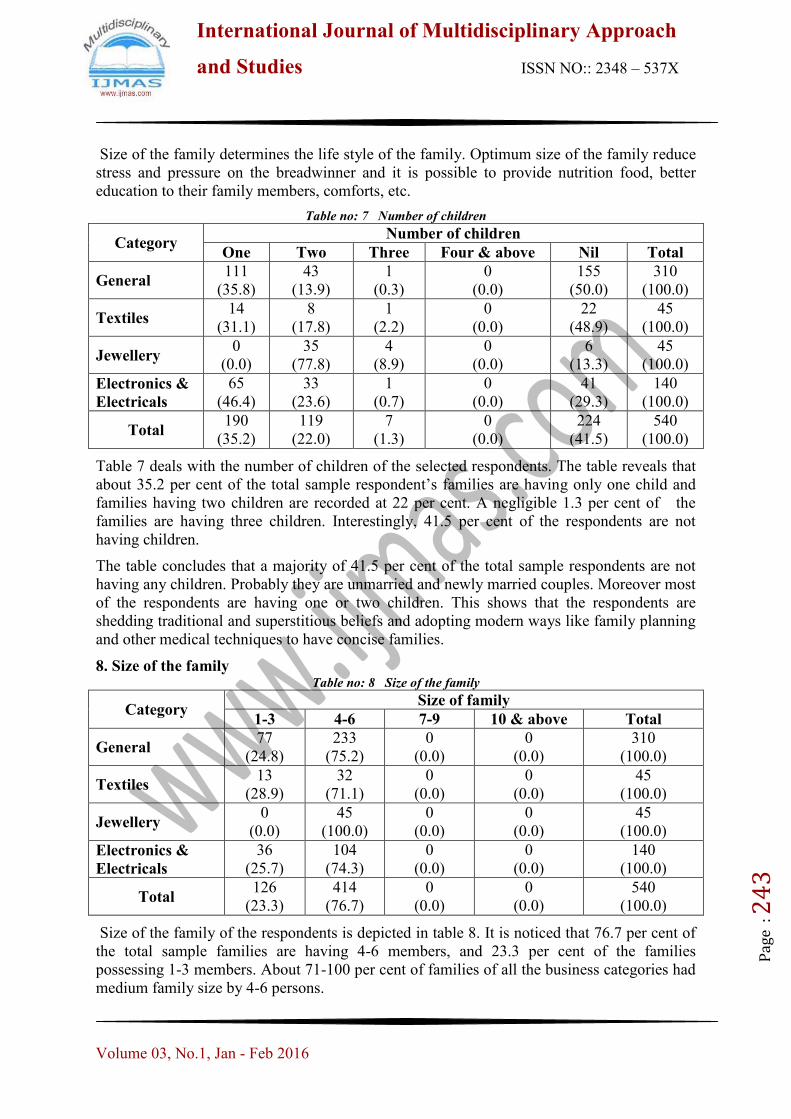
Size of the family determines the life style of the family. Optimum size of the family reduce
stress and pressure on the breadwinner and it is possible to provide nutrition food, better
education to their family members, comforts, etc.
Table no: 7 Number of children
Category Number of children
One Two Three Four & above Nil Total
General 111
(35.8)
43
(13.9)
1
(0.3)
0
(0.0)
155
(50.0)
310
(100.0)
Textiles 14
(31.1)
8
(17.8)
1
(2.2)
0
(0.0)
22
(48.9)
45
(100.0)
Jewellery 0
(0.0)
35
(77.8)
4
(8.9)
0
(0.0)
6
(13.3)
45
(100.0)
Electronics &
Electricals
65
(46.4)
33
(23.6)
1
(0.7)
0
(0.0)
41
(29.3)
140
(100.0)
Total 190
(35.2)
119
(22.0)
7
(1.3)
0
(0.0)
224
(41.5)
540
(100.0)
Table 7 deals with the number of children of the selected respondents. The table reveals that
about 35.2 per cent of the total sample respondent‟s families are having only one child and
families having two children are recorded at 22 per cent. A negligible 1.3 per cent of the
families are having three children. Interestingly, 41.5 per cent of the respondents are not
having children.
The table concludes that a majority of 41.5 per cent of the total sample respondents are not
having any children. Probably they are unmarried and newly married couples. Moreover most
of the respondents are having one or two children. This shows that the respondents are
shedding traditional and superstitious beliefs and adopting modern ways like family planning
and other medical techniques to have concise families.
8. Size of the family Table no: 8 Size of the family
Category Size of family
1-3 4-6 7-9 10 & above Total
General 77
(24.8)
233
(75.2)
0
(0.0)
0
(0.0)
310
(100.0)
Textiles 13
(28.9)
32
(71.1)
0
(0.0)
0
(0.0)
45
(100.0)
Jewellery 0
(0.0)
45
(100.0)
0
(0.0)
0
(0.0)
45
(100.0)
Electronics &
Electricals
36
(25.7)
104
(74.3)
0
(0.0)
0
(0.0)
140
(100.0)
Total 126
(23.3)
414
(76.7)
0
(0.0)
0
(0.0)
540
(100.0)
Size of the family of the respondents is depicted in table 8. It is noticed that 76.7 per cent of
the total sample families are having 4-6 members, and 23.3 per cent of the families
possessing 1-3 members. About 71-100 per cent of families of all the business categories had
medium family size by 4-6 persons.
International Journal of Multidisciplinary Approach
and Studies ISSN NO:: 2348 – 537X
Volume 03, No.1, Jan - Feb 2016
Pag
e : 2
44
It is found from the research observations that the majority of the respondents are awared of
the effects of large size family and its impact on the life style. Large numbers of new
couples are following one or two children norms because of their poor economic conditions.
However, interestingly, some of the lower caste families that is SCs and STs are willing to
have more children especially with low education because they are treating their children as
future asset to them. Thus, it is suggested that there should be a need of conducting awareness
classes by the concerned government in the rural and urban mass in this regard.
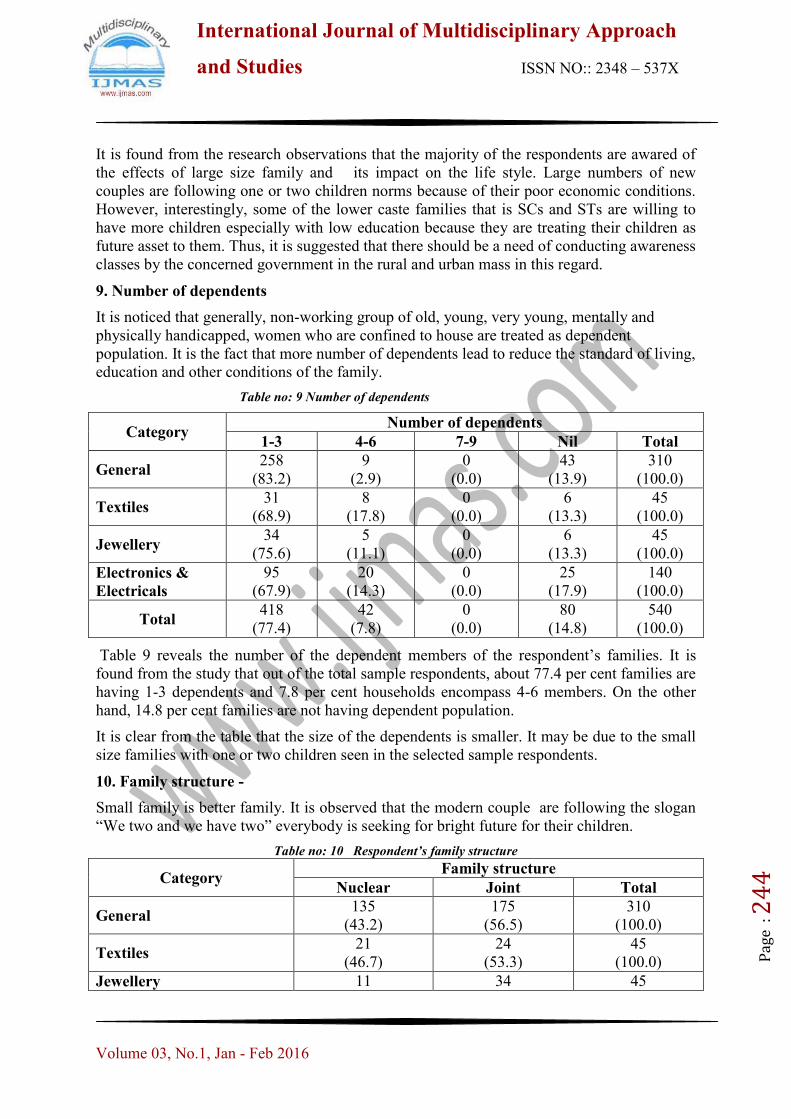
9. Number of dependents
It is noticed that generally, non-working group of old, young, very young, mentally and
physically handicapped, women who are confined to house are treated as dependent
population. It is the fact that more number of dependents lead to reduce the standard of living,
education and other conditions of the family.
Table no: 9 Number of dependents
Category Number of dependents
1-3 4-6 7-9 Nil Total
General 258
(83.2)
9
(2.9)
0
(0.0)
43
(13.9)
310
(100.0)
Textiles 31
(68.9)
8
(17.8)
0
(0.0)
6
(13.3)
45
(100.0)
Jewellery 34
(75.6)
5
(11.1)
0
(0.0)
6
(13.3)
45
(100.0)
Electronics &
Electricals
95
(67.9)
20
(14.3)
0
(0.0)
25
(17.9)
140
(100.0)
Total 418
(77.4)
42
(7.8)
0
(0.0)
80
(14.8)
540
(100.0)
Table 9 reveals the number of the dependent members of the respondent‟s families. It is
found from the study that out of the total sample respondents, about 77.4 per cent families are
having 1-3 dependents and 7.8 per cent households encompass 4-6 members. On the other
hand, 14.8 per cent families are not having dependent population.
It is clear from the table that the size of the dependents is smaller. It may be due to the small
size families with one or two children seen in the selected sample respondents.
10. Family structure -
Small family is better family. It is observed that the modern couple are following the slogan
“We two and we have two” everybody is seeking for bright future for their children.
Table no: 10 Respondent’s family structure
Category Family structure
Nuclear Joint Total
General 135
(43.2)
175
(56.5)
310
(100.0)
Textiles 21
(46.7)
24
(53.3)
45
(100.0)
Jewellery 11 34 45
International Journal of Multidisciplinary Approach
and Studies ISSN NO:: 2348 – 537X
Volume 03, No.1, Jan - Feb 2016
Pag
e : 2
45
(24.4) (75.6) (100.0)
Electronics & Electricals 73
(52.1)
67
(47.9)
140
(100.0)
Total 240
(44.4)
300
(55.6)
540
(100.0)
Table 10 explains about the family structure of the respondents‟. It is found that 55.6 per cent
of the total sample families are relating to joint family and remaining to nuclear family. It is
interesting to note that 75.6 per cent of the jewellery respondent‟s families are living in the
joint family system because gold smith profession is passed from one generation to the other
generation. The table concludes that predominance of joint family system is observed in the
present study.
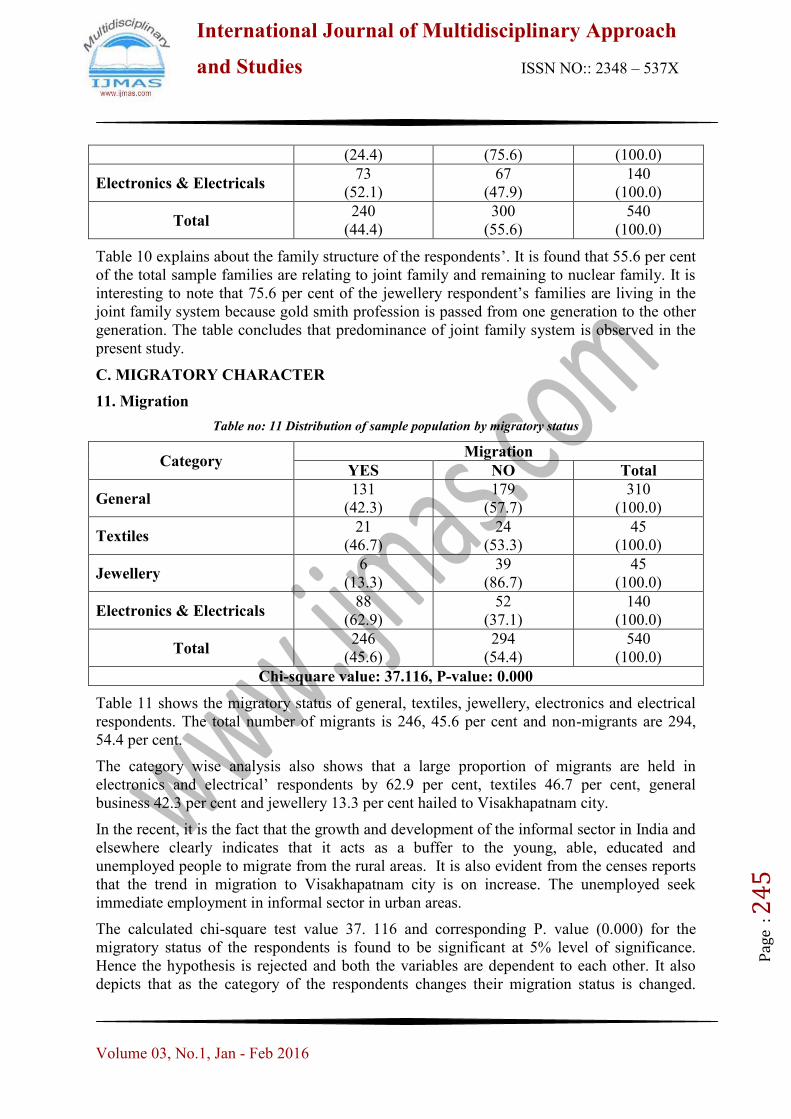
C. MIGRATORY CHARACTER
11. Migration
Table no: 11 Distribution of sample population by migratory status
Category Migration
YES NO Total
General 131
(42.3)
179
(57.7)
310
(100.0)
Textiles 21
(46.7)
24
(53.3)
45
(100.0)
Jewellery 6
(13.3)
39
(86.7)
45
(100.0)
Electronics & Electricals 88
(62.9)
52
(37.1)
140
(100.0)
Total 246
(45.6)
294
(54.4)
540
(100.0)
Chi-square value: 37.116, P-value: 0.000
Table 11 shows the migratory status of general, textiles, jewellery, electronics and electrical
respondents. The total number of migrants is 246, 45.6 per cent and non-migrants are 294,
54.4 per cent.
The category wise analysis also shows that a large proportion of migrants are held in
electronics and electrical‟ respondents by 62.9 per cent, textiles 46.7 per cent, general
business 42.3 per cent and jewellery 13.3 per cent hailed to Visakhapatnam city.
In the recent, it is the fact that the growth and development of the informal sector in India and
elsewhere clearly indicates that it acts as a buffer to the young, able, educated and
unemployed people to migrate from the rural areas. It is also evident from the censes reports
that the trend in migration to Visakhapatnam city is on increase. The unemployed seek
immediate employment in informal sector in urban areas.
The calculated chi-square test value 37. 116 and corresponding P. value (0.000) for the
migratory status of the respondents is found to be significant at 5% level of significance.
Hence the hypothesis is rejected and both the variables are dependent to each other. It also
depicts that as the category of the respondents changes their migration status is changed.
International Journal of Multidisciplinary Approach
and Studies ISSN NO:: 2348 – 537X
Volume 03, No.1, Jan - Feb 2016
Pag
e : 2
46
Further majority of the respondents from electronics and electrical category are migrated
followed by textiles respondents.
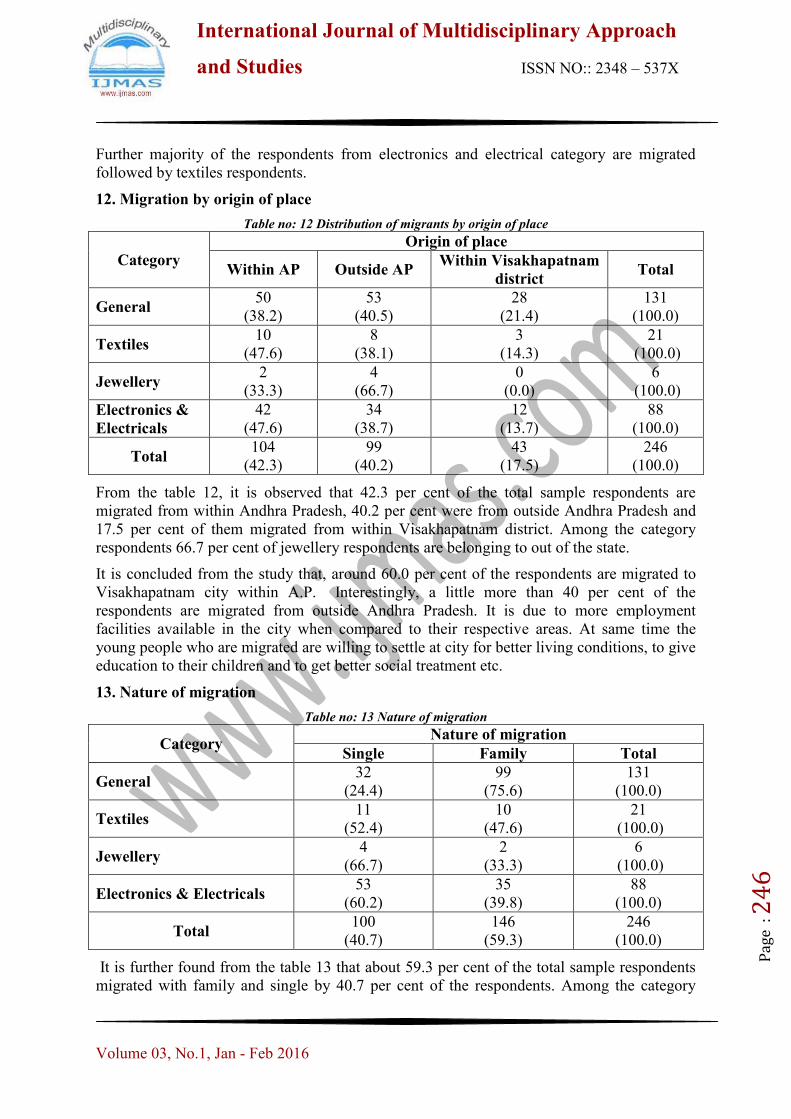
12. Migration by origin of place
Table no: 12 Distribution of migrants by origin of place
Category
Origin of place
Within AP Outside AP Within Visakhapatnam
district Total
General 50
(38.2)
53
(40.5)
28
(21.4)
131
(100.0)
Textiles 10
(47.6)
8
(38.1)
3
(14.3)
21
(100.0)
Jewellery 2
(33.3)
4
(66.7)
0
(0.0)
6
(100.0)
Electronics &
Electricals
42
(47.6)
34
(38.7)
12
(13.7)
88
(100.0)
Total 104
(42.3)
99
(40.2)
43
(17.5)
246
(100.0)
From the table 12, it is observed that 42.3 per cent of the total sample respondents are
migrated from within Andhra Pradesh, 40.2 per cent were from outside Andhra Pradesh and
17.5 per cent of them migrated from within Visakhapatnam district. Among the category
respondents 66.7 per cent of jewellery respondents are belonging to out of the state.
It is concluded from the study that, around 60.0 per cent of the respondents are migrated to
Visakhapatnam city within A.P. Interestingly, a little more than 40 per cent of the
respondents are migrated from outside Andhra Pradesh. It is due to more employment
facilities available in the city when compared to their respective areas. At same time the
young people who are migrated are willing to settle at city for better living conditions, to give
education to their children and to get better social treatment etc.
13. Nature of migration
Table no: 13 Nature of migration
Category Nature of migration
Single Family Total
General 32
(24.4)
99
(75.6)
131
(100.0)
Textiles 11
(52.4)
10
(47.6)
21
(100.0)
Jewellery 4
(66.7)
2
(33.3)
6
(100.0)
Electronics & Electricals 53
(60.2)
35
(39.8)
88
(100.0)
Total 100
(40.7)
146
(59.3)
246
(100.0)
It is further found from the table 13 that about 59.3 per cent of the total sample respondents
migrated with family and single by 40.7 per cent of the respondents. Among the category
International Journal of Multidisciplinary Approach
and Studies ISSN NO:: 2348 – 537X
Volume 03, No.1, Jan - Feb 2016
Pag
e : 2
47
wise single migrants were higher 66.7 per cent in jewellery respondents, next by electronics
and electrical respondents 60.2 per cent. Least per cent of 24.4 is recorded in general business
migrants. Regarding family migration a vast majority of 75.6 per cent of general business
respondents migrated with family.
It is concluded that many respondents have migrated with their family members in search of
employment to both wife and husband. Some other causes like better nursing of the children,
due to some personal quarrels between the family members, lack of job opportunities at rural
place made respondents migrated with family. It is clearly shown in table 14.
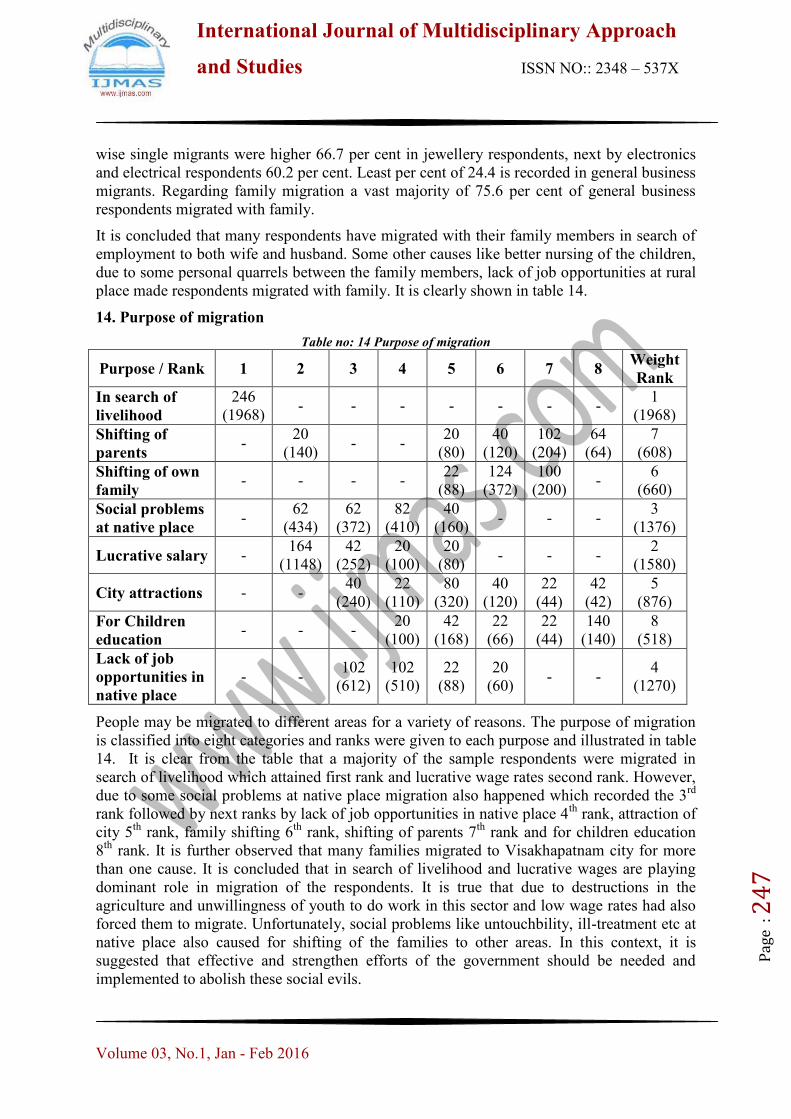
14. Purpose of migration
Table no: 14 Purpose of migration
Purpose / Rank 1 2 3 4 5 6 7 8 Weight
Rank
In search of
livelihood
246
(1968) - - - - - - -
1
(1968)
Shifting of
parents -
20
(140) - -
20
(80)
40
(120)
102
(204)
64
(64)
7
(608)
Shifting of own
family - - - -
22
(88)
124
(372)
100
(200) -
6
(660)
Social problems
at native place -
62
(434)
62
(372)
82
(410)
40
(160) - - -
3
(1376)
Lucrative salary - 164
(1148)
42
(252)
20
(100)
20
(80) - - -
2
(1580)
City attractions - - 40
(240)
22
(110)
80
(320)
40
(120)
22
(44)
42
(42)
5
(876)
For Children
education - - -
20
(100)
42
(168)
22
(66)
22
(44)
140
(140)
8
(518)
Lack of job
opportunities in
native place
- - 102
(612)
102
(510)
22
(88)
20
(60) - -
4
(1270)
People may be migrated to different areas for a variety of reasons. The purpose of migration
is classified into eight categories and ranks were given to each purpose and illustrated in table
14. It is clear from the table that a majority of the sample respondents were migrated in
search of livelihood which attained first rank and lucrative wage rates second rank. However,
due to some social problems at native place migration also happened which recorded the 3rd
rank followed by next ranks by lack of job opportunities in native place 4th
rank, attraction of
city 5th
rank, family shifting 6th
rank, shifting of parents 7th
rank and for children education
8th
rank. It is further observed that many families migrated to Visakhapatnam city for more
than one cause. It is concluded that in search of livelihood and lucrative wages are playing
dominant role in migration of the respondents. It is true that due to destructions in the
agriculture and unwillingness of youth to do work in this sector and low wage rates had also
forced them to migrate. Unfortunately, social problems like untouchbility, ill-treatment etc at
native place also caused for shifting of the families to other areas. In this context, it is
suggested that effective and strengthen efforts of the government should be needed and
implemented to abolish these social evils.

International Journal of Multidisciplinary Approach
and Studies ISSN NO:: 2348 – 537X
Volume 03, No.1, Jan - Feb 2016
Pag
e : 2
48
15. Periodicity visit to the native place
Migration could be either temporary or permanent in nature. Therefore, an attempt is also
made to point out whether the migrants keep their contact with their native places; if so, how
frequently they visit the place of origin.
Table no: 15 Periodicity visit to the native place
Category
Periodicity of visit
Weekly Fortnightly Monthly Quarterly Half
yearly Annually infrequently Total
General 0
(0.0)
22
(16.8)
51
(38.9)
58
(44.3)
0
(0.0)
0
(0.0)
0
(0.0)
131
(100.0)
Textiles 0
(0.0) -
11
(52.4)
10
(47.6)
0
(0.0)
0
(0.0)
0
(0.0)
21
(100.0)
Jewellery 0
(0.0)
6
(100.0)
0
(0.0)
0
(0.0)
0
(0.0)
0
(0.0)
0
(0.0)
6
(100.0)
Electronics
&
Electricals
0
(0.0)
14
(15.9)
60
(68.2)
14
(15.9)
0
(0.0)
0
(0.0)
0
(0.0)
88
(100.0)
Total 0
(0.0)
42
(17.1)
122
(49.6)
82
(33.3)
0
(0.0)
0
(0.0)
0
(0.0)
246
(100.0)
It is evident from the table 15 that about 49.6 per cent of the migrants visited their places
monthly followed by 33.3 per cent of them who visited quarterly and 17.1 per cent visited by
fortnightly. It is surprising to note that cent per cent of jewellery migrant respondents visited
their native place by fortnightly. More number of general category respondents visited
quarterly and next by monthly. Number of respondents that is 68.2 per cent electronics and
electrical visited monthly.
It is observed from the study that the respondents revealed that no one is willing to migrate
from rural to urban areas if it provides sufficient employment opportunities. Thus, attraction
on the native places has always an inseparable issue of the migrants otherwise they would of
opt for permanent settlement in the cities. It is evident from the analysis that a majority of the
respondents are visiting to their native places monthly which figure is near to the single
migrants.
D. HOUSEHOLD INCOME AND EXPENDITURE
16. Average household income per annum Table no: 16 Respondent’s average household income per annum
Household Income General Textiles Jewellery
Electronics &
Electrical
Your Salary
[543]
75012.4
(23454.126)
92195.1
(17565.78)
89000.04
(13562.28)
91865.7
(26241.7)
Your income from other
sources [20]
17500
(NA) NA NA NA
Husbands/Wife’s
income [105]
75735.2941
(15140.63)
48214.2857
(12371.79) NA
55978.26
(15139.55)
Other family members 71759.2593 71590.91 NA 77500
International Journal of Multidisciplinary Approach
and Studies ISSN NO:: 2348 – 537X
Volume 03, No.1, Jan - Feb 2016
Pag
e : 2
49
income [102] (26189.14) (19284.73) (22912.878)
Note: NA = Not applicable,
( ) = Standard Deviation
[ ] = Number of Respondents
The above table depicts the average household income of the respondents per annum and the
corresponding standard deviation. The average annual income by salary of the respondents
belonging to general category is `.75012.4/- and its standard deviation is 23454.126, similar
for textiles is `.92195.1/- and its standard deviation is 17565.78. In case of jewellery
`.89000.04/- and its standard deviation is 13562.28 and Electronics and Electrical `.91865.7/-
and its standard deviation is 26241.7. It is surprising to note that only general business
respondents are getting income from other sources of `.17,500/-per annum. Regarding
husbands/wife‟s income is more in general category `.75735/- and other members income is
high in electronics and Electricals with `.77500/-.
It may be concluded that the household income of general business respondents is high
followed by electronics and Electricals and textiles. Unfortunately jewellery is not receiving
any other income except salary income.
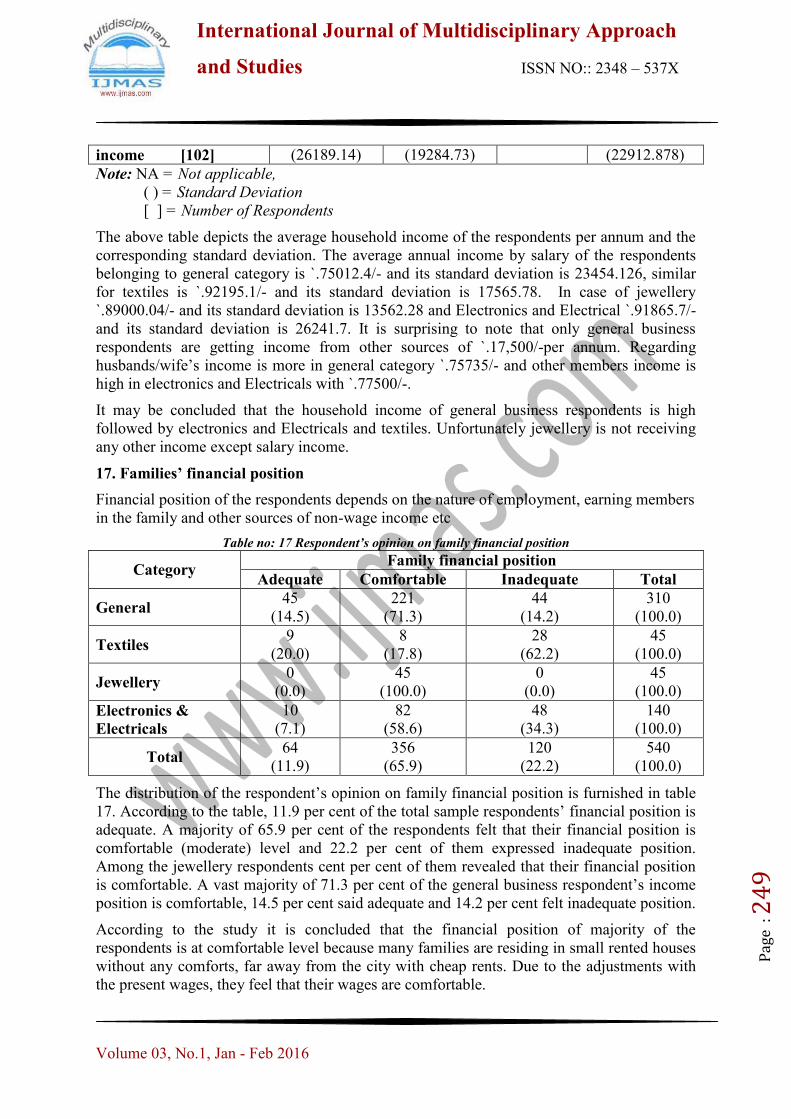
17. Families’ financial position
Financial position of the respondents depends on the nature of employment, earning members
in the family and other sources of non-wage income etc
Table no: 17 Respondent’s opinion on family financial position
Category Family financial position
Adequate Comfortable Inadequate Total
General 45
(14.5)
221
(71.3)
44
(14.2)
310
(100.0)
Textiles 9
(20.0)
8
(17.8)
28
(62.2)
45
(100.0)
Jewellery 0
(0.0)
45
(100.0)
0
(0.0)
45
(100.0)
Electronics &
Electricals
10
(7.1)
82
(58.6)
48
(34.3)
140
(100.0)
Total 64
(11.9)
356
(65.9)
120
(22.2)
540
(100.0)
The distribution of the respondent‟s opinion on family financial position is furnished in table
17. According to the table, 11.9 per cent of the total sample respondents‟ financial position is
adequate. A majority of 65.9 per cent of the respondents felt that their financial position is
comfortable (moderate) level and 22.2 per cent of them expressed inadequate position.
Among the jewellery respondents cent per cent of them revealed that their financial position
is comfortable. A vast majority of 71.3 per cent of the general business respondent‟s income
position is comfortable, 14.5 per cent said adequate and 14.2 per cent felt inadequate position.
According to the study it is concluded that the financial position of majority of the
respondents is at comfortable level because many families are residing in small rented houses
without any comforts, far away from the city with cheap rents. Due to the adjustments with
the present wages, they feel that their wages are comfortable.
International Journal of Multidisciplinary Approach
and Studies ISSN NO:: 2348 – 537X
Volume 03, No.1, Jan - Feb 2016
Pag
e : 2
50
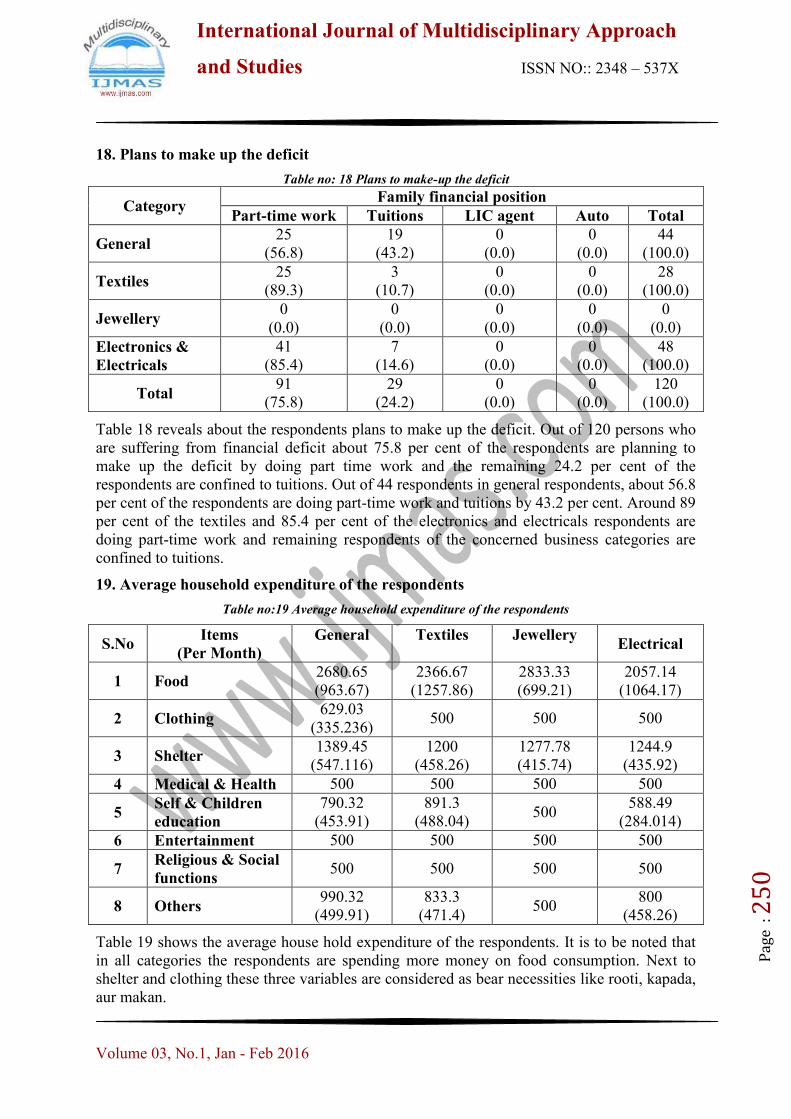
18. Plans to make up the deficit
Table no: 18 Plans to make-up the deficit
Category Family financial position
Part-time work Tuitions LIC agent Auto Total
General 25
(56.8)
19
(43.2)
0
(0.0)
0
(0.0)
44
(100.0)
Textiles 25
(89.3)
3
(10.7)
0
(0.0)
0
(0.0)
28
(100.0)
Jewellery 0
(0.0)
0
(0.0)
0
(0.0)
0
(0.0)
0
(0.0)
Electronics &
Electricals
41
(85.4)
7
(14.6)
0
(0.0)
0
(0.0)
48
(100.0)
Total 91
(75.8)
29
(24.2)
0
(0.0)
0
(0.0)
120
(100.0)
Table 18 reveals about the respondents plans to make up the deficit. Out of 120 persons who
are suffering from financial deficit about 75.8 per cent of the respondents are planning to
make up the deficit by doing part time work and the remaining 24.2 per cent of the
respondents are confined to tuitions. Out of 44 respondents in general respondents, about 56.8
per cent of the respondents are doing part-time work and tuitions by 43.2 per cent. Around 89
per cent of the textiles and 85.4 per cent of the electronics and electricals respondents are
doing part-time work and remaining respondents of the concerned business categories are
confined to tuitions.
19. Average household expenditure of the respondents
Table no:19 Average household expenditure of the respondents
S.No Items
(Per Month)
General Textiles Jewellery Electrical
1 Food 2680.65
(963.67)
2366.67
(1257.86)
2833.33
(699.21)
2057.14
(1064.17)
2 Clothing 629.03
(335.236) 500 500 500
3 Shelter 1389.45
(547.116)
1200
(458.26)
1277.78
(415.74)
1244.9
(435.92)
4 Medical & Health 500 500 500 500
5 Self & Children
education
790.32
(453.91)
891.3
(488.04) 500
588.49
(284.014)
6 Entertainment 500 500 500 500
7 Religious & Social
functions 500 500 500 500
8 Others 990.32
(499.91)
833.3
(471.4) 500
800
(458.26)
Table 19 shows the average house hold expenditure of the respondents. It is to be noted that
in all categories the respondents are spending more money on food consumption. Next to
shelter and clothing these three variables are considered as bear necessities like rooti, kapada,
aur makan.
International Journal of Multidisciplinary Approach
and Studies ISSN NO:: 2348 – 537X
Volume 03, No.1, Jan - Feb 2016
Pag
e : 2
51
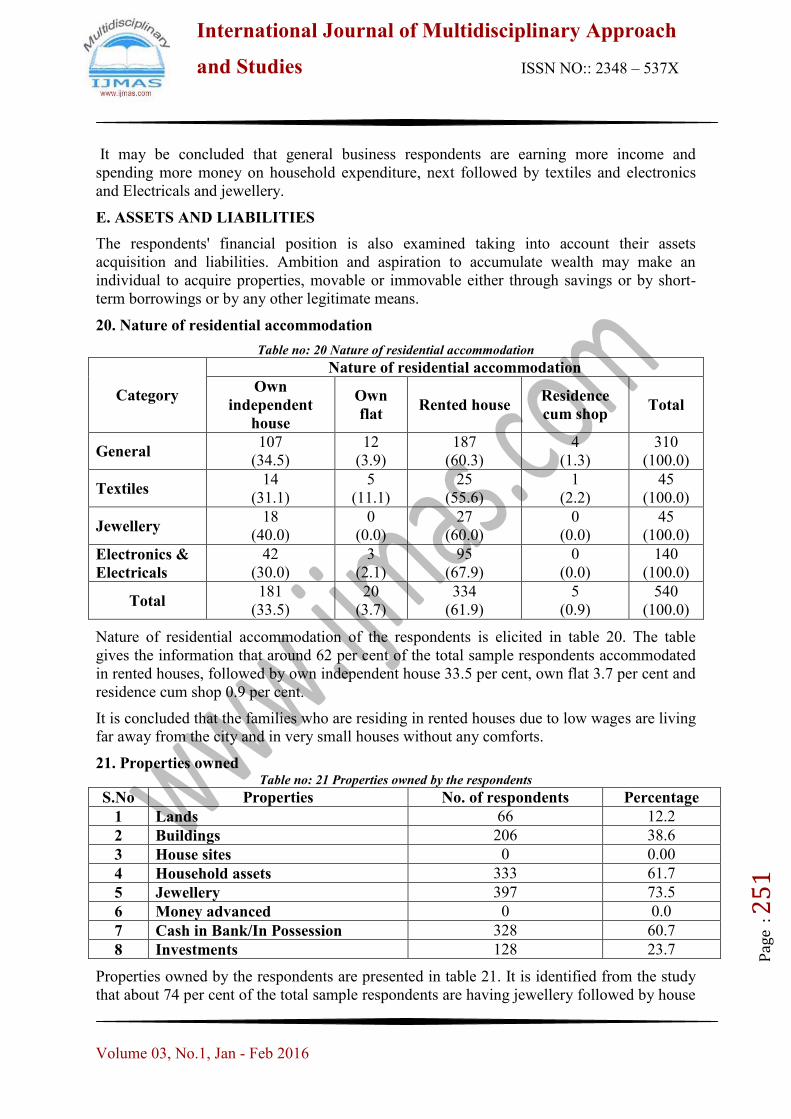
It may be concluded that general business respondents are earning more income and
spending more money on household expenditure, next followed by textiles and electronics
and Electricals and jewellery.
E. ASSETS AND LIABILITIES
The respondents' financial position is also examined taking into account their assets
acquisition and liabilities. Ambition and aspiration to accumulate wealth may make an
individual to acquire properties, movable or immovable either through savings or by short-
term borrowings or by any other legitimate means.
20. Nature of residential accommodation
Table no: 20 Nature of residential accommodation
Category
Nature of residential accommodation
Own
independent
house
Own
flat Rented house
Residence
cum shop Total
General 107
(34.5)
12
(3.9)
187
(60.3)
4
(1.3)
310
(100.0)
Textiles 14
(31.1)
5
(11.1)
25
(55.6)
1
(2.2)
45
(100.0)
Jewellery 18
(40.0)
0
(0.0)
27
(60.0)
0
(0.0)
45
(100.0)
Electronics &
Electricals
42
(30.0)
3
(2.1)
95
(67.9)
0
(0.0)
140
(100.0)
Total 181
(33.5)
20
(3.7)
334
(61.9)
5
(0.9)
540
(100.0)
Nature of residential accommodation of the respondents is elicited in table 20. The table
gives the information that around 62 per cent of the total sample respondents accommodated
in rented houses, followed by own independent house 33.5 per cent, own flat 3.7 per cent and
residence cum shop 0.9 per cent.
It is concluded that the families who are residing in rented houses due to low wages are living
far away from the city and in very small houses without any comforts.
21. Properties owned Table no: 21 Properties owned by the respondents
S.No Properties No. of respondents Percentage
1 Lands 66 12.2
2 Buildings 206 38.6
3 House sites 0 0.00
4 Household assets 333 61.7
5 Jewellery 397 73.5
6 Money advanced 0 0.0
7 Cash in Bank/In Possession 328 60.7
8 Investments 128 23.7
Properties owned by the respondents are presented in table 21. It is identified from the study
that about 74 per cent of the total sample respondents are having jewellery followed by house
International Journal of Multidisciplinary Approach
and Studies ISSN NO:: 2348 – 537X
Volume 03, No.1, Jan - Feb 2016
Pag
e : 2
52
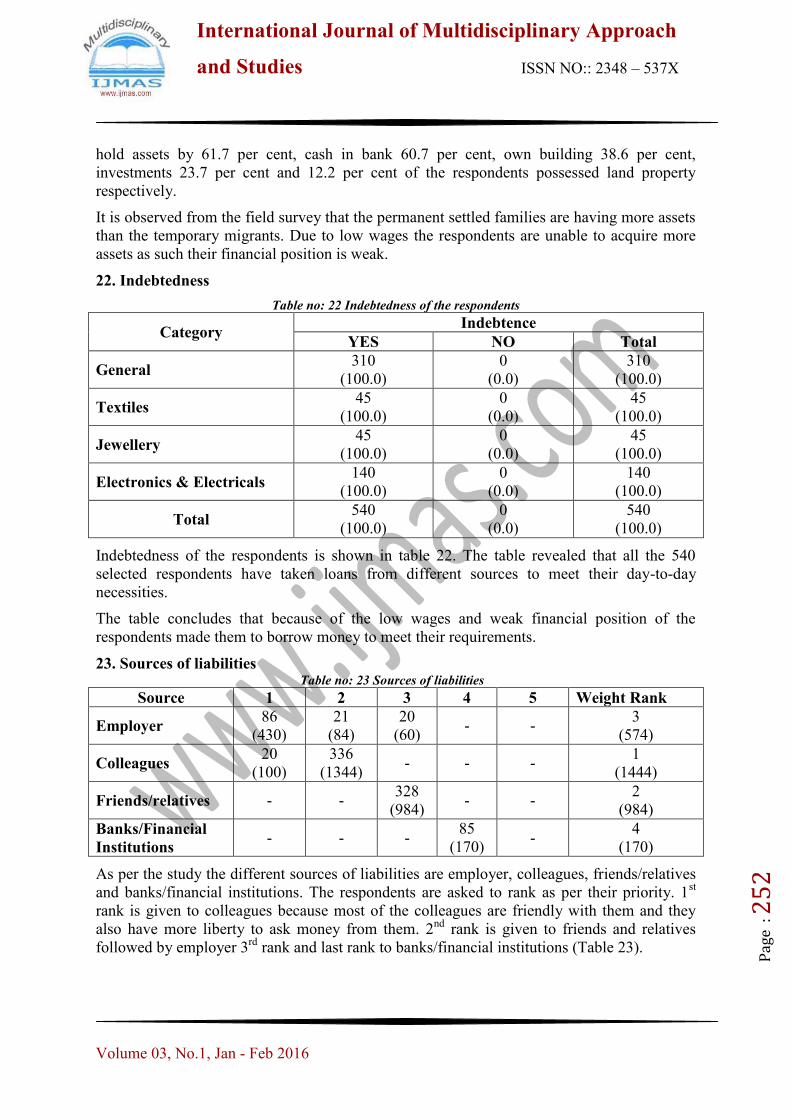
hold assets by 61.7 per cent, cash in bank 60.7 per cent, own building 38.6 per cent,
investments 23.7 per cent and 12.2 per cent of the respondents possessed land property
respectively.
It is observed from the field survey that the permanent settled families are having more assets
than the temporary migrants. Due to low wages the respondents are unable to acquire more
assets as such their financial position is weak.
22. Indebtedness
Table no: 22 Indebtedness of the respondents
Category Indebtence
YES NO Total
General 310
(100.0)
0
(0.0)
310
(100.0)
Textiles 45
(100.0)
0
(0.0)
45
(100.0)
Jewellery 45
(100.0)
0
(0.0)
45
(100.0)
Electronics & Electricals 140
(100.0)
0
(0.0)
140
(100.0)
Total 540
(100.0)
0
(0.0)
540
(100.0)
Indebtedness of the respondents is shown in table 22. The table revealed that all the 540
selected respondents have taken loans from different sources to meet their day-to-day
necessities.
The table concludes that because of the low wages and weak financial position of the
respondents made them to borrow money to meet their requirements.
23. Sources of liabilities Table no: 23 Sources of liabilities
Source 1 2 3 4 5 Weight Rank
Employer 86
(430)
21
(84)
20
(60) - -
3
(574)
Colleagues 20
(100)
336
(1344) - - -
1
(1444)
Friends/relatives - - 328
(984) - -
2
(984)
Banks/Financial
Institutions - - -
85
(170) -
4
(170)
As per the study the different sources of liabilities are employer, colleagues, friends/relatives
and banks/financial institutions. The respondents are asked to rank as per their priority. 1st
rank is given to colleagues because most of the colleagues are friendly with them and they
also have more liberty to ask money from them. 2nd
rank is given to friends and relatives
followed by employer 3rd
rank and last rank to banks/financial institutions (Table 23).
International Journal of Multidisciplinary Approach
and Studies ISSN NO:: 2348 – 537X
Volume 03, No.1, Jan - Feb 2016
Pag
e : 2
53
REFERENCES:
i. Shashi, Jain, „Status and Role perception of Middle Class Women‟ puja publishers,
New Delhi. 1988., p.37
ii. Jayal, Shakambari (ed.) „Status of women in the Epics‟, Motilal Banarsidas, New
Delhi, 1966, p. 40.
iii. Anju Agarwal and Aroral, D.R., „Women in Rural Society‟, Vohra Publishers and
Distributors, Allahabad, 1989, p. 13


