Embed Size (px)
Citation preview

Living biofouling-resistant membranes as a model forthe beneficial use of engineered biofilmsThammajun L. Wooda,b,1, Rajarshi Guhaa,1, Li Tanga, Michael Geitnera, Manish Kumara,2, and Thomas K. Wooda,b,c,2
aDepartment of Chemical Engineering, Pennsylvania State University, University Park, PA 16802; bThe Huck Institutes of the Life Sciences, Pennsylvania StateUniversity, University Park, PA 16802; and cDepartment of Biochemistry and Molecular Biology, Pennsylvania State University, University Park, PA 16802
Edited by David A. Weitz, Harvard University, Cambridge, MA, and approved April 11, 2016 (received for review November 5, 2015)
Membrane systems are used increasingly for water treatment,recycling water fromwastewater, during food processing, and energyproduction. They thus are a key technology to ensure water, energy,and food sustainability. However, biofouling, the build-up of microbesand their polymeric matrix, clogs these systems and reduces theirefficiency. Realizing that amicrobial film is inevitable, we engineered abeneficial biofilm that prevents membrane biofouling, limiting its ownthickness by sensing the number of its cells that are present via aquorum-sensing circuit. The beneficial biofilm also prevents biofilmformation by deleterious bacteria by secreting nitric oxide, a generalbiofilm dispersal agent, as demonstrated by both short-term dead-endfiltration and long-term cross-flow filtration tests. In addition, thebeneficial biofilm was engineered to produce an epoxide hydrolase sothat it efficiently removes the environmental pollutant epichlorohy-drin. Thus, we have created a living biofouling-resistant membranesystem that simultaneously reduces biofouling and provides a plat-form for biodegradation of persistent organic pollutants.
synthetic circuit | membranes | biofilm dispersal | nitric oxide | biofouling
Access to clean and safe water is essential to human survival (1)and plays an important role in manufacturing, agriculture, and
power generation (2). As the demand for fresh water increasesworldwide, membrane technologies have emerged as cost-effectiveapproaches to use lower-quality water sources including brackishwater, seawater, and recycled wastewater (3). Although micro-filtration and ultrafiltration membranes are used to remove par-ticulate matter and microbes from process waters, reverse osmosis(RO) membranes are the leading technology for removing saltsand dissolved contaminants from water (4).Membrane fouling by bacterial biofilms has remained a persistent
and unmet challenge for membrane-based water purification sys-tems (5–7). Bacterial biofilms reduce membrane permeability andcontaminant rejection and modify membrane module hydrody-namics, resulting in excessive pressure drops both across the mem-brane (transmembrane pressure drop) and along the membrane axisin membrane modules (axial pressure drop), leading to increasedenergy consumption (8). In solute-rejecting membranes such asnanofiltration (NF) and RO, biofilms reduce membrane perme-ability by trapping salt in the biofilm built on the membrane andincreasing the osmotic pressure that must be overcome to conductfiltration; this phenomenon is termed “biofilm-enhanced osmoticpressure” (9). Accumulation of solutes and microorganisms on themembrane surface also leads to higher leakage and thus lowersactual solute rejection (9), a major challenge in brackish watertreatment and wastewater reuse applications (10, 11). The two mostfrequently detected deleterious bacteria on RO membranes arePseudomonas aeruginosa and Sphingomonas wittichii (12–15).There are several strategies for controlling membrane biofouling,
including adding disinfectants and biocides, adding specific mole-cules to influence quorum sensing (QS) in biofilms to trigger theirdispersal (16–18), and modifying the membrane surface or spacersto reduce biofilm attachment and growth (19–21). However, mostcurrent biofouling control techniques either are effective only ini-tially because of the ability of the biofilm to adapt over time to theconditions imposed or need repeated application to control bio-
fouling effectively in the long run; hence, new methods are neededto control persistent biofouling.Temporal control of mixed-species biofilm formation and dis-
persal was achieved in a previous study using a synthetic gene cir-cuit based on the autoinducer synthase LasI/response regulatorLasR QS system of P. aeruginosa by combining it with engineeredHha and engineered biofilm dispersal protein based on c-di-GMP(BdcA) (22). LasI/LasR is one of the best-characterized QS systemsin P. aeruginosa, and it plays a key role in controlling virulencefactor production, swarming motility, biofilm maturation, and theexpression of antibiotic efflux pumps (23). Through this QS system,cells monitor their own cell density via exported signals produced byLasI; once a high cell density is reached, the signals diffuse back intothe cells and activate genes by binding to the transcription regulatorLasR. Previous applications have used the QS signal from one strainto control other strains. However, gene circuits have not been usedpreviously to impose self-regulation, i.e., to control biofilm forma-tion and thickness by the strain producing the QS signal itself.The final stage of biofilm formation is dispersal, which contrib-
utes to survival and biofilm propagation in distant regions (24).Dispersal may be triggered by changes in the environment includingnutrient levels, oxygen, pH, and temperature and occurs underfavorable and unfavorable conditions to expand the bacterial cel-lular population (24). Upon these changes in the environment,dispersal is regulated via QS cues such as acylhomoserine lactonesand 2-heptyl-3-hydroxy-4-quinolone (24) and by fatty acid signalssuch as cis-2-decenoic acid (25), nitric oxide (NO) (26), and cyclicdiguanylate (c-di-GMP) (27). As biofilms disperse, cells degrade
Significance
Biofouling is a significant problem for membrane-based systemsbecause it reduces flow and increases energy consumption. Thiswork shows a previously unreported approach to prevent mem-brane biofouling by using a beneficial biofilm. The beneficial strainwas engineered to have a dispersal “feedback circuit,” based onsecretion and uptake of a communication signal, limiting its ownbiofilm formation by self-monitoring and selective dispersal. Thebeneficial strain was also engineered to produce nitric oxide,which prevents biofilm formation by harmful bacteria; biofoulingby the twomost prevalent organisms was shown to be controlledby the beneficial strain. Moreover, the beneficial biofilm wasengineered to produce an evolved epoxide hydrolase to enable itto remove the environmental pollutant epichlorohydrin.
Author contributions: T.L.W., R.G., M.K., and T.K.W. designed research; T.L.W., R.G., L.T.,and M.G. performed research; T.L.W., R.G., M.K., and T.K.W. analyzed data; and T.L.W.,R.G., M.K., and T.K.W. wrote the paper.
The authors declare no conflict of interest.
This article is a PNAS Direct Submission.
Freely available online through the PNAS open access option.1T.L.W. and R.G. contributed equally to this work.2To whom correspondence may be addressed. Email: [email protected] or [email protected].
This article contains supporting information online at www.pnas.org/lookup/suppl/doi:10.1073/pnas.1521731113/-/DCSupplemental.
www.pnas.org/cgi/doi/10.1073/pnas.1521731113 PNAS Early Edition | 1 of 10
ENVIRONMEN
TAL
SCIENCE
SPN
ASPL
US

their extracellular matrix; for example, upon dispersal, P. aerugi-nosa uses endoglycosidase PslG to degrade its primary biofilmexopolysaccharide Psl (28) and also degrades extracellular lipidsand proteins of the biofilm matrix (29).The dispersal signal and secondary messenger c-di-GMP is ubiq-
uitous in Gram-negative bacteria and enhances biofilm formation(30); for example, c-di-GMP increases extracellular polysaccharideproduction by binding the PelD protein that is a c-di-GMP receptor inP. aeruginosa PA14 (31). Thus, biofilm formation and dispersal arecontrolled by a signal cascade mediated by c-di-GMP levels: Highlevels promote biofilm formation, and low levels lead to reducedbiofilm formation and increased dispersal. NO induces biofilm dis-persal by enhancing the activity of phosphodiesterases, resulting in thedegradation of c-di-GMP (32). NO is effective in dispersing a varietyof different biofilms (26), including P. aeruginosa biofilms (32), andNO synthase (NOS) from Bacillus anthracis is active inEscherichia coli(33). Also, sphingomonad biofilms should be dispersed by NO,because strains such as S. wittichii contain 40 diguanylate cyclasesand phosphodiesterases (34). Hence, NOS was used in this studyto generate NO to disperse deleterious biofilms.Here we describe a system to reduce the biofouling of water-
treatment membranes significantly while degrading an importantclass of contaminants. Specifically, we engineered a beneficial biofilmof E. coli via genetic circuits (i) to limit its biofilm formation, (ii) toprevent biofouling by the two most common biofouling organisms,and (iii) to degrade the model environmental pollutant and watercontaminant epichlorohydrin (35–37). To create these beneficialtraits, the LasI/LasR QS system of P. aeruginosa was used to controlthe engineered biofilm dispersal protein BdcA of E. coli to create thefirst (to our knowledge) self-controlled biofilm. Additionally, NO wasgenerated in the beneficial biofilm by NOS from B. anthracis toprevent biofouling. The effectiveness of this strategy in creating bio-fouling-resistant membranes was demonstrated using both short-termdead-end filtration tests and long-term cross-flow tests lasting severaldays under a variety of conditions. We also demonstrate that epi-chlorohydrin, which passes through the membrane, is degraded bycloning the gene encoding epoxide hydrolase (EH) from Agro-bacterium radiobacter AD1 into the beneficial biofilm.
ResultsBiofilm Formation Is Limited in the Self-Controlled Strain. To form abeneficial biofilm layer on membranes, we desired a protective biofilmthat does not attain a large thickness and that prevents the growth ofother bacteria so that membrane permeability and salt rejection aremaintained and cross-flow pressure drops are minimized. Hence, wedevised a genetic circuit in which the bacterium senses its own pres-ence to limit its biofilm formation (Fig. 1A). To do so, we used theLasI/LasRQS system of P. aeruginosa (38) to produce the autoinducermolecule N-(3-oxo-dodecanoyl)-L-homoserine lactone (3oC12HSL),which accumulates as the cell density increases and induces theformation of a biofilm dispersal protein, BdcA (22), which limits thebiofilm quantity and thus thickness of the protective strain. We usedthe BdcA E50Q variant because it causes sixfold higher levels ofbiofilm dispersal (39). Specifically, the response regulator LasR isproduced continuously and monitors the presence of the QS signal3oC12HSL produced by LasI; as the 3oC12HSL signal increasesbecause of increasing cell density, additional 3oC12HSL signal isproduced as LasR bound to 3oC12HSL activates lasI. Increasedproduction of the 3oC12HSL signal activates the dispersal proteinBdcA, which leads to dispersal of the beneficial biofilm.The resulting self-controlled biofilm strain is E. coli TG1/
pBdcAE50Q-lasI-lasR (hereafter the “self-controlled strain”); E. coliTG1/pBdcAE50Q-rfp-lasR (22), which lacks LasI (hereafter, the“QS signal-negative strain”), was used as a negative control. Todemonstrate that the self-controlled biofilm strain can self-regulateits biofilm, both a 96-well plate crystal violet biofilm assay and aconfocal microscope biofilm assay were performed. For the 96-wellplate assay, the self-controlled biofilm strain had approximately
ninefold less biofilm after 24 h than the QS signal-negative controlstrain (SI Appendix, Fig. S1). This result was corroborated usingconfocal microscopy: After 2 d, the self-controlled biofilm was six-fold less than the biofilm of the QS signal-negative control strain(average biomass 0.6 ± 0.6 μm3/μm2 vs. 3.5 ± 1 μm3/μm2 and av-erage thickness 1.5 ± 1 μm vs. 7.6 ± 2 μm, for the self-controlled andcontrol biofilms, respectively; representative figures are shown inFig. 1B). Therefore, using the biofilm dispersal protein BdcA underthe control of a QS circuit, this gene circuit controlled biofilm for-mation successfully as a function of cell density.
Membrane Flux Is Higher with the Self-Controlled Biofilm. Biofilms ofthe self-controlled biofilm strain and the QS signal-negative strainwere grown on commercially available NF90 thin film compositepolyamide NF membranes. The QS signal-negative strain formedthick and more uniform biofilms over the polyamide NF90 mem-brane (Fig. 2 A and B), whereas the self-controlled strain developeda considerably thinner and more heterogeneous biofilm with ∼42-fold lower biomass (0.2 ± 0.1 μm3/μm2) than that formed by thecontrol QS signal-negative strain (8.4 ± 7 μm3/μm2) (Fig. 2C and SIAppendix, Tables S1 and S2). This result confirms our previousresults showing that the QS circuit reduces biofilm formation (Fig.1B). More importantly, it shows that the synthetic circuit we
LasR LasI/LasR
3oC12HSL
Constitutive
LasR
rfpLasI
Biofilm Dispersal
PlasI
LasR
Q
bdcAE50Q
E. coli
PCP25 lasR
LasR
LasR
PAra bNos
1% Arabinose
NO
lasI
echA
Degradeepichlorohydrin
NosEH
A
B
BdcAE50
Fig. 1. The self-controlled strain can regulate its own biofilm growth. (A) Genecircuit for the self-controlled biofilm strain. E. coli was engineered to limit its ownbiofilm formation using the LasI/LasR QS module of P. aeruginosa. The genes forthe LasI protein and the engineered biofilm dispersal protein BdcA E50Q arecontrolled by the lasI promoter. When LasI is produced, it synthesizes the QS signal3oC12HSL; upon reaching a threshold value based on increasing cell density, the QSsignal binds to LasR (which is constitutively produced via the CP25 promoter alongwith RFP to visualize the cells). The 3oC12HSL+LasR complex activates the lasIpromoter, which leads to increasing production of dispersal protein BdcA E50Q ascell density increases. The BNos and epoxide hydrolase are induced by addingarabinose. (B) Biofilm formation visualized with confocal microscopy on glass sur-faces after 48 h for the QS signal-negative control strain (LasR) that lacks LasI (TG1/pBdcAE50Q-rfp-lasR) and the LasI/LasR self-controlled biofilm strain (TG1/pBdcAE50Q-lasI-lasR). (Scale bars, 20 μm.) LasR (control) vs. LasI/LasR biofilm valuesfor these figures were 4.2 μm3/μm2 vs. 0.52 μm3/μm2, respectively, for averagebiomass and 9.11 μm vs. 1.18 μm, respectively, for average thickness.
2 of 10 | www.pnas.org/cgi/doi/10.1073/pnas.1521731113 Wood et al.

assembled regulates its own biofilm amount and thickness oncommercial membranes.Water fluxes through the membrane were measured at different
feed salt (NaCl) concentrations to compare the effect of biofoulingby the self-controlled strain with that by the QS signal-negativestrain. By measuring filtered water flux, known as “permeate flux,”at a series of NaCl concentrations, the resistance of the membraneto water flow can be evaluated. Comparing clean membrane fluxes(incubated with medium) with fouled membrane fluxes (incubatedwith medium and biomass) provides a measure of biofilm re-sistance. On the other hand, tracking salt rejection for differentbiofilms provides an understanding of the extent of salt accumu-lation (or the degree of concentration polarization) at the mem-brane surface and its contribution to flux decline. An accounting ofthe clean membrane resistance and biofilm resistances under var-ious conditions is provided in SI Appendix, Fig. S2 and Table S3.A series of flux experiments for three independent colonies of
each strain revealed that application of the self-control syntheticcircuit can decrease flux decline caused by uncontrolled fouling by50% (Fig. 2D). Moreover, when the self-controlled strain was used,NaCl rejection was improved by 11%, indicating lower concen-tration polarization (SI Appendix, Table S4). Overall, by controllingits biofilm formation, the self-controlled biofilm increases operat-ing membrane flux significantly by reducing biofouling.
Deleterious Biofilm Formation Is Reduced and Permeate Flux IsIncreased by the Beneficial Biofilm That Produces NO. To create astrain capable of dispersing a wide range of biofilms to limit bio-fouling on RO membranes, the gene encoding NOS from Bacillussubtilis (bNos) (33) was added to the self-controlled strain to form astrain that limits its own biofilm formation and also produces NOto disperse deleterious biofilms. This strain, is referred to as “E. coliTG1/pBdcAE50Q-lasI-lasR/pBNos” (cell schematic shown in Fig.1A), henceforth “beneficial biofilm strain.” A 96-well plate assay
was performed to confirm that the QS circuit was still active afterthe addition of pBNos plasmid; the beneficial biofilm strain hadsixfold less biofilm after 24 h than the negative control strain (E. coliTG1/pBdcAE50Q-lasI-lasR/pBad), which lacks NO synthesis (SIAppendix, Fig. S1). After 24 h, the beneficial biofilm strain pro-duced 11 ± 4 μM of NO, three- to sixfold higher than the controlstrain E. coli TG1/pBdcAE50Q-lasI-lasR/pBad (Fig. 3A).P. aeruginosa, which is ubiquitous in soil and water, is one of the
most prevalent biofouling strains in membrane systems and has beenisolated from biofilms on water treatment membranes (12, 13, 15). Itis used as a model bacterium for membrane-fouling studies becauseof its ability to form biofilms and because the genetic basis of itsbiofilm formation is well studied (40). Sphingomonads are anotherkey biofouling organism in membrane systems; they colonizemembrane and spacer surfaces rapidly and cover them with theirextracellular polymeric substances (14). Therefore S. wittichii (41)also was used in this study as a model bacterium for biofouling.To demonstrate that the beneficial biofilm strain can inhibit
biofilm formation on membranes by deleterious bacteria, the ac-tivity of NO against the biofilm formation of P. aeruginosa wasassayed by tagging the beneficial biofilm with red fluorescent pro-tein (RFP) and P. aeruginosa with green fluorescent protein (GFP).Confocal microscopy (Fig. 3 B–E) showed that the beneficial bio-film strain reduced the P. aeruginosa biofilm biomass by around 40-fold and reduced the average biofilm thickness by around 100-fold(Fig. 3F) compared with the negative control E. coli TG1/pBdcAE50Q-lasI-lasR/pBad, which does not produce NO. Criti-cally, in the absence of NO, the P. aeruginosa biofilm dominated theE. coli control biofilm by forming sporadic patches on the mem-brane, often where E. coli was present [P. aeruginosa consortialbiofilm (PAO1) and E. coliNO− in SI Appendix, Table S5], reducingmembrane flux by almost 31% after 15 h compared with the self-controlled strain without P. aeruginosa (PAO1 and E. coli NO−
in Fig. 3 G and E. coli NO− in SI Appendix, Fig. S3). However,
A B
C D
0 2 4 6 8 10 12 14 16
6
8
10
12
14
16
18
LasR
LasI/LasR
Perm
eate
Flux
(LM
H)
NaCl Conc. (mM)
Bio
film
Bio
mas
s (µ
m³/ µ
m²)
0.0
0.2
0.4
2
6
10
14
0.0
0.4
0.8
Bio
film
Thi
ckne
ss (µ
m)
LasRLasR
LasI/LasR
LasI/LasR
10
20
30
Fig. 2. The self-controlled strain biofilm increases membrane permeate flux. Comparison of growth and resulting permeate fluxes for E. coli TG1/pBdcAE50Q-lasI-lasR (the self-controlled strain, LasI/LasR) and E. coli TG1/pBdcAE50Q-rfp-lasR (22), which lacks LasI (the QS signal-negative strain, LasR), onNF90 membranes. (A) Representative image of the uncontrolled biofilm formed for the QS signal-negative strain on membranes after 24 h. Additional imagesof biofilm are provided in SI Appendix, Table S1. (B) Representative image of the biofilm formed by the self-controlled strain on membranes after 24 h.Additional images of biofilm are provided in SI Appendix, Table S2. (Scale bars, 20 μm.) (C) Biofilm biomass and average biofilm thickness for the QS signal-negative strain and the self-controlled strain. (D) Comparisons of permeate flux through membranes with the self-controlled strain and the QS signal-negative control strain. All values are averages of three independent colonies (n = 3), and the error bars are SD from six samples.
Wood et al. PNAS Early Edition | 3 of 10
ENVIRONMEN
TAL
SCIENCE
SPN
ASPL
US

production of NO by the beneficial biofilm strain reduced biofoulingby reducing the biofilm of the deleterious species (PAO1 and E. coliNO+ in Fig. 3G). Without NO, the control biofilm generated 165%more resistance to flux because of P. aeruginosa infiltration into the
biofilm (SI Appendix, Table S3). Thus, the control consortial biofilmgenerated an additional resistance that approximately doubled theclean membrane resistance, whereas the beneficial biofilm essen-tially negated this increase. The beneficial biofilm produced per-meate flux similar to that of the self-controlled strain (compareLasI/LasR in Fig. 2D with E. coli NO+ in SI Appendix, Fig. S3), sothe production of NO by the beneficial strain did not affect per-meate flux. As a positive control for NO dispersal of P. aeruginosa,sodium nitroprusside (SNP) was used to generate NO, which dis-persed the P. aeruginosa biofilm in 96-well plates; at 5 μM SNP,normalized P. aeruginosa biofilm was reduced by 80% (SI Appendix,Fig. S4). Therefore, by controlling the formation of the deleteriousbiofilm strain by the production of NO, the self-controlled biofilmincreased membrane operating flux.We also investigated the ability of the beneficial biofilm to inhibit
the biofilm of the other prominent biofouling organism, S. wittichii.S. wittichii produced less biofilm than P. aeruginosa under all con-ditions tested (SI Appendix, Fig. S5). On membranes with consortia,without the presence of NO, the control strain E. coli TG1/pBdcAE50Q-lasI-lasR/pBad could not prevent S. wittichii biofilmformation after 2 d, as evident from the larger total biofilm biomassfound on the membrane (Fig. 4A) relative to the E. coli control strainportion of the consortial biofilm (Fig. 4B); in fact, most of theconsortial biofilm was that of S. wittichii. In contrast, in the presenceof NO produced by the beneficial biofilm strain (E. coli TG1/pBdcAE50Q-lasI-lasR/pBNos), total biofilm formation (Fig. 4C) wasreduced by more than an order of magnitude (Fig. 4E). Because thebiofilm biomass of the portion of the consortium that is the beneficialstrain (Fig. 4D) is roughly the same as the total biofilm (Fig. 4C), theS. wittichii biofilm was almost completely eliminated when NO wasproduced by the beneficial biofilm strain. Therefore, our beneficialstrain provides a general solution for preventing biofouling because itreduces biofilm formation by both P. aeruginosa and S. wittichii. Notethat, unlike the consortial biofilm experiments with P. aeruginosa, inwhich the pseudomonad was tagged with GFP, we determined theS. wittichii biofilm levels by subtracting the E. coli biofilm levels(determined by RFP levels) from the total biofilm that was de-termined by staining both strains with SYTO9 (green).We also conducted long-term cross-flow filtration challenge tests
to determine the robustness of our approach under the shear andpressure conditions typically seen in spiral-wound membrane systemsoperating at plant scales. We conducted these tests for 2–5 d, leadingto substantial declines in productivity, reaching over 50%, with a well-validated cross-flow system (Osmonics SEPA Cell) with Dow NF90membranes and a computerized control system built to allow oper-ation at constant pressure. In all experiments, the membranes werefirst conditioned with either the control strain (the self-controlledstrain with no NO release capabilities, E. coli NO−, TG1/pBdcAE50Q-lasI-lasR/pBad) or the beneficial strain (the self-controlled strain with NO release capabilities, E. coli NO+, TG1/pBdcAE50Q-lasI-lasR/pBNos) for 24 h in cross-flow mode but withminimal permeation by maintaining a transmembrane pressure of40 psi, and then the pressure was increased to 200 psi and permeatemeasured. The system conditioned with control biofilms (E. coliNO−)showed a rapid flux decline in 4,000 min (∼3 d) to ∼55% of initialflux, whereas the beneficial biofilm restricted the flux decline to∼34%, a decrease of ∼40% (Fig. 5). Critically, the beneficial biofilm-enhanced membranes could be run longer, for ∼4 d, under challengeconditions without the flux decline reaching 50% (SI Appendix, Fig.S6). In these experiments the conditioning biofilms were started withan initial E. coli turbidity at 600 nm of 0.01 in the system feed andwere challenged with P. aeruginosa PAO1 at an initial turbidity of0.002 in the system feed. Another set of experiments was conductedwith higher microbial loads (initial conditioning films with E. coli at aturbidity of 0.05 and P. aeruginosa PAO1 at a turbidity of 0.01) andled to similar differences in flux decline but over a shorter time scale(∼24 h of challenge) (SI Appendix, Fig. S7).
P
AO
1/ E
. col
i (B
iom
ass)
PA
O1/
E. c
oli (
Thic
knes
s)
C
D E
G
PAO1+E. coli NO+
PAO1+E. coli NO-
PAO1+E. coli NO-
PAO1+E. coli NO+
A
B
F
0
2
12
14
16
4
6
8
10N
OC
onc.
(µM
)
Beneficial (+Ara)
Beneficial (-Ara)
Control (-Ara)
Control (+Ara)
04
8
122060
100
024682080140
0 2 4 6 8 10 12 14 16
68
101214161820
Perm
eate
Flu
x (L
MH
)
NaCl Conc. (mM)
PAO1 + E. coli NO+PAO1 + E. coli NO-
Fig. 3. The NO-producing beneficial biofilm decreases P. aeruginosa biofilmformation on membranes. (A) NO production by the beneficial biofilm strain(E. coli TG1/pBdcAE50Q-lasI-lasR/pBNos) after 24 h in M9G medium with15 mM arginine (substrate for NOS) compared with the control strain (E. coliTG1/pBdcAE50Q-lasI-lasR/pBad). Arabinose induces the bNos gene. Confocalmicroscopy was used to discern the biofilm formation of the P. aeruginosaand the E. coli beneficial biofilm consortium developed on the RO mem-brane after 48 h. The biofilm formation by each bacterium in the consortiumis shown separately. (B and C) P. aeruginosa consortial biofilm (PAO1)(B) and consortial biofilm of the E. coli control strain (E. coli TG1/pBdcAE50Q-lasI-lasR/pBad) that does not produce NO (E. coli NO−) (C). (D and E) Con-sortium of the P. aeruginosa biofilm (D) and the beneficial biofilm strain(E. coli TG1/pBdcAE50Q-lasI-lasR/pBNos, E. coli NO+) (E). (Scale bars, 20 μm.)Representative images are shown; additional images are shown in SI Ap-pendix, Tables S5 and S6. (F) COMSTAT analysis of the ratio of the consortiabiofilm biomass and ratio of the average thickness. The error bars representSDs from a sample size of 15. (G) Membrane flux measurements withP. aeruginosa (PAO1)/E. coli biofilm consortia on NF90 membranes. The errorbars are SDs from three independent experiments for each type of consortialchallenge, i.e., PAO1/E. coli NO− and PAO1/ E. coli NO+.
4 of 10 | www.pnas.org/cgi/doi/10.1073/pnas.1521731113 Wood et al.

Biofilm analysis of the membranes subjected to the long-termcross-flow (3–4 d) tests corroborated the permeate flux results, inthat an order of magnitude less colonization of the membranes bythe challenge organisms (P. aeruginosa PAO1) was seen when themembranes were conditioned by the beneficial biofilm (E. coliNO+)than when membranes were conditioned by the control biofilm(E. coliNO−) (Fig. 5). The total biomass for the beneficial biofilm-conditioned membranes challenged by P. aeruginosa PAO1 was lim-ited to 0.017 (± 0.001) μm3/μm2, whereas it was 0.35 (± 0.02) μm3/μm2
for the membranes conditioned by control biofilms. Because both thecontrol and beneficial biofilms were based on the self-controlledLasI/LasR system, the overall biofilm formation was limited, asexpected. The biomass value of the control strain alone was∼0.10 μm3/μm2 (i.e., the difference between the total biomass andthe P. aeruginosa PAO1 biomass) at the end of ∼4 d, similar to thatseen after 1 d for the batch experiments (∼0.20 μm3/μm2) (Fig. 2),indicating the self-controlled strain was maintained.
Epichlorohydrin Degradation by the Beneficial Biofilm. Epichlorohy-drin is a common precursor for synthesizing glycerins, epoxy resins,elastomers, pesticides, textiles, membranes, paper, and pharma-ceuticals (35); it harms the skin, liver, kidneys, and central nervoussystem and is a potential carcinogen (42). Epichlorohydrin is rec-ognized as a water contaminant and has a concentration limit ofzero in water supplies (36, 37). Epichlorohydrin can be degraded bythe EH from A. radiobacter AD1 (43), and engineered variants ofEH (F108L/I219L/C248I) enhance epichlorohydrin degradationsixfold (44); hence, the engineered EH from this organism (44) wasused in this study so the beneficial biofilm could simultaneouslyperform bioremediation and prevent biofouling.Epichlorohydrin, as a small hydrophobic compound, passes
through the membrane used in this study (SI Appendix, Fig. S8). Asa planktonic culture, the beneficial strain that produces EH fromechA (E. coli TG1/pBdcAE50Q-lasI-lasR/pBNos-echA) degradedepichlorohydrin at a rate of 3.7 ± 0.4 nmol·min−1·mg−1 of protein (SIAppendix, Fig. S9), but there was no epichlorohydrin degradationin the control strain that lacks EH (E. coli TG1/pBdcAE50Q-lasI-lasR/pBNos). Furthermore, when grown on the NF90 membrane,the beneficial biofilm that produces EH degraded epichlorohy-drin by more than 39 ± 4% in single-pass batch filtration (Fig. 6and SI Appendix, Fig. S10). Therefore, the beneficial biofilm thatproduces EH is capable of degrading the environmental pollutantepichlorohydrin while controlling its own biofilm formation andlimiting the biofilm formation of deleterious strains.
DiscussionWe have demonstrated a previously unreported approach as a proofof concept and as an industry-relevant system for combating biofoul-ing in membrane systems by using the feature of biofilms that makesthem a challenge in many systems—their persistence—in a beneficialmanner. At the core of this work is a QS circuit we engineered tocreate a beneficial biofilm that effectively limits its own biofilm for-mation. We also produced the biofilm-dispersing agent NO in thebeneficial strain and effectively limited the biofilm formation of dele-terious bacteria P. aeruginosa and S. wittichii; both organisms have beendemonstrated to be important fouling agents for membranes. Wefurther developed the biofilm into a platform for treating refractorypollutants that escape or are modified through the upstream treatmentprocess and can even pass through RO membranes. Currentlymicropollutants that pass through NF and RO membranes, such asN-nitrosodimethylamine (45) and 1,4-dioxane (46), must be treated usingevenmore advanced techniques such as high-intensityUV radiation (47).To develop the approach presented further, the plasmid-based
systems shown to work here should be stabilized by integrating therequired functional elements into the chromosome, thereby limitingthe transfer of these genetic elements to other microorganisms. Inaddition, proven conditional suicide systems may be added thatwould prevent the beneficial biofilm strain from propagating shouldit be released (48); however, the evolutionary pressure would be tolose the biofilm self-control circuit, because biofilms are used bynearly all bacteria to increase fitness. Also, our system needs to betested further for its long-term effectiveness against more complexenvironmental samples, recognizing that each environmental sys-tem may require a different beneficial strain.We designed the membrane experiments to demonstrate the
effectiveness of the beneficial biofilm while carefully consideringand balancing actual membrane system operation and the need to
0.0
1.6
2.0
2.4
2.8
0
10
40
60
80
100
S. w
ittic
hii+
E.co
li (T
otal
Bio
mas
s)
S. w
ittic
hii /E
. col
i (B
iom
ass
Rat
io)
0.2
S. witti
chii+E. coli NO-
S. witti
chii+E. coli NO+
S. witti
chii/E. coli N
O-
S. witti
chii/E. coli N
O+
A B
C D
E
Fig. 4. The NO-producing beneficial biofilm decreases S. wittichii biofilm for-mation on membranes. (A) Total biofilm of the consortium of S. wittichii withthe control (E. coli TG1/pBdcAE50Q-lasI-lasR/pBad, E. coli NO−) after 48-h chal-lenge at 30 °C in M9G medium supplemented with 15 mM arginine and 1.6%arabinose. The confocal images were taken after SYTO9 staining to observetotal biofilm on the membranes. (B) Consortial biofilm of the RFP-taggedcontrol strain which did not produce NO (E. coli NO−). (C) Total biofilm of theconsortium of S. wittichii and the beneficial biofilm strain which produces NO(E. coli TG1/pBdcAE50Q-lasI-lasR/pBNos, E. coli NO+). (D) Consortial biofilm ofthe RFP-tagged, NO-producing, beneficial biofilm strain. (Scale bars, 20 μm.)Representative images are shown; additional images are shown in SI Appendix,Tables S8 and S9). (E) COMSTAT analysis of S. wittichii and E. coli consortialbiofilm biomass (expressed in cubic micrometers per square micrometer) andthe ratio of S. wittichii biomass to E. coli biomass. The error bars represent SDsfrom a sample size of six. E. coli biomass (RFP-tagged) was subtracted from thetotal biomass (stained with SYTO9) to determine the S. wittichii biomass.
Wood et al. PNAS Early Edition | 5 of 10
ENVIRONMEN
TAL
SCIENCE
SPN
ASPL
US

obtain reproducible data. Hence, the development of the beneficialbiofilm forming the conditioning film on the membrane was con-ducted both with and without shear, but in all cases at low pres-sures so no filtration occurred. In full-scale plants, this approachcan be implemented by using the cleaning setup to flow culturesthrough the system in recirculation mode without filtration to buildthe beneficial biofilm. Such operation in the flushing mode iscommon during chemical cleaning of membrane modules.Additionally, the flux measurements were conducted both under
filtration conditions in a dead-end mode with the use of a stirredcell that simulates the shear that is seen in cross-flow membranesystems (49) and is a widely used technique for rapid evaluation offouling trends (50) and in the cross-flow filtration mode under NF/RO practice-relevant conditions. The challenge experiments withP. aeruginosa and S. wittichii were conducted initially without
shearing and filtration (Figs. 3 and 4) to provide the most conser-vative estimate of the efficacy of the beneficial biofilms in preventingcolonization by these challenge strains (51). We also evaluated thebeneficial biofilm by challenging it with P. aeruginosa under shearstress using industrially relevant cross-flow and pressure conditionsand found that the beneficial biofilm maintained an order of mag-nitude less biofilm biomass than the control strain (Fig. 5 A–E). Thisresult was reflected in ∼30–40% less flux decline with the beneficialstrain than with the control strain under similar hydrodynamic andtemporal conditions (Fig. 5F). Therefore, the beneficial strain hasbeen demonstrated to be effective in minimizing biofilm, not only indead-end batch systems but also under high-pressure and shear-dominated cross-flow conditions used in large-scale applications.Possible additional industrial settings for the use of the benefi-
cial biofilm include cooling towers, water distribution systems, and
P
AO
1+E
. col
i (To
tal B
iom
ass)
PA
O1
(Bio
mas
s)
PAO1+E. coli NO-
PAO1+E. coli NO+
PAO1+E. coli NO-
PAO1+E. coli NO+
0.2
0.4
0.6
0.00
0.02
0.04
0.2
0.3
0.4
0.5
0.00
0.02
0.04
A
vera
ge N
orm
aliz
ed F
lux
Time (min)0 1000 2000 3000 4000
0.45
0.65
0.85
1.05PAO1/E. coli NO+PAO1/E. coli NO-
A B
C D
E F
Fig. 5. The beneficial biofilm reduces the formation of P. aeruginosa PAO1 biofilm on membranes and mitigates flux decline under cross-flow conditions.(A) Deconvoluted P. aeruginosa PAO1 consortial biofilm on an NF90membrane. (B) Deconvoluted E. coli control strain (TG1/pBdcAE50Q-lasI-lasR/pBad) that does notproduce NO (E. coli NO−) consortial biofilm on an NF90 at the same position asA. (C and D) Deconvoluted consortium of the P. aeruginosa PAO1 biofilm (C) and thebeneficial biofilm strain (E. coli TG1/pBdcAE50Q-lasI-lasR/pBNos, E. coli NO+) (D) under hydrodynamic conditions similar to those in A and B. (Scale bars, 20 μm.)Representative images are shown; additional images are in SI Appendix, Tables S10 and S11). (E) COMSTAT analysis of consortia biofilm biomass and P. aeruginosaPAO1 biomass is expressed in cubic micrometers per square micrometer. The error bars represent SDs from a sample size of six. (F) Average normalized flux profilemeasured at ∼200 psi applied pressure under cross-flow conditions with the P. aeruginosa (PAO1)/E. coli biofilm consortia on NF90 membranes.
6 of 10 | www.pnas.org/cgi/doi/10.1073/pnas.1521731113 Wood et al.

in-building HVAC systems [implicated in Legionnaires’ disease (52,53)]. The approach proposed also can be extended to other mem-brane technologies such as membrane bioreactors and forward os-mosis for contaminant degradation and biofouling prevention withproper controls on engineered biofilm proliferation.Beyond water treatment, biomedical applications that would rely on
limiting biofilm formation could include biofilm prevention in medicalcatheters (54), biomedical implants (55), and perhaps even biofilm-related human diseases (56) such as cystic fibrosis (57), endocarditis(58), dental plaque (59), and chronic rhinosinusitis (60). The use ofbeneficial biofilms to combat biofilm-related diseases could reduce theuse of antibiotics and help combat the rise of antibiotic resistance.Treatment of antibiotic-resistant Helicobacter pylori infection is rele-vant in this context (61), because the first-line antibiotics are provingincreasingly ineffective against H. pylori biofilms (62); the beneficialbiofilm, after suitable modifications, possibly could be used as an al-ternative treatment strategy. Overall, the general scheme we de-veloped has the potential for combating many problems that arisebecause of the uncontrolled proliferation of bacteria in biofilms.
MethodsBacterial Strains and Culture Conditions. All strains and plasmids used in thisstudy are summarized in Table 1. All strains were grown in lysogeny broth (LB)(63) or minimal medium with 0.4% glucose (M9G) (64) at 37 °C. Chloram-phenicol (Cm) (300 μg/mL) was used to maintain pCA24N-based plasmids inE. coli; carbenicillin (Cb) (250 μg/mL) was used to maintain pBad in E. coli andalso was used to maintain pMRP9-1 in P. aeruginosa PAO1; pMRP9-1 allowedP. aeruginosa to be taggedwith GFP. During coculture with E. coli, P. aeruginosawas not affected by the Cm (300 μg/mL) because it is naturally resistant to thisantibiotic. S. wittichii RW1 was obtained from Sharon L. Walker, University ofCalifornia, Riverside, CA, and was grown in M9G nutrient medium containingpeptone (5 g/L) and beef extract (3 g/L) or in LB at 30 °C.
Plasmid Construction. Plasmid pBdcA E50Q-lasI-lasR contains bdcAE50Q (39)and lasI under the control of lasI promoter and rfp and lasR under the controlof the constitutive CP25 promoter. lasI was amplified from pHha13D6-gfp-lasI(22) using the lasI-SalI forward and lasI-HindIII reverse primers (SI Appendix,Table S7) and was cloned into pBdcAE50Q (22) at the SalI and HindIII re-striction sites to form pBdcAE50Q-lasI. The constitutive promoter CP25, rfp,and lasR fragment was obtained by digesting the pBdcAE50Q-rfp-lasR plasmid(22) with BlpI and was inserted into the pBdcAE50Q-lasI plasmid at the BlpI sitedownstream of the lasI gene to form pBdcAE50Q-lasI-lasR.
To construct the pBNos-echA plasmid, the echA gene was amplified by PCRusing pBSKan (EH, F108L/I219L/C248I) (44) as the template with the EH HindIIIforward and EH SalI reverse primers (SI Appendix, Table S7). The PCR products
were double digested with HindIII-HF and SalI-HF and ligated into pBNos (33),yielding pBNos-echA.
All plasmids were verified by DNA sequencing. The oligonucleotides weresynthesized by Integrated DNA Technologies.
Biofilm Formation Assay Using Crystal Violet. Biofilm formation was assayed in96-well polystyrene plates using 0.1% crystal violet staining as described pre-viously (65) with some modifications. Diluted overnight cultures at an initialturbidity at 600 nm of 0.05 were inoculated into 96-well plates with M9G withappropriate antibiotics, and the bacteria were cultured for 24 h at 37 °C withoutshaking. SNP (Sigma-Aldrich) was used For the P. aeruginosa biofilm dispersalcontrol. After the crystal violet was added to each well, the wells were rinsed anddried, and ethanol was added to dissolve the crystal violet. The total biofilmformation samples were measured at 540 nm, and cell growth was measured at620 nm. Biofilm formation was normalized by the bacterial growth to reduceany growth effect. At least three independent cultures were used for each strain.
Biofilm Formation Assay Using Confocal Microscopy. The overnight cultureswere diluted to an initial turbidity at 600 nm of 0.05 and were inoculated intoM9G in glass-bottomed dishes (catalog no. 150680; Nunc, Thermo Scientific)for 24 h at 37 °C without shaking. Fresh M9G medium (1 mL) was added tothe dishes, and they were incubated for another 24 h at 37 °C. For thebiofilm experiments with P. aeruginosa, diluted overnight cultures of E. coli(turbidity at 600 nm of 0.01) were inoculated into M9G in glass-bottomeddishes for 24 h at 37 °C without shaking. Overnight cultures of P. aeruginosawere added to the dishes at an initial turbidity at 600 nm of 0.1, and 15 mMof arginine and 1% arabinose were added to the culture. The dishes wereincubated for another 24 h at 37 °C.
Confocal microscopy images were taken using a 63×/1.4 oil objective lens(HCX PL APO CS 63.0 × 1.4 OIL UV) with a TCS SP5 scanning confocal lasermicroscope (Leica Microsystem), and images were obtained using an argon laserwith emission set between ∼500 and 540 nm in one photomultiplier tube(green channel) and emission set between ∼550 and 650 nm in the otherphotomultiplier tube (red channel). A double dichoric lens was used to filteremitted light to visualize RFP (E. coli), and a triple dichoric lens was used to filteremitted light to observe both RFP (E. coli) and GFP (P. aeruginosa). For consortiaof S. wittichii and E. coli, membrane samples were incubated with 5 mL 5 μMSYTO 9 in 0.85% NaCl for 1 h under light-insulated conditions to stain the totalbiofilm from both S. wittichii and E. coli and were washed with 0.85% sterileNaCl solution to remove excess dye. The samples were analyzed using the sameprocedure, except that the red channel emission was collected between ∼560and 650 nm (for RFP-tagged E. coli) to minimize interference from the greenchannel. The S. wittichii biofilm cells were determined by subtracting the redE. coli biofilm signal from the total green signal. Using the confocal z-stackimages, 3D reconstruction of the biofilm architecture was performed usingIMARIS software (Bitplane Inc.). Biomass was obtained using COMSTATimage-processing software (66). At least three different areas were observed,and average biomass was reported. At least three independent cultures weretested in this manner, and representative images are shown.
NO Assay. The final products of NO produced in vivo are nitrite and nitrate;thus, the sum of the nitrite and nitrate concentrations is directly correlated tothe level of NO production (33). Nitrate and nitrite concentrations weremeasured using a nitrate/nitrite colorimetric assay kit (Cayman Chemicals).Diluted overnight cultures at an initial turbidity at 600 nm of 0.05 wereinoculated into M9G for 48 h at 37 °C. Arginine (15 mM) was added as thesubstrate, and 1% arabinose was added to induce NO production. At leastthree independent cultures were tested.
EH Assay. A chromogenic reaction of epoxide epichlorohydrin with 4-nitro-benzylpyridine was used to measure the activity of EH (67) using planktoniccells. The assay was performed in 1.5-mL microcentrifuge tubes as describedpreviously (44). Diluted overnight cultures at an initial turbidity at 600 nm of 0.05were inoculated in LB with 1% arabinose at 37 °C. The culture (100 μL) at aninitial turbidity at 600 nm of 1 was contacted with 400 μL of 5 mM epichloro-hydrin in Tris EDTA buffer (pH 9.0) at 37 °C; then 250 μL of 4-nitrobenzylpyridine[100 mM in 80% (vol/vol) ethylene glycol and 20% (vol/vol) acetone] was added.After the samples were heated at 80 °C for 10 min, 250 μL of 50% trimethyl-amine (in acetone) was added. The samples were measured at 520 nm. At leastthree independent cultures were tested. The protein content of E. coli TG1 (68)(0.22 mg of protein·mL−1·OD−1) was used to calculate the epichlorohydrindegradation rate.
Dead-End Filtration Membrane Biofilms. Biofilms were grown on membranesfor 24 h in M9G in a VWR gravity convection incubator. The membrane used
EH-
0% removal 39 ± 2% (n=3) removal
Engineered biofilmControl biofilm
Membrane
Membrane
EH+
A B
Fig. 6. The beneficial biofilm degrades the micropollutant epichlorohydrin thatpasses through the membrane. Epichlorohydrin removal was tested using biofilmsof E. coli [TG1/pBdcAE50Q-lasI-lasR/pBNos (EH−) and E. coli TG1/pBdcAE50Q-lasI-lasR/pBNos-echA (EH+)] developed in 24 h on NF90 membranes in M9G mediumwith 15mM arginine and 1.6% arabinose. The control biofilmwas challengedwith10 mM epichlorohydrin in 5 mM NaCl feed solution (pH ∼9.0). Epichlorohydrinadsorption to the cellular biomass was subtracted from the total removal amountto determine the actual enzymatic removal levels shown here (SI Appendix, Fig.S10). (A) No enzymatic removal was observed with the control biofilm of E. coliTG1/pBdcAE50Q-lasI-lasR/pBNos (EH−) on NF90 membranes. (B) Removal of epi-chlorohydrin by beneficial biofilm (E. coli TG1/pBdcAE50Q-lasI-lasR/pBNos-echA orEH+) was 39% at 30 min after the filtration began under similar process and feedconditions. The error values are SD for three independent colonies.
Wood et al. PNAS Early Edition | 7 of 10
ENVIRONMEN
TAL
SCIENCE
SPN
ASPL
US

was the commercially available DOW NF90 thin film composite polyamidetype. An Advantec MFS UHP-76 stirred cell with an effective membrane areaof 35.3 cm2 was used for growing biofilms on membranes and for con-ducting permeability tests. A flat sheet of the NF90 membrane was placedunder the O-ring and above the spacer of the stirred cell. The inner volume(450 mL) of the stirred cell was sterilized with 95% ethanol, and cells wereadjusted to a turbidity at 600 nm of 0.5 in M9G medium. The cells wereadded to the stirred cell to a total liquid volume of 300 mL and were grownwithout stirring for 24 h to form the biofilm. Small pieces of the membranes(∼5 × 5 mm) were used for confocal laser-scanning microscopy.
Dead-End Filtration Consortial Biofilms. To challenge the beneficial biofilmwithP. aeruginosa PAO1/pMRP9-1 (GFP tagged) and to ascertain the dispersal ac-tivity of the beneficial strain, both the NO− control strain, E. coli TG1/pBdcAE50Q-lasI-lasR/pBad, and the E. coli NO+ beneficial strain, E. coli TG1/pBdcAE50Q-lasI-lasR/pBNos, (both RFP tagged) were grown as biofilms on NF90membranes for 24 h as described above. The medium was discarded and wasreplaced with fresh M9G medium (300 mL) containing 15 mM L-arginine (sub-strate for NO synthase) and 1.6% L-arabinose inducer for bNos. An overnightculture of P. aeruginosa in LB with 1.6% arabinose and 15 mM of arginine wasadded to each stirred cell to make an initial turbidity at 600 nm of 0.1. Thestirred cells were incubated for 24 h. Small sections of the membranes fromdifferent regions were imaged for biofilms under confocal microscopy usingcombined green and red fluorescence lasers. At least 15 different membranebiofilm samples, spanning three independent cultures, were analyzed to de-termine average biofilm thickness and biomass.
The beneficial biofilm was grown under similar conditions for challengewith S.wittichii. After 24 h of growth of the E. coli NO+ beneficial strain (E. coliTG1/pBdcAE50Q-lasI-lasR/pBNos) or the NO− control strain (E. coli TG1/pBdcAE50Q-lasI-lasR/pBad), the medium was removed, and the stirred cell was washedwith M9G without any antibiotics. An overnight culture of S. wittichii in LBwith 1.6% arabinose and 15 mM of arginine was added to each stirred cell tomake an initial turbidity at 600 nm of 0.5 in M9G medium without antibiotics.The stirred cells were incubated for 48 h at 30 °C, the medium was removed,and the membrane samples were stained with SYTO9.
Dead-End Filtration Membrane Flux Assays. All flux measurements were con-ductedunder filtration conditions in a stirred cell that simulates the shear seen incross-flowmembrane systems; this technique is widely used for rapid evaluationof fouling trends (49, 69) and has been used for the development of foulingindices. Flux experiments were performed immediately following biofilmgrowth using 0, 5, 10, and 15 mM NaCl. After the medium was removed, thestirred cell was washed three times with 15 mM NaCl, and the stirrer andsample-withdrawal tubes were loaded into the cells. Simultaneously, solutionsof 25% feed NaCl concentrations were loaded into the 1-L Amicon reservoir(EMDMillipore). In this way, any variation of feed concentration during the fluxexperiment in the dead-end filtration mode was minimized. The reservoir NaClconcentrations were 0, 1.25, 2.5, and 3.75 mM. Thereafter, the reservoir and thestirred cell were pressurized to 50 psi using N2, and the stirring speed wasmaintained at 400 rpm. Permeate water weight was collected every 30 s usingan automated A&D FX-300i balance and analyzed using WinCT RS Weightsoftware, v. 3.00. The experiments were continued for 20–30 min for each feedconcentration. Conductivities of permeate and feed were measured using an
Orion VERSA STAR conductivity meter (model VSTAR 50) from Thermo Scien-tific. The measured flux in grams per minute was converted into liters persquare meter per hour for comparisons of membrane performance.
Long-Term Cross-Flow Filtration Biofilm Challenge Experiments. Biofilm devel-opment under cross-flow conditions was performed according to Herzberg andElimelech (9) with some modifications. A 0.5% bleach solution was circulatedthrough the cross-flow RO system built around an Osmonics SEPA cell (Sterilitech)for 2 h in recirculation mode to disinfect the system. Following disinfection,deionized (DI) water was introduced in flushing mode to rinse the system for10 min, and then trace organic matter was removed with 5 mM EDTA at pH∼11 (1 mM NaOH) under recirculation mode for 30 min. The unit was rinsed againwith DI water for 30 min in flushing mode, and 95% ethanol was recirculatedthrough the system for 1 h for further sterilization. Autoclaved DI water was in-troduced to flush the system of residual ethanol. An ethanol-sterilized and auto-claved water-washed NF90 membrane was loaded in the system along with a feedspacer (as indicated), and membrane compaction was performed overnight withautoclaved DI water with the temperature adjusted to 27 °C at 200 psi. Four litersof M9G medium was introduced with 300 μg/mL Cm and 250 μg/ mL Cb withoutarginine/arabinose, and the membrane was conditioned for 4 h at 27 °C at 200 psi.Centrifuged (3,750 × g for 10 min at 4 °C) E. coli NO− or E. coli NO+ cells fromovernight cultures were added to the 4 L of M9G medium to an initial turbidity at600 nm of 0.01 or 0.05. The E. coli biofilms on the membranes were developed for24 h at ∼40 psi at 27 °C in recirculation cross flow without any filtration. The feedsolution was removed, the systemwas flushed with 4 L of freshM9Gmedium, andcentrifuged (3,750 × g for 10 min at 4 °C) P. aeruginosa PAO1 cells from overnightcultures were added to another freshly prepared 4 L of M9G with 300 μg/mL Cmand 250 μg/mL Cb supplemented with 15 mM L-arginine and 1.6% L-arabinose atan initial turbidity of 0.002 or 0.01. The challenge experiment continued for∼72–96 h (depending on system stability) at ∼200 psi at 27 °C with collection offlux data. After the completion of the experiments, the membranes were col-lected in 0.85% sterile NaCl solution, and immediate confocal microscopy anal-ysis was performed on different sections of the membrane.
EH Removal via Once-Through Membrane Treatment. E. coli TG1/pBdcAE50Q-lasI-lasR/pBNos-echA and control (E. coli TG1/pBdcAE50Q-lasI-lasR/pBNos) bio-films were grown on NF90 membranes using M9G supplemented with 15 mML-arginine (substrate for NOS) and 1.6% L-arabinose (inducer of bNos andechA) under static conditions for 24 h. The medium was removed from thestirred cell, and the biofilm was challenged with 10 mM epichlorohydrin in5 mM NaCl solution with the pH adjusted to 9 (44) to maintain a constant pHthroughout the experiment and analysis, thus minimizing unwanted dissoci-ation. After incubation for 5 min, the membrane system was pressurized to50 psi via N2, permeate samples were collected at 10–20 min and at 20–30 min,and 100-μL samples were used for the EH assay.
ACKNOWLEDGMENTS. We thank Prof. Evgeny Nudler for providing the pBNosplasmid; Prof. Sharon Walker for S. wittichii RW1; Prof. Jintae Lee for his sug-gestions regarding confocal microscope experiments and COMSTAT analysis;Mark Signs of the Pennsylvania State Shared Fermentation Facility for help withthe membrane system; and Fabiola Agramonte for conducting image analysisand assisting with experiments. This work was supported by National ScienceFoundation Grant CBET-1402063. T.K.W. is the Biotechnology Endowed Profes-sor at the Pennsylvania State University.
Table 1. Bacterial strains and plasmids used in this study
Strain or plasmid Description Source
StrainsE. coli TG1 supE thi-1 Δ(lac-proAB) Δ(mcrB-hsdSM)5, (rK
−mK−)
F’ [traD36 proAB+ lacIq lacZΔM15](64)
P. aeruginosa PAO1 Wild-type (70)Plasmids
pHha13D6-gfp-lasI CmR; lacIq, pCA24N PT5-lac::hha13D6+ (22)
pBdcAE50Q CmR; lacIq, pCA24N PlasI::bdcAE50Q+ (22)
pBdcAE50Q-rfp-lasR CmR; lacIq, pCA24N PlasI::bdcAE50Q+ PCP25::rfp
+-lasR+ (22)pBdcAE50Q-lasI-lasR CmR; lacIq, pCA24N PlasI::bdcAE50Q
+-lasI+ PCP25::rfp+-lasR+ This study
pBNos CbR; pBad PAra::nos+ (33)
pBNos-echA CbR; pBad PAra::nos+- echA(F108L/I219L/C248I)+ This study
pBad/Myc-HisB CbR; araC InvitrogenpMRP9-1 CbR ; pUCP18 carrying a gene encoding enhanced GFP (71)
CbR, carbenicillin resistance; CmR, chloramphenicol resistance.
8 of 10 | www.pnas.org/cgi/doi/10.1073/pnas.1521731113 Wood et al.

1. Gleick PH, et al. (2014) The World’s Water: The Biennial Report on FreshwaterResources (Island Press, Washington, DC), Vol 8.
2. Baroni L, Cenci L, Tettamanti M, Berati M (2007) Evaluating the environmental impactof various dietary patterns combined with different food production systems. Eur JClin Nutr 61(2):279–286.
3. Shannon MA, et al. (2008) Science and technology for water purification in thecoming decades. Nature 452(7185):301–310.
4. Greenlee LF, Lawler DF, Freeman BD, Marrot B, Moulin P (2009) Reverse osmosisdesalination: Water sources, technology, and today’s challenges. Water Res 43(9):2317–2348.
5. Barnes RJ, et al. (2013) Optimal dosing regimen of nitric oxide donor compounds forthe reduction of Pseudomonas aeruginosa biofilm and isolates from wastewatermembranes. Biofouling 29(2):203–212.
6. Elimelech M, Phillip WA (2011) The future of seawater desalination: Energy, tech-nology, and the environment. Science 333(6043):712–717.
7. Mansouri J, Harrisson S, Chen V (2010) Strategies for controlling biofouling inmembrane filtration systems: Challenges and opportunities. J Mater Chem 20(22):4567–4586.
8. Matin A, Khan Z, Zaidi SMJ, Boyce MC (2011) Biofouling in reverse osmosis mem-branes for seawater desalination: Phenomena and prevention. Desalination 281:1–16.
9. Herzberg M, Elimelech M (2007) Biofouling of reverse osmosis membranes: Role ofbiofilm-enhanced osmotic pressure. J Membr Sci 295(1-2):11–20.
10. Vrouwenvelder JS, Graf von der Schulenburg DA, Kruithof JC, Johns ML, vanLoosdrecht MCM (2009) Biofouling of spiral-wound nanofiltration and reverse os-mosis membranes: A feed spacer problem. Water Res 43(3):583–594.
11. Vrouwenvelder JS, van der Kooij D (2001) Diagnosis, prediction and prevention ofbiofouling of NF and RO membranes. Desalination 139(1-3):65–71.
12. Al Ashhab A, Herzberg M, Gillor O (2014) Biofouling of reverse-osmosis membranesduring tertiary wastewater desalination: Microbial community composition. WaterRes 50:341–349.
13. Al Ashhab A, Gillor O, Herzberg M (2014) Biofouling of reverse-osmosis membranesunder different shear rates during tertiary wastewater desalination: Microbial com-munity composition. Water Res 67:86–95.
14. Bereschenko LA, Stams AJM, Euverink GJW, van Loosdrecht MCM (2010) Biofilmformation on reverse osmosis membranes is initiated and dominated by Sphingo-monas spp. Appl Environ Microbiol 76(8):2623–2632.
15. Ghayeni SBS, Beatson PJ, Schneider RP, Fane AG (1998) Adhesion of waste waterbacteria to reverse osmosis membranes. J Membr Sci 138(1):29–42.
16. Barnes RJ, et al. (2015) Nitric oxide treatment for the control of reverse osmosismembrane biofouling. Appl Environ Microbiol 81(7):2515–2524.
17. Kim SR, et al. (2013) Biofouling control with bead-entrapped quorum quenchingbacteria in membrane bioreactors: Physical and biological effects. Environ Sci Technol47(2):836–842.
18. Siddiqui MF, Sakinah M, Singh L, Zularisam AW (2012) Targeting N-acyl-homoserine-lactones to mitigate membrane biofouling based on quorum sensing using a bio-fouling reducer. J Biotechnol 161(3):190–197.
19. Miller DJ, et al. (2012) Short-term adhesion and long-term biofouling testing ofpolydopamine and poly(ethylene glycol) surface modifications of membranes andfeed spacers for biofouling control. Water Res 46(12):3737–3753.
20. Kochkodan V, Hilal N (2015) A comprehensive review on surface modified polymermembranes for biofouling mitigation. Desalination 356:187–207.
21. Yang HL, Lin JCT, Huang C (2009) Application of nanosilver surface modification toRO membrane and spacer for mitigating biofouling in seawater desalination. WaterRes 43(15):3777–3786.
22. Hong SH, et al. (2012) Synthetic quorum-sensing circuit to control consortial biofilmformation and dispersal in a microfluidic device. Nat Commun 3:613.
23. Williams P, Cámara M (2009) Quorum sensing and environmental adaptation inPseudomonas aeruginosa: A tale of regulatory networks and multifunctional signalmolecules. Curr Opin Microbiol 12(2):182–191.
24. Kaplan JB (2010) Biofilm dispersal: Mechanisms, clinical implications, and potentialtherapeutic uses. J Dent Res 89(3):205–218.
25. Davies DG, Marques CNH (2009) A fatty acid messenger is responsible for inducingdispersion in microbial biofilms. J Bacteriol 191(5):1393–1403.
26. Barraud N, et al. (2009) Nitric oxide-mediated dispersal in single- and multi-speciesbiofilms of clinically and industrially relevant microorganisms.Microb Biotechnol 2(3):370–378.
27. Nakhamchik A, Wilde C, Rowe-Magnus DA (2008) Cyclic-di-GMP regulates extracel-lular polysaccharide production, biofilm formation, and rugose colony developmentby Vibrio vulnificus. Appl Environ Microbiol 74(13):4199–4209.
28. Yu S, et al. (2015) PslG, a self-produced glycosyl hydrolase, triggers biofilmdisassembly by disrupting exopolysaccharide matrix. Cell Res 25(12):1352–1367.
29. Li Y, et al. (2014) BdlA, DipA and induced dispersion contribute to acute viru-lence and chronic persistence of Pseudomonas aeruginosa. PLoS Pathog 10(6):e1004168.
30. Kulasakara H, et al. (2006) Analysis of Pseudomonas aeruginosa diguanylate cyclasesand phosphodiesterases reveals a role for bis-(3′-5′)-cyclic-GMP in virulence. Proc NatlAcad Sci USA 103(8):2839–2844.
31. Lee VT, et al. (2007) A cyclic-di-GMP receptor required for bacterial exopolysaccharideproduction. Mol Microbiol 65(6):1474–1484.
32. Barraud N, et al. (2009) Nitric oxide signaling in Pseudomonas aeruginosa biofilmsmediates phosphodiesterase activity, decreased cyclic di-GMP levels, and enhanceddispersal. J Bacteriol 191(23):7333–7342.
33. Gusarov I, et al. (2008) Bacterial nitric-oxide synthases operate without a dedicatedredox partner. J Biol Chem 283(19):13140–13147.
34. Römling U, Galperin MY, Gomelsky M (2013) Cyclic di-GMP: The first 25 years of auniversal bacterial second messenger. Microbiol Mol Biol Rev 77(1):1–52.
35. Rossi AM, Migliore L, Loprieno N, Romano M, Salmona M (1983) Evaluation ofepichlorohydrin (ECH) genotoxicity. Microsomal epoxide hydrolase-dependentdeactivation of ECH mutagenicity in Schizosaccharomyces pombe in vitro. MutatRes 109(1):41–52.
36. US Envirnomental Protection Agency (2016) Drinking water contaminants—Standardsand regulations. Available at https://www.epa.gov/dwstandardsregulations. AccessedApril 22, 2016.
37. WHO (2016) Epichlorohydrin in drinking water. Available at www.who.int/water_sanitation_health/dwq/chemicals/epichlorohydrin.pdf. Accessed April 22,2016.
38. Pesci EC, Pearson JP, Seed PC, Iglewski BH (1997) Regulation of las and rhl quorumsensing in Pseudomonas aeruginosa. J Bacteriol 179(10):3127–3132.
39. Ma Q, Yang Z, Pu M, Peti W, Wood TK (2011) Engineering a novel c-di-GMP-bindingprotein for biofilm dispersal. Environ Microbiol 13(3):631–642.
40. Barnes RJ, et al. (2014) The roles of Pseudomonas aeruginosa extracellular polysac-charides in biofouling of reverse osmosis membranes and nitric oxide induced dis-persal. J Membr Sci 466:161–172.
41. Gutman J, Herzberg M, Walker SL (2014) Biofouling of reverse osmosis membranes:Positively contributing factors of Sphingomonas. Environ Sci Technol 48(23):13941–13950.
42. Krijgsheld KR, Vandergen A (1986) Assessment of the impact of the emission ofcertain organochlorine compounds on the aquatic environment. 3. Epichlorohydrin.Chemosphere 15(7):881–893.
43. Jacobs MHJ, Van den Wijngaard AJ, Pentenga M, Janssen DB (1991) Characterizationof the epoxide hydrolase from an epichlorohydrin-degrading Pseudomonas sp. Eur JBiochem 202(3):1217–1222.
44. Rui L, Cao L, Chen W, Reardon KF, Wood TK (2004) Active site engineering of theepoxide hydrolase from Agrobacterium radiobacter AD1 to enhance aerobic miner-alization of cis-1,2-dichloroethylene in cells expressing an evolved toluene ortho-monooxygenase. J Biol Chem 279(45):46810–46817.
45. Steinle-Darling E, Zedda M, Plumlee MH, Ridgway HF, Reinhard M (2007) Evaluatingthe impacts of membrane type, coating, fouling, chemical properties and waterchemistry on reverse osmosis rejection of seven nitrosoalklyamines, including NDMA.Water Res 41(17):3959–3967.
46. Zenker MJ, Borden RC, Barlaz MA (2003) Occurrence and treatment of 1,4-dioxane inaqueous environments. Environ Eng Sci 20(5):423–432.
47. Plumlee MH, López-Mesas M, Heidlberger A, Ishida KP, Reinhard M (2008) N-nitro-sodimethylamine (NDMA) removal by reverse osmosis and UV treatment and analysisvia LC-MS/MS. Water Res 42(1-2):347–355.
48. Molin S, et al. (1987) Conditional suicide system for containment of bacteria andplasmids. Biotechnology 5:1315–1318.
49. Becht NO, Malik DJ, Tarleton ES (2008) Evaluation and comparison of protein ultra-filtration test results: Dead-end stirred cell compared with a cross-flow system. SeparPurif Tech 62(1):228–239.
50. Krieg HM, Modise SJ, Keizei K, Neomagus HWJP (2004) Salt rejection in nanofiltrationfor single and binary salt mixtures in view of sulphate removal. Desalination 171(2):205–215.
51. Donlan RM (2002) Biofilms: Microbial life on surfaces. Emerg Infect Dis 8(9):881–890.52. Fraser DW, et al. (1977) Legionnaires’ disease: Description of an epidemic of pneu-
monia. N Engl J Med 297(22):1189–1197.53. Best M, et al. (1983) Legionellaceae in the hospital water-supply. Epidemiological link
with disease and evaluation of a method for control of nosocomial legionnaires’disease and Pittsburgh pneumonia. Lancet 2(8345):307–310.
54. Nickel JC, Ruseska I, Wright JB, Costerton JW (1985) Tobramycin resistance ofPseudomonas aeruginosa cells growing as a biofilm on urinary catheter material.Antimicrob Agents Chemother 27(4):619–624.
55. Douglas LJ (2003) Candida biofilms and their role in infection. Trends Microbiol 11(1):30–36.
56. Costerton JW, Stewart PS, Greenberg EP (1999) Bacterial biofilms: A common cause ofpersistent infections. Science 284(5418):1318–1322.
57. Singh PK, et al. (2000) Quorum-sensing signals indicate that cystic fibrosis lungs areinfected with bacterial biofilms. Nature 407(6805):762–764.
58. Hyde JAJ, Darouiche RO, Costerton JW (1998) Strategies for prophylaxis againstprosthetic valve endocarditis: A review article. J Heart Valve Dis 7(3):316–326.
59. Sbordone L, Bortolaia C (2003) Oral microbial biofilms and plaque-related diseases:Microbial communities and their role in the shift from oral health to disease. Clin OralInvestig 7(4):181–188.
60. Cryer J, Schipor I, Perloff JR, Palmer JN (2004) Evidence of bacterial biofilms in humanchronic sinusitis. ORL J Otorhinolaryngol Relat Spec 66(3):155–158.
61. Malfertheiner P, Link A, Selgrad M (2014) Helicobacter pylori: Perspectives and timetrends. Nat Rev Gastroenterol Hepatol 11(10):628–638.
62. Yonezawa H, et al. (2013) Impact of Helicobacter pylori biofilm formation onclarithromycin susceptibility and generation of resistance mutations. PLoS One 8(9):e73301.
63. Sambrook JF, Russell DW (2001)Molecular Cloning: A Laboratory Manual (Cold SpringHarbor Lab Press, New York), 3rd Ed.
64. Sambrook J, Fritsch EF, Maniatis T (1989) Molecular Cloning, A Laboratory Manual(Cold Spring Harbor Lab Press, Cold Spring Harbor, NY), 2nd Ed.
65. Fletcher M (1977) The effects of culture concentration and age, time, and tempera-ture on bacterial attachment to polystyrene. Can J Microbiol 23(1):1–6.
Wood et al. PNAS Early Edition | 9 of 10
ENVIRONMEN
TAL
SCIENCE
SPN
ASPL
US

66. Heydorn A, et al. (2000) Quantification of biofilm structures by the novel computerprogram COMSTAT. Microbiology 146(Pt 10):2395–2407.
67. Rink R, Fennema M, Smids M, Dehmel U, Janssen DB (1997) Primary structure andcatalytic mechanism of the epoxide hydrolase from Agrobacterium radiobacter AD1.J Biol Chem 272(23):14650–14657.
68. Leungsakul T, Johnson GR, Wood TK (2006) Protein engineering of the 4-methyl-5-nitrocatechol monooxygenase from Burkholderia sp. strain DNT for enhanced deg-radation of nitroaromatics. Appl Environ Microbiol 72(6):3933–3939.
69. Boerlage SFE, Kennedy MD, Dickson MR, El-Hodali DEY, Schippers JC (2002) Themodified fouling index using ultrafiltration membranes (MFI-UF): Characterisation,filtration mechanisms and proposed reference membrane. J Membr Sci 197(1-2):1–21.
70. Jacobs MA, et al. (2003) Comprehensive transposon mutant library of Pseudomonasaeruginosa. Proc Natl Acad Sci USA 100(24):14339–14344.
71. Davies DG, et al. (1998) The involvement of cell-to-cell signals in the development of abacterial biofilm. Science 280(5361):295–298.
10 of 10 | www.pnas.org/cgi/doi/10.1073/pnas.1521731113 Wood et al.

SUPPORTING INFORMATION
Living Biofouling-Resistant Membranes:
A Model for the Beneficial Use of Engineered Biofilms
Thammajun L. Wooda,b,1, Rajarshi Guhaa,1, Li Tanga, Michael Geitnera, Manish Kumara,2, and
Thomas K. Wooda,c,2
aDepartment of Chemical Engineering, the bHuck Institutes of the Life Sciences, and cDepartment of
Biochemistry and Molecular Biology, Pennsylvania State University,
University Park, Pennsylvania, 16802, USA
1These authors contributed equally to this work.
2Correspondence should be addressed to M. K. ([email protected]) or T. K. W. ([email protected])

Wood et a
Supplemeformation(300 g/maverage th
Image
1
2
3
al., Pennsylva
entary Tabln using IMAmL) for 24 h hickness data
# Biom(μm3/
15.
2.9
17.
ania State Uni
e 1. 3D recoARIS. The bi
at an initial were calcula
mass /μm2)
Aver
.81
97
.34
iversity
onstruction iofilms were OD600nm of 0ted using CO
rage Thickne (μm) 38.94
4.10
37.62
2
of LasR (E.grown on N
0.5. Image 4OMSTAT. Eac
ess
E. coli TG1/pNF90 membra
is shown in ch major grid
L
pBdcAE50Q-anes in M9G Figure 2. Al
d bar represen
LasR
-rfp-lasR) bimedium wit
ll the biomasnts 20 m.
iofilm th Cm ss and

Wood et a
4
5
6
Averag
al., Pennsylva
5.8
5.6
2.5
ge 8.3
ania State Uni
82
65
56
36
iversity
7.52
7.07
3.25
16.42
3

Wood et a
Supplemebiofilm foCm (300 average th
Image
1
2
3
4
al., Pennsylva
entary Tablormation usig/mL) for 2
hickness data
# Bi(μ
2
4
ania State Uni
le 2. 3D recing IMARIS.24 h at an inwere calcula
iomass μm3/μm2)
0.09
0.28
0.30
0.10
iversity
construction. The biofilmsitial OD600nm
ted using CO
Average Thickness (μ
0.15
0.73
0.40
0.13
4
n of LasI/Las were grownof 0.5. Imag
OMSTAT. Eac
μm)
asR (E. colin on NF90 mege 3 is shownch major grid
L
i TG1/pBdcAembranes in Mn in Figure 2d bar represen
LasI/ LasR
AE50Q-lasI-M9G medium2. All biomasnts 20 m.
-lasR) m with ss and

Wood et a
5
6
Aver
al., Pennsylva
5
6
rage
ania State Uni
0.12
0.34
0.20
iversity
0.16
0.45
0.34
5

Wood et al., Pennsylvania State University 6
Supplementary Table 3. Estimates of membrane and challenge biofilm resistances. The membrane resistance was evaluated after incubation of the membrane at 37˚C for 24 h with M9G and LB medium in quantities similar to that used for biofilm growth. Similarly, consortial biofilms were incubated in M9G medium with an initial overnight turbidity of 0.5 at 600 nm. All media contained Cm (300 μg/ mL) and Cb (250 g/ mL) along with 15 mM L-arginine and 1.6% L-arabinose. The membranes were subjected to a series of different NaCl feed concentrations (0, 5, 10 and 15 mM) at 50 psi and 400 rpm. The resistance was calculated based on measured permeate flux at no salt feed.
The membrane resistance (Rm) was calculated using NF90 membranes treated according to ‘Membrane biofilms’ method, but without adding any bacterial cells. Therefore, the resistance provided quantification of medium incubated membrane. This resistance was evaluated using the following equation:
R = ∆ (1)
Where, ∆P denotes the applied external pressure differential, μ is medium viscosity (assumed pure water viscosity at 25˚C) and J0signifies the pure water flux through the medium-incubated membrane. The pure water flux (J) through the biofilm-grown membrane at no salt feed is as follows:
J = ∆( ) (2)
Therefore, the biofilm resistance, which should be deconvoluted from total resistance, could be calculated using Equation (2) as follows-
R = ∆ − R (3)
Average Membrane Resistance (m-1)
PAO1/E. coli NO- Average Biofilm
Resistance (m-1)
PAO1/E. coli NO+ Average Biofilm
Resistance (m-1)
% Increase in Biofilm Resistance for Control Strain w.r.t. Beneficial
Strain 4.45 ×10 4.02 × 10 1.51 × 10 165.5

Wood et al., Pennsylvania State University 7
Supplementary Table 4. Salt rejection improvement with self-controlled (LasI/ LasR) biofilm over QS signal negative (LasR) biofilm. The membrane fluxes and related conductivities were evaluated after incubation of the membrane at 37˚C for 24 h with M9G containing Cm (300 μg/ mL).The membranes were subjected to 10 mM NaCl feed concentration at 50 psi and 400 rpm. The feed conductivity was the average of start of run and end of run measurements. The permeate conductivity was measured at the end of run. 10 mM NaCl Feed Feed conductivity (μS/
cm) at room temperature Permeate conductivity (μS/cm) at room temperature
% Average Rejection (R)
1. LasR 1184 271 75 2. LasR 1172 352 3. LasR 1154 236 1. LasI/ LasR 1146 160 86 2. LasI/ LasR 1181 122 3. LasI/ LasR 1177 215

Wood et a
Supplemeaeruginosgrown ong/mL) amedium warabinose quantified Image #
1
2
3
al., Pennsylva
entary Tablsa, PAO1/ pn NF90 memand Cb (250 with Cm (300
for another 2d using COM
Biomass: 0Biofilm th
Biomass: 3Biofilm th
Biomass: Biofilm th
ania State Uni
le 5. DeconMRP9-1) an
mbranes. Theg/mL) for 2
0 g/mL) and24 h at an inSTAT. Each m
PAO
0.31 µm3/µmhickness: 0.40
37.07 µm3/µmhickness: 54.1
16.05 µm3/µmhickness: 24.2
iversity
nvoluted IMnd E. coli NOe E. coli NO24 h and thed Cb (250 g/itial OD600nm
major grid ba
O1
2 0 µm
m2 2 µm
m2 21 µm
8
MARIS imagO- (control,
O- biofilm wan challenged/mL) supplemof 0.1. All th
ar represents 2
BB
BB
BB
ges of consoE. coli TG1as formed in
d by the additmented with 1he biomass a20 m. Image
Biomass: 0.01Biofilm thickn
Biomass: 0.42Biofilm thickn
Biomass: 1.06Biofilm thickn
ortial biofilm1/pBdcAE50Qn M9G mediution of PAO15 mM L-argand biofilm the 3 was show
E. coli NO
1 µm3/µm2 ness: 0.01 µm
2 µm3/µm2 ness: 1.12 µm
6 µm3/µm2 ness: 2.94 µm
ms of PAOQ-lasI-lasR/pum with Cm1 with fresh
ginine and 1.6hickness data
wn in Figure 3
O-
m
m
m
1 (P. pBad)
m (300 M9G
6% L-a were 3.

Wood et a
4
5
6
al., Pennsylva
Biomass: 3Biofilm th
Biomass: Biofilm th
Biomass: 2Biofilm th
ania State Uni
30.30 µm3/µmhickness: 61.1
1.56 µm3/µmhickness: 11.6
2.12 µm3/µmhickness: 13.8
iversity
m2 4 µm
2 60 µm
2 80 µm
9
BB
BB
BB
Biomass: 0.15Biofilm thickn
Biomass: 0.03Biofilm thickn
Biomass: 0.10Biofilm thickn
5 µm3/µm2 ness: 0.10 µm
3 µm3/µm2 ness: 0.03 µm
0 µm3/µm2 ness: 0.12 µm
m
m
m

Wood et a
7
8
9
al., Pennsylva
Biomass: Biofilm th
Biomass: Biofilm th
Biomass: 3Biofilm th
ania State Uni
19.85 µm3/µmhickness: 85.3
10.50 µm3/µmhickness: 20.3
31.50 µm3/µmhickness: 101.
iversity
m2 35 µm
m2 30 µm
m2 .10 µm
10
BB
BB
BB
Biomass: 0.50Biofilm thickn
Biomass: 0.64Biofilm thickn
Biomass: 1.34Biofilm thickn
0 µm3/µm2 ness: 2.60 µm
4 µm3/µm2 ness: 1.20 µm
4 µm3/µm2 ness: 3.71 µm
m
m
m

Wood et a
10
11
12
al., Pennsylva
Biomass: Biofilm th
Biomass: 4Biofilm th
Biomass: 2Biofilm th
ania State Uni
18.30 µm3/µmhickness: 28.4
40.30 µm3/µmhickness: 82.5
2.01 µm3/µmhickness: 13.1
iversity
m2 40 µm
m2 50 µm
2 6 µm
11
BB
BB
BB
Biomass: 2.70Biofilm thickn
Biomass: 2.73Biofilm thickn
Biomass: 0.14Biofilm thickn
0 µm3/µm2 ness: 5.91 µm
3 µm3/µm2 ness: 9.92 µm
4 µm3/µm2 ness: 0.23 µm
m
m
m

Wood et a
13
14
15
Average
al., Pennsylva
Biomass: 3Biofilm th
Biomass: Biofilm th
Biomass: Biofilm thBiomass: Biofilm thRoughnes
ania State Uni
32.32 µm3/µmhickness: 59.2
16.31 µm3/µmhickness: 39.7
11.75 µm3/µmhickness: 35.6
18.01 µm3/µmhickness: 42.0ss co-efficient
iversity
m2 20 µm
m2 70 µm
m2 65 µm m2 03 µm t: 0.18
12
BB
BB
BB
BBR
Biomass: 0.83Biofilm thickn
Biomass: 0.64Biofilm thickn
Biomass: 0.51Biofilm thickn
Biomass: 0.80Biofilm thickRoughness co
3 µm3/µm2 ness: 3.42 µm
4 µm3/µm2 ness: 1.52 µm
1 µm3/µm2 ness: 1.04 µm
0 µm3/µm2 kness: 2.25 µmo-efficient: 1.
m
m
m
m .95

Wood et a
Supplemeaeruginosmembrang/mL) fog/ml) anat an initiEach majo
Image # 1
2
3
al., Pennsylva
entary Tablsa, PAO1/ pMnes. The E. cfor 24 h and tnd Cb (250 gal OD600nm ofor grid bar rep
Biomass: 0Biofilm th
Biomass: 0Biofilm th
Biomass: 0Biofilm th
ania State Uni
le 6. DeconMRP9-1) andoli NO+ biofthen challengg/ml) supplemf 0.1. All the bpresents 20
PAO
0.16 µm3/µmhickness: 0.22
0.04 µm3/µmhickness: 0.06
0.07 µm3/µmhickness: 0.10
iversity
nvoluted IMd E. coli NO+film was formged by the admented with 1biomass and bm. Image 3 is
O1
2 2 µm
2 6 µm
2 0 µm
13
MARIS imag+ (TG1/pBdc
med in M9G mddition of PA15 mM L-argbiofilm thickns shown in Fi
BB
BB
BB
ges of consocAE50Q-lasImedium with
AO1 with fresinine and 1.6ness data werigure 3.
Biomass: 0.03Biofilm thickn
Biomass: 0.07Biofilm thickn
Biomass: 0.07Biofilm thickn
ortial biofilmI-lasR/pBNosh Cm (300 gsh M9G medi6% L-arabinosre quantified
E. coli NO
3 µm3/µm2 ness: 0.04 µm
7 µm3/µm2 ness: 0.10 µm
7 µm3/µm2 ness: 0.10 µm
ms of PAOs) grown on g/mL) and Cbium with Cmse for anotherusing COMS
O+
m
m
m
1 (P. NF90
b (250 m (300
r 24 h STAT.

Wood et a
4
5
6
al., Pennsylva
Biomass 0Biofilm th
Biomass: 0Biofilm th
Biomass: 0Biofilm th
ania State Uni
0.01 µm3/µm2
hickness: 0.01
0.02 µm3/µmhickness: 0.04
0.02 µm3/µmhickness: 0.04
iversity
2 µm
2 4 µm
2 4 µm
14
BB
BB
BB
Biomass: 0.06Biofilm thickn
Biomass: 0.12Biofilm thickn
Biomass: 0.06Biofilm thickn
6 µm3/µm2 ness: 0.07 µm
2 µm3/µm2 ness: 0.17 µm
6 µm3/µm2 ness: 0.08 µm
m
m
m

Wood et a
7
8
9
al., Pennsylva
Biomass: 0Biofilm th
Biomass: 0Biofilm th
Biomass: 0Biofilm th
ania State Uni
0.01 µm3/µmhickness: 0.01
0.02 µm3/µmhickness: 0.05
0.20 µm3/µmhickness: 0.30
iversity
2 µm
2 5 µm
2 0 µm
15
BB
BB
BB
Biomass: 0.03Biofilm thickn
Biomass: 0.06Biofilm thickn
Biomass: 0.12Biofilm thickn
3 µm3/µm2 ness: 0.04 µm
6 µm3/µm2 ness: 0.08 µm
2 µm3/µm2 ness: 0.20 µm
m
m
m

Wood et a
10
11
12
al., Pennsylva
Biomass: 0Biofilm th
Biomass: 0Biofilm th
Biomass: 0Biofilm th
ania State Uni
0.01 µm3/µmhickness: 0.02
0.01 µm3/µmhickness: 0.01
0.01 µm3/µmhickness: 0.01
iversity
2 2 µm
2 µm
2 µm
16
BB
BB
BB
Biomass: 0.05Biofilm thickn
Biomass: 0.13Biofilm thickn
Biomass: 0.05Biofilm thickn
5 µm3/µm2 ness: 0.07 µm
3 µm3/µm2 ness: 0.20 µm
5 µm3/µm2 ness: 0.05 µm
m
m
m

Wood et a
13
14
15
Average
al., Pennsylva
Biomass: 0Biofilm th
Biomass: 0Biofilm th
Biomass: 0Biofilm thBiomass: Biofilm thRoughnes
ania State Uni
0.10 µm3/µmhickness: 0.15
0.27 µm3/µmhickness: 0.40
0.07 µm3/µmhickness: 0.13
0.06 µm3/µmhickness: 0.10ss co-efficient
iversity
2 5 µm
2 0 µm
2 3 µm m2 0 µm t: 2.00
17
BB
BB
BBBBR
Biomass: 0.04Biofilm thickn
Biomass: 0.10Biofilm thickn
Biomass: 0.16Biofilm thicknBiomass: 0.0Biofilm thickRoughness co
4 µm3/µm2 ness: 0.05 µm
0 µm3/µm2 ness: 0.12 µm
6 µm3/µm2 ness: 0.22 µm07 µm3/µm2 kness: 0.10 µmo-efficient:1.9
m
m
m
m 94

Wood et al., Pennsylvania State University 18
Supplementary Table 7. Oligonucleotides used for cloning and sequencing. All restriction enzyme sites are underlined. “f” indicates forward primer and “r” indicates reverse primer.
Primer name Sequence (5’→3’)
Cloning
lasI-SalI-f GCTGAGCTTCTTCAGTCGACTATTTGGA
lasI-HindIII-r EH HindIII-f EH SalI-r
AAGCTCAGCAAAGCTTCGTCATGAAACCGCC ATAGCAAGCTTACAACGGTTTCCCT TTATTGCTGTCGACCAGTCATGCTAGCC
Sequencing
pCA24Nf-SH GCCCTTTCGTCTTCACCTCG
pCA24Nr-SH lasI-in-f rfp-lasR-P-f EH-in-f
GAACAAATCCAGATGGAGTTCTGAGGTCATT GCCCAGGTTTTCGGTTGCTGGCG CGCTAATCCCGCCAACGGGCCAATG GTACTCGCAATTCCATCAAC

Wood et a
Supplemecoli NO- NO- biofi15 mM Lmedium smembraneturbidity microscopunder lighRFP tag. bar repres Image #
1
2
al., Pennsylva
entary Table(control, E. cilm was formeL-arginine ansupplementede was challenof 0.5 at 600py, the membht insulated cAll the biom
sents 20 m. I
Biomass: 2Biofilm thic
Biomass: 2Biofilm thic
ania State Uni
e 8. Deconvocoli TG1/pBded in M9G m
nd 1.6% L-ard with 15 mMnged by the a0 nm. To obsbrane samplesconditions to ass and biofilImage 5 is sh
S. wittichii +
.84 µm3/µm2 ckness: 14.54
.54 µm3/µm2 ckness: 13.11
iversity
oluted IMARdcAE50Q-la
medium with Crabinose for M L-arginineaddition of S
serve the S. ws were incubastain the totalm thickness own in Figur
+E. coli NO-
4 µm
1 µm
19
RIS images oasI-lasR/pBadCm (300 g/m24 h, then t and 1.6% L
S. wittichii fowittichii/E. coated with 5 mal biofilm. Thdata were qu
re 4.
of consortial d) grown on mL) and Cb (the medium
L-arabinose wor 48 h; S. woli combined mL of 5 μM She E. coli biouantified usin
Biomass: 0Biofilm thic
Biomass: 0Biofilm thic
biofilms of SNF90 memb
(250 g/mL) swas replaced
without any awittichii was
biofilms (greSYTO 9 in 0.films were vi
ng COMSTAT
E. coli N
.09 µm3/µm2 ckness: 0.06
.02 µm3/µm2 ckness: 0.03
S. wittichii abranes. The Esupplementedd with fresh antibiotics, anadded at an een) with con.85% NaCl foisualized usinT. Each majo
NO-
µm
µm
nd E. E. coli d with M9G
nd the initial nfocal or 1 h ng the or grid

Wood et a
3
4
5
al., Pennsylva
Biomass: 1Biofilm thic
Biomass: 2Biofilm thic
Biomass: 1Biofilm thic
ania State Uni
.71 µm3/µm2 ckness: 0.90
.10 µm3/µm2 ckness: 1.55
.70 µm3/µm2 ckness: 20.30
iversity
µm
µm
0 µm
20
Biomass: 0Biofilm thic
Biomass: 0Biofilm thic
Biomass: 0Biofilm thic
.04 µm3/µm2 ckness: 0.03
.13 µm3/µm2 ckness: 0.05
.02 µm3/µm2 ckness: 0.04
µm
µm
µm

Wood et a
6
Average
al., Pennsylva
Biomass: 0Biofilm thic
Biomass: 1Biofilm thi
ania State Uni
.50 µm3/µm2 ckness: 1.04
1.9 µm3/µm2 ickness: 8.6 µ
iversity
µm
µm
21
Biomass: 0Biofilm thicBiomass: 0Biofilm thi
.02 µm3/µm2 ckness: 0.004
0.05 µm3/µm2
ickness: 0.03
4 µm 2 µm

Wood et a
Supplemecoli NO+was formarginine asupplemenwas challeat 600 nmmembraneinsulated the bioma20 m. Im Image #
1
2
al., Pennsylva
entary Table (TG1/pBdcAed in M9G mand 1.6% L-nted with 15 enged by the
m. To observee samples weconditions to
ass and biofilmmage 5 is show
S.
Biomass: 0Biofilm thic
Biomass: 0Biofilm thic
ania State Uni
e 9. DeconvoAE50Q-lasI-
medium with -arabinose fomM L-arginaddition of S
e the S. witticere incubated
o stain the totam thickness dwn in Figure
S. wittichii +E
.05 µm3/µm2 ckness: 0.01
.16 µm3/µm2 ckness: 0.11
iversity
oluted IMAR-lasR/pBNos)Cm (300 g/
or 24 h, thennine and 1.6%S. wittichii forchii/E. coli cod with 5 mL al biofilm. Thdata were qua
4.
E. coli NO+
µm
µm
22
RIS images o) grown on N/mL) and Cb n the medium
% L-arabinoser 48 h; S. witombined biofof 5 μM SY
he E. coli bioantified using
BioBio
BioBio
of consortial NF90 membr
(250 g/mL)m was replae without anyttichii was adfilms (green) YTO 9 in 0.films were viCOMSTAT.
omass: 0.02 µofilm thickne
omass: 0.03 µofilm thickne
biofilms of Sranes. The E.) supplementeaced with frey antibiotics, dded at an init
with confoc85% NaCl foisualized usin. Each major
E. coli NO
µm3/µm2 ess: 0.01 µm
µm3/µm2 ess: 0.01 µm
S. wittichii a. coli NO+ bied with 15 mesh M9G meand the memtial turbidity al microscop
for 1 h underng the RFP tagrid bar repre
+
nd E. iofilm
mM L-edium
mbrane of 0.5 y, the
r light ag. All esents

Wood et a
3
4
5
al., Pennsylva
Biomass: 0Biofilm thic
Biomass: 0Biofilm thic
Biomass: 0Biofilm thic
ania State Uni
.11 µm3/µm2 ckness: 0.07
.16 µm3/µm2 ckness: 0.13
.13 µm3/µm2 ckness: 0.09
iversity
µm
µm
µm
23
BioBio
BioBio
BioBio
omass: 0.03 µofilm thickne
omass: 0.02 µofilm thickne
omass: 0.02 µofilm thickne
µm3/µm2 ess: 0.02 µm
µm3/µm2 ess: 0.01 µm
µm3/µm2 ess: 0.005 µmm

Wood et a
6
Average
al., Pennsylva
Biomass: 0Biofilm thic
Biomass: 0Biofilm thi
ania State Uni
.20 µm3/µm2 ckness: 0.12
0.13 µm3/µm2
ickness: 0.09
iversity
µm 2 µm
24
BioBio
BioBio
omass: 0.05 µofilm thickne
omass: 0.03 µofilm thickne
µm3/µm2 ess: 0.02 µm
µm3/µm2 ess: 0.01 µm

Wood et a
SupplemeaeruginosNF90 meCm (300 conditionsand Cb (2initial ODdata wereFigure 5. Image #
1
2
3
al., Pennsylva
entary Tablsa PAO1/pMembranes (crg/mL) and s and then ch250 g/ml) su
D600nm of 0.002e quantified u
B
B
ania State Uni
le 10. DeconMRP9-1) and rossflow condCb (250 g/m
hallenged by upplemented 2 and at 200 pusing COMST
PAO1
Biomass: 0.24
Biomass: 0.16
iversity
nvoluted IME. coli NO-
ditions). ThemL) with an ithe addition owith 15 mM psi under croTAT. Each m
4 µm3/µm2
6 µm3/µm2
25
MARIS imag(control, TG
e E. coli NO-initial OD600n
of PAO1 withL-arginine a
ss flow condimajor grid ba
ges of consoG1/pBdcAE5- biofilm wasnm of 0.01 forh fresh M9G
and 1.6% L-aitions. All the
ar represents 2
Biom
Biom
ortial biofilm50Q-lasI-lasRs formed in Mr 24 h at 40 p
G medium witarabinose for e biomass and20 m. Imag
E. coli NO
mass: 0.06 µm
mass: 0.04 µm
ms of PAOR/pBad) growM9G mediumpsi under crosth Cm (300 another 72 hd biofilm thicge 1 was show
O-
m3/µm2
m3/µm2
O1 (P. wn on
m with ssflow g/ml) h at an ckness wn in

Wood et a
4
5
6
al., Pennsylva
B
B
B
ania State Uni
Biomass: 0.27
Biomass: 0.12
Biomass: 0.33
iversity
7 µm3/µm2
2 µm3/µm2
3 µm3/µm2
26
Biom
Biom
Biom
mass: 0.06 µm
mass: 0.002 µ
mass: 0.37 µm
m3/µm2
µm3/µm2
m3/µm2

Wood et a
Average
al., Pennsylva
Bi
B
ania State Uni
iomass: 0.34
Biomass: 0.24
iversity
µm3/µm2
4 µm3/µm2
27
Biom
Biom
mass: 0.06 µm
mass: 0.10 µm
m3/µm2
m3/µm2

Wood et a
Supplemeaeruginosmembran(300 g/mconditionsand Cb (2initial ODdata wereFigure 5. Image #
1
2
al., Pennsylva
entary Tablsa, PAO1/ pMnes (crossflowmL) and Cb s and then ch250 g/ml) su
D600nm of 0.002e quantified u
B
B
ania State Uni
le 11. DeconMRP9-1) andw conditions(250 g/mL)
hallenged by upplemented 2 and at 200 pusing COMST
PAO
Biomass: 0.01
Biomass: 0.02
iversity
nvoluted IMd E. coli NO+s). The E. co) with an initthe addition owith 15 mM psi under croTAT. Each m
O1
7 µm3/µm2
0 µm3/µm2
28
MARIS imag+ (TG1/pBdcoli NO+ biofitial OD600nm of PAO1 withL-arginine a
ss flow condimajor grid ba
ges of consocAE50Q-lasI
film was formof 0.01 for 2h fresh M9G
and 1.6% L-aitions. All the
ar represents 2
Biom
Biom
ortial biofilmI-lasR/pBNosmed in M9G 24 h at 40 ps
G medium witarabinose for e biomass and20 m. Imag
E. coli NO
mass: 0.002 µ
mass: 0.002 µ
ms of PAOs) grown on medium wit
si under crosth Cm (300 another 96 hd biofilm thicge 1 was show
+
µm3/µm2
µm3/µm2
O1 (P. NF90
th Cm ssflow g/ml) h at an ckness wn in

Wood et a
3
4
5
al., Pennsylva
B
B
B
ania State Uni
Biomass: 0.01
Biomass: 0.00
Biomass: 0.03
iversity
0 µm3/µm2
6 µm3/µm2
0 µm3/µm2
29
Biom
Biom
Biom
mass: 0. 001 µ
mass: 0.002 µ
mass: 0.003 µ
µm3/µm2
µm3/µm2
µm3/µm2
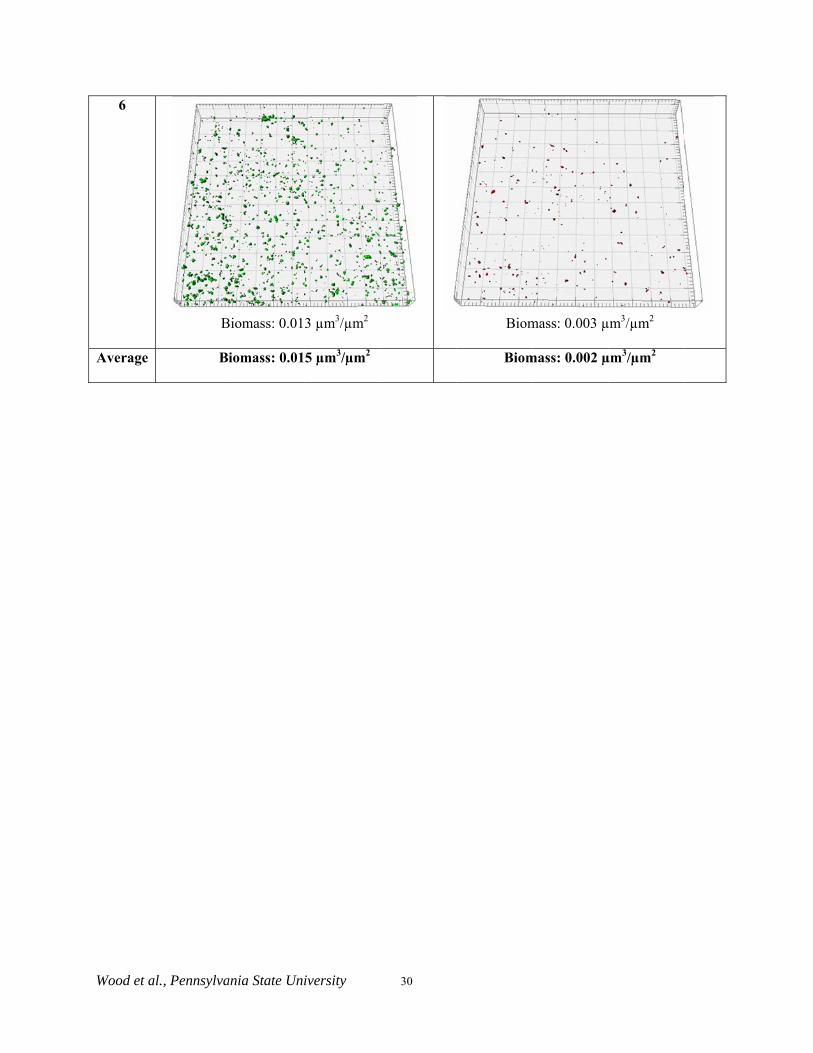
Wood et a
6
Average
al., Pennsylva
B
B
ania State Uni
Biomass: 0.01
iomass: 0.01
iversity
3 µm3/µm2
5 µm3/µm2
30
Biom
Biom
mass: 0.003 µ
mass: 0.002 µ
µm3/µm2
µm3/µm2

Wood et a
Supplemeself-contrsignal mibeneficialthe benef
“beneficia
(250 g/mvalues fro
al., Pennsylva
entary Figurolled strain (Einus control l biofilm straficial biofilm
al biofilm con
mL), 1% arabom three indep
ania State Uni
re 1. NormalE. coli TG1/p(E. coli TG
ain (E. coli Tm control th
ntrol”). Biofil
binose, and 5 pendent colon
iversity
lized biofilmpBdcAE50Q-G1/pBdcAE50TG1/pBdcAE5hat lacks NO
lms were form
mM L-arginnies.
31
m formation i-lasI-lasR, “se0Q-rfp-lasR, 50Q-lasI-lasRO synthesis
med for 24 h
nine in a 96 w
in 96-well plelf-controlled“QS signal
R/pBNos, “be(E. coli TG
at 37 C in M
well plate. Er
lates. Biofilmd biofilm”) co
minus conteneficial biofiG1/pBdcAE50
M9G with Cm
rror bars are
m formation foompared to thtrol”) and fofilm”) compar0Q-lasI-lasR/p
m (300 g/mL
standard dev
for the he QS or the red to pBad,
L), Cb
viation

Wood et a
Supplemepermeate through a of the meHowever,(without bbehavior cresults arepresence o
al., Pennsylva
entary Figurflux (liter/mNF90 memb
embrane with, the mediumbacteria) showcompared to me in line withof bacteria.
ania State Uni
re 2. NF90 mm2/h, LMH) m
rane at 50 psih biofilms shom incubated mwn above, demembranes wh previous st
iversity
membrane permeasured ovi and 400 rpmown in Figuremembrane, demonstrated cwith biofilms tudies where
32
rmeate flux bver ~30 minum stirring. Thee 2d at the sadeveloped acccomparable flat the same Ngrowth medi
behavior witutes with dife clean membame NaCl cocording to th
flux (only an NaCl concentria leads to lo
thout a biofilfferent concebrane flux waoncentrations he membraneaverage of ~
rations over ~owered fluxes
lm. Time aveentrations of as almost twicover ~30 min
e biofilms m~20 % higher~30 minutes. Ts even withou
eraged NaCl
ce that nutes.
method r flux) These ut the

Wood et a
SupplemelasR/pBa
formed foarabinose10, and 15biofilms. biofilm colasI-lasR)
al., Pennsylva
entary Figud) and bene
or 24 hr on N, and 15 mM5 mM NaCl fThere is no
overed memb) biofilm-cove
ania State Uni
re 3. Permeeficial strain
NF90 membr L-arginine. T
feed concentrasignificant d
brane-; the fluered membran
iversity
eate flux wi(E. coli NO
ranes with MThe RO systeations were u
difference for ux is also simne shown in F
33
th the contrO+, TG1/pBd
M9G medium,em was pressuused to test the
flux values milar to that oFigure 2d.
rol (E. colidcAE50Q-las
, Cm (300 gurized at 50 pe permeate flubetween the
of the E. coli
NO-, TG1/psI-lasR/pBNo
g/mL), Cb (2psi and stirreux through mE. coli NO+LasI/LasR (T
pBdcAE50Qos). Biofilms
250 g/mL), d at 400 rpm
membranes wi+ and E. coliTG1/pBdcAE
Q-lasI-were
1.6% ; 0, 5, ith the i NO- E50Q-

Wood et a
Supplemethe NO drepresent
reduction in M9G incolonies.
al., Pennsylva
entary Figurdonor. 80% normalized b
in normalizen a 96 well p
ania State Uni
re 4. Normalireduction in
biofilms (rati
d biofilms wilate without s
iversity
ized P. aerugnormalized
io of OD 540
ith respect to shaking. The
34
ginosa biofilmbiofilm was
0 nm to OD
no SNP additerror bars rep
m formationattained with620 nm) and
tion. Biofilmpresent stand
n in 96-well ph 5 mM SNd the black c
ms were formedard deviation
plates with SNP. The red c
circles represe
ed for 24 h at n for 3 indepe
NP as circles ent %
37 C endent

Wood et a
Supplemewell platdominatemedium c
al., Pennsylva
entary Figurtes at 30 Ces that of S. containing pep
ania State Uni
re 5. NormalC after 1 (a)
wittichii in aptone (5 g/L)
iversity
lized P. aerug), 2 (b), andall media tesand beef extr
35
ginosa PAO1d 3 (c) dayssted. The straract (3 g/L).
1 and S. witts shows P. aains were gro
tichii biofilmaeruginosa bown in LB, M
m formation ibiofilm formM9G, and nu
in 96-mation utrient

Wood et a
Supplemeaeruginosstrains (Eformed focross flowintroduced1.6% arab0.002. Thcovered mformer str
al., Pennsylva
entary Figusa PAO1 wE. coli NO+,or 24 h on NFw conditions d along with binose, and 1here is signifimembranes durain under sim
ania State Uni
re 6. Real twith control , TG1/pBdcAF90 membranat ~40 psi afresh M9G m5 mM L-argi
icant differenue to nitric o
milar hydrody
iversity
time flux be(E. coli NO
AE50Q-lasI-lnes with M9Gand 27˚C wit
medium with Cinine into the
nce for flux voxide-mediateynamic condit
36
ehavior of cO-, TG1/pBdlasR/pBNos) G medium, Cthout filtratioCm (300 g/me feed tank atvalues betweeed dispersal otions. Part of t
crossflow chdcAE50Q-laswith a feed
Cm (300 g/mn at an initiamL) and Cb (t time t = 0 men the E. coliof the P. aerthis figure wa
hallenge expsI-lasR/pBad
d spacer. E. mL) and Cb (al OD600nm of(250 g/mL) smin and at ani NO+ and Eruginosa PAOas shown in F
eriments wid) and benecoli biofilms
(250 g/mL)f 0.01. PAO1supplemented
n initial OD60
E. coli NO- biO1 biofilms bFigure 5f.
ith P. eficial were under 1 was d with 00nm of iofilm by the

Wood et a
SupplemeaeruginosbeneficiaincreasedNF90 memat ~ 40 pfresh M9G15 mM L-1500 minucan be attr
al., Pennsylva
entary Figusa PAO1 wl strain (E.
d microbial lombranes with
psi and 27˚C G medium wi-arginine intoutes is similarributed to mo
ania State Uni
re 7. Real twith the con
coli NO+, Toad and in thh M9G mediuwithout filtraith Cm (300
o the feed tankr in magnitud
ore biofilm fo
iversity
time flux bentrol (E. coTG1/pBdcAEhe absence oum, Cm (300 ation at an ing/mL) and Ck at time t = 0de to flux declrmation and l
37
ehavior of coli NO-, TGE50Q-lasI-laf a feed spacg/mL) and
nitial OD600nm
Cb (250 g/m0 min and at aline with a spless mixing in
crossflow chG1/pBdcAE5asR/pBNos) wcer. E. coli biCb (250 g/m
m of 0.05. PAmL) supplemean initial OD6
pacer ~ 4000 mn the absence
hallenge exp50Q-lasI-lasRwithout a feiofilms were fmL) under cr
AO1 was introented with 1.600nm of 0.01. minutes. This of a spacer.
eriments wiR/pBad) andeed spacer uformed for 24ossflow condoduced along.6% arabinoseThe flux dec
s rapid flux de
ith P. d the under 4 h on ditions g with e, and
cline ~ ecline

Wood et a
Supplemeexperimenhalf) epichwas in 5 m
al., Pennsylva
entary Figunts were condhlorohydrin fmM NaCl (pH
ania State Uni
re 8. Epichducted with Nfeed concentraH 9.0).
iversity
hlorohydrin NF90 membraations. Measu
38
is not rejecanes (no biofiurements wer
cted by the ilm) with 1 mre taken 30 m
NF90 memmM (left half)
min after perm
mbrane. Reje) and 10 mM
meation began.
ection (right . Feed

Wood et a
Supplemewith actepichloroh
Cm (300 incubatedindependecurve for of proteinhighlight
al., Pennsylva
entary Figurtive epoxidehydrin in 60 m
g/mL), Cb d with epichloent colonies. the first 5 min/mL/OD, thtext here can
ania State Uni
re 9. Epichloe hydrolase.min. The EH-
(250 g/mL)orohydrin in T
The initial rinutes, was 0.he calculated
be deleted.
iversity
orohydrin is TG1/pBdcA-expressing s
), 1% L-arabiTE buffer (pHrate of epichl3 mM/min. Wspecific deg
39
degraded bAE50Q_lasI_train was gro
inose, and 15H 9). The errolorohydrin deWith the measgradation rate
y planktonic_lasR/pBNos-own at an initi
5 mM L-arginr bars are stan
egradation, casurement of pe was 3.7 nm
c cells of the-echA degraial OD600nm ~
nine for ~19 ndard deviatialculated fromprotein contenmoles/min/m
e beneficial saded 80% o~ 0.05 in M9G
hours. It wasion values form the slope ont of TG1, 0.2
mg of protein
strain of the G with
s then r three of the 22 mg
n. The

Wood et a
Supplemesingle pawith 10 mmolar remremoval oexperimenlasR/pBNerror bars
al., Pennsylva
entary Figurss through N
mM epichloromoval of epicof epichlorohnt. EH- is E.
Nos-echA. Dea are standard
ania State Uni
re 10. BiofilmNF90 membrohydrin in 5 chlorohydrin hydrin by adscoli TG1/pBdad cells weredeviation for
iversity
ms that prodrane. BiofilmmM NaCl fe(%) at 20 m
sorption to cedcAE50Q-lase obtained byr three indepe
40
duce epoxidems grown for eed solution
min and 30 mellular biomasI-lasR/pBNoy autoclavingendent colonie
e hydrolase d24 h on NF9(pH 9). The
min respectiveass was estimos and EH+ isg overnight ces.
degrade epic90 membranered and blue
ely, after startmated using as E. coli TG1/cultures of th
chlorohydrines were challee bars indicating filtrationa dead cell co/pBdcAE50Qe EH+ strain
n in a enged
ate the n. The ontrol
Q-lasI-n. The