Embed Size (px)
Citation preview
BIOFOULING CONTROL OF REVERSE OSMOSIS
MEMBRANES USING FREE NITROUS ACID
Jingshi Wang
Bachelor of Chemical Engineering (Honours)
A thesis submitted for the degree of Master of Philosophy at
The University of Queensland in 2015
School of Chemical Engineering
Advanced Water Management Centre

i
ABSTRACT
Reverse osmosis (RO) membranes have been widely applied in membrane filtration
processes for water purification, since the high selective RO membranes are designed to
reject all materials with particle diameter larger than 10 angstrom (Å) [1]. However, this
optimal selectivity leads to fouling that can greatly affect the performance and productivity of
RO membranes. Biofouling remains as one of the major operational problems in RO
processes and is caused by unwanted deposit and growth of microorganisms on the
membrane. Numerous biofouling control strategies have been developed to restore the
performance of RO membranes, but none of them are able to prevent or remove biofouling
completely. A novel cleaning technique using a weak and monobasic acid (pKa=3.34, 25℃)
named free nitrous acid (FNA) in combined with hydrogen dioxide (H2O2) was proposed.
The effects of FNA with or without H2O2 on biofouling of RO membranes were investigated
in Chapter 4, five RO membranes with different degree of biofouling were cleaned using
FNA solutions (10, 35 and 47 mg HNO2-N/L) at pH 2.0, 3.0 and 4.0 under cross-flow
conditions for 24 hours. The cleaning efficiency of FNA solutions was compared with
conventional cleaning solution sodium hydroxide (NaOH, pH 11). The cleaning tests
demonstrated that FNA cleaning solutions were more efficient than NaOH at biomass
removal and inactivation. At the optimum cleaning conditions (35 mg HNO2-N/L at pH 3.0),
FNA has achieved higher biomass removal than NaOH for both heavily fouled (86-96%
versus 41-83%) and moderately fouled (92-95% against 89-92%) membranes, respectively.
In accordance to the biomass removal, 6-32% of viable cells remained on the moderately
fouled RO membranes under the impact of FNA cleaning (pH 3), whereas 38-58% of viable
cells stayed on the heavily fouled RO membranes. These results revealed that FNA cleaning
is more effective for moderately fouled membranes, implying that early cleaning for
biofouling is preferable. Although applying FNA alone, or combining it with H2O2 have
shown better efficiency at biofouling removal than NaOH, the cleaning efficiency has not
been significantly improved (<1% of enhancement) by adding H2O2 to FNA cleaning
solutions. The effects of FNA on scaling of RO membranes were also studied using the same
cleaning protocol developed for biofouling control. The results showed that FNA solutions at
pH 2.0 and 3.0 were as efficient as conventional cleaning acids (hydrochloric acid and citric
acid). The scaling layers which contain 32.4±1.7 g/cm2 of calcium were completely removed
by all acidic cleaning solutions. Based on the results, FNA is shown to be a promising
ii
cleaning agent for RO membrane biofouling and scaling removal.
Further investigation focused on the effectiveness of FNA for biofouling prevention in RO
processes (Chapter 5). The results showed that weekly FNA cleanings were unable to prevent
fouling in the RO filtration systems, as the hydraulic performances (permeability and salt
rejection) of RO membranes have gradually declined over two to three weeks filtration period.
Although FNA cleaning was able to restore the permeability of RO membranes for one to
two days, continuing declined permeability implied that the fouling rate was greater than the
inhibition rate of FNA. The results of prevention tests also showed that FNA was more
efficient at biomass inactivation and removal. The biomass contents and viable cells of the
fouling layers formed in the experiment filtration unit (with FNA weekly cleaning) were less
than half of that in the control filtration unit (without FNA weekly cleaning). Moreover, the
results of live/dead cell staining revealed the abundance of viable cells in the control unit
(57±5%) was four times higher than that in the experiment unit (13±2%). However, there was
no significant difference in the concentration of macromolecules such as proteins and
polysaccharides between control and experiment filtration units.

iii
Declaration by author
This thesis is composed of my original work, and contains no material previously published
or written by another person except where due reference has been made in the text. I have
clearly stated the contribution by others to jointly-authored works that I have included in my
thesis.
I have clearly stated the contribution of others to my thesis as a whole, including statistical
assistance, survey design, data analysis, significant technical procedures, professional
editorial advice, and any other original research work used or reported in my thesis. The
content of my thesis is the result of work I have carried out since the commencement of my
research higher degree candidature and does not include a substantial part of work that has
been submitted to qualify for the award of any other degree or diploma in any university or
other tertiary institution. I have clearly stated which parts of my thesis, if any, have been
submitted to qualify for another award.
I acknowledge that an electronic copy of my thesis must be lodged with the University
Library and, subject to the policy and procedures of The University of Queensland, the thesis
be made available for research and study in accordance with the Copyright Act 1968 unless a
period of embargo has been approved by the Dean of the Graduate School.
I acknowledge that copyright of all material contained in my thesis resides with the copyright
holder(s) of that material. Where appropriate I have obtained copyright permission from the
copyright holder to reproduce material in this thesis.

iv
Publications during candidature
No publications
Publications included in this thesis
No publications included

v
Contributions by others to the thesis
I would like to thank Professor Jin Zou and Mr Zhi Zhang from the Centre for Microscopy &
Microanalysis (CMM), Australian Institute for Bioengineering and Nanotechnology (AIBN),
University of Queensland (UQ) assisted in SEM-EDS analysis.
Statement of parts of the thesis submitted to qualify for the award of another degree
None.

vi
ACKNOWLEDGEMENTS
I wish to express my first and sincere gratitude to my supervisors Professor Zhiguo Yuan and
Dr Emmanuelle Filloux for their intellectual and invaluable advice in the course of this
research project. I would also like to acknowledge our industrial partners Australian Water
Recycling Centre of Excellence, National Centre of Excellence in Desalination, Seqwater,
and Veolia water, who generously sponsor this research project.
I further extend my gratitude to Dr Wolfgang Gernjak, Dr Phillip Bond, Dr Bogdan Donose
and Dr Liu Ye for reviewing the progress of my work and providing valuable feedbacks. I am
grateful to Dr Kenn Lu for his assistance in the microbiological analysis. I would like to
acknowledge Professor Jin Zou and Mr Zhi Zhang for SEM imaging. I would like to thank Dr.
Beatrice Keller-Lehman, Jianguang Li and Nathan Clayton for their analytical support, and
also to the administration staff for all their indispensable assistance through the entire process.
I am very grateful to all the members of the drinking water group, my friends and colleagues
at AWMC, Thank you to Dang, Apra, Shao, Elisabet, Guillermo and Zanina for providing
countless assistance on both academic and personal levels. I am also thankful to all my
friends outside the university, particularly Alfreda, Angela, Joy, Clare, Jeomo and Penny, for
their continued friendship, support, chats and laughs along the journey.
My final thanks are reserved for my parents and my family who have been a continual source
of support, strength and motivation and for that I am forever grateful.

vii
Keywords
Free nitrous acid, Biofouling control, Scaling control, Membrane cleaning, Reverse osmosis
membrane filtration.
Australian and New Zealand Standard Research Classifications (ANZSRC)
ANZSRC code: 090404 Membrane and Separation Technologies, 50%
ANZSRC code: 090301 Analytical Chemistry, 25%
ANZSRC code: 090605 Microbiology, 25%
Fields of Research (FoR) Classification
FoR code: 0904, Chemical Engineering, 100%

viii
TABLE OF CONTENTS
ABSTRACT ................................................................................................................................................................... I
ACKNOWLEDGEMENTS .................................................................................................................................... VI
TABLE OF CONTENTS ...................................................................................................................................... VIII
LIST OF FIGURES .................................................................................................................................................... X
LIST OF TABLES .................................................................................................................................................... XII
LIST OF ABBREVIATIONS AND NOMENCLATURE ............................................................................... XIII
1. INTRODUCTION ............................................................................................................................................. 1
§ 1.1. RESEARCH MOTIVATION ................................................................................................................ 1
§ 1.2. GENERAL RESEARCH OBJECTIVES ............................................................................................. 2
2. LITERATURE REVIEW ................................................................................................................................ 3
§ 2.1. INTRODUCTION .................................................................................................................................. 3
§ 2.2. RO MEMBRANES FILTRATION ...................................................................................................... 3
§ 2.3. FOULING ON RO MEMBRANES ..................................................................................................... 4
§ 2.3.1. Biofouling ....................................................................................................................................... 5
§ 2.3.2. Scaling ............................................................................................................................................. 7
§ 2.4. RO MEMBRANES BIOFOULING PREVENTION AND CLEANING METHODS ............... 9
§ 2.4.1. Prevention Methods ..................................................................................................................... 9
§ 2.4.2. Cleaning Methods ...................................................................................................................... 10
§ 2.5. FREE NITROUS ACID (FNA) ........................................................................................................... 13
§ 2.5.1. FNA and Its Biocidal Effect ....................................................................................................... 13
§ 2.5.2. FNA versus Other Biocides ....................................................................................................... 15
§ 2.6. RESEARCH GAP .................................................................................................................................. 16
3. RO MEMBRANE FOULING CHARACTERISATION .........................................................................19
§ 3.1. INTRODUCTION .................................................................................................................................19
§ 3.2. MATERIALS AND METHODS......................................................................................................... 20
§ 3.2.1. Membranes................................................................................................................................... 20
§ 3.2.2. Sample Preparation .................................................................................................................... 20
§ 3.3. MEMBRANE AUTOPSY .................................................................................................................... 20
§ 3.3.1. Biological Analysis ...................................................................................................................... 20
§ 3.3.2. Organic and Molecular Analysis ............................................................................................. 22
§ 3.3.3. Elementary Analysis ................................................................................................................... 24
§ 3.3.4. RO Membrane Hydraulic Performances ............................................................................... 24
§ 3.4. RESULTS AND DISCUSSION .......................................................................................................... 26
ix
§ 3.4.1. Visual Inspection ........................................................................................................................ 26
§ 3.4.2. Biofouling Characterisation ..................................................................................................... 27
§ 3.4.3. Scaling Characterisation ........................................................................................................... 32
§ 3.4.4. Hydraulic Performances of RO Membranes ......................................................................... 34
§ 3.5. CONCLUSION ..................................................................................................................................... 34
4. RO MEMBRANE CLEANING USING FNA........................................................................................... 36
§ 4.1. INTRODUCTION ................................................................................................................................ 36
§ 4.2. MATERIALS AND METHODS......................................................................................................... 37
§ 4.2.1. Cleaning Set-Up and Operation .............................................................................................. 37
§ 4.2.2. Design of Cleaning Tests ........................................................................................................... 37
§ 4.2.3. Post-Cleaning Analyses ............................................................................................................. 40
§ 4.3. RESULTS AND DISCUSSION .......................................................................................................... 42
§ 4.3.1. Effects of FNA Cleaning on RO Biofouling under Cross-Flow Conditions .................. 42
§ 4.3.2. Descaling Efficiency of FNA ...................................................................................................... 51
§ 4.3.3. Hydraulic Performances of RO Membranes after Cleaning ............................................. 53
§ 4.4. CONCLUSION ..................................................................................................................................... 55
5. RO BIOFILM PREVENTION USING FNA ............................................................................................. 57
§ 5.1. INTRODUCTION ................................................................................................................................ 57
§ 5.2. MATERIALS AND METHODS......................................................................................................... 58
§ 5.2.1. Membranes................................................................................................................................... 58
§ 5.2.2. Bench-Scale RO Filtration Units ............................................................................................ 58
§ 5.2.3. Operation Conditions and Analyses ...................................................................................... 59
§ 5.3. RESULTS AND DISCUSSION ........................................................................................................... 61
§ 5.3.1. Effects of FNA Dosing on the Hydraulic Performances of RO Membranes ................... 61
§ 5.3.2. Effect of FNA on the membrane fouling layer ...................................................................... 65
§ 5.4. CONCLUSIONS ................................................................................................................................... 67
6. CONCLUSIONS AND RECOMMENDATIONS ................................................................................... 68
§ 6.1. CONCLUSIONS ................................................................................................................................... 68
§ 6.2. RECOMMENDATIONS..................................................................................................................... 69
REFERENCES .......................................................................................................................................................... 72
APPENDIXES ............................................................................................................................................................ 80
APPENDIX A. CALIBRATION CURVE FOR ATP MEASUREMENT ..................................................................... 80
APPENDIX B. ADDITIONAL RESULTS OF FISH ANALYSIS .................................................................................. 81
APPENDIX C. LIVE/DEAD CELLS REPRESENTED BY CLSM IMAGES ................................................................ 84
APPENDIX D. ICP-OES AND SEM-EDS RESULTS OF DESCALING TESTS ...................................................... 87

x
LIST OF FIGURES
Figure 2-1. Schematic diagrams of cross-flow pattern (left) and configuration of the spiral-
wound RO module (right) [20]. ................................................................................................. 3
Figure 2-2. Five stages of biofilm development [52]................................................................ 6
Figure 2-3. Schematic demonstration of scale formation [37] .................................................. 8
Figure 3-1. Cross flow filtration unit. ..................................................................................... 25
Figure 3-2. Visual inspection on fouled membranes (RO1-6). ............................................... 26
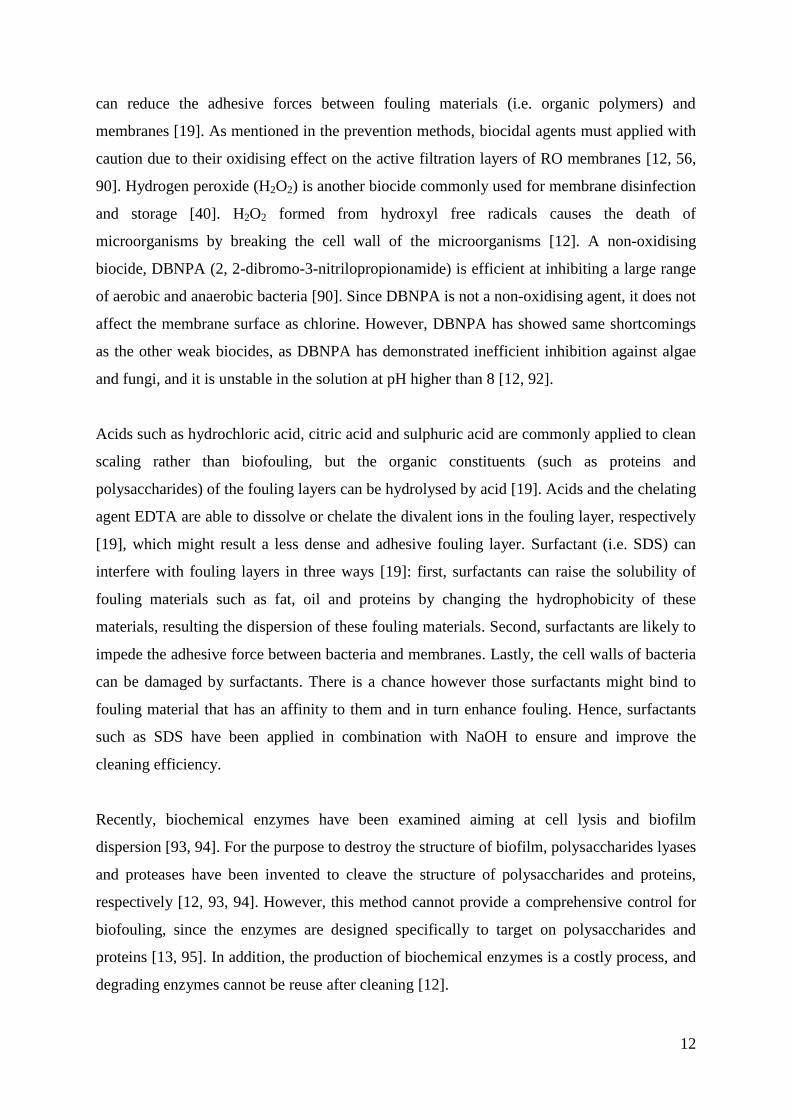
Figure 3-3. Biomass (ATP) contents in the fouling layers of each RO membranes. The error
bars show the standard errors of the replicate samples (n=5). ................................................. 28
Figure 3-4. The abundances of proteobacteria (Alpha, Beta, and Gamma) and archaea in the
biofouling layers of membrane RO1 (a), RO3 (b), RO4 (c) and RO5 (d). .............................. 29
Figure 3-5. Total solid, volatile solid and organic fraction of fouling layers deposited on
membranes. The error bars show the standard errors of the replicate samples (n=5). ............ 30
Figure 3-6. SEM image (left) and EDS element weight percentage (right) of RO6 scaling
layer.......................................................................................................................................... 33
Figure 4-1. The cleaning cell (left), and the entire cleaning system with five cleaning cells in
parallel, fed with a single peristaltic pump with five pump heads........................................... 37
Figure 4-2. Biomass residual after 24 hours cleaning tests performed in cross-flow conditions
with the membranes (a) heavily fouled RO1, RO2 and RO3, and (b) moderately fouled RO4
and RO5. The cross-flow velocity applied was 0.1 m/s. The error bars show the standard
errors of three replicate experiments. The results without error bars are based on three
measurements from each experiment....................................................................................... 44
Figure 4-3. Proportion of viable cells in membrane biofilm before and after 24 hours
cleaning tests for membranes RO4 and RO5. A cross-flow velocity of 0.1 m/s was applied.
The error bars show the standard errors of 15 to 60 CLSM images. ....................................... 46
Figure 4-4. The abundance of proteobacteria (Alpha, Beta, and Gamma) and archaea in the
biofouling layers before and after 24 hours cleaning tests for the membranes RO1 and RO5,
respectively. Standard test conditions: FNA (50 mgN-NO2/L), pH 3, cross-flow velocity 0.1
m/s. The abundances of each microbe were calculated based on the FISH images (n=20±5).
.................................................................................................................................................. 47
Figure 4-5. Biomass removal (%, based on ATP values), protein and polysaccharide removal
(%) after 24 hours cleaning tests for the membranes (a) RO4 and (b) RO5. A cross-flow

xi
velocity 0.1 m/s was applied. The error bars in the plot show the standard errors of 2-3
replicate experiments. .............................................................................................................. 49
Figure 4-6. Biomass removal after 24 hours cleaning tests for the membranes heavily fouled
RO2 and RO3 and moderately fouled RO4. A cross-flow velocity 0.1 m/s was applied. The
error bars show the standard errors of three replicate experiments. The results without error
bars are based on three measurements from each experiment. ................................................ 50
Figure 4-7. Dissolved calcium content removed from the membrane surface after 24 hours
cleaning tests with membrane RO6. A cross-flow velocity 0.1 m/s was applied in all tests.
The error bars show the standard errors of four measurements from two replicate experiments.
.................................................................................................................................................. 52
Figure 5-1. A schematic diagram of the crossflow membrane filtration unit ......................... 59
Figure 5-2. Normalised permeability (Kw/Kw0) of filtration test 1 (a) and test 2 (b). Standard
test conditions: SE was circulating at 0.1 m/s in both filtration systems. For the experiment
filtration, the data points highlighted in red represent that the membrane was cleaned by FNA
(10 mg-N/L) at pH 3 for 6 hours on these specific. The scatter points are based on two
measurements from each experiment on each day. ................................................................. 62
Figure 5-3. Salt rejection of the filtration test 1 (a) and test 2 (b). Standard test conditions: SE
was circulating at 0.1 m/s in both filtration systems. For the experiment filtration, the data
points highlighted in red represent that the membrane was cleaned by FNA (10 mg-N/L) at
pH 3 for 6 hours on these specific dates. The scatter points are based on two measurements
from each experiment on each day. ......................................................................................... 64
Figure 5-4. CLSM images of fouling samples from control (a) and experimental (b) filtration
units. Live cells were stained in green with the DNA specific dye SYTO®
9 and the dead cells
are stained in red with PI. Standard test conditions: a cross-flow velocity 0.1 m/s was applied.
FNA (10 mg FNA-N/L) at pH 3 was cleaned for 6 hours in the experimental filtration unit on
a weekly base. .......................................................................................................................... 66

xii
LIST OF TABLES
Table 2-1: Major categories of membrane cleaning chemicals [19] .................................. 11
Table 2-2: Studies of biocidal effects of FNA on microorganisms..................................... 13
Table 3-1: RO membranes used in this study. .................................................................... 20
Table 3-2: Oligonucleotide probes used in FISH analysis .................................................. 22
Table 3-3: Protein and polysaccharides deposited on RO membranes. ........................... 31
Table 3-4: Metal concentration of fouling layers for each membrane (ICP-OES results)
.................................................................................................................................................. 32
Table 3-5: Hydraulic performances of RO membrane coupons (n=4). ............................ 34
Table 4-1: Design of the biofouling control tests. ................................................................ 38
Table 4-2: The repetition of the cleaning tests .................................................................... 39
Table 4-3: Design of the descaling tests with RO6. ............................................................. 39
Table 4-4: Comparison of FNA and NaOH cleaning effects on proteins and
polysaccharides. ..................................................................................................................... 48
Table 4-5: Hydraulic performances of membranes after cleaning tests. .......................... 54
Table 5-1: The composition of synthetic nutrient [146]. .................................................... 60
Table 5-2: The operation conditions of filtration tests and foulant analyses performed
after the filtration tests. ......................................................................................................... 60
Table 5-3: Summary results of foulant analyses ................................................................. 65

xiii
LIST OF ABBREVIATIONS AND NOMENCLATURE
Abbreviation
ATP: adenosine triphosphate
BSA: bovine serum albumin
CA: cellulose acetate
CFV: cross flow velocity
CLSM: confocal laser scanning microscope
CP: concentration polarisation
Cy: cyanine
DABCO: 1,4-Diazabicyclo[2.2.2]octane, Sigma-Aldrich
DBNPA: 2,2-dibromo-3-nitrilopropionamide
DI:
DNA: deoxyribonucleic acid
EDS: energy dispersive spectroscopy
EDTA: ethylenediaminetetraacetic acid
EPS: extracellular polymeric substances
FISH: fluorescence in-situ hybridization
FITC: fluorescein isothiocyanate
FNA: free nitrous acid
ICP: inductively coupled plasma
LOD: limit of detection
LOI: loss on ignition
N.D.: not determined
MF microfiltration
NF: nanofiltration
NP: normalised permeability
OES: optical emission spectrometry
PBS: phosphate-buffered saline
PFA: paraformaldehyde
PI: propidium iodide
PV: polyamide
RLU: relative light units

xiv
RNA: ribonucleic acid
RNS: reactive nitrogen species
RO: reverse osmosis
SBS: sodium bisulfite
SDS: sodium dodecyl sulfate
SE: secondary effluent
SEM: scanning electron microscopy
TFC: thin film composite
UF: ultrafiltration
UV: ultraviolet
Nomenclature
Å Angstrom
Cf: feed conductivity
Cp: permeate conductivity
J: flux (l∙h-1
∙m-2
)
K: permeability (l∙h-1
∙ bar-1
∙m-2
)
Ka: ionization constant
Kw: temperature corrected permeability (l∙h-1
∙ bar-1
∙m-2
, 25 ℃)
OF: organic fraction (%)
∆𝑃: transmembrane pressure (bar)
Qp: permeate flow rate (l∙h-1
)
S: membrane surface area (m2)
T: temperature (℃)
TS: total solids concentration(g.m-2
)
VS: volatile solids concentration (g.m-2
)

1
1. INTRODUCTION
§ 1.1. RESEARCH MOTIVATION
Due to freshwater scarcity across Australia and the world, membrane technologies have
gained enormous attention for water purification applications such as seawater desalination
and wastewater recycling. Compare to micro, ultra, and nanofiltration, reverse osmosis (RO)
filtrations can achieve high rate of contaminant removal using low energy consumption [2].
Due to this reason, RO membrane filtration has been widely applied for water purification in
recent years [3]. However, membrane fouling and specially biofouling are the major obstacles
hindering the full potential of RO purification processes [4]. Biofouling is defined as the
undesired development of microbial layers on RO membranes [5], and well known by its
adverse effects to the membranes. Studies have reported biofouling is likely to cause the
increase of energy and chemical costs, loss of water production and quality, and eventually
membrane deterioration [6, 7].
To restore the performances of RO membranes, chemical cleaning is regularly required.
Chemical cleanings involve alkali cleaning (i.e. sodium hydroxide) for organics and biofilm
removal, and acid cleaning (i.e. hydrochloric acid, citric acid) for scaling removal. However,
many studies have reported that biofouling cannot be removed effectively using the standard
chemical cleaning method [8-10]. The application of chemical cleaning agents in large
quantities has also caused significant operational costs and environmental issues for their
disposal [11-13].
Free nitrous acid (FNA) has been reported to have a strong biocidal effect on sewer biofilms
and waste activated sludge [14-18]. Studies have reported FNA potentially induce cell death
and biofilm detachment at parts per million levels (0.2 mg HNO2-N/L), and the biocidal
effect of FNA was increased by 43–51% when FNA is combined with hydrogen peroxide
(H2O2) [14, 15]. Based on these studies, it is anticipated that FNA not only can damage the
structure of biofouling layers but also can inactivate the microbes in the biofilm formed on
RO membranes. FNA as acid can hydrolyse organic constituents of biofouling layers such as
proteins and polysaccharides [19], resulting a loose biofilm that may be susceptible to
biocidal attracts. As a biocidal agent, inactivation of bacteria induced by FNA can inhibit the
development or the regrowth of biofilm. Moreover, the synergistic biocidal effect of FNA
and H2O2 has been well demonstrated on sewer biofilms and waste activated sludge [14-18],

2
as aforementioned, H2O2 is a strong oxidant agent that can also cause the death of bacteria.
Therefore, an alternative anti-fouling strategy using FNA with or without H2O2 for RO
membranes was studied. Additionally, it is expected FNA as an acid could potentially remove
scaling from RO membranes. The descaling efficiency of FNA was also investigated.
The potential inactivation and cleaning effects of FNA on RO membrane biofilms and the
application of FNA to replace the conventional two-stage cleaning strategy under cross-flow
conditions have formed the motivation for the work in this thesis.
§ 1.2. GENERAL RESEARCH OBJECTIVES
The main objective of this study is to use FNA with or without H2O2 for RO membrane
biofouling and scaling removal. The specific goals are:
1. To characterise biofouling of RO membrane from different full-scale plants.
2. To design a cleaning protocol under cross-flow conditions at lab-scale.
3. To determine the cleaning effects of FNA with or without H2O2 on different biofouling
matrix.
4. To reveal the optimal cleaning conditions for RO biofouling removal by studying the
impacts of FNA concentration, pH, and H2O2 concentration.
5. To determine the descaling efficiency of FNA in comparison with standard acid cleaning
solutions (i.e. hydrochloric acid and citric acid).
6. To investigate the ability of FNA to prevent the accumulation of fouling on RO
membranes at the bench-scale.

3
2. LITERATURE REVIEW
§ 2.1. INTRODUCTION
In this chapter, literatures about reverse osmosis (RO) membrane filtration and biofouling
have mainly been reviewed. The review includes the principles and functions of RO
membrane filtration, the principles and adverse effects of fouling and biofouling on RO
membrane filtration, prevention and cleaning methods for biofouling in RO processes.
§ 2.2. RO MEMBRANES FILTRATION
Flat sheet RO membranes are commonly packed in the spiral-wound configuration for large-
scale applications. The spiral-wound configuration is considered better than plate and cushion
configurations due to its high component density (high surface area to volume ratio) [20]. In
the spiral-wound configuration, RO membranes usually operate under cross-flow conditions
also known as dynamic filtrations. Figure 2-1 demonstrates the flow pattern of dynamic
filtration and the general configuration of the spiral-wound RO module. During the filtration
process, the feed flows across RO membranes in parallel, and is then separated into two
streams. The purified stream that passes through the membrane is called permeate and the
other stream that contains rejected solutes by RO membranes is called retentate or
concentrate [21, 22]. RO membranes have been widely used to produce purified water in the
seawater desalination, wastewater treatment and recycling plants, since RO membranes
produce high capacity and quality products with less requirement of energy [23].
Figure 2-1. Schematic diagrams of cross-flow pattern (left) and configuration of the spiral-
wound RO module (right) [20].
4
The asymmetric membrane made of cellulose acetate (CA) polymer is the first commercially
available RO membrane, which was developed by Loeb and Sourirajean in late 1950’s [24].
There are some disadvantages limit applications of CA membranes. CA membranes can be
easily degraded at high temperature and alkaline conditions. Therefore, the operating
temperature has to below 30℃ and pH is restricted to 4-6 for CA membranes applications
[22]. CA membranes have a low tolerance to chlorination, as the structure and selectivity of
CA membranes are likely to be degraded when continuously exposed to free chlorine (<1
mg/L) [25]. It has been reported that the cellulose backbone of CA membranes can be
consumed by the organisms in the RO feed water, which also leads to the membrane
degradation [26]. Thin film composite (TFC) membranes are the second generation of RO
membranes, which are composed of an active layer and a porous supportive layer. The active
layer is responsible for the filtration and commonly made of cross-linked aromatic polyamide
and the porous supportive layer is commonly made of polysulfone [27, 28]. TFC membranes
are more popular than CA membranes due to its higher performances in permeate flux
production and salt rejection [23, 28]. TFC membranes can be operated over a wider
temperature and pH range (pH 2-12) than CA membranes [29], hence TFC membranes have
been widely used in full-scale processes [30].
§ 2.3. FOULING ON RO MEMBRANES
Due to the high efficiency and selectivity of RO membranes, rejected solutes and particles
that are not flushed away by the cross-flow are likely to accumulate at membrane surfaces.
This phenomenon is generally referred as membrane fouling which can hinder membrane
performances [31, 32]. RO membrane fouling can be classified into four groups: biofouling,
inorganic fouling or scaling, colloidal fouling and organic fouling [33-39]. The formation and
development of fouling are influenced by feed water properties, hydrodynamic conditions,
temperature and pH [40, 41]. In reality, the performance loss of membranes is likely due to
the combination of different fouling phenomena [42-44]. RO fouling are generally initiated
by concentration polarization (CP) which is caused by the build-up of solutes near the
membrane surface [11, 31]. A cake layer induced by CP is formed by attaching more
microorganisms, colloidal particles, dissolved natural organic matter from feed water [45].
Cake-layers further enhance CP, hydraulic resistances and osmotic pressure near membrane
surface, resulting the decline of membrane performances in term of permeability and salt
rejection [42]. To recovery the performance of RO membranes, extra energy input might be

5
required to raise the operating pressure and to meet the production rate. Cleaning is an
alternative method to restore the capacity of membranes, especially in the case of heavy
fouling. Additional units or processes need to be installed to neutralise the cleaning chemicals
and to avoid the product contamination [12]. However, frequent or inefficient cleaning
normally leads to the replacement of membrane.
Among different types of fouling, biofouling have been considered as one of the most serious
operational problems in RO process and found in 70% of the seawater RO membrane plants
in the Middle East [46]. Literature suggests that effective anti-biofouling methods have not
yet been discovered or implemented yet, so there is an urgent need to define a simple and
effective method for biofouling control in RO applications. Mineral scales (i.e. calcium
carbonate) presented in almost any feedwater are more likely to interact with biofilm and
form a complex fouling network. Hence, the following literature review focus on biofouling
and scaling in RO processes and the respective control methods for biofouling and scaling.
§ 2.3.1. Biofouling
§ 2.3.1.1. Formation
Biofilm is a layer of microorganisms deposited at the membrane surface, and biofouling is
defined as the undesirable growth and proliferation of biofilm [12, 47]. The formation of
biofilm on RO membranes is inevitable, since the membrane filtration process provides water
and a surface for biofilm growth [48]. The feedwater is the source of microorganisms and
nutrients such as organic matters and salt ions which are essential for the growth of
microorganisms [49]. The RO membranes provide the platform for microbes to deposit.
Moreover, biofilm formation is greatly influenced by hydrodynamic operating conditions,
such as flow rate of feed (cross-flow rate) and product (flux) [41]. The effects of cross-flow
velocity (CFV) on biofilm remains unclear, as reports revealed that increasing CFV can either
facilitate or reduce the accumulation of biofilm on RO membranes [50]. It has been reported
that high CFV may pose a strong shear rate to reduce the CP and the rate of biofilm formation
[50, 51], but the other studies reported that high CFV or shear rate may attribute to the
formation of a denser and thinner biofilm [50]. High flux is achieved normally by applying
high pressure, which is likely to accelerate the development of biofilm. Suwarno et al.
revealed severe biofouling is caused by a higher flux rate [51], suggested that the growth rate
of biofilm is proportionally related to the flux rate.

6
A schematic diagram of biofilm development is given in Figure 2-2. A conditioning film
composed of inorganic solutes and organic molecules is formed on the membrane surface
initially. At the second stage, the conditioning film starts to attract free-floating cells from
feedwater [52]. Biofilm is formed with the embedment of microcolonies [22]. As the product
of microcolonies, extracellular polymeric substances (EPS) attach cells irreversibly to the
biofilm [53]. The number of embedded microorganisms has been reported to be 500 to
50,000 times higher than the free-floating cells in feedwater [48]. The biofilm is matured with
additional EPS production, and then is capable for cellular motility and reproduction [54, 55].
The reproduction of microorganisms in biofilm is problematic, as it has been reported that
although 99.9% of biofilm are removed, the remaining microorganisms are still able to
initiate the regrowth of biofilm by consuming the nutrients from feedwater [56].
Figure 2-2. Five stages of biofilm development [52].
§ 2.3.1.2. Structure and composition
The random structure and composition of biofilm is the main obstacle to study
biofilm/biofouling in RO processes, since the structure and composition of biofilms varies
widely depended on the process water and operating parameters [40, 41]. Biofilm is mainly
made up of 70-95% water. Within 5-30% of dry weight, 70-95% of EPS hold microbial cells
[57]. Beside the embedded microorganisms, EPS consist 40-95% of polysaccharides, up to
60 % of proteins and small amount of nucleic acids, lipids and other biopolymers [58].
Extracellular polymeric substances (EPS)
EPS are normally composed of polysaccharides, proteins, nucleic acids and lipids [59]. The
primary functionality of EPS is to facilitate the growth of biofilm by attaching microbes and

7
nutrients from feed water [53]. EPS participate in microbial activities. For instance, EPS store
nutrients and distribute them under starvation conditions [60]. EPS also contribute to the
formation of a complex and robust biofilm. The stability of EPS depends on the
hydrophobicity interaction with RO membranes, the cross-linking network with mineral ions
and the entanglements of the biopolymers within EPS matrix [61]. The complex network of
EPS protects embedded microbes to against shear force and cleaning attacks, and
substantially limits the diffusion of biocides and other disinfectants into the biofilm [62].
Nucleic acids and lipids occupy a small portion of EPS, which are contributed to the
stabilization of the biofilm structure and hydrophobic properties of EPS [55, 63].
Proteins and Polysaccharides
The main biological functions of proteins can be divided into five major classes: metabolism,
biosynthesis, secretion, adaptation and protection [55, 64]. Proteins have been reported to
play an important role in the initial adherence of biofilm onto the surface of membrane [55].
Proteins also serve as enzymatic catalysts for chemical reactions within the cell [65].
Structural proteins form parts of cell walls and ribosomes [65]. If the protein is successfully
removed or denatured, the functionality and structure of biofilm are expected to be damaged.
The main functionality of polysaccharides is glucose storage for energy generation [27].
Structural polysaccharides form parts of cell walls, like the peptidoglycan layer in bacterial
cell walls [27]. As major part of EPS, polysaccharides support the structural stability and
architecture of EPS. It was reported that exopolysaccharide composition induces the
filamentous networks and gel-like structures within biofilm [59, 65]. Polysaccharides also
facilitate the extension of EPS structure. For instance, polysaccharides contribute to the
formation of EPS backbone where other components of EPS can bind [66]. It is anticipated
successful removal of polysaccharides would not only cut-off the energy supply for the
microbial cells within biofilm, but also damage the structure of EPS and entire biofilm.
§ 2.3.2. Scaling
Inorganic fouling or scaling is caused by the precipitation of supersaturated inorganic ions
from feed water [37]. RO membranes are especially at high risk to experience scaling
problem, since a large number of rejected inorganic ions are likely contribute to the
concentration polarization on the membrane surface. When the concentrate stream becomes
supersaturated and exceeds the solubility limit of inorganic ions, dissolved mineral ions start

8
to precipitate and form scales in RO systems [37, 67]. Mineral ions such as calcium are
present in almost any feedwater, which are like to form calcium carbonate, calcium sulphate,
and calcium phosphate scales in high pressure water treatments. Silicate scale is another
common scale in RO systems, since silica is rich in nature [37]. Scale can be formed through
two schemes: surface crystallisation and bulk crystallisation [68, 69]. Surface crystallisation
is induced by the growth of the scale on the membrane surface. Bulk crystallisation is the
deposition of homogeneously formed crystals from the bulk solutions. Bulk and surface
crystallisation can also occur simultaneously [37]. Like the other types of fouling, scaling can
hinder RO membrane performances and cause the decline of flux and salt rejection, loss of
production, membrane deterioration and elevated operating costs.
Figure 2-3. Schematic demonstration of scale formation [37]
Scaling can be effectively controlled by acidification, antiscalant addiction and ion-exchange
softening. Acidification is commonly applied to prevent calcium carbonate (CaCO3) and
calcium phosphate by adjusting the pH of the feed water to 5-7 [70]. Acid addition increases
the solubility of calcium ions and keeps calcium salts soluble in the concentrate stream.
Acidification is also effective for removing scales from membrane surfaces. DOW
recommends to use 0.2 wt% of hydrochloric acid, or alternatively 2.0 wt% of citric acid for
severely CaCO3 fouled RO membranes [71].
Antiscalants are surface active materials that disrupt crystallisation process in three basic
ways: threshold inhibition, crystal modification and dispersion [37]. Threshold inhibition is
one of the functionalities of antiscalants, which enables sparingly salts ions soluble in their
supersaturated solutions without forming any crystals. Antiscalants worked as crystal
modifiers can distort crystal shapes and produce less adherent scales. Antiscalants such as
polyphosphates can interrupt crystal growth by attacking positive charged calcium and

9
magnesium scales at the sub-microscopic level. Antiscalants with high anionic charged
functional groups such as polycarboxylates can cause the dispersion of crystals by imparting
an anionic charge on the crystals, and the separation between the anionic charged crystals and
negatively changed RO membranes. Antiscalants should be applied with caution as overdose
of antiscalants may lead to the precipitation of themselves [72]. Moreover, monitoring the
quantities of antiscalant in the RO is more complicated than monitoring acidification [73]. In
addition, it has been reported the application of polyacrylic acid and phosphonates based
antiscalants for scaling removal could stimulate biofouling in RO systems [74].
Ion-exchange softening commonly use sodium attached resin to exchange with magnesium
and calcium ions based on the reactivity of these metal ions [73]. Consequently, the
concentration of magnesium and calcium ions is declined and so is the formation potential for
their associated scales. Brine solutions are required to regenerate the resin, which is a
disadvantage of this method since it is problematic to disposal brine regenerate [73]. In order
to decide the adequate decaling method among aforementioned methods, characterisation of
feed water, compatibility of the RO elements with chemical additives and costs associated
with the cleaning all have to take into consideration [37].
§ 2.4. RO MEMBRANES BIOFOULING PREVENTION AND CLEANING
METHODS
Biofouling control for RO membranes has generally been performed in two stages.
Stage one: Prevention is carried out to alleviate the formation of biofouling when the
capacity of RO membranes is yet to be influenced by biofilm. During the downtime of
RO processes, prevention is occasionally required to preserve the properties of RO
membranes [56].
Stages two: Cleaning is required to restore the performance loss of membranes caused
by biofouling [75, 76].
§ 2.4.1. Prevention Methods
In the past, prevention methods focused on removing nutrients and inactivating
microorganisms in the upstream of RO processes. Membrane pre-treatment is one of common
methods used to prevent the biofilm [12, 56]. By comparing to the other pre-treatment
technologies such as coagulation and flocculation, micro- and ultra-filtrations (MF and UF

10
respectively) are more efficient in bacteria, colloidal particles and nutrients removal with less
space requirements and chemical usages [12, 56]. However, membranes used in the pre-
treatment also have to face fouling and performance loss issues. The leakage of unwanted
fouling materials from pre-treatment units can cause fouling in RO units. It has been reported
fouling is likely to occur in RO units if MF and UF fail to reject sub-micro (> 1 𝜇m) materials
[56, 77].
Biocidal disinfection is commonly used to sterilise microorganisms in the upstream of RO
processes [12, 56]. Free chlorine, a strong oxidant, has been reported to be the most effective
biocidal agent [12, 56, 78], as it was reported that process water containing 0.04-0.05 mg/L
free chlorine can effectively prevent biofilm [79]. However, the application of free chlorine
has been limited due to its potential negative effect on membrane integrity. Many studies
reported that free chlorine can damage the active filtration layers of polyamide composite RO
membranes, and eventually lead to membrane degradation and replacement [80-83]. In order
to protect the integrity of polyamide composite RO membranes, process water containing free
chlorine should always be dechlorinated before entering the RO instalments. However,
chlorination and dechlorination using sodium bisulfite (SBS) have been reported to
occasionally enhance biofouling [56]. Alternative biocides such as chloramines,
monochloramine and chlorine dioxide have been applied to replace free chlorine [84-86].
Although these biocides have less effects on membrane, all of them have been found to be
less efficient at disinfecting than free chlorine [80].
Recent research has focused on membrane surface modification in order to produce chlorine-
resistance or low fouling membranes. Studies reported that bacteria are less likely to deposit
on the hydrophilic, negatively charged and smooth membrane surfaces [12, 56]. However,
membrane surfaces with these modification might attract hydrophilic and positively charged
fouling materials [12]. Although studies have suggested that low fouling membrane might
reduce the deposition of fouling materials [46], there is no guarantee that low fouling
membrane can completely prevent biofouling. Chemical cleaning is commonly required once
biofouling formed on RO membranes.
§ 2.4.2. Cleaning Methods
Membrane cleaning methods can be generally divided into two groups: physical and chemical

11
cleaning. Physical cleaning methods such as forward and reverse flushing, sponge ball
cleaning, permeate back pressure, vibration and etc. have been widely applied to clean hollow
fibre or tubular RO modules [87]. However, physical cleaning methods are not suitable for
spiral-wound RO modules. Chemicals are commonly employed to clean spiral-wound RO
modules. During cleaning processes, chemical agents are used to disperse biofilm by
disrupting the bonds between foulants, and between foulants and membrane surfaces [56]. A
shear force created by the cross-flow is normally applied along with chemical agents to
remove the detached fouling materials. There are five groups of chemicals commonly used to
clean RO membranes, as given in Table 2-1 [19].
Table 2-1: Major categories of membrane cleaning chemicals [19]
Category Functions
Caustic Hydrolysis, solubilisation
Biocides Oxidation, disinfection
Acid Solubilisation
Chelating Agents Chelation
Surfactants Dispersion, surface conditioning
Caustic solutions (i.e. sodium hydroxide, NaOH) are commonly used to clean organic and
biological fouled RO membranes through hydrolysis and solubilisation [19]. Caustic
solutions can potentially disrupt biofouling by hydrolysing its major organic constituents
such as polysaccharides and proteins. Moreover, caustic solutions not only can transform fats
and oils into water-soluble micelles, but also can increase the solubility of organic molecules
such as phenolic functional group [19]. Addition of NaOH creates the electrostatic repulsion
between negatively charged organic matters and membranes [88, 89], resulting a loose
fouling layer or even the dispersion of the fouling layers. Many studies have combined NaOH
with less harmful biocides such as 2,2-dibromo-3-nitrilopropionamide (DBNPA) [90],
chelating agents (e. g. ethylenediaminetetraacetic acid, EDTA) or detergents (e. g. sodium
dodecyl sulfate, SDS) to improve its cleaning efficiency [36, 91]. However, no evidence of
completely biofouling removal was found.
The cleaning effects of weak biocidal agents such as chloramines, monochloramine and
chlorine dioxide on biofouling have been widely studied. Weak biocides as oxidising agents
12
can reduce the adhesive forces between fouling materials (i.e. organic polymers) and
membranes [19]. As mentioned in the prevention methods, biocidal agents must applied with
caution due to their oxidising effect on the active filtration layers of RO membranes [12, 56,
90]. Hydrogen peroxide (H2O2) is another biocide commonly used for membrane disinfection
and storage [40]. H2O2 formed from hydroxyl free radicals causes the death of
microorganisms by breaking the cell wall of the microorganisms [12]. A non-oxidising
biocide, DBNPA (2, 2-dibromo-3-nitrilopropionamide) is efficient at inhibiting a large range
of aerobic and anaerobic bacteria [90]. Since DBNPA is not a non-oxidising agent, it does not
affect the membrane surface as chlorine. However, DBNPA has showed same shortcomings
as the other weak biocides, as DBNPA has demonstrated inefficient inhibition against algae
and fungi, and it is unstable in the solution at pH higher than 8 [12, 92].
Acids such as hydrochloric acid, citric acid and sulphuric acid are commonly applied to clean
scaling rather than biofouling, but the organic constituents (such as proteins and
polysaccharides) of the fouling layers can be hydrolysed by acid [19]. Acids and the chelating
agent EDTA are able to dissolve or chelate the divalent ions in the fouling layer, respectively
[19], which might result a less dense and adhesive fouling layer. Surfactant (i.e. SDS) can
interfere with fouling layers in three ways [19]: first, surfactants can raise the solubility of
fouling materials such as fat, oil and proteins by changing the hydrophobicity of these
materials, resulting the dispersion of these fouling materials. Second, surfactants are likely to
impede the adhesive force between bacteria and membranes. Lastly, the cell walls of bacteria
can be damaged by surfactants. There is a chance however those surfactants might bind to
fouling material that has an affinity to them and in turn enhance fouling. Hence, surfactants
such as SDS have been applied in combination with NaOH to ensure and improve the
cleaning efficiency.
Recently, biochemical enzymes have been examined aiming at cell lysis and biofilm
dispersion [93, 94]. For the purpose to destroy the structure of biofilm, polysaccharides lyases
and proteases have been invented to cleave the structure of polysaccharides and proteins,
respectively [12, 93, 94]. However, this method cannot provide a comprehensive control for
biofouling, since the enzymes are designed specifically to target on polysaccharides and
proteins [13, 95]. In addition, the production of biochemical enzymes is a costly process, and
degrading enzymes cannot be reuse after cleaning [12].

13
Overall, literature review reveals that the current prevention and cleaning methods for
biofouling are not efficient enough. None of the novel techniques have proved dramatically
improvement for biofouling control, and it is difficult to implement these techniques based on
the shortcomings listed above. Therefore, there is still a need to develop efficient methods for
biofouling control. In this study, the ability of free nitrous acid (FNA) to clean biofouling was
investigated.
§ 2.5. FREE NITROUS ACID (FNA)
§ 2.5.1. FNA and Its Biocidal Effect
FNA is the protonated form of nitrite, it is a weak and monobasic acid (pKa=3.34, 25℃)
which only presents in solution [96]. The concentration of FNA in solution is calculated
based on the following equation which is extracted from [97]: FNA = NO2--N / (Ka x 10
pH),
where Ka is the ionization constant of the nitrous acid (Ka=e-2300/(T+273)) and T is the
temperature (℃). Over the past 40 years, FNA has shown its strong biocidal effect on various
types of microorganisms, as summarised in Table 2-2.
Table 2-2: Studies of biocidal effects of FNA on microorganisms.
Year Remarks Reference
1976 FNA rather than nitrite inhibits nitrification [98]
2006 FNA inhibition on the metabolism of nitrifying
organisms in the nitrification
[99, 100]
2010 FNA inhibition on the aerobic metabolism of poly-
phosphate accumulating organisms (PAOs)
[16]
2010 FNA inhibition on the aerobic metabolism of glycogen
accumulating organisms (GAOs); on the anaerobic
metabolism of PAOs and GAOs.
[17, 101]
2012 FNA inhibition on aerobic and anoxic metabolism of
PAOs.
[102]
2012c FNA treatment improves the biodegradability of
secondary sludge
[103]
2013 FNA (with hydrogen peroxide) has a strong biocidal
effect on microbes in anaerobic sewer biofilms
[14, 15]
2014 FNA treatment can inactivate nitrite oxidizing bacteria
(NOB) and ammonium oxidizing bacteria (AOB).
[104]
2015 FNA effectively deactivates sulfide and sulfur oxidizing
bacteria (SOB) in the sewer corrosion layer.
[105]

14
Many studies have reported that the strong biocidal effect of FNA is likely derived from FNA
and its reactive nitrogen species (RNS) such as nitric oxide (NO), nitric dioxide (NO2) and
peroxynitrite [14, 106, 107].
2[HNO2 (aq) ↔ H+ + NO2
-] Equation 1
2HNO2 (aq) ↔ N2O3 (aq) + H2O (l) ↔ NO (aq) + NO2 (aq) + H2O (l) Equation 2
•NO + •O2- ↔ ONOO
- Equation 3
HNO2 (aq)+ H2O2 (aq) ↔ ONOO- + H3O
+ Equation 4
Zhou et al. [107] revealed that FNA hinders ATP synthesis by acting as an uncoupler agent,
however they acknowledged that this inhibition effect does not occur in every organism. NO
is one of intermediate products of the HNO2 reaction (Equation 2). NO has been reported to
react with heme and metal centres of proteins [107]. The product of this reaction, metal-
nitrosyl complexes (e.g. Fe-NO-R), can destruct the catalytic site of the enzymes, and then
inhibits electron transport and ATP generation [107]. NO also interferes with the oxygen
respiration and hence inhibits oxygen uptake rate for the cells [108]. The other two RNS of
FNA, NO2 and peroxynitrite have also been reported to play important roles during the
biocidal processes. NO2 can induce lipid peroxidation, resulting in cell membrane damage
[109]. Peroxynitrite (ONOO-) can oxidise protein, DNA and lipids, and lead to the death of
microbial cells [110]. Moreover, recent studies have revealed that FNA is able to break the
structure of biofilm extracted from waste activated sludge. Du et al. reported that FNA can
break the bond between organic materials and metals (cooper and zinc) and the structure of
EPS [111]. Zhang et al. also demonstrated the breakdown of macromolecules such as
proteins in EPS under the impact of FNA [18]. Based on the inhibition mechanisms of FNA
and its reactive nitrogen species (RNS) on microorganisms and biofilm structure, it is
anticipated that FNA can be effective for biofouling control. However, disinfection using
FNA involves risks, as it reported that sodium nitrate can react with organic substances to
produce carcinogenic nitrosamines under acidic conditions [112]. FNA is generally prepared
by mixing sodium nitrite and hydrochloric acid. Hence, using FNA at low pH level may lead
to the formation of disinfection by-products (DBPs) such as carcinogenic nitrosamines in the
RO systems. The formation of nitrosamines is specifically not desired in water treatment, as
human exposure to these may have serious health effects such as cancer [113, 114]. Hence,

15
the formation potential of carcinogenic nitrosamines should be investigated before applying
FNA at real plants.
As previously mentioned in the cleaning method, H2O2 is a strong oxidant that can cause the
death of microorganisms. The synergistic biocidal effect of FNA and H2O2 has been
demonstrated in the anaerobic wastewater system [15]. Jiang et al reported that applying
H2O2 can enhance the biocidal efficiency of FNA on anaerobic sewer biofilm from 90% to 99%
[15]. Many studies have reported that H2O2 can lethally effect on bacteria by oxidising
proteins, DNA and bacterial cell membranes [15, 115]. Hence, it is postulated that combining
H2O2 with FNA would enhance the effect of FNA on biofouling.
In addition, FNA as an acid should be capable of removing inorganic scaling from RO
membranes as commercial acids, such as hydrochloric acid (HCl) and citric acid. This could
allow one-stage cleaning for biofouling and scaling, reduce the requirement and hence cost of
two stages cleaning: alkaline cleaning for organics and biofouling removal and acid cleaning
for scaling removal [116].
§ 2.5.2. FNA versus Other Biocides
In addition to the strong biocidal effects of FNA on microorganisms, it was anticipated
applying FNA has more advantages than applying other biocides. The first advantage was
that free nitrous acid will not damage the active filtration layers of RO membrane as other
biocides do. The ageing effect of FNA on TFC polyamide membranes were studied in our
research team. Results of ageing tests showed that polyamide membranes are compatible with
FNA. In comparison, application of free chlorine is generally not recommended to protect the
integrity of polyamide composite RO membranes as aforementioned (§ 2.4.1 Prevention
Methods). Though alternative biocides such as monochloramine has less effect on polyamide
composite membrane in compare to free chlorine, the efficiency of monochloramine in
disinfection was found to be reduced [80]. By applying FNA, there is no need to evaluate the
tradeoff between the effect of FNA on membrane and its efficiency in disinfection.
Moreover, the residual control for the new technique using FNA was anticipated to be more
convenient. FNA is prepared from the commonly available sodium nitrite and hydrochloric
acid, and can be simply discharged after dilutions, as the residues of FNA solutions were

16
reported to be biodegradable. Hence, its disposal after dilutions will not cause environmental
problems. In comparison, monochloramine is formed by mixing aqueous ammonia and
sodium hypochlorite. As a consequence, a large amount of ammonia is generally required to
balance monochloramine residual in the reverse osmosis concentration stream, which is
unwanted for the environment. For example, this is under strictly control at Luggage Point
Luggage point wastewater treatment plant (Brisbane, Australia) [117].
Another benefit of using FNA is it works as an acid which can remove scaling as well. If
FNA could remove biofouling and scaling simultaneously, it not only benefits the cleaning
process but also reduces the costs associated with conventional two-step cleaning. In
comparison, common biocides such as chloramines, monochloramine and chlorine dioxide
can only be used for biofouling mitigation. Therefore, new cleaning method using FNA was
proposed for RO membranes in this study.
§ 2.6. RESEARCH GAP
The literature review has shown the principles of RO membrane filtration, the adverse effects
of fouling and biofouling on RO membrane filtration, prevention and cleaning methods for
biofouling in RO processes. Due to the highly varied features of biofouling in RO processes,
no adequate method can be applied among conventional and novel cleaning methods.
Therefore, the major objective of this study is to examine the efficiency of an alternative
chemical agent named FNA for RO membrane biofouling control. Additionally, RO
membrane fouled at different full-scale plants were characterised and the preliminary study
on the effect of FNA for fouling prevention in RO processes were carried out. The specific
approaches are given as following.
Objective 1: To characterise RO membranes biofouling fouled at different full-scale plants.
(Chapter 3)
Five RO membranes fouled at different full-scale plants were used in this study, the degree
and composition of different biofouling matrices were anticipated to be highly varied. As
reviewed in section 2.3.1, biofouling is mainly composed of microorganisms, proteins,
polysaccharides plus the other organic and inorganic materials. The purpose of this objective
was to reveal the characteristics of five different fouling matrices before undergoing FNA
cleaning. Different fouling matrices were characterised by quantifying the major constituents

17
such as bacterial cells, inorganic ions, proteins and polysaccharides in the biofouling layers.
In addition, the live and dead bacterial cells of biofouling layer were measured in order to
investigate the biocidal effects of FNA on RO biofouling.
Objective 2: To use FNA with or without H2O2 in a single stage for RO membrane
biofouling and scaling removal. (Chapter 4)
A cleaning protocol using cross-flow conditions was designed for the cleaning tests. As
previously reviewed, the shear forces generated by the cross-flow might be potentially
facilitate biofouling cleaning by removing fouling materials detached from biofouling layers
and promoting the diffusion of cleaning solutions. Hence, RO membranes were cleaned by
FNA cleaning solutions and NaOH (pH 11) at a cross-flow rate of 0.1 m/s for 24 hours. As
the main objective of this study, the efficiency of FNA with or without H2O2 for membrane
biofouling control was reflected by the reduction of fouling materials (bacterial cells, viable
cells, proteins and polysaccharides) in the biofouling layers after cleaning tests.
In addition, the effect of FNA on the scale deposited on RO membrane was tested using the
cleaning protocol developed for biofouling control. The descaling efficiency of FNA was
assessed along with standard acid cleaning solutions (i.e. hydrochloric acid and citric acid),
all FNA and standard acid cleaning solutions were adjusted pH at 2 and 3 for the cleaning
tests, as these pH levels were recommended by the membrane manufacturer [116]. The
descaling efficiency was determined by evaluating the concentration of dissolved salt ions
that have been removed by each cleaning solution.
Objective 3: To investigate the ability of FNA to prevent the accumulation of fouling on
RO membranes at bench-scale. (Chapter 5)
Biofouling control in RO membrane processes is generally divided into two groups,
prevention and cleaning, as aforementioned, but the ideal condition for biofouling control is
to prevent the initial adsorption of fouling materials on RO membranes. Thus, the efficiency
of FNA for RO membrane biofouling prevention was preliminarily investigated in this study.
Two bench-scale crossflow RO filtration units were applied to simulate fouling accumulation
processes, except only one of filtration units was exposed to FNA cleaning for 6 hours on a
weekly base. As previously reviewed, fouling is the main reason that causes the performances
loss of RO membranes, and the development of fouling can be reflected by the loss of
permeability and salt rejection in RO processes. Hence, the hydraulic performances of RO

18
membranes filtrations with or without FNA treatment have been continuously monitored for
up to three weeks, in order to justify the ability of FNA to prevent fouling on RO membranes.
After the filtration tests, the effect of FNA on fouling layers was revealed by comparing the
characteristics of fouling material deposited on the RO membranes with or without FNA
treatments.

19
3. RO MEMBRANE FOULING CHARACTERISATION
§ 3.1. INTRODUCTION
The fouling is notorious to the membrane process, as it hinders the process to perform their
full capacity [4]. When the performance decline cannot be restored due to irreversible fouling,
membrane autopsy can be conducted to discover the causes. In this study, membrane
autopsies were performed to characterise membrane foulants prior cleaning trials. Six fouled
RO membranes from different full-scale plants were used.
Membrane autopsy involves visual inspection, fouling characterisations and hydraulic
performance of RO membranes. Fouling was characterised in three fractions: biological,
organics and inorganics. The biological and organics fractions were determined via biological
and molecular analyses. In these analyses, the quantities of biomass were measured to reveal
the fraction of biofouling. The organic fraction was determined by measuring protein,
polysaccharides and volatile solid. The proportion of inorganic material was revealed via
elemental analysis. Based on the results of membrane autopsy, fouling characterisations not
only revealed the composition of fouling layers, but also the degree of fouling (the quantities
of foulant deposits) on RO membranes. The hydraulic performance was determined in terms
of permeability and salt rejection. Sample preparation and the procedures of each analysis are
given in this chapter.
Results reported in this chapter formed part of the following submitted paper
E. Filloux, J.Wang, M. Pidou, W. Gernjak, Z. Yuan. 2015. Biofouling and scaling control of
reverse osmosis membrane using one-step cleaning - potential of acidified nitrite solution as
an agent.

20
§ 3.2. MATERIALS AND METHODS
§ 3.2.1. Membranes
Membrane autopsies have been done on six fouled RO membranes. All RO membranes are
commercial thin-film composite polyamide membranes, which were collected from full-scale
plants (Table 3-1) and stored in the cold room at 4℃ until membrane autopsy took place. In
membrane autopsy, biological fouled RO modules (RO1-5) were undergone all the analyses
listed in section 3.3 Membrane Autopsy. The RO6 was expected to be mainly fouled with
calcium carbonate scales and characterised by the elementary analysis and hydraulic tests
only.
Table 3-1: RO membranes used in this study.
Membrane # Source Fouling Type Membrane
Autopsy
Date
RO1
RO2 Industrial wastewater recycling plant Biofouling
2013/10/16
2014/01/13
RO3 Water reclamation plant Biofouling 2014/05/07
RO4 Water reclamation plant Biofouling 2014/08/13
RO5 Seawater desalination plant Biofouling 2014/10/30
RO6 Coal seam gas water recycling plant Scaling 2014/07/09
§ 3.2.2. Sample Preparation
Foulant samples were collected in two ways: (1) the in situ method, which membrane
coupons with foulant attachments were cut directly from RO modules, (2) the destructive
extraction methods, which foulant was physically scraped or brushed off the membranes [91].
Size of membrane coupons and extra preparation procedures are varying depending on the
limit of detection of each analysis. For microscopy based analyses, in situ biofilm samples on
RO membrane coupons were prepared. In order to conduct comprehensive membrane
autopsy, five biomass samples were collected from different location of RO modules for each
analysis.
§ 3.3. MEMBRANE AUTOPSY
§ 3.3.1. Biological Analysis

21
§ 3.3.1.1. Adenosine tri-phosphate (ATP)
ATP is an energy-rich compound present in all living microorganisms [118]. The method for
analysing ATP was adapted from Hammes et al. [119]. ATP was determined using the
BacTiter-GloTM reagent (Promega Corporation, USA). For ATP measurements, biomass
samples were prepared from a membrane coupon (2x2.5 cm2) using the destructive extraction
method. A set volume of biomass sample (300 µL) was mixed with 50 µL of the reagent in
the 96 well plate (Greiner Bio-One, Germany). The luminescence response was then
measured at 38℃ after 20s orbital shaking by a DTX 880 multiplate reader (Beckman coulter,
USA). Samples were prepared in triplicate with at least three controls. MilliQ water (control)
and standard controls prepared from pure rATP (Promega Corporation, USA) were measured
for each batch of sample. Data were acquired as relative light units (RLU) and then converted
to ATP concentrations (nM) using a calibration curve made from pure rATP standard, as
given in the Appendix Figure A-1.
§ 3.3.1.2. Fluorescence in situ hybridization (FISH)
FISH can hybridise targeted microbes with fluorescently labelled oligonucleotide probes and
was applied to provide visual examination and quantification for the targeted microbes [120,
121]. FISH were performed as described in Amann et al. [122]. 0.5 mL biomass was fixed in
2 volumes of 4% paraformaldehyde (PFA) for 2 h at 4℃. Fixed biomasses were washed with
phosphate-buffered saline (PBS). Fixed cells were then well suspended in the mixture of 100%
ethanol-PBS (1:1) and stored in the freezer (-30℃) until the hybridisation.
Approximately 3 μL of fixed cell suspension was applied to each well of the glass slide
(coated with 0.1% gelatin solution). After air-drying, the slide was dehydrated in an ethanol
series of 50, 80 and 98% ethanol (3 min each). Hybridisation buffer (2 ml) containing 30%
formamide. 9uL of hybridisation buffer was added to each well, followed by the addition of 1
μL fluorescently labelled probes (0.5ng/μL). Since proteobacteria and archaea has been found
in many reverse osmosis application plants for water treatment [123-129], FISH probes
targeting major groups of proteobacteria were applied as well as general bacteria and archaea
in this study (Table 3-2).

22
Table 3-2: Oligonucleotide probes used in FISH analysis
Specificity FISH probe-
fluorochrome
Probe Sequence (5’-3’)
References
Bacteria EUB338c-Cy5
d GCTGCCTCCCGTAGGAGT [120]
EUB338+c-Cy5
d GCWGCCACCCGTAGGTGT [120]
Alphaproteobacteria ALF1b-Cy3d CGTTCG(C/T)TCTGAGCCAG [130]
Betaproteobacteria BET42a-FITCd GCCTTCCCACTTCGTTT [130]
Gammaproteobacteria GAM42a-FITCd GCCTTCCCACATCGTTT [130]
Most Archaea ARC915-FITCd GTGCTCCCCCGCCAATTCCT [130]
a Base on Escherichia. coli rRNA numbering [131].
b Percentage formamide in the hybridization buffer.
c EUB338 and EUB338+ are used in a mixture called EUBMIX.
d Fluorescein isothiocyanate (FITC), cyanine (Cy) 3 and 5 are green, red and blue labelled
FISH probes, respectively.
The slide was incubated at 46℃ for 2 h and then washed for 15 min at 48℃. Extra salts (from
buffers) were removed by dipping the slide in the cold water (4℃) for 2–3 s. After air-dried,
the slide was mounted with DABCO (1,4-Diazabicyclo[2.2.2]octane, Sigma-Aldrich) and
viewed under the Zeiss LSM510 confocal laser scanning microscope (CLSM) (School of
Chemistry and Molecular Biosciences at UQ). 20 ± 5 images were randomly taken for each
sample using the CLSM equipped with a Krypton–Argon laser (488 nm) and two He–Ne
lasers (543 and 633 nm). The images were imported to DAIME (Centre for Organismal
Systems Biology, Austria) for biovolume fraction analysis.
§ 3.3.2. Organic and Molecular Analysis
§ 3.3.2.1. Loss on ignition (LOI)
LOI is a gravimetric method for measuring organic and inorganic fractions in biofouling
layers [132].The fouling samples were collected from a known surface area of membrane
(40×40 cm2) using destructive extraction methods. The samples were transferred to crucibles,

23
and subsequently dried in an oven at 105°C overnight and a furnace at 500°C for another 3~4
hours. The total and volatile solids concentrations were then calculated as follows:
Total solids concentration(g/m2) : 𝑇𝑆 =
𝑤2 − 𝑤1
𝑆 Equation 5
Volatile solids concentration (g/m2): 𝑉𝑆 =
𝑤2 − 𝑤3
𝑆 Equation 6
Organic fraction (%): 𝑂𝐹 = 𝑉𝑆 𝑇𝑆⁄ × 100 Equation 7
Where w1 is the weight of the crucible, w2 is the weight of the crucible and deposits after
oven, w3 is the weight of the crucible and deposits after furnace and S is the surface area of
membrane coupons.
§ 3.3.2.2. Polysaccharide quantification with phenol-sulfuric acid method
Phenol-Sulfuric Acid method, also known as DuBois’s method was used to determine
polysaccharides in aqueous solutions [133]. Biomass samples were collected through the
destructive extraction method, 1mL aliquot of biomass samples (n=2) was mixed with 1 mL
of phenol 5 % (w/v) (Sigma-Aldrich, reagent plus >99 %). Samples were mixed carefully and
incubated for 10 min. 5 mL of sulfuric acid 98 % (Merck, 98 %) were added to the mixture
and incubated for 30 min. Mixture samples and blank solution were then analysed with a UV
Spectrophotometer (Varian Cary 50 UV-Visible) at wavelength 490 nm. The signals were
calibrated with glucose, and the amount of polysaccharides was represented as g glucose per
unit area.
§ 3.3.2.3. Protein quantification with the BCA method
The BCA-method was used to quantify protein in solutions, which has been introduced by
Smith et al. in 1985 [134]. A BCA Assay Kit (Sigma, USA) contains three regents:
QA (alkaline buffer), a 250 mL of mixture of sodium carbonate, sodium tartate, and
sodium bicarbonate in 0.2 M NaOH, pH 11.25.
QB (BCA solution) contains 250mL of a 4% (w/v) bicinchoninic acid solution, pH 8.5.
QC contains 12mL of a 4% (w/v) copper (II) sulfate, pentahydrate solution.
Triplicate biomass samples were prepared through the destructive extraction method, 2 mL
aliquot of sample was mixed with 2 mL protein reagents in a ratio of 100 QA: 100 QB : 4 QC.
The mixture samples and then transferred into a preheated oven (37℃ , Thermo Fisher
Scientific Australia) for 2 hours. The samples and blank solution were then immediately

24
measured by the UV Spectrophotometer at wavelength 562 nm. The signals were calibrated
with bovine serum albumin (BSA), and the amount of proteins was reported as g BSA per
unit area.
§ 3.3.3. Elementary Analysis
§ 3.3.3.1. Inductively coupled plasma-optical emission spectrometry (ICP-OES)
Vista-PRO simultaneous ICP-OES (Varian Inc.) was used to measure the metal contents in
fouling layers [106]. A set area of fouled membrane coupon was cut and placed in a 50 mL
yellow capped tube with 20 mL of 10% nitric acid solution. Samples were then recovered
after 1-2 min vortex and kept at room temperature until the digestion process. Aggregate
compounds were further broken and dissolved during the digestion process. Final filtered
samples were used for the ICP-OES measurements and reported.
§ 3.3.3.2. Scanning electron microscopy-energy dispersive spectroscopy (SEM-EDS)
A Philips XL30 scanning electron microscope (secondary electrons) was used to directly
visualise the foulant from the membrane surface. Samples of approximately 3x10 mm were
cut from the RO modules and dried in a desiccator for at least 24h. Before the analysis,
samples were placed on metal stubs and then Pt coated. Typical imaging has been done at
500x magnification rates, 15 kV accelerating voltage. Energy Dispersive X-ray Spectroscopy
was performed on the previously SEM imaged areas with a typical working distance of 10.3
mm. Elemental percentage has been obtained after background subtraction and ZAF
optimization.
§ 3.3.4. RO Membrane Hydraulic Performances
Hydraulic performances of RO membranes were evaluated by measuring both water
permeability and salt rejection. Hydraulic performance tests were carried out in a laboratory
scale cross-flow filtration unit (Figure 3-1). The unit is composed of a 15 L feed tank, a
diaphragm pump (Metering pump Z series, Tacmica), a dampener (PD36, Neptune), two
filtration cells (CF042, Sterlitech, Figure 3-1) and two needle valves.
The pressure and flow rate of this system required constant monitoring during the
measurements. Pressure of the system was indicated by a sensor (Cerabar M, Endress &

25
Hauser) located in the feed line just before the filtration cells. A flow meter is fitted in bypass
line indicating the total flow rate of two inlet streams in the filtration units. The system was
operated in batch mode and consequently both permeate and concentrate were recirculated
back into the feed tank. Once the system reaches steady state, an operating pressure of 5 bars
and total flow rate of 80 L/h could be applied based on the overall setting. The following
parameters can be calculated by recording the permeate flow rate, temperature, pressure and
the conductivity of salt feed and permeate streams.
𝐽 =𝑄𝑃𝑆
Equation 8
where 𝐽: Flux [𝐿
𝑚2×ℎ], Qp: Permeate flow rate [
𝐿
ℎ], S: Membrane surface Area [𝑚2]
𝐾 =𝐽
∆𝑃
Equation 9
where K: Permeability [𝐿
𝑚2×ℎ×𝑏𝑎𝑟], 𝐽: Flux [
𝐿
𝑚2×ℎ], ∆𝑃: Transmembrane pressure [bar]
𝐾𝑤 =𝐾
𝑒𝛽×(1
273.15+𝑇−
1298.15
)
Equation 10
where Kw: Temperature corrected permeability [𝐿
𝑚2×ℎ×𝑏𝑎𝑟, 25℃], K: Permeability [
𝐿
𝑚2×ℎ×𝑏𝑎𝑟], T:
Temperature[℃] 𝛽: Membrane coefficient
Salt Rejection = (1 −𝐶𝑝
𝐶𝑓) × 100
Equation 11
where 𝐶𝑝: permeate conductivity, 𝐶𝑓: feed conductivity
The pure water permeability was monitored for 1-2 hours and was recorded every 30 minutes.
For salt rejection tests, the DI water was subsequently replaced by a 1500 mg/L sodium
chloride (NaCl) solution and operational data points were recorded at same interval for 1-2
hours.
Figure 3-1. Cross flow filtration unit.

26
§ 3.4. RESULTS AND DISCUSSION
§ 3.4.1. Visual Inspection
In Figure 3-2, brown viscous deposits were observed on RO1 and RO2. The color of fouling
layers was darker on RO2 than RO1, and so did the density of the fouling layers. The
observation implied that concentration of foulant on RO2 was higher than that on RO1.
Brown silky deposits were spotted on RO3, which were not as viscous as fouling deposited
on RO1 and RO2. Deposits were spread across these membranes’ surfaces. However, the
abundance of fouling has decreased from the feed side over to the concentration side of the
membranes. Smell could be noticed when unfold these membranes. Dark brown and white
gelatin-like deposits were observed on RO4 and RO5, respectively. Based on the visual
inspection, it appeared the abundance of deposits on RO4 and RO5 were less than that on RO
1 to RO3. RO6 was covered with hard, dry, dark brown fouling deposits.
RO1
RO2
RO3
Figure 3-2. Visual inspection on fouled membranes (RO1-6).

27
RO4
RO5
RO6
Figure 3-2 (continued). Visual inspection on fouled membranes (RO1-6).
§ 3.4.2. Biofouling Characterisation
§ 3.4.2.1. Biomass quantification
The biomass deposited on RO membranes was measured in term of ATP (Figure 3-3).
Biomass was detected on all membranes, and the biomass load from high to low is following
this order: RO2 (4234±1543 pgATP/cm²)>RO1 (950±288 pgATP/cm2)>RO3 (919±477
pgATP/cm2)>RO5 (339±159 pgATP/cm²)>RO4 (204±153 pgATP/cm²). In membrane
systems, fouling layer is considered to have high biomass contents when the ATP
measurement exceeds 1000 pg/cm² [135, 136]. Hence, the results suggested that RO
membranes (RO1 to RO3) were severely fouled with biomass. In agreement to the visual
observation, the results suggested that RO2 was most fouled membrane, and RO4 and RO5
were least fouled membranes.
28
Figure 3-3. Biomass (ATP) contents in the fouling layers of each RO membranes. The error
bars show the standard errors of the replicate samples (n=5).
§ 3.4.2.2. Microbial community of biofouling layers
Based on FISH images (n=20±5), the relative quantities of each microbe and the total
community (all bacteria and archaea) were estimated using DAIME (Appendix Table B-1).
The representative FISH images are given in the Appendix Figure B-1. Figure 3-4 presents
the distribution of each microbe on different RO membranes. The Alphaproteobacteria,
Betaproteobacteria and archaea presented in all biofouling matrixes. More than 60% of
communities were identified by the FISH probes for RO1 and RO5. Alphaproteobacteria
(43%) dominated in RO1 with significant amount of Betaproteobacteria (21%), while the
opposite observed in RO3. Gammaproteobacteria emerged in RO4 and RO5. Within the 25%
detection range, 17% of Gammaproteobacteria was the dominant group in RO4. Community
in RO5 were even distributed within 4 groups with slightly higher abundance of Archaea
(28%).
The results showed that the quantities of detected microbial communities are not related to
the degree of biofouling on membranes, since more than 60% of microbial communities were
identified for both heavily fouled membrane RO1 and moderately fouled membrane RO5.

29
Although proteobacteria and archaea has been mainly found in many reverse osmosis
application plants, proportion of each microbe depends on RO feed water quality, operation
conditions, and sampling location [123-129]. It explains the substantial difference in
distribution and abundances of each microbe in different biofouling matrixes. Less than half
of microbial communities have not been defined by chosen FISH for RO3 and RO4. The
results suggested that more comprehensive FISH analysis is needed by introducing new FISH
probes other than Alphaproteobacteria, Betaproteobacteria, Gammaproteobacteria and
archaea.
(a)
(b)
(c)
(d)
Figure 3-4. The abundances of proteobacteria (Alpha, Beta, and Gamma) and archaea in the
biofouling layers of membrane RO1 (a), RO3 (b), RO4 (c) and RO5 (d).
§ 3.4.2.3. Loss on ignition (LOI)
The organic fractions of the fouling layers were measured by LOI. LOI estimated the
percentage of volatile solids in the total solids measured on membranes. Figure 3-5 reveals
there was more than 88% of organic material deposited in all fouling matrixes. It has been

30
reported that membranes are likely biofouled if the fouling layers contain a large quantity of
microorganisms and more than 70% of organics substances [57, 137]. Hence, the LOI results,
along with the ATP measurement, confirmed the presence of large amount of organic matters
on the surface of membranes, suggesting these membranes (RO1-5) were covered by a
mixture of organic and biological fouling.
In accordance to biomass quantification, the total solid contents of RO1 to RO3 (1.9±0.1 to
4.0±0.1 g/m2) was more than two times of RO4 and RO5 membranes (0.8±0.1 and 0.5±0.2
g/m2 respectively). The quantities of biomass and total solids have suggested that RO1-RO3
were heavily biofouled, RO4 and RO5 were moderately biofouled.
Figure 3-5. Total solid, volatile solid and organic fraction of fouling layers deposited on
membranes. The error bars show the standard errors of the replicate samples (n=5).
§ 3.4.2.4. Proteins and polysaccharides
Proteins and polysaccharides were determined as the organic constituents of fouling layers. In
addition to the biomass deposits, protein (0.04-0.07 gBSA/m²) and polysaccharide (0.07-0.16
gGlucose/m²) were found in the fouling layers (Table 3-3). The detection of biomass and
biopolymers implied that RO membranes were biofouled. However, the amounts of protein
0
20
40
60
80
100
120
0
1
2
3
4
5
RO1 RO2 RO3 RO4 RO5
Org
an
ic F
ract
ion
(%
)
Soli
d D
eposi
t (g
/m2)
Reverse Osmosis Membranes
Total solid (g/m2)
Volatile solid (g/m2)
Organic fraction

31
are not in accordance to biomass contents in the fouling layers. It has been reported that
protein contents in biofouling are highly influenced by the properties of feed water [138].
Hence, the results of protein could not reflect the degree of fouling. The trend of
polysaccharide deposits was in the opposite order as the biomass content for each RO
modules. The polysaccharide deposits on RO4 (0.16±0.03 gGlucose/m2) and RO5 (0.15±0.08
gGlucose/m2) were two time higher than that on RO1 (0.07±0.01 gGlucose/m
2). According to
the life cycle of biofilm development [52], a conditional layer composed of inorganic and
organic is formed on the membrane surfaces at the beginning, which attracts more bacterial
cells for biofilm growth. These results suggested that RO4 and RO5 are covered with less
matured biofilm, since less biomass and high concentration of biopolymers were found in
their fouling layers.
Table 3-3: Protein and polysaccharides deposited on RO membranes.
Membrane # RO1 RO2 RO3 RO4 RO5
Proteins
(gBSA/m2, n=2)
0.06±0.01 n.d. n.d. 0.04±0.01 0.07±0.03
Polysaccharides
(gGlucose/m2, n=3)
0.07±0.01 n.d. n.d. 0.16±0.03 0.15±0.08
n.d.: not determined. The deviation ranges show the standard errors of the replicate samples.
§ 3.4.2.5. Elemental analysis
Metals concentrations, representing less than 12% of total solid deposits, were determined by
ICP-OES. Table 3-4 shows high concentrations of calcium (Ca) ions were found in all
fouling matrixes. Iron (Fe) was second abundant ion, which was dominant in the fouling
layers of RO1 and RO2 (0.04±0.01 g/m2). Divalent Ca and Fe ions primarily influence fouling
in two aspects. First, Ca and Fe ions promote the adsorption of organic matters such as
polysaccharides either to the membrane surfaces or biofouling layers [7, 34, 36]. Second, Ca
and Fe ions interact with proteins and polysaccharides, resulting complex and bridge
structures in the fouling layers [34, 36, 139].
The concentration of sodium (Na) up to 0.1 g/m2 was found in the fouling layers of RO5,
which 1 to 2-log higher than the amounts on RO1-4. Since the membrane was fouled at
seawater desalination plant, the high amount of sodium deposits must from the feed water.

32
Studies have reported phosphorus (P) is essential for all living organisms as it participates in
the synthesis of deoxyribonucleic acid (DNA), ribonucleic acid (RNA), and ATP [140, 141].
P was found on all membranes except RO4, implying biofilm is likely to be formed on these
membranes.
Table 3-4: Metal concentration of fouling layers for each membrane (ICP-OES
results)
Membrane
# RO1 RO2 RO3 RO4 RO5
Metals
(n=5)
Calcium
(g/m2)
0.01±0.00 0.03±0.00 0.03±0.00 0.01±0.01 0.01±0.00
Iron
(g/m2)
0.04±0.01 0.04±0.01 0.004±0.001 <LOD <LOD
Sodium
(g/m²) 0.01±0.00 0.01±0.00 0.02±0.00 0.003±0.000 0.1±0.0
Phosphate
(g/m2)
0.005±0.001 0.02±0.01 0.01±0.00 <LOD 0.004±0.002
Sulfur
(g/m2)
0.002±0.000 0.01±0.00 0.02±0.00 <LOD 0.01±0.00
Magnesium
(g/m²) 0.006±0.001 0.01±0.00 0.005±0.001 <LOD 0.02±0.00
Potassium
(g/m2)
0.003±0.000 0.006±0.002 <LOD <LOD 0.006±0.001
Manganese
(g/m²) 0.001±0.000 0.002±0.000 <LOD <LOD 0.001±0.001
LOD: limit of detection. The deviation ranges show the standard errors of the replicate samples.
§ 3.4.3. Scaling Characterisation
Elemental analyses (ICP-OES and SEM-EDS) were performed on the foulant characterisation
for membrane RO6. ICP-OES results revealed that the fouling layer was dominated by
calcium (21.7±3.8 gCa/m2) and smaller concentrations of barium, potassium and magnesium.

33
As the RO6 was collected from a full-scale coal seam gas water treatment plant, large amount
of calcium was found based on ICP results, suggesting the presence of calcium carbonate.
SEM-EDS analysis has supported the ICP-OES results. SEM images (n=14) showed crystals
deposited on the membrane surfaces (Figure 3-6). EDS elemental analysis (n=18) have
suggested the presence of calcium carbonate (CaCO3) on membrane RO6, as the signals of C
(15±2 % as element weight percentage, wt%) and Ca (24±5 %) are approximatively 2 to 4
times lower than signal of O (60±3 %).
Figure 3-6. SEM image (left) and EDS element weight percentage (right) of RO6 scaling
layer.

34
§ 3.4.4. Hydraulic Performances of RO Membranes
Hydraulic performances of RO membranes were measured in terms of pure water
permeability and salt rejections. No information has been provided on the operation
conditions and hydraulic performances of these RO before fouling, so no correlation between
the degree of fouling and hydraulic performances of RO modules can be made. Baseline
values for the hydraulic performances of RO membrane before cleaning are given in Table
3-5. The effect of different chemical agents on RO membranes was studied by comparing the
hydraulic performances of membrane coupons after chemical cleaning to these baseline
values (section 4.3.3). Hydraulic tests were unable to perform on RO6, as RO6 was very dry
when it was received.
Table 3-5: Hydraulic performances of RO membrane coupons (n=4).
Permeability
(L/m2.h.bar, 25℃)
Rejection
(%)
RO1 4.1±0.2 95.1±1.2
RO2 4.4±0.2 95.7±1.7
RO3 2.3±0.1 98.1±0.7
RO4 3.6±0.2 98.4±0.2
RO5 2.5±0.1 99.0±0.2
RO6 - -
§ 3.5. CONCLUSION
Membrane autopsy was carried out on six fouled RO membranes. In the membrane autopsy,
the biological, organic and inorganic fractions of fouling were determined for each RO
module. It has been concluded that membrane RO1 to RO5 were mainly biofouled, while
RO6 was scale fouled. By comparing the quantities of biomass and total solid in different
fouling matrixes, RO1 to RO3 were considered as heavily fouled and RO4 and RO5 were
moderately fouled.
The FISH analysis revealed that more than 60% of RO1 and RO5 microbial communities
have been represented by the major proteobacteria (alpha, beta and gamma) and archaea.
Additional FISH probes are required to fully demonstrate the microbial communities formed
on the RO membranes.

35
Although the hydraulic performances were no comparable between the RO modules, the
performances can be used as baseline for the cleaning tests. The results obtained in
membrane autopsy can also be the baseline of fouling characterisation. The effects of
cleaning solutions on foulants and membranes would then be revealed by comparing to these
baseline conditions.

36
4. RO MEMBRANE CLEANING USING FNA
§ 4.1. INTRODUCTION
The cleaning effect of free nitrous acid (FNA) on biological fouled RO membranes has been
studied at lab-scale in static conditions. The static cleaning test results showed a stronger
biocidal effect of FNA than the conventional cleaning sodium hydroxide (NaOH) on
microorganisms on fouled RO membrane [106]. However, the inactivation of FNA on RO
biofilm was not as efficient as its effect on sewer biofilm. It has been reported that 0.2 mg
HNO2-N/L FNA can achieve approximately 80-90% inactivation in sewer biofilm, and the
addition of 30 mg/L H2O2 to the FNA solution could further enhance its inactivation to 99%
[15]. To improve FNA cleaning efficiency on RO biofilm, dynamic cleaning tests with cross-
flow were carried out in this study. Hence, the main objective of the cleaning experiments is
to investigate and demonstrate the effectiveness of FNA for RO membrane biofouling control.
In the dynamic cleaning tests, the efficiency of FNA alone or in combination with hydrogen
peroxide (H2O2) was assessed along with the commercial cleaning agent NaOH. The analyses
focussed on the biomass residual on the membrane surfaces and potential recovery of
membrane performance in terms of permeability and salt rejection. The remaining biofilm
(biofouling residual) on membranes were analysed with previously used autopsy-based
methods. The quantities of biofouling residual were used to compare the cleaning efficiency
of FNA and the other cleaning solutions.
In addition, as an acid, it is anticipated that FNA will also be able to remove inorganics
fouling or scaling on the membrane surface. The effectiveness of FNA for RO membrane
scaling control was also tested. The cleaning procedures developed for biofouling control
were applied for the descaling cleaning tests. The descaling efficiency of FNA cleaning
solutions adjusted pH at 2 and 3 were compared with the conventional acidic cleaning
solutions such as hydrochloric acid and citric acid. Elemental analyses, ICP-OES and SEM-
EDS, were used to evaluate the descaling efficiency of FNA and the other acidic cleaning
solutions.
Results reported in this chapter formed part of the following submitted paper
E. Filloux, J.Wang, M. Pidou, W. Gernjak, Z. Yuan. 2015. Biofouling and scaling control of
reverse osmosis membrane using one-step cleaning - potential of acidified nitrite solution as
an agent.

37
§ 4.2. MATERIALS AND METHODS
§ 4.2.1. Cleaning Set-Up and Operation
Cleaning trials were carried out at lab-scale under dynamic (with cross-flow recirculation)
conditions. Five cleaning cells made of Perspex were operated in parallel with cross-flow,
without permeate production, as they were designed to simulate the configuration of RO
filtration system only (Figure 4-1). In a test, membrane coupons (150 cm2 of membrane active
surface) cut out from a fouled membrane and the respective feed spacers were placed in the
cleaning cells. All cleaning cells were connected to the same pump (Cole Parmer, Masterflex
L/S economy drive pump), this pump was assembled with five pump heads allowing cleaning
cells to run in parallel with similar flows. In order to simulate industry cleaning practice, a
cross flow velocity of 0.1 m/s was applied for the cleaning trials [142]. To conduct a cleaning
test, the following operational procedure was applied:
Tap water was pumped through the cell for 2 hours to remove the loose, external
biofilm layer that is removable using shear force. The external layer of the marine
biofilm on RO5 could further be affected by tap water due to osmotic shock.
A cleaning solution (to be described in section § 4.2.2) was pumped through the cell
for 22 hours;
Tap water was pumped through for 15 minutes to remove chemicals.
Figure 4-1. The cleaning cell (left), and the entire cleaning system with five cleaning cells in
parallel, fed with a single peristaltic pump with five pump heads.
§ 4.2.2. Design of Cleaning Tests
Based on the preliminary results of static cleaning tests (data not shown), the nitrite
concentration used in the dynamic tests was 50 mgNO2--N/L. Sodium nitrite (≤99%, Sigma

38
Aldrich) and hydrochloric acid, HCl (32%, Univar) were used to prepare the FNA solution at
different pH level. The concentration of FNA is related to the total nitrite concentration, the
pH and the temperature, and is calculated based on the following equation which is extracted
from [97]: FNA = NO2--N / (Ka x 10
pH), where Ka is the ionization constant of the nitrous
acid (Ka=e-2300/(T+273)) and T is the temperature (°C). In this study, the FNA
concentration was varied by adjusting the pH level of cleaning solutions. FNA cleaning
solutions at concentrations of 47, 35 and 10 mg HNO2-N/L were prepared by acidifying the
nitrite solution (50 mgNO2--N/L) to pH 2, 3 and 4, respectively (T=20
oC). The cleaning
efficiency of FNA was compared with that of sodium hydroxide solution (NaOH, Univar) at
pH 11 and deionised (DI) water, as controls. Although DOW and LENNTECH (RO
membrane manufacturers) indicate that caustic solutions at pH level higher than pH 11 are
more effective at biofouling cleaning, it is generally not recommended to use such harsh
cleaning solutions since NaOH at pH 11.5 can shorten the membrane life due to hydrolysis
[116, 143]. Hence, NaOH at pH 11 was selected to be the control solution in this study.
Table 4-1: Design of the biofouling control tests.
Cell #1 Cell #2 Cell #3 Cell #4 Cell #5
RO1
Test 1
Test 2
Test 3
47 mgFNA-N/L,
pH 2.0
35 mgFNA-N/L,
pH 3.0
10 mgFNA-N/L,
pH 4.0
NaOH,
pH 11.0
DI
water
RO2
Test 4 35 mgFNA-N/L,
pH 3.0
NaOH,
pH 11.0
DI
water
Test 5 35 mgFNA-N/L,
pH 3.0
35 mgFNA-N/L,
pH 3.0;
50 mg/L H2O2
35 mgFNA-N/L,
pH 3.0;
150 mg/L H2O2
NaOH,
pH 11.0
DI
water
RO3 Test 6
Test 7
35 mgFNA-N/L,
pH 3.0 50 mg/L H2O2
35 mgFNA-N/L,
pH 3.0;
50 mg/L H2O2
NaOH,
pH 11.0
DI
water
RO4
Test 8 47 mgFNA-N/L,
pH 2.0
35 mgFNA-N/L,
pH 3.0
10 mgFNA-N/L,
pH 4.0
NaOH,
pH 11.0
DI
water
Test 9 35 mgFNA-N/L,
pH 3.0
NaOH,
pH 11.0
Test 10 35 mgFNA-N/L,
pH 3.0 50 mg/L H2O2
35 mgFNA-N/L,
pH 3.0;
50 mg/L H2O2
NaOH,
pH 11.0
DI
water
RO5 Test 11
Test 12
47 mgFNA-N/L,
pH 2.0
35 mgFNA-N/L,
pH 3.0
10 mgFNA-N/L,
pH 4.0
NaOH,
pH 11.0
DI
water

39
The replication of the cleaning tests (cleaning solutions) was summarised in the following
table.
Table 4-2: The repetition of the cleaning tests
Cleaning
Solutions
47
mgFNA
-N/L,
pH 2.0
35
mgFNA
-N/L,
pH 3.0
10
mgFNA
-N/L,
pH 4.0
35
mgFNA
-N/L,
pH 3.0;
50 mg/L
H2O2
35
mgFNA-
N/L, pH
3.0;
150
mg/L
H2O2
50 mg/L
H2O2
NaOH,
pH 11.0
DI
water
RO1 n=3 n=3 n=3 n=3 n=3
RO2 n=2 n=1 n=1 n=2 n=2
RO3 n=2 n=2 n=2 n=2 n=2
RO4 n=1 n=3 n=1 n=1 n=1 n=3 n=3
RO5 n=2 n=2 n=2 n=2 n=2
Based on membrane autopsy results, the fouling layer of RO6 was mainly composed of
calcium carbonate. Therefore, the efficiency of acidified nitrous solutions (50 mgNO2--N/L,
pH 2.0, 3.0) for scaling removal was compared with these two standard cleaning solutions,
i.e., HCl (pH 2.0, 3.0), citric acid (pH 2.0, .3.0, 99.5%, Chem supply). Along with these
cleaning agents, DI water and 10 v/v % of nitric acid (HNO3, pH 0.5, Univar) were applied as
additional controls. It is reasonable to assume that CaCO3 scaling would be completely
removed from the membrane by HNO3 at this extreme pH level. Design of the descaling tests
is given in Table 4-3.
Table 4-3: Design of the descaling tests with RO6.
Cell #1 Cell #2 Cell #3 Cell #4 Cell #5
Test 1 47mgFNA-N/L;
Citric acid pH 2.0
47 mgFNA-N/L;
HCl pH 2.0
Citric acid
pH 2.0
HCl pH 2.0 DI water
Test 2 35 mgFNA-N/L;
Citric acid pH 3.0
35 mgFNA-N/L;
HCl pH 3.0
Citric acid
pH 3.0
HCl pH 3.0 10 v/v%
HNO3
Test 3 47 mgFNA-N/L;
Citric acid pH 2.0
47 mgFNA-N/L;
HCl pH 2.0
Citric acid
pH 2.0
HCl pH 2.0 DI water
Test 4 35 mgFNA-N/L;
Citric acid pH 3.0
35 mgFNA-N/L;
HCl pH 3.0
Citric acid
pH 3.0
HCl pH 3.0 10 v/v%
HNO3

40
§ 4.2.3. Post-Cleaning Analyses
§ 4.2.3.1. Post-cleaning analysis for biofouling cleaning tests
The characteristics of the biofouling layer after different cleaning tests were determined using
following methods. Samples preparation and methodology for each analysis were given in
Chapter 3. The method of live/dead cells is described in the following section.
Biomass (ATP) measurement (section 3.3.1.1)
Live/dead cells staining method (section 4.2.3.1)
FISH analysis (section 3.3.1.2)
Protein and polysaccharides measurement (section 3.3.2.2 and 3.3.2.3)
Hydraulic performances of RO membranes (section 3.3.4)
Based on the biofouling conditions before cleaning (referring to Chapter 3), the percentage of
biomass residuals and removal percentage of protein and polysaccharides under the impact of
different cleaning agents were obtained based on following equations:
Biomass residuals (%) = ATP (pg/cm²) of biofilm after cleaning / ATP (pg/cm²) of biofilm
before cleaning×100
Protein removal (%) = (1-BSA/m2 of biofilm after cleaning / BSA/m
2 of biofilm before
cleaning) ×100
Polysaccharides removal (%) = (1- Glucose/m2 of biofilm after cleaning / Glucose/m
2 of
biofilm before cleaning) ×100
From the FISH analysis, the distribution and relative abundance of major groups of
proteobacteria (Alpha-, and Beta-proteobacteria) and archaea were determined and compared
with the biofilm communities before cleaning. The detail procedure and oligonucleotide
probes which were applied for FISH analysis are given in Chapter 3, section 3.3.1.2. The
percentage of each microbe was estimated using relative abundance of the microbe (i.e.
Alphaproteobacteria) over that of total targeted microbes (bacteria + archaea).
Live/dead cell staining
The microbial viability of biofilm was determined using the LIVE/DEAD® BacLight
TM
Bacterial Viability Kits (Molecular Probes, L-7012). The viability kits contains with two
41
nucleic acid stains, the green-fluorescent SYTO-9 labels viable cells, whereas red-fluorescent
Propidium iodide (PI) stains dead cells [14]. 2×2 cm2 membrane coupons (n=5) with in situ
biofilm attachment were cut, and then submerged into 1 ml MilliQ water in the centrifuge
tubes (1 membrane coupon per tube). After mixing 1 uL of each SYTO-9 and PI stains in the
tubes, samples were incubated for 25 mins under dark condition. The stained membranes
were air dried first, then mounted onto a glass slide and observed under the Zeiss 510
Confocal Laser Scanning Microscopy (CLSM) (School of Chemistry and Molecular
Biosciences at UQ). Two excitation/emission wavelengths were used for the two fluorescent
stains: 488 nm/500 nm for SYTO-9 and 510 nm/635 nm for PI. CLSM images (n=15-60)
were randomly taken from each sample. CLSM images were used to demonstrate the
distribution and abundance of live and dead cells in the biofilm before and after the cleaning
tests. DAIME (Center for Organismal Systems Biology, Austria) was applied to estimate the
relative abundance of live and dead cells by counting green and red pixels respectively. The
proportion of viable cell was obtained using relative abundance of viable cells (green pixels)
over that of total cells (red + green pixels).
§ 4.2.3.2. Post-cleaning analysis for descaling tests
From membrane autopsy, the concentration (21.7±3.8 gCa/m2) of calcium carbonate scale
was determined. Given the size of membrane used in the cleaning tests, the concentration of
calcium carbonate scale that was removed can be estimated by measuring the calcium
contents in the cleaning solutions via ICP-OES. The descaling efficiency of different cleaning
solutions can be determined by comparing the calcium contents in the cleaning solution with
membrane autopsy result. SEM-EDS analysis was also performed on the membrane coupons
and its results can be used to justify the ICP-OES results. The characteristics of the biofouling
layer after different cleaning tests were determined using following methods. Samples
preparation and methodology for following elementary analyses are given in Chapter 3.
ICP-OES (section 3.3.3.1)
SEM-EDS (section 3.3.3.2)
42
§ 4.3. RESULTS AND DISCUSSION
§ 4.3.1. Effects of FNA Cleaning on RO Biofouling under Cross-Flow
Conditions
§ 4.3.1.1. Effects of FNA cleaning on active biomass (ATP)
ATP was used to quantify the biomass contents within biofouling layers after cleaning tests.
Figure 4-2 shows the biomass residual in percentage of the pre-cleaning level for five
different fouled RO membranes after the cleaning tests. The percentage of biomass residual
was estimated using ATP measurements after cleaning tests over initial ATP contents of
biofilm, which quantitatively demonstrates biomass residual under impacts of different
cleaning solutions.
For all RO membranes tested in the cleaning tests, the FNA cleaning solutions were more
efficient than conventional cleaning solution, namely NaOH (pH11), for removing biomass.
Acidified nitrite cleaning solutions removed 7-45% more biomass than NaOH for heavily
fouled membranes, RO1-3 (referring to Chapter 3). For moderately fouled membranes, RO4
and RO5 (referring to Chapter 3), 3-5% and 2-3% more biomass were removed by nitrite
cleaning solution at low pH level for RO4 and RO5 respectively. Although the RO2 biofilm
contained the highest biomass load (4234±15423 pgATP/cm2) (referring to Figure 3-3), FNA
solution at pH 3 has achieved the best cleaning efficiency for RO2 among heavily fouled
membranes. Hijnen et al. reported the resistance of biofilm against cleaning varies based on
the structure of biofilm [91]. It is likely that the natural structure of biofilm formed on RO2
has created less resistance to FNA cleaning solution. Hijnen et al.’s theory also applies to
cleaning tests for moderately fouled membranes. The biomass residual results have shown
FNA cleaning was more efficient for moderately fouled membranes, implying that cleaning
efficiency of cleaning agents is influenced by the degree of fouling.
The results showed all cleaning solutions were more efficient for cleaning moderately fouled
membranes than heavily fouled membranes, suggesting cross-flow conditions have created
great effects on the loose biofilm layers. It is likely that cross-flow conditions helped to
facilitate the diffusion of cleaning solutions into biofouling layers, detach bacterial cells and
flushed them away [88]. However, it is evident that biomass removal was not mainly caused
by hydrodynamic shear, since removal caused by FNA cleaning solutions is significantly

43
higher compared to removal with DI water only. The results have suggested that applying
cross-flow enhances the cleaning efficiency of FNA.
Figure 4-2 (a) also demonstrated the effect of pH level on the cleaning efficiency of nitrite
cleaning solutions. For heavily fouled membrane RO1, the best cleaning efficiency of nitrite
cleaning solutions is observed at pH 3. Based on the three cleaning tests, more than 86% of
biomass was removed by nitrite cleaning solutions at pH 3. The concentration of FNA is
inversely correlated to the pH level of nitrite solutions. The results have proved higher FNA
concentration at pH 3 has resulted in better cleaning efficiency. However, there was no
obvious further improvement to biomass removal for nitrite solutions at pH 2, likely due to
the loss of nitrite concentration induced by the conversion of nitrite to nitrate [106]. Hence,
50 mg NO2-N/L at pH 3.0 as optimum conditions were used to clean RO2 and RO3.
For moderately fouled membranes, there was no obvious difference between the cleaning
efficiency of nitrite cleaning solutions at different pH levels. The results have suggested that
lower concentration of nitrite can be applied to clean moderately fouled membranes.

44
a.
b.
Figure 4-2. Biomass residual after 24 hours cleaning tests performed in cross-flow conditions
with the membranes (a) heavily fouled RO1, RO2 and RO3, and (b) moderately fouled RO4 and
RO5. The cross-flow velocity applied was 0.1 m/s. The error bars show the standard errors of
three replicate experiments. The results without error bars are based on three measurements from
each experiment.

45
§ 4.3.1.2. Influence of FNA on viability of biomass
The biocidal effect of FNA has already been demonstrated on anaerobic sewer biofilm and waste
activated sludge applications [14, 144]. Thus, it is anticipated FNA would affect biofilm formed
on RO membranes in a similar way. The potential inhibition of FNA was assessed by measuring
live and dead bacterial cells after cleaning tests. The CLSM image analysis was carried out
directly on biofilm on the RO membranes. Due to the density and thickness of the biofilm on the
heavily fouled membranes (RO1 to RO3), it was difficult to reveal the accurate quantification of
live and dead cells. CLSM imaging could not give quantitative results due to the density of
biofilm changing from location to location on the membrane [138]. Therefore, live and dead
analysis did not appear to be applicable to heavily fouled biofilm.
In situ CLSM observation and image analysis could be performed on the moderately fouled
membranes (RO4&5) due to lower biofilm density. The CLSM images of RO4&5 before and
after cleaning are given in Appendix Figures C-1 and C-2. Comparing to the biomass before
cleaning, 13-39% and 22-54% of viable cells were inactivated and removed by chemical
cleaning solutions for RO4 and RO5, respectively (Figure 4-3). The trends of viable cell revealed
the best inactivation effect of nitrite cleaning solutions is at pH 3 for RO4, and there was no
distinct difference between the inactivation effects of nitrite cleaning solutions at different pH
levels on RO5 biofilm.
In accordance with the biomass residual measured as ATP, the inactivation efficiency of FNA is
better than NaOH (pH 11). 32±5% of total cells remained activated in the biofilm on RO4 under
the impact of FNA at pH 3, which is 26% less than that under impact of NaOH. For RO5, the
biofilm contained only 6-7% of viable cells after cleaning with nitrite solutions, whereas 38±4%
of viable cells remained in the biofilm which was cleaned by NaOH. CLSM images (n=15-45)
also explain the more superior inactivation effect of FNA solutions on RO5 biofilms in
comparison to that on RO4. CLSM images revealed that the biofilm formed on RO4 was denser
than biofilm on RO5. It appears the denser biofilm on RO4 creates resistance to the
hydrodynamic flow, which then reduces the interaction between cleaning chemicals and biofilm,
hence hinders the cleaning efficiency. The results of live/dead cells staining confirm that the
bactericidal efficiency of FNA on bacteria formed on RO membranes. The results additionally

46
demonstrated FNA is more efficient than NaOH in killing bacteria.
Figure 4-3. Proportion of viable cells in membrane biofilm before and after 24 hours cleaning
tests for membranes RO4 and RO5. A cross-flow velocity of 0.1 m/s was applied. The error bars
show the standard errors of 15 to 60 CLSM images.
§ 4.3.1.3. Biofilm community structure changes after FNA cleaning
The selected FISH probes have revealed that more than 60% of biofilm communities on RO1
and RO5 were Alphaproteobacteria, Betaproteobacteria, Gammaproteobacteria and archaea, so
the impacts of FNA on these microbes were further investigated using the same probes. The
relative quantity of each detected bacterium was determined by DAIME based on FISH images,
which is given in the appendix (Appendix Table B-2).
FISH results showed that the total amount of detected bacteria has been dropped after the
cleaning tests. Figure 4-4 (a) and (b) show targeted bacteria in the biofilm of RO1 decreased 70%
after FNA cleaning at its optimal condition (pH 3). Figure 4-4 (b) and (d) indicate that 38% of
total detected bacteria of RO5 biofilm were removed under the same treatment. This result also
revealed that the microbe communities of RO1 were more susceptible to the impact of FNA
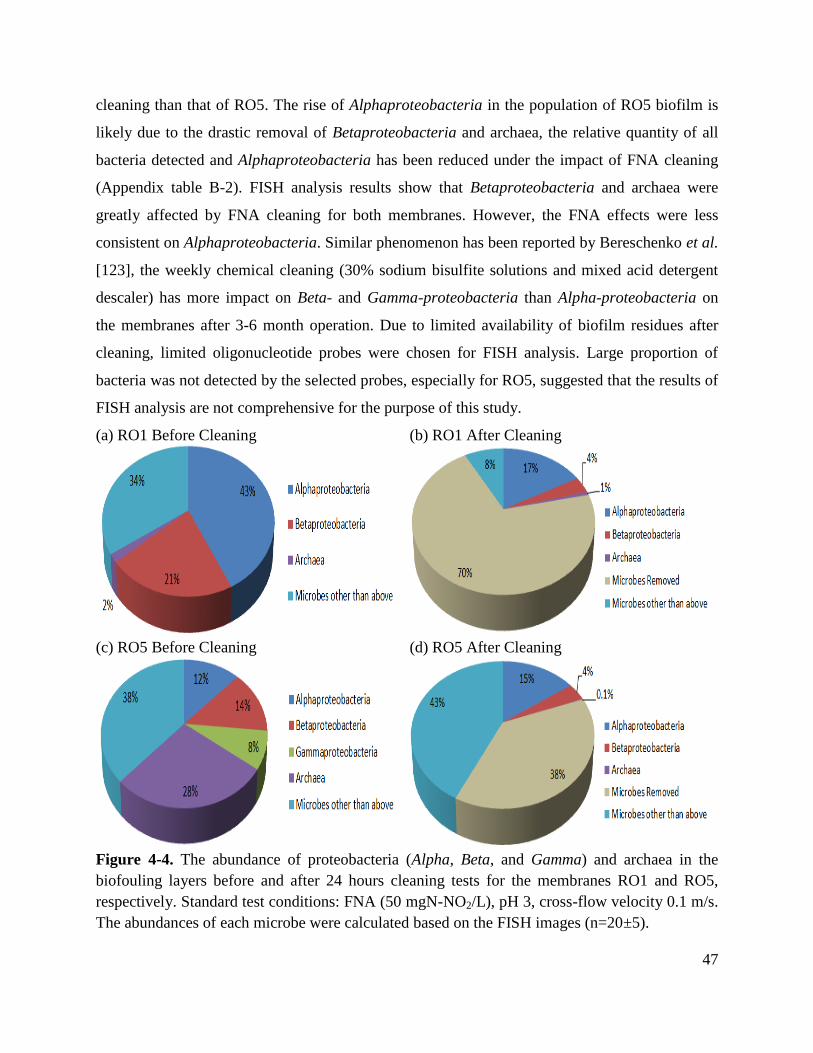
47
cleaning than that of RO5. The rise of Alphaproteobacteria in the population of RO5 biofilm is
likely due to the drastic removal of Betaproteobacteria and archaea, the relative quantity of all
bacteria detected and Alphaproteobacteria has been reduced under the impact of FNA cleaning
(Appendix table B-2). FISH analysis results show that Betaproteobacteria and archaea were
greatly affected by FNA cleaning for both membranes. However, the FNA effects were less
consistent on Alphaproteobacteria. Similar phenomenon has been reported by Bereschenko et al.
[123], the weekly chemical cleaning (30% sodium bisulfite solutions and mixed acid detergent
descaler) has more impact on Beta- and Gamma-proteobacteria than Alpha-proteobacteria on
the membranes after 3-6 month operation. Due to limited availability of biofilm residues after
cleaning, limited oligonucleotide probes were chosen for FISH analysis. Large proportion of
bacteria was not detected by the selected probes, especially for RO5, suggested that the results of
FISH analysis are not comprehensive for the purpose of this study.
(a) RO1 Before Cleaning
(b) RO1 After Cleaning
(c) RO5 Before Cleaning
(d) RO5 After Cleaning
Figure 4-4. The abundance of proteobacteria (Alpha, Beta, and Gamma) and archaea in the
biofouling layers before and after 24 hours cleaning tests for the membranes RO1 and RO5,
respectively. Standard test conditions: FNA (50 mgN-NO2/L), pH 3, cross-flow velocity 0.1 m/s.
The abundances of each microbe were calculated based on the FISH images (n=20±5).

48
§ 4.3.1.4. Effect of FNA on protein and polysaccharide removal
In addition to biomass analyses, the impact of FNA and other cleaning solutions on the removal
of the organic constituents of biofilm was studied for moderately fouled membranes (RO4&5).
This impact was reflected by evaluating the removal of proteins and polysaccharides by the
cleaning. By comparing the average removal efficiency of proteins and polysaccharides achieved
by the FNA cleaning solutions with that by NaOH (Table 4-4), FNA cleaning solutions have
shown similar or better efficiency for proteins and polysaccharides removal. The removal of
proteins and polysaccharides was likely due to the interaction between FNA or its reactive
nitrogen species (RNS) and biofilm, as FNA is able to damage chemical bond and structure of
EPS in waste activated sludge [18]. Based on results obtained from all analyses, FNA can be a
substitute cleaning chemical for NaOH.
Table 4-4: Comparison of FNA and NaOH cleaning effects on proteins and polysaccharides.
Cleaning Agents FNA NaOH
Membrane # RO4 RO5 RO4 RO5
Protein removal rate (%) 93.1±3.4 67.1±2.5 60.3±14.9 59.16±0.0
Polysaccharides removal rate (%) 72.9±2.0 86.5±1.8 61.7±7.5 79.36±0.0
The deviation ranges show the standard errors of the FNA cleaning solutions (at pH 2.0, 3.0 and 4.0)
The comparison of the effects of all cleaning solutions on biomass, protein and polysaccharides
is given in Figure 4-5. Figure 4-5 (b) shows the removal rate for biomass and polysaccharides
and proteins presented a similar trend. However, FNA cleaning solution was still more efficient
on biomass removal (94-95%) than on protein and polysaccharides removal, respectively (Table
4-4). Many studies have reported that bacteria are more susceptible than EPS to the cleaning
chemicals, in which polysaccharides and proteins have been used as proxy of EPS [91, 123, 138].
Hijnen et al. and Bereschenko et al. [91, 123] revealed that the biofilm matrix consisting of
polysaccharides and proteins creates greater resistance to the cleaning attack, though the bacteria
cells are removed during the cleaning processes.

49
a.
b.
Figure 4-5. Biomass removal (%, based on ATP values), protein and polysaccharide removal
(%) after 24 hours cleaning tests for the membranes (a) RO4 and (b) RO5. A cross-flow
velocity 0.1 m/s was applied. The error bars in the plot show the standard errors of 2-3
replicate experiments.

50
§ 4.3.1.5. Synergistic cleaning effects of FNA and H2O2 on RO membrane biofouling
Jiang et al. reported adding H2O2 can enhance the biocidal efficiency of FNA by 43-51%
compared with FNA alone [15]. Hence, the synergistic cleaning effects of FNA and H2O2 on RO
biofouling were studied and compared with effects of FNA and H2O2 individually, as shown in
Figure 4-6. For both heavily fouled RO2 and moderately fouled RO4, minimal enhancement
(less than 1%) was obtained after adding H2O2 to FNA. Increasing the concentration of H2O2 to
150 mg/L showed no improvement in cleaning for RO2. However, FNA and FNA/H2O2 are still
more efficient than NaOH on biomass (ATP) removal for all three RO membranes. Given that
the cleaning efficiency of H2O2 alone is lower than FNA or the combination of FNA and H2O2,
this implies that FNA is still the main cleaning agent for the biofouling removal.
Figure 4-6. Biomass removal after 24 hours cleaning tests for the membranes heavily fouled
RO2 and RO3 and moderately fouled RO4. A cross-flow velocity 0.1 m/s was applied. The error
bars show the standard errors of three replicate experiments. The results without error bars are
based on three measurements from each experiment.

51
§ 4.3.2. Descaling Efficiency of FNA
Since the FNA cleaning solutions are formed by combining nitrite with acid, it is expected that
FNA cleaning solutions would act like acid to remove scaling from membrane surfaces. The
same cleaning procedures used for biofouling were carried out to remove scaling from RO
membrane (RO6). After 24 hour cleaning tests, the descaling efficacy of FNA and the other
cleaning solutions (as controls) were assessed by evaluating the dissolved inorganic elements in
the cleaning solutions. Figure 4-7 presents the dissolved calcium content based on ICP-OES
results. 28.5±4.6 to 34.3±1.4 g/cm2 calcium was removed by all acidic solutions, which suggests
that all cleaning solutions are efficient at calcium scaling removal. The results suggested that
nitrite has no influence on the descaling efficiency of acidic solutions, since the descaling
efficient of FNA at pH 2 and 3 (either adjusted by HCl or citric acid) was similar to conventional
descaling agents (HCl and citric acid). In accordance to the cleaning tests for biofouling removal,
it was proven again that hydrodynamic shear is beneficial for the cleaning tests as it improves the
solubility of the fouling layer. HNO3 (10 v/v % at pH 0.5) the control cleaning solution
successfully removed 32.4±1.7 g/cm2 versus the autopsy results 21.7±3.8 g/cm
2. The calcium
removal rate is higher in cross-flow conditions. However, scaling removal was not mainly
caused by hydrodynamic shear, since only 4.4±0.1 g/cm2 of calcium was removed from the
membrane surface by water washing.

52
Figure 4-7. Dissolved calcium content removed from the membrane surface after 24 hours
cleaning tests with membrane RO6. A cross-flow velocity 0.1 m/s was applied in all tests. The
error bars show the standard errors of four measurements from two replicate experiments.
In addition, SEM-EDS analyses were conducted on the membrane after cleaning for nitric acid
and all cleaning solutions at pH 3, which is also the optimal pH level selected for biofouling
removal. SEM images and element distribution (wt%) are available in the appendix (Appendix
Figures D-1 and D-2). In agreement with the ICP-OES results (Figure 4-7), the SEM-EDS results
revealed that the calcium contents of scaling layers reduced from 24% to 1% under impacts of all
cleaning solutions adjusting pH to 3, implying that calcium carbonate scaling has been
effectively removed. This result is supported by SEM images of calcium carbonate scaled RO
membrane before and after cleaning. SEM images revealed that the crystal structure of calcium
carbonate scaling was removed by all cleaning solutions at pH 3. Overall, the results of the
cleaning tests for biofouling and scaling removal suggested that FNA can be used as a single
cleaning agent for both biofouling and scaling removal.

53
§ 4.3.3. Hydraulic Performances of RO Membranes after Cleaning
As result of effective cleaning for RO membrane, it is anticipated that permeability would be
improved and salt rejection would be increased. However, based on the filtration results, there
was no significant difference in permeability and salt rejection for all tested RO membranes after
cleaning. According to RO membrane manufacturers, the permeability of RO module is normally
±15–20% of its nominal rate due to membrane manufacturing and experimental error[145]. Since
all permeability changes remained in the range of this deviation (Table 4-5), no conclusive
statement could be made based on the hydraulic results for this study. In addition, fouling is
likely non-uniformly spread out on membranes surface. The small coupons (active area 42 cm2)
used in the filtration trials do not completely represent the full scale RO module. Applying small
coupons would have also caused large variations in performance of the membrane coupons. The
results have suggested that the lab-scale filtration system was not suitable for permeability and
salt rejection tests. It is necessary to study the cleaning impact of FNA on the hydraulic
parameters at larger-scale filtration units.

54
Table 4-5: Hydraulic performances of membranes after cleaning tests.
Membrane #
Membrane autopsy Cleaning Tests
Permeability
(L/m2.h.bar, 25
oC)
Water Rinse
(2hr) Water
NaOH
pH 11
FNA
pH 2
FNA
pH 3
FNA
pH 4
RO1 4.1 1.3
3.7
4.7 2.9
4.8 4.6
RO2 4.3 4.0 3.8 4.7
4.3
4.0 4.2 4.2
3.9
RO3 2.3 2.2 1.9 2.2
2.2
RO4 3. 6
3.6 3.6 3.4 3.7 3.2
4.0
2.7
3.7 2.9
3.7
RO5 2.5 2.8 2.7 2.7 2.8 2.8
2.6 2.6
Rejection (%)
Water Rinse
(2hr) Water
NaOH
pH 11
FNA
pH 2
FNA
pH 3
FNA
pH 4
RO1 95.1 95.9
95.1
95.4 96.5
96.1 95.6
RO2 95.7 95.4 95.5 96.4
97.5
92.0 96.3 95.9
97.6
RO3 98.1 98.6 98.5 98.7
98.2
RO4 98.4
97.3 98.8 99.4 96.3 99.1
99.0
98.0
98.1 98.5
98.3
RO5 99.0 99.2 98.9 99.3 99.4 98.8
98.1 98.7

55
§ 4.4. CONCLUSION
Five biofouled membranes (RO1-5) were used in 12 dynamic cleaning tests in which 0.1 m/L
cross-flow was applied. The cleaning tests have shown that FNA solutions are more efficient at
biofouling cleaning than NaOH (pH 11) and 35 mgFNA-N/L at pH 3.0 is the optimum cleaning
conditions in this study, based on the results of biomass, protein and polysaccharides analysis,
and live/dead cells staining.
The ATP results showed that all nitrite cleaning solutions (pH 2.0, 3.0 and 4.0) removed 7-45%
more biomass than NaOH for heavily fouled membranes, RO1-3 (referring to Chapter 3).
Although the superior cleaning efficiency of nitrite cleaning solutions was not obvious for
moderately fouled membranes (referring to Chapter 3), there were still 3-5% and 2-3% more
biomass removed by nitrite cleaning solutions than NaOH for RO4 and RO5, respectively. This
result suggested that all chemical cleaning solutions are more efficient for cleaning moderately
fouled membranes than heavily fouled membranes, under cross-flow cleaning conditions.
Live/dead cells, protein and polysaccharides measurements were able to be performed on
moderately fouled membranes (RO4&5), due to their less dense biofilm structure. In accordance
to ATP results, live/dead cells staining has revealed that less viable cells remain in biofouling
layers after FNA cleaning at pH 3.0 (32±5% for RO4 and 7±2% for RO5) than NaOH (57±5%
for RO4 and 38±4% for RO5). The removal rate (%) of protein and polysaccharides showed a
similar trend as the results of ATP and CLSM analysis. However, FNA cleaning appeared more
efficient for biomass removal.
FISH analysis has demonstrated that the overall abundances of targeted bacteria on RO1 and
RO5 have been reduced under the impact of FNA cleaning at pH 3.0. The results of FISH
analysis also revealed that Betaproteobacteria and archaea were greatly affected by FNA
cleaning than Alphaproteobacteria.
Although applying FNA alone, or combine FNA and H2O2 have shown better efficient at
biofouling removal than NaOH, the percentage of biomass residual showed combining FNA with
H2O2 was not able to improve the cleaning/removal efficiency of FNA significantly (less than 1%

56
of enhancement).
The scaling cleaning tests revealed that FNA solutions at pH 2.0 and 3.0 were as efficient as
conventional descaling acids based on elemental analyses (ICP-OES and SEM-EDS). The results
of both analyses showed that the scaling layers were effectively cleaned by all acidic cleaning
solutions. Based on the outcomes of biofouling and scaling cleaning tests, FNA has showed its
better at both biofouling and scaling cleaning. Hence, FNA can be a promising cleaning agent to
achieve biofouling and scaling removal at a single stage.
For all cleaning tests, performances of tested membrane coupons were examined in terms of
permeability and salt rejection. No significant difference was observed for all membrane, which
was likely due to the small size of filtration cells used in this study.

57
5. RO BIOFILM PREVENTION USING FNA
§ 5.1. INTRODUCTION
The results obtained in previous chapter suggested that FNA cleaning was more effective for
moderately fouled membranes, suggesting that early cleaning is preferable. Based on this finding,
the application of FNA cleaning for biofouling prevention, rather than for biofouling removal,
was investigated. In this chapter, RO membranes were used for filtrating secondary effluent (SE).
Additional nutrients were introduced to the filtration systems in order to generate fouling. Two
bench-scale crossflow RO filtration units were applied in parallel: one unit was fed with SE only
(the control unit), while the second one was fed with SE and exposed to FNA cleaning (10 mg
FNA-N/L, pH 3) for 6 hours (the experimental unit) on a weekly base.
The permeability and salt rejection of both filtration systems have been continuously monitored
for three weeks. The operational data of filtrations with or without FNA cleanings were used to
reveal the effects of fouling and FNA on the hydraulic performances of RO membranes. After
last FNA cleaning at the end of the filtration experiments, membrane coupons were retrieved
from the filtration units, and foulant analyses such as ATP, protein, polysaccharides
measurements, elemental analysis (ICP-OES) and live/dead staining were carried out on the
fouling material deposited on the membranes. The results of foulant analyses were used to
disclose the effect of FNA on the fouling layers.

58
§ 5.2. MATERIALS AND METHODS
§ 5.2.1. Membranes
Membrane coupons were cut from a polyamide thin-film composite RO membrane, ESPA 2
(Hydranautics, USA) and used for the filtration tests. New RO membranes were compacted with
10 L DI water overnight. The general performances of membranes were characterised in terms of
pure water permeability and salt rejection prior to the filtration tests. 1500 mg/L NaCl salt
solution was used in the salt rejection measurements.
§ 5.2.2. Bench-Scale RO Filtration Units
Two bench-scale crossflow filtration units were operated in parallel to foul the RO membranes.
Both filtration units were made of stainless steel, a schematic diagram of the filtration unit is
presented in Figure 5-1. Within the filtration cell body, the shim, the feed spacer and permeate
spacer were installed to give a 0.86 mm channel height. Since filtration cells have dimensions of
14.6 and 9.5 cm for flow channel length and width respectively, so the active area of membrane
is 139 cm2 and the cross-section flow area is 0.82 cm
2. Base on the cross-section flow area, the
feed flow was kept at 30 L/h to maintain the cross-flow velocity at 0.1 m/s. The active membrane
area was used to estimate permeability based on the Equation 10 given in Chapter 3. The feed
pressure was maintained at 8 bar and was not particularly adjusted to compensate the fouling
during the experiments. The conductivities of the feed and permeate were obtained using a
SevenEasy conductivity meter (Mettler Toledo, USA) for salt rejection measurements (referring
to Equation 11 in Chapter 3). The temperature of feed SE was recorded with an IC9237
thermometer (Synotronics, Australia), and all filtration experiments were carried out at ambient
temperature.
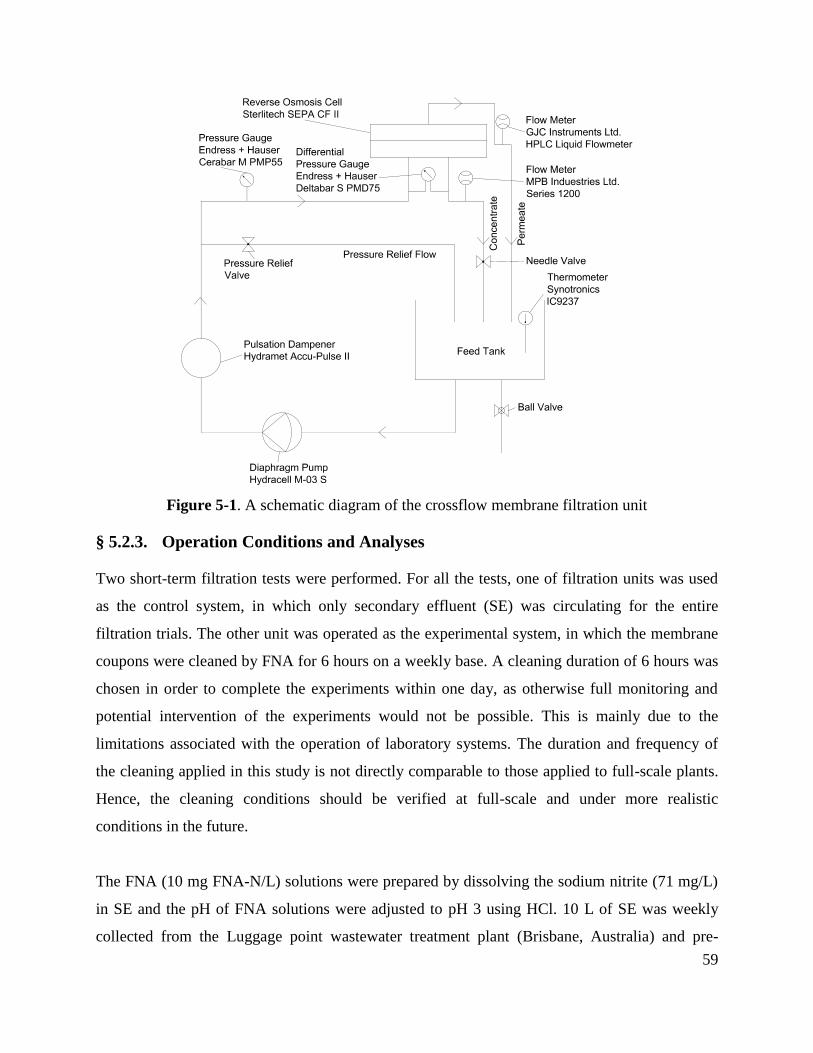
59
Figure 5-1. A schematic diagram of the crossflow membrane filtration unit
§ 5.2.3. Operation Conditions and Analyses
Two short-term filtration tests were performed. For all the tests, one of filtration units was used
as the control system, in which only secondary effluent (SE) was circulating for the entire
filtration trials. The other unit was operated as the experimental system, in which the membrane
coupons were cleaned by FNA for 6 hours on a weekly base. A cleaning duration of 6 hours was
chosen in order to complete the experiments within one day, as otherwise full monitoring and
potential intervention of the experiments would not be possible. This is mainly due to the
limitations associated with the operation of laboratory systems. The duration and frequency of
the cleaning applied in this study is not directly comparable to those applied to full-scale plants.
Hence, the cleaning conditions should be verified at full-scale and under more realistic
conditions in the future.
The FNA (10 mg FNA-N/L) solutions were prepared by dissolving the sodium nitrite (71 mg/L)
in SE and the pH of FNA solutions were adjusted to pH 3 using HCl. 10 L of SE was weekly
collected from the Luggage point wastewater treatment plant (Brisbane, Australia) and pre-

60
filtered through 1.2 µm filters (nylon filter membrane, PM separations, Australia) before to be
used. Synthetic nutrient was added to the feed every second day, in order to speed up the
biofouling process and make the thesis possible within the timeframe available. The composition
of the synthetic nutrient is given in Table 5-1.
Table 5-1: The composition of synthetic nutrient [146].
Substance [Supplier] Concentration
[mg/10 L]
Sodium Acetate (NaCH3CO2) [Chem Supply, Australia] 136
Urea (CH4N2O) 3
Di-Potassium Hydrogen Phosphate (K2HPO4) [Univar, Australia] 2.8
The operation conditions and analyses are given in
Table 5-2. Permeate flow rate of both filtration units, and the conductivity of feed and permeate
were measured on daily base. The permeability and salt rejection of membranes were calculated
based on the Equation 10 and Equation 11 given in Chapter 3.
Table 5-2: The operation conditions of filtration tests and foulant analyses performed after
the filtration tests.
Operating conditions
Filtration Test 1 Filtration Test 2
Control Experiment
(FNA Cleaning) Control
Experiment
(FNA Cleaning)
Period of run (days) 14 21 22 22
Foulant sampling After last FNA cleaning, at end of filtration tests
Foulant analysis ATP analysis, protein and polysaccharides measurements, elemental
analysis (ICP-OES), and live/dead cells staining method
Foulant analyses with replicated samples (n=2-4) were carried out based on the procedures given
in Chapter 3 and 4. CLSM and live/dead staining method were used to reveal the viability of
bacterial cells on the membrane surface at the end of the filtration trials. 35 CLSM images were
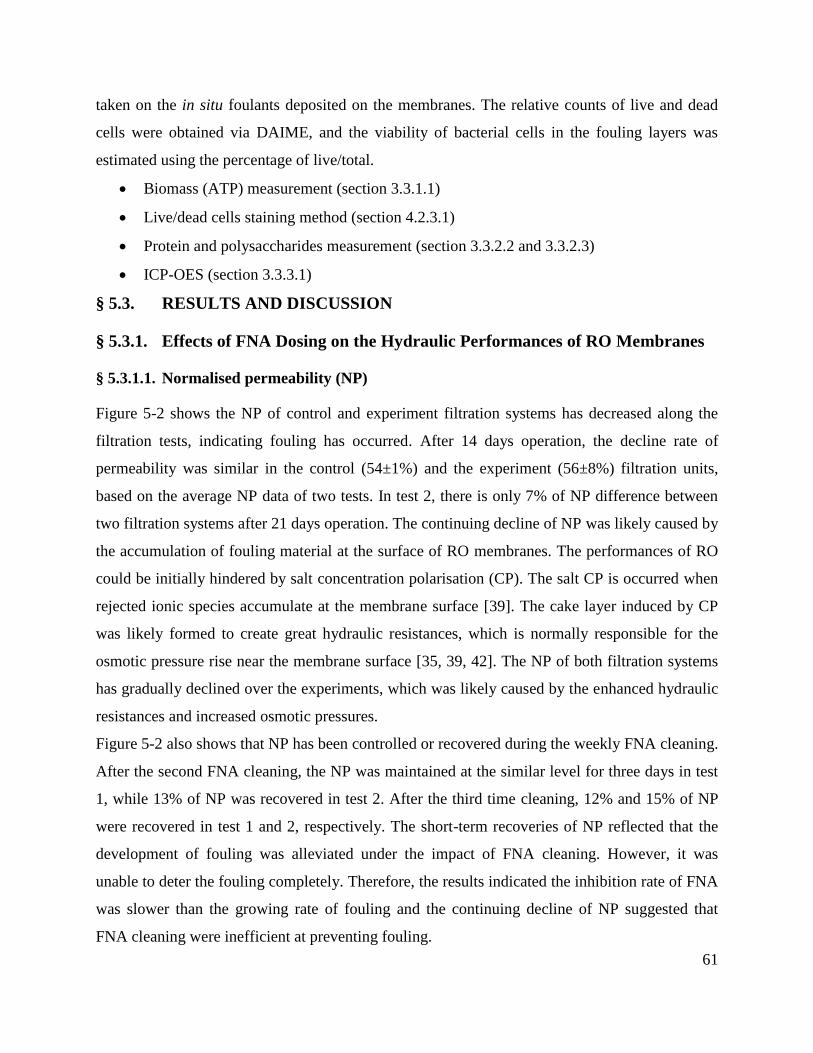
61
taken on the in situ foulants deposited on the membranes. The relative counts of live and dead
cells were obtained via DAIME, and the viability of bacterial cells in the fouling layers was
estimated using the percentage of live/total.
Biomass (ATP) measurement (section 3.3.1.1)
Live/dead cells staining method (section 4.2.3.1)
Protein and polysaccharides measurement (section 3.3.2.2 and 3.3.2.3)
ICP-OES (section 3.3.3.1)
§ 5.3. RESULTS AND DISCUSSION
§ 5.3.1. Effects of FNA Dosing on the Hydraulic Performances of RO Membranes
§ 5.3.1.1. Normalised permeability (NP)
Figure 5-2 shows the NP of control and experiment filtration systems has decreased along the
filtration tests, indicating fouling has occurred. After 14 days operation, the decline rate of
permeability was similar in the control (54±1%) and the experiment (56±8%) filtration units,
based on the average NP data of two tests. In test 2, there is only 7% of NP difference between
two filtration systems after 21 days operation. The continuing decline of NP was likely caused by
the accumulation of fouling material at the surface of RO membranes. The performances of RO
could be initially hindered by salt concentration polarisation (CP). The salt CP is occurred when
rejected ionic species accumulate at the membrane surface [39]. The cake layer induced by CP
was likely formed to create great hydraulic resistances, which is normally responsible for the
osmotic pressure rise near the membrane surface [35, 39, 42]. The NP of both filtration systems
has gradually declined over the experiments, which was likely caused by the enhanced hydraulic
resistances and increased osmotic pressures.
Figure 5-2 also shows that NP has been controlled or recovered during the weekly FNA cleaning.
After the second FNA cleaning, the NP was maintained at the similar level for three days in test
1, while 13% of NP was recovered in test 2. After the third time cleaning, 12% and 15% of NP
were recovered in test 1 and 2, respectively. The short-term recoveries of NP reflected that the
development of fouling was alleviated under the impact of FNA cleaning. However, it was
unable to deter the fouling completely. Therefore, the results indicated the inhibition rate of FNA
was slower than the growing rate of fouling and the continuing decline of NP suggested that
FNA cleaning were inefficient at preventing fouling.

62
a.
b.
Figure 5-2. Normalised permeability (Kw/Kw0) of filtration test 1 (a) and test 2 (b). Standard
test conditions: SE was circulating at 0.1 m/s in both filtration systems. For the experiment
filtration, the data points highlighted in red represent that the membrane was cleaned by FNA
(10 mg-N/L) at pH 3 for 6 hours on these specific. The scatter points are based on two
measurements from each experiment on each day.
0.0
0.1
0.2
0.3
0.4
0.5
0.6
0.7
0.8
0.9
1.0
1.1
20
15
/3/1
1
20
15
/3/1
2
20
15
/3/1
3
20
15
/3/1
4
20
15
/3/1
5
20
15
/3/1
6
20
15
/3/1
7
20
15
/3/1
8
20
15
/3/1
9
20
15
/3/2
0
20
15
/3/2
1
20
15
/3/2
2
20
15
/3/2
3
20
15
/3/2
4
20
15
/3/2
5
20
15
/3/2
6
20
15
/3/2
7
20
15
/3/2
8
20
15
/3/2
9
20
15
/3/3
0
20
15
/3/3
1
No
rmal
ise
d P
erm
eab
ility
Kw
/Kw
0
Test 1 Control Filtration
Test 1 Experiment Filtration with Weekly FNA Cleaning
0.0
0.1
0.2
0.3
0.4
0.5
0.6
0.7
0.8
0.9
1.0
1.1
20
15
/4/1
20
15
/4/2
20
15
/4/3
20
15
/4/4
20
15
/4/5
20
15
/4/6
20
15
/4/7
20
15
/4/8
20
15
/4/9
20
15
/4/1
0
20
15
/4/1
1
20
15
/4/1
2
20
15
/4/1
3
20
15
/4/1
4
20
15
/4/1
5
20
15
/4/1
6
20
15
/4/1
7
20
15
/4/1
8
20
15
/4/1
9
20
15
/4/2
0
20
15
/4/2
1
20
15
/4/2
2
No
rmal
ise
d P
erm
eab
ility
Kw
/Kw
0
Test 2 Control Filtration
Test 2 Experiment Filtration with Weekly FNA Cleaning

63
§ 5.3.1.2. Salt rejection
Figure 5-3 presents the salt rejection data of both filtration systems. In accordance with the NP
plots, salt rejection of all RO membranes used in filtration tests has also gradually decreased
along the filtration tests, suggesting membranes were fouled. In test 2, the salt rejection of RO
membranes from control systems dropped from 98% to 95%, whereas the RO membranes
exposed to FNA cleanings had less than 2% decline in salt rejection. The decline of salt rejection
was likely caused by the same fouling mechanisms which lead to the decline of NP. Studies have
reported that concentration polarisation (CP) raises the salt passage across RO membranes and
cake layers also enhance the passage of salt solutes [31, 39, 42]. It is noteworthy that the salt
rejection trend obtained in the experiment is not in accordance to that observed in real practice.
In practice, the feed pressure is increased to compensate the fouling in order to ensure the
productivity of RO membranes. Water molecules are pushed through the membrane at a faster
rate than the salts under such circumstance. As a consequence, the salt rejection increases as
fouling progresses. In contrast, the feed pressure was maintained at the same level throughout the
experiments in this study. That explains why the salt rejection trend observed in this study is
different to what observed at real plants. As mentioned before, the cleaning condition applied in
this study is not directly comparable to those applied to full-scale plants. Hence, the cleaning
conditions should be verified under more realistic conditions at full-scale.
In Figure 5-3, it appeared that FNA cleanings have applied a short-term reversible effect on RO
membranes. During FNA cleaning, the salt rejection of RO membranes dropped 7 to 11%
compared to the rejection data before FNA cleaning (unfilled data points in Figure 5-3), which
quickly came back after switching the FNA solution back to SE in both tests. Since the FNA
cleaning solutions were prepared by new SE, the sharp drops of salt rejection were likely due to
the sudden salinity changes of the feed water [147, 148].

64
a.
b. Figure 5-3. Salt rejection of the filtration test 1 (a) and test 2 (b). Standard test conditions: SE was
circulating at 0.1 m/s in both filtration systems. For the experiment filtration, the data points highlighted in
red represent that the membrane was cleaned by FNA (10 mg-N/L) at pH 3 for 6 hours on these specific
dates. The scatter points are based on two measurements from each experiment on each day.
80%
82%
84%
86%
88%
90%
92%
94%
96%
98%
100%
20
15
/3/1
1
20
15
/3/1
2
20
15
/3/1
3
20
15
/3/1
4
20
15
/3/1
5
20
15
/3/1
6
20
15
/3/1
7
20
15
/3/1
8
20
15
/3/1
9
20
15
/3/2
0
20
15
/3/2
1
20
15
/3/2
2
20
15
/3/2
3
20
15
/3/2
4
20
15
/3/2
5
20
15
/3/2
6
20
15
/3/2
7
20
15
/3/2
8
20
15
/3/2
9
20
15
/3/3
0
20
15
/3/3
1
Salt
Rej
ecti
on
(%
)
Test 1 Control Filtration
Test 1 Experiment Filtration with Weekly FNA Cleaning
Test 1 Salt Rejection Data before Weekly FNA Cleaning
80%
82%
84%
86%
88%
90%
92%
94%
96%
98%
100%
20
15
/4/1
20
15
/4/2
20
15
/4/3
20
15
/4/4
20
15
/4/5
20
15
/4/6
20
15
/4/7
20
15
/4/8
20
15
/4/9
20
15
/4/1
0
20
15
/4/1
1
20
15
/4/1
2
20
15
/4/1
3
20
15
/4/1
4
20
15
/4/1
5
20
15
/4/1
6
20
15
/4/1
7
20
15
/4/1
8
20
15
/4/1
9
20
15
/4/2
0
20
15
/4/2
1
20
15
/4/2
2
Salt
Rej
ecti
on
(%
)
Test 2 Control Filtration
Test 2 Experiment Filtration with Weekly FNA Cleaning
Test 2 Salt Rejection Data before Weekly FNA Cleaning

65
§ 5.3.2. EFFECT OF FNA ON THE MEMBRANE FOULING LAYER
After the last FNA cleaning in test 2, fouling deposits were collected from membrane coupons
and undergone foulant analyses. Table 5-3 presents the biomass contents, the percentage of
viable cells, and the concentration of proteins, polysaccharides and metal ions in the fouling
layers formed on the RO membranes. The results showed that all fouling layers were composed
of microorganisms, organic (such as proteins and polysaccharides) and inorganic materials.
However, total metal deposits were less than 1 g/m2 in all fouling layers, suggesting that there
were mainly biological and organic foulants deposited on the RO membrane. All fouling layers
contained more than 1000 pgATP/cm2, implying biomass contents were high in both filtration
units [149]. Table 5-3 also indicates the percentage of viable cells from experiment filtration was
four times higher than that from control filtration unit. Moreover, in accordance to the biomass
measurement (ATP), the relative count of total cells after exposing to FNA cleaning was less
than half of that from the control unit, as given in Appendix Table C-1. Figure 5-4 presents
distribution of live and dead cells on the membranes collected from control and experimental
filtration units, respectively.
Table 5-3: Summary results of foulant analyses
Control Experiment
(FNA Cleaning)
Biological Analysis
Adenosine triphosphate (pg/cm2) (n=6-9) 23112±386 9967±608
Viable/Total cells (%) (n=35) 57±5 13±2
Organic Analysis (n=4-6)
Proteins (gBSA/m2) 1.23±0.00 0.95±0.02
Polysaccharides (gGlucose/m2) 0.98±0.03 0.78±0.02
Elemental Analysis (n=4)
Calcium (g/m2) 0.19±0.01 0.06±0.00
Iron (g/m2) 0.06±0.00 0.10±0.00
Sodium (g/m2) 0.07±0.00 0.09±0.00
Phosphate (g/m2) 0.16±0.01 0.06±0.00
ICP results (0.01-0.1 g/m2) K, Mg, Mn, S, Zn Cu, Mg, S, Zn
ICP results (0.001-0.01 g/m2) Cu K
Sum of total metal ions (g/m2) 0.63±0.01 0.45±0.02
Note: The deviation ranges show the standard errors based on the number of the data points of
each analysis.
66
(a)
(b)
Figure 5-4. CLSM images of fouling samples from control (a) and experimental (b) filtration
units. Live cells were stained in green with the DNA specific dye SYTO®9 and the dead cells
are stained in red with PI. Standard test conditions: a cross-flow velocity 0.1 m/s was applied.
FNA (10 mg FNA-N/L) at pH 3 was cleaned for 6 hours in the experimental filtration unit on a
weekly base.
The results of biological analysis suggested that FNA cleanings were efficient at inhibiting
bacteria. In contrast, the concentration of proteins and polysaccharides were similar for both
filtration systems. This outcome is in accordance to the discussion regarding the effect of FNA
on proteins and polysaccharides (section 4.3.1.4), implying FNA cleanings were not effective
for the macromolecules such as proteins and polysaccharides cleaning. The inefficient removal
of these macromolecules might be responsible for declined performance of membrane in both
filtration systems, as these macromolecules were likely to impede the flow of feed water and
enhance the fouling. Overall, the results of foulant analyses suggested that FNA was more
efficient at killing bacteria than disrupting proteins and polysaccharides in the fouling layers,
which might explain the continuing loss of membranes’ hydraulic performance.

67
§ 5.4. CONCLUSIONS
Two bench-scale crossflow filtration units were used to test the new cleaning method using FNA
to prevent fouling on RO membranes. SE and additional nutrient were added to the filtration
units to generate fouling. Although FNA cleanings have showed the ability to restore the
permeability of RO membranes for a short period, the result revealed that FNA cleanings were
unable to deter the performance (NP and salt rejection) decline of RO membranes and the
formation of fouling on RO membranes. The results of foulant analysis indicated that the fouling
materials collected from both filtration systems were mainly composed of microbes and organic
matters. Although the composition of proteins and polysaccharides in the fouling layers were
found to be similar, the biomass contents and viable cells of the fouling layers formed in the
experiment filtration (with FNA cleanings) unit were less than half of that in the control filtration
unit. The abundance of viable cells in the control unit (57±5%) was found to be four times higher
than that in the experiment unit (13±2%). Although the FNA cleaning was efficient at
inactivating bacteria, it was inefficient to clean proteins and polysaccharides. The accumulation
of protein and polysaccharides was likely attributed to the continuing loss of the hydraulic
performance of RO membranes.

68
6. CONCLUSIONS AND RECOMMENDATIONS
§ 6.1. CONCLUSIONS
This chapter summarises the main conclusions from this study and recommends direction for
future study.
Overall, the biofouling cleaning tests have suggested that FNA is more efficient at biomass
removal and inactivation than NaOH (pH 11). 50 mg NO2-N/L at pH 3 (corresponding to 35 mg
HNO2-N/L) was the optimum cleaning conditions for biofouling. Achieving higher biomass
removal than NaOH for both heavily fouled (86-96% versus 41-83%) and moderately fouled
(94-95% against 86-92%) membranes, respectively. In accordance to ATP results, live/dead
staining results have revealed that less viable cells remain in biofouling layers after FNA
cleaning. For moderately fouled RO membranes, 6-32% of total cells remained activated under
the impact of FNA at pH 3, whereas 38-58% of viable cells remained in the biofilm cleaned by
NaOH. However, the difference between the efficiency of FNA and NaOH at protein (67-93%
versus 59-60%) and polysaccharides (73-87% versus 62-79%) removal was not as significant as
biomass removal for moderate fouled RO membranes. In addition, FISH analysis has
demonstrated that FNA had effectively reduced the quantities of targeted bacteria deposited on
heavily and moderately fouled RO membranes. The results of FISH analysis also revealed that
Betaproteobacteria and archaea were greatly affected by FNA cleaning. The benefit of using
FNA is more obvious for cleaning moderately fouled membranes, implying that early cleaning
for biofouling is preferable. Although applying FNA alone, or combining FNA and H2O2 have
shown better efficiency at biofouling removal than NaOH, the cleaning efficiency of FNA has
not been significantly improved (<1% of enhancement).
Descaling tests have shown that FNA was as efficient as HCl and citric acid for scaling control.
Elemental analyses, such as ICP-OES and SEM-EDS, showed that the scaling layer with a
calcium concentration of 32.4±1.7 g/cm2 was completely removed by the FNA solutions at pH 2
and 3 adjusted with HCl or citric acid and these standard acids alone. Based on the outcomes of
biofouling and scaling cleaning tests, FNA has been shown to be a promising cleaning agent to
achieve biofouling and scaling removal at a single stage.

69
Although the characteristics of fouling layers formed in filtration tests are different from the
fouling matrix used in cleaning tests, similar observation was obtained as FNA is more efficient
at biomass inactivation and removal. The biomass contents and viable cells of the fouling layers
formed in the experiment filtration (with FNA cleaning) unit were less than half of that in the
control filtration unit. Moreover, the results of live/dead staining revealed the abundance of
viable cells in the control unit (57±5%) was four times higher than that in the experiment unit
(13±2%). However, the concentration of proteins and polysaccharides were similar in both
control and experiment filtration units (referring to Table 5-3). In term of hydraulic performances,
FNA cleaning showed the ability to restore the permeability of RO membranes for a short period,
but the overall result showed that FNA cleanings were unable to prevent the decline of NP and
salt rejection, and consequently the accumulation of fouling on RO membranes.
§ 6.2. RECOMMENDATIONS
This research work also opens up several interesting directions that can be taken for further
research. These include:
Protocol optimisation for RO biofilm cleaning
The cleaning protocol used in this study was very basic. Different concentrations of FNA
cleaning solutions were the only variables, operating parameters such as cross flow velocity
(CFV, 0.1 m/s), cleaning time (24 hr) and temperature (20℃) were all applied as constants.
Optimising operational conditions could potentially improve the cleaning efficiency of FNA and
simplify the cleaning procedures. The optimal CFV should provide sufficient shear force to
detach biofilm, and also allow the cleaning solution to fully contact with biofouling layers [50].
The effects of CFV on the accumulation of foulants have been critically reviewed by Dreszer et
al. [50], it remains unclear whether increasing CFV can facilitate (increasing nutrient load) or
hinder (enhancing shear force) the biofilm accumulation. For the purpose of optimising cleaning
protocol, actual experiments need to be conducted to justify the effects of CFV.
Regarding the cleaning time for biofouling removal, Jiang et al. have reported that 6-24 h
exposure time would be sufficient for sewer biofilms inactivation at lab-scale [150]. Protocol
optimisation should test if cleaning efficiency of FNA presented in this study could be achieved

70
less than 24 h.
The effect of cleaning temperature on cleaning efficiency for membranes was generally studied
at a temperature range of 20–35 °C. These studies showed that better cleaning efficiency was
obtained at higher temperature (35 °C), as the higher temperature led to higher reaction rate
between cleaning chemicals and fouling deposits. Moreover, higher cleaning temperature
facilitated the transport of foulants from the fouling layer to the bulk solution [151, 152]. The
cleaning efficiency of FNA at a higher temperature (e.g. 35 °C) should be studied in future
research and compared to caustic cleaning under similar temperatures.
Protocols validation for both cleaning and prevention at large scale
Due to randomly distributed amorphous biofouling or general fouling on the surface of RO
membranes [3]. The small filtration cells (referring to Figure 3-1) were unable to reveal the
hydraulic performances (permeability and salt rejection) of RO under impacts of different
cleaning solutions. After the cleaning protocol is fully optimised, it is recommended to conduct
cleaning tests and hydraulic measurements at large-scale filtration units.
In the short-term biofilm prevention tests (referring to Chapter 5), the impacts of FNA weekly
cleaning on fouling accumulation have been demonstrated in terms of permeability and salt
rejection. However, the pressure changes of filtration units were not representative for full scale
RO module due to the size of filtration cells. Membrane manufacturers has revealed fouling can
be detected by monitoring permeability, salt rejection and pressure changes [71, 143]. Hence, it
is still important to monitor pressure changes (either over the feed channel or through the
membranes) during the filtration tests under the impacts of FNA. In order to validate prevention
protocol using FNA, pressure changes should monitor along with permeability and salt rejection
at a larger scale.
Study the cleaning mechanisms between FNA cleaning solutions and RO biofilm
The impacts of FNA on RO biofouling were inferred from the mechanisms behind the
applications of FNA on sewer anaerobic biofilm and waste activated sludge [14-18]. The
cleaning mechanisms between FNA and RO biofilm are yet to be fully revealed, highlighting the

71
need for quantitative molecular tools to monitor the abundance and the dynamics of RO biofilm
under the impacts of FNA cleaning solutions. For instance, EPS can be extracted from RO
biofilms and its interaction with FNA can be studied individually. New FISH probes which are
not limiting to the proteobacteria should also be applied for further microbial communities study.
Hence, the phylogenetic diversity in the biofilm and interaction between FNA and each bacterial
group can be fully investigated.
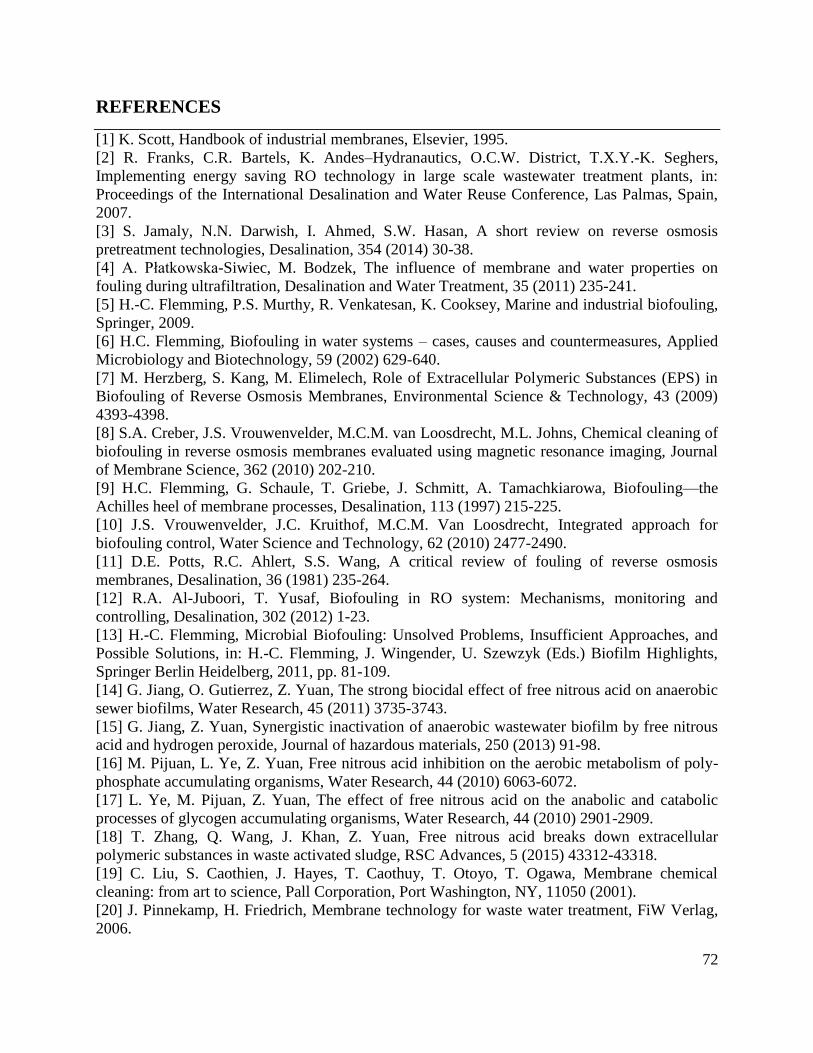
72
REFERENCES
[1] K. Scott, Handbook of industrial membranes, Elsevier, 1995.
[2] R. Franks, C.R. Bartels, K. Andes–Hydranautics, O.C.W. District, T.X.Y.-K. Seghers,
Implementing energy saving RO technology in large scale wastewater treatment plants, in:
Proceedings of the International Desalination and Water Reuse Conference, Las Palmas, Spain,
2007.
[3] S. Jamaly, N.N. Darwish, I. Ahmed, S.W. Hasan, A short review on reverse osmosis
pretreatment technologies, Desalination, 354 (2014) 30-38.
[4] A. Płatkowska-Siwiec, M. Bodzek, The influence of membrane and water properties on
fouling during ultrafiltration, Desalination and Water Treatment, 35 (2011) 235-241.
[5] H.-C. Flemming, P.S. Murthy, R. Venkatesan, K. Cooksey, Marine and industrial biofouling,
Springer, 2009.
[6] H.C. Flemming, Biofouling in water systems – cases, causes and countermeasures, Applied
Microbiology and Biotechnology, 59 (2002) 629-640.
[7] M. Herzberg, S. Kang, M. Elimelech, Role of Extracellular Polymeric Substances (EPS) in
Biofouling of Reverse Osmosis Membranes, Environmental Science & Technology, 43 (2009)
4393-4398.
[8] S.A. Creber, J.S. Vrouwenvelder, M.C.M. van Loosdrecht, M.L. Johns, Chemical cleaning of
biofouling in reverse osmosis membranes evaluated using magnetic resonance imaging, Journal
of Membrane Science, 362 (2010) 202-210.
[9] H.C. Flemming, G. Schaule, T. Griebe, J. Schmitt, A. Tamachkiarowa, Biofouling—the
Achilles heel of membrane processes, Desalination, 113 (1997) 215-225.
[10] J.S. Vrouwenvelder, J.C. Kruithof, M.C.M. Van Loosdrecht, Integrated approach for
biofouling control, Water Science and Technology, 62 (2010) 2477-2490.
[11] D.E. Potts, R.C. Ahlert, S.S. Wang, A critical review of fouling of reverse osmosis
membranes, Desalination, 36 (1981) 235-264.
[12] R.A. Al-Juboori, T. Yusaf, Biofouling in RO system: Mechanisms, monitoring and
controlling, Desalination, 302 (2012) 1-23.
[13] H.-C. Flemming, Microbial Biofouling: Unsolved Problems, Insufficient Approaches, and
Possible Solutions, in: H.-C. Flemming, J. Wingender, U. Szewzyk (Eds.) Biofilm Highlights,
Springer Berlin Heidelberg, 2011, pp. 81-109.
[14] G. Jiang, O. Gutierrez, Z. Yuan, The strong biocidal effect of free nitrous acid on anaerobic
sewer biofilms, Water Research, 45 (2011) 3735-3743.
[15] G. Jiang, Z. Yuan, Synergistic inactivation of anaerobic wastewater biofilm by free nitrous
acid and hydrogen peroxide, Journal of hazardous materials, 250 (2013) 91-98.
[16] M. Pijuan, L. Ye, Z. Yuan, Free nitrous acid inhibition on the aerobic metabolism of poly-
phosphate accumulating organisms, Water Research, 44 (2010) 6063-6072.
[17] L. Ye, M. Pijuan, Z. Yuan, The effect of free nitrous acid on the anabolic and catabolic
processes of glycogen accumulating organisms, Water Research, 44 (2010) 2901-2909.
[18] T. Zhang, Q. Wang, J. Khan, Z. Yuan, Free nitrous acid breaks down extracellular
polymeric substances in waste activated sludge, RSC Advances, 5 (2015) 43312-43318.
[19] C. Liu, S. Caothien, J. Hayes, T. Caothuy, T. Otoyo, T. Ogawa, Membrane chemical
cleaning: from art to science, Pall Corporation, Port Washington, NY, 11050 (2001).
[20] J. Pinnekamp, H. Friedrich, Membrane technology for waste water treatment, FiW Verlag,
2006.

73
[21] D. Lapierre, Water purification, in, Google Patents, 1987.
[22] M. Mulder, Basic principles of membrane technology, Springer Science & Business Media,
1996.
[23] K.P. Lee, T.C. Arnot, D. Mattia, A review of reverse osmosis membrane materials for
desalination—Development to date and future potential, Journal of Membrane Science, 370
(2011) 1-22.
[24] H. Lonsdale, The growth of membrane technology, Journal of Membrane Science, 10 (1982)
81-181.
[25] M. Cheryan, Ultrafiltration and microfiltration handbook, CRC press, 1998.
[26] M.M. Pendergast, E.M. Hoek, A review of water treatment membrane nanotechnologies,
Energy & Environmental Science, 4 (2011) 1946-1971.
[27] J. Kucera, Wiley-Scrivener : Reverse Osmosis : Design, Processes, and Applications for
Engineers, Wiley-Scrivener, Hoboken, NJ, USA, 2010.
[28] R.J. Petersen, Composite reverse osmosis and nanofiltration membranes, Journal of
membrane science, 83 (1993) 81-150.
[29] I.L. Alsvik, M.-B. Hägg, Pressure retarded osmosis and forward osmosis membranes:
materials and methods, Polymers, 5 (2013) 303-327.
[30] A. Simon, L.D. Nghiem, P. Le-Clech, S.J. Khan, J.E. Drewes, Effects of membrane
degradation on the removal of pharmaceutically active compounds (PhACs) by NF/RO filtration
processes, Journal of Membrane Science, 340 (2009) 16-25.
[31] S.S. Sablani, M.F.A. Goosen, R. Al-Belushi, M. Wilf, Concentration polarization in
ultrafiltration and reverse osmosis: a critical review, Desalination, 141 (2001) 269-289.
[32] C. Fritzmann, J. Löwenberg, T. Wintgens, T. Melin, State-of-the-art of reverse osmosis
desalination, Desalination, 216 (2007) 1-76.
[33] J. Baker, L. Dudley, Biofouling in membrane systems—a review, Desalination, 118 (1998)
81-89.
[34] Q. Li, M. Elimelech, Organic Fouling and Chemical Cleaning of Nanofiltration
Membranes: Measurements and Mechanisms, Environmental Science & Technology, 38 (2004)
4683-4693.
[35] M.M.T. Khan, P.S. Stewart, D.J. Moll, W.E. Mickols, S.E. Nelson, A.K. Camper,
Characterization and effect of biofouling on polyamide reverse osmosis and nanofiltration
membrane surfaces, Biofouling, 27 (2011) 173-183.
[36] W.S. Ang, S. Lee, M. Elimelech, Chemical and physical aspects of cleaning of organic-
fouled reverse osmosis membranes, Journal of Membrane Science, 272 (2006) 198-210.
[37] A. Antony, J.H. Low, S. Gray, A.E. Childress, P. Le-Clech, G. Leslie, Scale formation and
control in high pressure membrane water treatment systems: A review, Journal of Membrane
Science, 383 (2011) 1-16.
[38] A. Rahardianto, W.-Y. Shih, R.-W. Lee, Y. Cohen, Diagnostic characterization of gypsum
scale formation and control in RO membrane desalination of brackish water, Journal of
Membrane Science, 279 (2006) 655-668.
[39] E.M.V. Hoek, A.S. Kim, M. Elimelech, Influence of Crossflow Membrane Filter Geometry
and Shear Rate on Colloidal Fouling in Reverse Osmosis and Nanofiltration Separations,
Environmental Engineering Science, 19 (2002) 357-372.
[40] T. Nguyen, F.A. Roddick, L. Fan, Biofouling of water treatment membranes: a review of the
underlying causes, monitoring techniques and control measures, Membranes, 2 (2012) 804-840.

74
[41] X. Chen, S.R. Suwarno, T.H. Chong, D. McDougald, S. Kjelleberg, Y. Cohen, A.G. Fane,
S.A. Rice, Dynamics of biofilm formation under different nutrient levels and the effect on
biofouling of a reverse osmosis membrane system, Biofouling, 29 (2013) 319-330.
[42] E.M. Hoek, M. Elimelech, Cake-enhanced concentration polarization: a new fouling
mechanism for salt-rejecting membranes, Environmental science & technology, 37 (2003) 5581-
5588.
[43] H.-C. Flemming, Reverse osmosis membrane biofouling, Experimental thermal and fluid
science, 14 (1997) 382-391.
[44] E. Curcio, X. Ji, G. Di Profio, A.O. Sulaiman, E. Fontananova, E. Drioli, Membrane
distillation operated at high seawater concentration factors: Role of the membrane on CaCO3
scaling in presence of humic acid, Journal of Membrane Science, 346 (2010) 263-269.
[45] C. Park, Y.H. Lee, S. Lee, S. Hong, Effect of cake layer structure on colloidal fouling in
reverse osmosis membranes, Desalination, 220 (2008) 335-344.
[46] J.S. Vrouwenvelder, M.C.M. Van Loosdrecht, J.C. Kruithof, A novel scenario for
biofouling control of spiral wound membrane systems, Water Research, 45 (2011) 3890-3898.
[47] H.-C. Flemming, G. Schaule, H.F. Ridgway, Living with biofilms-elements of an integrated
anti-fouling strategy, Annu Rev Microbiol, 41 (2001) 435-464.
[48] T. Mattila‐Sandholm, G. Wirtanen, Biofilm formation in the industry: A review, Food
Reviews International, 8 (1992) 573-603.
[49] S. Pandey, V. Jegatheesan, K. Baskaran, L. Shu, Fouling in reverse osmosis (RO)
membrane in water recovery from secondary effluent: a review, Reviews in Environmental
Science and Bio/Technology, 11 (2012) 125-145.
[50] C. Dreszer, H.C. Flemming, A. Zwijnenburg, J.C. Kruithof, J.S. Vrouwenvelder, Impact of
biofilm accumulation on transmembrane and feed channel pressure drop: Effects of crossflow
velocity, feed spacer and biodegradable nutrient, Water Research, 50 (2014) 200-211.
[51] S.R. Suwarno, X. Chen, T.H. Chong, D. McDougald, Y. Cohen, S.A. Rice, A.G. Fane,
Biofouling in reverse osmosis processes: The roles of flux, crossflow velocity and concentration
polarization in biofilm development, Journal of Membrane Science, 467 (2014) 116-125.
[52] D. Monroe, Looking for Chinks in the Armor of Bacterial Biofilms, PLoS Biol, 5 (2007)
e307.
[53] S.U. Gerbersdorf, B. Westrich, D.M. Paterson, Microbial extracellular polymeric substances
(EPS) in fresh water sediments, Microbial ecology, 58 (2009) 334-349.
[54] P. Stoodley, K. Sauer, D.G. Davies, J.W. Costerton, BIOFILMS AS COMPLEX
DIFFERENTIATED COMMUNITIES, Annual Review of Microbiology, 56 (2002) 187-209.
[55] S. Andersson, Characterization of bacterial biofilms for wastewater treatment, (2009).
[56] A. Matin, Z. Khan, S.M.J. Zaidi, M.C. Boyce, Biofouling in reverse osmosis membranes for
seawater desalination: Phenomena and prevention, Desalination, 281 (2011) 1-16.
[57] H.-C. Flemming, Biofilms and environmental protection, Water Science & Technology, 27
(1993) 1-10.
[58] H. Flemming, J. Wingender, Relevance of microbial extracellular polymeric substances
(EPSs)-Part I: Structural and ecological aspects, Water Science & Technology, 43 (2001) 1-8.
[59] H.C. Flemming, J. Wingender, Extracellular Polymeric Substances (EPS): Structural,
Ecological and Technical Aspects, in: Encyclopedia of Environmental Microbiology, John
Wiley & Sons, Inc., 2003.

75
[60] G.M. Wolfaardt, J.R. Lawrence, R.D. Robarts, D.E. Caldwell, In situ Characterization of
Biofilm Exopolymers Involved in the Accumulation of Chlorinated Organics, Microbial ecology,
35 (1998) 213-223.
[61] H.-C. Flemming, T.R. Neu, D.J. Wozniak, The EPS Matrix: The “House of Biofilm Cells”,
Journal of Bacteriology, 189 (2007) 7945-7947.
[62] D.G. Allison, T. Maira-Litran, and P. Gilbert, Antimicrobial resistance of biofilms, in: L.V.
Evans (Ed.) In Biofilms: recent advances in their study and control, Harwood Academic
Publishers, Amsterdam, 2000, pp. 149-166.
[63] A. Conrad, M. Kontro, M.M. Keinänen, A. Cadoret, P. Faure, L. Mansuy-Huault, J.-C.
Block, Fatty acids of lipid fractions in extracellular polymeric substances of activated sludge
flocs, Lipids, 38 (2003) 1093-1105.
[64] P. Stoodley, K. Sauer, D. Davies, J.W. Costerton, Biofilms as complex differentiated
communities, Annual Reviews in Microbiology, 56 (2002) 187-209.
[65] I.W. Sutherland, Biofilm exopolysaccharides: a strong and sticky framework, Microbiology,
147 (2001) 3-9.
[66] S.S. Adav, D.-J. Lee, J.-H. Tay, Extracellular polymeric substances and structural stability
of aerobic granule, Water Research, 42 (2008) 1644-1650.
[67] A. Rahardianto, J. Gao, C.J. Gabelich, M.D. Williams, Y. Cohen, High recovery membrane
desalting of low-salinity brackish water: Integration of accelerated precipitation softening with
membrane RO, Journal of Membrane Science, 289 (2007) 123-137.
[68] J. Gilron, D. Hasson, Calcium sulphate fouling of reverse osmosis membranes: flux decline
mechanism, Chemical Engineering Science, 42 (1987) 2351-2360.
[69] S. Lee, C. Lee, Scale formation in NF/RO: mechanism and control, Water Science &
Technology, 51 (2005) 267-275.
[70] N. Prihasto, Q.-F. Liu, S.-H. Kim, Pre-treatment strategies for seawater desalination by
reverse osmosis system, Desalination, 249 (2009) 308-316.
[71] Dow, FILMTEC™ Reverse Osmosis Membranes Technical Manual, in, 2008.
[72] A. Plottu-Pecheux, B. Houssais, C. Democrate, D. Gatel, C. Parron, J. Cavard, Comparison
of three antiscalants, as applied to the treatment of water from the River Oise, Desalination, 145
(2002) 273-280.
[73] E.H. Kelle Zeiher, B. Ho, K.D. Williams, Novel antiscalant dosing control, Desalination,
157 (2003) 209-216.
[74] J.S. Vrouwenvelder, S.A. Manolarakis, H.R. Veenendaal, D. van der Kooij, Biofouling
potential of chemicals used for scale control in RO and NF membranes, Desalination, 132 (2000)
1-10.
[75] Dow, Liquid Separation, FILMTEC™ Reverse Osmosis Membranes Technical Manual, in,
2008.
[76] HYDRANAUTICS, RO Membrane Foulants and Their Removal from Composite
Polyamide (ESPA, ESNA, CPA, LFC, and SWC) RO Membrane Elements, in, May 2000.
[77] A. Al-Amoudi, R.W. Lovitt, Fouling strategies and the cleaning system of NF membranes
and factors affecting cleaning efficiency, Journal of Membrane Science, 303 (2007) 4-28.
[78] D. Kim, S. Jung, J. Sohn, H. Kim, S. Lee, Biocide application for controlling biofouling of
SWRO membranes—an overview, Desalination, 238 (2009) 43-52.
[79] V. Lund, K. Ormerod, The influence of disinfection processes on biofilm formation in water
distribution systems, Water research, 29 (1995) 1013-1021.

76
[80] J. Yu, Y. Baek, H. Yoon, J. Yoon, New disinfectant to control biofouling of polyamide
reverse osmosis membrane, Journal of Membrane Science, 427 (2013) 30-36.
[81] N.P. Soice, A.C. Maladono, D.Y. Takigawa, A.D. Norman, W.B. Krantz, A.R. Greenberg,
Oxidative degradation of polyamide reverse osmosis membranes: studies of molecular model
compounds and selected membranes, Journal of applied polymer science, 90 (2003) 1173-1184.
[82] G.-D. Kang, C.-J. Gao, W.-D. Chen, X.-M. Jie, Y.-M. Cao, Q. Yuan, Study on hypochlorite
degradation of aromatic polyamide reverse osmosis membrane, Journal of membrane science,
300 (2007) 165-171.
[83] Y.-N. Kwon, J.O. Leckie, Hypochlorite degradation of crosslinked polyamide membranes:
II. Changes in hydrogen bonding behavior and performance, Journal of membrane science, 282
(2006) 456-464.
[84] C. Bartels, M. Wilf, K. Andes, J. Iong, Design considerations for wastewater treatment by
reverse osmosis, Water Science & Technology, 51 (2005) 473-482.
[85] M.K. da Silva, I.C. Tessaro, K. Wada, Investigation of oxidative degradation of polyamide
reverse osmosis membranes by monochloramine solutions, Journal of Membrane Science, 282
(2006) 375-382.
[86] G. Petrucci, M. Rosellini, Chlorine dioxide in seawater for fouling control and post-
disinfection in potable waterworks, Desalination, 182 (2005) 283-291.
[87] S. Ebrahim, Cleaning and regeneration of membranes in desalination and wastewater
applications: State-of-the-art, Desalination, 96 (1994) 225-238.
[88] W.S. Ang, N.Y. Yip, A. Tiraferri, M. Elimelech, Chemical cleaning of RO membranes
fouled by wastewater effluent: Achieving higher efficiency with dual-step cleaning, Journal of
Membrane Science, 382 (2011) 100-106.
[89] N. Porcelli, S. Judd, Chemical cleaning of potable water membranes: a review, Separation
and Purification Technology, 71 (2010) 137-143.
[90] HYDRANAUTICS, Biocides for Disinfection and Storage of Hydranautics Membrane
Elements, in, March 2015.
[91] W.A.M. Hijnen, C. Castillo, A.H. Brouwer-Hanzens, D.J.H. Harmsen, E.R. Cornelissen, D.
van der Kooij, Quantitative assessment of the efficacy of spiral-wound membrane cleaning
procedures to remove biofilms, Water Research, 46 (2012) 6369-6381.
[92] C. Frayne, The selection and application of nonoxidizing biocides for cooling water systems,
The Analyst (Spring), (2001) 1-10.
[93] J.B. Kristensen, R.L. Meyer, B.S. Laursen, S. Shipovskov, F. Besenbacher, C.H. Poulsen,
Antifouling enzymes and the biochemistry of marine settlement, Biotechnology advances, 26
(2008) 471-481.
[94] B. Thallinger, E.N. Prasetyo, G.S. Nyanhongo, G.M. Guebitz, Antimicrobial enzymes: An
emerging strategy to fight microbes and microbial biofilms, Biotechnology Journal, 8 (2013) 97-
109.
[95] J.S. Webb, L.S. Thompson, S. James, T. Charlton, T. Tolker-Nielsen, B. Koch, M. Givskov,
S. Kjelleberg, Cell death in Pseudomonas aeruginosa biofilm development, Journal of
bacteriology, 185 (2003) 4585-4592.
[96] N.N.E. Greenwood, Alan, Chemistry of the Elements, Butterworth-Heinemann, 1997.
[97] A.C. Anthonisen, R.C. Loehr, T.B.S. Prakasam, E.G. Shinath, Inhibition of nitrification by
ammonia and nitrous acid, J. Water Pollut. Control Fed, 48 (1976) 835-852.
[98] A. Anthonisen, R. Loehr, T. Prakasam, E. Srinath, Inhibition of nitrification by ammonia
and nitrous acid, Journal (Water Pollution Control Federation), (1976) 835-852.

77
[99] V.M. Vadivelu, J. Keller, Z. Yuan, Effect of free ammonia and free nitrous acid
concentration on the anabolic and catabolic processes of an enriched Nitrosomonas culture,
Biotechnology and Bioengineering, 95 (2006) 830-839.
[100] V.M. Vadivelu, Z. Yuan, C. Fux, J. Keller, The Inhibitory Effects of Free Nitrous Acid on
the Energy Generation and Growth Processes of an Enriched Nitrobacter Culture, Environmental
Science & Technology, 40 (2006) 4442-4448.
[101] L. Ye, M. Pijuan, Z. Yuan, The effect of free nitrous acid on key anaerobic processes in
enhanced biological phosphorus removal systems, Bioresource Technology, 130 (2013) 382-389.
[102] Y. Zhou, L. Ganda, M. Lim, Z. Yuan, W.J. Ng, Response of poly-phosphate accumulating
organisms to free nitrous acid inhibition under anoxic and aerobic conditions, Bioresource
Technology, 116 (2012) 340-347.
[103] M. Pijuan, Q. Wang, L. Ye, Z. Yuan, Improving secondary sludge biodegradability using
free nitrous acid treatment, Bioresource Technology, 116 (2012) 92-98.
[104] Q. Wang, L. Ye, G. Jiang, S. Hu, Z. Yuan, Side-stream sludge treatment using free nitrous
acid selectively eliminates nitrite oxidizing bacteria and achieves the nitrite pathway, Water
Research, 55 (2014) 245-255.
[105] X. Sun, G. Jiang, P.L. Bond, J. Keller, Z. Yuan, A novel and simple treatment for control
of sulfide induced sewer concrete corrosion using free nitrous acid, Water Research, 70 (2015)
279-287.
[106] E.F. B. Donose, W. Gernjak, M. Pidou and Z. Yuan, Preliminary results of the membrane
biofouling removal with Free Nittous Acid (FNA), in, 2013.
[107] Y. Zhou, A. Oehmen, M. Lim, V. Vadivelu, W.J. Ng, The role of nitrite and free nitrous
acid (FNA) in wastewater treatment plants, Water Research, 45 (2011) 4672-4682.
[108] T. Casey, M. Wentzel, G. Ekama, Filamentous organism bulking in nutrient removal
activated sludge systems: Paper 9: Review of biochemistry of heterotrophic respiratory
metabolism, Water SA, 25 (1999) 409-424.
[109] M. Repetto, J. Semprine, A. Boveris, Lipid Peroxidation: Chemical mechanism, biological
implications and analytical determinations, Lipid peroxidation, (2012) 1-28.
[110] W. Heaselgrave, P.W. Andrew, S. Kilvington, Acidified nitrite enhances hydrogen
peroxide disinfection of Acanthamoeba, bacteria and fungi, Journal of Antimicrobial
Chemotherapy, (2010).
[111] F. Du, S. Freguia, Z. Yuan, J. Keller, I. Pikaar, Enhancing Toxic Metal Removal from
Acidified Sludge with Nitrite Addition, Environmental Science & Technology, 49 (2015) 6257-
6263.
[112] M. Greenblatt, S. Mirvish, B.T. So, Nitrosamine studies: Induction of lung adenomas by
concurrent administration of sodium nitrite and secondary amines in Swiss mice, Journal of the
National Cancer Institute, 46 (1971) 1029-1034.
[113] U. EPA, Guidelines for carcinogen risk assessment. Retrieved from, in, 1986.
[114] E. Ireland, Water Treatment Manual: Disinfection, in, 2011.
[115] E. Linley, S.P. Denyer, G. McDonnell, C. Simons, J.-Y. Maillard, Use of hydrogen
peroxide as a biocide: new consideration of its mechanisms of biocidal action, Journal of
Antimicrobial Chemotherapy, 67 (2012) 1589-1596.
[116] DOW, Cleaning Procedures for DOW FILMTEC FT30 Elements, in.
[117] C. Bele, Y. Kumar, T. Walker, Y. Poussade, V. Zavlanos, Operating boundaries of full-
scale advanced water reuse treatment plants: many lessons learned from pilot plant experience,
Water Science and Technology, 62 (2010) 1560-1566.

78
[118] B. Alberts, D. Bray, K. Hopkin, A. Johnson, J. Lewis, M. Raff, K. Roberts, P. Walter,
Essential cell biology, Garland Science, 2013.
[119] F. Hammes, F. Goldschmidt, M. Vital, Y. Wang, T. Egli, Measurement and interpretation
of microbial adenosine tri-phosphate (ATP) in aquatic environments, Water Research, 44 (2010)
3915-3923.
[120] R.I. Amann, B.J. Binder, R.J. Olson, S.W. Chisholm, R. Devereux, D.A. Stahl,
Combination of 16S rRNA-targeted oligonucleotide probes with flow cytometry for analyzing
mixed microbial populations, Applied and environmental microbiology, 56 (1990) 1919-1925.
[121] G. Talbot, E. Topp, M.F. Palin, D.I. Massé, Evaluation of molecular methods used for
establishing the interactions and functions of microorganisms in anaerobic bioreactors, Water
Research, 42 (2008) 513-537.
[122] R. Amann, Fluorescently labelled, rRNA‐targeted oligonucleotide probes in the study of
microbial ecology, Molecular Ecology, 4 (1995) 543-554.
[123] L.A. Bereschenko, H. Prummel, G.J.W. Euverink, A.J.M. Stams, M.C.M. van Loosdrecht,
Effect of conventional chemical treatment on the microbial population in a biofouling layer of
reverse osmosis systems, Water Research, 45 (2011) 405-416.
[124] C.M. Pang, W.-T. Liu, Community structure analysis of reverse osmosis membrane
biofilms and the significance of Rhizobiales bacteria in biofouling, Environmental Science &
Technology, 41 (2007) 4728-4734.
[125] C.-L. Chen, W.-T. Liu, M.-L. Chong, M.-T. Wong, S. Ong, H. Seah, W. Ng, Community
structure of microbial biofilms associated with membrane-based water purification processes as
revealed using a polyphasic approach, Applied Microbiology and Biotechnology, 63 (2004) 466-
473.
[126] J. Lee, I.S. Kim, Microbial community in seawater reverse osmosis and rapid diagnosis of
membrane biofouling, Desalination, 273 (2011) 118-126.
[127] A. Al Ashhab, O. Gillor, M. Herzberg, Biofouling of reverse-osmosis membranes under
different shear rates during tertiary wastewater desalination: Microbial community composition,
Water Research, 67 (2014) 86-95.
[128] C. Ayache, C. Manes, M. Pidou, J.P. Croué, W. Gernjak, Microbial community analysis of
fouled reverse osmosis membranes used in water recycling, Water Research, 47 (2013) 3291-
3299.
[129] A. Al Ashhab, M. Herzberg, O. Gillor, Biofouling of reverse-osmosis membranes during
tertiary wastewater desalination: Microbial community composition, Water Research, 50 (2014)
341-349.
[130] W. Manz, R. Amann, W. Ludwig, M. Wagner, K.-H. Schleifer, Phylogenetic
oligodeoxynucleotide probes for the major subclasses of proteobacteria: problems and solutions,
Systematic and applied microbiology, 15 (1992) 593-600.
[131] J. Brosius, T.J. Dull, D.D. Sleeter, H.F. Noller, Gene organization and primary structure of
a ribosomal RNA operon from< i> Escherichia coli</i>, Journal of molecular biology, 148 (1981)
107-127.
[132] L. Nieradzik, Biofouling removal from RO membranes, in, University of Duisburg-Essen,
2012.
[133] M. Dubois, K. Gilles, J. Hamilton, P. Rebers, F. Smith, A colorimetric method for the
determination of sugars, (1951).

79
[134] P. Smith, R.I. Krohn, G. Hermanson, A. Mallia, F. Gartner, M. Provenzano, E. Fujimoto,
N. Goeke, B. Olson, D. Klenk, Measurement of protein using bicinchoninic acid, Analytical
biochemistry, 150 (1985) 76-85.
[135] J. Vrouwenvelder, S. Manolarakis, H. Veenendaal, D. Van der Kooij, Biofouling potential
of chemicals used for scale control in RO and NF membranes, Desalination, 132 (2000) 1-10.
[136] J.S. Vrouwenvelder, D. van der Kooij, Diagnosis, prediction and prevention of biofouling
of NF and RO membranes, Desalination, 139 (2001) 65-71.
[137] H.-C. Flemming, Mechanistic aspects of reverse osmosis membrane biofouling and
prevention, (1993).
[138] E.L. Farias, K.J. Howe, B.M. Thomson, Spatial and temporal evolution of organic foulant
layers on reverse osmosis membranes in wastewater reuse applications, Water research, 58 (2014)
102-110.
[139] M.T. Khan, M. Busch, V.G. Molina, A.-H. Emwas, C. Aubry, J.-P. Croue, How different
is the composition of the fouling layer of wastewater reuse and seawater desalination RO
membranes?, Water Research, 59 (2014) 271-282.
[140] W. Fang, J. Hu, S. Ong, Influence of phosphorus on biofilm formation in model drinking
water distribution systems, Journal of applied microbiology, 106 (2009) 1328-1335.
[141] RepetaGroup, Speciation of dissolved organic phosphorus in seawater, in, February 11,
2014.
[142] Dow, Liquid Separations, FILMTECTM
Reverse Osmosis Membranes. Technical manual.
Form no. 609-00771-0705:1-182., in, 2008.
[143] LENNTECH, Foulants and Cleaning Procedures for composite polyamide RO Membrane
Elements (ESPA, ESNA, CPA, LFC, and SWC), in, Octorber 2011.
[144] M. Pijuan, Q. Wang, L. Ye, Z. Yuan, Improving secondary sludge biodegradability using
free nitrous acid treatment Bioresource Technology, 116 (2013) 92-98.
[145] T. Schipolowski, A. Jeżowska, G. Wozny, Reliability of membrane test cell measurements,
Desalination, 189 (2006) 71-80.
[146] L. Nieradzik, Biofouling removal from RO membranes, in, University of Duisburg-Essen,
Essen, 2012, pp. 96.
[147] C. Bartels, R. Franks, S. Rybar, M. Schierach, M. Wilf, The effect of feed ionic strength on
salt passage through reverse osmosis membranes, Desalination, 184 (2005) 185-195.
[148] Lewabrane, Principles of Reverse Osmosis Membrane separation, in, 2012.
[149] J. Vrouwenvelder, D. Van der Kooij, Diagnosis of fouling problems of NF and RO
membrane installations by a quick scan, Desalination, 153 (2003) 121-124.
[150] G. Jiang, A. Keating, S. Corrie, K. O'Halloran, L. Nguyen, Z. Yuan, Dosing free nitrous
acid for sulfide control in sewers: Results of field trials in Australia, Water Research, 47 (2013)
4331-4339.
[151] L.H. Kim, A. Jang, H.-W. Yu, S.-J. Kim, I.S. Kim, Effect of chemical cleaning on
membrane biofouling in seawater reverse osmosis processes, Desalination and Water Treatment,
33 (2011) 289-294.
[152] M.R. Sohrabi, S.S. Madaeni, M. Khosravi, A.M. Ghaedi, Chemical cleaning of reverse
osmosis and nanofiltration membranes fouled by licorice aqueous solutions, Desalination, 267
(2011) 93-100.

80
APPENDIXES
Appendix A. Calibration curve for ATP measurement
Figure A-1. Calibration curve for ATP quantification. Error bars show the standard deviation
on n measurements (n= [2-14]). The detection limit was defined as the lowest ATP
concentration of which a three-fold error bar extension downward did not overlap with a
three-fold error bar extension of the negative control, and was set at 0.01 nM ATP, upwards
of which a linear correlation of R2=0.99 was obtained
y = 13397x + 10181 R² = 0.9943
1.E+02
1.E+03
1.E+04
1.E+05
1.E+06
1.E-03 1.E-02 1.E-01 1.E+00 1.E+01 1.E+02
Res
po
nse
(R
LU)
rATP (nM)

81
Appendix B. Additional results of FISH analysis
Table B-1: The relative quantification of each specific bacteria detected with the respective FISH
probes (n= 20±5) in each biofouling matrix.
Membrane # All Alpha-
proteobacteria
Beta-
proteobacteria
Gamma-
proteobacteria Archaea
RO1 6086±1004 2603±769 1292±387 n.d. 108±30
RO3 44844±5598 4467±693 12215±1564 n.d 3150±613
RO4 7291±632 119±40 154±51 1252±267 238±104
RO5 5752±642 720±152 804±467 477±125 1583±290
n.d.: not determined
Table B-2: The relative abundances of each specific bacteria detected with the respective FISH
probes (n=20±5) in the biofouling matrix of RO1 and RO5 before and after cleaning.
Membrane # All Alpha-
proteobacteria
Beta-
proteobacteria
Gamma-
proteobacteria Archaea
RO1-Before
cleaning 6086±1004 2603±769 1292±387 n.d. 108±30
RO1-After
cleaning 1816±360 313±122 67±25 n.d. 13±9
RO5-Before
cleaning 5752±642 720±152 804±467 477±125 1583±290
RO5-After
cleaning 3575±772 551±193 141±39 n.d. 3±2
n.d.: not determined

82
(a) (b)
(c) (d)
(e) (f)
Figure B-1. FISH images of biofilm formed on the membranes RO1 (a); RO3 (b); RO4(c and
d) and RO5 (e and f). In images (a), (b), (c), and (e), bacteria (EUBmix) are in blue,
alphaproteobacteria are in pink, betaproteobacteria are in cyan and archaea in green. For (d)
and (f), Gammaproteobacteria are in pink. 20±5 FISH images were taken for this analysis.

83
(a)
(b)
(c)
(d)
Figure B-2. FISH images of biofilm formed on membranes RO1 before (a) and after cleaning
tests (b); RO5 before (c) and after cleaning tests (d), respectively. Bacteria (EUBmix) are in
blue, Gammaproteobacteria are in pink, Betaproteobacteria are in cyan and archaea in green.
A cross-flow velocity 0.1 m/s was applied. 20±5 FISH images were taken for this analysis.

84
Appendix C. Live/dead cells represented by CLSM images
(a) (d)
(b) (e)
(c) (f)
Figure C-1. CLSM images of RO4, before cleaning (a) and after cleaning with Control
(Water) (b), NaOH, pH 11(c), FNA, pH 2 (d), FNA, pH 3 (e) and FNA, pH 4 (f). Standard
test conditions: a cross-flow velocity 0.1 m/s was applied. Live cells were stained in green
with the DNA specific dye SYTO®9 and the dead cells are stained in red with PI.

85
(a) (d)
(b) (e)
(c) (f)
Figure C-2. CLSM images of RO5, before cleaning (a) and after cleaning with Control
(Water) (b), NaOH, pH 11(c), FNA, pH 2 (d), FNA, pH 3 (e) and FNA, pH 4 (f). Standard
test conditions: a cross-flow velocity 0.1 m/s was applied. Live cells were stained in green
with the DNA specific dye SYTO®9 and the dead cells are stained in red with PI.
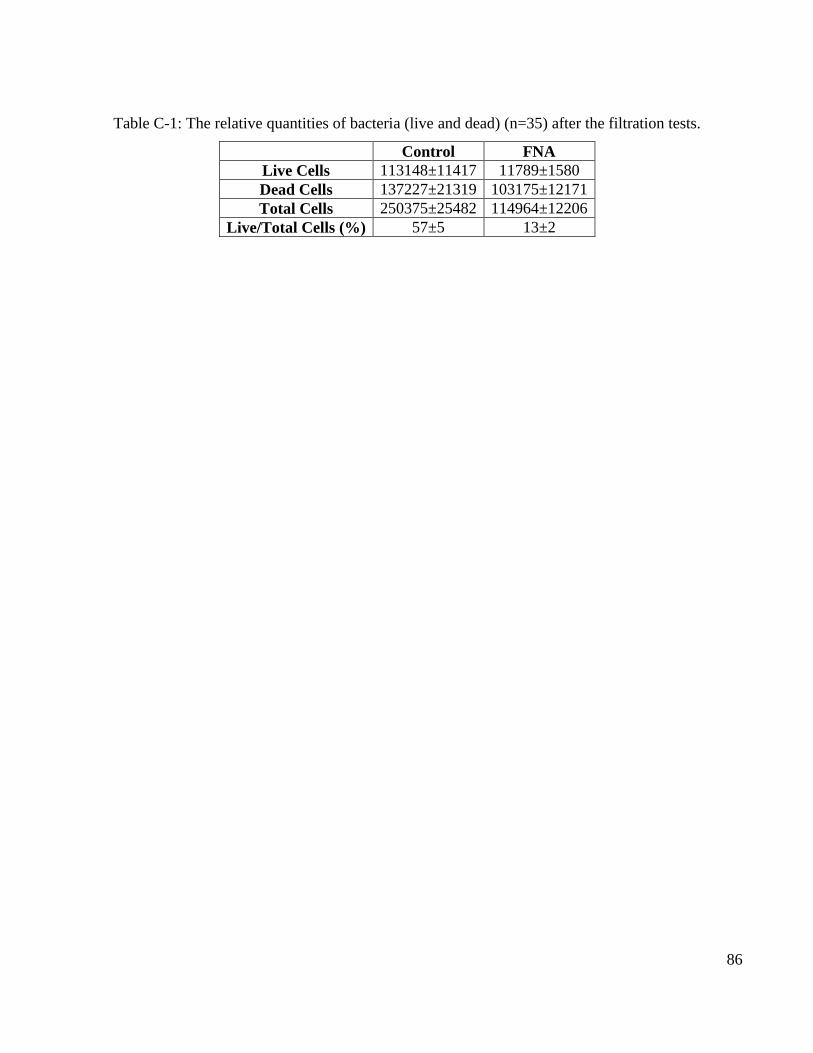
86
Table C-1: The relative quantities of bacteria (live and dead) (n=35) after the filtration tests.
Control FNA
Live Cells 113148±11417 11789±1580
Dead Cells 137227±21319 103175±12171
Total Cells 250375±25482 114964±12206
Live/Total Cells (%) 57±5 13±2
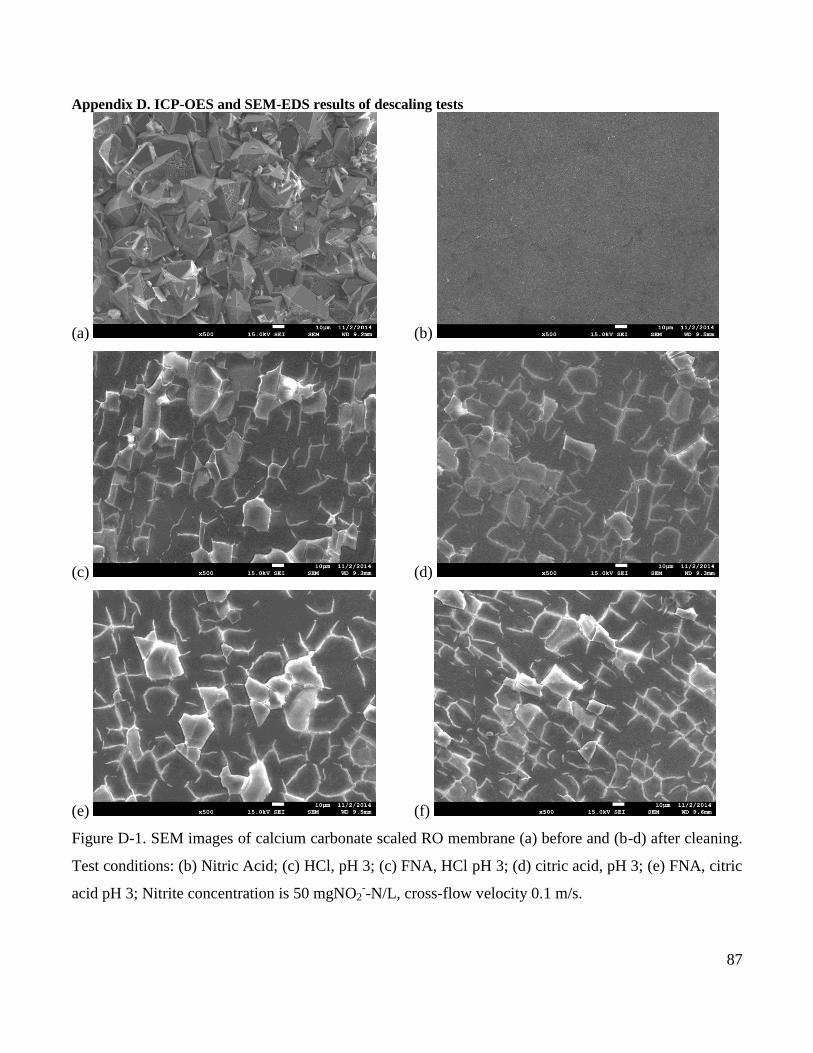
87
Appendix D. ICP-OES and SEM-EDS results of descaling tests
(a) (b)
(c) (d)
(e) (f)
Figure D-1. SEM images of calcium carbonate scaled RO membrane (a) before and (b-d) after cleaning.
Test conditions: (b) Nitric Acid; (c) HCl, pH 3; (c) FNA, HCl pH 3; (d) citric acid, pH 3; (e) FNA, citric
acid pH 3; Nitrite concentration is 50 mgNO2--N/L, cross-flow velocity 0.1 m/s.

88
a) b)
c) d)
e) f)
Figure D-2. Element wt% (from SEM-EDS analysis) of calcium carbonate scaled RO membrane (a)
before and (b-d) after cleaning. Test conditions: (b) Nitric Acid; (c) HCl, pH 3; (c) FNA, HCl pH 3; (d)
citric acid, pH 3; (e) FNA, citric acid pH 3; Nitrite concentration is 50 mgNO2--N/L, cross-flow velocity
0.1 m/s, No. of analysis = 5.


![Application of DBNPA dosage for biofouling control in ... may be used to control biofouling in spiral-wound reverse osmosis ... alkaline aqueous solutions [16]. ... Bronkhorst High-Tech](https://img.dokumen.tips/doc/110x75/5b2082c47f8b9af6058b45e3/application-of-dbnpa-dosage-for-biofouling-control-in-may-be-used-to-control.jpg)