Embed Size (px)
Citation preview

Faculty of bioscience engineering
Academic year 2014 – 2015
Linking Growth to Defense: Della’s show how
Valerie Biebaû
Promoter: Prof. dr. ir. Monica Höfte Co-Promoter: dr. ir. David De Vleesschauwer
Master’s dissertation submitted in fulfilment of the requirements for the degree of Master in Bioscience Engineering: Cell and gene biotechnology


Faculteit bio-ingenieurswetenschappen
Academiejaar 2014 – 2015
Het koppelen van groei aan afweer: DELLAs tonen de weg
Valerie Biebaû
Promotor: Prof. dr. ir. Monica Höfte Co-Promotor: dr. ir. David De Vleesschauwer
Masterproef voorgedragen tot het behalen van de graad van Master in de bio-ingenieurswetenschappen: cel- en genbiotechnologie


Equipped with his five senses, man explores the universe around him
and calls the adventure science. Edwin Powell Hubble
(1898-1953)


De auteur en promotoren geven de toelating deze scriptie voor consultatie beschikbaar te stellen en delen ervan te kopiëren voor persoonlijk gebruik. Elk ander gebruik valt onder de beperkingen van het auteursrecht, in het bijzonder met betrekking tot de verplichting uitdrukkelijk de bron te vermelden bij het aanhalen van resultaten uit deze scriptie. The author and promoters give the permission to use this thesis for consultation and to copy parts of it for personal use. Every other use is subject to the copyright laws, more specifically the source must be extensively specified when using results from this thesis. Gent, Juni/June 2015
De promotor Prof. dr. ir. M. Höfte
De co-promotor dr. ir. D. De Vleesschauwer
De auteur Valerie Biebaû


i
Woord Vooraf
Na bijna een jaar labowerk, literatuur raadplegen en schrijven is het zover: het afwerken van mijn
masterproef en daarmee ook mijn opleiding als bio-ingenieur cel- en genbiotechnologie. Het waren
vijf interessante jaren die ik nu in schoonheid kan afsluiten met een werk over een interessant
onderwerp en waarbij ik verschillende technieken aangeleerd kreeg. Het was nog maar eens een
bevestiging dat ik de juiste keuze qua opleiding maakte. Biotechnologie en planten zijn voor mij
namelijk interessante onderwerpen die ik in deze masterproef kon combineren.
Maar interesse alleen was niet voldoende om deze masterproef tot een goed einde te maken: de
praktijk is toch nog net iets anders dan de theorie en daarvoor zijn wat helpende handen nodig, zeker
in het begin. Het kan dan ook niet anders dat ik bepaalde mensen een dankwoord verschuldigd ben.
Eerst en vooral wil ik professor Monica Höfte bedanken voor mijn interesse voor de moleculaire
fytopathologie en plantbiotechnologie in het algemeen op te wekken in verschillende lessen.
Daarnaast natuurlijk ook om me de kans te geven om mijn masterproef uit te voeren in het labo
fytopathologie van de Universiteit Gent. Verder wil ik David De Vleesschauwer bedanken om me dit
onderwerp aan te raden en me te begeleiden bij de experimenten en het interpreteren van de
resultaten. Verder ben ik ook een dankwoord verschuldigd aan Evelien De Waele die me hielp bij het
uitvoeren en aanleren van een aantal experimenten en aan Osvaldo Filipe om me de eerste weken
rond te leiden in het labo en me een aantal technieken aan te leren. Ik wil ook iedereen die in het
labo fytopathologie werkt, inclusief de voorgenoemde personen, bedanken voor de ‘tips and tricks’,
de fijne babbels, de vriendelijke goedemorgen en zoveel meer. Het is fijn om zo’n vriendelijke
mensen te leren kennen!
Tenslotte wil ik ook mijn familie en vrienden bedanken voor de ontspanningsmomenten, de tips
en het luisterende oor wanneer het iets minder ging. Ik wil ook een groot dankwoord plaatsen voor
mijn ouders die me de kans gegeven hebben om deze studies te doen en me ook ten volle hebben
gesteund. Ze geven me alles wat ik nodig heb om gelukkig te zijn en cijferen zich daarbij zelf vaak
weg. Het zijn fantastische ouders die me gevormd hebben tot wie ik nu ben en daar ben ik heel blij
om.
Met enige nostalgie moet ik dan jammer genoeg afscheid nemen van het ‘boerekot’ aan de
Coupure in Gent. Maar afscheid nemen doe ik met enige trots over wat ik heb geleerd, bereikt en
hoop te betekenen in de toekomst voor de wetenschap. Een mooie bekroning voor de voorbije vijf
jaar is alvast deze masterproef en ik hoop hiermee ook uw interesse op te kunnen wekken voor de
moleculaire fytopathologie. Alvast veel leesplezier!
Valerie Biebaû,
5 juni 2015

ii
iii
Samenvatting
DELLA proteïnen zijn nucleaire transcriptie regulatoren die de plant helpen om zijn energie en
energiebronnen te verdelen over afweer en groei. Dit door de crosstalk tussen verschillende
(hormoon) pathways zoals de gibberellinezuur (GA) pathway, de jasmijnzuur (JA) pathway, de
salicylzuur pathway, enz. te regelen. DELLA’s veranderen de functionering van deze pathways via de
regulatie van gentranscriptie en eiwit interacties die de functie van dat andere eiwit stimuleren,
verhinderen of het eiwit zelfs laten degraderen (Sun, 2011) (Itoh et al., 2005). Een goed voorbeeld is
de inductie van de transcriptie van JA responsieve genen door binding met JAZ eiwitten (Gao et al.,
2011). Maar het DELLA eiwit zelf ondergaat ook enig regulatie: het proteïne promoot afweer boven
groei, dus wanneer groei nodig is, worden DELLA’s tot degradatie gebracht door de vorming van een
GA-GID1-DELLA complex waarin het groeihormoon GA een belangrijke rol speelt (Gao et al., 2011)
(Hirano et al., 2010). Hoe dan ook, het grootste deel van deze informatie is verzameld door
onderzoek met de modelplant Arabidopsis thaliana, dat vijf DELLA eiwitten bevat: RGA, GAI, RGL1
(RGA-LIKE 1), RGL2 en RGL3 (Sun, 2011). Aangezien Arabidopsis thaliana enkel een modelplant is en
geen echt economisch belang heeft, zou het interessanter zijn om onderzoek te doen naar de
werking van DELLA’s in gewassen zoals rijst. Rijst heeft de tweede grootste productie van de
voedselgewassen na maïs en is dus erg belangrijk om voor de groeiende wereldbevolking voedsel te
voorzien (EnsemblePlants, 2014). Het is een monocotyl en bevat slechts één DELLA eiwit: Slender
Rice 1 of SLR1 (Sun, 2011). Dit doet vermoeden dat de SLR1 invloeden in de moleculaire pathways
lichtjes zullen verschillen met die van de DELLA eiwitten in Arabidopsis. Maar naast het feit dat SLR1
ook een belangrijke en soms centrale rol speelt in plantengroei en plantenafweer pathways, zijn er
nog niet veel details opgehelderd (Filipe et al., 2014) (Huu, 2014). Om deze mechanismen uit te
klaren, zijn er in deze masterproef enkele experimenten rond SLR1 uitgevoerd. Zo werd met een Y2H
duidelijk dat SLR1 bindt met de JAZ eiwitten JAZ2 en JAZ9 en dat het JAS domein van het JAZ9 eiwit
noodzakelijk is voor deze interactie. Verder toont een library screening aan dat SLR1 bindt met nog
veel meer andere eiwitten. De functies van deze eiwitten kunnen onderverdeeld worden in drie
groepen: eiwitten die een afweer- of stressrespons induceren, eiwitten die ontwikkelingsprocessen
beïnvloeden en eiwitten die een rol spelen in signaaltransductie en eiwitregulatie. Tenslotte werd er
ook aangetoond dat het SLR1 niveau in rijstbladeren en de behandeling met Pathogen Associated
Molecular Patterns (PAMPs) de afweerrespons en de expressie van afweer gerelateerde genen
beïnvloeden.

iv

v
Summary
DELLA proteins are nuclear transcription regulators that help the plant to divide its energy and
resources between the defense system and growth. This by regulating the cross-talk between several
(hormone signalling) pathways such as the gibberellic acid (GA) pathway, the jasmonic acid (JA)
pathway, the salicylic acid (SA) pathway, etc. DELLAs alter the functioning of those pathways via
regulation of gene transcription and protein interactions that stimulate the function of the other
protein, inhibit it or even lead it to degradation (Sun, 2011) (Itoh et al., 2005). A good example is the
induction of the transcription of JA responsive genes by binding with JAZ proteins (Gao et al., 2011).
But DELLA itself also undergoes regulation: the protein promotes defense over growth, so when
growth is wanted, DELLAs are lead to degradation by the formation of a GA-GID1-DELLA complex in
which the growth hormone GA plays an important role (Gao et al., 2011) (Hirano et al., 2010).
However, most information is gathered with research in the model plant Arabidopsis thaliana, which
contains five DELLA proteins: RGA, GAI, RGL1 (RGA-LIKE 1), RGL2 and RGL3 (Sun, 2011). Since
Arabidopsis thaliana is only a model plant and has no real economic importance, it would be more
interesting to do research about the mechanism of DELLAs in crops such as rice. Rice has the second
highest world production of the staple crops after maize and is thus very important to provide food
for the growing world population (EnsemblePlants, 2014). It is a monocot and contains only one
DELLA protein: Slender Rice 1 or SLR1 (Sun, 2011). This seems to suggest that SLR1 influences in
molecular pathways will be slightly different of those of the DELLA proteins in Arabidopsis. But
besides the fact that SLR1 also plays an important and sometimes central role in pathways of plant
growth and plant defense, not many details are elucidated yet (Filipe et al., 2014) (Huu, 2014). To
clarify these mechanisms, some experiments about SLR1 are performed in this master’s dissertation.
This way, it became clear with a Y2H that SLR1 interacts with the JAZ proteins JAZ2 and JAZ9 and that
the JAS domain of the JAZ9 protein is necessary for this interaction. Further was it shown with a
library screening that SLR1 interacts with many more proteins. The functions of these proteins could
be divided in three groups: proteins that induce a defense or stress response, proteins that influence
developmental processes and proteins that play a role in signal transduction and protein regulation.
Finally, it also has been demonstrated that the level of SLR1 in rice leaves and the treatment with
Pathogen Associated Molecular Patterns (PAMPs) can alter the defense response and the expression
of some defense response related genes.

vi

vii
Table of Contents
WOORD VOORAF .............................................................................................................................................. I
SAMENVATTING .............................................................................................................................................. III
SUMMARY ....................................................................................................................................................... V
TABLE OF CONTENTS ...................................................................................................................................... VII
LIST OF ABBREVIATIONS .................................................................................................................................. IX
INTRODUCTION ................................................................................................................................................ 1
LITERATURE STUDY .......................................................................................................................................... 2
1. ORYZA SATIVA AND PATHOGENS........................................................................................................................ 2 1.1 Oryza sativa.......................................................................................................................................... 2 1.2 Magnaporthe oryzae ............................................................................................................................ 4 1.3 Bipolaris oryzae .................................................................................................................................... 5
2. THE PLANT IMMUNE SYSTEM ............................................................................................................................ 6 2.1 Passive/constitutive defense system .................................................................................................... 6 2.2 Active/inducible defense system .......................................................................................................... 7
2.2.1 Microbial-associated malicular patterns (MAMP)-triggered immunity (MTI) ............................................ 8 2.2.2 Effector-triggered immunity (ETI) ............................................................................................................... 8 2.2.3 The zigzag model ........................................................................................................................................ 9
2.3 Systemic resistance ............................................................................................................................ 10 2.3.1 Systemic acquired resistance .................................................................................................................... 10 2.3.2 Induced systemic resistance ..................................................................................................................... 11
3. PLANT HORMONES AND PLANT IMMUNITY ........................................................................................................ 11 3.1 Salicylic acid ....................................................................................................................................... 11 3.2 Jasmonates......................................................................................................................................... 12 3.3 Ethylene .............................................................................................................................................. 13 3.4 Abscisic acid ....................................................................................................................................... 13 3.5 Cytokinins ........................................................................................................................................... 14 3.6 Auxin .................................................................................................................................................. 14 3.7 Brassinosteroids ................................................................................................................................. 14 3.8 Gibberellins ........................................................................................................................................ 14 3.9 Pathway interactions ......................................................................................................................... 15
4. ROLE OF THE DELLA PROTEIN ........................................................................................................................ 16 4.1 DELLA and plant growth ..................................................................................................................... 17 4.2 DELLA and plant immunity ................................................................................................................. 19 4.3 Other functions of DELLA ................................................................................................................... 20 4.4 DELLA in Rice ...................................................................................................................................... 20
5. INTERACTION PARTNERS OF DELLA ................................................................................................................. 22
OBJECTIVES .................................................................................................................................................... 23
METHODOLOGY ............................................................................................................................................. 24
1. RICE CULTIVARS ........................................................................................................................................... 24 1.1 The used cultivars ............................................................................................................................... 24 1.2 Growing circumstances ...................................................................................................................... 25
2. PATHOGEN INOCULATION AND SCORING ........................................................................................................... 25 2.1 Inoculation with Cochliobolus miyabeanus ........................................................................................ 25 2.2 Scoring of the infection ...................................................................................................................... 25
3. RNA EXTRACTION AND Q RT-PCR .................................................................................................................. 26 3.1 RNA extraction and cDNA synthesis ................................................................................................... 26 3.2 Quantitative RT-PCR ........................................................................................................................... 26
4. VECTOR CONSTRUCTS ................................................................................................................................... 27

viii
4.1 Primer design and construction of DNA fragment ............................................................................. 27 4.2 PCR with Phusion DNA polymerase .................................................................................................... 28 4.3 Restriction digest ................................................................................................................................ 29 4.4 DNA separation on gel and DNA recovery ......................................................................................... 29 4.5 Gateway ® entry clone: BP reaction ................................................................................................... 29 4.6 Gateway ® expression clone: LR reaction ........................................................................................... 30 4.7 Sequencing ......................................................................................................................................... 30
5. TRANSFORMATIONS ..................................................................................................................................... 30 5.1 Escherichia coli ................................................................................................................................... 30 5.2 Plasmid precipitation from E. coli ...................................................................................................... 31 5.3 Yeast ................................................................................................................................................... 31 5.4 Plasmid precipitation from yeast ....................................................................................................... 31
6. YEAST TWO-HYBRID ASSAY ............................................................................................................................. 32 7. SPLIT-YFP .................................................................................................................................................. 32 8. CALLUS TRANSFORMATION ............................................................................................................................ 33
8.1 Electrocompetent Agrobaterium........................................................................................................ 33 8.2 Transformation of Agrobacterium ..................................................................................................... 33 8.3 Callus transformation......................................................................................................................... 33
9. PROTOPLASTS ............................................................................................................................................. 34 9.1 Making protoplasts ............................................................................................................................ 34 9.2 PEG transformation of protoplasts .................................................................................................... 34
10. WESTERN BLOTTING .................................................................................................................................... 34 10.1 Protein extraction .......................................................................................................................... 34 10.2 Electrophoresis .............................................................................................................................. 35 10.3 Blotting .......................................................................................................................................... 35 10.4 Blockage and antibody inoculation ............................................................................................... 35 10.5 Detection ....................................................................................................................................... 36
11. STATISTICAL ANALYSIS ................................................................................................................................... 36
RESULTS AND DISCUSSION ............................................................................................................................. 37
1. PROTEIN INTERACTION PARTNERS OF SLR1 ....................................................................................................... 37 1.1 SLR1 and the SA pathway .............................................................................................................. 37 1.2 SLR1 and the JA pathway (JAZ9) ........................................................................................................ 37
1.2.1 SLR1 and JAZ9 in rice cells ........................................................................................................................ 39 1.2.2 Domains of SLR1 and JAZ9 needed for interaction ................................................................................... 40 1.2.3 RNAi elimination of SLR1 and JAZ9 in Kitaake callus ................................................................................. 43
1.3 SLR1 and the JA pathway (JAZ2 and JAZ3) ......................................................................................... 44 1.3.1 Interaction SLR1 and JAZ2 / JAZ3 in yeast................................................................................................. 44 1.3.2 SLR1 and JAZ2 in rice cells ........................................................................................................................ 45
1.4 SLR1 library screening ........................................................................................................................ 47 2. SLR1 AND PAMP TREATMENTS ..................................................................................................................... 52
2.1 Treatment of Kitaake protoplasts with SLR1-GFP .............................................................................. 52 2.2 Treatment of callus SLR1-YFP rice line ............................................................................................... 54 2.3 Leaf treatment of SLR1 mutant rice lines ........................................................................................... 56 2.4 pH of PAMP treated rice leaves .......................................................................................................... 57 2.5 Infection test with leaves of SLR1 mutant rice lines ........................................................................... 58
CONCLUSIONS ................................................................................................................................................ 61
FURTHER RESEARCH ....................................................................................................................................... 62
REFERENCES ................................................................................................................................................... 64
APPENDIX .......................................................................................................................................................... I
1. MEDIA .......................................................................................................................................................... I 2. VECTORS ..................................................................................................................................................... III

ix
List of abbreviations AA Amino acid
ABA Abscisic Acid
AD DNA Activation Domain
ADP Adenosinediphosphate
ALC ALCATRAZ
3-AT 3-amino-triazol
ATP Adenosinetriphosphate
BD DNA Binding Domain
BR Brassinosteroid
BSA Bovine Serum Albumin
BTH Benzo (1,2,3) thiadiazole-7-carbothioic acid S-methyl ester
BZR1 BRASSINAZOLE RESISTANT1
CK Cytokinin
2,4-D 2,4-Dichlorophenoxyacetic acid
DAMP Damage Associated Molecular Pattern
DNA Deoxyribonucleic Acid
ET Ethylene
ETI Effector Triggered Immunity
ETS Effector Triggered Susceptibility
GA Gibberellin
GB5 Gamborg 5 (medium)
GFP Green Fluorescent Protein
GID Gibberellin Insensitive Dwarf
HR Hypersensitive Response
IAA Indole Acetic Acid
INA 2,6-dichloroisonicotinic acid
ISR Induced Systemic Resistance
JA Jasmonic acid
JAZ Jasmonate ZIM-domain protein
LB Luria-Bertani medium
LPS Lipopolysaccharides
LRR Leucine Rich Repeat
MAMP Microbial Associated Molecular Pattern
MAPK Mitogen Activated Protein Kinases
MeJA Methyl Jasmonate
MeSA Methyl Salicylic Acid
MS Murashige and Skoog medium
MSD MS medium with auxin 2,4-D
x
MTI MAMP Triggered Immunity
NB-LRR Nucleotide Binding Leucine Rich Repeat
N-Ex Amino-terminal extension domain
NPR Nonexpressor of PR genes
PAL Phenylalanine Ammonia Lyase
PAMP Pathogen Associated Molecular Pattern
PEG Poly Ethylene Glycol
PDA Potato Dextrose Agar
PGPR Plant Growth Promoting Rhizobacteria
PIF Phytochrome Interacting Factor
PR Pathogenesis Related
PRR Pattern Recognition Receptor
RLK Receptor Like Kinase
RLP Receptor Like Protein
RNAi RNA-interference
RNI Reactive Nitrogen Intermediates
ROS Reactive Oxygen Species
SA Salicylic acid
SAR Systemic Acquired Resistance
SCL3 ScareCrow-Like3
SLN1 SLENDER 1
SLR1 SLENDER Rice 1
SLY SLEEPY
SPY SPINDLY
Y2H Yeast two Hybrid
YFP Yellow Fluorescent Protein

1
Chapter1
Introduction When improving agricultural systems or traits in crops, it is important to know how molecular
signal transduction pathways operate in crops. This because changes in or in the environment of
plants will mostly have influences on several traits in the plants, which is a consequence of the many
interactions in the complex regulations in a plant, needed for homeostasis. Most changes are done to
make that crops are able to fulfil our needs: first, crop yield has to be increased to meet the food
supply needed for the growing world population. second, novel strategies need to be designed to
reduce the yield losses caused by pests, pathogens and abiotic stresses. To meet these objectives
without creating new problems, understanding the plant is important. When this understanding is
there, successes can be booked. A good example is the green revolution.
The most important pathways in crops are probably the growth and development pathways and
the plant immunity pathways. The first group of pathways is linked to crop yield and the second
group defines the resistances and responses to pests, pathogens and stresses. Mostly, growth and
defense response antagonise each other to divert the energy resources to those pathways that are
most needed at any given time. But as growers, the best outcome in both cases, namely a high yield
and a strong immune response, is wanted. So to develop new crops, new plant protection systems or
agricultural techniques, a good understanding of these pathways and the cross-talk between the
pathways is needed. A lot is already known about the pathways itself, but the cross-talk stays in
many cases unclear. However, it seems that some nuclear proteins, DELLA proteins, play an
important role in this: they can stop growth and development, but can also alter the immune
response, depending on the specific pathogen or stress. There is already a lot known about DELLAs in
Arabidopsis thaliana, but many details and key regulations mechanisms remain unclear.
Most research about DELLA proteins is done in Arabidopsis thaliana, the model plant for dicots.
But for monocots, and especially for monocot crops, it is more interesting to know how the
mechanisms work in rice. Rice is not only a model plant for monocots, it is also a very important crop
in the world that feeds over 3,5 billion people and it will even get more important with the growing
world population (Khush, 2013).
In rice, there is only one DELLA protein, SLENDER RICE 1 or SLR1 and it is known that it has roles in
growth and in the immune response of rice, but how it exactly works still has to be cleared out. The
main objective of this master’s dissertation is to find something more about of the action mechanism
of SLR1 and to help to clear out the biological processes in which SLR1 plays an important role.
2
Chapter 2
Literature Study
1. Oryza sativa and pathogens
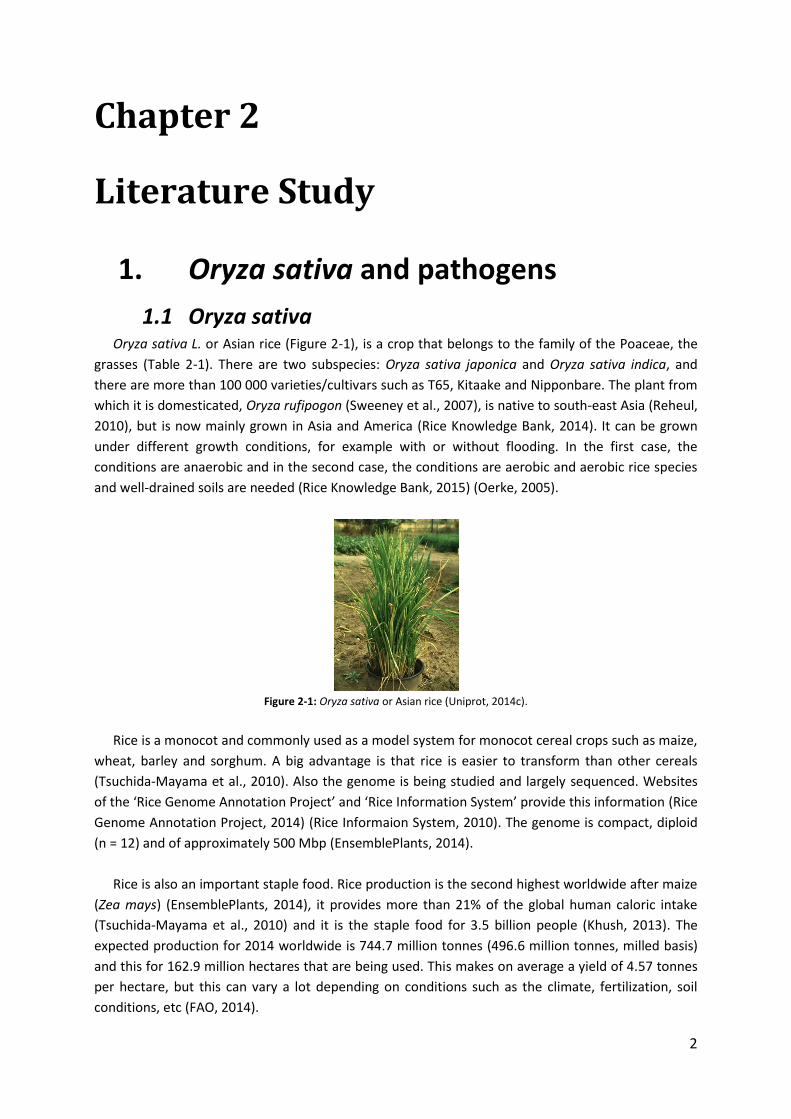
1.1 Oryza sativa Oryza sativa L. or Asian rice (Figure 2-1), is a crop that belongs to the family of the Poaceae, the
grasses (Table 2-1). There are two subspecies: Oryza sativa japonica and Oryza sativa indica, and
there are more than 100 000 varieties/cultivars such as T65, Kitaake and Nipponbare. The plant from
which it is domesticated, Oryza rufipogon (Sweeney et al., 2007), is native to south-east Asia (Reheul,
2010), but is now mainly grown in Asia and America (Rice Knowledge Bank, 2014). It can be grown
under different growth conditions, for example with or without flooding. In the first case, the
conditions are anaerobic and in the second case, the conditions are aerobic and aerobic rice species
and well-drained soils are needed (Rice Knowledge Bank, 2015) (Oerke, 2005).
Figure 2-1: Oryza sativa or Asian rice (Uniprot, 2014c).
Rice is a monocot and commonly used as a model system for monocot cereal crops such as maize,
wheat, barley and sorghum. A big advantage is that rice is easier to transform than other cereals
(Tsuchida-Mayama et al., 2010). Also the genome is being studied and largely sequenced. Websites
of the ‘Rice Genome Annotation Project’ and ‘Rice Information System’ provide this information (Rice
Genome Annotation Project, 2014) (Rice Informaion System, 2010). The genome is compact, diploid
(n = 12) and of approximately 500 Mbp (EnsemblePlants, 2014).
Rice is also an important staple food. Rice production is the second highest worldwide after maize
(Zea mays) (EnsemblePlants, 2014), it provides more than 21% of the global human caloric intake
(Tsuchida-Mayama et al., 2010) and it is the staple food for 3.5 billion people (Khush, 2013). The
expected production for 2014 worldwide is 744.7 million tonnes (496.6 million tonnes, milled basis)
and this for 162.9 million hectares that are being used. This makes on average a yield of 4.57 tonnes
per hectare, but this can vary a lot depending on conditions such as the climate, fertilization, soil
conditions, etc (FAO, 2014).
3
Table 2-1: Taxonomy of rice (Oryza sativa) (Integrated Taxonomic Information System, 2014).
Taxonomy Asian Rice
Superkingdom Eukaryota
Kingdom Plantae
Subkingdom Viridaeplantae
Infrakingdom Streptophyta
Division Tracheophyta
Subdivision Spermatophytina
Infradivision Angiospermae
Class Magnoliopsida
Superorder Lilianae
Order Poales
Family Poaceae
Genus Oryza L.
Species Oryza sativa L.
Rice yield gradually rose over the past 40 years, due to the technical advances of the green
revolution. The adoption of these techniques was facilitated by irrigation facilities, availability of
inorganic fertilizers and benign government policies (Khush, 2005). Nevertheless, the rise in yield has
been smaller and smaller: in 1970-1990 the growth in yield was 2.3% per year, but has fallen to 1.5%
during 1990s and to < 1.0% during the first decade of present century. This can cause problems since
in 2035, a yield of 852 million tons will be needed for the growing population. Further, extra
fertilization is limited and area to plant rice has reduced because of conversion of land for housing,
industries and highways. Possible solutions are breeding rice for a better yield or managing pest
control (Khush, 2013).
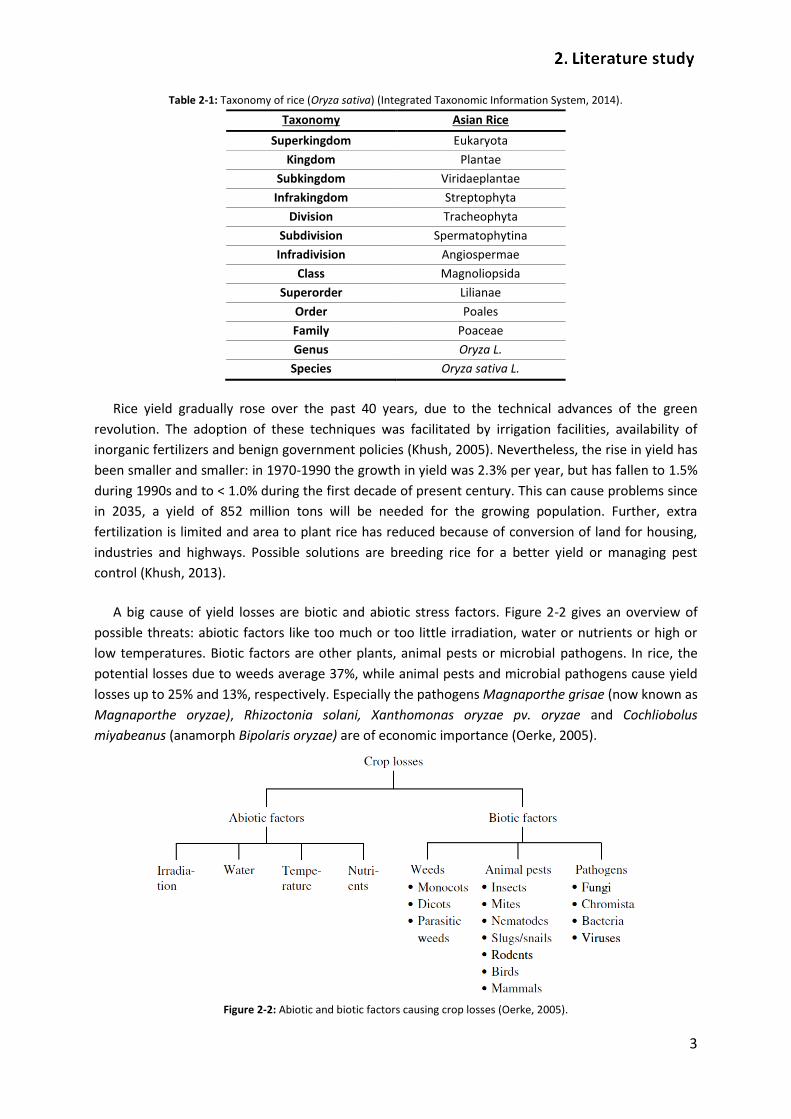
A big cause of yield losses are biotic and abiotic stress factors. Figure 2-2 gives an overview of
possible threats: abiotic factors like too much or too little irradiation, water or nutrients or high or
low temperatures. Biotic factors are other plants, animal pests or microbial pathogens. In rice, the
potential losses due to weeds average 37%, while animal pests and microbial pathogens cause yield
losses up to 25% and 13%, respectively. Especially the pathogens Magnaporthe grisae (now known as
Magnaporthe oryzae), Rhizoctonia solani, Xanthomonas oryzae pv. oryzae and Cochliobolus
miyabeanus (anamorph Bipolaris oryzae) are of economic importance (Oerke, 2005).
Figure 2-2: Abiotic and biotic factors causing crop losses (Oerke, 2005).

4
The rice pathogens Magnaporthe oryzae and Bipolaris oryzae will be discussed in the next
sections because these cause severe problems and will be used in this work.
1.2 Magnaporthe oryzae The filamentous fungus Magnaporthe oryzae is a specie from the family of the Magnaporthaceae
(Table 2-2) and causes rice blast disease. It can infect rice, millets and other grasses. Rice blast
disease is the most important disease in rice that effects the global rice production and causes huge
losses. The disease causes leaf lesions that first have a white or grey-green center and a darker green
border. These evolve to greater diamond-shaped lesions with a grey or white center and brown
borders (Wilson et al., 2009).
Magnaporthe oryzae is used as a model organism for investigating fungal plant diseases because
of its huge economic importance (it causes serious pests in rice) ant its genetic tractability (both the
genomes of rice and M. oryzae are sequenced) (Wilson et al., 2009).
Table 2-2: Taxonomy of Magnaporthe oryzae (Uniprot, 2014b).
Taxonomy Magnaporthe oryzae
Superkingdom Eukaryota
Kingdom Fungi
Subkingdom Dikarya
Phylum Ascomycota
Subphylum Pezizomycotina
Class Sordariomycetes
Subclass Sordariomycetidae
Order Magnaporthales
Family Magnaporthaceae
Genus Magnaporthe
Species Magnaporthe oryzae
The fungus can attack rice plants at all stages of development and it can infect leaves, stems
nodes, panicles and even roots. The infection begins with a conidium that consists out of three cells
(Figure 2-3). Following germination, the conidia differentiate into a germ tube which grows over the
leaf surface until it transforms into an appressorium. The appressorium will build up turgor which is
translated in mechanical force that is used to form a penetration peg through the cuticle. After
entering the tissue, hyphae grow into the plasma membrane and invade epidermal cells. Cell-to-cell
movement occurs via plasmodesmata. The invasion and movement of the fungus cause the disease
lesions. Sporulation occurs under humid conditions and from disease lesions. The spores can spread
via the wind and rain and infects rapidly other plants (Wilson et al., 2009).
Magnaporthe oryzae is a hemibiotrophic pathogen (more explanation under 2. The plant immune
system): first it has a biotrophic stage, but later on when the lesions come more apparent, it
becomes necrotrophic (Wilson et al., 2009).

5
Figure 2-3: Life cycle of Magnaporthe oryzae (Wilson et al., 2009).
1.3 Bipolaris oryzae Bipolaris oryzae is the asexual form (anamorph) of a fungus that causes brown spot disease in
rice. The taxonomy can be found in Table 2-3. The sexual reproductive stage (teleomorph) is called
Cochliobolus miyabeanus. A property of this anamorph of Bipolaris is that the spores germinate at
both sides (Figure2- 4) (Tazick et al., 2013).
Table 2-3: Taxonomy of Bipolaris oryzae (Uniprot, 2014a).
Taxonomy Bipolaris oryzae
Superkingdom Eukaryota
Kingdom Fungi
Subkingdom Dikarya
Phylum Ascomycota
Subphylum Pezizomycotina
Class Dothideomycetes
Subclass Pleosporomycetidae
Order Pleosporales
Suborder Pleosporineae
Family Pleosporaceae
Genus Bipolaris
Species Cochliobolus miyabeanus /
Bipolaris oryzae
Brown spot disease that is caused by the fungus can be found on the leaves, the glumes, stems
and grains on seedling to adult plants. Typical symptoms on the leaves are lesions. These are evenly
distributed, oval-shaped, up to 1 cm. In the beginning, they are small and dark brown, but they
become larger, brown with gray centres (Plantwise Knowledge Bank, 2014).

6
Figure 2-4: A Bipolaris spore that germinates on both sides (Phytopathology Practice, 2013).
2. The plant immune system
Plants have to cope with several threats like abiotic stress, herbivores, nematodes, viruses,
bacteria, fungi, etc (Figure 2-2). When the (phyto)pathogen causes a disease or symptoms on a plant,
this plant is called a ‘susceptible host’. Other plants have a resistance against the pathogen and can
avoid disease. The resistance can be spread in the whole plant species and is against al the isolates of
the pathogen (non-host plant) or is only present in specific plant cultivars within a plant species
(resistant host plant) (Muthamilarasan et al., 2013)(Senthil-Kumar et al., 2013)(Heath, 2000).
Considering their lifestyles, pathogens can be divided in three groups: necrotrophs, biotrophs and
hemibiotrophs. Necrotrophs will kill the host or cells of the host and feeds itself with the nutritive
materials that are being released. Biotrophs need the host to be alive to provide nutrients for the
pathogen and to complete their lifecycle. Hemibiotrophs first need a living host but later on in the
infection they will kill the host tissues. Bacteria and fungi can either be biotrophic or necrotrophic.
Virusses are mostly biotrophic, but can in some cases be necrotrophic or hemibiotrophic
(Muthamilarasan et al., 2013)(Pieterse et al., 2012).
In order to survive, a plant has to defend itself against these pathogens. But unlike mammals, they
lack mobile defender cells and a somatic adaptive immune system. Instead, plants rely on a innate
immune system that is present in each cell and on systemic signals. This so-called innate immunity
can be divided in a passive/constitutive defense system and an active/inducible system (Jones et al.,
2006).
Plant defense against viruses is mostly achieved through RNA interference (RNAi), transcriptional
gene silencing and post-transcriptional gene silencing. However, these mechanisms are not relevant
for this thesis and therefore will not be addressed in this literature study.
2.1 Passive/constitutive defense system Pathogens invade plants to gain access to plant nutrients and to replicate. Before they can do this,
they need to enter the host plant tissue. For viruses this is only possible with the help of vectors like
insects, who injure the plant to get for example nutrients and when they enter the plant tissue, the
viruses enter with them. Once they are in the cells, the viruses can spread systematically via

7
intracellular or symplastic movement through the plasmodesmata or with the help of movement
proteins.
Bacteria do not need the help of vectors: they move via aerotaxis and/or chemotaxis towards the
host plant and enter the cells through wounds, trichomes or natural openings like stomata, lenticels
or hydathodes. After entering the plant, they live and spread through the apoplast.
Fungi also do not need vectors: they form modified hyphae that are used as infection structures.
Fungi can enter by wounds and natural opening, but most fungi adhere to the cuticle and form a
germ tube with at the end an appressorium. This structure will with the help of enzymes that soften
the cell wall, penetrate the cell wall and grow into the apoplast. There, it can feed itself on leaked
nutrients or enter the cell with a haustorium (Muthamilarasan et al., 2013).
In other words, the pathogens have to pass the natural barriers of the plant before they can infect
the tissue. These barriers can be physical or chemical in nature and are present all the time: they are
the passive or constitutive defense system. Examples of physical barriers are the wax layer on the
outside of the cuticle, rigid cell walls, lignin, bark and cuticular lipids. Chemical compounds in the
passive defense system can be antimicrobial enzymes or phytoanticipins like glucosinolates or
tannins and secondary metabolites. The systems is supposed to stop both host as well as non-host
pathogens (Muthamilarasan et al., 2013)(Höfte, 2014)(Höfte, 2015).
2.2 Active/inducible defense system Although the passive defense system stops most potential pathogens, some virulent strains
succeed at entering the host plant tissue. Once inside the plant, they have to cope with the inducible
or active defence system: a system that can be turned on by the attack of a pathogen and that is
used by the plant to stop the pathogen on a general or specific manner. Examples of inducible plant
defenses are the production of phytoalexines, a hypersensitive response (HR, rapid cell death) and
associated production of reactive oxygen species and antimicrobial proteins, or structural changes
like cell wall modifications, papillae or wound plug formation, tylose formation in xylem vessels or
formation of cork layers (Höfte, 2015).
But before it can be active, the defense system has to be triggered. This is done by recognizing
elicitors that are from endogenous or microbial origin. Endogenous elicitors or Damage Associated
Molecular Patterns (DAMPs) are released from the plant itself by enzymes from the pathogen. These
are only present when a pathogen attacks and are associated with damage to the tissue, for example
parts of a damaged cuticle after attack with cutinase (Serrano et al., 2014). Other, more general
elicitors, are directly associated or even a part of the pathogen: Pathogen Associated Molecular
Patterns (PAMPs) or Microbial Associated Molecular Patterns (MAMPs). The more general term
MAMPs will further be used instead of PAMPs. Both DAMPs as MAMPs will trigger the MAMP
Triggered Immunity or MTI.
Another possibility is the recognition of race specific elicitors or effector proteins. This will trigger
the Effector Triggered Immunity that will act more specific against certain pathogens (Höfte, 2015)
(Muthamilarasan et al., 2013).

8
2.2.1 Microbial-associated malicular patterns (MAMP)-
triggered immunity (MTI) Like mentioned before, MTI is the immune response that is triggered after the recognition of
MAMPs or DAMPs. The DAMPs can be present after plant tissues have been damaged by lytic
enzymes of the pathogen. MAMPs can only be sensed if the pathogen itself is in the neighbourhood.
It are mostly structures or components that are specific and necessary for micro-organisms. MAMPs
can be conserved through all pathogen classes or can be specific for one pathogen family. Examples
are flagellin, lipopolysaccharides (LPS), xylanase, etc. A MAMP can also be recognized in various host
plants or the recognition is specific for one plant family or even species (Muthamilarasan et al.,
2013).
The surface receptor proteins that can recognize the PAMPs and MAMPs are called Pattern
Recognition Receptors or PRRs. This family of receptors includes receptor-like kinases (RLK) and
receptor-like proteins (RLP). RLK consist of a extracellular ligand-binding domain with a leucine rich
repeat (LRR), a single transmembrane domain and an intracellular serine/threonine kinase domain.
RLP also have an extracellular and a transmembrane domain, but because they lack an intracellular
domain, they need interaction with adaptor molecules. After phosphorylation of the kinase(s) in the
PRR, a MAPK cascade is activated. This leads to the activation of transcription factors of the WRKY
family. These have a conserved region of WRKYGQK and a zinc-finger pattern, which allows them to
bind DNA: they bind with W-box motifs in promoters of denfense-related genes (Muthamilarasan et
al., 2013)(Heath, 2000).
As a consequence of the recognition and the signal cascade, several responses are induced. A first
main response of MTI is the alkalinisation of the growth medium. This, and especially the higher Ca2+
concentration, plays an important role in mediating other defense responses. Further, the stomata
are being closed, there is a decrease in photosynthesis to limit the carbon source availability for the
pathogen and between cell wall and plasma membrane, there is callose deposition to limit the
penetration of the pathogens. Also a nitrosative and oxidative burst can occur: this is the production
of reactive nitrogen intermediates (RNIs) and ROS at the cell surface that can induce a HR.
A last important response is the biosynthesis of hormones like salicylic acid (SA), jasmonic acid
(JA) and ethylene (ET) (Muthamilarasan et al., 2013).
2.2.2 Effector-triggered immunity (ETI) If pathogens want to survive, they have to overcome the MTI. Producing effectors (Avr proteins)
and injecting them (15-30) in the host cells through the type III secretion system, is a solution to
overcome MTI. One single bacteria can produce up to 50 very different effectors and fungi
sometimes even 500 (Höfte, 2014). Once these effectors enter a plant cell, they contribute to the
pathogen virulence by acting as transcription factors, affecting histone packing and chromatin
configuration or targeting host transcription factors or they suppress the plant’s immune response at
all possible steps of the signalling cascade (Muthamilarasan et al., 2013).
Because the effectors are highly specific, the receptors also have to be very specific. In ETI, these
specific receptors are the products of the host disease resistance (R) genes, called the R proteins. Like

9
the RLK proteins of the MTI, a lot of these R proteins are intracellular nucleotide binding LRR (NB-
LRR) proteins. The other R proteins are extracellular LRR proteins (Muthamilarasan et al., 2013).
The R receptors can recognize an effector by direct physical interaction or by indirect interaction
mediated by accessory-proteins that can be associated with effector-induced modifications. The
interaction induces a ADP/ATP exchange and/or phosphorylation and starts a signalling cascade. This
signalling cascade shows similarities with the downstream ETI response: there is activation of a MAPK
cascade and activation of WRKY transcription factors. Further, also a part of the responses is the
same as in MTI: the production of SA, JA and ET, cell wall strengthening, production of anti-microbial
compounds, although some will be more specific and lignifications. The SA will bind to the receptor
NPR3 (NONEXPRESSOR OF PR GENES3) with low affinity and mediates the degradation of cell-death
suppressor NPR1, what leads to a HR (Muthamilarasan et al., 2013).
The NB-LRR mediated disease resistance or ETI is mostly effective against biotrophs and
hemibiotrophs but not against necrotrophs as the HR stimulates attack by necrotrophic pathogens
(Jones et al., 2006).
2.2.3 The zigzag model The MTI and ETI can be summarized in what is known as the ‘zigzag model’ (Figure 2-5).
Figure 2-5: The plant immune system ‘zigzag’ model. First will the plant detect MAMPs, PAMPs and DAMPs and stop the
pathogen with MTI/PTI. The pathogen answers with effectors and makes the plant susceptible. Via R genes, the plant can
detect some effectors and initiates ETI. The effectors that are being recognized will be modified or disappear which makes
the plant back susceptible, but the plant gets new R genes and ETI is back used, etc. The effect of ETI is each time faster and
stronger till a certain limit (Zvereva et al., 2012).
In the first step of the zigzag model, the MTI or PTI step, the plant recognizes MAMPs, PAMPs or
DAMPs and induces an immune response against the pathogen. The pathogen answers with
effectors: the plant is again susceptible. This is called effector triggered susceptibility (ETS). But the

10
plant can recognize one or more of these effectors with NB-LRR proteins (in)directly. An immune
response is initiated that is similar to that of the MTI/PTI, but is faster and stronger. In the next step,
the pathogen will get rid of that specific effector, it will be altered or new effectors are formed of
which some will suppress the ETI. Plant infection is then again possible, until the plant gets new
specific R genes via natural selection or via breeding and initiates a new ETI. The pathogen can again
change its effectors, etc. (Jones et al., 2006).
2.3 Systemic resistance A plant can attack a pathogen at the infection site itself (local defense), but it can also ‘prepare’
the rest of the plant for a pathogen infection. This will result in a faster response by that other parts.
There is knowledge about two sorts of systemic resistance: Systemic Acquired Resistance or SAR and
Induced Systemic Resistance or ISR. In both cases, the resistance is induced by elicitors or molecules
related to infection like effectors, and it results in a resistance or tolerance against pathogens or
parasites. But the elicitors are different likewise the regulatory pathways involved (Vallad et al.,
2004).
2.3.1 Systemic acquired resistance Systemic acquired resistance is a phenomenon whereby disease resistance is induced in the whole
plant, while the infection is at one spot. It is a long-lasting, sometimes for the lifetime of the plant,
and broad-spectrum resistance and is activated by the pathogens who attack the plant at a certain
place. The onset of SAR can be triggered by PTI- and ETI mediated pathogen recognition and it can
also be induced by chemical compounds like benzo (1,2,3) thiadiazole-7-carbothioic acid S-methyl
ester (BTH) or 2,6-dichloroisonicotinic acid (INA). Depending on the plant and the type of elicitor, it
takes a period of time for the SAR is set (4-6 hours) and it requires an intact cuticle to percept the
SAR signal (Durrant et al., 2004)(Hammerschmidt, 1999)(Kachroo et al., 2013)(Vallad et al., 2004).
SAR requires an endogenous accumulation of SA which will lead to chromatin modifications and
to transcriptional reprogramming of a battery of genes encoding for pathogenesis-related (PR)
proteins. The SA accumulation is needed in the signal perceiving systemic tissue, but is produced at
the infection site as the volatile methyl-SA (MeSA). MeSA moves from cell to cell via plasmodesmata
or through the phloem, but can also be transported through the air. The movement process is light-
regulated what means that it is only present/produced when the plant receives light. Once it reached
its destination, the MeSA is turned into SA and SA binds to the high-affinity receptor NPR4 instead of
binding to low-affinity NPR3. SA prevents this way the degradation of NPR1 which stops HR and
favours cell survival and expression of systemic immunity-related genes by entering the nucleus and
interacting with TGA transcription factors (Durrant et al., 2004) (De Vleesschauwer et al., 2009). SAR
also favours a suitable immune response by participating in the cross-talk between SA- and JA-
dependent defense pathways. The genes that are activated downstream of SA, can be divided into
two groups: immediate-early genes who were activated in 30 min or genes that are induced later
(Muthamilarasan et al., 2013).
Besides MeSA, also another complex is important as mobile signal: a complex formed between
the lipid transfer protein DIR1 and glycerolipid or lipid derivatives (Liu et al., 2011) (Durrant et al.,

11
2004). Further, also the components dicarboxylic acid, azelaic acid, abietane diterpenoid,
dihydroabetinal and glycerol-3-phosphate seem to play a role in SAR (Kachroo et al., 2013).
Finally, SAR is believed to also have transgenerational benefits: an immune ‘memory’ is passed on
to the next generation (Kachroo et al., 2013).
2.3.2 Induced systemic resistance ISR is associated with the colonization of plant growth promoting rhizobacteria (PGPR), which are
symbiotic root-colonizing bacteria such as Bacillus, Pseudomonas and Serratia, and non-pathogenic
root-colonizing fungi such as Trichoderma. The signal in most cases does not depend on SA (in some
plants such as tomato and tobacco it nevertheless does), but on the pathways regulated by
jasmonate and ethylene. It does not activate any PR genes, but it makes the plant alert for a
pathogen attack that may occur: priming. After the attack, the tissue will start the defense response
faster and sometimes more strongly than non primed tissue (Höfte, 2015) (Hammerschmidt, 1999)
(Conrath et al., 2002).
ISR is effective against a broad range of pathogens, but the PGPR are only able to induce ISR in
certain plant species and genotypes (Vallad et al., 2004).
An immune response like SAR means a lower crop yield or a lower plant growth. This because the
plant has to put its energy in making immunity proteins. For this reason, ISR is somewhat better. The
immune response is faster, but only induced when a pathogen effectively attacks (Vallad et al.,
2004).
3. Plant hormones and plant immunity
Like mentioned before, plant hormones or phytohormones play important roles in plant
immunity: they and the interaction between their pathways are needed in the signalling cascade or
in the formation of the response. This in a pathogen dependent specific and energy efficient way.
This last aspect is important because producing components for defense costs energy what is
detrimental to the plant growth.
Salicylic acid, jasmonic acid and ethylene are the classical immunity hormones, but also others,
under which some growth-controlling hormones, are found to be needed by interacting with the SA
and JA pathways. The most important ones are discussed shortly.
Most findings rely on dicots because of the research in Arabidopsis thaliana, but recently there is
more research in the monocot rice. This is important because it appears that there are differences in
the role of the hormones in different plants.
3.1 Salicylic acid SA is a phenolic phytohormone (Figure 2-6) that plays a role in thermogenesis, flowering, plant
defense signalling and SAR. The endogenous concentrations can vary a lot: in tobacco (Nicotiana
tabacum) and Arabidopsis the basal levels found are around 50 ng/g fresh weight what is very low in

12
comparison with rice which has basal levels of 8-37 µg/g fresh weight. This high concentration works
like an antioxidant that prevents oxidative damage in the plant (Yang et al., 2004).
However, the levels of SA in tobacco and Arabidopsis can rise a lot in response to pathogen
attack. This in contrast with rice where the defense responses are more dependent on the SA
signalling but less on the SA level (Yang et al., 2013)(De Vleesschauwer et al., 2014).
SA seems to be the key hormone in the resistance against biotrophs (De Vleesschauwer et al.,
2013).
Figure 2-6: Chemical structure of the plant hormone salicylic acid (Merz Pharmaceuticals, 2002).
Some downstream components of the signalling pathway in rice are the same as in Arabidopsis:
NPR1, WRKY45 and WRKY13. All three of them are in rice associated with resistance against
Magnaporthe oryzae, rice blast disease. The WRKY gene WRKY13 modulates the expression of SA
biosynthetic and responsive genes. The transcription factor gene WRKY45 plays an essential role in
SA-mediated defense responses complementary to NPR1, but works independent of NPR1.
NPR1 itself is a key regulator in SA-dependent immunity response and many SA-responsive genes
are dependent on NPR1. It is regulated by SA which modulates NPR1 protein levels through the
ubiquitin/26S proteasome system and regulates the trafficking of the protein from the cytoplasm
into the nucleus. There, NPR1 activates transcription factors and so defense genes (De
Vleesschauwer et al., 2013) (Yang et al., 2013).
3.2 Jasmonates Jasmonates, like JA and methyl jasmonate (MeJA) are lipid-derived regulators (Figure 2-7) that
play essential roles in plant defense and (growth) developmental processes. In a lot of plant species,
the immune response against abiotic stress, necrotrophic pathogens, insect herbivores and
nematode pathogens is related with JA. In this cases, this plant hormone acts together with ET and
antagonizes SA-mediated biotroph resistance (Yang et al., 2013).
In Arabidopsis, two major branches of the JA signalling pathway are recognized: the MYC branch
and the ERF branch. The MYC branch is controlled by MYC-type transcription factors and the ERF
branch by members of the APETALA2/ETHYLENE RESPONSE FACTOR (AP2/ERF) family of transcription
factors. Activation of the ERF branch requires both JA and ET signalling. In general, ERF is associated
with enhanced resistance to necrotrophs, whereas MYC is associated with wound response, defence
against insect herbivores and ISR (Pieterse et al., 2012).
However, in rice JA has a slightly different role: it promotes resistance against pathogens with
diverse lifestyles and infection strategies. This way, JA is not only correlated with resistance against
necrotrophs, but also against biotrophs and hemi-biotrophs (De Vleesschauwer et al., 2013).
13
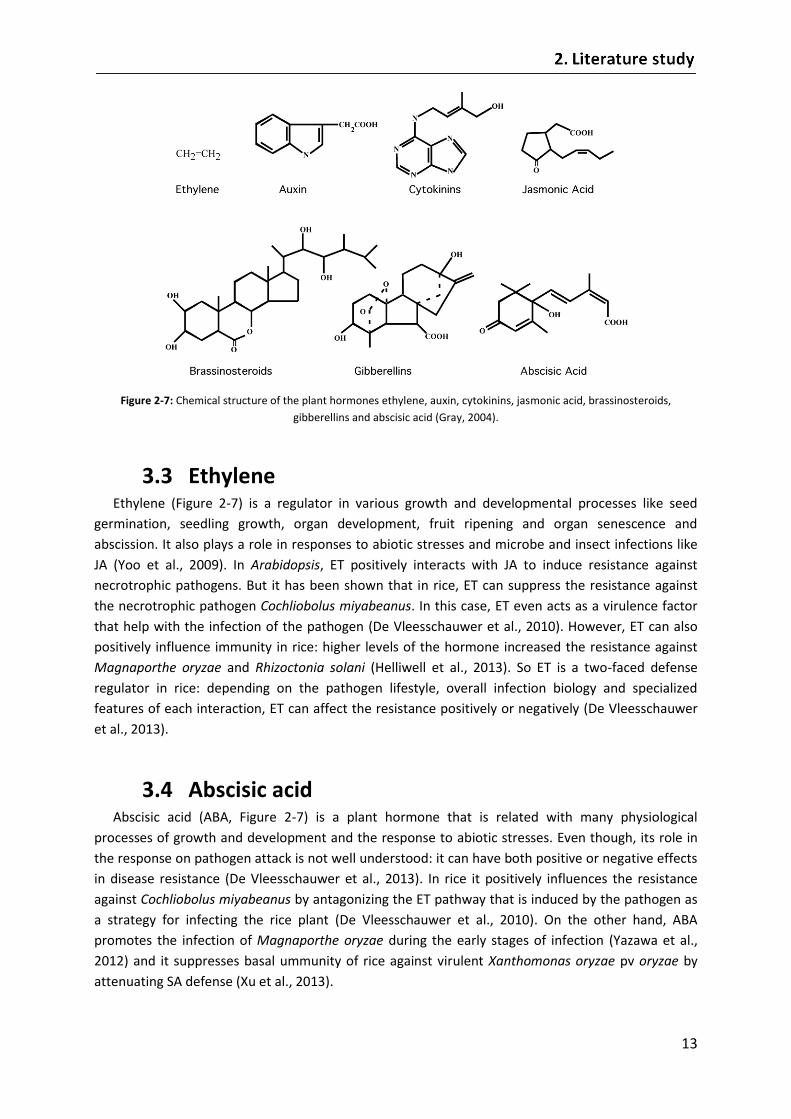
Figure 2-7: Chemical structure of the plant hormones ethylene, auxin, cytokinins, jasmonic acid, brassinosteroids,
gibberellins and abscisic acid (Gray, 2004).
3.3 Ethylene Ethylene (Figure 2-7) is a regulator in various growth and developmental processes like seed
germination, seedling growth, organ development, fruit ripening and organ senescence and
abscission. It also plays a role in responses to abiotic stresses and microbe and insect infections like
JA (Yoo et al., 2009). In Arabidopsis, ET positively interacts with JA to induce resistance against
necrotrophic pathogens. But it has been shown that in rice, ET can suppress the resistance against
the necrotrophic pathogen Cochliobolus miyabeanus. In this case, ET even acts as a virulence factor
that help with the infection of the pathogen (De Vleesschauwer et al., 2010). However, ET can also
positively influence immunity in rice: higher levels of the hormone increased the resistance against
Magnaporthe oryzae and Rhizoctonia solani (Helliwell et al., 2013). So ET is a two-faced defense
regulator in rice: depending on the pathogen lifestyle, overall infection biology and specialized
features of each interaction, ET can affect the resistance positively or negatively (De Vleesschauwer
et al., 2013).
3.4 Abscisic acid Abscisic acid (ABA, Figure 2-7) is a plant hormone that is related with many physiological
processes of growth and development and the response to abiotic stresses. Even though, its role in
the response on pathogen attack is not well understood: it can have both positive or negative effects
in disease resistance (De Vleesschauwer et al., 2013). In rice it positively influences the resistance
against Cochliobolus miyabeanus by antagonizing the ET pathway that is induced by the pathogen as
a strategy for infecting the rice plant (De Vleesschauwer et al., 2010). On the other hand, ABA
promotes the infection of Magnaporthe oryzae during the early stages of infection (Yazawa et al.,
2012) and it suppresses basal ummunity of rice against virulent Xanthomonas oryzae pv oryzae by
attenuating SA defense (Xu et al., 2013).

14
3.5 Cytokinins Cytokinins (CK, Figure 2-7) play a dual role in plants: they can influence plant immunity in a
positive or negative way. Besides that, they are also important in plant growth processes (De
Vleesschauwer et al., 2013).
3.6 Auxin Like cytokinins, also auxins (Figure 2-7) are growth hormones. But besides that, they also induce
susceptibility to biotrophs in dicots and in rice. In rice, the main auxin indole acetic acid (IAA) appears
to be a virulence factor of the (hemi)biotrophs Magnaporthe oryzae and Xanthomonas oryzae pv.
oryzae (Fu et al., 2011). In Arabidopsis, auxin acts by repressing SA levels and signalling (also the
opposite can happen: SA represses disease by down-regulating auxin signalling (Wang et al., 2007)),
but in rice auxin-induced biotroph susceptibility is independent of changes in SA or in JA signalling. In
case of necrotrophic pathogens, auxin promotes resistance in Arabidopsis, but its role in rice is not
clear yet (De Vleesschauwer et al., 2013).
3.7 Brassinosteroids Brassinosteroids (BRs) are polyhydroxylated steroid hormones (Figure 2-7) that promote growth,
developmental and physiological processes, but also seem to play a role in immunity and in reaction
to abiotic stresses. BRs act SA-independent and in a complex way: the response is independent of the
plant species and the pathogen involved. What is sure is that BRs can obstruct MAMP-triggered
immunity, both in Arabidopsis as in rice (De Vleesschauwer et al., 2013).
The BR-signalling output is shaped by the activity of transcription factors like BZR1 that migrate to
the nucleus and there bind to BR-responsive promoters. This BZR1 is a key factor in the BR pathway
and can suppress PAMP-induced immune signalling. This by activating WRKY genes who negatively
regulate PAMP-triggered reactive oxygen species (ROS) production and gene expression (De Bruyne
et al., 2014).
3.8 Gibberellins Gibberellins (GA, Figure 2-7) are tetracylic diterpenoid plant hormones that regulate a variety of
growth and developmental processes including seed germination, flower initiation, flower, fruit and
seed development and vegetative growth. Gibberellins have been found in vascular plants, in fungi
and in bacteria too. However, only a few GAs species are active growth regulators (Figure 2-8) while
others are biosynthetic intermediates or catabolites of bioactive GAs (Sun, 2011) (Yang et al., 2013).
The hormone was first identified in the fungal pathogen Gibberella fujikuroi which causes the
‘foolish seedling’ disease in rice, also called ‘bakanae rice’ which is highly elongated rice. GA also has
its role in the green revolution: the dwarfing traits in these crops were caused by alterations in GA
biosynthesis or in the GA response (Sun, 2011).

15
Figure 2-8: Some bioactive GAs in seed plants. GA3 is the most abundant active GA made in fungi, GA4 is the major active GA
in Arabidopsis thaliana (Sun, 2011).
GAs are also related with plant immunity via proteins called DELLAs: GA promotes growth via
degradation of DELLAs. DELLA itself promotes resistance to necrotrophs and susceptibility against
biotrophs in Arabidopsis by balancing of SA and JA signalling. In rice, however, GA undermines the
resistance against (hemi)biotrophs in rice, so DELLA positively regulates disease resistance. This
happens via crosstalk with the JA-pathway and more precisely via the jasmonate ZIM-domain or JAZ
proteins (De Vleesschauwer et al., 2013) (Yang et al., 2013).
3.9 Pathway interactions The best known pathway interaction in the defense system is the cross-talk between SA and JA (or
SA versus JA and ET). This cross-talk is antagonistic although exceptions are known. Mostly, a binary
model with SA and JA/ET having opposite functions is proposed (Figure 2-9, left). It also seems that
this SA-JA negative cross-talk is conserved in rice, although here, both hormones can also work
together against both biotrophic and necrotrophic pathogens (De Vleesschauwer et al., 2013).
A key regulatory protein in this cross-talk is the above mentioned NPR1. NPR1 stimulates
activation of the SA pathway and SA-responsive genes when located in the nucleus, but suppresses
the biosynthesis of JA and antagonizes JA-responsive gene expression when it is present in the
cytosol. It can be concluded that NPR1 positively regulates SA-dependent pathogen resistance, but at
the same time, it prevents JA-mediated defences to herbivorous insects and abiotic stress tolerance
(Yuan et al., 2007) (Li et al., 2013) (Pieterse et al., 2009).
Also other of the earlier discussed hormones go in crosstalk with hormone pathways. ABA for
example generally antagonizes the SA pathway via repressing of NPR1 and WRKY45 (Yang et al.,
2013), interacts with ET and influences positively the JA pathway. But in some cases these
statements do not hold: the interaction of ABA with the other pathways is attacker dependent and
can be more complex (De Vleesschauwer et al., 2012) (Nahar et al., 2013).
The growth hormone GA works antagonistically with both BR and JA via the DELLA protein(s). BR
itself interferes negatively with SA and JA by antagonizing these pathways downstream and upstream
of the hormone synthesis (De Vleesschauwer et al., 2012).
Figure 2-9 shows the general accepted model of hormone defense networking in Arabidopsis
thaliana. In this plant species, the main pathways are those of SA and JA/ET who activate the right
responses against pathogens with a certain lifestyle or infection strategy. The other plant hormones
play a positive or negative role in these responses. In rice however, the pathway-interactions are

16
more complex (Figure 2-9, right) and the general responses of the pathways cannot be divided in
classes dependent on the lifestyle of the pathogen (De Vleesschauwer et al., 2013).
Figure 2-9: General model about the hormone defense networking in the model plants Arabidopsis thaliana (left) and Oryza
sativa (right). Positive and negative regulatory actions are indicated by respectively arrows and lines with bars. Plus signs
indicate synergistic signal interactions and minus signs refer to antagonistic crosstalk. Hormone abbreviations: ABA, abscisic
acid; BR, brassinosteroid; CK, cytokinin; ET, ethylene; GA, Gibberellic acid; JA, jasmonic acid; SA, salicylic acid. Pathogen
abbreviations: Ab, Alternaria brassicicola; Bc, Botrytis cinerea; Cm, Cochliobolus miyabeanus; Ec, Erwinia carotovora; Eo,
Erysiphe orontii; Ha,Hyaloperonospora arabidopsidis; Mo, Magnaporthe oryzae; Pg, Pythium graminicola; Pi, Pythium
irregular; Ps, Pseudomonas syringae; Rs, Rhizactonia solani; Xoo, Xanthomonas oryzae pv. oryzae
(De Vleesschauwer et al., 2013).
4. Role of the DELLA protein
Phytohormones do not only play important roles in the immune system / response of the plant,
but also influence plant growth and physiological processes. The most important hormone in plant
growth is GA. The cross-talk between growth and the immune system and between the many
different pathways and hormones, happens with the help of other proteins. DELLAs, which are
nuclear transcription regulators, seem to play such a role. Their function is not yet completely clear,
but it is sure that DELLAs help the plant to divide its energy and resources between the defense
system and growth.
The number of DELLA proteins / orthologs differs from plant to plant. In Arabidopsis thaliana for
example, there are five DELLAs: RGA, GAI, RGA-LIKE 1 (RGL1), RGL2 and RGL3. In monocots to the
contrary, there is only one DELLA protein. In rice, this is called SLENDER1 (SLR1) and in barley,
SLENDER (SLN1) (Sun, 2011). Other DELLA homologs are: RHT (wheat), D8 (maize), LeGAI (tomato),
VvGAI1 (grape) and LA and CRY (pea) (Davière et al., 2008).
DELLA proteins belong to a subfamily of the plant-specific GRAS proteins who are a family of
regulatory proteins / transcription regulators that function in diverse processes such as light and

17
hormone signalling pathways and maintenance and development of the meristem. Like all GRAS
family members, DELLAs contain a conserved carboxy-terminal GRAS domain that confers
transcriptional regulator function. Furthermore, DELLA has at its N-terminus a unique amino acid
sequence (DELLA) domain that is required for GA-induced degradation. DELLAs mainly function in the
nucleus (Sun, 2011) (Itoh et al., 2005).
DELLAs not only regulate the transcription or activation of other proteins, but their stability and
activity too. This happens by protein-protein interactions (see further for specific examples) and by
post-translational modifications like phosphorylation. The factors responsible for these modifications
still remain to be determined (Gao et al., 2011).
4.1 DELLA and plant growth DELLA proteins regulate plant growth by modulating gene expression of growth related proteins.
When there are more DELLAs, a more dynamic control of GA-mediated growth throughout plant
development is possible. This by interaction of DELLAs with other transcription factors. A good
example is the interaction between DELLA and PHYTOCHROME INTERACTING FACTORs or PIFs, which
belong to subfamily 15 of the bHLH transcription factors in Arabidopsis. DELLA-PIF interactions
inhibits the transcription of PIF target genes and as a consequence inhibit PIF-induced hypocotyl
elongation. This way, DELLA behaves as a transcriptional repressor (de Lucas et al., 2008). A second
bHLH protein in subfamily 15 with which DELLA binds is ALCATRAZ (ALC). This interaction to inhibit
the function of ALC in valve margin development / fruit patterning (Arnaud et al., 2010). Another
DELLA-induced target gene is the gene of SCARECROW-LIKE3 (SCL3). This protein is a member of the
GRAS family too and it is a positive regulator of GA signalling and involved in GA homeostasis. But it
also represses DELLA proteins by direct protein-protein interaction (Zhang et al., 2011) (Sun, 2011).
Further, DELLA binds to genes who encode GA biosynthesis enzymes or GA receptors. This way,
DELLA seems to play a role in maintaining GA homeostasis by feedback regulation of positive
components in the upstream GA pathway. But DELLA proteins also restrict GA-promoted processes
by modulating both GA and abscisic acid pathways (Sun, 2011).
The importance of DELLA protein(s) in the growth inhibition in plants becomes very clear in
modified / mutated plants. For example, loss-of-function mutants such as slr1 in rice are taller and
reach flowering earlier than wild-type plants, because the DELLA protein is not functional anymore
and cannot inhibit growth. On the other hand, transgenic plants engineered to overexpress DELLA
proteins tend to be dwarfed in stature and flower late in comparison with the wild relative (Itoh et
al., 2002) (Peng et al., 1997).
So DELLAs mainly act to restrain growth. But when growth is wanted, the DELLA proteins have to
be stopped and this happens by GA-mediated degradation (Figure 2-10).
GA-mediated degradation of DELLAs is also called the ‘relief of repression model’: the growth
repression by DELLA is stopped by degradation of DELLA (Gao et al., 2011). For this process, the
soluble GA receptor GIBBERELLIN INSENSITIVE DWARF1 or GID1 is needed. It is a soluble receptor
that binds with high affinity only to bioactive GAs. In Arabidopsis, three orthologs of this protein are
found which have some overlapping but also distinct functions. Besides this GID1 protein, also a
specific F-box protein is needed in the process: in Arabidopsis is this SLEEPY1 (SLY1) and in rice GID2
(Sun, 2011).

18
Figure 2-10: GA-mediated degradation of DELLA. A: General model by which GA binds to the GA receptor GID1. This protein
will then interact with DELLA which enhances the interaction at the C-terminus with the F-box component of SCFSLY1/GID/SNZ
complex. This leads to polyubiquitination and degradation by the 26S proteasome of the DELLA protein. (Gao et al., 2011) B:
More detailed model which shows the structural conformation of GID1 after binding whith GA and the specific interaction
of the GRAS domain of DELLA with GID1 (Sun, 2011).
The GID1 protein contains a carboxy-terminal core domain that forms a GA-binding pocket and it
also contains an amino-terminal extension domain (N-Ex) that acts as a lid for the pocket (Figure 2-
10B). When there is no binding with active GA, the N-Ex of GID1 has a flexible structure that is highly
sensitive to protease treatment. Binding of GA to the carboxy-terminal core domain of GID1 induces
a conformational switch of the N-Ex to cover the GA-binding pocket, just like a closing lid. This way,
DELLA-binding surfaces are created. The DELLA protein then binds to the complex / GID1 protein,
first the amino-terminal DELLA/VHYNP domain and then the GRAS domain, and when the binding is
completed, the GA-GID1-DELLA complex is stabilized. It has to be noticed, that in this complex
formation, DELLA does not contact GA directly. But GA is needed to make the contact between
DELLA and GID1: GA is an allosteric inducer of its receptor GID1 (Sun, 2011). However, in rice, binding
of GA to GID1 is not essential to allow binding of SLR1 to GID1: complex formation without GA is
possible, but this is less strong and less frequent then the complex formation with GA (Gao et al.,
2011).
When the GA-GID1-DELLA complex is formed, a conformational change in the DELLA protein
occurs, what favours the recognition of its GRAS domain by the F-box protein (SLY1 or GID2). When
this F-box protein has bound, DELLA is brought to the SCFSLY1/GID2 ubiquitin E3 ligase complex for poly-
ubiquitination. After the ubiquitination, degradation of DELLA by the 26S proteasome follows (Sun,
2011). But the degradation of DELLA is not necessary: GID1-DELLA interaction can inhibit DELLA
function without protein degradation if GID1 directly binds to the GRAS domain. This mechanism is
used for transcriptional regulation of target genes (Hirano et al., 2010) (Ueguchi-Tanaka et al., 2008).
So DELLAs restrain growth and this is hindered by GA-GID-DELLA degradation, but the removal of
DELLA not only influences plant growth. Both GA and DELLA are also needed in the regulation of
other pathways and concentrations of other molecules and hormones (Figure 2-11). For example: it
affects tolerance to cold and salt stresses and susceptibility to biotroph and necrotroph pathogens.

19
Figure 2-11: Interaction network between GA, DELLA and other internal and external cues in Arabidopsis. The GA-GID1-
DELLA regulatory module is highlighted in orange. Signals that promote bioactive GA accumulation are labelled in blue,
signals that reduce GA levels are highlighted in purple. DELLA interacts directly with the proteins in green. PD: protein
degradation, PPI: protein-protein interaction, TC: transcription, SAM: shoot apical meristem, ABA: abscisic acid, JA: jasmonic
acid. Positive and negative regulatory actions are indicated by respectively arrows and lines with bars (Sun, 2011).
4.2 DELLA and plant immunity DELLAs play also an important role in the immune system of the plant. In Arabidopsis thaliana, the
DELLA proteins will favour the SA/JA balance to JA and thus enhance salinity tolerance and resistance
to necrotrophs, but susceptibility to biotrophs (Navarro et al., 2008). DELLAs do this by direct
interaction with JAZ proteins, the major repressors of JA signalling (Figure 2-12). The JAZ proteins
bind to MYC2 and so inhibit its activity as transcriptional activator of the JA response. If JA is present,
JA will bind JAZ proteins and lead the JAZ protein to degradation by the 26S proteasome, which
allows the release of MYC2. This way, the JA responsive gen can be transcribed. But when JA is not
present and the DELLA proteins are not degraded by GA-GID1, then DELLA will compete with MYC2
for binding to JAZ which again leads to release of MYC2. In this case, DELLA acts as a transcriptional
activator and the process can again called ‘a relief of repression’ (Gao et al., 2011).
There seems to be an important cross-talk between the JA- and GA-pathways to change the
balance growth/defense in the right direction to save energy. The DELLA proteins play an important
role in this cross-talk (Lan et al., 2014).

20
Figure 2-12: ‘Relief of repression’ model in which DELLAs modulate JA signalling via competitive binding to JAZ proteins
(Hou, Lee, Xia, Yan, & Yu, 2010).
4.3 Other functions of DELLA In periods of adversity, DELLAs will modulate ROS production by inducing genes who are involved
in ROS detoxification. The lower ROS concentrations will result in restraining plant cell death, which
is the opposite of the GA-induced oxidative stress. This process will favour the resistance against
necrotrophs (De Bruyne et al., 2014)(Achard et al., 2008).
DELLAs play also a role in shifting the energy resources from growth to defense. That is, GA may
modify plant metabolism profiles, resulting in decreased production of antimicrobial compounds or
increased nutrient efflux favouring microbes. At the same time, this will result in more resources for
growth. When DELLA antagonizes GA, it will at the same time invert this process (De Bruyne et al.,
2014).
Furthermore, GA and DELLAs respectively induce and repress cell wall relaxation. Cell wall
loosening facilitates pathogen entry or allows enhanced nutrient leakage, so again, DELLAs promote
resistance against pathogens. This can also be seen in other functions: DELLAs potentially interfere
with cell cycle-dependent expression of immunity genes and control plant cytoskeleton dynamics.
This cytoskeleton is needed in sensing and responding to several pathogens (De Bruyne et al., 2014).
DELLAs seem to be stabilised by influences of JA, ABA, cytokinin and ET. Whereas auxin promotes
the GA-induced proteolysis. At last, DELLA may also serve as a point of integration of hormone and
metabolite signalling because there has been found that sucrose stabilizes the protein (De Bruyne et
al., 2014).
4.4 DELLA in Rice As mentioned before, rice only has one DELLA gene: SLR1. But there are also two SLR1-LIKE (SLRL)
genes that encode for proteins similar to the DELLA protein: they contain regions with high similarity
to the C-terminal conserved domains in SLR1, but they lack the N-terminal DELLA domain and are
therefore GA-resistant. SLRL can also inhibit growth, but in a weaker way than SLR1. Nevertheless,

21
SLRL can be important to sustain the growth inhibition during submergence conditions: when GA
responses are inhibited by SLR1, GA levels will increase and promote SLR1 degradation via the GA-
GID1-DELLA system. Then, SLRL is also transcribed and can maintain the inhibition of growth because
it is GA-resistant (Itoh et al., 2005) (Sun, 2011).
Both SLR1 and SLRL1 are influenced by Sub1A. Sub1A is an ethylene-responsive factor-type
transcription factor that will increase the accumulation of SLR1 and SLRL1 during submergence. This
accumulation will limit the ethylene-promoted GA responsiveness and induce tolerance against
submergence (Fukao et al., 2008).
The DELLA protein SLR1 has in rice also an effect on the growth, the SA and JA pathways. But
contrary to Arabidopsis thaliana where DELLAs positively influence JA and SA negatively, in rice both
SA and JA are positively regulated by SLR1. As a consequence, resistance against (hemi)biotrophic
pathogens and some necrotrophic ones is promoted. The reverse is also true: SA and JA strongly
induce the expression of the DELLA-encoding gene SLR1. They further enhance the expression of GA-
degrading (OsGA2ox3) and GA-repressor (SPINDLY and EL1) genes and down-regulate the expression
of the GA-biosynthesis gene OsGA20ox1. By doing so, SA and JA inhibit GA effects and the GA-
degradation of SLR1 (Filipe et al., 2014)
Thus DELLAs and also SLR1 in rice play an important and sometimes central role in pathways of
plant growth and plant defense. Also other functions have been discovered in which DELLA is
important (see 4.3 Other functions of DELLA). The exact mechanisms are not known yet, but De
Vleesschauwer et al. (unpublished) proposed a model of the interactions of several players in the
immune response and other responses when a pathogen (here M. Oryzae) attacks: Figure 2-13 (Huu,
2014).
Figure 2-13: Proposed model of the interactions between plant hormones and their function in the rice immune response
towards. SLR1 plays a central role. Positive and negative regulatory actions are indicated by respectively arrows and lines
with bars (Huu, 2014).

22
5. Interaction partners of DELLA
One goal in this master’s dissertation is to find protein interaction partners of the DELLA protein
in rice: SLENDER RICE 1 or SLR1. This is needed to better understand the influences of this protein on
the different pathways, other proteins and molecules that are already known and that still have to be
discovered.
This is a short summary of the (possible) interaction partners of DELLA/SLR1 that are already
known in literature:
PIF3 / PIF4 It has been shown that the Arabidopsis thaliana DELLA protein RGA interacts with PIF3 and PIF4 (de Lucas et al., 2008).
ALC In Arabidopsis thaliana, DELLA interacts with ALC and thus plays a role in fruit patterning (Arnaud et al., 2010).
SCL3 DELLA interacts with SCL3 in Arabidopsis thaliana as discussed in 4.1 DELLA and plant growth (Zhang et al., 2011).
GID1 DELLAs bind to the GID1 protein of the GA-GID1 complex in the GA-dependent degradation. But in this case, it is important that GA is present for the binding to succeed (Sun, 2011).
SLY1 / GID2 For the degradation of DELLA, binding of SLY1 or GID2 to the GRAS domain of DELLA occurs after the formation of the GA-GID1-DELLA complex. SLY1 or GID2 mostly bind as a SCF
SLY1/GID2 complex (Sun, 2011).
JAZ DELLAs bind to JAZ proteins in controlling the JA response (Hou et al., 2010). Son Nguyen Huu showed in his master’s dissertation that this is also the case for SLR1 in rice: SLR1 binds with JAZ9 in yeast two hybrid tests (Huu, 2014).
BZR1 In Arabidopsis it has been found that DELLA proteins interact with BZR1 (BRASSINAZOLE RESISTANT 1). BZR1 is a transcription factor that plays a role in the BR pathway. By this interaction, DELLA and BZR1 antagonize each other’s transcription activity and enables interaction between the BR and GA pathways (Li et al., 2012)(Gallego-Bartolome et al., 2012).
SPL Another transcription factor with which DELLA binds in Arabidopsis is Squamosa Promotor Binding-Like (SPL). This protein controls floral transition (Yu et al., 2012).
SPY DELLAs can be phosphorylated to regulate its function. A protein that does phophorylate DELLAs is SPINDLY (SPY), a negative regulator of GA. Phosphorylation of DELLA stabilizes DELLA or to improve its repression function which has of course a negative effect on the GA pathway (Shimada et al., 2006).
Transcription
factors
Marin-de la Rosa et al. (2014) reported 57 unique transcription factors of different families that interact with GAI in Arapidopsis thaliana (la Rosa et al., 2014).

23
Chapter 3
Objectives
The objective of this master’s dissertation is to learn something more about the DELLA protein SLR1
in rice. It is known that it plays an important role in growth and immunity of plants, but probably, the
protein regulates more. To find out what it is doing and how, some experiments will be done. First, it
will be investigated which the protein interaction partners are of SLR1. This will provide information
about which pathways SLR1 plays a role in and which interaction partners are exactly needed for this
regulation. Further, some tests will be done about how SLR1 influences the immune system of rice
and how the SLR1 protein itself is regulated.
The goal is not to completely find out the working of SLR1, but to examine some (important) details
in this complex regulation and cross-talk of pathways that have important consequences for the
plant (in this case: rice plants). With these details, the bigger puzzle / picture can be supplemented.
This whole story is important to learn about, because it not only provides information about the
growth and immune system of the plant, but also about the cross-talk between those two pathways
and between other regulation systems. This is important to learn how we can later on improve
plants, agricultural systems and plant protection systems without losing wanted properties (for
example yield) of plants via negative feedback regulations. This last point is of course for the future,
now, some more insights in the basal regulation systems in which SLR1 plays a part, are needed.
A second main objective in this master’s dissertation is to learn some biotechnology techniques that
are important to know for a bio-engineer in the cell- and gene biotechnology and to have some
experience in the lab.

24
Chapter 4
Methodology In this chapter, all the methods used in this master’s dissertation are shortly discussed.
1. Rice cultivars
1.1 The used cultivars In the experiments in this master’s dissertation, some rice cultivars were used. One of the used
cultivars is the wild type cultivar Kitaake (Oryza sativa subsp. japonica). Another one is the wild type
cultivar T65 (Oryza sativa subsp. japonica). Also some mutant lines in the background of the T65
cultivar are used: gid 1-8, gid 2-2, D35 and SLR1-d3/SLR1-d1. The lines gid 1-8 and gid 2-2 are both
insensitive for GA and SLR1-d3 has a point mutation in the SLR1 gene that results in slower
degradation of the SLR1 protein. SLR1-d1 has another point mutation, but the result is the same as in
SLR1-d3. The line d35 has less GA biosynthesis. As a consequence, all the lines have a higher SLR1
content but in gradations: T65 has a normal SLR1 concentration, gid 1-8, d35, SLR1-d1 and SLR1-d3
an intermediate and gid 2-2 a high SLR1 concentration. These different levels of SLR1 influence the
GA pathway and thus also the growth: gid 1-8, d35, SLR1-d1 and SLR1-d3 are smaller plants then T65
and gid 2-2 displays a strong dwarph phenotype (Figure 4-1).
Figure 4-1: The wild type cultivar T65 and the mutants d35, gid 1-8, SLR1-d3, gid 2-2 and SLR1-YFP in the T65 background.
Further, also a SLR1-YFP transgenic line is used: this line brings a SLR1-YFP construct at
overexpression in a T65 background.

25
1.2 Growing circumstances To grow the different cultivars, the seeds were first dehulled by hand or by grinding between two
wooden planks. The seeds were then sterilized in 2% NaOH solution by incubating for 20 minutes
while shaking and washed with distilled water until the smell of javel had disappeared. If the purpose
was to make protoplasts, the seeds were placed on GB5 (Gamborg 5, Appendix 1-1) medium in solo
cups, after they had dried in a laminar flow. The seeds could then be incubated at 28°C in the dark. If
callus was needed, the dried seeds were placed on petri dishes with MSD medium (Appendix 1-2)
and incubated at 28°C in the dark.
To grow full plants, the sterilized seeds were placed on wet sterile filter papers in a sealed petri
dish and incubated at 28°C. After germination, this is after approximate 5-7 days, the seeds were
placed in soil and grown in a greenhouse. Soil-grown plants were fertilized every week with a
solution containing 1 g/L ammonium sulphate and 2 g/L iron sulphate.
2. Pathogen inoculation and scoring
2.1 Inoculation with Cochliobolus miyabeanus For the inoculation of rice leaves with Cochliobolus miyabeanus, the strain Cm988 was used. To
make the spore solution, 10 ml of bidest water was added to a PDA (Potato Dextrose Agar, Appendix
1-15) plate with sporulating Cm988. The conidia were rubbed with a sterile spatula and the spore
solution was filtered through sterile cheese cloth. The spore solution was held on ice to prevent
spore germination. The spores were then counted with a Burker chamber and a solution of 1.5 104
spores / ml was made. Also a solution of 1% gelatine was made. 20 ml of the gelatine solution and 20
ml of the spore solution were mixed to obtain a solution of 0.5% gelatine and 0.75 104 spores / ml.
The leaves that had to be infected were detached and incubated on wet tissues in a plastic box. 30 ml
of the mixed solution was nebulised over the leaves and a plastic foil was put over the box to prevent
dehydration. The leaves were then incubated for 14 hours in the dark at room temperature and
afterwards in daylight. After five days, the infection could be scored.
2.2 Scoring of the infection The scoring of the infection of rice leaves with Cochliobolus miyabeanus was done in two ways.
First, the percentage of infected area or the part of the area that contains lesions was calculated with
the program APS Assess 2.0. Before this could be done, the pictures of the leaves were modulated in
the program GIMP: the background was deleted and coloured blue because APS Assess 2.0 only
works with blue backgrounds.
For the second method of scoring, each leaf was assessed individually and scored using a 1-to-5
disease severity scale. The classification of the scores can be found in Figure 4-2.
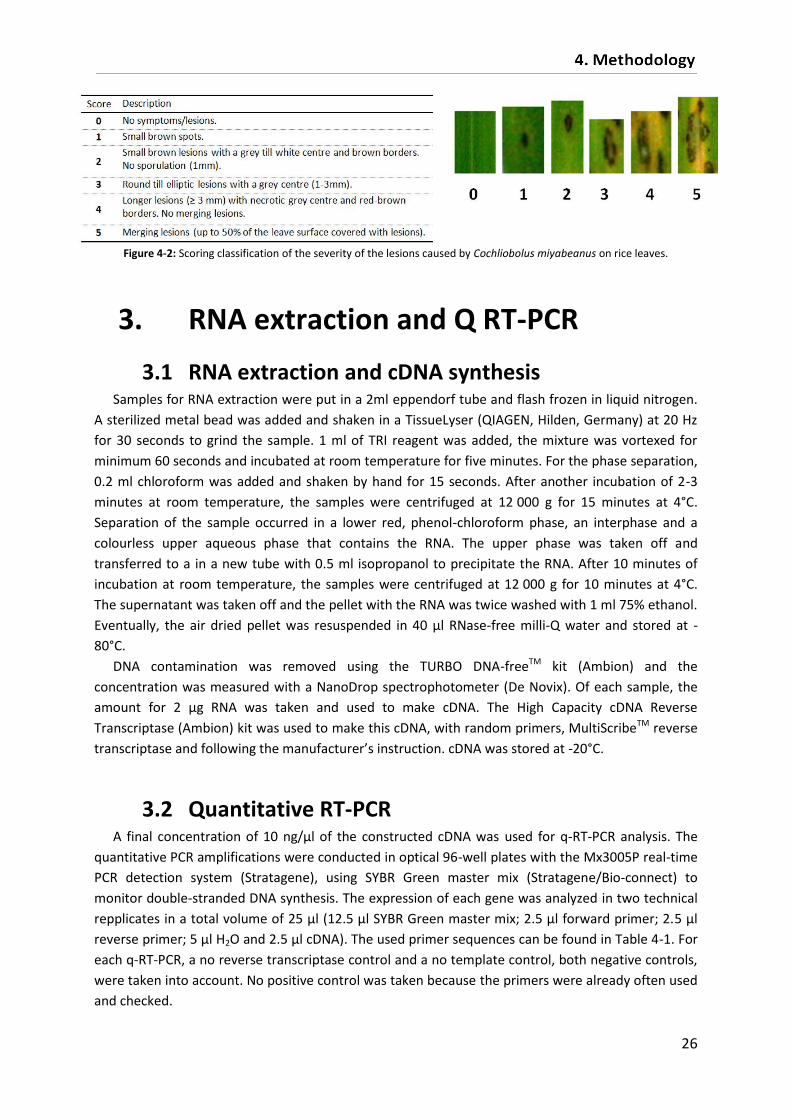
26
Figure 4-2: Scoring classification of the severity of the lesions caused by Cochliobolus miyabeanus on rice leaves.
3. RNA extraction and Q RT-PCR
3.1 RNA extraction and cDNA synthesis Samples for RNA extraction were put in a 2ml eppendorf tube and flash frozen in liquid nitrogen.
A sterilized metal bead was added and shaken in a TissueLyser (QIAGEN, Hilden, Germany) at 20 Hz
for 30 seconds to grind the sample. 1 ml of TRI reagent was added, the mixture was vortexed for
minimum 60 seconds and incubated at room temperature for five minutes. For the phase separation,
0.2 ml chloroform was added and shaken by hand for 15 seconds. After another incubation of 2-3
minutes at room temperature, the samples were centrifuged at 12 000 g for 15 minutes at 4°C.
Separation of the sample occurred in a lower red, phenol-chloroform phase, an interphase and a
colourless upper aqueous phase that contains the RNA. The upper phase was taken off and
transferred to a in a new tube with 0.5 ml isopropanol to precipitate the RNA. After 10 minutes of
incubation at room temperature, the samples were centrifuged at 12 000 g for 10 minutes at 4°C.
The supernatant was taken off and the pellet with the RNA was twice washed with 1 ml 75% ethanol.
Eventually, the air dried pellet was resuspended in 40 µl RNase-free milli-Q water and stored at -
80°C.
DNA contamination was removed using the TURBO DNA-freeTM kit (Ambion) and the
concentration was measured with a NanoDrop spectrophotometer (De Novix). Of each sample, the
amount for 2 µg RNA was taken and used to make cDNA. The High Capacity cDNA Reverse
Transcriptase (Ambion) kit was used to make this cDNA, with random primers, MultiScribeTM reverse
transcriptase and following the manufacturer’s instruction. cDNA was stored at -20°C.
3.2 Quantitative RT-PCR A final concentration of 10 ng/µl of the constructed cDNA was used for q-RT-PCR analysis. The
quantitative PCR amplifications were conducted in optical 96-well plates with the Mx3005P real-time
PCR detection system (Stratagene), using SYBR Green master mix (Stratagene/Bio-connect) to
monitor double-stranded DNA synthesis. The expression of each gene was analyzed in two technical
repplicates in a total volume of 25 µl (12.5 µl SYBR Green master mix; 2.5 µl forward primer; 2.5 µl
reverse primer; 5 µl H2O and 2.5 µl cDNA). The used primer sequences can be found in Table 4-1. For
each q-RT-PCR, a no reverse transcriptase control and a no template control, both negative controls,
were taken into account. No positive control was taken because the primers were already often used
and checked.

27
The thermal profile consisted of an initial denaturation phase at 95°C for 5 minutes, followed by
40 cycles of denaturation (95°C for 15 seconds), annealing (59°C for 30 seconds) and extension (72°C
for 30 seconds). The profile was ended with one minute at 95°C, 30 seconds at 59°C and 30 seconds
at 95°C. To verify amplification of one specific target cDNA, a melting-curve analysis was included.
The gene expression of each sample was expressed relative to the calibrator (control) and normalized
using the housekeeping gene Actin or eEF1a. The relative expression results of the samples and
calibrator were compared using the ΔΔ-Ct method. The calculation for this model was performed as
follows:
ΔCt = Ctgene – Cthousekeeping gene
Normalized target gene expression level = 2(-(ΔCt treated – ΔCt control)) = 2-ΔΔCt
Table 4-1: Primer sequences used in quantitative RT-PCR.
Gene Forward primer (5’-3’) Reverse primer (3’-5’)
eEF1a GGCTGTTGGCGTCATCAAGA CCGTGCACAAAACTACCACTT
Actin GCGTGGACAAAGTTTTCAACCG TCTGGTACCCTCATCAGGCATC
MLO CACCCTGCAGCGACAGAAAG CCTCTCGCTGGAGCTCGATA
PAL1 AGCACATCTTGGAGGGARGCT GCGCGGATAACCTCAATTTG
β-glucanase ATTCTCGCTTGCGGCTTCTT CCAGCATGCCGTAGTTCACA
WRKY62 AATGCTAGTGGCGACCTACG TTGATGGAGATGGAGCACGG
4. Vector constructs
4.1 Primer design and construction of DNA fragment Before the construct could be made that had to be ligated in the right vector, primers had to be
constructed (Table 4-2). To make suited primers, the CDS (coding sequence) of the gene was used
and with the program ‘Primer 3’, possible primers were searched. These primers were then checked
for self-complementarity in the program ‘Oligocalc’ and for dimers on the site of Thermo Scientific.
To make the construct for the RNAi mechanism in rice of JAZ9 (that of SLR1 was already available),
a region in the CDS of JAZ9 was searched that did not contain known / conserved domains. This part
was then blasted against the rice genome in the NCBI Reference RNA database and a piece of 200 bp
that showed as less as possible overlap with other genes is chosen. The specificity was checked by
blasting this last piece against the rice genome in the NCBI nucleotide collection database. When
there was no homology found of more than 20 bp, the part is suited for RNAi and primers were made
like mentioned above.
When the Gateway® cloning system (Life Technologies Invitrogen, see further) was used, for each
gene, also an attB primer was needed. After amplifying the construct, another PCR was performed
with these primers to add specific sequences to the sequence of the gene. These sequences were
needed to ligate the construct in a vector of the Gateway® cloning system. The primers were made
as follows: the ‘normal’ primer for the sequence was taken and the GGGG-attB1 and the GGG-attB2
sequence is added before respectively the forward and the reverse primer. This becomes: ‘GGGG

28
ACA AGT TTG TAC AAA AAA GCA GGC TTC GCC ACC-forward primer’ and ‘GGGG AC CAC TTT GTA CAA
GAA AGC TGG GTT-reverse primer’.
Table 4-2: Self-made primers for PCR reactions to make constructs of the DNA sequence of genes.
Gene Forward primer (5’-3’) Reverse primer (3’-5’)
NPR1 ATGGAGCCGCCGACCAGC TCATCTCCTTGGTCGAATGGCCC
WRKY45 ATGACGTCATCGATGTCG TCAAAAGCTCAAACCCATAATG
JAZ9 N-terminal ΔZIM ATGGAGAGGGATTTTCTTGGCG GGATGCCCTGCTTGCCAAAAGCATAAG
JAZ9 C-terminal ΔZIM AGGGACCTTCAAAATCCGAAGGTGACA
CTTATGCTTTTGGCAAGC TCATATCTGTAACTTTGTGCTGGGG
JAZ9 N-terminal ΔJAS ATGGAGAGGGATTTTCTTGGCG CGCAACACTTGACACTCTTTCCTTTCG
JAZ9 C-terminal ΔJAS GCTATCATGCCAAGAGCTGTGCCTCAA
CGAAAGGAAAGAGTGTCAAG TCATATCTGTAACTTTGTGCTGGGG
SLR1 N-terminal ΔDELLA ATGAAGCGCGAGTACCAAGAA GGACGACCGCACCTTGTACCCGAGCGC
SLR1 C-terminal ΔDELLA GGGGCGGCGGGGGAGGAGGAG
GACGTCGCGCTCGGGTACAAGGTG TCACGCCGCGGCGACGCG
SLR1 N-terminal ΔVHIID ATGAAGCGCGAGTACCAAGAA CCATTGCATCCCCTGCTTGATGCCGAA
SLR1 C-terminal ΔVHIID CTCGAGGCTTTCGCCGGCTGCCACCGC
TTCGGCATCAAGCAGGGG TCACGCCGCGGCGACGCG
SLR1 N-terminal ΔLXXLL ATGAAGCGCGAGTACCAAGAA GACCTTCTCCAGCGCGCCGGGCTGCGC
SLR1 C-terminal ΔLXXLL GTGATCGCCGTCAACTCGGTGTTCGAG
GCGCAGCCCGGCGCGCTG TCACGCCGCGGCGACGCG
SLR1 N-terminal ΔLHRI ATGAAGCGCGAGTACCAAGAA CTCGCCGAAGTAGGCAGCGACCTTGCG
SLR1 C-terminal ΔLHRI GTTGACACGCAGGAGGCTGGGATCCGG
CGCAAGGTCGCTGCCTAC TCACGCCGCGGCGACGCG
SLR1 N-terminal ΔLHRII ATGAAGCGCGAGTACCAAGAA CTCGTTCGCGTCCGCCTCGCCCTCCGG
SLR1 C-terminal ΔLHRII CCCCCGCAGCCGGACGAGACCGACGCC
CCGGAGGGCGAGGCGGAC TCACGCCGCGGCGACGCG
SLR1 N-terminal ΔTVHTNP ATGAAGCGCGAGTACCAAGAA CGGCGCGTTGAGCTCGGAAAGCATGCT
SLR1 C-terminal ΔTVHTNP GCCGCGGATGACGGGTTCGTGTCGCAC
AGCATGCTTTCCGAGCTC TCACGCCGCGGCGACGCG
SLR1 N-terminal ΔpolyS/T/V ATGAAGCGCGAGTACCAAGAA CAGCAACGCGTGCACCAGCCGGATCCC
SLR1 C-terminal ΔpolyS/T/V GCGACGGCTGACCCGTCGGCTGCTGAC
GGGATCCGGCTGGTGCAC TCACGCCGCGGCGACGCG
SLR1 N-terminal ΔPFYRE ATGAAGCGCGAGTACCAAGAA CTCCGTGCGCTCCGCGCCCTCGCACGC
SLR1 C-terminal ΔPFYRE AACGAGGAGCCTGAGGTGATCGCCGTC
GCGTGCGAGGGCGCGGAG TCACGCCGCGGCGACGCG
SLR1 N-terminal ΔSAW ATGAAGCGCGAGTACCAAGAA CGCCGCGGCGACGCGCGCCACGACGTT
SLR1 C-terminal ΔSAW GGCCGGCAGATCTGCAACGTCGTGGCG
CGCGTCGCCGCGGCG TCACGCCGCGGCGACGCG
JAZ9 RNAi TGCTGCGAAACTTACAGTGC GAGTAACAGCCAACGGTAGGC
4.2 PCR with Phusion DNA polymerase Abovementioned primers were used in a PCR reaction with Phusion® High-Fidelity DNA
Polymerase (FINNZYMES, Thermo Scientific). All PCR reactions were performed following
manufacturer’s instruction, except for the extension PCR to make the constructs of JAZ9 and SLR1
without some domains. For this extension PCR, no primers were used and the next PCR conditions
were chosen: 1 minute at 95°C; 12 times 30 seconds at 95°C, 30 seconds at 42°C and 30 seconds per
kb at 72°C; 5 minutes at 72°C and hold at 15°C. For the PCRs, the device FlexCycler (Analytik Jena)
was used.

29
4.3 Restriction digest To check whether a construct was ligated correctly in a vector and if it was of the right length, a
restriction digest can be performed. This was for example done to know if the sequence, ligated in
the TOPO TA vector (Appendix 2-2) had the right orientation. First, suitable restriction enzymes had
to be chosen: they must cut the plasmid with the construct only one or a few times and the pieces
must have a different length when the construct had the right or wrong orientation. 1 µl of the
chosen restriction enzyme(s) is then combined with 200-800 ng of the vector, 2 µl 5X Green GoTaq®
Reaction Buffer with loading dey (Promega) and water till 20 µl. The solution was incubated on 37°C
for one hour and used for a gel electrophoresis on a 1% or 2% agarose gel. Ethidium bromide was
used for the staining and a UV-lamp for the visualisation.
4.4 DNA separation on gel and DNA recovery After a PCR, the length of the wanted construct or fragment could be checked and the fragment
could be purified by separating the DNA fragments in a mixture on an agarose gel. Practically, a
suited agarose gel was made: 1% or 2% agarose in TAE buffer, heated and cooled down in a mould.
The sample was pipetted in one of the wells and a DNA ladder (100 bp or 1 kb, Promega) in another
one. Then, an electrophoresis was done for 35 minutes and the DNA was stained with ethidium
bromide. The visualisation of the bands was done with an UV-lamp and if a band with the right length
was present, the DNA was extracted out of the gel with the MicroElute® Gel Extraction Kit (Omega)
following the manufacturer’s instructions.
4.5 Gateway ® entry clone: BP reaction To ligate the constructs in the right vector, the Gateway® Cloning system (Life Technologies,
Invitrogen) was used. This technology provides a rapid and highly efficient way to move DNA
sequences into multiple vector systems. It is based on the site-specific recombination properties of
bacteriophage lambda: enzymes bind to specific sequences (att sites), bring together the target sites,
cleave them and covalently attach the DNA after which recombination occurs.
The first step in the Gateway® cloning system is the BP reaction to make the entry clone (Figure 4-
3, left side). In this reaction, the construct with the attB borders (made with the with the earlier
constructed primers) is cut in the attB borders releasing the gene, at the same time, attP borders of
the donor vector (pDONR207, Appendix 2-1) are also cut releasing the ccdB gene and both genes are
switched places. This results in the entry clone with the wanted gene and attL borders and a by-
product with the ccdB gene and attR borders. The ccdB gene is a lethal gene for bacteria which
allows selection for plasmids in which the BP reaction succeeded.
Practically, 15-150 ng attB-PCR product was combined with 150 ng donor vector, 8 µl TE buffer
(pH 8) and 1 µl BP-enzyme. The reaction was incubated for at least three hours at room temperature,
after which 1 µl of proteinase K was added to stop the reaction and improve the efficiency. The entry
clone was then selected and amplified by transformation and plasmid precipitation of E. coli.

30
4.6 Gateway ® expression clone: LR reaction The constructed entry clone could then be used to ligate the construct via an LR-reaction to a
variety of destination vectors (Appendix 2-3 to 2-10), depending on the goal of the experiment
(Figure 4-3, right side). In this reaction, the attL borders of the entry clone and the attR borders of
the destination vector are cut and the gene between the borders are switched resulting in the
expression vector with the gene of interest between attB borders and a by-product with attP
borders.
Practically, 100 ng entry clone was combined with 150 ng destination vector, 2 µl TE buffer (pH 8)
and 0.5 µl LR-enzyme. The reaction was incubated for at least three hours at room temperature,
after which 1 µl of proteinase K was added to stop the reaction and improve the efficiency. The entry
clone was then selected and amplified by transformation and plasmid precipitation of E. coli.
Figure 4-3: Principle of the Gateway
® cloning technology. The ccdB gene is lethal for bacteria.
4.7 Sequencing For sequencing, 500 – 1000 ng of sample (plasmid) was taken and water was supplemented to 10
µl. 4 µl of primer (5 mM) was added. The sample was then sent to LGC Genomics who sequenced the
sample and sent the result via e-mail. The result was analysed via blast or alignment (website NCBI).
5. Transformations
5.1 Escherichia coli To transform plasmids in E. coli, chemi-competent cells of the strain DH5α were used. The chemi-
competent cells were made as follows: 20 µl of a glycerol stock of the strain was plated on LB
medium (Appendix 1-3) and incubated overnight at 37°C. One of the colonies that grew is inoculated
in 5 ml liquid LB medium and overnight incubated at 37°C while shaken. The 5 ml culture was
subcultured in 500 ml liquid LB medium and incubated at 37°C while shaken, until the OD600nm is
between 0.4-0.6. Then, the subculture was split between pre-chilled centrifuge tubes and

31
centrifuged at 3500g for 15 minutes at 4°C. The supernatant was removed and the pellet was
resuspended in 10 ml ice-cold TFB1 (30mM Potassium acetate, 10mM CaCl2, 50mM MnCl2, 100mM
RbCl and 15% v/v glycerol; pH to 5.8 and filter sterilised). After five minutes of incubation on ice, the
suspension was again centrifuged, the supernatant was taken off and now, the pellet was
resuspended in 10 ml TFB2 buffer (10mM MOPS or PIPEs, 75mM CaCl2, 10mM RbCl and 15% v/v
glycerol; pH to 6.5 and filter sterilised). The cells were incubated on ice for 60 minutes and finally
transferred to epppendorf tubes. The chemi-competent E. coli cells were stored at -80°C.
The transformation of these chemi-competent E. coli cells went as follows: 50 µl of the chemi-
competent cells were combined with 100 ng of plasmid and incubated on ice for 30 minutes. Then
the heath shock followed: 45 seconds on 42°C. After two minutes on ice, 500 µl of liquid LB medium
was added and incubated for one hour at 37°C while shaken. Next, the suspension was shortly
centrifugated and half of the medium was discarded to concentrate the cells. Finally, 100 µl was
plated on LB medium with the antibiotic according to the plasmid and overnight incubated at 37°C.
5.2 Plasmid precipitation from E. coli To obtain the amplified plasmids out of the E. coli cells, a plasmid miniprepcipitation or a
midiprecipitation (for higher concentrations) was done. When needed, a higher concentration could
be obtained by evaporating the water in a vacuum centrifuge.
For the miniprecipitation, one transformed colony was inoculated in 3 ml LB medium with the
right antibiotic according to the plasmid. The culture was incubated overnight at 37°C on a shaker.
Next, the PureYieldTM Plasmid Miniprep System (Promega) was used following the manufacturer’s
instruction.
Preparing for the midiprecipitation, one transformed colony was inoculated in 3 ml LB medium
with antibiotics and incubated overnight at 37°C while shaken. The culture was then subcultured in
50 ml LB medium with antibiotics and again overnight incubated at 37°C while shaken. Finally, the
E.Z.N.A.® Plasmid DNA Midi kit (Omega) was used following the manufacturer’s manual.
5.3 Yeast Two yeast strains were used: mav203 and Egy48. Competent cells of both were made with the
Frozen-EZ Yeast Transformation IITM kit (Zymo Research) following manufacturer’s instructions. The
competent yeast cells were then transformed with the same kit, but the instructions were not
completely followed. For the mav203 strains, the only step that was changed is the incubation step
after the transformation: not 45 minutes, but three hours of incubation at 30°C with regularly mixing
was done. The transformation of Egy48 cells was done in the same way, but with different quantities:
100 ng of plasmid was combined with 20 µl competent yeast cells and 100 µl of EZ3 solution. Also for
the library screening with mav203, different quantities were used: 12 µl of library DNA was combined
with 500 µl competent yeast cells and 5 ml EZ3 solution.
5.4 Plasmid precipitation from yeast To extract plasmids from transformed yeast cells, a yeast colony was inoculated in liquid YPAD
medium (Appendix 1-4) and grown for a few days on a shaker at 30°C. Next, the ZymoprepTM Yeast
Plasmid Miniprep II kit (Zymo Research) was used according to the manufacturer’s manual.

32
6. Yeast two-hybrid assay
Two types of yeast two-hybrid (Y2H) assays were used: a one to one Y2H with blue-white
screening and a library screening. For the one to one Y2H with blue-white screening, the two
plasmids pLexA (Appendix 2-6) and pB42 (Appendix 2-5) with the sequences of the two proteins of
interest or the GUS gene as control were transformed in competent yeast cells of the strain Egy48.
The transformed yeast was selected on HUT DO medium (DO medium lacking histidine, uracil and
tryptophan; Appendix 1-6): pLexA contains the gene for histidine biosynthesis (H), pB42 for
tryptophan (T) and the yeast Egy48 for uracil (U). The selected yeast colonies were then again plated
on HUT DO medium to confirm the transformation. Finally, the colonies were plated on HUT DO
medium that also contained X-gal (Appendix 1-7). In the transformed yeast, the gene in the pB42
vector will be transcribed and translated with a DNA adhesion domain attached to it and the gene in
the pLexA vector with a DNA binding domain. When the two proteins interact, the two extra domains
will come together and induce the transcription of the lacZ gene that is located after an inducible
promotor. The β-galactosidase enzyme is formed and X-gal will be hydrolyzed resulting in the
formation of a blue pigment. So yeast colonies turning blue indicated interaction between the two
proteins of interest.
For the library screening, another Y2H method with the same principle was used: the yeast strain
mav203 was transformed with the constructs in vectors pDEST32 (leucine gene, Appendix 2-3) and
pDEST22 (tryptophan gene, Appendix 2-4). Selection of the transformed yeast was done on TL DO
medium (Appendix 1-6) and the screening for protein interaction partners on TLH DO medium
(Appendix 1-6) with 3-amino-triazol (3-AT) to prevent self-activation activity. In this case, the gene
for histidine is the gene after the inducible promotor (hence selection marker), so only the yeast
colonies that were transformed and in which interaction occurs between the two proteins could
grow on the TLH DO medium.
7. Split-YFP
A split-YFP or Bimolecular fluorescence complementation (BiFC) experiment was performed in
protoplasts to test for interaction between two proteins. For this, the sequence of the two proteins
of interest were ligated in the vectors 728 (Appendix 1-7) and 738 (Appendix 1-8): one sequence in
one vector, the other sequence in the second vector. These two vectors each contain a part of the
yellow fluorescent protein (YFP): 728 has the sequence for the N-terminal part and 738 for the C-
terminal part. When the two vectors are transformed into protoplasts, the two proteins are
transcribed with one part of the YFP attached to it. The parts of YFP cannot show any fluorescence on
their own, but when there is interaction between the two proteins of interest, the two parts come
together, form the complete protein and show fluorescence. So when the two proteins interacted
with each other, yellow fluorescence could be seen in the protoplasts.

33
8. Callus transformation
8.1 Electrocompetent Agrobaterium To make electrocompetent Agrobacterium cells, the strain EHA105 which has a rifampicin
resistance was used. This strain was grown for two day at 28°C on plates with LB medium and
rifampicin (Appendix 1-3). Afterwards, some of the colonies were grown in 5 ml liquid LB medium
without antibiotics for one and a half day at 28°C. 1 ml of this bacterial culture was then inoculated in
200 ml liquid LB medium with rifampicin and overnight grown at 25°C until the OD600nm reached 0.6-
0.9. On the fifth day, the culture that had the right OD600nm was cooled down on ice for 30 minutes
and centrifugated at 4°C for 15 minutes at 4000 rpm. The supernatant was decanted and 200 ml of
ice-cold PIPES buffer (0.3 g/l PIPES, pH 7) is added. After two more centrifugations steps, respectively
100 ml and 25 ml of PIPES buffer was added and a next centrifugation steps follows. Again, the
supernatant was decanted and 20 ml of ice-cold 10% glycerol was added to resuspend the pellet. The
suspension was centrifugated at 4°C for 15 minutes at 4000 rpm, the supernatant was decanted and
the pellet was resuspended 2 ml ice-cold 10% glycerol. This last suspension was then divided in 1.5
ml Eppendorf tubes, flash frozen in liquid nitrogen and stored at -80°C.
8.2 Transformation of Agrobacterium The electrocompetent Agrobacterium cells were transformed via electroporation: ± 600 ng of
plasmid was combined with 40 µl of competent cells. The mixtures was brought in a cuvette and air
bubbles were removed. The cuvett was placed in the MicroPulserTM Electroporator of Bio-RAD and
one pulse of 2,2 kV was applied. Then, 500 µl of liquid YEP medium (Appendix 1-5) was added and
incubated for 2-4 hours at 28°C. The transformed Agrobacterium was plated on YEP medium with
rifampicin and another antibiotic according to the plasmid used. The plates were incubated at 28°C.
8.3 Callus transformation Callus was grown by placing sterilized (in 2% javel) Kitaake seeds in plates with MSD medium
(Appendix 1-2) and incubating the plates at 28°C. After one month, the calli were cut into small (± 2
mm) pieces with a sterile scalpel and placed on fresh MSD medium. Four to seven days later, the calli
were co-incubated with a transformed Agrobacterium suspension for 30 minutes while occasionally
shaken. The Agrobacterium suspension was obtained by first inoculating 1 ml LB medium (Appendix
1-3) with the right antibiotic (conform the used plasmid) and incubated for 24 hours at 28°C while
shaken. 150 µl of that suspension was then added to 5 ml TY+AS medium (Appendix 1-9) and grown
at 25°C for 2-4 hours until the OD600 was between 0.1 and 0.2.
The co-cultivated calli were placed on plates with MSD+S+AS medium (Appendix 1-11) and
incubated for 2-3 days in the dark at 22-28°C. After that, the calli were washed two times with 50 ml
liquid MSD (Appendix 1-10) for 10 minutes while swirling and air dried. The calli were then
transferred to MSD+CH+PPM selection medium (Appendix 1-12) and incubated under continuous
light at 28-30°C (Selection for transformed calli and elimination of Agrobacterium that rested on the
calli). Every 2-3 weeks, the calli were placed on fresh MSD+CH+PPM medium. After about 2-6 weeks,
resistant microcalli of 2-5 mm started to appear. These were taken off with sterile forceps and

34
transferred to dishes that contained BN+S+CH regeneration medium (Appendix 1-13) and incubated
under continuous light at 28-30°C. Two or three weeks later, the surviving calli were placed in Solo
Cups with BN+S+CH regeneration medium (Appendix 1-13) and placed on fresh medium every 3-4
weeks until the calli turned green. Then, the calli can be transferred to MS+H rooting medium
(Appendix 1-14) and later on to soil.
9. Protoplasts
9.1 Making protoplasts Protoplasts were made of one or two weeks old Kitaake rice plants: the seeds were sterilised with
2% javel and grown on GB5 medium (Appendix 1-1) at 28°C in the dark. The small rice plants were
cut in 1 mm pieces with a razor blade and incubated for four hours at 28°C in an enzyme solution
(0.6M mannitol, 10mM MES pH5.7, 1.5% cellulase, 0.75% macerozyme, 0.1% bovine serum albumin,
3.4mM CaCl2 dihydrate, 5mM β-mercaptoethanol and 50 μg/ml carbenicillin). The enzyme solution is
a buffer which contains cell wall degrading components. The protoplasts were recovered by passing
the solution through a 35 μm mesh screen. A W5 solution (154mM NaCl, 125mM CaCl2, 5mM KCl and
2mM MES pH 5.7) was twice added and poured off after centrifugation. Finally, Mmg solution (0.6M
mannitol, 15mM MgCl2 and 4mM MES pH 5.7) was added, followed by PEG transformation.
9.2 PEG transformation of protoplasts 100 μl of protoplasts in Mmg solution were combined with 5-10 μg of DNA / plasmid and 110 μl of
40% Poly Ethylene Glycol (PEG) was added (0.6M mannitol, 100mM CaCl2 and 40% v/v PEG 3350).
After 15 minutes of incubation at room temperature, W5 solution was added, the solution with the
protoplasts was centrifugated and the supernatant was removed. After a second wash step with W5
solution, 50 μl of incubation solution (0.6M mannitol, 4mM MES pH 5.7 and 4mM KCl) was added.
The protoplasts were then overnight incubated at 28°C in the dark and the next morning visualized
under a fluorescent microscope.
10. Western Blotting
The Western blot technique was used to detect specific proteins. First, the proteins were
separated based on their molecular weight with a gel electrophoresis. They were then transferred
on a membrane and specific proteins were stained with antibodies. These specific proteins could be
visualized by chemiluminescence.
10.1 Protein extraction The samples in 2ml tubes of which the proteins had to be extracted were flash frozen and a sterile
metal bead was added to the tubes. They were then shaken in a TissueLyser (QIAGEN, Hilden,
Germany) at 20 Hz for 30 seconds. To these grinded samples, extraction buffer (100mM phosphate
buffer pH 8, 1mM EDTA, 10% v/v glycerol, 1% v/v Triton X-100, 7mM β-mercaptoethanol, 100mM

35
NaF, 1mM NaVO3, 1mM Na3VO4, 10mM Na4P2O7, 10mM N-ethylmaleimide and protease inhibitor)
was added, vortexed and held on ice for 30 minutes. After centrifugation, the supernatant was
transferred to a new Eppendorf tube and held on ice. The protein concentration was measured with
a (BioRAD) Bradford assay and Bovine Serum Albumin (BSA) as standard.
10.2 Electrophoresis To separate the proteins, a sodium dodecyl sulphate polyacrylamide gel electrophoresis (SDS-
PAGE) was used. For this, gels had to be made. The gels consisted out of two parts: the lower part
was the resolving gel for separating the proteins and the upper part was the stacking gel that
concentrates the proteins just before the separation. Various types can be made of the resolving gel,
depending on the molecular weight of the protein of interest. In this case, a 12% SDS resolving gel
and a 5% stacking gel were made (Table 4-3). The resolving gel was poured between two cleaned
glass plates and after polymerisation of the gel, the stacking gel was put on top of it. A comb was
placed in this upper gel to obtain wells. The acrylamide gel was obtained by cross-linking acrylamide
with bisacrylamide. Table 4-3: Resolving and stacking gel for gel electrophoresis.
Resolving gel (12%) Stacking gel (5%)
H2O 4.9 ml 6.8 ml
30% acryl-bisacrylamide mix 6.0 ml 1.7 ml
1.5M Tris 3.8 ml (pH 8.8) 1.25 ml (pH 6.8)
10% SDS 0.15 ml 0.1 ml
10% ammonium persulfate 0.15 ml 0.1 ml
TEMED 0.006 ml 0.01 ml
The glass plates with the gel were placed in an electrophoresis tank (Mini Protein IITM, BIO-RAD),
filled with 1x SDS-PAGE buffer (100 ml 10x SDS-PAGE & WB stock: 650 ml milli-Q water, 30.25 g Tris
Base and 144.20 g glycine; 10 ml 10% SDS and 890 ml milli-Q water). In the first well, a pre-stained
protein ladder (14.4-116 kDa) was loaded as a reference and in the other wells, the samples. The
samples had the next pre-treatment: 40 μg proteins of the sample was taken in a total amount of 40
μl water. 10 μl of a loading dye (150mM Tris-HCl pH 6.8, 2% w/v SDS, 10% w/v glycerol, 0.01% w/v
bromophenol blue, 0.1M w/v dithiothreitol and β-mercaptoethanol) was added and the sample was
cooked for 5 minutes to improve the denaturation. 25 μl of this pre-treated sample was loaded. The
gel was run for 80 minutes using an electric current of 100V (PowerPac 300, BIORAD).
10.3 Blotting To transfer the proteins from the gel to a nitrocellulose membrane, a sandwich board was made
that consisted out of sponges, Whatmann papers, the gel and a nitrocellulose membrane soaked in
blot buffer (100 ml 10x SDS-PAGE &WB stock, 200 ml methanol and 700 milli-Q water) (Figure 4-4).
The sandwich was then installed in the transfer tank between two electrodes (BioRAD Trans-Blot
Transfer Tank), placed on ice and filled with blot buffer. A current of 100V was applied for 80
minutes.
10.4 Blockage and antibody inoculation When the blotting was done, the membrane was blocked with 5% milk in washbuffer (100 ml 10x
TBS stock: 6.05 g Tris base, 43.9 g NaCl and milli-Q water to 500ml; 1 ml Tween 20 and milli-Q water

36
to 1l) and incubated on a shaker for 60 minutes on room temperature. Next, the membrane was
sealed in a plastic bag with the primary antibody (1:1000 diluted in washbuffer with 1% milk) against
the protein of interest. After overnight incubation on a shaker at 4°C, the membrane was three times
rinsed for 10 minutes with washbuffer. Then, the incubation with the second antibody could be
done: the membrane was again sealed in a plastic bag, now with the secondary HRP-labelled
antibody (1:1000 diluted in washbuffer with 1% milk) which is directed against the primary antibody
and incubated on a shaker for 45 minutes at room temperature. Afterwards, the membrane was
rinsed three time for five minutes with washbuffer.
Figure 4-4: Sandwich board for Western blotting.
10.5 Detection The secondary antibodies and thus the protein of interest was visualised by
electrochemiluminescence using Super-Signal® West Pico Chemiluminescent substrate (Thermo
Scientific) through the detection of peroxidise activity. The signal was caught on a film with the help
of a cassette and a film developer.
As internal control, to check whether the proteins were transferred to the membrane, the
membrane was stained for five minutes with Ponceau S (0.5% Ponceau S in 5% TCA) after blotting.
11. Statistical analysis
Statistical analysis was done with the program SPSS Statistics 22. First, normality was checked
with the Kolmogorov-Smirnow test and the Shapiro-Wilk test (α = 0.05). Homoscedasticity was then
verified with the modified Levene test (α = 0.05). If the conditions of normality and homoscedasticity
were fulfilled, the data were analysed with a One-way ANOVA / Tukey test. If there was no normality
and / or heteroscedasticity, the data was compared with non-parametric tests: a Kruskal-Wallis Rank
Sum test to examine the equality of the means and in case of significant results, the Mann-Whitney
test was used for pair-wise comparisons between any two individual groups. Statistics were done on
a 5% significant level.

37
Chapter 5
Results and discussion In Chapter 5, the performed experiments are explained, the results are given and discussed. The
experiments can roughly be divided in two parts: one part deals with protein interaction partners of
SLR1 and in the second part, PAMP treatments are used to investigate the influence of SLR1 on the
immune system in rice and to investigate the regulation of SLR1.
1. Protein interaction partners of SLR1
It is known that SLR1 interacts with the JA and SA pathways. This way, SLR1 has an influence on
the plant immune system. However it is not known with which proteins SLR1 exactly interacts with to
modulate the pathways. The goal of the next experiments is to test some proteins of these two
hormone pathways whether they interact with SLR1 or not. Further, it is also tested with a library
screening which proteins in rice interact with SLR1.
1.1 SLR1 and the SA pathway Experiment
It is known that SLR1 plays a role in the SA pathway, but how this happens is not known yet (Filipe
et al., 2014). To shed some light on this, two important proteins, OsNPR1 and OsWRKY45, of the SA
pathway were being tested if they interact with SLR1 or not. For this, RNA was extracted from
Kitaake leaves and cDNA was synthesised of it. This cDNA was then used as template for a PCR
(Phusion polymerase) to amplify the genes of OsNPR1 and OsWRKY45 with specific primers. The
genes were purified and with specific primers, attB-borders were attached to the genes in a second
PCR. This way, it was possible to ligate the constructs in the entry vector pDONR207 (Appendix 2-1)
via a BP-Gateway reaction. The goal was then to transfer the constructs via an LR Gateway reaction
in a destination vector and to do a one to one yeast two hybrid (Y2H) to check for interaction.
Results
Unfortunately it did not work out to make the construct of the genes of OsNPR1 and OsWRKY45:
the primers of WRKY45 formed a hairpin structure and the obtained construct of NPR1 did not have
the right sequence. To solve this problem, other primers could be made, an optimised PCR protocol
could be used, etc. But there was not enough time to do this, so it was not possible to check for
interaction with SLR1 in a Y2H.
1.2 SLR1 and the JA pathway (JAZ9) Besides the SA pathway, SLR1 also influences the JA pathway. In this pathway in Arabidopsis
thaliana, DELLA binds to JAZ proteins and leads them to degradation. This way, the MYC2 protein
that is normally bound to JAZ is released and can start the transcription of JA inducible genes (see

38
Chapter 2, 4.2 DELLA and plant immunity). Via this interaction, DELLA can alter the immune response
in the plant (Gao et al., 2011). If this also the case with SLR1 is not clear yet, but when is does, also
SLR1 interacts with JAZ proteins.
However, in rice, there are 15 JAZ proteins and SLR1 does probably not interact with all of them
(Lyons et al., 2013). To find out with which JAZ proteins SLR1 interacts with, some tests like a Y2H can
be performed. For such tests, a construct of SLR1 is needed, but the problem is that SLR1 exerts self-
activation activity in Y2H analyses which can lead to false positive results. To avoid this problem, a
truncated version of SLR1 can be used. In the master’s dissertation of Son Nguyen Huu, two such
truncated versions were tested: SLR1-ΔN1 and SLR1-ΔN2 (Figure 5-1). It appeared that SLR1-ΔN1 still
has some self-activation activity, but SLR1-ΔN2 not (Huu, 2014). In this master’s dissertation, the
truncated version SLR1-ΔN2 is used for protein interaction tests to avoid self-activation activity.
Figure 5-1: Schematic representation of SLR1 with some functional domains. The truncated SLR1-proteins SLR1-ΔN1 and
SLR1-ΔN2 are indicated. SLR1-ΔN2 still shows some self-activation activity like the full SLR1 protein, so SLR1-ΔN2 is used in
the protein interaction tests to avoid self-activation activity (Huu, 2014).
From those 15 JAZ proteins in rice, 7 (JAZ5-JAZ11) were tested for their ability to interact with
SLR1-ΔN2 in a one to one Y2H with blue-white screening (X-gal). The results showed that there was
no interaction between SLR1-ΔN2 and JAZ5, JAZ6, JAZ7, JAZ8, JAZ10 and JAZ11, but blue yeast
colonies (Figure 5-2) confirmed the interaction between SLR1-ΔN2 and JAZ9 (Huu, 2014).
Figure 5-2: Results of the Y2H with blue-white screening (X-gal) with the construct SLR1-ΔN2 and JAZ9 in respectively the
vectors pLexA (Appendix 2-6) and pB42 (Appendix 2-5). Of each, three repeats are shown. A) The yeast colonies
transformed with SLR1-ΔN2 and JAZ9 are blue, indicating interaction. B) and C) Controls to check whether there is no self-
activation activity of one of the constructs (Huu, 2014).

39
1.2.1 SLR1 and JAZ9 in rice cells Experiment
Son Nguyen Huu found in his master’s dissertation that in yeast, SLR1-ΔN2 interacts with JAZ9
from rice (Huu, 2014). This does not mean that there is also interaction between those two proteins
in rice. To test whether this interaction also occurs in rice cells, a split-YFP was performed in
protoplasts from cells from Kitaake rice plants, grown on GB5 medium (Appendix 1-1). Before the
test was started, the following constructs were already available: JAZ9 in the entry vector pDONR207
(Appendix 2-1) and SLR1-ΔN2 in the entry vector pDONR207 (Appendix 2-1). These constructs were
used to ligate the genes via an LR-Gateway reaction into respectively vector 728 (Appendix 2-7) and
vector 738 (Appendix 2-8). Both vectors are suited for a split-YFP. The vectors were then multiplied
by transforming them in E. coli and growing the bacteria on selective LB-medium (Appendix1-3). The
vectors were then obtained with a plasmid midiprecipitation and transformed in the protoplasts via
poly ethylene glycol (PEG) transformation (Table 5-1).
Table 5-1: Combinations that were used to transform Kitaake protoplasts to do a split-YFP test with SLR1-ΔN2 and JAZ9.
Combination Test
No plasmids Control: fluorescence of the protoplasts
SLR1-ΔN2 in 738 + empty 728 Control: fluorescence of the SLR1-ΔN2 construct
JAZ9 in 728 + empty 738 Control: fluorescence of the JAZ9 construct SLR1-ΔN2 in 738 + JAZ9 in 728 Testing the interaction between SLR1-ΔN2 and JAZ9
Results
The protoplasts seemed to have a good round shape and the nucleus could clearly be seen (Figure
5-3). So there were protoplasts and they were intact. When looking at the protoplasts with a
fluorescence microscope (blue light was used), as expected the control protoplasts did not show any
yellow fluorescence. If there would have been fluorescence, this would be caused by self-activation
activity (Figure 5-3 A).
Figure 5-3: Pictures of the split-YFP test on Kitaake protoplasts with SLR1-ΔN2 and JAZ9. A) Control (Controls with one of
the two plasmids gave the same result): as expected there is no yellow fluorescence. B) SLR1-ΔN2 + JAZ9: there is no yellow
fluorescence, so there is no interaction between the two proteins. The red fluorescence is caused by granules or artefacts.
The protoplasts that were transformed with both the construct SLR1-ΔN2 and JAZ9 did not show
yellow fluorescence either (Figure 5-3 B). In some protoplasts, some red fluorescence could be seen:
this is caused by granules (small round shapes in the nucleus or in the cytoplasm) or by artefacts. The
used blue light has a broad spectrum that not only can induce yellow, but also red fluorescence.

40
Discussion The transformed protoplast showed no yellow fluorescence, so there cannot be concluded that
there is interaction between SLR1-ΔN2 and JAZ9 in rice cells. However, the fact that there is no
fluorescence can have different causes: it can indeed be that there is no interaction at all, but it can
also be that the fluorescence is too low to detect. Another possibility is that the transformation
efficiency is too low or that the transcription and expression of the protein(s) is beneath the
detection level. This can respectively be checked by doing a qPCR with the cDNA of the extracted
RNA of the protoplasts with primers for SLR1-ΔN2 and JAZ9 and by performing a Western blot on the
extracted proteins. These controls are not done in this case because there were too little protoplasts
to have a decent amount of RNA / proteins. A last possible cause for the lack of yellow fluorescence
can be that the truncated version of SLR1, SLR1-ΔN2, is enough to have interaction in yeast, but not
enough to have interaction in rice cells. In other words: one of the missing domains of SLR1 is in this
case needed for the interaction with JAZ9 in Kitaake rice cells.
Nevertheless, there cannot be concluded that there is interaction, but at the same time it is not
sure that there is totally no interaction. The split-YFP test cannot give a decisive answer. So the
interaction has to be tested with other techniques, for example with co-immunoprecipitation.
1.2.2 Domains of SLR1 and JAZ9 needed for interaction Experiment
The Y2H shows that there is probably interaction between SLR1 and JAZ9 (Huu, 2014). On both
proteins, at least one domain will be necessary to allow the interaction. The goal of this experiment
was to find out which domains are needed. In a first step, the conserved domains of both SLR1 and
JAZ9 were identified. For SLR1, nine conserved domains were found and for JAZ9, there were two
(Table 5-2; Figure 5-4).
Table 5-2: The conserved domains of SLR1 and JAZ9, found in literature.
SLR1
Domain Amino acids Reference
DELLA 39-43 (Uniprot, 2015) VHIID 344-348 (Uniprot, 2015)
LXXLL 449-453 (Uniprot, 2015)
LHRI 241-278 (Itoh et al., 2002)
LHRII 390-427 (Itoh et al., 2005)
TVHTNP 87-104 (Itoh et al., 2002) poly S/T/V 175-237 (Itoh et al., 2002)
PFYRE 414-544 (Itoh et al., 2005)
SAW 546-620 (Itoh et al., 2005)
JAZ9
Domain Amino acids Reference
ZIM similar to JAZ1 202-224 (Melotto et al., 2008)
JAS similar to JAZ1 345-356 (Melotto et al., 2008)
With the information of the conserved domains, constructs for truncated proteins were made in
which every time one domain is missing. For this, primers were made for the part of the sequence
before the domain (F1 and R1) and for the part after the domain (R2 and R2). At the primer F2, a part
was attached that is complementary to the end of the part before the domain (Figure 5-5). This was

41
for the attachment of the two parts. With these primers, a PCR with Phusion polymerase was
performed to amplify the two parts (before and after the domain) of the sequence. The two parts
were then purified and attached to each other (hybridisation between the end of part one and the
overlap of part two) and made double stranded in an extension PCR (PCR with Phusion polymerase,
without any primers). Finally, the made constructs were amplified in another PCR and trued up.
Figure 5-4: Schematic representation of the conserved domains of SLR1 and JAZ9, found in literature (see Table 5-2). The
amino acid position is indicated with the numbers.
Afterwards, attB-borders were added to the constructs to use the Gateway ligation system, but
these primers gave the formation of dimers. To solve this problem, a Topo TA kit was used: first, an
A-tail was attached to the constructs with Taq-polymerase and this construct was then ligated in a
Topo TA/GW/PCR8 vector (Appendix 2-2), which contains a ligation-site for A-tails and a Gateway
cassette. Because there was a chance that the construct was ligated in the vector with a wrong
orientation, a restriction digest was performed to check this. For the construct of JAZ9, the restriction
enzymes EcoRV and AvaII were used and for SLR1, EcoRV and BamHI, EcoRV and BglII or EcoRV and
PstI. The good plasmids were then used to ligate the construct in the right vector for a one to one
Y2H with blue-white screening (X-gal): in vector pB42 (Appendix 2-5) or vector pLexA (Appendix 2-6).
These were transformed in chemi-competent cells of yeast Egy48 and grown on selection medium:
HUT DO medium (Appendix 1-6); pLexA has the gene for H, pB42 for T and the yeast for U. The yeast
colonies that grew were then plated on HUT DO medium with X-gal.
Figure 5-5: Primers that were made to amplify the part of the sequence before and the part after the domain.
Results
It did not work out to make the constructs for SLR1, so unfortunately, these domains could not be
tested, but the right construct for JAZ9 were obtained. These two constructs were co-transformed in
yeast along with SLR1-ΔN2. The truncated version was used to avoid self-activation activity what also
was tested again with a control in which SLR1-ΔN2 was combined with the pB42 vector that
contained a GUS gene. This GUS gene does not interact and replaces the lethal gene that is present in
the Gateway cassette. Also the two JAZ9 constructs (one without the ZIM domain and the other
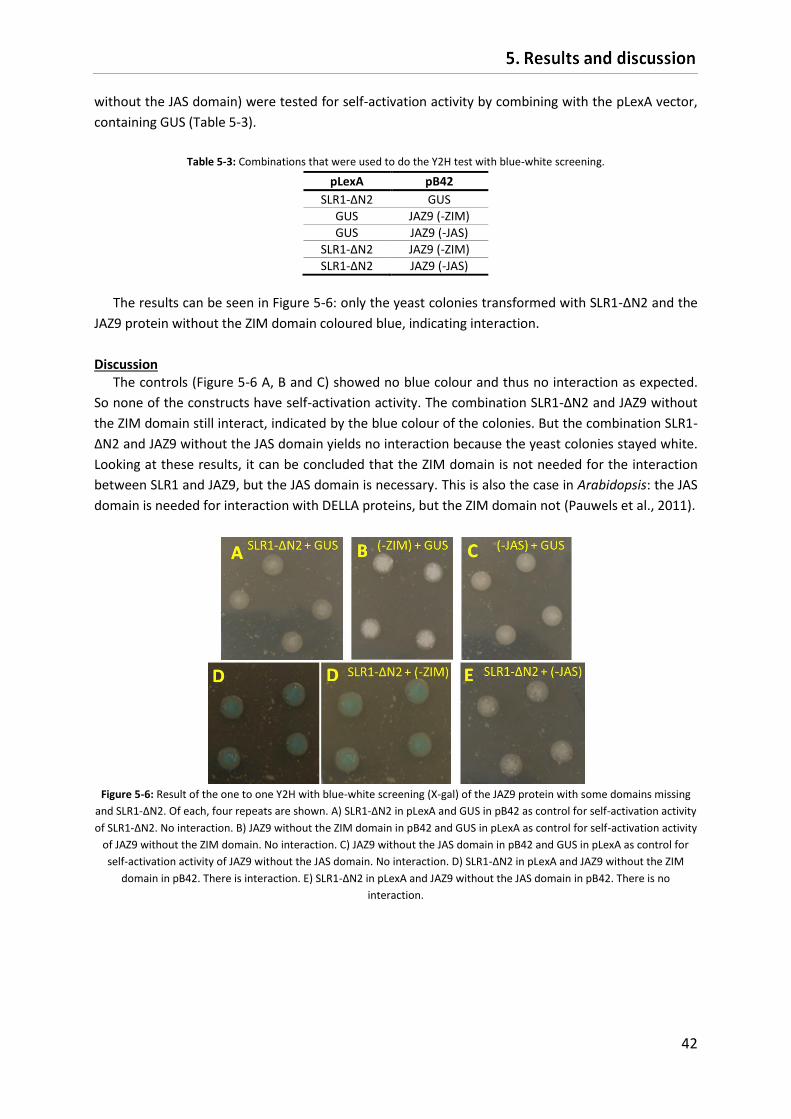
42
without the JAS domain) were tested for self-activation activity by combining with the pLexA vector,
containing GUS (Table 5-3).
Table 5-3: Combinations that were used to do the Y2H test with blue-white screening.
pLexA pB42
SLR1-ΔN2 GUS
GUS JAZ9 (-ZIM)
GUS JAZ9 (-JAS)
SLR1-ΔN2 JAZ9 (-ZIM)
SLR1-ΔN2 JAZ9 (-JAS)
The results can be seen in Figure 5-6: only the yeast colonies transformed with SLR1-ΔN2 and the
JAZ9 protein without the ZIM domain coloured blue, indicating interaction.
Discussion The controls (Figure 5-6 A, B and C) showed no blue colour and thus no interaction as expected.
So none of the constructs have self-activation activity. The combination SLR1-ΔN2 and JAZ9 without
the ZIM domain still interact, indicated by the blue colour of the colonies. But the combination SLR1-
ΔN2 and JAZ9 without the JAS domain yields no interaction because the yeast colonies stayed white.
Looking at these results, it can be concluded that the ZIM domain is not needed for the interaction
between SLR1 and JAZ9, but the JAS domain is necessary. This is also the case in Arabidopsis: the JAS
domain is needed for interaction with DELLA proteins, but the ZIM domain not (Pauwels et al., 2011).
Figure 5-6: Result of the one to one Y2H with blue-white screening (X-gal) of the JAZ9 protein with some domains missing
and SLR1-ΔN2. Of each, four repeats are shown. A) SLR1-ΔN2 in pLexA and GUS in pB42 as control for self-activation activity
of SLR1-ΔN2. No interaction. B) JAZ9 without the ZIM domain in pB42 and GUS in pLexA as control for self-activation activity
of JAZ9 without the ZIM domain. No interaction. C) JAZ9 without the JAS domain in pB42 and GUS in pLexA as control for
self-activation activity of JAZ9 without the JAS domain. No interaction. D) SLR1-ΔN2 in pLexA and JAZ9 without the ZIM
domain in pB42. There is interaction. E) SLR1-ΔN2 in pLexA and JAZ9 without the JAS domain in pB42. There is no
interaction.

43
1.2.3 RNAi elimination of SLR1 and JAZ9 in Kitaake callus Experiment
To know more about the function of SLR1, investigation about the function of its interaction
partners, such as JAZ9, is needed. In this experiment, the proteins SLR1 and JAZ9 will be eliminated in
Kitaake rice callus with the RNA-interference or RNAi system. The rice plants, regenerated out of this
callus, will then tell something about the function by being not able to do some processes by the lack
of the protein. Practically, the experiment was performed as follows: first, a piece of the sequence of
the protein (for both SLR1 and JAZ9) was chosen that is suited for the RNAi system. This means that
the piece is no part of a conserved domain and it does not show homology of more than twenty bp
with other proteins. Or in other words: it is specific for that protein. To choose this part, the database
of NCBI was used to check homology with other proteins. For JAZ9, the piece from base 750 until 950
was used and for SLR1, two pieces were chosen: 122-S, a piece of 122 bp that is located within the
DELLA domain and 60-D, a piece of 60 bp that is outside of the DELLA domain. Primers were made for
these chosen pieces DNA and they were amplified in a PCR with Phusion polymerase. The obtained
constructs were then ligated via a BP-Gateway reaction in the entry vector pDONR207 (Appendix 2-
1), followed by an LR-Gateway reaction in the vector Panda (Appendix 2-10). In this Panda vector,
two of the same pieces DNA are ligated that will form a hairpin structure after transcription. The
hairpin is needed to initiate RNAi.
The Panda vector with the constructs is in a next step transformed in the Agrobacterium strain
EHA105. The Agrobacterium cells were first made competent and the transformation happened via
electroporation. Then, the transformed Agrobacterium was used to transform Kitaake rice callus.
Agrobacterium is suited to transform plant cells because it is a plant pathogen that inserts a piece of
its own DNA in the genome of the plant (Gheysen, 2014).
Results
The Kitaake rice callus was transformed according to the described protocol (see Chapter 4:
Methodology), but in the last step, the regeneration step, the calli did not grow anymore and did not
regenerate (Figure 5-7).
Figure 5-7: The transformed calli to eliminate SLR1 or JAZ9 via the RNAi system in a solo cup with regeneration medium.
The calli did not grow or regenerate.
Discussion
The transformed calli in which SLR1 or JAZ9 was eliminated did not regenerate. It is possible that
the protein is essential for regeneration or growth and so that the callus cannot grow anymore. This

44
can be solved or tested with inducible RNAi. But it is more likely that something went wrong with the
protocol (something missing in the medium, not the right incubation, wounding of the calli, etc.) or
that it just did not work out: it is a difficult protocol and most calli never regenerate.
1.3 SLR1 and the JA pathway (JAZ2 and JAZ3) Of the 15 JAZ proteins that are present in rice only seven have been tested for interaction with
SLR1: JAZ5 through JAZ11 (Huu, 2014). Among the other eight JAZ proteins, there can still be some
interaction partners, so also these have to be tested for interaction with JAZ9.
1.3.1 Interaction SLR1 and JAZ2 / JAZ3 in yeast Experiment
Soren Seifi of the lab of Phytopathology of the University of Ghent succeeded in cloning the JAZ2
and JAZ3 proteins of rice. These were ligated in the entry vector pDONR207 (Appendix 2-1). Also an
entry clone of SLR1-ΔN2 in pDONR207 was available. These were used for LR reactions with the
destination vectors pB42 (Appendix 2-5) and pLexA (Appendix 2-6). The vectors were then
transformed in chemicompetent yeast cells (Egy48): Table 5-4. Some controls were taken into
account by transforming together with one of the two vectors containing the GUS gene that replaces
the lethal gene in the Gateway cassette. With the controls, the self-activation activity of the
constructs is tested.
The transformed yeast was grown on HUT DO medium (Appendix 1-6) to select for yeast that was
transformed with both vectors. The vector pLexA contains the gene for histidine, pB42 for
tryptophan and the yeast for uracil. The growing colonies were plated on fresh HUT DO medium to
confirm the transformation and then plated on HUT DO medium with X-gal to perform the Y2H.
Table 5-4: Combinations that were used to do the Y2H with blue-white screening.
pLexA pB42
SLR1-ΔN2 GUS
GUS JAZ2
GUS JAZ3
SLR1-ΔN2 JAZ2 SLR1-ΔN2 JAZ3
Results
The results can be seen in Figure 5-8. For the combinations of GUS and SLR1-ΔN2 or JAZ2, the
colonies stayed white. Those of GUS and JAZ3 and SLR1-ΔN2 and JAZ3 became in some cases blue
and the yeast with SLR1-ΔN2 and JAZ2 were in four of the five cases blue.
Discussion The control for self-activation activity of SLR1-ΔN2 and JAZ2 did not give blue colonies, so for
these two proteins there is no self-activation activity. For JAZ3 there is self-activation activity since
there were some blue colonies. The combination of SLR1-ΔN2 and JAZ3 resulted also in some blue
colonies, but these may be caused by the self-activation activity of JAZ3. So for JAZ3, it is not clear
whether there is interaction with SLR1-ΔN2 or not, but probably not because then, more colonies

45
would have become blue. However, for the combination SLR1-ΔN2 and JAZ2, more blue colonies
were obtained while in the controls, there were none. So for JAZ2, it can be concluded that there is
interaction with SLR1.
Figure 5-8: Result of the one to one Y2H with blue-white screening of SLR1-ΔN2 and JAZ2/JAZ3. Of each combination, five
repeats are shown. A) SLR1-ΔN2 in pLexA and JAZ2 in pB42. There is interaction. B) SLR1-ΔN2 in pLexA and JAZ3 in pB42. No
interaction: too little blue colonies in comparison with the control. C) GUS in pLexA and JAZ2 in pB42 as control for self-
activation activity for JAZ2. No interaction. D) GUS in pLexA and JAZ3 in pB42 as control for self-activation of JAZ3. There is
some self-activation activity. E) SLR1-ΔN2 in pLexA and GUS in pB42 as control for self-activation activity of SLR1-ΔN2. No
interaction.
1.3.2 SLR1 and JAZ2 in rice cells Experiment
Again, like with JAZ9, the interaction between SLR1 and JAZ2 has to be proven in rice cells. In
order to test this, the constructs of SLR1-ΔN2 and JAZ2 in the entry vector pDONR207 (Appendix 2-1)
that were made for the Y2H, were now used to recombine both genes in the destination vectors 738
(Appendix 2-8) and 728 (Appendix 2-7), respectively. These expression clones were then multiplied
by transforming in E. coli, growing E. coli on selection medium (LB medium + carbenicillin: Appendix
1-3) and by performing a plasmid midiprecipitation. In a next step, the constructs were transfected in
Kitaake rice protoplasts via PEG transformation. Different combinations were used to test the
constructs for autofluorescence and to assess the possible interaction between SLR1-ΔN2 and JAZ2
(Table 5-5). Protoplasts were investigated using fluorescence microscopy.
Table 5-5: Combinations that were used to transform Kitaake protoplasts to do a split-YFP test with SLR1-ΔN2 and JAZ2.
Combination Test
No plasmids Control: fluorescence of the protoplasts
SLR1-ΔN2 in 738 + empty 728 Control: fluorescence of the SLR1-ΔN2 construct
JAZ2 in 728 + empty 738 Control: fluorescence of the JAZ2 construct SLR1-ΔN2 in 738 + JAZ2 in 728 Testing the interaction between SLR1-ΔN2 and JAZ2
Results
The protoplasts looked very nice: a round shape and a clear nucleus. Importantly, the empty
vector controls exhibited no yellow fluorescence. However, just like the transformed protoplasts in

46
the test with SLR1-ΔN2 and JAZ9, there was again some red fluorescence. This can be explained by
artefacts or granules.
When looking under the fluorescence microscope, some of the protoplasts transformed with
SLR1-ΔN2 and JAZ2 showed some yellow fluorescence. There were only very few of them and the
signal was not very strong.
Discussion The controls indicated that there was no yellow fluorescence of the constructs on their own
(Figure 5-9 A). So the yellow fluorescence that can be seen in the nucleus of the protoplasts
transformed with SLR1-ΔN2 and JAZ2, indicates interaction between the two proteins (Figure 5-9 B).
It is logic that the fluorescence is present in the nucleus because SLR1 is a nuclear protein.
However, the fact that only very few protoplasts showed fluorescence does not give complete
certainty about the interaction of SLR1 and JAZ2. It is possible that the yellow fluorescence is the
results of artefacts. But it is also possible that the transformation efficiency is too low or the signal of
the yellow fluorescence is too low to detect.
To conclude: there is a strong indication that there is interaction between SLR1 and JAZ2, but the
interaction has to be proven with alternative approaches such as co-immunoprecipitation.
Figure 5-9: Pictures of the split-YFP test on Kitaake protoplasts with SLR1-ΔN2 and JAZ2. A) Control (Controls with one of
the two plasmids gave the same result): as expected there is no yellow fluorescence. B) SLR1-ΔN2 + JAZ2: some of the
protoplasts showed yellow fluorescence in the nucleus, but there were not many.
Thus, although it is known that SLR1 and DELLAs in general bind with JAZ proteins, DELLAs do not interact with all the JAZ proteins. Thus far, in rice only OsJAZ2 and OsJAZ9 from the 15 JAZ proteins seem to interact with SLR1. In Arabidopsis, the Della proteins GAI and RGL1 only interact with AtJAZ1 and the DELLA protein RGA interacts with AtJAZ1, AtJAZ3 and AtJAZ9 of the 12 JAZ proteins (Pauwels et al., 2011). With this fact, different conclusions can be taken: the JAZ proteins do not have the same functions, DELLAs do not interfere in the functioning of all the JAZ proteins and there are probably more regulation pathways than those with JA and DELLA to induce transcription of JA responsive genes (see Figure 2-12, Chapter 2).

47
1.4 SLR1 library screening Experiment
Besides the GA, JA and SA pathway, there are probably more pathways in which SLR1 plays a role
and thus other proteins with which SLR1 interacts. To investigate those other protein interaction
partners, a library screening with SLR1 is performed.
The library itself was made by a commercial company. To enhance library coverage, samples of
rice plants (japonica cultivar Nipponbare) exposed to different stresses were pooled. Then the RNA
was extracted, cDNA was made of this RNA and the obtained cDNAs were ligated in the pDEST22
vector (Appendix 2-4).
Besides the library, also a construct of SLR1-ΔN2 was needed: an available construct of SLR1-ΔN2
in the entry vector pDONR207 (Appendix 2-1) was used to recombine the sequence in destination
vector pDEST32 (Appendix 2-3) via an LR-Gateway reaction.
The next step was to test for self-activation activity. This self-activation activity has to be avoided
because false positives are not wanted. If there is any self-activation activity, strong or weak, it can
be inhibited by adding 3-amino-triazol (3-AT) to the medium. But the right concentration had to be
found: enough to inhibit even weak self-activation activity, but not too much to avoid false negatives.
To find the right concentration, the following was done: chemicompetent cells of the yeast strain
mav203 were cotransformed with SLR1-ΔN2 in vector pDEST32 and GUS in vector pDEST22 (GUS
replaces the lethal gene in the Gateway-cassette and has no self-activation activity). The transformed
yeast was selected on TL DO medium (Appendix 1-6): the pDEST32 vector contains a leucine
biosynthetic gene and pDEST22 for tryptophan, so yeast that contains both vectors should be able to
grow on the medium. The yeast colonies that grow on the medium were then plated on TLH medium
that contained different concentrations of 3-AT. This medium also missed histidine, which was in this
case the reporter gene: the gene is present in the yeast, but the transcription can only be induced
when the DNA-binding domain and the DNA-activation domain come together by interaction of two
proteins or when there is self-activation activity. The right 3-AT concentration was then the lowest
concentration that inhibits this transformed yeast to grow.
When the right 3-AT concentration was found, the actual library screening could be performed.
First, chemicompetent yeast cells of the strain mav203 were transformed with SLR1-ΔN2 in pDEST32
and selected on L DO medium. Of these transformed yeast, chemicompetent cells were made and
transformed with the library. An alternative protocol for the yeast transformation (see Chapter 4:
methodology) was used: 500 μl chemicompetent cells with SLR1-ΔN2 in pDEST32 were combined
with 12 μl of the library DNA (in pDEST22) and 5ml of the EZ3 solution. This was incubated for 3
hours at 30°C and plated out on -TLH DO medium with the right 3-AT concentration. The yeast
colonies that grew on these plates and thus showed interaction between proteins, were plated on
fresh medium to confirm the interaction. A plasmid prep was performed on the colonies that still
grew to obtain the plasmids (pDEST32 and pDEST22) and those were then transformed in E. coli. The
transformed E. coli was grown on LB medium with carbenicillin (Appendix 1-3) to select for the
pDEST22 vector that contained the sequence for the unknown protein that interacts with SLR1. After
a bacterial plasmid precipitation, the pDEST22 vectors with the unknown proteins were finally sent
for sequencing.

48
Results For the self-activation activity test, four concentrations of 3-AT were tested: 0 mM, 10 mM, 25
mM and 50 mM. On the plates with TLH DO medium without 3-AT and containing 10 mM 3-AT, the
transformed yeast with SLR1-ΔN2 in pDEST32 and GUS in pDEST22 did still grow, thus these
concentration did not inhibit the self-activation activity (Figure 5-10). Although, the yeast on the
medium with 10 mM 3-AT grew less than that on the medium without 3-AT: there is already a bit of
inhibition of the self-activation activity. On the plates with 25 mM or 50 mM, the transformed yeast
that was spread out on the plates, did not grow anymore. So the optimal concentration lies between
10 mM and 25 mM. For the library screening, a concentration of 20 mM 3-AT was chosen.
Figure 5-10: Test for the right concentration of 3-AT to inhibit self-activation activity. On the medium without and with 10
mM 3-AT, the yeast transformed with SLR1-ΔN2 in pDEST32 and GUS in pDEST22 still grew. The media with 25 mM or 50
mM 3-AT inhibits the plated yeast to grow, so the optimal concentration lies between 10 and 25 mM 3-AT.
The transformation efficiency of the library screening was calculated by counting transformed
yeast colonies on plates with TL DO medium. We obtained: 7.7 x 10⁵ colonies which is close to the
optimal transformation efficiency of 106 colonies.
In the library screening itself, 48 colonies were obtained of which 45 still grew on fresh medium.
After the plasmid precipitation, the E. coli selection step only gave 38 different plasmids that were
sent for sequencing. The analysis of these sequences gave 18 results of which 17 are different.
The blast results against the NCBI rice database resulted in proteins that are found in the Japonica
cultivar. The function of some of these proteins is known, but others are not. A possible function of
this last group of proteins was predicted, based on the conserved domains, homology and
information from literature. The results can be found in Table 5-6 and are summarized in Figure 5-11.
Discussion First, there has to be mentioned that with a yeast library screening not all of the protein
interaction partners of SLR1 will be found. Some proteins that normally interact with SLR1 are not a
part of this test because they are not present in the library or in the part of the library that is
transformed in the yeast. It is also possible that the interaction was too weak to detect, that the
sequence was lost during the recovery of the plasmids or that the truncated version of SLR1, SLR1-
ΔN2 was not enough to bind. Nevertheless, the test can give interesting results about unknown
interactions and function of SLR1. It only has to be taken into account that these results may not
cover all (possible) interaction partners of SLR1.

49
Table 5-6: The protein interaction partners of SLR1 that were found with the library screening. The exact functions of these
proteins are not known yet, but a possible function based on conserved domains, homology and literature is given.
No BLAST result: RAP (Tigr) No
Conserved in Protein Conserved domains Possible function in:
1 Os02g0465900
(LOC_Os02g26700) fruit fly, mosquito,
A.thaliana
ChaC-like protein family protein: antiporter-regulating protein =
OsARP
ChaC and GGCT-like domain, also called
AIG2-like family
Cation transport: salt tolerance by pumping the Na
+ into vacuoles
(Avr-induced gene)
4 Os03g0268000
(LOC_Os03g16110.1)
human, chimpanzee, Rhesus monkey, dog, cow, mouse, chicken,
zebrafish, fruit fly, mosquito, S.pombe,
A.thaliana, frog
Ser/Thr protein phosphatise PP1
protein phosphatase type 1 (PP1)
Phosphoprotein phosphatase activity (mRNA surveillance
pathway)
5
Os11g0127700 (LOC_Os11g03380) or Os12g0123900 (LOC_Os12g03060)
/ Hypothetical protein / Cytoplasmic
membrane-bounded vesicle (GO)
14 Os05g0156500
(LOC_Os05g06440)
human, chimpanzee, dog, cow, mouse, rat,
chicken, zebrafish, fruit fly, mosquito, C.elegans,
A.thaliana, frog
Similar to Apobec-1 binding protein 2 / DnaJ
homolog subfamily B member 11
DnaJ-class molecular chaperone with C-terminal Zn finger
domain
Posttranslational modification, protein turnover, chaperones; function in the ER (can
have a role in stress response)
15 Os04g0650000
(LOC_Os04g55650) /
Similar to Oryzain alpha chain precursor =
cysteine endopeptidase
Cathepsin (C1) Peptidase
Proteolysis (role in disease resistance and
stress tolerance)
21 /
36
Os03g0565500 (LOC_Os03g36780)
human, chimpanzee, Rhesus monkey, dog,
cow, mouse, rat, chicken, zebrafish, fruit
fly, mosquito, C.elegans, S.cerevisiae, K.lactis, E.gossypii, S.pombe, M.oryzae, N.crassa,
A.thaliana, frog
Similar to Elongation factor G 1,
mitochondrial precursor (mEF-G-1)
Elongation factor G (EF-G = translocase)
Involved in both the elongation and
ribosome recycling phases of protein
synthesis (mitochondrial)
22 Os11g0704500
(LOC_Os11g47809) /
Metallothionein-like protein type 1 = OsMT-
I-1a Metallothionein
Metal binding protein: Zn homeostasis,
drought tolerance and protection against
oxidative stress
23 Os12g0514100
(LOC_Os12g32950) /
Ribosome associated membrane protein =
RAMP4 / Stress-associated endoplasmic
reticulum protein 1 = SERP1
Ribosome associated membrane protein
RAMP4
Stabilizes membrane proteins during stress
and facilitates subsequent
glycosylation
27 Os06g0644100
(LOC_Os06g43650) /
Carboxypeptidase regulatory region
domain containing protein / secreted
salivary protein
Carboxypeptidase regulatory region
and DUF2012 (unknown function)
Protease (and cellular signal transducer)
29 Os09g0504700
(LOC_Os09g32690) /
Zinc finger, RING-type domain containing
protein
RING-finger (Really Interesting New Gene) domain
Protein folding, sorting and degradation and ubiquitin mediated
proteolysis (contribution to the post-translational
modification of target proteins during plant
responses to environmental stresses)

50
34 Os03g0177400
(LOC_Os03g08010)
human, chimpanzee, Rhesus monkey, dog,
cow, mouse, rat, chicken, zebrafish,
A.thaliana, frog
EF-1 alpha = OseEF-1A Elongation Factor 1-
alpha (EF1-α)
RNA transport: alpha subunit of EF1 which is
responsible for the GTP-dependent binding of
aminoacyl-tRNAs to the ribosomes
37 Os04g0179700
(LOC_Os04g10060) /
Syn-pimara-7,15-diene synthase = ent-kaurene
synthase 4 = OsKS4
Terpene Cyclase and ent-kaur-16-ene
synthase
Diterpenoid biosynthesis: first step
in making momilactone A (antimicrobial and allelopathic agent)
39 Os02g0626400
(LOC_Os02g41650) M.oryzae, N.crassa,
A.thaliana
Phenylalanine ammonia-lyase (PAL) =
phenylalanine deaminase = OsPAL2
Phenylalanine ammonia-lyase
Phenylalanine metabolism: trans-
cinnamate forming (can lead to the pathways
for structural and biochemical response)
40 Os03g0408500
(LOC_Os03g29470) /
Transcription factor TAFII-31 / transcription
initiation factor IID
TATA Binding Protein (TBP)
Associated Factor 9 (TAF9)
Basal transcription factor
42 Os09g0424300
(LOC_Os09g25620)
human, chimpanzee, dog, cow, mouse, rat,
chicken, zebrafish, fruit fly, mosquito, C.elegans,
S.cerevisiae, K.lactis, E.gossypii, S.pombe, M.oryzae, N.crassa,
A.thaliana, frog
S-adenosylmethionine decarboxylase =
OsSAMDC4
S-adenosylmethionine
decarboxylase
Arginine and proline metabolism: production
of spermidine and spermine (growth
modulation / differentiation and response to abiotic
stress)
47 Os01g0626400
(LOC_Os01g43650) /
WRKY transcription factor 11 = semidwarf and late flowering 1 (Dlf1) = OsWRKY11
WRKY DNA -binding domain, zinc finger
domain
Pleiotropic effect on a variety of traits,
including flowering time, plant height, grain number and leaf rolling.
Late flowering = surviving strategy.
48 Os05g0595400
(LOC_Os05g51700)
human, chimpanzee, dog, cow, mouse, rat,
chicken, zebrafish, A.thaliana
Similar to Nucleoside diphosphate kinase III =
OsNDPK3
nucleoside-diphosphate kinase
ADP, ATP, GDP, ATP, UDP, UTP, CDP and CTP
synthesis (purine and pyrimidine
methabolism, biosynthesis of
secondary metabolites and antibiotics; needed in coleoptile elongation
and stress response)
References: Lib 1: (NCBI, 2015s) (NCBI, 2015h) (Getentry, 2008b) (Uddin et al., 2008) / Lib 4: (Bajsa et al., 2011) (NCBI,
2015v) (NCBI, 2015j) (Oryzabase, 2011d) (KEGG, 2015g) / Lib 5: (NCBI, 2015af) (NCBI, 2015ah) (Getentry, 2008c) (Getentry,
2008e) / Lib 14: (Lau et al., 2001) (Sarkar et al., 2013) (NCBI, 2015aa) (NCBI, 2015a) (NCBI, 2015b) (Getentry, 2008a) (KEGG,
2015i) / Lib 15: (NCBI, 2015z) (NCBI, 2015i) (NCBI, 2015m) (CNProt, 2015) (HanaDB-OS, 2015c) (Oryzabase, 2015b) / Lib
21,36: (NCBI, 2015x) (NCBI, 2015f) (NCBI, 2015g) (HanaDB-OS, 2015b) / Lib 22: (Kumar et al., 2012) (Yang et al., 2009) (NCBI,
2015ag) (HanaDB-OS, 2015g) (Oryzabase, 2015a) / Lib 23: (NCBI, 2015ai) (NCBI, 2015n) (Getentry, 2015b) (GenomeNet,
2015) / Lib 27: (NCBI, 2015ac) (NCBI, 2015c) (InterPro, 2015) (HanaDB-OS, 2015e) / Lib 29: (Lim et al., 2013) (NCBI, 2015ae)
(NCBI, 2015o) (HanaDB-OS, 2015f) (KEGG, 2015a) / Lib 34: (NCBI, 2015u) (NCBI, 2015d) (NCBI, 2015e) (Oryzabase, 2011c)
(KEGG, 2015f) / Lib 37: (Xu et al., 2007) (NCBI, 2015y) (NCBI, 2015q) (AmiGO2, 2015) (Oryzabase, 2011b) (KEGG, 2015e)
(Kato-Noguchi et al., 2008) / Lib 39: (NCBI, 2015t) (NCBI, 2015l) (Oryzabase, 2011a) (RiceNetDB, 2013) (KEGG, 2015d)
(Tonnessen et al., 2014) (Hayashi et al., 2014) / Lib 40: (NCBI, 2015w) (NCBI, 2015p) (HanaDB-OS, 2015a) (KEGG, 2015h) /
Lib 42: (Carbonell et al., 2009) (Thu-hang et al., 2002) (Li et al., 2000) (NCBI, 2015ad) (Capell, 2004) (Getentry, 2015a)
(Oryzabase, 2011e) (KEGG, 2015c) / Lib 47: (Ross et al., 2007) (NCBI, 2015r) (Oryzabase, 2015c) (Getentry, 2008d) (Cai et al.,
2014) (Peña-Castro et al., 2011) / Lib 48: (Cho et al., 2004) (Pan et al., 2000) (NCBI, 2015ab) (NCBI, 2015k) (KEGG, 2015b)
(HanaDB-OS, 2015d) (KEGG, 2015j)

51
Figure 5-11: Schematic representation of the (possible) functions of the SLR1 interaction partners, found with the library
screening. All the proteins lead to three groups of functions: stress and defense response, developmental processes or
signal transduction and protein regulation. Sharp arrows indicate positive interactions, blunted arrows indicate negative
interactions and dotted arrows indicate interactions of with it is not known if it is positive or negative.
The 17 proteins that were found with the library screening show diverse functions (Table 5-6).
Some of them have already being studied, but others not: these proteins need further research to
define their exact function. Why, when and how (positive or negative) SLR1 interacts with these
proteins is not known yet either. However, the (possible) functions of the proteins can roughly be
divided in three groups: proteins that induce a stress or defense response, proteins that regulate
developmental processes and proteins that play a role in signal transduction or protein regulation
(Figure 5-11). The first group includes proteins like OsPAL2, OsARP and OsKS4. Within this group
involved in stress or defense responses, the interaction partners have various functions: from the
production of antimicrobial compounds such as momilactone A (OsKS4) to protein stabilization
(RAMP4) or even the opposite, proteolysis (oryzain alpha chain precursor) that both lead to stress
tolerance. It is also important to mention that not only abiotic stress tolerance is obtained with this
group of proteins (for example salt tolerance with OsARP), but also resistance against biotic threats
(production of momilactone A, an antimicrobial compound). It is only not known yet whether SLR1
improves or inhibits these tolerances and resistances. SLR1 can thus improve resistance or induce
susceptibility by interacting with these proteins and the subsequent pathways.
OsWRKY11, OsSAMDC4 and OsMT-I-1a lead to developmental processes, the second group that
can be distinguished. Two of these proteins, OsMT-I-1a and OsSAMDC4, are also linked with stress
and defense responses, indicating that SLR1 probably regulates the trade-off between growth and
defense. Also the late flowering, induced by WRKY11 and thus by SLR1 can be seen as a surviving
strategy. So again, SLR1 has its influence on defense by changing developmental processes.
The last group contains proteins like transcription factors (TFIID), elongation factors (mEF-G-1,
OseEf-1a) and proteases (carboxypeptidase regulatory region domain protein). The proteins in this
group perform regulation in several ways: they play a role in signal transduction pathways
(carboxypeptidase regulatory region domain protein), modifying proteins (DnaJ homolog), synthesis
or degradation of proteins (RING finger containing protein) or regulation at DNA level (transcription

52
factors such as TFIID). This can eventually also lead to a stress / defense response or developmental
processes, but can also be involved in other pathways such as primary metabolism etc. Or it is even
possible that these proteins aren’t activated or repressed by SLR1, but that they modify SLR1 itself
ant thereby alter the functioning of SLR1.
The obtained results seem logic: it is known that DELLAs play a role in defense, growth and
development and signal transduction. For example: SLR1 is known to alter plant immunity by
interacting with the JA and SA pathways in rice and also in Arabidopsis, it is proven that the DELLA
proteins have a role in plant immunity (Navarro et al., 2008). Further, it is proven that DELLAs and
SLR1 have an influence in growth and developmental processes, mostly to alter the growth/defense
balance in favour of defense. Think about GA, PIF proteins (hypocotyl elongation), ALC (fruit
patterning) or SPL (floral transition: via this protein, DELLA will induce late flowering like SLR1 does
this by interacting with OsWRKY11) (De Bruyne et al., 2014)(de Lucas et al., 2008)(Arnaud et al.,
2010)(Yu et al., 2012). And finally, DELLAs in general are also known to play a role in signal
transduction, pathway interactions, protein stabilisation and regulation of gene transcription (De
Vleesschauwer et al., 2012)(la Rosa et al., 2014). So, it is clear that the general functions of these
found interaction partners fulfil the expectations, but many of them were not known to interact with
SLR1. This shows that SLR1 has a broader influence then currently thought and that more proteins
and pathways are involved in the functioning of SLR1. It would thus be interesting to do further
research about these interaction partners, their functioning and the pathways in which they play a
role.
2. SLR1 and PAMP treatments
In this series of experiments, the influence of treatment with Pathogen Associated Molecular
Patterns (PAMPs) on SLR1 is examined. Specifically, we aimed to investigate the influence of these
PAMPs on the translocation and stability of SLR1 and changes in the influence of SLR1 on the
immunity of rice against Cochliobolus miyabeanus.
The PAMPs used are lipopolysaccharides (LPS) and chitin. LPS are present in (gram negative)
bacteria whereas chitin is present in the cell wall of fungi. Both are used in a concentration of 0.1 mg
/ ml and are dissolved in water.
2.1 Treatment of Kitaake protoplasts with SLR1-GFP Experiment
The goal of this experiment is to investigate if PAMPs can induce a translocation of the SLR1
protein from the nucleus to the cytoplasm. Kitaake rice protoplasts were transformed with the
vector Ubi-smGFP-1300 (Appendix 2-9) which expresses a GFP-tagged version of SLR1. This construct
was obtained by using vector pDONR207-SLR1 (Appendix 2-1), that was already available in the lab,
for an LR-Gateway reaction to recombine SLR1 in the Ubi-smGFP-1300 vector.

53
After the transformation, the protoplasts were treated with water (control), LPS (0.1 mg/ml) or
chitin (0.1 mg/ml) and looked at under a fluorescence microscope with blue light excitation. The SLR1
protein was visualized with the help of the green fluorescence.
Some Kitaake rice protoplast were also transformed with the GFP protein to control the
transformation efficiency. GFP is present in the whole cell and is always expressed what makes the
protein very visible in the cell. Other protoplasts were not transformed to check for auto-
fluorescence.
Results
As expected, the protoplasts transformed with GFP showed a clear green fluorescence in the
whole cell. Also a great part of all the protoplasts gave a fluorescent signal. So for the control, the
transformation efficiency for this transformation is good. The transformation efficiency of the
protoplasts transformed with SLR1-GFP was a bit lower: there were less protoplasts and the signal
was also weaker (Figure 5-12). According to expectations, the SLR-GFP signal was only seen in the
nucleus, confirming the nuclear presence of the fusion protein.
Figure 5-12: Transformed Kitaake rice protoplasts. A) Transformed with SLR1-GFP. There is some green fluorescence in the
nucleus. B) Transformed with GFP. There is green fluorescence in the whole cell.
Although the transformation was successful, the expression of SLR1-GFP was too low to do the
test: the signal was too weak to follow. Reasons for this low signal can be: the transformation
efficiency was lower than that of GFP because the SLR1-GFP construct is larger. It is also possible that
the transcription of the SLR1-GFP was too low, that the protein was too much degradated by GA (Gao
et al., 2011), that the SLR1-GFP protein was not stable enough or that the concentration of SLR1 was
already high enough so that the cell did not need to transcribe SLR1-GFP.
To check the concentration and stability of the SLR1-GFP protein, the proteins were extracted
from the protoplasts (both from those transformed with GFP and with SLR1-GFP) and used in a
Western blot with antibodies against GFP. For GFP, a band of 27 Da could be seen, so this protein is
clearly present in the protoplasts. But for SLR1-GFP, the expected band of 92 Da was not found. So
probably, the concentration of SLR1-GFP was too low in the protoplasts (Figure 5-13).
To solve this problem and thus to increase the concentration of SLR1-GFP, the rice plants grown
to make protoplasts were grown on GB5 medium (Appendix 1-1) with paclobutrazole (PAC, 50 μM).
PAC is a GA-inhibitor and thus prevents the GA-mediated degradation of SLR1(-GFP). But besides
that, it also prevents normal growth and this resulted in small plants. As a consequence, the

54
protoplasts of these plants were misshapen and broke easily open and the transformation resulted in
a very low efficiency. So again, the treatment with the PAMPs could not be performed.
Figure 5-13: Western blot with the proteins extracted from the transformed protoplasts.
Discussion
The first transformation of the Kitaake rice protoplasts with SLR1-GFP confirmed that in normal
conditions (without stress) the SLR1 protein is indeed located in the nucleus (Itoh et al., 2005).
Unfortunately, the treatment with the PAMPs could not be done, so the possible migration of the
SLR1 protein due to the PAMPs, could not be followed.
2.2 Treatment of callus SLR1-YFP rice line Experiment
Besides the migration of SLR1, also the concentration of SLR1 (degradation and production) and
the influence of SLR1 on the immune response, caused by PAMPs can be examined. To do this, an
experiment with callus of a transformed rice line overexpressing SLR1-YFP was used. Callus and thus
no rice leaves were used to test whether similar tests could be done with callus instead of leaves. It
takes less time to grow callus than leaves which makes the use of callus preferable.
Callus was treated with 2 ml of cell culture medium (Appendix 1-8) that contained 0.1 mg/ml LPS
or chitin or that contained nothing extra (control) and then incubated on 28°C on a shaker. After 30
minutes, 2 hours, 4 hours and 24 hours, two samples were taken of each treatment. One sample was
used to extract the proteins and to perform a Western blot with antibodies against the YFP protein.
The goal of this Western blot is to see if the level of SLR1 changes by the treatment with PAMPs.
The other of the two samples was used to extract the RNA, make cDNA of it and to perform a q-
RT-PCR with PAMP Triggered Immunity (PTI) marker genes: OsMLO, OsPAL1, Osβ-glucanase and
OsWRKY62. MLO is a modulator of defense and cell death which is responsive to (a)biotic stress
stimuli (Piffanelli et al., 2002); PAL stands for Phenylalanine Ammonia Lyase and is an important
enzyme in the phenylpropanoid pathway which causes structural and biochemical immune responses
(Höfte, 2015); β-glucanase is a Pathogenesis related (PR) gene (Höfte, 2015) and WRKY62 is a SA
responsive gene (Kim et al., 2008). The expression of these genes can indicate whether the plant
immune response is promoted or downregulated by the PAMP treatments. The combined results of
the Western blot and the q-RT-PCR should then relate the SLR1 concentration with the induced or
downregulated immune response.

55
Results A Western blot was performed with the proteins of the samples of the different treatments and
time points. The Poinceau staining indicated that there were proteins captured and separated on the
membrane. But after the staining with antibodies, no bands could be seen, indicating that no SLR1-
YFP could be found. It can be that something went wrong during the protocol, but another reason
can be that the SLR1-YFP construct was lost in the rice line. To check this, some of the calli were
grown on selective medium: MSD medium with 50 mg/l G418 (disulphate salts). But the calli did still
grow, so the construct was present in the rice calli. PCR genotyping further confirmed these results.
Another option is that the concentration of SLR1-YFP was too low to detect.
The results of the q-RT-PCR can be found in Figure 5-14.
Figure 5-14: Results of the q-RT-PCR with PTI marker genes on cDNA of RNA of SLR1-YFP rice callus treated with PAMPs (LPS
or chitin). The normalisation is done with the values of the housekeeping gene Actin.
Discussion
The possible change in SLR1 level due to the PAMP treatment could not be detected because the
Western blot was not successful. However, the results of the q-RT-PCR indicate that the callus tissue
was responsive to the PAMPs: the expression of the PTI related genes is in most cases higher for the
PAMP treatment in comparison with the control. Especially the chitin treatment induces a higher
response which is biggest after 24 hours for MLO, 4 hours for PAL1 and 2 hours for β-glucanase and
WRKY62. However, compared to the effects observed in chitin-treated leaf material, these
transcription alterations are rather limited (De Vleeschauwer et al., 2015).
The fact that there is a response is good to know: it means that callus can be used for indication
tests, but when a clear result is wanted, it is better to use leaves, roots or the whole plant.

56
2.3 Leaf treatment of SLR1 mutant rice lines Experiment
For the next experiments, some mutant rice lines are used that have different levels of SLR1 (see
Chapter 4: Methodology). In a first experiment, the role of the level SLR1 on the induction of defense
genes and the response on PAMP treatment was investigated. Practically, pieces (± 3 cm) of the
youngest two leaves of the rice plants were taken and treated with water (control), LPS (0.1 mg/ml)
or chitin (0.1 mg/ml). They were incubated for four hours on room temperature and of each, two
samples were taken. From these samples, the RNA was extracted, cDNA was made and a q-RT-PCR
was performed with four PTI marker genes: OsMLO, OsPAL1, Osβ-glucanase and OsWRKY62.
Results The results of the q-RT-PCR can be found in Figure 5-15.
Figure 5-15: Results of the q-RT-PCR with PTI marker genes on cDNA of RNA of SLR1 mutant rice leaves, treated with PAMPs
(LPS or Chitin). The wild type T65 has a normal, low level of SLR1; the mutant lines gid1-8 and SLR1-d3 have an intermediate
level of SLR1 and gid2-2 a high SLR1 level. The normalisation is done with the values of the housekeeping gene eEF1a.
Vertical lines indicate the standard deviation (n = 4).
Discussion
The results of the q-RT-PCR suggest that the level of SLR1 and the treatment with PAMPs (activate
PTI) can have an influence on the expression of PTI related genes. For example: the expression of
WRKY62 was somewhat lower in leaves that have an intermediate level of SLR1 (gid1-8 and SLR-d3),
the expression of PAL1 in the control leaves was lower for a higher level of SLR1 (gid2-2) then that in
the wild type (T65), for MLO and β-glucanase the level of SLR1 did not have many influence, etc. Also
the PAMP treatment caused changes: the chitin treatment resulted for all SLR1 levels in a lower
expression of β-glucanase, while for the same gene, the LPS treatment caused a higher expression in
comparison with the control in the gid1-8 background. The PAL1 gene was upregulated by the LPS
treatment, but only when the level of SLR1 was higher than that of the wild type rice T65 (gid1-8,

57
SLR1-d3 and gid2-2). Also the chitin treatment caused a higher expression of PAL1. This in all the
lines, but the expression was more boosted in the SLR1-d3 background (4-fold induction) than in the
other two mutant lines (gid1-8 and gid2-2) and certainly in comparison with the wild type T65 (only
1.1-fold). The same could be said for the expression of the WRKY62 gene: the rise in expression was
much higher for SLR1-d3 (4-fold) than in the wild-type T65 (1.6-fold). Finally, the expression of the
MLO gene was also boosted by the PAMP treatments: very little in the mutant lines (SLR1-d3, gid1-8
and gid2-2), but more in the wild-type T65 line.
So generally taken, the PAMP treatment and the level of SLR1 will cause different defense
responses by differently inducing or decreasing the gene expression of the defense genes in rice
leaves. But the changes in gene expression are too low to make a clear and decent conclusion.
2.4 pH of PAMP treated rice leaves Experiment
The influence of the SLR1 level and PAMP treatment on the immune response can also be
investigated at short-term. This can be done by measuring the change in pH in the environment of
treated rice leaves: Kuchitsu et al. found that cells treated with N-acetylchitooligosaccharides
(PAMPs), induced a fast immune response. One of the first steps in this response is the transient
efflux of K+ and influx of H+ which causes a lower pH in the cytoplasm and a higher pH in the apoplast
(Kuchitsu et al., 1997).
Pieces (± 1 cm) of the youngest two leaves of the SLR1 mutant rice lines were taken and five of
those pieces were treated with 3 ml water (control), LPS (0.1 mg/ml) or chitin (0.1 mg/ml). They were
incubated on a shaker at room temperature and the pH was measured after 10, 20, 40 and 60
minutes.
Results
The changes in pH in comparison with the control per time point, per treatment and per mutant
were calculated. The results were summarized in a graph and statistics were performed on a 5%
significance level (Figure 5-16). Statistical differences could be found between the time points 10
minutes and 60 minutes and 20 minutes and 60 minutes for the wild type T65 and the mutant SLR1-
d1, treated with LPS. Further, no statistical differences could be found, but it seems that the pH
change for the gid2-2 mutant treated with chitin and for the gid2-2 and SLR1-d3 mutants treated
with LPS is smaller than for the other mutants. All the mutants show a decrease in pH change with
the time and a difference between the treatments: the LPS treatment causes a rise in the pH, while
the chitin treatment causes a pH decrease.
Discussion The pH change of the LPS treated T65 and SLR1-d1 leaves decreased statistically. This shows that
the pH defense response is really a short time response: the decrease is already visible after one
hour. It indicates that this mechanism is probably used as a trigger for other immune pathways that
induce stronger and longer lasting immune responses. The decrease in pH change was also
noticeable for the other mutants treated with LPS or chitin, but could not be statistically detected.
Reasons can be that the decrease is very small or that the number of replicates (three) is too low.

58
The gid2-2 mutant caused a smaller pH change for both treatments, although it was statistically
not significant. It can be that the higher SLR1 concentration in gid2-2 hinders a bigger response. This
can turn out positively or negatively for the resistance or defense against the pathogen, depending
on the pathogen and the defense pathways that are triggered.
Figure 5-16: Change between the pH of the control and the LPS or chitin treatment for each SLR1 rice mutant and each time
point. The wild type T65 has a normal, low level of SLR1; the mutant lines gid1-8, D35, SLR1-d1 and SLR1-d3 have an
intermediate level of SLR1 and gid2-2 a high SLR1 level. There is a statistical difference on the 5% significance level between
the LPS treatment of T65 after 10 minutes and 60 minutes and between 20 and 60 minutes. Also a statistical difference on
the 5% significance level can be seen between the LPS treatment of SLR1-d1 after 10 minutes and 60 minutes and between
20 and 60 minutes. Statistical differences were checked with the Kruskal-Wallis Rank Sum test and the Mann-Whitney test.
Vertical lines indicate the standard deviation (n = 3).
Nevertheless, the most important difference to see in these results is that the LPS treatment
caused a pH rise, while the chitin treatment caused a pH decrease in comparison with the control.
This was like expected for the LPS treatment: the PAMP caused a defense response by which the pH
was increased. But for the chitin treatment, also a higher pH was expected what did not occur. It can
be that other mechanisms took place than those described in the article of Kuchitsu et al. because
leaves were used instead of rice cell cultures. Likewise tests performed by David De Vleesschauwer
demonstrated that it was easier to work with rice suspension cells than with leaves. But this does not
explain why it did work out for the LPS treatment. Another explanation can be that chitin activated
another defense mechanism in which no lower pH is needed in the cytoplasm. Kuroda et al. even
showed that rice infected with Magnaporthe oryzae did not show a rapid pH decrease at all (Kuroda
et al., 2006). In this case, the lower pH would then have other causes such as another pathway that is
activated or a reaction between chitin and other present components. It is also possible that another
(immune response) pathway is activated that requires a pH decrease in the environment. Clearly,
further tests and research is needed, such as an expression analysis of defense related genes.
2.5 Infection test with leaves of SLR1 mutant rice lines Experiment
The last test in which the SLR1 mutant rice lines were used was an infection test with Cochliobolus
miyabeanus. The goal was to investigate if a chitin treatment can induce a (higher) resistance against
this pathogen and which role the SLR1 level plays in this resistance. Other experiments that David De

59
Vleesschauwer performed with other mutant rice lines, showed that a chitin treatment before
infection could induce a higher resistance.
Practically, leaves of the rice plants were detached (±10 cm) and treated with chitin (0.1 mg/ml)
or water. After around six hours of incubation at room temperature, all the leaves were infected with
a spore solution (0.75 x 10⁴ spores/ml) of Cochliobolus miyabeanus. Gelatin was added to the spore
solution to improve the adhesion to the hydrophobic leaves. After five days, the lesions and the
infected area was scored.
Results
The infected leaves (Figure 5-17) with or without the chitin treatment were scored in two ways:
the lesions were given a score from zero to five (Figure 5-18 A) depending on the disease severity
(see Chapter 4: methodology) and the percentage infected area was calculated with the program APS
Assess (Figure 5-18 B).
Figure 5-17: Infected rice leaves of the mutant lines SLR1-d3, gid1-8 and gid2-2 and the wild type T65. Some leaves had a
pre-treatment with chitin. The leaves were infected with 0.75 104 Cochliobolus miyabeanus spores / ml.
Figure 5-18: Scoring of the SLR1 mutant rice line leaves infected with Cochliobolus miyabeanus. The wild type T65 has a
normal, low level of SLR1; the mutant lines gid1-8 and SLR1-d3 have an intermediate level of SLR1 and gid2-2 a high SLR1
level. Half of the leaves were first treated with chitin (0.1 mg/ml). A) Scoring of the severity of the lesions. B) Percentage of
the area that is infected. Statistical differences were calculated with a Kruskal-Wallis Rank Sum test and a Mann-Whitney
test on the 5% significance level. Vertical lines indicate standard deviation (n = 10).
For the lesion scoring, there is a statistical difference between the gid1-8 and SLR1-d3 without
chitin treatment and all the other combinations of mutant and treatment: gid1-8 and SLR1-d3
without chitin treatment have less severe lesions. Further, the percentages of infected area show

60
differences within the mutant lines without chitin treatment between gid1-8 and SLR1-d3 and the
other 2 mutants lines. Within the mutant lines with chitin treatment, there is no statistical difference,
but a difference can be seen between gid1-8 with and without chitin treatment. The statistical
differences were calculated on the 5% significance level.
Discussion
Looking at these results, there can be seen that the mutant lines that have an intermediate level
of SLR1 (SLR1-d3 and gid1-8) and that had no chitin treatment, had a less severe infection. The
percentage infected area on the leaves of these two mutant lines was statistically lower in
comparison with the wild type line T65 which has a low level SLR1 and the gid2-2 mutant line which
contains a high level of SLR1. Also the lesions on the leaves on SLR1-d3 and gid1-8 without chitin
treatment were less severe (lower score) than those of the other lines without chitin treatment. It
seems thus that there is an optimal concentration of SLR1 in the leaves against Cochliobolus
miyabeanus infection: with this level, a higher resistance against the fungus is achieved in
comparison with leaves that have a lower (like in T65) or a higher (like in gid2-2) concentration of
SLR1. This may work by interfering more or less in the hormone pathways which play a role in the C.
miyabeanus resistance / susceptibility such as the ET and ABA pathways (De Vleesschauwer et al.,
2010). So in contrast to what Son Nguyen Huu reported in his master’s dissertation, the SLR1 protein
does appear to play a role in the defense against Cochliobolus miyabeanus (Huu, 2014).
But the question then rises why this optimal level of SLR1 is not present in the wild type rice. The
answer can be seen in the results of the infected leaves that received a chitin treatment. Among
those treated lines, no statistical difference in infection could be measured. The infection on the
leaves with the intermediate level of SLR1 (SLR1-d3 and gid1-8) was even worse with chitin
treatment than without (statistically for SLR1-d3, not statistically for gid1-8 but the percentages were
clearly higher). Thus when there are more influences or when the circumstances change, the benefit
of the optimal level disappears, probably by the interference or antagonism of other pathways that
are induced in this changed environment. So the optimal level fulfils only its role in ‘optimal’
circumstances, which rarely occur in nature. And when a mechanism rarely works, it will not be used.
The chitin treatment itself did not cause statistical improvement in resistance against Cochliobolus
miyabeanus. However, it seems to be that there was slightly less infection on T65 and gid2-2, but it
cannot be detected statistically on a 5% significance level. It can be that the effectiveness of the
chitin-induced resistance is related to the disease pressure, for example a better effectiveness under
low disease pressure, or that time point of infection after the treatment or the measurement of the
disease severity play a role. This has to be tested to be sure, but it can explain why previous
experiments yielded other results.

61
Chapter 6
Conclusions Generally, the following conclusions can be taken. Y2H experiments show that SLR1 interacts
directly with JAZ9 and JAZ2 of the JA pathway and not with JAZ3, JAZ5, JAZ6, JAZ7, JAZ8, JAZ10 and
JAZ11. For the interaction between JAZ9 and SLR1, the JAS domain of the JAZ9 protein is certainly
needed. However, these interactions are proven in yeast but not in rice cells: there are indications
that JAZ2 also interacts with SLR1 in Kitaake rice cells, but no strong evidence was obtained.
These interactions are similar to those in Arabidopsis thaliana: in this model plant the DELLA
proteins do not interact with all the JAZ proteins either. There is only interaction with JAZ1, JAZ3 and
JAZ9 of the 12 JAZ proteins. This indicates that there is indeed regulation of the transcription of the
JA responsive gene via DELLA / SLR1, but because of the many JAZ proteins with which DELLAs do not
interact, this regulation via DELLA is not the only possibility. Further, also in Arabidopsis, the JAS
domain and not the ZIM domain is necessary for the interaction with DELLAs. This shows that the
regulation system is the same and conserved in Arabidopsis and in rice (Pauwels et al., 2011).
Besides these two JAZ proteins, SLR1 also interacts with many other proteins. The function of
these protein interaction partners can roughly be divided in three groups: proteins that induce a
stress or defense response, proteins that regulate developmental processes and proteins that play a
role in signal transduction or protein modification / regulation. It was already known that SLR1 and
DELLAs in general influence these functions (defense regulation via the JA and SA pathways, growth
and developmental processes via GA, PIFs, SPL, etc. and transcription regulation), but these specific
interaction partners were not found yet (De Bruyne et al., 2014)(Yu et al., 2012)(la Rosa et al., 2014).
It thus seems that SLR1 coordinates much more pathways than currently thought and this makes the
protein a central regulation point. It also raises the question whether this multitude of interactions
with SLR1 is the result of the fact that in rice, there is only one DELLA protein while in Arabidopsis,
there are five. As a consequence, SLR1 would have to interact with more proteins than one DELLA
protein in Arabidopsis. These findings open a new research domain that can elucidate the complex
molecular working mechanisms in a plant.
Further, the experiments with the LPS and chitin treatment learn that these PAMPs induce a
different response in Kitaake rice leaves and callus. They have a different influence on the expression
of defense related genes and even change this expression with time. They also cause a different pH
change in the extracellular environment. LPS and chitin thus may cause a different immune response.
But the level of SLR1 in the rice leaves also plays a role in this: the SLR1 concentration can alter the
expression of defense related genes in the presence or absence of PAMPs. Against a C. miyabeanus
infection, there even seems to be an optimal SLR1 level that induces a higher resistance, probably by
interfering with the ET and ABA pathways (De Vleesschauwer et al., 2010). Even though, this optimal
concentration only works under ‘optimal’ conditions: when there are other influences such as a
PAMP treatment, the benefit of the optimal SLR1 level disappears. Finally, a chitin treatment prior to
infection with C. miyabeanus, can induce a higher resistance in rice leaves against this pathogen, but
only under certain conditions that need to be investigated further.

62
Further research
It is clear from the results of this master’s dissertation that many details of the functioning of SLR1
stay unclear. It is thus important to continue the research about this protein. For example, some
more experiments can be done about the interaction between SLR1 and the JAZ proteins in rice. The
interaction between JAZ9 and SLR1 and JAZ2 and SLR1 are already proven in yeast, but not in rice
cells. Also some other JAZ proteins (JAZ1, JAZ4, JAZ12, JAZ13, JAZ14 and JAZ15) still have to be tested
for interaction. It would be interesting too, to investigate the function of these individual JAZ
proteins for example by knock-out mutants, mutants that do not bind with SLR1 anymore etc. This to
find out why SLR1 interacts specifically with JAZ2 and JAZ9 and what the difference is with the other
JAZ proteins. Also the protein structure can be studied to investigate if this influences the binding
with SLR1 or the fact that there is no binding at all.
The Y2H library screening clearly demonstrated the great variety in functions of SLR1, but this is
only the beginning: the exact functions of these putative interaction partners have to be determined;
in which pathways they play a role; how, when and why SLR1 interacts with these proteins has to be
investigated; etc. Practically, it would be easier to examine the found protein interaction partners per
group based on their function. Then find out if they work together or if there functioning is
independent of each other, search for their function by making knock-out mutants, investigating
their expression in case of another SLR1 level, treatment with PAMPs and other conditions, etc.
Also the influence of SLR1 on the immune response, triggered by different pathogens is not that
easy. Apparently, this influence differs among pathogens and is depending on the level of SLR1, the
presence of certain PAMPs and the environment. So here, further research is also needed with
different pathogens and stresses.
But besides research based on the tests of this master’s dissertation, some other experiments can
be performed. Since SLR1 is a transcription regulator, it could for example be interesting to test
whether the protein also interacts directly with DNA (ChIP) or maybe even RNA and when it does,
with which genes, repeats, regulatory domains, etc. Also other components such as sugars, fatty
acids, etc can be possible interaction partners. Further, the regulation of SLR1 can be determined:
how, when and why the levels of SLR1 are regulated. The migration of the SLR1 protein can be
investigated too: when and why SLR1 migrates and how this is achieved.
The research about DELLAs can also be extended to other plants and crops. The functions and
regulations of SLR1 can be compared with those of the DELLA proteins in other plants (looking for
homologues or proteins with the same function) and when needed, adjusted and supplemented.
When the molecular basis is better understood, it is then possible to see the bigger picture and to
imagine what SLR1 and DELLAs can mean for plants and crops in general. With this knowledge,
strategies can be envisioned to influence DELLAs to do what we want and to search for possibilities
to increase yield and disease resistance.
It is thus clear that the research about SLR1 and DELLA is still in its infancy and offers a lot of
opportunities.

63

64
References
Achard, P., Renou, J. P., Berthomé, R., Harberd, N. P., & Genschik, P. (2008). Plant DELLAs Restrain Growth and Promote Survival of Adversity by Reducing the Levels of Reactive Oxygen Species. Current Biology, 18, 656–660. doi:10.1016/j.cub.2008.04.034
AmiGO2. (2015). diterpene phyoalexin metabolic process. Retrieved May 08, 2015, from http://amigo.geneontology.org/amigo/term/GO:0051501
Arnaud, N., Girin, T., Sorefan, K., Fuentes, S., Wood, T. a., Lawrenson, T., … Østergaard, L. (2010). Gibberellins control fruit patterning in Arabidopsis thaliana. Genes and Development, 24, 2127–2132. doi:10.1101/gad.593410
Bajsa, J., Pan, Z., & Duke, S. O. (2011). Serine/threonine protein phosphatases: Multi-purpose enzymes in control of defense mechanisms. Plant Signaling & Behavior, 6(December), 1921–1925. doi:10.4161/psb.6.12.18146
Bracha-Drori, K., Shichrur, K., Katz, A., Oliva, M., Angelovici, R., Yalovsky, S., & Ohad, N. (2004). Detection of protein-protein interactions in plants using bimolecular fluorescence complementation. Plant Journal, 40, 419–427. doi:10.1111/j.1365-313X.2004.02206.x
Cai, Y., Chen, X., Xie, K., Xing, Q., Wu, Y., Li, J., … Guo, Z. (2014). Dlf1, a WRKY transcription factor, is involved in the control of flowering time and plant height in rice. PLoS ONE, 9(7), 1–13. doi:10.1371/journal.pone.0102529
Capell, T. (2004). Enhanced drought tolerance in transgenic rice. Retrieved May 08, 2015, from http://www.isb.vt.edu/articles/aug0402.htm
Carbonell, J., & Blázquez, M. a. (2009). Regulatory mechanisms of polyamine biosynthesis in plants. Genes & Genomics, 31, 107–118. doi:10.1007/BF03191144
Cho, S. M., Shin, S. H., Kim, K. S., Kim, Y. C., Eun, M. Y., & Cho, B. H. (2004). Enhanced expression of a gene encoding a nucleoside diphosphate kinase 1 (OsNDPK1) in rice plants upon infection with bacterial pathogens. Molecules and Cells, 18(3), 390–395.
CNProt. (2015). Oryzain alpha chain. Retrieved May 08, 2015, from http://www.cnprot.com/uniprot/P25776
Conrath, U., Pieterse, C. M. J., & Mauch-Mani, B. (2002). Priming in plant-pathogen interactions. Trends in Plant Science, 7(5), 210–216. doi:10.1016/S1360-1385(02)02244-6
Davière, J. M., de Lucas, M., & Prat, S. (2008). Transcriptional factor interaction: a central step in DELLA function. Current Opinion in Genetics and Development, 18, 295–303. doi:10.1016/j.gde.2008.05.004
De Bruyne, L., Höfte, M., & De Vleesschauwer, D. (2014). Connecting growth and defense: The emerging roles of brassinosteroids and gibberellins in plant innate immunity. Molecular Plant, 7(April), 943–959. doi:10.1093/mp/ssu050
De Lucas, M., Davière, J.-M., Rodríguez-Falcón, M., Pontin, M., Iglesias-Pedraz, J. M., Lorrain, S., … Prat, S. (2008). A molecular framework for light and gibberellin control of cell elongation. Nature, 451(January), 480–484. doi:10.1038/nature06520
65
De Vleeschauwer, D., Seifi, H. S., Osvaldo, F., Huu, S. N., & Höfte, M. (2015). Title : The DELLA protein SLR1 integrates and amplifies salicylic acid- and jasmonic acid-dependent innate immunity in rice. Unpublished.
De Vleesschauwer, D., Gheysen, G., & Höfte, M. (2013). Hormone defense networking in rice: tales from a different world. Trends in Plant Science, 18(10), 555–65. doi:10.1016/j.tplants.2013.07.002
De Vleesschauwer, D., & Höfte, M. (2009). Chapter 6 Rhizobacteria-Induced Systemic Resistance. Advances in Botanical Research, 51(09), 223–281. doi:10.1016/S0065-2296(09)51006-3
De Vleesschauwer, D., Van Buyten, E., Satoh, K., Balidion, J., Mauleon, R., Choi, I.-R., … Hofte, M. (2012). Brassinosteroids Antagonize Gibberellin- and Salicylate-Mediated Root Immunity in Rice. Plant Physiology, 158(April), 1833–1846. doi:10.1104/pp.112.193672
De Vleesschauwer, D., Yang, Y., Cruz, C. V., & Höfte, M. (2010). Abscisic acid-induced resistance against the brown spot pathogen Cochliobolus miyabeanus in rice involves MAP kinase-mediated repression of ethylene signaling. Plant Physiology, 152(4), 2036–52. doi:10.1104/pp.109.152702
Durrant, W. E., & Dong, X. (2004). Systemic acquired resistance. Annual Review of Phytopathology, 42, 185–209. doi:10.1146/annurev.phyto.42.040803.140421
EnsemblePlants. (2014). Oryza sativa japonica. Retrieved December 20, 2014, from http://plants.ensembl.org/Oryza_sativa/Info/Index
FAO. (2014). FAO Rice Market Monitor (RMM). Retrieved December 20, 2014, from http://www.fao.org/economic/est/publications/rice-publications/rice-market-monitor-rmm/en/
Filipe, Osvaldo, Seifi, Hamed Soren, Huu, Son Nguyen, Höfte, Monica, De Vleesschauwer, D. (2014). The rice DELLA protein SLR1 integrates and amplifies salicylic acid- and jasmonic acid-dependent immunity (pp. 1–8). Unpublished work.
Fu, J., Liu, H., Li, Y., Yu, H., Li, X., Xiao, J., & Wang, S. (2011). Manipulating broad-spectrum disease resistance by suppressing pathogen-induced auxin accumulation in rice. Plant Physiology, 155(January), 589–602. doi:10.1104/pp.110.163774
Fukao, T., & Bailey-Serres, J. (2008). Submergence tolerance conferred by Sub1A is mediated by SLR1 and SLRL1 restriction of gibberellin responses in rice. Proceedings of the National Academy of Sciences of the United States of America, 105, 16814–16819. doi:10.1073/pnas.0807821105
G. Gheysen. (2014). Plant biotechnology. Cursus, Lab of applied molecular genetics.
Gallego-Bartolome, J., Minguet, E. G., Grau-Enguix, F., Abbas, M., Locascio, a., Thomas, S. G., … Blazquez, M. a. (2012). Molecular mechanism for the interaction between gibberellin and brassinosteroid signaling pathways in Arabidopsis. Proceedings of the National Academy of Sciences, 109(33), 13446–13451. doi:10.1073/pnas.1119992109
Gao, X. H., Xiao, S. L., Yao, Q. F., Wang, Y. J., & Fu, X. D. (2011). An updated GA signaling “relief of repression” regulatory model. Molecular Plant, 4(4), 601–606. doi:10.1093/mp/ssr046
GenomeNet. (2015). RAMP4. Retrieved May 11, 2015, from http://www.genome.jp/dbget-bin/www_bget?pfam:RAMP4
Getentry. (2008a). AK062718. Retrieved May 11, 2015, from http://getentry.ddbj.nig.ac.jp/getentry/na/AK062718

66
Getentry. (2008b). AK071205. Retrieved May 11, 2015, from http://getentry.ddbj.nig.ac.jp/getentry/na/AK071205/?filetype=html
Getentry. (2008c). AK103742. Retrieved May 09, 2015, from http://getentry.ddbj.nig.ac.jp/getentry/na/AK103742/?filetype=html
Getentry. (2008d). AK108745. Retrieved May 08, 2015, from http://getentry.ddbj.nig.ac.jp/getentry/na/AK108745/?filetype=html
Getentry. (2008e). BAG88153.1. Retrieved May 09, 2015, from http://getentry.ddbj.nig.ac.jp/getentry/dad/BAG88153.1/?filetype=html
Getentry. (2015a). AK102445. Retrieved May 09, 2015, from http://getentry.ddbj.nig.ac.jp/getentry/na/AK102445/?filetype=html
Getentry. (2015b). AK121189. Retrieved May 11, 2015, from http://getentry.ddbj.nig.ac.jp/getentry/na/AK121189/?filetype=html
Gray, W. M. (2004). Hormonal regulation of plant growth and development. PLoS Biology, 2(9), E311. doi:10.1371/journal.pbio.0020311
Hammerschmidt, R. (1999). Induced disease resistance : how do induced plants stop pathogens ? Physiological and Molecular Plant Pathology, 55, 77–84.
HanaDB-OS. (2015a). Os03g0408500. Retrieved May 10, 2015, from http://evolver.psc.riken.jp/seiken/OS/GENE/Os03g0408500.html
HanaDB-OS. (2015b). Os03g0565500. Retrieved May 11, 2015, from http://evolver.psc.riken.jp/seiken/OS/GENE/Os03g0565500.html
HanaDB-OS. (2015c). Os04g0650000. Retrieved May 11, 2015, from http://evolver.psc.riken.jp/seiken/OS/GENE/Os04g0650000.html
HanaDB-OS. (2015d). Os05g0595400. Retrieved May 11, 2015, from http://evolver.psc.riken.jp/seiken/OS/GENE/Os05g0595400.html
HanaDB-OS. (2015e). Os06g0644100. Retrieved May 10, 2015, from http://evolver.psc.riken.jp/seiken/OS/GENE/Os06g0644100.html
HanaDB-OS. (2015f). Os09g0504700. Retrieved May 10, 2015, from http://evolver.psc.riken.jp/seiken/OS/GENE/Os09g0504700.html
HanaDB-OS. (2015g). Os11g0704500. Retrieved May 11, 2015, from http://evolver.psc.riken.jp/seiken/OS/GENE/Os11g0704500.html
Hayashi, G., Shibato, J., Imanaka, T., Cho, K., Kubo, A., Kikuchi, S., … Rakwal, R. (2014). Unraveling Low-Level Gamma Radiation-Responsive Changes in Expression of Early and Late Genes in Leaves of Rice Seedlings at litate Village, Fukushima. The Journal of Heredity, 105(5), 723–38. doi:10.1093/jhered/esu025
Heath, M. C. (2000). Nonhost resistance and nonspecific plant defenses. Current Opinion in Plant Biology, 3(4), 315–319. doi:10.1016/S1369-5266(00)00087-X

67
Helliwell, E. E., Wang, Q., & Yang, Y. (2013). Transgenic rice with inducible ethylene production exhibits broad-spectrum disease resistance to the fungal pathogens Magnaporthe oryzae and Rhizoctonia solani. Plant Biotechnology Journal, 11, 33–42. doi:10.1111/pbi.12004
Hirano, K., Asano, K., Tsuji, H., Kawamura, M., Mori, H., Kitano, H., … Matsuoka, M. (2010). Characterization of the molecular mechanism underlying gibberellin perception complex formation in rice. The Plant Cell, 22(August), 2680–2696. doi:10.1105/tpc.110.075549
Höfte, M. (2014). Plant biotechnology. Cursus, Lab of fytopathology, University Gent.
Höfte, M. (2015). Molecular fytopathology. Cursus, Lab of fytopathology, University Gent.
Hou, X., Lee, L. Y. C., Xia, K., Yan, Y., & Yu, H. (2010). DELLAs Modulate Jasmonate Signaling via Competitive Binding to JAZs. Developmental Cell, 19(6), 884–894. doi:10.1016/j.devcel.2010.10.024
Huu, S. N. (2014). Linking Growth to Defense : The Role of DELLA in Orchestrating Rice Innate Immunity. University Gent.
Integrated Taxonomic Information System. (2014). Oryza sativa. Retrieved from http://www.itis.gov/servlet/SingleRpt/SingleRpt?search_topic=TSN&search_value=41976
InterPro. (2015). Carboxypeptidase-like, regulatory domain (IPR008969). Retrieved May 08, 2015, from http://www.ebi.ac.uk/interpro/entry/IPR008969
Intuit. (2014). pANDA vector map. Retrieved October 09, 2015, from http://www.docstoc.com/docs/80810872/pANDA-vector-map
Invitrogen. (2012). PCR8/GW/TOPO TA. Retrieved March 08, 2015, from https://tools.lifetechnologies.com/content/sfs/manuals/pcr8gwtopo_man.pdf
Invitrogen. (2015a). pDEST22. Retrieved March 10, 2015, from https://tools.lifetechnologies.com/content/sfs/vectors/pdest22_map.pdf
Invitrogen. (2015b). pDEST32. Retrieved March 08, 2015, from https://tools.lifetechnologies.com/content/sfs/vectors/pdest32_map.pdf
Invitrogen. (2015c). pDONR207. Retrieved March 10, 2015, from https://tools.lifetechnologies.com/content/sfs/vectors/pdonr201_pdonr207_map.pdf
Itoh, H., Shimada, A., Ueguchi-Tanaka, M., Kamiya, N., Hasegawa, Y., Ashikari, M., & Matsuoka, M. (2005). Overexpression of a GRAS protein lacking the DELLA domain confers altered gibberellin responses in rice. Plant Journal, 44, 669–679. doi:10.1111/j.1365-313X.2005.02562.x
Itoh, H., Ueguchi-Tanaka, M., Sato, Y., Ashikari, M., & Matsuoka, M. (2002). The gibberellin signaling pathway is regulated by the appearance and disappearance of SLENDER RICE1 in nuclei. The Plant Cell, 14(January), 57–70. doi:10.1105/tpc.010319
Jones, J. D. G., & Dangl, J. L. (2006). The plant immune system. Nature, 444(7117), 323–9. doi:10.1038/nature05286
Kachroo, A., & Robin, G. P. (2013). Systemic signaling during plant defense. Current Opinion in Plant Biology, 16(4), 527–33. doi:10.1016/j.pbi.2013.06.019
68
Kato-Noguchi, H., Ino, T., & Ota, K. (2008). Secretion of momilactone A from rice roots to the rhizosphere. Journal of Plant Physiology, 165, 691–696. doi:10.1016/j.jplph.2007.07.018
KEGG. (2015a). Arabidopsis thaliana (thale cress): AT5G22920. Retrieved May 10, 2015, from http://www.genome.jp/dbget-bin/www_bget?ath:AT5G22920
KEGG. (2015b). ENZYME: 2.7.4.6. Retrieved May 08, 2015, from http://www.genome.jp/dbget-bin/www_bget?ec:2.7.4.6
KEGG. (2015c). ENZYME: 4.1.1.50. Retrieved May 09, 2015, from http://www.genome.jp/dbget-bin/www_bget?ec:4.1.1.50
KEGG. (2015d). ENZYME: 4.3.1.24. Retrieved May 09, 2015, from http://www.genome.jp/dbget-bin/www_bget?ec:4.3.1.24
KEGG. (2015e). ORTHOLOGY: K14046. Retrieved May 09, 2015, from http://www.genome.jp/dbget-bin/www_bget?K14046+4.2.3.35+R09117
KEGG. (2015f). Oryza sativa japonica (Japanese rice) (RAPDB): Os03t0177400-01. Retrieved May 10, 2015, from http://www.genome.jp/dbget-bin/www_bget?dosa:Os03t0177400-01+dosa:Os03t0177500-01+dosa:Os03t0177900-01+dosa:Os03t0178000-01
KEGG. (2015g). Oryza sativa japonica (Japanese rice) (RAPDB): Os03t0268000-01. Retrieved May 11, 2015, from http://www.genome.jp/dbget-bin/www_bget?dosa:Os03t0268000-01
KEGG. (2015h). Oryza sativa japonica (Japanese rice) (RAPDB): Os03t0408500-01. Retrieved May 10, 2015, from http://www.genome.jp/dbget-bin/www_bget?dosa:Os03t0408500-01
KEGG. (2015i). Oryza sativa japonica (Japanese rice) (RAPDB): Os05t0156500-01. Retrieved May 11, 2015, from http://www.genome.jp/dbget-bin/www_bget?dosa:Os02t0195300-01+dosa:Os05t0156500-01
KEGG. (2015j). Oryza sativa japonica (Japanese rice) (RAPDB): Os05t0595400-01. Retrieved May 11, 2015, from http://www.genome.jp/dbget-bin/www_bget?dosa:Os05t0595400-01
Khush, G. S. (2005). What it will take to feed 5.0 billion rice consumers in 2030. Plant Molecular Biology, 59(1), 1–6. doi:10.1007/s11103-005-2159-5
Khush, G. S. (2013). Strategies for increasing the yield potential of cereals: case of rice as an example. Plant Breeding, 436, n/a–n/a. doi:10.1111/pbr.1991
Kim, K.-C., Lai, Z., Fan, B., & Chen, Z. (2008). Arabidopsis WRKY38 and WRKY62 transcription factors interact with histone deacetylase 19 in basal defense. The Plant Cell, 20(September), 2357–2371. doi:10.1105/tpc.107.055566
Kuchitsu, K., Yazaki, Y., & Sakano…, K. (1997). Transient cytoplasmic pH change and ion fluxes through the plasma membrane in suspension-cultured rice [Oryza sativa] cells triggered by N. Plant and Cell Physiology, 38(9), 1012–1018. Retrieved from http://agris.fao.org/agris-search/search/display.do?f=2001/JP/JP01038.xml;JP1998002935
Kumar, G., Kushwaha, H. R., Panjabi-Sabharwal, V., Kumari, S., Joshi, R., Karan, R., … Pareek, A. (2012). Clustered metallothionein genes are co-regulated in rice and ectopic expression of OsMT1e-P confers multiple abiotic stress tolerance in tobacco via ROS scavenging. BMC Plant Biology, 12(1), 107. doi:10.1186/1471-2229-12-107

69
Kuroda, K., Sasaki, K., Iwai, T., Yazaki, Y., Hiraga, S., Seo, S., … Ohashi, Y. (2006). Rapid defense gene expression in both resistant and susceptible rice cultivars by elicitor(s) originating from conidia of blast fungus-Basal resistance response before fungal penetration into host cells. Physiological and Molecular Plant Pathology, 69(2006), 13–25. doi:10.1016/j.pmpp.2006.12.003
La Rosa, N. M. -d., Sotillo, B., Miskolczi, P., Gibbs, D. J., Vicente, J., Carbonero, P., … Blazquez, M. a. (2014). Large-Scale Identification of Gibberellin-Related Transcription Factors Defines Group VII ETHYLENE RESPONSE FACTORS as Functional DELLA Partners. Plant Physiology, 166(October), 1022–1032. doi:10.1104/pp.114.244723
Lan, Z., Krosse, S., Achard, P., Van Dam, N. M., & Bede, J. C. (2014). DELLA proteins modulate Arabidopsis defences induced in response to caterpillar herbivory. Journal of Experimental Botany, 65(2), 571–583. doi:10.1093/jxb/ert420
Lau, P. P., Villanueva, H., Kobayashi, K., Nakamuta, M., Chang, B. H. J., & Chan, L. (2001). A DnaJ Protein, Apobec-1-binding Protein-2, Modulates Apolipoprotein B mRNA Editing. Journal of Biological Chemistry, 276(49), 46445–46452. doi:10.1074/jbc.M109215200
Li, Q.-F., Wang, C., Jiang, L., Li, S., Sun, S. S. M., & He, J.-X. (2012). An Interaction Between BZR1 and DELLAs Mediates Direct Signaling Crosstalk Between Brassinosteroids and Gibberellins in Arabidopsis. Science Signaling, 5(244), ra72–ra72. doi:10.1126/scisignal.2002908
Li, R., Afsheen, S., Xin, Z., Han, X., & Lou, Y. (2013). OsNPR1 negatively regulates herbivore-induced JA and ethylene signaling and plant resistance to a chewing herbivore in rice. Physiologia Plantarum, 147, 340–351. doi:10.1111/j.1399-3054.2012.01666.x
Li, Z.-Y., & Chen, S.-Y. (2000). Differential accumulation of the S-adenosylmethionine decarboxylase transcript in rice seedlings in response to salt and drought stresses. TAG Theoretical and Applied Genetics, 100, 782–788. doi:10.1007/s001220051352
Lim, S. D., Hwang, J. G., Jung, C. G., Hwang, S. G., Moon, J. C., & Jang, C. S. (2013). Comprehensive analysis of the rice RING E3 ligase family reveals their functional diversity in response to abiotic stress. DNA Research, 20(April), 299–314. doi:10.1093/dnares/dst011
Liu, P.-P., von Dahl, C. C., Park, S.-W., & Klessig, D. F. (2011). Interconnection between methyl salicylate and lipid-based long-distance signaling during the development of systemic acquired resistance in Arabidopsis and tobacco. Plant Physiology, 155(4), 1762–8. doi:10.1104/pp.110.171694
Lyons, R., Manners, J. M., & Kazan, K. (2013). Jasmonate biosynthesis and signaling in monocots: A comparative overview. Plant Cell Reports, 32, 815–827. doi:10.1007/s00299-013-1400-y
Melotto, M., Mecey, C., Niu, Y., Chung, H. S., Katsir, L., Yao, J., … He, S. Y. (2008). A critical role of two positively charged amino acids in the Jas motif of Arabidopsis JAZ proteins in mediating coronatine- and jasmonoyl isoleucine-dependent interactions with the COI1 F-box protein. Plant Journal, 55, 979–988. doi:10.1111/j.1365-313X.2008.03566.x
Merz Pharmaceuticals. (2002). Progranic, description. Retrieved January 11, 2015, from https://www.drugs.com/drp/prograniq-ointment.html
Muthamilarasan, M., & Prasad, M. (2013). Plant innate immunity: An updated insight into defense mechanism. Journal of Biosciences, 38(2), 433–449. doi:10.1007/s12038-013-9302-2
Nahar, K., Kyndt, T., Hause, B., Höfte, M., & Gheysen, G. (2013). Brassinosteroids suppress rice defense against root-knot nematodes through antagonism with the jasmonate pathway. Molecular Plant-Microbe Interactions, 26(1), 106–115. doi:10.1094/MPMI-05-12-0108-FI

70
Navarro, L., Bari, R., Achard, P., Lisón, P., Nemri, A., Harberd, N. P., & Jones, J. D. G. (2008). DELLAs Control Plant Immune Responses by Modulating the Balance of Jasmonic Acid and Salicylic Acid Signaling. Current Biology, 18, 650–655. doi:10.1016/j.cub.2008.03.060
NCBI. (2015a). Conserved Protein Domain Family DnaJ. Retrieved May 08, 2015, from http://www.ncbi.nlm.nih.gov/Structure/cdd/cddsrv.cgi?uid=223560
NCBI. (2015b). Conserved Protein Domain Family DnaJ_C. Retrieved May 08, 2015, from http://www.ncbi.nlm.nih.gov/Structure/cdd/cddsrv.cgi?uid=199909
NCBI. (2015c). Conserved Protein Domain Family DUF2012. Retrieved May 08, 2015, from http://www.ncbi.nlm.nih.gov/Structure/cdd/cddsrv.cgi?uid=255362
NCBI. (2015d). Conserved Protein Domain Family EF1_alpha. Retrieved May 08, 2015, from http://www.ncbi.nlm.nih.gov/Structure/cdd/cddsrv.cgi?uid=206670
NCBI. (2015e). Conserved Protein Domain Family EF1_alpha_II. Retrieved May 08, 2015, from http://www.ncbi.nlm.nih.gov/Structure/cdd/cddsrv.cgi?uid=239664
NCBI. (2015f). Conserved Protein Domain Family EF-G. Retrieved May 08, 2015, from http://www.ncbi.nlm.nih.gov/Structure/cdd/cddsrv.cgi?uid=206673
NCBI. (2015g). Conserved Protein Domain Family EFG_mtEFG1_IV. Retrieved May 08, 2015, from http://www.ncbi.nlm.nih.gov/Structure/cdd/cddsrv.cgi?uid=238715
NCBI. (2015h). Conserved Protein Domain Family GGCT_like. Retrieved May 08, 2015, from http://www.ncbi.nlm.nih.gov/Structure/cdd/cddsrv.cgi?uid=119400
NCBI. (2015i). Conserved Protein Domain Family Inhibitor_I29. Retrieved May 08, 2015, from http://www.ncbi.nlm.nih.gov/Structure/cdd/cddsrv.cgi?uid=214853
NCBI. (2015j). Conserved Protein Domain Family MPP_PP1_PPKL. Retrieved May 08, 2015, from http://www.ncbi.nlm.nih.gov/Structure/cdd/cddsrv.cgi?uid=163657
NCBI. (2015k). Conserved Protein Domain Family NDPk_I. Retrieved May 08, 2015, from http://www.ncbi.nlm.nih.gov/Structure/cdd/cddsrv.cgi?uid=239876
NCBI. (2015l). Conserved Protein Domain Family PAL-HAL. Retrieved May 08, 2015, from http://www.ncbi.nlm.nih.gov/Structure/cdd/cddsrv.cgi?uid=176460
NCBI. (2015m). Conserved Protein Domain Family Peptidase_C1. Retrieved May 08, 2015, from http://www.ncbi.nlm.nih.gov/Structure/cdd/cddsrv.cgi?uid=260335
NCBI. (2015n). Conserved Protein Domain Family RAMP4. Retrieved May 08, 2015, from http://www.ncbi.nlm.nih.gov/Structure/cdd/cddsrv.cgi?uid=253828
NCBI. (2015o). Conserved Protein Domain Family RING. Retrieved May 08, 2015, from http://www.ncbi.nlm.nih.gov/Structure/cdd/cddsrv.cgi?uid=238093
NCBI. (2015p). Conserved Protein Domain Family TAF9. Retrieved May 08, 2015, from http://www.ncbi.nlm.nih.gov/Structure/cdd/cddsrv.cgi?uid=173963
NCBI. (2015q). Conserved Protein Domain Family Terpene_cyclase_plant_C1. Retrieved May 08, 2015, from http://www.ncbi.nlm.nih.gov/Structure/cdd/cddsrv.cgi?uid=173832

71
NCBI. (2015r). Os01g0626400 [Oryza sativa Japonica Group]. Retrieved May 08, 2015, from http://www.ncbi.nlm.nih.gov/gene?term=115438696[NUID]&RID=K45R3JRA01R&log$=genealign&blast_rank=2
NCBI. (2015s). Os02g0465900 [Oryza sativa Japonica Group]. Retrieved May 08, 2015, from http://www.ncbi.nlm.nih.gov/gene?term=115446062[NUID]&RID=K1HJ3CB2016&log$=genealign&blast_rank=1
NCBI. (2015t). Os02g0626400[Oryza sativa Japonica Group]. Retrieved May 08, 2015, from http://www.ncbi.nlm.nih.gov/gene?term=115447404[NUID]&RID=M6Z3MA8K015&log$=genealign&blast_rank=4
NCBI. (2015u). Os03g0177400 [Oryza sativa Japonica Group]. Retrieved May 08, 2015, from http://www.ncbi.nlm.nih.gov/gene?term=115451088[NUID]&RID=M6UVPNTF014&log$=genealign&blast_rank=11
NCBI. (2015v). Os03g0268000 [Oryza sativa Japonica Group]. Retrieved May 08, 2015, from http://www.ncbi.nlm.nih.gov/gene?term=115452136[NUID]&RID=K1MJABAZ013&log$=genealign&blast_rank=1
NCBI. (2015w). Os03g0408500 [Oryza sativa Japonica Group]. Retrieved May 08, 2015, from http://www.ncbi.nlm.nih.gov/gene?term=115453475[PUID] OR 30017563[PUID] OR 113548809[PUID]&RID=M70PJ9MC015&log$=genealign&blast_rank=2
NCBI. (2015x). Os03g0565500 [Oryza sativa Japonica Group]. Retrieved May 08, 2015, from http://www.ncbi.nlm.nih.gov/gene?term=115453800[NUID]&RID=K2D0D9BR013&log$=genealign&blast_rank=1
NCBI. (2015y). Os04g0179700 [Oryza satica Japonica Group]. Retrieved May 08, 2015, from http://www.ncbi.nlm.nih.gov/gene?term=115457149[NUID]&RID=M6XZMEKW01R&log$=genealign&blast_rank=1
NCBI. (2015z). Os04g0650000 [Oryza sativa Japonica Group]. Retrieved May 08, 2015, from http://www.ncbi.nlm.nih.gov/gene?term=297603471[NUID]&RID=K2B7VYB2016&log$=genealign&blast_rank=1
NCBI. (2015aa). Os05g0156500 [Oryza sativa Japonica Group]. Retrieved May 08, 2015, from http://www.ncbi.nlm.nih.gov/gene?term=115462194[NUID]&RID=K299PC1001R&log$=genealign&blast_rank=2
NCBI. (2015ab). Os05g0595400 [Oryza sativa Japonica Group]. Retrieved May 08, 2015, from http://www.ncbi.nlm.nih.gov/gene?term=115465830[NUID]&RID=K46SYNPB01R&log$=genealign&blast_rank=2
NCBI. (2015ac). Os06g0644100 [Oryza sativa Japonica Group]. Retrieved May 08, 2015, from http://www.ncbi.nlm.nih.gov/gene?term=115469167[NUID] OR 32969795[NUID]&RID=M6JNEF06014&log$=genealign&blast_rank=1
NCBI. (2015ad). Os09g0424300 [Oryza sativa Japonica Group]. Retrieved May 08, 2015, from http://www.ncbi.nlm.nih.gov/gene?term=115479246[NUID]&RID=M719263X015&log$=genealign&blast_rank=1
NCBI. (2015ae). Os09g0504700 [Oryza sativa Japonica Group]. Retrieved May 08, 2015, from http://www.ncbi.nlm.nih.gov/gene?term=297609762%5bNUID%5d&RID=M6TFHXMP014&log$=genealign&blast_rank=2

72
NCBI. (2015af). Os11g0127700 [Oryza sativa Japonica Group]. Retrieved May 08, 2015, from http://www.ncbi.nlm.nih.gov/gene?term=115483936[NUID]&RID=K1PCCX6A016&log$=genealign&blast_rank=1
NCBI. (2015ag). Os11g0704500 [Oryza sativa Japonica Group]. Retrieved May 08, 2015, from http://www.ncbi.nlm.nih.gov/gene?term=115486800[NUID]&RID=K2GSTXHW013&log$=genealign&blast_rank=6
NCBI. (2015ah). Os12g0123900 [Oryza sativa Japonica Group]. Retrieved May 08, 2015, from http://www.ncbi.nlm.nih.gov/gene?term=115487097[NUID] OR 32971880[NUID]&RID=K1PCCX6A016&log$=genealign&blast_rank=3
NCBI. (2015ai). Os12g0514100 [Oryza sativa Japonica Group]. Retrieved May 08, 2015, from http://www.ncbi.nlm.nih.gov/gene?term=115488783[NUID]&RID=M6EPM0YD01R&log$=genealign&blast_rank=5
Oerke, E.-C. (2005). Crop losses to pests. The Journal of Agricultural Science, 144(01), 31. doi:10.1017/S0021859605005708
Oryzabase. (2011a). Ak061959. Retrieved May 09, 2015, from http://www.shigen.nig.ac.jp/rice/oryzabase/cdna/detail/5377;jsessionid=B5334D5B8166A2615C7A0910855C178D
Oryzabase. (2011b). KS4. Retrieved May 09, 2015, from http://www.shigen.nig.ac.jp/rice/oryzabase/gene/detail/3134
Oryzabase. (2011c). Os03g0177400. Retrieved May 10, 2015, from http://www.shigen.nig.ac.jp/rice/oryzabase/tool/riceIdChecker/list;jsessionid=000FEAA8DEEED9FA3BBD3A6315A2CBAB?keyword=Os03g0177400
Oryzabase. (2011d). OsPP47. Retrieved May 11, 2015, from http://www.shigen.nig.ac.jp/rice/oryzabase/gene/detail/18637;jsessionid=CD27336377BF28704D3FE6F1B6DFCC74
Oryzabase. (2011e). OsSAMDC4. Retrieved May 09, 2015, from http://www.shigen.nig.ac.jp/rice/oryzabase/gene/detail/14053;jsessionid=69381AD2884F6722FEC2752056F71F67
Oryzabase. (2015a). MTI1A. Retrieved May 11, 2015, from http://www.shigen.nig.ac.jp/rice/oryzabase/gene/detail/11117;jsessionid=FAE86658C5C418A71E4F731424F33A08
Oryzabase. (2015b). OCP. Retrieved May 11, 2015, from http://www.shigen.nig.ac.jp/rice/oryzabase/gene/detail/589
Oryzabase. (2015c). WRKY11. Retrieved May 08, 2015, from http://www.shigen.nig.ac.jp/rice/oryzabase/gene/detail/6522#geneFeedback
Pan, L., Kawai, M., Yano, a, & Uchimiya, H. (2000). Nucleoside diphosphate kinase required for coleoptile elongation in rice. Plant Physiology, 122(February), 447–452. doi:10.1104/pp.122.2.447
Pauwels, L., & Goossens, a. (2011). The JAZ proteins: a crucial interface in the jasmonate signaling cascade. Plant Cell, 23(September), 3089–3100. doi:10.1105/tpc.111.089300

73
Peña-Castro, J. M., Van Zanten, M., Lee, S. C., Patel, M. R., Voesenek, L. a J. C., Fukao, T., & Bailey-Serres, J. (2011). Expression of rice SUB1A and SUB1C transcription factors in Arabidopsis uncovers flowering inhibition as a submergence tolerance mechanism. Plant Journal, 67, 434–446. doi:10.1111/j.1365-313X.2011.04605.x
Peng, J., Carol, P., Richards, D. E., King, K. E., Cowling, R. J., Murphy, G. P., & Harberd, N. P. (1997). The Arabidopsis GAI gene defines a signaling pathway that negatively regulates gibberellin responses. Genes and Development, 11, 3194–3205. doi:10.1101/gad.11.23.3194
Phytopathology Practice. (2013). Important genera of Deutoromycetes. Retrieved December 30, 2014, from http://web2.mendelu.cz/af_291_projekty2/vseo/stranka.php?kod=956
Pieterse, C. M. J., Leon-Reyes, A., Van der Ent, S., & Van Wees, S. C. M. (2009). Networking by small-molecule hormones in plant immunity. Nature Chemical Biology, 5(5), 308–316. doi:10.1038/nchembio.164
Pieterse, C. M. J., Van der Does, D., Zamioudis, C., Leon-Reyes, A., & Van Wees, S. C. M. (2012). Hormonal Modulation of Plant Immunity. Annual Review of Cell and Developmental Biology, 28, 489–521. doi:10.1146/annurev-cellbio-092910-154055
Piffanelli, P., Zhou, F., Casais, C., Orme, J., Jarosch, B., Schaffrath, U., … Schulze-Lefert, P. (2002). The barley MLO modulator of defense and cell death is responsive to biotic and abiotic stress stimuli. Plant Physiology, 129(July), 1076–1085. doi:10.1104/pp.010954
Plantwise Knowledge Bank. (2014). Brown leaf spot of rice. Retrieved December 30, 2014, from http://www.plantwise.org/KnowledgeBank/Datasheet.aspx?dsid=14691
Reheul, D. (2010). Plantaardige productiesystemen. Cursus, Department of plant production.
Rice Genome Annotation Project. (2014). Rice Genome Annotation Project, hom page. Retrieved December 20, 2014, from http://rice.plantbiology.msu.edu/
Rice Informaion System. (2010). RIS, home page. Retrieved December 20, 2014, from http://rise2.genomics.org.cn/page/rice/index.jsp
Rice Knowledge Bank. (2014). Oryza sativa. Retrieved December 20, 2014, from http://www.knowledgebank.irri.org/training/fact-sheets/item/oryza-sativa
Rice Knowledge Bank. (2015). Aerobic rice. Retrieved April 13, 2015, from http://www.knowledgebank.irri.org/step-by-step-production/growth/water-management/aerobic-rice
RiceNetDB. (2013). LOC_Os02g41650. Retrieved May 09, 2015, from http://bis.zju.edu.cn/ricenetdb/proteindetails.php?ID=LOC_Os02g41650
Ross, C. a., Liu, Y., & Shen, Q. J. (2007). The WRKY gene family in rice (Oryza sativa). Journal of Integrative Plant Biology, 49(6), 827. doi:10.1111/j.1672-9072.2007.00504.x
Sarkar, N. K., Thapar, U., Kundnani, P., Panwar, P., & Grover, A. (2013). Functional relevance of J-protein family of rice (Oryza sativa). Cell Stress and Chaperones, 18, 321–331. doi:10.1007/s12192-012-0384-9
Senthil-Kumar, M., & Mysore, K. S. (2013). Nonhost resistance against bacterial pathogens: retrospectives and prospects. Annual Review of Phytopathology, 51, 407–27. doi:10.1146/annurev-phyto-082712-102319
Serrano, M., Coluccia, F., Torres, M., L’Haridon, F., & Métraux, J.-P. (2014). The cuticle and plant defense to pathogens. Frontiers in Plant Science, 5(June), 274. doi:10.3389/fpls.2014.00274

74
Shimada, A., Ueguchi-Tanaka, M., Sakamoto, T., Fujioka, S., Takatsuto, S., Yoshida, S., … Matsuoka, M. (2006). The rice SPINDLY gene functions as a negative regulator of gibberellin signaling by controlling the suppressive function of the DELLA protein, SLR1, and modulating brassinosteroid synthesis. Plant Journal, 48, 390–402. doi:10.1111/j.1365-313X.2006.02875.x
Sun, T. P. (2011). The molecular mechanism and evolution of the GA-GID1-DELLA signaling module in plants. Current Biology, 21(9), R338–R345. doi:10.1016/j.cub.2011.02.036
Sweeney, M., & McCouch, S. (2007). The complex history of the domestication of rice. Annals of Botany, 100(5), 951–7. doi:10.1093/aob/mcm128
Tazick, Z., & Tajick Ghanbary, M. A. (2013). Taxonomic position of Bipolaris oryzae among other Cochliobolus species using Ribosomal region and some Protein Coding genes. Research Journal of Recent Sciences, 2, 212–216.
Thu-hang, P., Thu-hang, P., Bassie, L., Bassie, L., Safwat, G., Safwat, G., … Capell, T. (2002). Expression of a Heterologous. Society, 129(August), 1744–1754. doi:10.1104/pp.010966.1744
Tonnessen, B. W., Manosalva, P., Lang, J. M., Baraoidan, M., Bordeos, A., Mauleon, R., … Leach, J. E. (2014). Rice phenylalanine ammonia-lyase gene OsPAL4 is associated with broad spectrum disease resistance. Plant Molecular Biology, 87, 273–286. doi:10.1007/s11103-014-0275-9
Tsuchida-Mayama, T., Nakamura, H., Hakata, M., & Ichikawa, H. (2010). Rice transgenic resources with gain-of-function phenotypes. Breeding Science, 60(5), 493–501. doi:10.1270/jsbbs.60.493
Uddin, M. I., Qi, Y., Yamada, S., Shibuya, I., Deng, X. P., Kwak, S. S., … Tanaka, K. (2008). Overexpression of a new rice vacuolar antiporter regulating protein OsARP improves salt tolerance in tobacco. Plant and Cell Physiology, 49(6), 880–890. doi:10.1093/pcp/pcn062
Ueguchi-Tanaka, M., Hirano, K., Hasegawa, Y., Kitano, H., & Matsuoka, M. (2008). Release of the repressive activity of rice DELLA protein SLR1 by gibberellin does not require SLR1 degradation in the gid2 mutant. The Plant Cell, 20(September), 2437–2446. doi:10.1105/tpc.108.061648
Uniprot. (2014a). Cochliobolus miyabeanus (Brown spot disease fungus) (Bipolaris oryzae). Retrieved December 28, 2014, from http://www.uniprot.org/taxonomy/101162
Uniprot. (2014b). Magnaporthe oryzae (strain Y34) (Rice blast fungus) (Pyricularia oryzae). Retrieved December 28, 2014, from http://www.uniprot.org/taxonomy/1143189
Uniprot. (2014c). Oryza sativa (Rice) (species). Retrieved December 21, 2014, from http://www.uniprot.org/taxonomy/4530
Uniprot. (2015). Q7G7J6 - SLR1_ORYSJ. Retrieved April 22, 2015, from http://www.uniprot.org/uniprot/Q7G7J6
Vallad, G. E., & Goodman, R. M. (2004). Systemic Acquired Resistance and Induced Systemic Resistance in Conventional Agriculture. Crop Science, 44, 1920–1934.
Wang, D., Pajerowska-Mukhtar, K., Culler, A. H., & Dong, X. (2007). Salicylic Acid Inhibits Pathogen Growth in Plants through Repression of the Auxin Signaling Pathway. Current Biology, 17, 1784–1790. doi:10.1016/j.cub.2007.09.025
Wilson, R. a, & Talbot, N. J. (2009). Under pressure: investigating the biology of plant infection by Magnaporthe oryzae. Nature Reviews. Microbiology, 7(3), 185–95. doi:10.1038/nrmicro2032
75
Xu, J., Audenaert, K., Hofte, M., & de Vleesschauwer, D. (2013). Abscisic Acid Promotes Susceptibility to the Rice Leaf Blight Pathogen Xanthomonas oryzae pv oryzae by Suppressing Salicylic Acid-Mediated Defenses. PLoS ONE, 8(6). doi:10.1371/journal.pone.0067413
Xu, M., Ross Wilderman, P., Morrone, D., Xu, J., Roy, A., Margis-Pinheiro, M., … Peters, R. J. (2007). Functional characterization of the rice kaurene synthase-like gene family. Phytochemistry, 68, 312–326. doi:10.1016/j.phytochem.2006.10.016
Yang, D. L., Yang, Y., & He, Z. (2013). Roles of plant hormones and their interplay in rice immunity. Molecular Plant, 6(3), 675–685. doi:10.1093/mp/sst056
Yang, Y., Qi, M., & Mei, C. (2004). Endogenous salicylic acid protects rice plants from oxidative damage caused by aging as well as biotic and abiotic stress. The Plant Journal : For Cell and Molecular Biology, 40(6), 909–19. doi:10.1111/j.1365-313X.2004.02267.x
Yang, Z., Wu, Y., Li, Y., Ling, H.-Q., & Chu, C. (2009). OsMT1a, a type 1 metallothionein, plays the pivotal role in zinc homeostasis and drought tolerance in rice. Plant Molecular Biology, 70(1-2), 219–229.
Yazawa, K., Jiang, C.-J., Kojima, M., Sakakibara, H., & Takatsuji, H. (2012). Reduction of abscisic acid levels or inhibition of abscisic acid signaling in rice during the early phase of Magnaporthe oryzae infection decreases its susceptibility to the fungus. Physiological and Molecular Plant Pathology, 78, 1–7. doi:10.1016/j.pmpp.2011.12.003
Yoo, S. D., Cho, Y., & Sheen, J. (2009). Emerging connections in the ethylene signaling network. Trends in Plant Science, 14(April), 270–279. doi:10.1016/j.tplants.2009.02.007
Yu, S., Galvao, V. C., Zhang, Y.-C., Horrer, D., Zhang, T.-Q., Hao, Y.-H., … Wang, J.-W. (2012). Gibberellin Regulates the Arabidopsis Floral Transition through miR156-Targeted SQUAMOSA PROMOTER BINDING-LIKE Transcription Factors. The Plant Cell, 24(August), 3320–3332. doi:10.1105/tpc.112.101014
Yuan, Y., Zhong, S., Li, Q., Zhu, Z., Lou, Y., Wang, L., … He, Z. (2007). Functional analysis of rice NPR1-like genes reveals that OsNPR1/NH1 is the rice orthologue conferring disease resistance with enhanced herbivore susceptibility. Plant Biotechnology Journal, 5, 313–324. doi:10.1111/j.1467-7652.2007.00243.x
Zhang, Z.-L., Ogawa, M., Fleet, C. M., Zentella, R., Hu, J., Heo, J.-O., … Sun, T. (2011). Scarecrow-like 3 promotes gibberellin signaling by antagonizing master growth repressor DELLA in Arabidopsis. Proceedings of the National Academy of Sciences of the United States of America, 108, 2160–2165. doi:10.1073/pnas.1012232108
Zvereva, A. S., & Pooggin, M. M. (2012). Silencing and innate immunity in plant defense against viral and non-viral pathogens. Viruses, 4(11), 2578–97. doi:10.3390/v4112578

76

I
Appendix
1. Media
In this section, the composition of the used media are given.
Appendix 1-1: Gamborg 5 (GB5) medium.
GB5 medium (1L)
3.164 g GB5
10 g agar
1 L bidest water
autoclave
Appendix 1-2: MSD medium: Murashige and
Skoog (MS) medium with auxin
2,4- Dichlorophenoxyacetic acid (2,4-D).
MSD medium (1L)
4.4 g MS medium (no salts)
30 g sucrose
1 L bidest water
adjust pH 5.8
8 g agar
Autoclave and let cool down to 55°C
2 mg auxin 2,4-D
Appendix 1-3: (Liquid) Luria-Bertani (LB)
medium with or without antibiotic (selection,
final concentration of 50 mg/L).
LB medium (1L)
5 g yeast extract
10 g bacterial tryptone
10 g NaCl
15 g agar (if non liquid)
1 L bidest water
autoclave and let cool down to 55°C
1 mL of 50 mg/mL stock antibiotic if wanted
Appendix 1-4: (Liquid) YPAD medium.
YPAD medium (300 mL)
3 g yeast extract
6 g bacterial peptone
280.5 mL bidest water
adjust pH 6.0
6 g agar (if non liquid)
autoclave and let cool down to 55°C
4.5 mL 0.2% adenine sultfate (filter sterilized)
15 mL 40% glucose (filter sterilized)
Appendix 1-5: (Liquid) YEP medium.
YEP medium (1L)
10 g bacto peptone
10 g yeast extract
5 g NaCl
15 g agar (if non liquid)
1 L bidest water
autoclave
Appendix 1-6: Synthetic dropout medium: in
this medium, some amino acids (AA) are left
out to select yeast cells that have been
transformed with plasmids who contain genes
for these AA. The specific AA that are left out
can vary.
Dropout medium (1L)
6.7 g yeast nitrogen base w/o AA
dropout –AA supplement, the amount differs
950 mL of bidest water
adjust pH 5.6 with NaOH
20 g agar
autoclave and let cool down to 55°C
50 mL 40% glucose (filter sterilized)
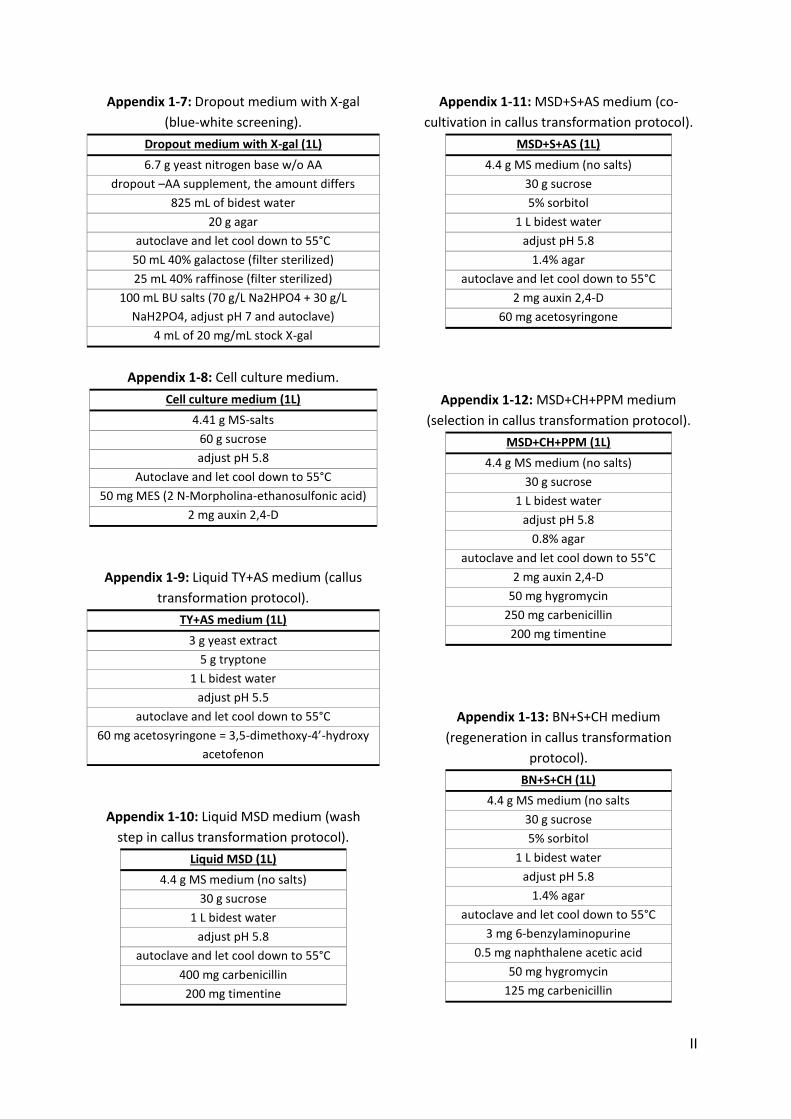
II
Appendix 1-7: Dropout medium with X-gal
(blue-white screening).
Dropout medium with X-gal (1L)
6.7 g yeast nitrogen base w/o AA
dropout –AA supplement, the amount differs
825 mL of bidest water
20 g agar
autoclave and let cool down to 55°C
50 mL 40% galactose (filter sterilized)
25 mL 40% raffinose (filter sterilized)
100 mL BU salts (70 g/L Na2HPO4 + 30 g/L
NaH2PO4, adjust pH 7 and autoclave)
4 mL of 20 mg/mL stock X-gal
Appendix 1-8: Cell culture medium.
Cell culture medium (1L)
4.41 g MS-salts
60 g sucrose
adjust pH 5.8
Autoclave and let cool down to 55°C
50 mg MES (2 N-Morpholina-ethanosulfonic acid)
2 mg auxin 2,4-D
Appendix 1-9: Liquid TY+AS medium (callus
transformation protocol).
TY+AS medium (1L)
3 g yeast extract
5 g tryptone
1 L bidest water
adjust pH 5.5
autoclave and let cool down to 55°C
60 mg acetosyringone = 3,5-dimethoxy-4’-hydroxy
acetofenon
Appendix 1-10: Liquid MSD medium (wash
step in callus transformation protocol).
Liquid MSD (1L)
4.4 g MS medium (no salts)
30 g sucrose
1 L bidest water
adjust pH 5.8
autoclave and let cool down to 55°C
400 mg carbenicillin
200 mg timentine
Appendix 1-11: MSD+S+AS medium (co-
cultivation in callus transformation protocol).
MSD+S+AS (1L)
4.4 g MS medium (no salts)
30 g sucrose
5% sorbitol
1 L bidest water
adjust pH 5.8
1.4% agar
autoclave and let cool down to 55°C
2 mg auxin 2,4-D
60 mg acetosyringone
Appendix 1-12: MSD+CH+PPM medium
(selection in callus transformation protocol).
MSD+CH+PPM (1L)
4.4 g MS medium (no salts)
30 g sucrose
1 L bidest water
adjust pH 5.8
0.8% agar
autoclave and let cool down to 55°C
2 mg auxin 2,4-D
50 mg hygromycin
250 mg carbenicillin
200 mg timentine
Appendix 1-13: BN+S+CH medium
(regeneration in callus transformation
protocol).
BN+S+CH (1L)
4.4 g MS medium (no salts
30 g sucrose
5% sorbitol
1 L bidest water
adjust pH 5.8
1.4% agar
autoclave and let cool down to 55°C
3 mg 6-benzylaminopurine
0.5 mg naphthalene acetic acid
50 mg hygromycin
125 mg carbenicillin

III
Appendix 1-14: MS+H medium (rooting in
callus transformation protocol).
MS+H (1L)
4.4 g MS medium (no salts)
30 g sucrose
1 L bidest water
adjust pH 5.8
0.8% agar
autoclave and let cool down to 55°C
50 mg hygromycin
50 mg carbenicillin
Appendix 1-15: Potato dextrose agar (PDA).
PDA (1L)
4 g potato extract
20 g dextrose
15 g agar
autoclave
2. Vectors
In this part, the vector maps of vector used in this master’s dissertation are given.
Appendix 2-1: Vector map pDONR207. This vector is used as entry vector. It contains a Gateway
cassette (BP). Gentamicin resistance is used as a marker for selection in E. coli (Invitrogen, 2015c).

IV
Appendix 2-2: Vector map pCR8/GW/TOPA TA. This vector is used as entry vector in the experiment
with the domains of JAZ9 and SLR1. It contains binding sites for constructs with an A-tail and a
gateway cassette. Spectinomycin resistance is use as marker for selection in E. coli (Invitrogen, 2012).
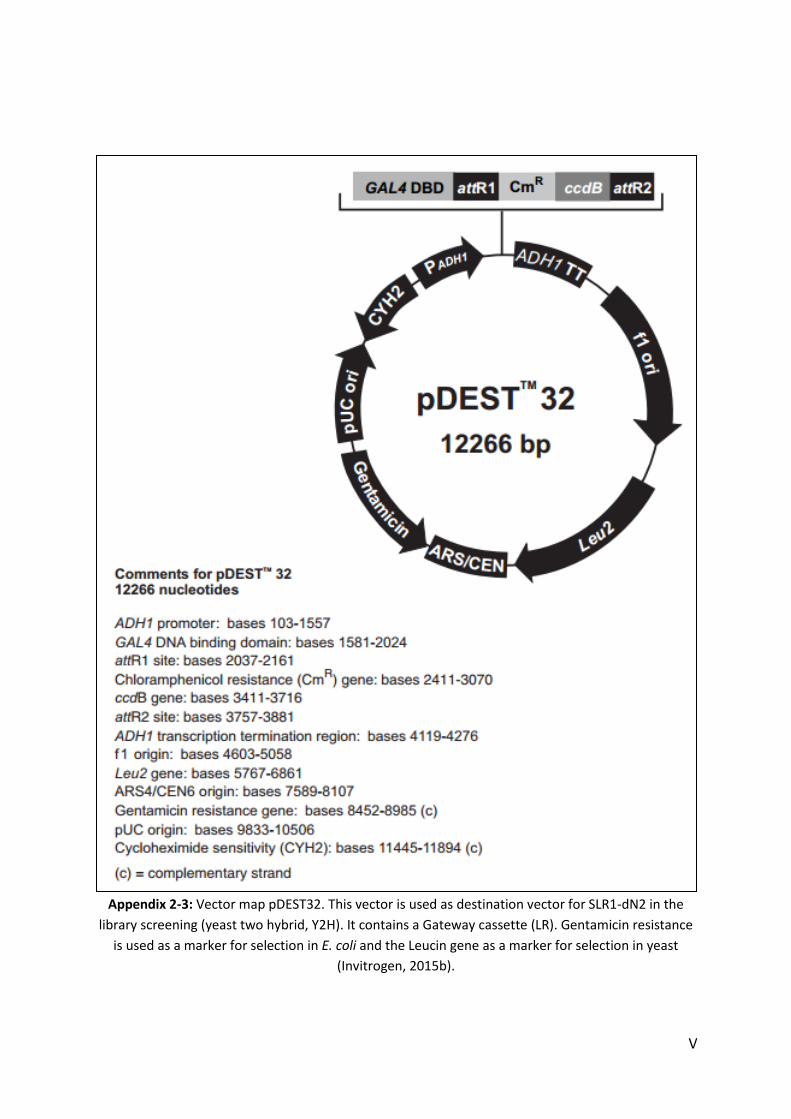
V
Appendix 2-3: Vector map pDEST32. This vector is used as destination vector for SLR1-dN2 in the
library screening (yeast two hybrid, Y2H). It contains a Gateway cassette (LR). Gentamicin resistance
is used as a marker for selection in E. coli and the Leucin gene as a marker for selection in yeast
(Invitrogen, 2015b).

VI
Appendix 2-4: Vector map pDEST 22. This vector is used as destination vector for the library in the
library screening (Y2H). It contains a Gateway cassette (LR). Ampicillin/Carbenicillin resistance is used
as a marker for selection in E. coli and the tryptophan gene as a marker for selection in yeast
(Invitrogen, 2015a).

VII
Appendix 2-5: Vector map pB42 AD. This vector is used for one to one Y2H in combination with the
vector pLexA (Appendix 2-6). It contains a DNA activation domain (AD) and a Gateway cassette (LR).
Ampicillin/Carbenicillin resistance is used as a marker for selection in E. coli and the tryptophan gene
as a marker for selection in yeast (Huu, 2014).

VIII
Appendix 2-6: Vector map pLexA. This vector is used for one to one Y2H in combination with the
vector PB42 AD (Appendix 2-5). It contains a DNA binding domain (BD) and a Gateway cassette (LR).
Ampicillin/Carbenicillin resistance is used as a marker for selection in E. coli and the histidine gene as
a marker for selection in yeast (Huu, 2014).
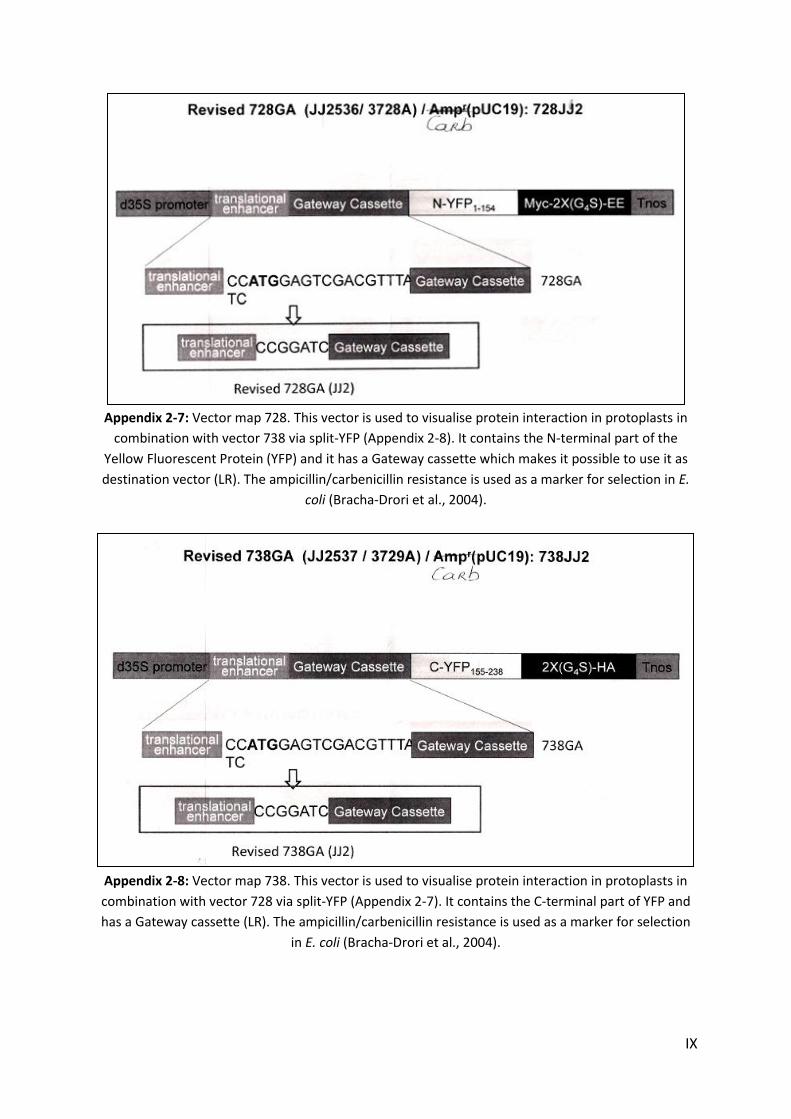
IX
Appendix 2-7: Vector map 728. This vector is used to visualise protein interaction in protoplasts in
combination with vector 738 via split-YFP (Appendix 2-8). It contains the N-terminal part of the
Yellow Fluorescent Protein (YFP) and it has a Gateway cassette which makes it possible to use it as
destination vector (LR). The ampicillin/carbenicillin resistance is used as a marker for selection in E.
coli (Bracha-Drori et al., 2004).
Appendix 2-8: Vector map 738. This vector is used to visualise protein interaction in protoplasts in
combination with vector 728 via split-YFP (Appendix 2-7). It contains the C-terminal part of YFP and
has a Gateway cassette (LR). The ampicillin/carbenicillin resistance is used as a marker for selection
in E. coli (Bracha-Drori et al., 2004).
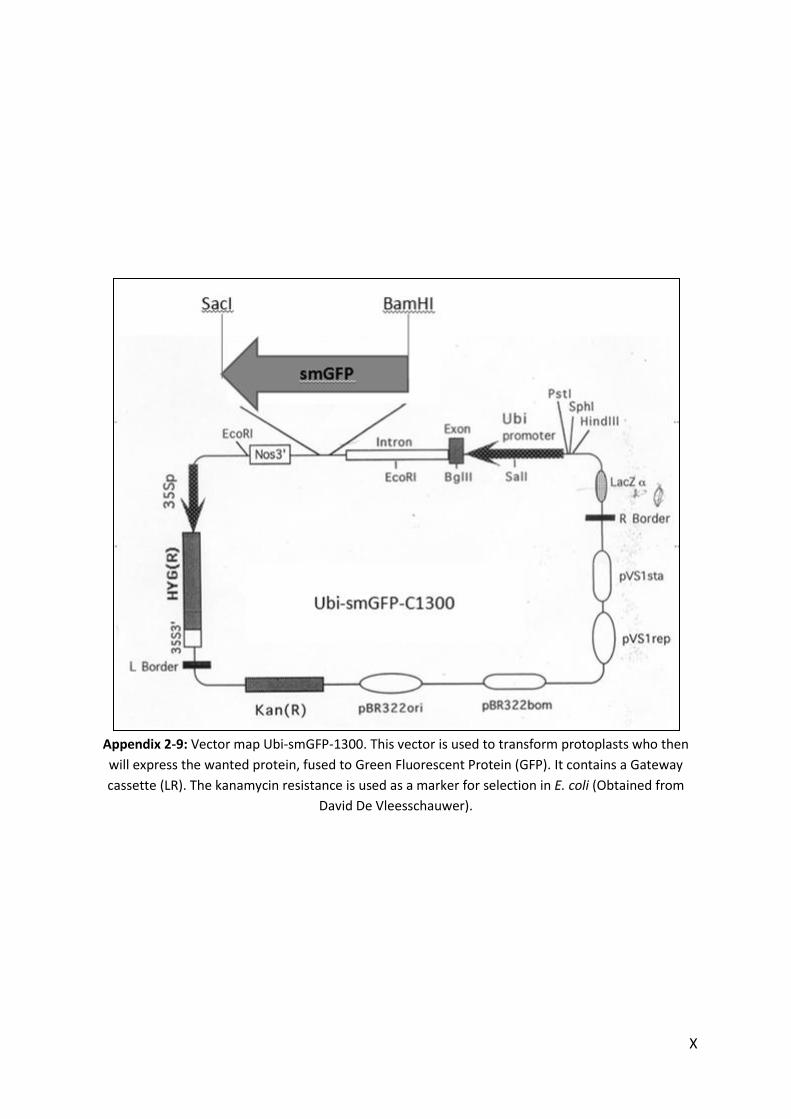
X
Appendix 2-9: Vector map Ubi-smGFP-1300. This vector is used to transform protoplasts who then
will express the wanted protein, fused to Green Fluorescent Protein (GFP). It contains a Gateway
cassette (LR). The kanamycin resistance is used as a marker for selection in E. coli (Obtained from
David De Vleesschauwer).

XI
Appendix 2-10: Vector map Panda. This vector is used for callus transformation with Agrobacterium.
It contains a Gateway cassette (LR). Kanamicin resistance is used as a marker for selection in E. coli
and Agrobacterium (Intuit, 2014).