Embed Size (px)
Citation preview

Stock Code: 3008TT
http://mops.twse.com.tw
http://www.largan.com.tw
Largan Precision Co., Ltd
2018 Annual Report
(Translation)
----Disclaimer----
This is a translation of the 2018 Annual Report of Largan Precision Co., Ltd. The
translation is for reference only. If there is any discrepancy between the English
version and Chinese version, the Chinese version shall prevail.
Printed April 22nd, 2019

Largan Precision Co., Ltd.
Company Spokesperson Adam Lin
CEO
04-36002345
Deputy Spokesperson Josephine Huang
Special Assistant to CEO
04-36002345
Corporate Headquarters and Factories Head office: No. 11, Jingke Road, Nantun District, Taichung City, Taiwan Telephone: 04-36002345
Factories: No. 4, Gongyequ 16th Road, Taichung City, Taiwan Telephone: 04-36002345
No. 14, Gongyequ 23rd Road, Nantun District, Taichung City, Taiwan Telephone: 04-36002345
No. 11, Jingke Road, Nantun District, Taichung City, Taiwan Telephone: 04-36002345
No. 13, Jingke Road, Nantun District, Taichung City, Taiwan Telephone: 04-36002345
No. 7, Jingke 2nd Road, Nantun District, Taichung City, Taiwan Telephone: 04-36001825
Stock Affairs Agent Company: Stock-Affairs Agency Department of Taishin International Bank
Address: B1, No.96, Sec.1, Jianguo N. Rd., Taipei City
Website: www.taishinbank.com.tw
Tel: (02) 2504-8125
Certified Public Accountant (CPA) and accounting firm for the financial statements of the
most recent year: CPA: Tzu-Hsin Chang & Chun-Man Chen
Company: KPMG Certificated Public Accountants
Address: 68F, No.7, Sec.5, Xinyi Rd., Taipei
Website: www.kpmg.com/tw
Tel: (02) 8101-6666
Offshore secondary exchange and disclosure information: Not Applicable
Company Website: http://www.largan.com.tw

Largan Precision, Co., Ltd. Annual Report Contents
Page Number1. Letter to Shareholders ...................................................................................................... 1 2. Company Profile .............................................................................................................. 2 3. Corporate Governance Report ......................................................................................... 4
3.1. Company organization ..................................................................................................... 4 3.2. Information on Directors, Supervisors, President, Vice Presidents, Assistant Vice
Presidents, and heads of departments and divisions ........................................................ 6 3.3. Implementation of Corporate Governance ...................................................................... 17 3.4. Information on CPA fees ................................................................................................. 35 3.5. Replacement of CPAs ...................................................................................................... 35 3.6. Company's Chairman, President, or any managerial officer in charge of finance or
accounting matters who has, in the most recent year, held a position at the accounting firm of its CPA or at an affiliated company ..................................................................... 37
3.7. Equity transfer or changes in equity pledged by the Company's Directors, Supervisors, managerial officers or shareholders with shareholding percentage exceeding 10% in the most recent fiscal year up to the publication date of the Annual Report .............................................................................................................................. 37
3.8. Information on the relationship between the top 10 shareholders of the Company ........ 38 3.9. Information on the number of shares of the companies invested by the Company, its
Directors, Supervisors and managerial officers or a company directly or indirectly controlled by the Company and consolidated percentage of shareholding ..................... 39
4. Funding Status ................................................................................................................. 40 4.1. Company capital and issuance of shares ......................................................................... 40 4.2. Issuance of corporate bonds ............................................................................................ 44 4.3. Preferred shares ............................................................................................................... 44 4.4. Overseas depository receipt ............................................................................................. 44 4.5. Issuance of employee stock options ................................................................................ 44 4.6. Restrictions on employee shares and mergers, acquisitions or issuance of new shares
for the acquisition of shares of other companies ............................................................. 44 4.7. Implementation status of the capital utilization plan ....................................................... 44
5. Operational Highlights .................................................................................................... 45 5.1. Business activities ........................................................................................................... 45 5.2. Overview of market, production and sales ...................................................................... 49 5.3. Number of employees during the two most recent years ................................................ 53 5.4. Environmental protection expenditures ........................................................................... 54 5.5. Labor relations ................................................................................................................. 54 5.6. Important contracts .......................................................................................................... 59
6. Financial Highlights ........................................................................................................ 60 6.1. Condensed Balance Sheet and Condensed Consolidated Income Statement for the
Last Five Years ................................................................................................................ 60 6.2. Financial Analysis for the Last Five Years ...................................................................... 64 6.3. 2018 Supervisors' Review Report for the Financial Report ............................................ 67 6.4. Consolidated Financial Statements of the Most Recent Year with Independent
Auditors’ Report and Notes ............................................................................................. 68 6.5. Parent Company Only Financial Statements of the Most Recent Year with
Independent Auditors’ Report and Notes ......................................................................... 148 6.6. Impact on the Company's financial status due to financial difficulties experienced by
the Company and its affiliate companies in the most recent year and as of the publication date of this Annual Report ............................................................................ 231
7. Review and Analysis of Financial Position and Financial Performance, and Risk Management .................................................................................................................... 232
7.1. Financial position analysis .............................................................................................. 232 7.2. Financial performance ..................................................................................................... 232 7.3. Cash flow ......................................................................................................................... 233

7.4. Impact of major capital expenditures on the Company’s financial operations for the most recent fiscal year ..................................................................................................... 233
7.5. Reinvestment policies, main reasons for profits/losses generated thereby, improvement plans, and investment plans for the coming year ...................................... 233
7.6. Risk management and assessment ................................................................................... 233 7.7. Other material matters ..................................................................................................... 234
8. Special Notes ................................................................................................................... 235 8.1. Information on affiliate companies .................................................................................. 235 8.2. Private placement of securities of the past year as of the publication date of this
Annual Report ................................................................................................................. 241 8.3. Holding or disposal of the Company's shares by the subsidiaries of the most recent
year as of the publication date of this Annual Report ...................................................... 241 8.4. Other necessary supplementary items to be included ...................................................... 241
9. Any event which has a material impact on the shareholders' equity or securities prices as prescribed in Subparagraph 2, Paragraph 2, Article 36 of the Securities and Exchange Act that has occurred in the most recent year as of the publication date of this Annual Report ........................................................................................................... 242

1
1. Letter to Shareholders
In 2018, with the increasing penetration rate of smartphones, the growth of the market had started to
plateau. The Company’s 2018 business results and 2019 business plan are summarized below:
2018 Business Report
(1) Business results: Largan Precision's consolidated revenue in 2018 amounted to NT$49,952,158
thousand, which was a 6% decline from NT$53,127,510 thousand in 2017. The net profit after
tax was NT$24,369,534 thousand, which was a 6% decline from NT$25,975,623 in 2017. The
net profit after tax per share was NT$181.67.
(2) Financial performance and profitability: Please refer to the financial statements in the
attachment for the financial overview of 2018.
(3) Research and development: The Company invested a total of NT$3,258,445 thousand in
research and development for the current year, which represented a 1% decline from
NT$3,277,712 thousand in the previous year.
2019 Business Plan
(1) Business strategy: Largan Precision upholds the business philosophy of "innovation,
professionalism, speed, and flexibility." All employees continuously pursue discipline and
growth in the face of a changing business environment, as they commit themselves to product
development and quality improvement to create ongoing profit and growth.
(2) Production and sales forecast: The Company shall remain focused on the production and sales
of mobile phone camera lenses, and actively enhance production technology and output, with
the aim of maintaining the Company's advantages in production cost and making overall
production and sales more competitive.
(3) Research and development plans: The Company shall continue to conduct research and
development in mobile phone camera lenses. We will continue to expand our R&D team,
product range, add new product lines, and improve the scale and quality of products. We shall
also commit ourselves to the development of other product applications and improvement of
manufacturing capabilities to maintain long-term competitiveness in the industry.
Largan Precision shall continue to work hard and adopt a spirit of constant innovation and in the
production of each product. We shall fully develop the Company's core expertise and continue to
strengthen the Company's competitiveness in all aspects to respond to the competitive environment and
overall business environment. At the same time, the Company complies with regulatory requirements
and adopts policies and measures in response to changes in the legal environment. We hereby express
our most sincere gratitude for the support of all customers, suppliers, shareholders, and employees.
Chairman: En-Chou Lin
2
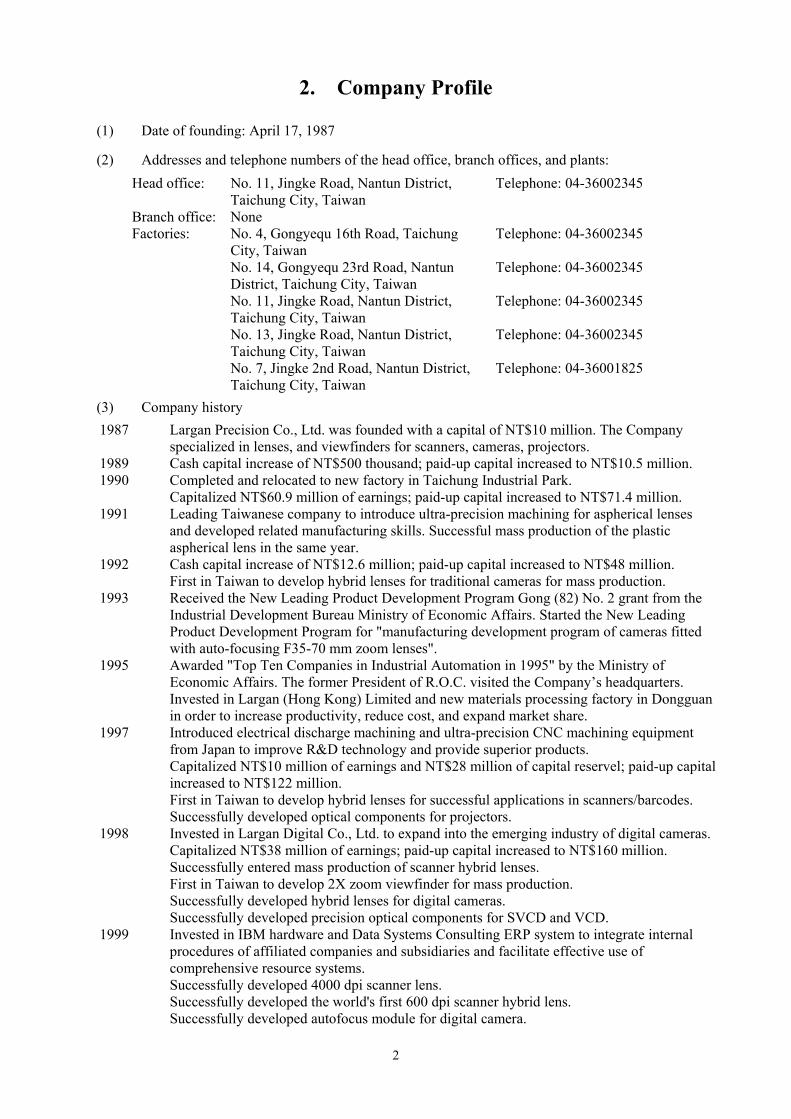
2. Company Profile
(1) Date of founding: April 17, 1987
(2) Addresses and telephone numbers of the head office, branch offices, and plants:
Head office: No. 11, Jingke Road, Nantun District, Taichung City, Taiwan
Telephone: 04-36002345
Branch office: None Factories: No. 4, Gongyequ 16th Road, Taichung
City, Taiwan Telephone: 04-36002345
No. 14, Gongyequ 23rd Road, Nantun District, Taichung City, Taiwan
Telephone: 04-36002345
No. 11, Jingke Road, Nantun District, Taichung City, Taiwan
Telephone: 04-36002345
No. 13, Jingke Road, Nantun District, Taichung City, Taiwan
Telephone: 04-36002345
No. 7, Jingke 2nd Road, Nantun District, Taichung City, Taiwan
Telephone: 04-36001825
(3) Company history
1987 Largan Precision Co., Ltd. was founded with a capital of NT$10 million. The Company specialized in lenses, and viewfinders for scanners, cameras, projectors.
1989 Cash capital increase of NT$500 thousand; paid-up capital increased to NT$10.5 million. 1990 Completed and relocated to new factory in Taichung Industrial Park.
Capitalized NT$60.9 million of earnings; paid-up capital increased to NT$71.4 million. 1991 Leading Taiwanese company to introduce ultra-precision machining for aspherical lenses
and developed related manufacturing skills. Successful mass production of the plastic aspherical lens in the same year.
1992 Cash capital increase of NT$12.6 million; paid-up capital increased to NT$48 million. First in Taiwan to develop hybrid lenses for traditional cameras for mass production.
1993 Received the New Leading Product Development Program Gong (82) No. 2 grant from the Industrial Development Bureau Ministry of Economic Affairs. Started the New Leading Product Development Program for "manufacturing development program of cameras fitted with auto-focusing F35-70 mm zoom lenses".
1995 Awarded "Top Ten Companies in Industrial Automation in 1995" by the Ministry of Economic Affairs. The former President of R.O.C. visited the Company’s headquarters. Invested in Largan (Hong Kong) Limited and new materials processing factory in Dongguan in order to increase productivity, reduce cost, and expand market share.
1997 Introduced electrical discharge machining and ultra-precision CNC machining equipment from Japan to improve R&D technology and provide superior products. Capitalized NT$10 million of earnings and NT$28 million of capital reservel; paid-up capital increased to NT$122 million. First in Taiwan to develop hybrid lenses for successful applications in scanners/barcodes. Successfully developed optical components for projectors.
1998 Invested in Largan Digital Co., Ltd. to expand into the emerging industry of digital cameras. Capitalized NT$38 million of earnings; paid-up capital increased to NT$160 million. Successfully entered mass production of scanner hybrid lenses. First in Taiwan to develop 2X zoom viewfinder for mass production. Successfully developed hybrid lenses for digital cameras. Successfully developed precision optical components for SVCD and VCD.
1999 Invested in IBM hardware and Data Systems Consulting ERP system to integrate internal procedures of affiliated companies and subsidiaries and facilitate effective use of comprehensive resource systems. Successfully developed 4000 dpi scanner lens. Successfully developed the world's first 600 dpi scanner hybrid lens. Successfully developed autofocus module for digital camera.

3
Successfully developed high-precision optical components and assemblies applied in DVDs. 2000 Capitalized NT$60 million of earnings and NT$80 million in cash; paid-up capital increased
to NT$300 million. The Company became publicly listed. First in Taiwan to develop 4X zoom viewfinder for mass production.
2001 Passed ISO 9001 quality certification. Capitalized NT$233,434,000 of earnings and employee bonus. Issued new shares through a capital increase to merge Largan Optronic Co., Ltd. to sustain growth and scale to enhance the Company’s competitiveness. Paid-up capital increased to NT$621,621,640.
2002 Publicly listed on the Taiwan Stock Exchange (TWSE) on March 11. Capitalized NT$233,182,590 of earnings and employee bonus; paid-up capital increased to NT$854,804,230. The establishment of the Company’s headquarters was approved in September. Successfully developed zoom lenses for projectors. Successfully developed camera lenses for mobile phones. Successfully developed 3.0 megapixels 3x zoom digital camera lens.
2003 Capitalized NT$104,021,920 of earnings and employee bonus; paid-up capital increased to NT$958,826,150. Invested in Suzhou Largan Co., Ltd. through NET International Trading Limited to expand production capacity and reduce manufacturing cost. Successfully developed 3X Zoom lens for digital cameras. Successfully developed 1.3 megapixels lens for mobile phones. Expanded floor space in plant #1.
2004 Capitalized NT$115,422,610 of earnings and employee bonus; paid-up capital increased to NT$1,074,248,760. Successfully developed 2.0 megapixels autofocus lens for mobile phones.
2005 Capitalized NT$71,902,440 of earnings and employee bonus; paid-up capital increased to NT$1,146,151,200. Successfully developed 3.0 megapixels autofocus lens for mobile phones. Expanded floor space in Plant #2.
2006 Capitalized NT$67,121,210 of earnings and employee bonus; paid-up capital increased to NT$1,213,272,410. Completed development of 5.0 megapixels autofocus lens for mobile phones.
2007 Capitalized NT$33,914,470 of earnings and employee bonus; paid-up capital increased to NT$1,257,186,880. Entered mass production of 5.0 megapixels lens for mobile phones
2008 Capitalized NT$44,145,930 of earnings and employee bonus; paid-up capital increased to NT$1,301,332,810. Completed development of 8.0 megapixels autofocus lens for mobile phones.
2009 Capitalized NT$521,642,990 of earnings and employee bonus; paid-up capital increased to NT$1,341,401,970. Inaugurated new plant in the Precision Machinery Innovation Technology Park. Became the first company to mass produce EDOF lenses for mobile phones. Entered mass production of 8.0 megapixels lens for mobile phones Completed development of 12.0 megapixels autofocus lens for mobile phones.
2012 Inaugurated new plant in the Precision Machinery Innovation Technology Park. (Plant #5) 2014 Obtained industrial land in phase 1 of the Taichung City Precision Machinery Innovation
Technology Park. 2017 Inaugurated new plant in the Precision Machinery Innovation Technology Park. (Plant #7)

4
Information Technology D
epartment
Sales D
epartment
Procurem
ent Departm
ent
Quality M
anagement D
epartment
Research and D
evelopment D
epartment
Adm
inistrative Departm
ent
Finance D
epartment
Production D
epartment
Production M
anagement D
epartment
Maintenance D
epartment
Overseas B
usiness Departm
ent
3. Corporate Governance Report
3.1 Company organization 3.1.1 Company organization chart
Shareholders' Meeting
Supervisors
Board of Directors
Chairman
CEO
Internal Audit Chairman's Office
Occupational Safety and Health Office
Compensation Committee

5
3.1.2 Responsibilities and functions of major departments
Major Department Responsibilities and Functions
Chairman's Office Oversees the planning and execution of the Company's operations and implements
continuous supervision and improvement of various internal controls.
Internal Audit Inspects and evaluates the Company’s internal control system and provides analyses
and recommendations.
Occupational Safety
and Health Office
Formulates, plans, and promotes safety and health management issues and instructs
related departments on its implementation.
Information
Technology
Department
Responsible for the integration, establishment, and maintenance of the Company's
IT system.
Finance Department Responsible for finances, accounting, shareholder services, and taxation affairs.
Administrative
Department
Responsible for human resources, general affairs, employee welfare, and labor
relations.
Sales Department Responsible for product marketing, market research, and customer after-sales
services.
Procurement
Department Responsible for procurement of raw materials, equipment, and consumables.
Quality Management
Department
Responsible for inspection of raw materials, production, and finished goods , and
other quality assurance operations.
Production
Management
Department
Responsible for production planning, raw materials management, outsourcing, and
shipment.
Production Department Responsible for the production of various optical components.
Maintenance
Department Maintenance and repairs of machinery and inspection equipment.
Research and
Development
Department
New product optical design.
Improvement of production technology.
Design and development of molding and tooling technology.
Overseas Business
Department Responsible for production, quality assurance, and services for overseas businesses.

6
3.2 Information on Directors, Supervisors, President, Vice Presidents, Assistant Vice Presidents, and heads of departments and divisions
3.2.1 Directors and Supervisors
April 14, 2019
Title Nationality or Place of
RegistrationName Gender
Date Elected
Term Date First Elected
Shares Held When Elected
Shares Currently Held
Shares Held by Spouse and
Minor Children
Shares Held in the Name of Other
Persons Education and Work Experience
Positions Concurrently Held at the Company and Other
Companies
Other Supervisory or Director Roles Held by a Spouse or Second-Degree
Relative Number of Shares
% Number of Shares
% Number of Shares
% Number of Shares
% Title Name Relationship
Chairman Taiwan En-Chou Lin
Male 2016.06.08 3
years 1987.4.4Note 1
4,111,142 3.06% 2,861,142 2.13% 2,479,504 1.85% 2,450,000 1.83%
Degree in Insurance and Banking, Tamkang University Vice President, Largan Digital Co., Ltd.
Vice President of Largan Precision, Chairman of Amtai International Limited, Director of Astro International Limited, Chairman of Suzhou Largan Co., Ltd., Chairman of Largan (Dongguan) Optronic Ltd., Director of Largan Digital Co. Ltd., Director of Largan (Hong Kong) Limited, Director representative of Net International Trading Limited, Director of Largan Medical Co., Ltd., Chairman representative of Ba Fang Co., Ltd., Director of NEO (Shanghai) Medical Technology Co., Ltd.
DirectorVice
Chairman
Yao-Ying Lin
En-Ping Lin
Father-son Brothers
Vice Chairman
Taiwan En-Ping Lin
Male 2016.06.08 3
years 2007.06.15 6,019,652 4.49% 3,379,506 2.52% - - 2,640,146 1.97%
Master of Business Administration, Dominican University
CEO of Largan Precision, Director of Largan (Hong Kong) Limited, Director of Suzhou Largan Co., Ltd., Director of Largan Digital Co., Ltd., Chairman of Largan Medical Co., Ltd., Director representative of Ba Fang Co., Ltd. Director of Alpha and Beta, Director of LHT, Director representative of Largan Health Technology Inc., Director of Largan Health AI-Tech Co., Ltd.
DirectorChairman
Yao-Ying Lin
En-Chou Lin
Father-son Brothers
Director Taiwan Shih-Ching Chen
Male 2016.06.08 3
years 1993.7.3 6,756,831 5.04% 6,756,831 5.04% 6,625,569 4.94% - -
Degree in Mechanical Engineering, National Cheng Kung University Manager at a German optics company, President, Largan Optronic Chairman, Largan Precision
Director of Largan Digital Co. Ltd., Director of Largan Medical Co., Ltd., Director representative of Ba Fang Co., Ltd.
DirectorSupervisor
Tsui-Ying Chiang Hui-Fen
Chen
Spouse Brother-sister
Director Taiwan Yao-Ying Lin
Male 2016.06.08 3
years 1993.7.3 2,526,036 1.88% 1,526,036 1.14% - - 1,000,000 0.75%
Degree in Agricultural Chemistry, National Chung Hsing University Chairman, Largan OptronicChairman, Largan Precision
Director of Largan Digital Co. Ltd., Director of Largan Medical Co., Ltd.
ChairmanVice
Chairman
En-Chou Lin
En-Ping Lin
Father-son

7
Title Nationality or Place of
RegistrationName Gender
Date Elected
Term Date First Elected
Shares Held When Elected
Shares Currently Held
Shares Held by Spouse and
Minor Children
Shares Held in the Name of Other
Persons Education and Work Experience
Positions Concurrently Held at the Company and Other
Companies
Other Supervisory or Director Roles Held by a Spouse or Second-Degree
Relative Number of Shares
% Number of Shares
% Number of Shares
% Number of Shares
% Title Name Relationship
Director Taiwan Ming-Yuan Hsieh
Male 2016.06.08 3
years 1996.10.20 3,606,585 2.69% 3,606,585 2.69% - - - -
Degree in Applied Mathematics, Feng Chia University
None – – –
Director Taiwan Po-Jen Liang
Male 2016.06.08 3
years 1993.7.3Note 2
1,218,802 0.91% 1,207,802 0.90% 272,356 0.20% - - Chang Jung Senior High School
Director of Largan Digital Co. Ltd.
SupervisorChung-Jen
Liang Brothers
Director Taiwan Tsui-Ying Chiang
Female 2016.06.08 3
years 2001.7.16 6,625,569 4.94% 6,625,569 4.94% 6,756,831 5.04% - -
Degree in German, Tamkang University
None DirectorShih-Ching
Chen Spouse
Independent Director
Taiwan Shan-Chieh Yen
Male 2016.06.08 3
years 2016.06.08
No shares held
0.00%No shares
held0.00% - -
Taichung Industrial High School, Electrial EngineeringAssistant Vice President, Largan Precison
None – – –
Independent Director
Taiwan Ming-Hua Peng
Male 2016.06.08 3
years 2016.06.08 8,604 0.01% 56,604 0.04% - -
Ming Chi Institute of Technology, Mechanical Engineering Assistant Vice President, Largan Precison
None – – –
Supervisor Taiwan Chung-Jen Liang
Male 2016.06.08 3
years 2004.6.10 2,098,721 1.56% 2,091,721 1.56% 924 0.00% 8,000 0.01%
Degree in Finance, National Chengchi University
Supervisor of Largan Medical Co., Ltd., Supervisor of Largan Digital Co. Ltd.
DirectorPo-Jen Liang
Brothers
Supervisor Taiwan Hui-Fen Chen
Female 2016.06.08 3
years 2010.06.14
No shares held
0.00%No shares
held0.00% - - - -
Ph.D in Industrial Engineering, Purdue University (United States) Professor, Department of Industrial and Systems Engineering, Chung Yuan Christian University
None DirectorShih-Ching
Chen Brother-sister
Supervisor Taiwan Hsiao-Pei
Su Female
2016.06.08 3
years 2004.6.10 210,159 0.16%
210,159 0.16%38,100 0.03% - -
San Hsin High School of Commerce
None – – –
Note 1: En-Chou Lin did not serve as a Director from July 3, 1993 to November 11, 1997. Note 2: Po-Jen Liang did not serve as a Director from July 15, 2001 to June 9, 2004.

8
Table 1: Professional qualifications and independence of the Directors and Supervisors
Criteria
Name
Meet the following professional qualification requirements, together with
at least 5 years of work experience Independence criteria (Note 1)
Number of other public companies in which the individual is concurrently serving as an independent director
An instructor or higher position in a private or public college or university in the field of business, law, finance, accounting, or the business sector of the Company
A Judge, Public Prosecutor, Attorney, Certified Public Accountant, orOther Professional or Technical Specialist Who Has Passed a National Examination and Been Awarded a Certificate in a Profession Necessary for the Business of the Company
Work Experience in the Area of Commerce,Law, Finance, orAccounting, or Otherwise Necessary for the Business ofthe Company
1 2 3 4 5 6 7 8 9 10
Shih-Ching Chen
ˇ ˇ ˇ ˇ -
En-Chou Lin ˇ ˇ ˇ ˇ - En-Ping Lin ˇ ˇ ˇ ˇ - Yao-Ying Lin
ˇ ˇ ˇ ˇ -
Ming-Yuan Hsieh
ˇ ˇ ˇ ˇ ˇ ˇ ˇ ˇ ˇ -
Po-Jen Liang ˇ ˇ ˇ ˇ ˇ ˇ - Tsui-Ying Chiang
ˇ ˇ ˇ ˇ ˇ ˇ ˇ -
Shan-Chieh Yen
ˇ ˇ ˇ ˇ ˇ ˇ ˇ ˇ ˇ ˇ ˇ -
Ming-Hua Peng
ˇ ˇ ˇ ˇ ˇ ˇ ˇ ˇ ˇ ˇ ˇ -
Chung-Jen Liang
ˇ ˇ ˇ ˇ ˇ ˇ -
Hui-Fen Chen
ˇ ˇ ˇ ˇ ˇ ˇ ˇ ˇ -
Hsiao-Pei Su ˇ ˇ ˇ ˇ ˇ ˇ ˇ ˇ ˇ ˇ - Note 1: Tick the appropriate corresponding boxes if a Director or Supervisor meets the following criteria
during his/her term of office and two years prior to the date elected.

9
(1) Not employed by the Company or its affiliated companies. (2) Not a director or supervisor of any affiliated company (except for the independent directors of
the parent company or a subsidiary in which the Company holds more than 50% direct or indirect voting interest).
(3) Not a natural-person shareholder who holds more than 1% of issued shares or is ranked top 10 in terms of the total shares held, including the shares held in the name of the person’s spouse, minor children, or in the name of others.
(4) Not a spouse, second-degree relative, or direct, blood-related fifth-degree relative of the personnel listed in the first three criteria.
(5) Not a director, supervisor, or employee of a corporate shareholder that directly holds 5% or more of the total number of outstanding shares of the Company or that holds shares ranking in the top five in holdings.
(6) Not a director (a member of the governing board), supervisor (member of the supervising board), managerial officer, or shareholder who holds more than 5% of shares of companies or institutions that have financial or business dealings with the Company.
(7) Not a professional who provides commercial, legal, financial, accounting, or consulting services to the Company or its affiliated companies, nor is an owner, partner, director, supervisor, or manager, or the spouse of any of the above, of a sole proprietorship, partnership, company, or organization that provides such services to the Company or its affiliated companies. This restriction, however, does not apply to any member of the remuneration committee who exercises powers pursuant to Article 7 of the Regulations Governing the Appointment and Exercise of Powers by the Remuneration Committee of a Corporation Whose Stock is Listed on the Stock Exchange or Traded Over the Counter.
(8) Not a spouse or a relative within the second degree of kinship with any director. (9) Where none of the circumstances in the subparagraphs of Article 30 of the Company Act
applies. (10) Not an elect in the name of a government, institution, or its representative as defined in Article
27 of the Company Act.

10
3.2.2 President, Vice Presidents, Assistant Vice Presidents, and managers of departments or divisions April 14, 2019
Title Nationality Name GenderDate
Appointed
Number of Shares Held
Shares Held by Spouse and Minor
Children
Shares Held in the Name of
Other Persons Education and
Work Experience
Positions Concurrently Held at the Company and Other
Companies
Other Managerial Roles Held by Spouse or Second-Degree
Relative Number of Shares
% Number of Shares
% Number of Shares
% Title Name Relationship
CEO TaiwanEn-Ping
Lin Male 2007.06.15 3,379,506 2.52% 0 0 2,640,146 1.97%
Master in Business Administration, Dominican University
Director of Largan (Hong Kong) Limited., Director of Suzhou Largan Co., Ltd., Chairman of Largan Digital Co., Ltd., Chairman of Largan Medical Co., Ltd., Chairman representative of Ba Fang Co., Ltd., Director of Alpha and Beta, Director of LHT, Director representative of Largan Health Technology Inc., Director of Largan Health AI-Tech Co., Ltd.
Vice President
En-Chou Lin
Brothers
Vice President TaiwanEn-Chou
Lin Male 1987.04.17 2,861,142 2.13% 2,479,504 1.85% 2,450,000 1.83%
Degree in Insurance and Banking, Tamkang University Vice President, Largan Digital Co., Ltd.
Chairman of Amtai International Limited, Director of Astro International Limited, Chairman of Suzhou Largan Co., Ltd., Chairman of Largan (Dongguan) Optronic Ltd., Director of Largan Digital Co., Ltd., Director of Largan (Hong Kong) Limited., Director representative of Net International Trading Limited, Director of Largan Medical Co., Ltd, Director representative of Ba Fang Co., Ltd., Director of NEO (Shanghai) Medical Technology Co., Ltd.
CEOEn-Ping
Lin Brothers
Vice President TaiwanChung-Shih
Lin Male 2005.06.01 4,000 0.00% 0 0 - -
Degree in Industrial Engineering, Tunghai University
Director of Largan (Dongguan) Optronic Ltd., Director of Suzhou Largan Co., Ltd., Director
representative of Largan Health Technology Co., Ltd., Director of Nanjing Largan Health Technology Co., Ltd.
_ _ _

11
Title Nationality Name GenderDate
Appointed
Number of Shares Held
Shares Held by Spouse and Minor
Children
Shares Held in the Name of
Other Persons Education and
Work Experience
Positions Concurrently Held at the Company and Other
Companies
Other Managerial Roles Held by Spouse or Second-Degree
Relative Number of Shares
% Number of Shares
% Number of Shares
% Title Name Relationship
Chief Technology Officer/Vice
President Taiwan
Yu-Chih Huang
Male 2010.01.01 94,2280.07%
0 0 - -
Master in Power Mechanical Engineering, National Tsing Hua University
None _ _ _
Assistant Vice President
TaiwanSheng-Lien
Wang Male 2011.04.01 0 0 212 0.00% - -
Degree in Industrial Engineering, Feng Chia University
Director of LHT, Director of NEO (Shanghai) Medical Technology Co., Ltd.
_ _ _
Finance/Accounting Director
TaiwanHsing-Ju
Tsao Female 2011.05.01 289 0.00% 0 0 - -
Master in Accounting, National Chengchi University
Supervisor representative of Ba Fang Co., Ltd.
_ _ _
Note: Positions held as of the publication date of the Annual Report

12
3.2.3 Compensation of Directors, Supervisors, President, and Vice Presidents As of December 31, 2018
Unit: NT$ thousands Compensation for Directors (including Independent Directors)
Title Name
Compensation of Directors Ratio of total compensation
(A+B+C+D) to net profit after tax (%)
Compensation earned as an employee Ratio of the total sums of A, B, C, D, E, F, and G to the net profit after
tax
Compensation From Other
Affiliates that the
Company has Invested In
Compensation (A) Severance Pay and
Pension (B) Directors'
Remuneration (C)Business Expenses
(D) Salary, Bonus and
Allowances (E) Severance Pay and
Pension (F) Employees' Compensation (G)
The Company
All Companies
in the Financial
Report
The Company
All Companies
in the Financial Report
The Company
All Companie
s in the Financial Report
The Company
All Companies
in the Financial
Report
The Company
All Companies
in the Financial
Report
The Company
All Companies
in the Financial
Report
The Company
All Companies
in the Financial
Report
The CompanyAll Companies in the Financial
Report The Company
All Companies in
the Financial
Report
Cash Stock Cash
Stock
Chairman En-Chou
Lin
- - - -
230,751
230,751
- - 0.95% 0.95% 16,385 16,385 - - 134,500 - 134,500 - 1.57% 1.57% None
Vice Chairman
En-Ping Lin
Director Yao-Ying
Lin
Director Shih-Ching
Chen
Director Ming-Yuan
Hsieh
Director Tsui-Ying
Chiang
Director Po-Jen Liang
Independent Director
Shan-Chieh Yen
Independent Director
Ming-Hua Peng

13
Table of compensation ranges
Compensation Range for Each Director of the Company
Name of Director Sum of the first 4 items (A+B+C+D) Sum of the first 7 items (A+B+C+D+E+F+G)
The Company All Companies in the
Financial Report The Company
All Companies in the Financial Report
Less than NT$2,000,000 Shan-Chieh Yen, Ming-Hua Peng Same as left Shan-Chieh Yen, Ming-Hua Peng Same as left NT$2,000,000 (inclusive) to NT$5,000,000 (exclusive)
- - - -
NT$5,000,000 (inclusive) to NT$10,000,000 (exclusive)
- - - -
NT$10,000,000 (inclusive) to NT$15,000,000 (exclusive)
- - - -
NT$15,000,000 (inclusive) to NT$30,000,000 (exclusive)
- - - -
NT$30,000,000 (inclusive) to NT$50,000,000 (exclusive)
Ming-Yuan Hsieh, Po-Jen Liang, Tsui-Ying Chiang, Shih-Ching Chen, En-Chou Lin, En-Ping Lin, Yao-Ying Lin
Same as left Ming-Yuan Hsieh, Po-Jen Liang, Tsui-Ying Chiang
Same as left
NT$50,000,000 (inclusive) to NT$100,000,000 (exclusive)
- - Shih-Ching Chen, En-Chou Lin, En-Ping Lin, Yao-Ying Lin
Same as left
More than NT$100,000,000 - - - - Total 9 9 9 9
Compensation for Supervisors
As of December 31, 2018 Unit: NT$ thousands
Title Name
Compensation for Supervisors
Ratio of the total sums of A, B, and C to net profit after tax Compensation From Other
Affiliates that the Company
has Invested In
Compensation (A) Remuneration (B) Business Expenses (C)
The Company
All Companies in the Financial
Report
The Company
All Companies in the Financial
Report
The Company
All Companies in the Financial
Report
The Company
All Companies in the Financial
Report Supervisor Chung-Jen Liang
- - 98,036 98,036 - - 0.40% 0.40% None Supervisor Hui-Fen ChenSupervisor Hsiao-Pei Su

14
Table of Compensation Ranges
Compensation Range for Each Supervisor of the Company
Names of Supervisor
Total of (A+B+C)
The Company All Companies in the Financial Report
Less than NT$2,000,000 - -
NT$2,000,000 (inclusive) to NT$5,000,000 - -
NT$5,000,000 (inclusive) to NT$10,000,000 - -
NT$10,000,000 (inclusive) to NT$15,000,000 - -
NT$15,000,000 (inclusive) to NT$30,000,000 - -
NT$30,000,000 (inclusive) to NT$50,000,000 Chung-Jen Liang, Hui-Fen Chen, Hsiao-Pei Su Same as left
NT$50,000,000 (inclusive) to NT$100,000,000 - -
More than NT$100,000,000 - -
Total 3 3
Compensation for President and Vice Presidents
As of December 31, 2018 Unit: NT$ thousands
Title Name
Salary (A) Severance Pay and
Pension (B) Bonuses and
Allowances, etc. (C) Employees' Compensation
(D)
Ratio of the total sums of A, B, C, and D to the net
profit after tax (%) Compensation From Other
Affiliates that the Company has
Invested In The Company
All Companies in the Financial
Report
The Company
All Companies in the Financial
Report
The Company
All Companies in the Financial
Report
The Company
All Companies in the Financial
Report The Company
All Companies in the
Financial Report Cash Stock Cash Stock
CEO En-Ping Lin
14,520 14,520 - - - - 119,067 - 119,067 - 0.55% 0.55% None Vice President En-Chou Lin
Vice President Chung-Shih Lin Chief Technology
Officer Yu-Chih Huang

15
Table of Compensation Ranges
Compensation Range for the President and Vice Presidents of the CompanyName of the President and Vice Presidents
The Company All Companies in the Financial Report
Less than NT$2,000,000 - -
NT$2,000,000 (inclusive) to NT$5,000,000 - -
NT$5,000,000 (inclusive) to NT$10,000,000 - -
NT$10,000,000 (inclusive) to NT$15,000,000 - -
NT$15,000,000 (inclusive) to NT$30,000,000 - -
NT$30,000,000 (inclusive) to NT$50,000,000 En-Chou Lin, En-Ping Lin, Chung-Shih Lin, Yu-Chih Huang Same as left
NT$50,000,000 (inclusive) to NT$100,000,000 - -
More than NT$100,000,000 - -
Total 4 4
Name of management to which employees' compensation are distributed, and the status of distribution
As of December 31, 2018
Unit: NT$ thousands
Title Name Stock Cash Total
Ratio of total compensations to the net profit after tax (%)
Managem
ent
CEO En-Ping Lin
- 178,600 178,600 0.73%
Vice President En-Chou Lin
Vice President Chung-Shih Lin
Chief Technology Officer Yu-Chih Huang
Assistant Vice President Sheng-Lien Wang
Finance/Accounting Director Hsing-Ju Tsao

16
3.2.4 Comparison of compensation paid by the Company and all the consolidated entities in the last two years to the Company's Directors, Supervisors, President and Vice Presidents as a ratio to the net profit after tax. Explanation on compensation policies, standards and procedures for determining compensation, and association with business performance and future risks: 1. Analysis of compensation to the Company's Directors, Supervisors, President and
Vice Presidents as a ratio of net profit after tax in the most recent year Ratio of total compensation to net profit
after tax (%) Percentage change
2018 2017 Director 1.57% 1.46% 0.11% Supervisor 0.40% 0.40% - President and Vice Presidents
0.55% 0.46% 0.09%
Note: 1. The Company's compensation for the Company's Directors, Supervisors, President, and Vice Presidents are determined pursuant to the Company's Articles of Incorporation and Managerial Officer Salary Standards. They are reviewed by the Compensation Committee and authorized by the Board of Directors. There were no material changes in the Company's payment to Directors and Supervisors. Total compensation for Directors to net profit after tax increased by 0.11%; Total compensation for Supervisors to net profit after tax was the same; Total compensation for the President and Vice Presidents to net profit after tax increased by 0.09%.
2. The Company's compensation for Directors and Supervisors is determined pursuant to Article 26 of the Company's Articles of Incorporation. If the Company sustains profit for the current year, it may set aside no more than 5% of profit as Director and Supervisor compensation. With regard to the procedures for determining the amount of compensation, the Company considers personal performance achievement rates and the level of contribution to the Company, while taking into account the Company's overall performance, future trends and business risks of the industry, to provide a reasonable level of compensation. Such performance evaluation and the reasonableness of salary and remuneration are reviewed by the Compensation Committee and the Board of Directors. The remuneration system is also reviewed constantly based on actual business operations and applicable laws.
3. The compensation of the President and Vice Presidents include salary and employees' compensation which shall be determined in accordance with their positions, responsibilities, and the Company's Managerial Officer Salary Standards. They are reviewed by the Compensation Committee and approved by the Board of Directors.

17
3.3 Implementation of Corporate Governance 3.3.1 Operations of the Board of Directors
The Company convened a total of four Board of Directors meetings in 2018.The attendance was as follows:
Title Name Attendance in
Person Attendance by
Proxy Rate of Attendance
in Person (%) Note
Chairman En-Chou Lin 4 0 100% Re-elected Vice Chairman En-Ping Lin 4 0 100% Re-elected
Director Shih-Ching
Chen 4 0 100% Re-elected
Director Yao-Ying Lin 3 0 75% Re-elected Director Po-Jen Liang 3 0 75% Re-elected
Director Ming-Yuan
Hsieh 3 0
75% Re-elected
Director Tsui-Ying
Chiang 4 0
100% Re-elected
Independent Director
Shan-Chieh Yen
4 0 100% Newly
appointed Independent
Director Ming-Hua
Peng 4
0 100% Newly appointed
Annotations: 1. (1) Items included in Article 14-3 of the Securities and Exchange Act and other dissenting or
qualified opinions by other Independent Directors in record or the resolutions of the Board of Directors in a written statement: The resolutions of board meetings in 2018 contained no items specified in Article 14-3 of the Securities and Exchange Act. (2) Other resolutions of the Board of Directors on which Independent Directors have dissenting or qualified opinions, and that were documented or issued through written statements: None.
2. Recusals of Directors due to conflicts of interests: The Directors recused themselves from discussion and voting on their salaries and compensation.
3. Measures taken to strengthen the functions of the Board and the implementation status during the current and preceding fiscal year: The Company established the 3rd Compensation Committee on June 8, 2016 to assist the Board of Directors to determine the salaries and compensation of Directors and managerial officers as well as to regularly review the performance of Directors and managerial officers and the Company’s compensation policies, systems, standards, and structure.

18
3.3.2 Supervisors' participation in Board meetings A total of 4 Board of Directors meetings were held in the most recent year. The attendance was as follows:
Title Name Attendance in Person
Rate of Attendance in Person (%)
Note
Supervisor Chung-Jen Liang 4 100% Re-electedSupervisor Hui-Fen Chen 2 50% Re-electedSupervisor Hsiao-Pei Su 3 75% Re-elected
Annotations: 1. Composition and responsibilities of Supervisors:
(1) Communication between Supervisors and the Company's employees and shareholders (e.g. communication channels and methods): If Supervisors deem it necessary, they may actively communicate with employees and shareholders of the Company and the Company's employees may also propose opinions or file claims regarding their rights to the Supervisors. (2) Supervisors' communication with internal auditor manager and CPAs (e.g. communication over the Company's financial and business status, the methods and results, etc.): After the Company's internal auditor manager completes the audit report, the Supervisors are requested to review the contents of the Report. The Company's certifying CPAs may explain the results of the audit of the financial report or internal control to the Directors and Supervisors in accordance with regulations and propose necessary recommendations. If the Supervisors have any questions, they may contact the CPAs at any time.
2. Opinions stated by a Supervisor while attending Board of Directors' meetings, the date, session, contents of the case discussed, resolution of the meeting, as well as the Company's disposition of opinions stated by the Supervisor: None.
3.3.3 Operations of the audit committee: Not applicable as the Company does not have an audit
committee.

19
3.3.4 Implementaiton of corporate governance, deviations from Corporate Governance Best Practice Principles for TWSE/TPEx Listed Companies, and the reasons for the said deviations
Assessment Item
Implementation status Deviations from Corporate
Governance Best Practice Principles for TWSE/TPEx
Listed Companies and
Reasons
Yes No Summary
1. Does the Company stipulate and disclose best practice principles for corporate governance according to the Corporate Governance Best Practice Principles for TWSE/TPEx Listed Companies?
v The Company has established the "Corporate Governance Best Practice Principles"and disclosed them on the Company's website.
No deviation
2. Shareholding structure & shareholders' rights
(1) Does the Company establish an internal procedure for handling shareholder proposals, inquiries, disputes, and litigations? Are such matters handled according to internal procedure?
(2) Does the Company maintain a register
of major shareholders with controlling power as well as a register of persons exercising ultimate control over those of major shareholders?
(3) Has the Company established and
enforced risk control and firewall systems with its affiliated companies?
(4) Does the Company have internal
regulations in place to prevent its internal staff from trading securities based on information yet to be public on the market?
v
v
v
v
(1) The Company has established a
spokesperson and acting spokesperson system to ensure prompt disclosure of information that may affect shareholders' decision-making. The Company has also established a dedicated mailbox to process shareholders' suggestions or disputes.
(2) The Company reports changes in the number of shares held by insiders (Directors, managers, and major shareholders holding more than 10% of the shares) monthly in accordance with applicable laws.
(3) The Company has established the Subsidiary Company Management Regulations to enforce risk control and firewall systems with affiliated companies.
(4) The Company has established the "Procedures for Handling Material Inside Information" as the basis for handling and disclosing the Company's material information. The Procedures have been disclosed on the company's website.
No deviation No deviation No deviation No deviation
3. Composition and responsibilities of the Board of Directors
(1) Has a policy for diversity been established and implemented for the composition of the Board of Directors?
v
(1) The Company has established the
"Corporate Governance Best Practice Principles"and the Procedures for Elections of Directors and Supervisors to take into consideration diversity of the board members. Diversity in basic qualifications and professional knowledge are established based on the Company’s operations, business model, and development requirements. The Company considers Directors' professional background and diversity when appointing Directors. The Company has 9 Directors including 2 Independent Directors and 1 female
No deviation

20
Assessment Item
Implementation status Deviations from Corporate
Governance Best Practice Principles for TWSE/TPEx
Listed Companies and
Reasons
Yes No Summary
(2) In addition to the Remuneration
Committee and Audit Committee established according to law, has the Company voluntarily established other functional committees?
v
Director. Both Independent Directors have served terms for less than 3 years. The board members have professional backgrounds in business management, electrical engineering, finance, mathematics, and various professional skills and industry experience. The Company has fulfilled the requirements for diversity and complementary skill sets of board members established in the Company's "Corporate Governance Best Practice Principles". The Company values gender equality, and targets to have more than 10% of female Directors, and this target was achieved in this term of the Board of Directors.The implementation status of Board member diversity is provided below:
Name Gender
Industry knowledge and
skills Age
Industryrelated
Business manage-ment, law, finance
55 and below
55-65 65 and above
En-Chou Lin
Male v v v
En-Ping Lin Male v v v
Shih-Ching Chen
Male v v v
Yao-Ying Lin
Male v v v
Ming-Yuan Hsieh
Male v v
Po-Jen Liang
Male v v v
Tsui-Ying Chiang
Female v v
Shan-Chieh Yen
Male v v
Ming-Hua Peng
Male v v
(2) The Company has established the Compensation Committee and other corporate governance operations are assigned to other units based on their responsibilities. The Company shall establish other functional committees in accordance with regulations.
The Supervisors currently take on the duties of the Audit Committee

21
Assessment Item
Implementation status Deviations from Corporate
Governance Best Practice Principles for TWSE/TPEx
Listed Companies and
Reasons
Yes No Summary
(3) Has the Company established a performance evaluation method for the Board of Directors and conducted performance evaluation accordingly on an annual basis?
(4) Does the Company regularly assess
on the independence of CPAs?
v
v
(3) The Company's Compensation Committee establishes and regularly reviews Director and manager performance as well as compensation policies, systems, standards, and structures. It also submits recommendations to the Board of Directors for discussions.
(4) The Company's Board of Directors periodically evaluates the independence and competency of CPAs and obtain the CPAs' Statement of Independence. The Company verifies that the contents include compliance of all CPA personnel with the independence policy and prohibits any personnel from conducting insider trading and disseminating internal information. The evaluation standards are provided in Note 1 and was reported to the Board of Directors on February 25, 2019.
No deviation
No deviation
4. Does the TWSE/TPEx-listed company have a dedicated (part-time) unit/personnel in charge of the company' corporate governance affairs (including but not limited to providing information required for director/supervisor's operations, convening board/shareholder meetings in compliance with the law, apply for/change company registry and producing meeting minutes of board/shareholder meetings)?
v
The Company's part-time governance unit is the Administrative Department which regularly reviews updates to the Annual Report and related information on the Company's website.
No deviation
5. Has the Company set up channels of communication for stakeholders, dedicated a section of the Company's website for stakeholder affairs and adequately responded to stakeholders' inquiries on significant corporate social responsibility issues?
v The Company has established a spokesperson system and a dedicated Stakeholders Section on the Company's website to provide the Company's latest information and important corporate social responsibility issues.
No deviation
6. Has the Company commissioned a professional stock affair agency to manage shareholders' meetings and other relevant affairs?
v The Company has appointed the Shareholder Service Department of Taishin International Bank as the Company's stock affair agency to manage affairs related to shareholders' meetings.
No deviation
7. Information disclosure (1) Has the Company established a
website to disclose information on v
(1) The Company has established a website
in Chinese and English and regularly
No deviation

22
Assessment Item
Implementation status Deviations from Corporate
Governance Best Practice Principles for TWSE/TPEx
Listed Companies and
Reasons
Yes No Summary
financial operations and corporate governance?
(2) Does the Company adopt other means of information disclosure (such as establishing an English language website, delegating a professional to collect and disclose company information, implement a spokesperson system, and disclosing the process of investor conferences on the company website)?
v
updates the financial, business, and corporate governance information.
(2) The Company has assigned dedicated personnel to serve as the contact window for investors. Investors can download financial information from previous years and audio recordings of investor conferences from the website. The Company's website also discloses company information through links to the Market Observation Post System.
No deviation
8. Has the Company disclosed other information to facilitate a better understanding of its corporate governance (including but not limited to employee's rights, employee care, investor relations, supplier relations, stakeholders' rights, further studies of directors and supervisors, implementation of risk management policies and measurement standards, implementation of customer policies and purchase of liability insurance for the directors and supervisors of the Company)?
v 1. The Company has established various benefit measures and formed an Employee Welfare Committee which provides benefits, allowances, and emergency relief funds for employees
2. The Company provides the Directors and Supervisors with necessary legal information at all times.
3. The attendance of the Directors and Supervisors at the Company's Board of Directors meetings is satisfactory and they provide opinions on business operations when required.
4. The Company takes out liability insurance for the Directors and Supervisors each year.
5. The Company has set up an Investor Relations section and regularly updates related information for investors' reference.
6. The Company has a spokesperson, website, and established multiple channels to communicate and provide the Company's latest information.
No deviation
9. Improvements made in the most recent fiscal year in response to the results of corporate governance evaluation conducted by the Corporate Governance Center of the Taiwan Stock Exchange Corporation, and improvement measures and plans for items yet to be improved.
v
The Company has fully disclosed the execution of resolutions adopted in the General Shareholders' Meeting in the previous year and the implementation status of various employee welfare and pension programs. The Company has also established Independent Directors who complete their continuing education requirements in accordance with regulations each year.
Executed in accordance with related regulations of the competent authority

23
Note 1:
Evaluation item for the independence of CPAs Evaluation results
Meet independence criteria
1. Direct or indirect material financial interests between the CPAs and the Company? No Yes 2. Financing or endorsements with the Company 's Directors? No Yes 3. Close business relations with the Company? No Yes 4. Provide Non-audit services that may directly impact auditing tasks? No Yes 5. Serve as the Company's defense counsel or represent the Company in mediating conflicts with third parties?
No Yes
6. Are family members or relatives of the Company's Directors, Supervisors, or other individuals in positions that could seriously impact the audit?
No Yes
7. Employed by the Company or the Company's affiliated companies? No Yes 3.3.5 If the Company has set up a compensation committee, its composition, responsibilities and operations should
be disclosed: 1. Information on the members of the Compensation Committee
Title
Criteria Name
Meet the following professional qualification requirements, together with at least 5 years of work experience
Compliance of independence (Note)
Number of other public companies in
which the member is
also serving as a member
of their compensation
committee
Note
Instructor or above in department of commerce/law/finance/accounting or other company affairs related subjects at public/private university/college
Judge, prosecutor, lawyer, accountant, or other professional practice or technician that must undergo national examinations and specialized license
Work experience in commerce, law, finance, accounting or other areas relevant to the business of the Company
1 2 3 4 5 6 7 8
Others Sun-Yuan Chien
v v v v v v v v v 0 Re-elected
Independent Director
Shan-Chieh Yen
v v v v v v v v v 0 Newly appointed
Independent Director
Ming-Hua Peng
v v v v v v v v v 0 Newly appointed
Note: For any committee member who fulfills the relevant condition(s) 2 years before being elected or during the term of office, please tick in the appropriate corresponding boxes.
(1) Not employed by the Company or its affiliated companies. (2) Not a Director or Supervisor at the Company or its affiliated companies. This does not apply in cases where the
person is an independent director of the Company, its parent company, or subsidiary where the company holds, directly and indirectly, more than 50% of the voting shares.
(3) Not a natural-person shareholder who holds more than 1% of issued shares or is ranked top 10 in terms of the total shares held, including the shares held in the name of the person’s spouse, minor children, or in the name of others.
(4) Not a spouse, relative within the second degree of kinship, or direct, blood-related three-degree relative of the personnel listed in the first three criteria.
(5) Not a director, supervisor, or employee of a corporate shareholder that directly holds 5% or more of the total number of outstanding shares of the Company or that holds shares ranking in the top five in holdings.
(6) Not a director (a member of the governing board), supervisor (member of the supervising board), managerial officer, or shareholder who holds more than 5% of shares of companies or institutions that have financial or business dealings with the Company.
(7) Not a professional person, business owner, partner, director, supervisor, or manager of any sole-proprietorship, partnership, company, or institution providing commercial, legal, financial, or accounting services or consultations to the Company or any of its affiliated companies; nor a spouse of anyone listed herein.
(8) Where none of the circumstances in the subparagraphs of Article 30 of the Company Act applies.

24
2. Operations of the Compensation Committee (1) The Company's Compensation Committee consists of 3 members. (2) Term of office for the current members of the Compensation Committee: June 8, 2016 to June 7, 2019. A
total of two meetings were convened in 2018 and the attendance of the members was as follows:
Title Name Attendance in
Person Attendance by Proxy Attendance Rate (%) Note
Member Sun-Yuan Chien 2 0 100% Re-elected Convener Shan-Chieh Yen 2 0 100% Newly appointedMember Ming-Hua Peng 2 0 100% Newly appointed
Annotations: 1. If the Board of Directors chooses not to adopt or amend the recommendations made by the Compnesation
Committee, the date and session of the Board of Directors' meeting, resolutions, voting results and handling of opinions of the Compensation Committee by the Company should be disclosed (if the compensation approved by the Board of Directors is better than that of the Compensation Committee, the discrepancies and related reasons should be stated): None.
2. If the members of the Compensation Committee have any dissenting or qualified opinions on the resolutions of the Compensation Committee, where such opinions are documented or issued through written statements, the date and session of the meeting of the Compensation Committee, resolutions, all the members' opinions and handling of these opinions should be stated: None.
3. Discussions and results of resolutions of the Compensation Committee and the Company's handling of opinions of the committee members: First meeting of the Compensation Committee on February 12, 2018: (1) Reviewed the Company's proposal for compensation distribution for employees, Directors, and Supervisors
for 2017. The chair of the Compensation Committee consulted all committee members in attendance. The proposal was passed unanimously and submitted for discussion in the Board meeting where it was approved by all Directors in attendance.
(2) Reviewed the Company's salary and remuneration for Directors, Supervisors, and managerial officers and the distribution of compensation to Directors and Supervisors in 2017. The chair of the Compensation Committee consulted all committee members in attendance. The proposal was passed unanimously and submitted for discussion in the Board meeting where it was approved by all Directors in attendance.
Second meeting of the Compensation Committee on July 23, 2018: (1) Reviewed the Company's proposal for compensation distribution for managerial officers for 2017. The chair
of the Compensation Committee consulted all committee members in attendance. The proposal was passed unanimously and submitted for discussion in the Board meeting where it was approved by all Directors in attendance.

25
3.3.6 CSR implementation: The Company's CSR practices, such as environmental protection, social engagement, social contribution, community service, community welfare, consumer rights, human rights, safety and health, the system and methods used to plan and organize CSR activities and the status of implementation:
Assessment Item
Implementation status Deviation from Corporate Social Responsibility Best Practice Principles for TWSE/TPEx Listed Companies and Reasons for Deviation
Yes No Summary
1. Implementing corporate governance (1) Has the Company set up corporate
social responsibility (CSR) policies and systems and reviewed the effectiveness of CSR implementation?
(2) Does the Company conduct CSR
education and training on a regular basis?
(3) Has the Company set up a dedicated
(part-time) unit for promoting CSR? Is the unit empowered by the Board of Directors to implement CSR activities at the senior management level? Does the unit report the progress of such activities to the Board of Directors?
v
v
v
(1) The Company has established the
"Corporate Governance Best Practice Principles" and disclosed them on the Company's website. The Company follows the Code of Conduct of the Electronic Industry Citizenship Coalition (EICC) and other international standards in internal audits and external customer evaluations. Discrepancies are listed and reviewed and improvement measures are implemented to ensure the safety of employees' work environment, protection of employee rights, and control contamination in the production process and generation of products.
(2) The Company conducts CSR education and training from time to time.
(3) The Company's Vice President of
Administration serves concurrently as the Chairman of the Corporate Social Responsibility Committee. The Administration Department is authorized to assemble representatives from Sales, Procurement, Finance, Human Resources, and Legal Affairs Departments and assign dedicated employees to create a section for stakeholders on the corporate website to collect their feedback. Each department can report stakeholders' issues of concern to the Vice President and provide relevant written information to the Board of Directors at the end of each fiscal year. Social issues: The Company has contributed more than NT$10 million in donations to alleviate the suffering of victims in major natrual disasters, such as the Kaohsiung gas explosion, typhoons in the Philippines, and victims in the recent Tainan earthquake, as well as patients suffering from Lou Gehrig's disease, on humanitarian considerations to speed up their recovery and rehabilitation.
No deviation No deviation No deviation

26
Assessment Item
Implementation status Deviation from Corporate Social Responsibility Best Practice Principles for TWSE/TPEx Listed Companies and Reasons for Deviation
Yes No Summary
(4) Has the Company established a fair
compensation policy and linked employee performance evaluation with CSR policy, as well as established a precise and effective incentive and disincentive system?
v
Education issues: The Company collaborates with major universities and has donated equipment for students to gain hands-on experience and improve their skills. In addition, it also awarded scholarships to disadvantaged students to enable them to focus on their studies.
(4) The Company sets salaries for employees based on their academic background, professional knowledge, skills, and experience. The Company does not discriminate against genders, religions, race, or political affiliation. Employee performance evaluations are conducted in accordance with the Employee Performance Evaluation Regulations. If the Company has profit for the year, it shall allocate 1% to 30% as employees' compensation.
No deviation
2. Development of environmental sustainability
(1) Is the Company committed to improving the efficient use of resources and utilizing renewable resources to reduce environmental impact?
(2) Has the Company established a suitable environmental management system based on the nature of its industry?
(3) Has the Company paid attention to the
impacts of climate change on business operations, implemented greenhouse gas audit and formulated energy conservation and carbon reduction as well as greenhouse gas cutback strategy?
v
v
v
(1) The Company actively improves the
efficiency of its use of resources including electricity, water, and raw materials.
(2) The Company has obtained ISO 14001
certification and established industrial waste management procedures to meet relevant regulatory requirements. The Company has also established a dedicated unit to take charge of environmental management and protection responsibilities.
(3) The impacts of climate change have become a common environmental issue globally. The Company aims to achieve low pollution and low energy consumption by improving the production process and air-conditioning equipment in order to be more environmentally friendly. 1. T8 lamps in factories have been
replaced with T5 lamps. 2. Improved air-conditioning and
cooling equipment in various plants with the aim of achieving more than 1% in electricity savings.
3. Energy usage: 13,163.992 KLOE with a savings rate of 9.224%.
4. The plant under construction were inaugurated in 2017. In addition to adopting a "green building" concept in design, the buildings fully adopt
No deviation No deviation No deviation

27
Assessment Item
Implementation status Deviation from Corporate Social Responsibility Best Practice Principles for TWSE/TPEx Listed Companies and Reasons for Deviation
Yes No Summary
LED lighting equipment which is expected to save 1214.101 KLOE in energy.
3. Safeguarding public welfare (1) Has the Company set up management
policy and procedures according to related laws and regulations and the International Bill of Human Rights?
(2) Has the Company established
employee complaint systems and channels, and are employee complaints handled appropriately?
(3) Has the Company provided employees with safe and healthy work environment as well as regular classes on health and safety?
(4) Has the Company established a
system to regularly communicate with its employees, and used appropriate means to notify them of operational changes that may cause material impacts?
(5) Has the Company established an
effective competency development career training program for employees?
v
v
v
v
v
(1) The Company is committed to
following all labor regulations and protecting employee rights. The Company has established an "Employee Work Handbook", and appropriate management mechanisms for "Sexual Harassment Prevention", "Prevention of Non-Voluntary Labor", "Occupational Maternity Protection", and "Complaint Management Procedures" in accordance with the Code of Conduct of the Electronic Industry Citizenship Coalition (EICC). The contents include working hours, wages, humanitarian treatment, non-discrimination, freedom of association, and anti-bullying regulations. The Company has set up complaint hotlines and emails, as well as a CEO mailbox for employees to provide various suggestions anonymously to prevent acts of retribution.
(2) The Company has established a complaint mailbox and assigned a unit to process employee grievances.
(3) The Company provides employees
with a safe and healthy work environment and administers regular safety education for all employees. Regular health examinations are organized and professional doctors are available to provide employees with psychological and health consultancy services.
(4) The Company has established internal bulletin boards to inform employees of Company announcements. Suggestion mailboxes and a CEO mailbox have been set up to provide diverse communication channels and ensure smooth communication with employees.
(5) The Company provides multiple internal and external education and training programs and appoint professional instructors to give lectures from time to time on professional skills and technology.
No deviation No deviation No deviation No deviation No deviation

28
Assessment Item
Implementation status Deviation from Corporate Social Responsibility Best Practice Principles for TWSE/TPEx Listed Companies and Reasons for Deviation
Yes No Summary
(6) Has the Company established relevant policies and systems of appeal for consumer rights for the processes of research and development, procurement, production, operations, and services?
(7) With regard to marketing and labeling
of products and services, does the Company comply with related regulations and international standards?
(8) Prior to conducting business with suppliers, does the Company evaluate the suppliers in terms of past records of impacts on the environment and society?
(9) Do contracts between the Company and its major suppliers include terms where the Company may terminate or rescind the contract at any time if the said suppliers violate the Company's corporate social responsibility policy and have caused material impacts on the environment and the society?
v
v
v
v
(6) The Company organizes regular meetings with customers and assign dedicated units to take charge of product development and services and provide services in the shortest time possible.
(7) All of the Company’s products comply with relevant regulations and international standards.
(8) The Company values protection of the
environment and society and chooses companies with the same integrity as the Company.
(9) The Company signs confidentiality and
integrity agreements with suppliers to jointly commit to fulfilling corporate social responsibilities.
No deviation No deviation No deviation No deviation
4. Enhancing information disclosure (1) Does the Company disclose relevant
and reliable information related to CSR on its official website or the Market Observation Post System?
v The Company has disclosed relevant information on the Company's website and annual report.
No deviation
5. If the Company has established corporate social responsibility principles based on "Corporate Social Responsibility Best Practice Principles for TWSE/TPEx Listed Companies", please describe any deviations between the principles and their implementation: The Company has established a CSR policy that encompasses ethics, labor, and other related regulations. The Company fulfills its social responsibilities in accordance with its business philosophy and vision for development.
6. Other key information useful for explaining status of corporate social responsibility practices: (1) CSR governance framework: The highest-level manager of the Administration Department serves as the representative of the CSR organization and serves concurrently as the management representative. The officer shall convene a meeting at least once every six months with representatives assigned by the Human Resources, Sales, Procurement, Maintenance, Finance, R&D, Manufacturing, and Quality Management Departments to jointly promote and implement corporate social responsibility issues, and report the results of the implementation to the Board of Directors. (2) CSR operations and status of implementation: Industrial and academic collaboration: The Company donates equipment and regularly provides scholarships to improve students’ practical skills.. The Company also arranges corporate lecturers to communicate with teachers and students in schools to enhance interactions and connections between the industry and academia. Social welfare: The Company provides donations for disaster relief or necessary resources for major disasters. Occupational training and job matching: The Company organizes related professional courses with the Taichung-Changhua-Nantou Regional Branch of the Workforce Development Agency and courses include training for unemployed laborers, youth occupational training, and on-the-job training for employees. After completion of training, the Company may employ these students through job matching mechanisms. (3) CSR implementation results:
1. The Company organized 22 campus seminars in 2018 for 1,695 participants. 2. 2017-2018 donation details:
2017 January Tsing Hua University Sponsorship Program (2nd year) Cash: NT$1 million

29
Assessment Item
Implementation status Deviation from Corporate Social Responsibility Best Practice Principles for TWSE/TPEx Listed Companies and Reasons for Deviation
Yes No Summary
April Equipment donation: National Chung Hsing University Equipment: 1 unit
Equipment donation: Taichung-Changhua-Nantou Regional Branch of the Workforce Development Agency
Equipment: 1 unit
July National Chung Hsing University Scholarship Cash: NT$100,000
2018 March
Tsing Hua University Sponsorship Program (3rd year) Cash: NT$1 million Project sponsorship for the Department of Mechanical Engineering, National Cheng Kung University
Cash: NT$4 million
Hualien Earthquake Disaster Relief Donation Cash: NT$5 million
July 2018 National Chung Hsing University Scholarship Cash: NT$100,000
October AED Equipment donation: Fire Bureau of Taichung City Government
Equipment: 22 units
December Equipment donation: National Taiwan University Hospital (Eye Measurement)
Equipment: 1 unit
3. Number of people employed in 2018 through professional training and job matching: 39 accepted and a total of 109 people employed year to date.
7. Describe, if any, whether the Company's product or CSR Report has been certified by relevant certification bodies: ISO9001, ISO14001, and OHSAS 18001
3.3.7 Compliance with ethical corporate management and measures implemented:
Assessment Item
Implementation status Deviation from the "Ethical Corporate Management Best Practice Principles for TWSE/TPEx
Listed Companies" and
Reasons for Deviation
Yes No Summary
1. Stipulating policies and plans for ethical corporate management
(1) Has the Company clearly shown its ethical operational policy and methods in its regulations and external documents, in addition, has the Board of Directors and the management proactively implemented the commitment to ethical business operations in practice?
(2) Has the Company set plans to forestall unethical conduct, clearly prescribed procedures/best practices/disciplinary actions and reporting systems for violations in plans, and implemented the plans accordingly?
(3) Has the Company established preventive
measures for the items prescribed in Article 7, Paragraph 2 of the Ethical Corporate Management Best Practice Principles for TWSE/GTSM Listed Companies or business activities with a higher risk of being involved in an unethical conduct within the Company’s scope of business?
v
v
v
(1) The Company has disclosed
"Ethical Corporate Management Best Practice Principles and Reporting and Complaint Policy" on the company website.
(2) New recruits are required to sign
an Integrity Rules and Guideline to ensure they understand and abide by the Company's integrity policies.
(3) The Company requires suppliers,
contractors, and other partners to sign written statements that they shall not conduct any illegal business activities or provide inappropriate benefits or bribes to the Company's employees. The Company has established a
No deviation No deviation No deviation

30
Assessment Item
Implementation status Deviation from the "Ethical Corporate Management Best Practice Principles for TWSE/TPEx
Listed Companies" and
Reasons for Deviation
Yes No Summary
whistleblower system to provide personnel with channels to report any inappropriate conduct.
2. Implementing ethical corporate management(1) Does the Company assess the integrity
records of its business partners, and specify ethical business policy in contracts with the partners?
(2) Has the Company established a dedicated
(part-time) unit under the Board of Directors for promoting ethical corporate management? Does the said unit regularly report to the Board of Directors on the state of its activities?
(3) Has the Company established policies
preventing conflict of interests, provided proper channels of appeal, and enforced these policies and channels accordingly?
(4) Has the Company established effective accounting systems and internal control systems for enforcing ethical corporate management? Are regular audits carried out by the Company’s internal audit unit or commissioned to a CPA?
(5) Does the Company regularly organize
internal and external training for ethical corporate management?
v
v
v
v
v
(1) The Company requires all
stakeholders with business transactions with the Company such as suppliers, contractors, and other partners to abide by the same ethical standards as the Company’s employees, and submit written agreements that they shall not provide inappropriate interest or bribes. The Company also promotes relevant ethical guidelines to them periodically. The Board of Directors and management implement the ethical business principles in internal management and external business activities.
(2) The Company's Board of Directors and management actively uphold the business principle for ethical management in both internal management and external business activities. The Company has formed audit and legal affairs units to ensure the legality of business activities, implement supervision mechanisms, and control various risks, and the state of these activities are reported to the Board of Directors.
(3) The Company has established an internal complaint mailbox and provides a report section on the Company's website.
(4) The Company has established effective accounting and internal control systems to ensure the implementation of ethical management. The audit unit establishes annual audit plans for inspections based on risk assessment results. It also prepares an audit report for the Board of Directors.
(5) New recruits are required to sign the Integrity Rules and Guideline to ensure they understand the
No deviation No deviation No deviation No deviation No deviation

31
Assessment Item
Implementation status Deviation from the "Ethical Corporate Management Best Practice Principles for TWSE/TPEx
Listed Companies" and
Reasons for Deviation
Yes No Summary
Company's integrity policies and available channels to report inappropriate conduct.
3. Status for enforcing whistleblowing systems in the Company
(1) Has the Company established a specific whistleblowing and reward system, set up convenient whistleblowing channels, and designated appropriate personnel to handle the investigations, depending on the identity of the person being reported?
(2) Has the Company established standard investigation operation and procedure for whistleblowing matters and relevant protective mechanisms?
(3) Has the Company adopted protection against inappropriate disciplinary actions for the whistleblower?
v
v
v
The Company has established work rules and requires employees and partners to sign written statements regarding ethics, and has also established a whistleblowing system to provide employees or related personnel with channels for reporting any inappropriate conduct. The reports are processed personally by senior management personnel designated by the Company. The Company has also established confidentiality and protection systems for whistleblowers to protect them from inappropriate treatment for their reports. Any violation of the Company's professional ethical standards are punished in accordance with the Rewards and Penalties Regulations.
No deviation
4. Enhancing information disclosure (1) Has the Company disclosed the contents of
its best practices for ethical corporate management and the effectiveness of relevant activities on its official website or Market Observation Post System?
v The Company has disclosed related contents of the "Ethical Corporate Management Best Practice Principles and Reporting and Complaint Regulations" on the company website.
No deviation
5. If the Company has established Ethical Corporate Management Principles in accordance with the "Ethical Corporate Management Best Practice Principles for TWSE/TPEX-Listed Companies", describe any deviations between the principles and their implementation: None.
6. Other important information that facilitates the understanding of the implementation of ethical corporate management (such as review and amendment of the Company's Ethical Corporate Management Best Practice Principles): None.
3.3.8 Corporate governance principles, related guidelines, and the means of accessing this information: The Company's website http://www.largan.com.tw.
3.3.9 Other material information that can enhance the understanding of the state of corporate governance at the Company: None.

32
3.3.10 The following matters regarding the internal control system implementation status shall be disclosed:
1. Internal Control Statement Largan Precision, Co., Ltd.
Internal Control System Statement Date: February 25, 2019
This Internal Control System Statement is issued based on the self-assessment results of the Company for 2018: (1) The Company acknowledges that the Company's Board of Directors and managers are
responsible for the implementation and maintenance of the internal control system, and that the Company has already established such a system. The objectives of internal control system include obtaining business benefits and efficiency (including profitability, performance, and protection of assets and safety); ensuring the reliability, timeliness, transparency, and regulatory compliance of reporting; and providing reasonable assurance.
(2) The internal control system has inherent constraints, and no matter how comprehensive its design may be, an effective internal control system is only capable of providing adequate assurance for achieving the above-mentioned objectives. In addition, the effectiveness of the internal control system may change with the environment and different situations. Nevertheless, the Company's internal control system contains self-monitoring mechanisms and the Company takes immediate remedial actions in response to any identified deficiencies.
(3) The Company determines the effectiveness of the design and implementation of its internal control system in accordance with the items in "Regulations Governing Establishment of Internal Control Systems by Public Companies" (hereinafter referred to as the "Governing Regulations") that are related to the effectiveness of internal control systems. The criteria adopted by the Governing Regulations are divided into 5 components in accordance with the procedure s of management control: 1. Control Environment; 2. Risk Assessment; 3. Control Activities; 4. Information and Communication; and 5. Monitoring Activities. Each constituent element includes a number of categories. Please refer to "Governing Regulations" for details.
(4) The Company has already adopted the aforementioned internal control system assessment items to evaluate the effectiveness of internal control system design and implementation.
(5) Based on the above assessment results, the Company determined that the internal control system (covering monitoring and management of its subsidiaries) as of December 31, 2018 has been effectively designed and implemented and sufficient to ensure that the objectives below are achieved, including understanding the degree of achievement of operational effectiveness and efficiency objectives, reliable, timely and transparent reporting and compliance of applicable rules, laws, regulations and bylaws.
(6) This statement of declaration shall be the primary content of the Company's Annual Report and prospectus, and shall be made available to the public. Falsehood, concealment, or other illegality in the content made public will entail legal liability under Articles 20, 32, 171, and 174 of the Securities and Exchange Act.
(7) This Statement was approved by the Board on February 25, 2019 where 0 of the 8 attending directors expressed dissenting opinions, and the remainder all affirmed the content of this Statement.
Largan Precision, Co., Ltd. Chairman: En-Chou Lin
President: En-Ping Lin 2. Where CPAs are commissioned to audit the Company's internal control systems, the audit
report prepared by the CPAs shall be disclosed: None.

33
3.3.11 From the most recent fiscal year up until the date of publication of the Annual Report,
explain the circumstances in which the Company and its personnel have been punished
by law, the Company has undertaken disincentive measures for its personnel for
breaching the internal control system, and any material deficiencies and revisions: None.
3.3.12 Material resolutions adopted by the Shareholders' Meetings and the Board meetings in
the most recent fiscal year up to the publication date of this Annual Report: 1. Material resolutions adopted in the 2018 Shareholders' Meeting and implementation status
Adoption of the 2017 Business Report and Financial Statements
Implementation status: Resolution passed.
Adoption of 2017 earnings distribution proposal
Implementation status: August 22, 2018 was set as the ex-dividend record date and
dividends were distributed on September 5, 2018.
(Cash dividend per share was NT$72.5. )
Amendment to the Company's "Rules and Procedures for Shareholders' Meetings"
Implementation status: Completed in accordance with the resolution of the Shareholders'
Meeting.
Amendment to the "Articles of Incorporation"
Implementation status: Approved for registration by the competent authority on June 27,
2018.
2. Important resolutions of the Board of Directors
Date of
Meeting Material Resolutions
2018.2.26
Approved matters related to the convening of the 2018 General
Shareholders' Meeting.
Approved the compensation distribution for employees, Directors, and
Supervisors for 2017.
Approved the Company's salary and remuneration for Directors,
Supervisors, and managerial officers and the distribution of
compensation to Directors and Supervisors for 2017.
Approved the 2017 Business Report and Financial Statements.
Approved amendment to the Company's "Rules and Procedures for
Shareholders' Meetings".
2018.4.23 Approved the 2017 earnings distribution proposal.
Apprvoed amendment to the "Articles of Incorporation".
2018.7.30
Deteremined the ex-dividend date for the distribution of cash dividends.
Approved the 2017 compensation distribution proposal for managerial
officers reviewed by the Compensation Committee.

34
Date of
Meeting Material Resolutions
2018.10.23 Approved the 2019 Business Plan.
Approved the 2019 Audit Plan.
2019.2.25
Approved matters related to the convening of the 2019 General
Shareholders' Meeting.
Approved the compensation distribution for employees, Directors, and
Supervisors for 2018.
Approved the Company's salary and remuneration for Directors,
Supervisors, and managerial officers and the distribution of
compensation to Directors and Supervisors for 2018.
Approved the 2018 Business Report and Financial Statements.
Approved amendment to the "Articles of Incorporation".
Approved amendment to the "Procedures for the Acquisition or Disposal
of Assets".
Approved amendment to the "Procedures for Engaging in Derivatives
Trading".
Election of the Company's 17th-term of Directors and Supervisors.
Approved the Internal Control System Statement.
Evaluation of the independence of CPAs.
Approved amendment of the "Corporate Governance Best Practice
Principles".
Established the Company's "Standard Operating Procedures for Requests
Filed by Directors".
3.3.13 Major contents of any dissenting opinions on record or stated in a written statement made by Directors or Supervisors regarding key resolutions of the Board of Directors’ meeting in the most recent year up to the publication date of the Annual Report: None.
3.3.14 Summary of the resignation and dismissal of the Company's Chairman, President,
Accounting Manager, Finance Manager, Head of Internal Audit and Head of Research and Development in the most recent fiscal year up to the publication date of the Annual Report: None.

35
3.4 Information on CPA fees 3.4.1 Information on the CPA’s professional fees Name of the CPA
Firm Name of CPA Audit period Notes
KPMG Taiwan Tzu-Hsin
Chang Chun-Man
Chen January 1, 2018 to December
31, 2018 -
Professional fee
Amount range Audit fees Non-audit fees Total
1 Less than NT$2,000,000 v
2 NT$2,000,000 (inclusive) to NT$4,000,000 v v
3 NT$4,000,000 (inclusive) to NT$6,000,000
4 NT$6,000,000 (inclusive) to NT$8,000,000
5 NT$8,000,000 (inclusive) to NT$10,000,000
6 More than NT$10,000,000 (inclusive)
3.4.2 Amount of non-audit fees and details of non-audit services:
Unit: NT$thousands
Name of the CPA
Firm
Name of CPA
Audit fees
Non-audit fees Audit period Notes
System design
Business registration
Human resources Others Subtotal
KPMG Taiwan
Tzu-Hsin Chang
2,531
0 15 0 250 265
January 1, 2018 to December 31, 2018
TP Report, change of registration, review of annual report for Shareholders' Meeting totaling NT$265 thousand.
Chun-Man Chen
3.4.3 Replacement of accounting firms and the annual audit expenses are less than that of the
year prior to the change: None. 3.4.4 Audit expenses have decreased by 15% or more from the previous period: None. 3.5 Replacement of CPAs: 3.5.1 Former CPA
Date of Change February 20, 2019
Replacement reasons and explanations Due to internal adjustments of duties in the certifying accounting firm, CPAs Tzu-Hsin Chang and Chun-Man Chen are replaced by CPAs Tzu-Hsin Chang and Shih-Hua Kuo.
State whether the client or the CPAs have terminated the engagement or whether the client or the CPAs have rejected the engagement
PrincipalStatus CPA Client
Termination initiated by the client
Not applicable.
CPA declined to accept (continue) the engagement

36
Opinion and reason for the issuance of audit reports containing opinions other than unqualified opinions in the most recent two fiscal years
Not applicable.
Different opinions from the issuer
Yes
Accounting principles or practices
Disclosure of financial statements Audit scope or procedures Others
None v Description
Other disclosures (Matters that should be disclosed in accordance with Item 1-4 to 1-7, Subparagraph 6, Article 10 of the Regulations)
Not applicable.
3.5.2 Succeeding CPA
Name of CPA Firm KPMG Taiwan
Name of CPA CPAs Tzu-Hsin Chang and Shih-Hua Kuo
Date of appointment February 20, 2019
Subjects and outcomes of consultation on the accounting treatment of or application of accounting principles to specific transactions, or opinions that may be included on financial statements before the appointment of new CPAs
Not applicable.
The succeeding accountant’s opinions in written form in response to the former accountant’s opinions
Not applicable.
3.5.3 The former CPA's response for items specified in Article 10, Subparagraph 6, Item 1 and Item 2-3 of the Accounting Standards: Not applicable.

37
3.6 Company's Chairman, President, or any managerial officer in charge of finance or
accounting matters who has, in the most recent year, held a position at the accounting firm of its CPA or at an affiliated company: None.
3.7 Equity transfer or changes in equity pledged by the Company's Directors, Supervisors,
managerial officers or shareholders with shareholding percentage exceeding 10% in the most recent fiscal year up to the publication date of the Annual Report:
3.7.1 Changes to shares held by Directors, managerial officers, and shareholders holding more than 10% of shares:
Title Name
2018 As of April 14, 2018
NoteIncrease
(decrease) in number of shares
held
Increase (decrease) in
number of shares pledged
Increase (decrease) in
number of shares held
Increase (decrease) in
number of shares pledged
Chairman (Vice
President) En-Chou Lin (1,250,000) 0 0 0
Vice Chairman (CEO)
En-Ping Lin (2,640,146) 0 0 0
Director Yao-Ying Lin (1,000,000) 0 0 0
Director Shih-Ching Chen
0 0
0 0
Director Po-Jen Liang 1,000 0 0 0
Director Ming-Yuan Hsieh
0 0
0 0
Director Tsui-Ying Chiang
0 0
0 0
Independent Director
Shan-Chieh Yen
0 0
0 0
Independent Director
Ming-Hua Peng
0 0
0 0
Supervisor Chung-Jen Liang
0 0
0 0
Supervisor Hui-Fen Chen
0 0
0 0
Supervisor Hsiao-Pei Su 0 0 0 0
Vice President Chung-Shih Lin
0 0 0 0
Chief Technology Officer/Vice
President
Yu-Chih Huang
0 0 0 0
Assistant Vice President
Sheng-Lien Wang
0 0 0 0
Finance/ Accounting
Director
Hsing-Ju Tsao
0 0 0 0
Note 1: The Company does not have shareholders who hold more than 10% of the Company's
total shares.

38
3.7.2 Where the counterparty in the transfer of shares is a related party:
Name Reason for
transfer Date of
transaction Counterparty
Relationship between the counterparty and the
Company, its Directors, Supervisors and
shareholders with shareholding percentage of
over 10%
Number of shares
Transaction price
En-Chou Lin
Disposal 2018.9.18 Mao Yu Commemorate Co., Ltd.
Shares held by a Director in the name of other persons
1,250,000 -
En-Ping Lin
Disposal 2018.9.18 Mao Yu Commemorate Co., Ltd.
Shares held by a Director in the name of other persons
2,640,146 -
Yao-Ying Lin
Disposal 2018.9.18 Mao Yu Commemorate Co., Ltd.
Shares held by a Director in the name of other persons
1,000,000 -
3.7.8 Where the counterparty in the pledge of shares is a related party: None.
3.8 Information on the relationship between the top 10 shareholders of the Company:
Name
Personal shareholding
Shares held by spouse and minor
children
Shares held in the name of other
persons
Familial relationships between top 10
shareholders who are either related parties, spouses, or relatives
within the second degree of kinship,
his/her/its title (or name) and relationships
Note
Number of shares
% Number of
shares %
Number of shares
% Title (or name)
Relationship
Mao Yu Commemorate Co.,
Ltd. Representative: Yao-Ying Lin
8,672,968 6.47% - - - - En-Chou
Lin, En-Ping Lin
Son of representative
Shih-Ching Chen 6,756,831 5.04% 6,625,569 4.94% - - Tsui-Ying
Chiang Spouse -
Tsui-Ying Chiang 6,625,569 4.94% 6,756,831 5.04% - - Shih-Ching
Chen Spouse -
Cathay Life Insurance Co., Ltd.
Representative: Hung-Tu Tsai
4,108,000 3.06% - - - - - -
Government of Singapore Investment
Corp. under the custody of Citibank (Taiwan) Limited
3,746,262 2.79% - - - - - -
Ming-Yuan Hsieh 3,606,585 2.69% - - - - - - -
En-Ping Lin 3,379,506 2.52% - - 2,640,146 1.97%
Yao-Ying Lin/
En-Chou Lin
Father-son/ Brothers
-
EuroPacific Growth Fund under the
custody of JP Morgan Chase Bank Taipei
Branch
2,962,000 2.21% - - - - - - -
En-Chou Lin 2,861,142 2.13% 2,479,504 1.85% 2,450,000 1.83%Yao-Ying
Lin/ En-Ping Lin
Father-son/ Brothers
-

39
Name
Personal shareholding
Shares held by spouse and minor
children
Shares held in the name of other
persons
Familial relationships between top 10
shareholders who are either related parties, spouses, or relatives
within the second degree of kinship,
his/her/its title (or name) and relationships
Note
Number of shares
% Number of
shares %
Number of shares
% Title (or name)
Relationship
Prospect Foundation investment account under the custody of
JP Morgan Chase Bank Taipei Branch
2,691,000 2.01% - - - - - - -
3.9 Information on the number of shares of the companies invested by the Company, its Directors, Supervisors and managerial officers or a company directly or indirectly controlled by the Company and consolidated percentage of shareholding:
December 31, 2018
Units: 1,000 shares; %
Investee
Investment by the Company
Investments of Directors, Supervisors, managerial officers and directly or
indirectly controlled businesses
Combined investment
Number of shares
% Number of shares % Number of shares %
Largan Digital Co.,
Ltd. 26,636 49.37 5,914 10.96 32,550 60.33

40
4. Funding Status
4.1 Company capital and issuance of shares
4.1.1 Sources of shares
Unit: Share; NT$
Year/month Issuance
price
Authorized capital Paid-in capital Note
Number of shares
amount Number of
shares amount
Sources of capital
Subscriptions paid with
property other than cash
Others
98.7 10 200,000,000 2,000,000,000 134,140,197 1,341,401,970
Capital increase by
earnings 2,602,665
shares Capital
increase by employee
bonus 1,404,251
shares Total new
shares issued 4,006,916
shares
None Note
Note: Jin-Guan-Zheng-I No. 0980034271 dated July 9, 2009
April 14, 2019; Unit: Share
Shares Type
Authorized capital NoteOutstanding shares Unissued shares Total
Registered common shares 134,140,197 65,859,803 200,000,000 -

41
4.1.2 Shareholder structure
April 14, 2019
Shareholder structure
Number
Government institutions
Financial institutions
Other legal persons
Individuals
Foreign institutions
and foreigners
Total
Number of people
6 218 72 9,953 1,244 11,493
Number of shares held
3,961,316 11,630,868 9,144,537 41,918,386 67,485,090 134,140,197
Shareholding ratio
2.95% 8.67% 6.82% 31.25% 50.31% 100%
4.1.3 Distribution of equity ownership
The nominal value is NT$10 per share
April 14, 2019
Shareholding classification Number of shareholders Number of shares held Shareholding ratio 1 to 999 8,448 295,962 0.22% 1,000 to 5,000 2,000 3,660,196 2.73% 5,001 to 10,000 285 2,106,011 1.57% 10,001 to 15,000 154 1,980,100 1.48% 15,001 to 20,000 88 1,558,119 1.16% 20,001 to 30,000 124 3,018,813 2.25% 30,001 to 40,000 56 1,958,196 1.46% 40,001 to 50,000 51 2,290,823 1.71% 50,001 to 100,000 118 8,252,444 6.15% 100,001 to 200,000 72 10,468,875 7.80% 200,001 to 400,000 45 12,866,256 9.59% 400,001 to 600,000 18 8,568,196 6.39% 600,001 to 800,000 6 4,192,828 3.13% 800,001 to 1,000,000 3 2,516,385 1.88% 1,000,001 to 999,999,999 25 70,406,993 52.48%
Total 11,493 134,140,197 100.00%
4.1.4 List of major shareholders: Please refer to page 38 of the Annual Report.
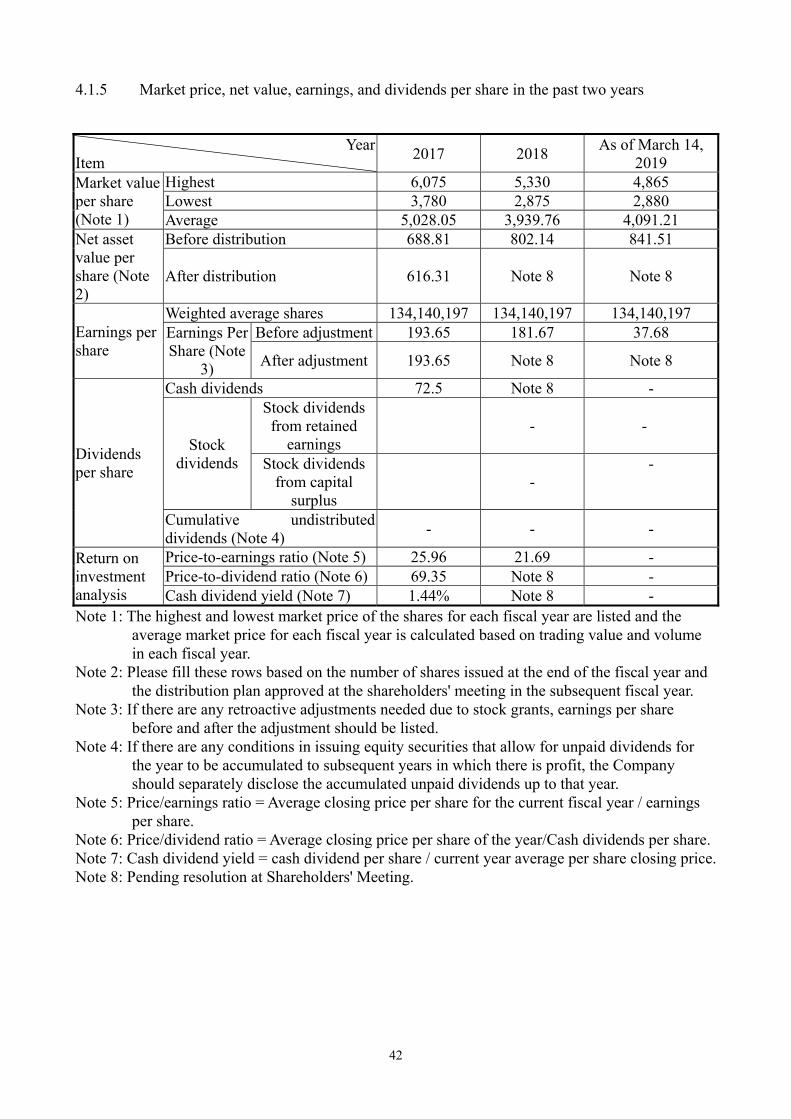
42
4.1.5 Market price, net value, earnings, and dividends per share in the past two years
YearItem
2017 2018 As of March 14,
2019 Market value per share (Note 1)
Highest 6,075 5,330 4,865 Lowest 3,780 2,875 2,880 Average 5,028.05 3,939.76 4,091.21
Net asset value per share (Note 2)
Before distribution 688.81 802.14 841.51
After distribution 616.31 Note 8 Note 8
Earnings per share
Weighted average shares 134,140,197 134,140,197 134,140,197 Earnings Per Share (Note
3)
Before adjustment 193.65 181.67 37.68
After adjustment 193.65 Note 8 Note 8
Dividends per share
Cash dividends 72.5 Note 8 -
Stock dividends
Stock dividends from retained
earnings - -
Stock dividends from capital
surplus -
-
Cumulative undistributed dividends (Note 4)
- - -
Return on investment analysis
Price-to-earnings ratio (Note 5) 25.96 21.69 - Price-to-dividend ratio (Note 6) 69.35 Note 8 - Cash dividend yield (Note 7) 1.44% Note 8 -
Note 1: The highest and lowest market price of the shares for each fiscal year are listed and the average market price for each fiscal year is calculated based on trading value and volume in each fiscal year.
Note 2: Please fill these rows based on the number of shares issued at the end of the fiscal year and the distribution plan approved at the shareholders' meeting in the subsequent fiscal year.
Note 3: If there are any retroactive adjustments needed due to stock grants, earnings per share before and after the adjustment should be listed.
Note 4: If there are any conditions in issuing equity securities that allow for unpaid dividends for the year to be accumulated to subsequent years in which there is profit, the Company should separately disclose the accumulated unpaid dividends up to that year.
Note 5: Price/earnings ratio = Average closing price per share for the current fiscal year / earnings per share.
Note 6: Price/dividend ratio = Average closing price per share of the year/Cash dividends per share. Note 7: Cash dividend yield = cash dividend per share / current year average per share closing price. Note 8: Pending resolution at Shareholders' Meeting.

43
4.1.6 Dividend policy and implementation status
1. Current Articles of Incorporation:
As the Company experiences constant changes in the business environment and is at a stage of stable growth, the Company’s dividend policy depends on factors such as future fund requirements, long-term financial plans, future capital expenditures and maximization of shareholder interests. The Company may retain a portion of earnings based on operational requirements and the remaining amount shall be distributed in cash and stock dividends. The amount of dividends distributed to shareholders shall be no less than 10% of distributable earnings of the current year, and no less than 30% of the shareholders’ dividends shall be in the form of cash.
2. The proposal for dividends distribution at the Shareholders’ Meeting this year
Unit: NT$ thousands
Shareholder dividends (cash) 9,121,533
4.1.7 The impacts of issuing stock grants in this shareholder’s meeting on the Company’s operational performance and earnings per share: Not applicable.
4.1.8 Compensation of employees, Directors and Supervisors:
1. Quantity or scope of compensation for employees, Directors, and Supervisors as stipulated by the Articles of Incorporation: In the event the Company makes profits (i.e. profit before tax and before compensation distribution to the employees, Directors, and Supervisors) in any fiscal year, it shall set aside 1% to 30% of the profits as employee compensation and no higher than 5% of the profits as Directors and Supervisors compensation. If there are cumulative losses, the Company shall reserve a sufficient amount to offset such losses. Employees and Directors and Supervisors compensation shall be resolved by a majority vote at a Board of Director meeting attended by two thirds of the total number of Directors and shall be reported to the Shareholders' Meeting. The Board of Directors may resolve to distribute employee compensation in stocks or cash and the recipients may include employees of subsidiaries of the Company meeting certain requirements set by the Board of Directors.
2. The basis for estimating the amount of employees, Directors, and Supervisors compensation, for calculating the number of shares to be distributed as employees' compensation, and the accounting treatment of the discrepancy, if any, between the actual distributed amount and the estimated figure, for the current period: The Company's compensation for employees and Directors and Supervisors for 2018 are NT$4,383,828 thousand and NT$328,787 thousand, respectively. The amounts are calculated based on the profit before tax, net the compensation for employees, Directors and Supervisors, and multiplied by the percentage set for employee and Directors and Supervisors compensation in the Articles of Incorporation. They are listed as operating cost or operating expenses for 2018. The appropriated employees' compensation and remuneration for Directors and Supervisors determined in the resolution of the Board Meeting are consistent with the recognized amount in the Company's 2018 Consolidated Financial Report.
3. Compensation proposal approved by the Board of Directors (1) Information on the distribution of compensation for employees and Directors and

44
Supervisors passed by the Board of Directors on February 25, 2019:
Distribution status (Unit: NT$ thousands)
Employee compensation - cash
Director and Supervisor compensation - cash
The aforementioned estimate is the same as the expenses recognized for the year.
(2) The amount of employees' compensation to be paid in stocks out of the current parent
company only or individual financial report in terms of the sum of net profit after tax and employee compensation: Not applicable.
4. Actual distribution of compensation for employees, Directors, and Supervisors and where
there were discrepancies the recognized compensations for employees and Directors, the difference, cause, and treatment of the discrepancy shall be described:
(1) Distribution status
(Unit: NT$ thousands)
Employee compensation - cash Director and Supervisor compensation - cash
(2) No discrepancy between the actual distribution and the recognized amount
4.1.9 Company share repurchase status: None.
4.2 Issuance of corporate bonds: None.
4.3 Preferred shares: None.
4.4 Overseas depository receipt: None.
4.5 Issuance of employee stock options: None.
4.6 Restrictions on employee shares and mergers, acquisitions or issuance of new shares for the
acquisition of shares of other companies: None.
4.7 The following items are required for the implementation status of the capital utilization plan:
(1) Plan: As of one quarter before the publication date of this Annual Report, previous issuance or
private placement of marketable securities that have not been completed or completed but are
yet to record any benefit within the past three fiscal years: None.
(2) Implementation status: The implementation status of previous plans as of one quarter before
the publication date of this Annual Report: Not applicable.
$4,383,828
$328,787
$4,677,131$350,785

45
5. Operational Highlights
5.1 Business activities
5.1.1 Business scope
The Company's businesses include the research and development, design, production, sales and after-sales technical services for various optical lens modules and optoelectronic components. Products include the design, production, processing, and sales of lenses and optoelectronic components for multifunction printers, scanners, smartphones, 3D structured light, ToF, in-display optical fingerprint recognition, drones, tablets, IP cameras, smart TVs, wearable devices, iris recognition lenses, optical mouse lenses, medical instruments, and automobile lenses.
5.1.2 Main businesses
(1) CE01010 Photographic and optical equipment manufacturing. (2) CQ01010 Die manufacturing. (3) F601010 Intellectual property (4) F113030 Wholesale of precision instruments (5) F401010 International trade. (6) I501010 Product designing (7) CF01011 Medical materials and equipment manufacturing. (8) ZZ99999 All business items that are not prohibited or restricted by law, except those
that are subject to special approval.
5.1.3 Major product lines and their breakdown Unit: NT$ thousands
Year
Product
2016 2017 2018
Amount Percentage Amount Percentage Amount Percentage
Optical
components 48,351,791 100.00% 53,127,510 100.00% 49,952,158 100.00%
5.1.4 Current products
Main products Usage/functions
Optical lenses
Mainly used in scanners, multifunction printers, mobile phone lenses, drone
camera lenses, mobile 3D structured light lenses, tablets, motion-controlled
gaming systems, laptop computer lenses, smart TV lenses, IP camera lenses,
and automobile lenses.

46
5.1.5 New products planned and under development The Company shall invest approximately 5% to 10% of revenue in R&D expenditures for 2019. However, spending shall be adjusted based on global market conditions and the Company's actual operations. Future research and development will focus on improving the specifications of existing products, as well as actively developing the following mainstream products: (1) Automobile imaging lenses
(2) Lenses for medical use
(3) Security surveillance lenses
(4) Large aperture/wide angle lenses
(5) Full-focus lenses
(6) Iris recognition lenses
(7) Lenses for sports cameras
(8) Lenses for drones
(9) Low-pixel size lenses
(10) Lenses with lower Z height
(11) ToF lenses
(12) In-display optical fingerprint recognition lenses 5.1.6 Industry overview
Current status and development of the industry: In the past, the optical components industry had maintained stable growth due to the development of products such as cameras, telescopes, and microscopes. However, the development of digital cameras and mobile phones in recent years has now led to rapid growth of optical components and lenses. This mainly began with the global digital camera market which took off in 2000 and led a new wave of imaging revolution. Growth exceeded market expectations and caused a continuous shortage of supply for optical components such as lenses over many years. The introduction and popularity of camera phones further intensified the need for lenses, and the development of multiple lenses on handheld devices has escalated this demand. Besides this imaging market, the optical industry has also expanded to automobiles and drones and as such, the industry is expected to continue to expand in the next few years. Correlation with upstream, midstream, and downstream sections of the industry:
Industry Product Optical
materials (Upstream industries)
Optical glass industry Optical glass blocks and pressed blanks Optical plastic industry Plastic pellets such as PC, CR-39, and PMMA
Optical components (Midstream industries)
Optical components industry
Lenses, prisms, mirrors, filters, absorbing glass, and various lenses
Optical application
products (Downstream
industries)
Traditional optical equipment
Glasses, cameras, telescopes, microscopes, projectors, vehicle lights
Traditional imaging products
Photocopiers, fax machines, cameras
Consumer digital products Digital cameras, digital video cameras, projectors, camera phones, tablet computers, wearable devices, sports cameras, drone cameras
Consumer optical storage products
CD players, DVD players

47
Industry Product Computer peripheral digital products
Laser printers, image scanners, PC cameras, data projectors
Computer peripheral optical storage devices
DVD-ROM drives
Optical equipment industry Spectrometers, optical spectrometers, interferometers Measurement equipment industry
Range finders, theodolites, tachymeter
Medical, industrial, and commercial products
Medical lasers, laser processors, barcode scanners
Others Exposure equipment, ultraviolet curing equipment, lighting equipment, military night vision goggles
Peripheral industries
Coating materials industry, coating equipment industry, vacuum equipment industry, abrasive materials industry, grinding equipment industry, mold manufacturing industry, molding equipment industry, inspection equipment industry, photographic equipment industry, photographic processing industry
Source: PIDA
Trends in product development: Optical products require a wide range of optical components including glass lenses, plastic lenses, spheric lenses, and aspheric lenses for different levels of precision and product applications. Due to requirements for smaller photoelectric imaging products, optical lenses have become increasingly miniaturized and moved toward mass production, higher quality, and lower prices. Meanwhile, consumer demand for high-resolution, wide angle, large aperture, and more lens pieces per camera have risen. Competition: Consumer optical component manufacturers are mostly concentrated in Asia such as Japan, Korea, Mainland China, and Taiwan. Competitors differ in their product application and production technology. The Company believes that the only way to maintain long-term competitiveness is to continue to invest in research and development and expand production capacity.
5.1.7 Overview of technology and R&D 1. Research and development (R&D) expense in the most recent year as of the publication date
of the Annual Report Unit: NT$ thousands
2018 2019 Q1 R&D expense 3,258,445 759,427
Operating revenue 49,952,158 9,823,506 Percentage of expense to
revenue 6.52% 7.73%
2. Successfully developed technologies and products
Technology and products successfully developed by the Company in the most recent year and as of the printing of the Annual Report
Item Successfully developed technology and products
Phone Camera
Development of new 6P 13M AF mobile phone lens Development of new 5P 16M AF mobile phone lens Development of new 6P 16M AF mobile phone lens Development of new 6P 20M AF mobile phone lens Development of new 6P 12M AF mobile phone lens Development of new 5P 4M AF mobile phone lens Development of new 6P 5M AF mobile phone lens Development of new 6P 21M AF mobile phone lens Development of new 6P 23M AF mobile phone lens Development of new 4P 13M AF mobile phone lens Development of new 6P 8M AF mobile phone lens Development of new 6P 24M AF mobile phone lens

48
Item Successfully developed technology and products Development of new 5P 24M AF mobile phone lens Development of new 5P 20M AF mobile phone lens Development of new 5P 32M AF mobile phone lens Development of new 6P 48M AF mobile phone lens Development of new 7P 40M AF mobile phone lens
Automobile rear view imaging lenses
Development of new 3P3G VGA wide angle design Development of new 6G 1.3M AF wide angle design Development of new 6G VGA wide angle design Development of new 8G VGA narrow angle design Development of the new 1G4P wide angle design Development of the new 2G2P wide angle design
5.1.8 Long-term and short-term business development plans 1. Short-term plans (1) Production strategies
A. Use existing production equipment to improve manufacturing technologies and yield to maximize output.
B. Control and manage raw materials and finished products to prevent waste and loss. C. Fully implement ISO 9001 and 14000 and achieve quality goals. D. Use the Taiwan headquarters as a base to effectively use the advantages on both sides of
the strait to provide customers with flexibility in applications, reduce costs, and strengthen market mobility and competitiveness
(2) Sales strategies A. Existing customers: Provide more competitive products and services and continue to
cultivate key existing customers while developing and establishing long-term partnerships to increase market share in existing customers.
B. Potential new customers: Use existing optical technology as the basis to actively develop potential customers for optical applications. Introduce and collaborate with customers' new product development projects to expand the market value of optical products, diversify operations, and avoid risks of excessive concentration in certain products.
C. Product end-customers: Connect directly with end-customers to encourage system manufacturers to use the Company's products.
(3) Research and Development strategies A. Gain insight into future product development trends and jointly develop product
specifications and participate in customers' preliminary product R&D plans. Respond to customers product demands to gain opportunities in the market.
B. Actively invest in R&D of the latest optical/mechanical designs and expand development for all product applications.
(4) Business strategies A. Streamline the organization and strengthen project based organizational structure to
improve efficiency of decision-making and operating performance. B. Talents are the foundation of the Company's competitiveness. The Company actively
recruits outstanding talent, and conducts on-the-job training for employees internally to enhance the Company’s competitive advantage
C. Strengthen internal information systems to manage use and timeliness of information . (5) Finance strategies
A. Maintain a healthy financial structure to provide strong support for sales, production, and R&D.
B. Plan long-term and short-term capital utilization to maximize returns with minimal risk.
2. Long-term plans (1) Production strategies

49
A. Implement the international division of labor and a flexible production to enhance business performance.
B. Strengthen management by objectives and reduce inventory to improve the inventory turnover rate.
C. Continue to enhance production technology to reduce production cost and improve yield rate and competitiveness.
D. Continue to invest in automation and expand production capacity to alleviate rising labor costs and stabilize product quality.
E. Continue to expand production capacity to satisfy market and customer demands. F. Enter different markets and obtain TS16949 certification.
(2) Sales strategies A. Consolidate marketing advantages and grasp opportunities in the market. Expand niche
competitiveness and promote global marketing strategies and international market expansion.
B. Seek major international manufacturers and form upstream and downstream strategic alliances. Commit to using the Company's strengths to satisfy customer demands and form partnerships to prevent destructive competition.
C. Actively obtain long-term orders from international companies and stabilize revenue growth. Leverage opportunities to obtain key technology cooperation and new product development.
(3) R&D strategies A. Collaborate with major international companies in new technology to gain experience,
develop talents, and strengthen R&D capacity. B. Monitor market product development trends and develop various miniature
optoelectronic components and strengthen capabilities to improve product appearances and various mechanical designs.
C. Actively seek out applications for the development of new materials for optoelectronic components to expand end applications and reduce costs.
D. Apply for domestic and foreign patents in new technology to protect intellectual property rights and widen the technological lead.
E. Actively develop new products for different sectors. (4) Business strategies
A. Monitor international business development trends and establish cross-border management organizations and structures to ensure the Company is more competitive internationally.
B. Consolidate upstream and downstream information systems and connect closely with upstream suppliers and downstream customers so that all three parties benefit.
(5) Finance strategies A. Strengthen capital risk management. B. Execute sound financial planning and conform with the Company's business
objectives and development plans to strengthen business performance and improve overall competitiveness.
5.2 Overview of market, production and sales 5.2.1 Market analysis
1. Sales regions for major products Unit: NT$ thousands
Year Region
2017 2018 Amount Percentage Amount Percentage
Asia 52,952,931 99.67% 49,886,010 99.87%Americas 174,222 0.33% 61,936 0.12%Europe 357 - 4,212 0.01%Total 53,127,510 100.00% 49,952,158 100.00%
2. Market supply and demand and market growth in the future (1) With continuous innovation in information technology, essentially all image output/input
requires the use of various types of optical lenses or modules. These include digital cameras,

50
telescopes, microscopes, photocopiers, fax machines, laser printers, scanners, barcode scanners, computer cameras, video cameras, surveillance cameras, televisions, projectors and video phones. Disc drives (CD/DVD players and CD/DVD-ROM drives) and optical communication components also require optical lenses. The products with the largest volume in 2018 are high-end lenses for mobile phones while the products with the highest growth are automotive imaging lenses, while demand for micro projector lenses, and drones will continue to grow.
(2) Optical components are mainly used in products such as disc drives, digital cameras, and mobile phones. According to various market research, mobile phones is one product with the largest need for optical components. As demand for mobile phone cameras has increased, lens specifications have also continued to migrate while getting smaller at the same time. The key to success for manufacturers will depend on their ability to improve product precision and take advantage of opportunities in the market.
3. Competitive niches, favorable and unfavorable factors for long-term growth and countermeasures
Item Competitive Niches and
Favorable Factors Unfavorable
Factors Countermeasures
1. Main businesses and development outlook
Our current products encompass new optical products and the continuous migration of consumer optoelectronic products helps the Company's development and expansion into a broader market.
The Company faces competition from other related industries, and competitors in the optical industry are now producing low-end products with quality similar to that of the Company’s products.
The Company shall adopt pricing strategies based on the characteristic of different markets and products to reduce the price disparity for low-end products and provide customers with added value to improve competitiveness in the low-end market.
2. Position in the industry
The Company's fully-staffed and experienced R&D team and production quality have received wide acclaim from customers. The Company offers comprehensive product lines and provide customized lenses based on customers' demands.
Low-price competition from Mainland China and competitors have gradually reduced product cycles.
The Company shall develop the most advanced technologies, improve existing quality control, and maintain strong relationships with customers to maintain leadership. The Company shall also develop a wide portfolio of lenses to satisfy customer demands at various price points and accelerate the speed of development to gain market opportunities.
3. Supply situation of main raw materials
The Company maintains long-term relationships with raw materials suppliers which consist entirely of major domestic and foreign manufacturers, and as such have maintained stable relationships and regular supplies.
Market prices are controlled by major international manufacturers.
The Company invests in diverse materials for product development to meet changing demands in the market and reduce the supply risks of individual materials.
4. Status of sales The Company's main Shipment of mobile The Company shall focus

51
Item Competitive Niches and
Favorable Factors Unfavorable
Factors Countermeasures
of main products
products are lenses for mobile phones, followed by lenses for tablet computers. Customers consist entirely of major domestic and international companies and the Company has thus achieved stable growth in sales orders.
phone lenses account for a high proportion of shipments and it is difficult to diversify market and product risks.
on the design and development of new products and expand into new sectors and applications for other optical products to increase product range and reduce risks.
5. Labor status of main production
Highly automated production equipment.
Labor cost has increased along with citizens' income, economic structure, and wages and benefits for entry-level workers in recent years.
The Company hires foreign workers to replenish manpower. The Company shall increase the level of automation to reduce demand for labor, and transfer labor-intensive and low-value-added products and processes to overseas regions with low labor costs.
5.2.2 Major applications and production process of primary products 1. Major applications of primary products
(1) Optical lenses Main applications: Scanners, multifunction printers, mobile phones, drones, wearable devices, tablet computers, and smart TVs.
(2) Optical lens products Main applications: DVD readers and optical mouse.
2. Manufacturing process of main products (1) Optical lenses
(2) Optical lenses
A. Plastics
B. Glass products
Raw materials Mold injection Cutting Coating
Finished product Inspection
Blanks Cutting Polishing Centering
Coating Inspection Finished product
Raw materials Assembly Inspection
Functionality check Finished product

52
5.2.3 Supply status of main materials
Material Supplier Country Supplier status
Engineering plastic 110185 100140 110181
Taiwan Taiwan Taiwan
All suppliers are renowned world-class companies with high quality, large volume and stable supply.
5.2.4 A list of customers accounting for more than 10% of sales for any given year within the last two
years, their purchase amount and percentage, and explanation for changes (increase or decrease) in sales. 1. Information on customers accounting for 10% or more of the Company's total sales in either of the 2 most recent years:
Unit: NT$ thousands
2017 2018 2019 up to the end of the first quarter
Item Name
Amount Percentage
of net
sales for
the entire
year (%)
Relationship
with the
Company
Name
Amount Percentage
of net
sales for
the entire
year (%)
Relationship
with the
Company
Name
Amount Percentage
of net
sales up to
the
previous
quarter
(%)
Relationship
with the
Company
1 653021 14,647,437 28 - 653003 9,848,693 20 - 623020 2,290,630 23 -
2 653003 11,757,631 22 - 623119 9,108,365 18 - 623045 1,696,107 17 -
3 623028 7,789,814 15 - 623028 7,486,036 15 - 623044 1,170,287 12 -
4 - - - - 653021 6,928,370 14 - 653003 1,026,561 10 -
Others 18,932,628 35 - Others 16,580,694 33 - Others 3,639,921 38 -
Net
sales 53,127,510 100 -
Net
sales49,952,158 100 -
Net
sales9,823,506 100 -
Reasons for change: Mainly due to a decrease in the operating revenue in 2018.

53
2. Information on suppliers accounting for 10% or more of the Company's total purchases in either of the 2 most recent years:
Unit: NT$ thousands
2017 2018 2019 up to the end of the first quarter
Item Name Amount Percentage of
annual net purchase
(%)
Relationship with the Company
Name Amount Percentage of annual
net purchase
(%)
Relationship with the Company
Name
Amount Percentage of net
purchase up to the previous quarter
(%)
Relationship with the Company
1 100230 2,058,182 30 - 110185 1,555,231 24 - 100230 281,455 20 -
2 100236 1,301,451 19 - 100236 1,198,005 19 - 110185 253,818 18 -
3 110185 1,226,955 18 - 100230 965,379 15 - 100236 215,389 15 -
4 - - - - - - - - 110059 162,287 12 -
Reasons for change: Mainly due to a decrease in the operating revenue in 2018.
5.2.5 Table of production volume in the two most recent years Unit: 1,000 units; NT$ thousands
Year Production Quantity
and Value of Primary Products
2017 2018
Production Capacity
Production Volume
Production Value
Production Capacity
Production Volume
Production Value
Optical Components 18,421,479 17,593,243 20,908,399 22,726,640 21,411,376 23,351,560
Note: Substitutable production capacity may be included in the production capacity.
5.2.6 Table of sales volume in the two most recent years Unit: 1,000 units; NT$ thousands
Year Sales Volume and Value of
Main products
2017 2018 Domestic Sales Export Sales Domestic Sales Export Sales
Volume Value Volume Value Volume Value Volume Value
Optical Components
116,825 105,408 7,423,289 53,022,102 140,362 145,565 7,368,844 49,806,593
5.3 Number of employees during the two most recent years
Year 2017 2018 As of April 14, 2019
Number of employees
Production 5,258 5,357 5,343Management 1,084 1,188 1,171
R&D 772 871 919Total 7,114 7,416 7,433
Average age 29.79 30.04 30.06Average years of services 4.23 3.61 3.73
Educational background distribution %
PhD 0.11% 0.11% 0.11%Masters 4.57% 4.92% 5.02%
Bachelors 34.58% 36.01% 36.29%Senior high school 46.47% 49.62% 49.07%
Below senior high school 14.27% 9.34% 9.51%

54
5.4 Environmental protection expenditures Explanation of total losses (including indemnity paid) and fines paid by the Company for environmental pollution, as well as future countermeasures (including improvement measures) and possible expenditure (including losses, fines and an estimate of indemnity incurred by a failure to implement improvement measures, if a reasonable estimation cannot be made, the explanation): None.
5.5 Labor relations (1) The Company's employee benefits for studying, training, pension systems and its
implementation status as well as labor agreements and measures for preserving employee rights and interests 1. Benefits and implementation
1.1 The Company established the Employee Welfare Committee on April 1, 2000 in accordance with the "Employee Welfare Fund Act" to be responsible for allocating employee welfare funds and benefits.
1.2 The Company has subscribed to labor insurance and health insurance in accordance with relevant regulations and added group insurance to provide employees with various insurance payment privileges.
1.3 Where the Company generates profits at the end of the year, the Company shall pay taxes, make up for losses, and set aside dividends and surplus reserve. The Company shall distribute year-end bonuses to employees who have not committed acts of negligence in the entire year.
2. Allowances: Benefits and subsidies for meals, weddings, pregnancy, funerals, hospitalization, travel, birthday, Labor Day, family day, and group insurance.
3. Social childcare measures: 3.1. In addition to distributing maternity benefits, the Company has established
breastfeeding (breast milk collection) rooms in all plants and set up dedicated parking spaces for pregnant employees for prioritized use.
3.2. The Company has signed special contracts with nearby childcare centers to provide diverse options for employees.
3.3. From 2017 to March 2019, 280 employees had applied for unpaid parental leave.
4. Healthcare: In addition to arranging professional nursing staff and appointing doctors to provide consultation services onsite each week, the Company has also supported rehabilitation evaluations for injured employees. In addition, the Company has exceeded regulatory labor requirements and provided annual health checks free of charge to employees.
5. Emergency aid: 5.1. The Company has established emergency relief guidelines to allow employees to
apply for an emergency relief fund to maintain basic needs in the event of a major illness, long-term care required in the family, or damage to real estate that prevents the employee from attending work and family difficulties.
5.2. From 2017 to March 2019, the Company has provided financial aid amounting to NT$500,000 for up to four employees who could not attend work due to major injuries and experienced family difficulties.
6. Pension system and implementation status The Company's employees enjoy pension payment in accordance with labor insurance regulations. The Company has also established pension regulations in accordance with the Labor Standards Act and the Labor Pension Act. According to the Regulations for the Allocation and Management of the Workers' Retirement Reserve Funds, the Company

55
sets aside a certain ratio of the employees' salaries as retirement reserve each month in accordance with applicable laws and deposit the funds into the employees' dedicated personal pension account in the Bank of Taiwan or the Bureau of Labor Insurance. 6.1. An employee may apply for voluntary retirement in the event of any of the following
conditions: 6.1.1 The employee has provided services for more than 15 years and is 55 years old or
older. 6.1.2 The employee has provided services for 25 years or more. 6.1.3 The employee has provided more than 10 years of services and is 60 years old or
older.
6.2. The Company may subject an employee to compulsory retirement in the event of any of the following conditions:
6.2.1 The employee is 65 years old or older. 6.2.2 The employee is mentally incapable or physically disabled and cannot continue to
work.
6.3. Employee pension payment standards are as follows: 6.3.1 Employees who have provided services for less than 15 years are given two base
points for every full year of service. 6.3.2 Employees who have provided services for more than 15 years are given one base
points for every full year of service. The total number of base units shall be limited to 45. Less than half a year of service is considered half a year and less than a full year but more than half a year of service is considered a full year.
6.3.3 Where the employee subject to compulsory retirement is mentally incapable or physically disabled due to the performance of duties, the employee shall receive an additional 20% of pension in accordance with the two preceding subparagraphs.
6.3.4 The payment, collection, and calculation method for pension of employees who elect to adopt the "Labor Pension Act" system starting from July 1, 2005 are as follows: a. The Company appropriates 6% of the employee's salary to the dedicated
personal pension account at the Bureau of Labor Insurance in accordance with the personal salary appropriation classification table.
b. Pension collection and calculation methods shall be pursuant to the "Labor Pension Act".
6.4. The monthly average salary of an employee authorized for retirement shall be
adopted as the standards for calculating employee pension base unit.
6.5. Voluntary retirees shall be required to fill out a retirement application which shall be implemented after approval.
6.6. For employees subject to compulsory retirement, the units shall report to obtain
approval and notify the retiree to complete procedures.
6.7. Where a retiree meets requirements for voluntary retirement, the Company shall pay the total pension within 30 days of his/her retirement. Where the pension cannot be paid in full, the Company may report to the competent authority for approval and pay in installments.
6.8. Employees' right to request pension shall start in the month after retirement and it
shall be extinguished if not exercised within five years.
6.9. Number of employees who have applied for retirement in the most recent three years (2016 to 2018): 6.

56
7. Work environment and employees' personal safety The Company's production, management, information, and safety and health units conduct safety and health risk assessments before building a new plant or refurbishing certain areas of a plant. The Company achieves more with less if safety and health features are incorporated into the planning and design stage. The Company completes planning, design, and construction in accordance with various regulations, international regulations, and company standards for the audit unit to administer safety and health management. With regard to operation safety and safety and health management, in addition to high-risk operation control, contractor management and construction safety management, chemical safety management, and occupational disaster analysis statistics, the Company also plans the operating environment evaluation, disaster emergency response procedures, and regular fire safety drills. In the event of a disaster, these measures shall be implemented to minimize damage and impact on the Company's property, people, society, and the environment.
8. Safety and Health Committee
The Company has established the Safety and Health Committee which convenes meetings each quarter to discuss environmental protection, safety, and health. The Company has also elected labor representatives in accordance with laws and provided managers and employees with official channels for communicating environmental protection, safety, and health issues. In response to the increase in scale of new plants, unit supervisors organize monthly meetings to discuss environmental protection, safety, and health issues to fulfill environmental protection, safety, and health management.
9. Fire safety
The Company organizes two self-defense fire safety group drills and an annual fire safety inspection each year to control operation safety risks and implement emergency response. The Company has also arranged firefighting teams in the districts to conduct employee education and training to promote awareness of fire safety. Potential disaster scenarios that may occur during the Company's operations are simulated and the effectiveness of emergency response measures are observed so that employees learn the basic skills for emergency evacuation and preliminary firefighting. The Company has established an effective system to assign disaster prevention tasks to minimize the damage caused by disasters to the lives and property of employees.
10. Safety and health management
The Company assigns unit supervisors or designated personnel to conduct safety and health hazard identification and risk assessment for related activities, products, and services. The Company also considers scale, nature, and other factors and has assigned management representatives to recommend occupational safety and health management plans as the basis for setting and reviewing policy goals and subjects. The plan is delivered to all company personnel and administered, maintained, and periodically reviewed to ensure its appropriateness. The Company also uses verification mechanisms in the ISO 14001 and OSHAS 18001 management systems and implement plan-do-check-action (PDCA) cycle to continue to improve the Company's environmental protection, safety and health management performance.
11. Emergency response center
The Company's plants have set up self-defense fire safety organizations and the emergency response center conducts immediate broadcasts in the event of irregularities or accidents and notify response teams to take instant action. The emergency response center is equipped with the following facilities: 11.1. Emergency response information: Including the layout of the plant, layout of the
equipment, and response procedure diagrams. 11.2. Fire safety and life preservation monitoring: The system includes the fire safety
system, gas monitoring system, emergency smoke ventilation system, key area

57
surveillance and video recording system, gas and chemical supply emergency cut-off system, and broadcast systems.
11.3. Response equipment: The equipment includes various protective clothing, personal protective equipment, portable personal air breathing apparatus, portable detector, leakage treatment equipment, and warning equipment. In addition, as the emergency response center may be affected by disasters, the plants have established secondary emergency response centers at appropriate locations on the periphery. They are equipped with simpler response equipment with access to adequate information for continuing response operations where necessary.
11.4. Emergency aid equipment: The Company has set up AEDs, emergency shower equipment, eyewash equipment, and emergency backpacks and chemical disaster response packs at work sites in accordance with emergency aid practices.
The Company has set up infirmaries in all plants. The Company has assigned health professionals and specialist doctors to provide 24-hour emergency care and promote a wide range of healthcare services. In addition, the Company is committed to implementing hazard assessments, maternity protection plans as well as management plans that are committed to preventing cardiovascular diseases that may be caused by long working hours, night shifts, and rotating shifts with the aim to protect and promote employees' physical and mental health. Multiple physical and health promotion resources and related activities are organized to protect employees from workplace hazards and actively promote their health.
12. Occupational injury statistics and analysis The occupational injury statistics and analysis data are based on the indicators for critical disabling injuries announced by the Ministry of Labor and Global Reporting Initiative G4 (GRI G4). The Company selects the disabling injury frequency rate (FR, number of injuries per million manhours worked), disabling injury severity rate (SR, number of work days lost per million manhours worked), and absenteeism rate (AR) as the basis for main statistics (statistical count excludes traffic accidents outside production plants). The Company continues to establish a culture of safety to provide a safe and comfortable work environment. All individual occupational hazard cases are analyzed and the Company formulates and executes improvement solutions. Statistics on occupational hazard occurrence rates are compiled periodically and units with higher rates of occupational hazards and the categories of occupational hazards are analyzed. Incidents with higher severity, incidents across different units, or incidents that occur repeatedly are listed as key points for education and training.
Chemicals in the plants are managed based on their different characteristics. The Company has implemented management and control from storage to transportation, usage, and disposal such as classified storage, supply system security protection, process machinery and auxiliary equipment safety protection, hazard labeling and general knowledge rules, and personal protective equipment usage to effectively prevent exposure of personnel to chemicals. The Company sets priorities for disaster rescue in accordance with emergency response strategies. The primary goal is to ensure the safety of the Company's employees, nearby plants, and residents and to prevent contaminating the environment. The second goal is to reduce property loss. Restoration of the Company's operations is the third priority. The Company believes that immediate response measures implemented in the event of a natural disaster or accident will not only minimize harm to personnel and environmental pollution but also greatly reduce loss of equipment and difficulties in recovering production. The Company values emergency response measures and conducts overall planning, execution, appraisal, and evaluation for improvements from the purchase of equipment and establishment of response procedures to strengthening personnel training and actual drills.

58
13. Human-factor hazards assessment and management The Company provides employees training and education on engineering to establish correct safety awareness with regards to moving and designing machinery on the production lines. The Company has also implemented human-factor assessment and improvements for machinery maintenance and repairs that include cranes, lifting trolleys, and jigs for replacing components. To prevent repetitive tasks from causing sores and pains, health service staff plan annual health checks and issue questionnaires to all employees regarding their discomforts and how it may affect their work. High-risk groups are identified and management measures are carried out. They also report to occupational safety and environmental protection units to implement human-factor identification and formulate improvement solutions.
14. Maternity health protection and management
To prevent the exposure of female employees to workplaces that may cause health hazards to mothers, the health center has established maternity health protection and management procedures. In addition to providing qualitative and quantitative risk assessments for operations that may pose health risks to mothers, the Company considers the different conditions of individuals and assign contracted specialist doctors to conduct comprehensive assessments. The Company then implements tiered management and onsite improvement measures to ensure the health of pregnant employees. In addition to this, the Company has provided parking spaces for pregnant women and signed contracts with related stores for maternity needs. Questionnaires are distributed regularly and information provided regarding pregnancy and childrearing before pregnant employees take their maternity leave.
15. Implementing employee health examinations and management
The Company provides regular health examinations and special health examinations for employees that conduct special and hazardous operations. Health service staff and unit supervisors are responsible for providing lists of personnel that conduct such operations. The Company also follows recommendations of doctors that provide consultation services at the plants regarding health examinations. The frequency and items in the health checkexceed minimum regulatory requirements and all costs are borne by the Company. The Company also helps conduct assessments and prevention of cardiovascular diseases, and follow up with high-risk groups.
16. Corporate disease prevention plans for new contagious diseases
The Company believes employee health to be the foundation of sustaining normal corporate operations and it is the Company's responsibility to look after the physical and mental health of employees. Faced with potential threats of emerging diseases in the workplace, the Company's dedicated unit continues to monitor the occurrence of new contagious diseases across the world, evaluate their subsequent development, and formulate response plans for disease prevention in the workplace. For instance, the novel Influenza has become a crucial target for disease prevention in recent years. The Company protects employees' health and also encourage employees to apply their disease prevent knowledge to their families.
17. Continuous focus on seasonal influenza and other contagious diseases
The Company carefully responds to risks of outbreaks of seasonal influenza (H1N1, H3N2, A virus or B virus) each year and continue to manage occupational risks for various contagious diseases (e.g. tuberculosis and typhoid fever). Experience is accumulated from measures taken to avoid overreacting or insufficient preparation. Disease prevention information is announced on bulletin boards in every plant for employee reference and disease prevention.
(2) Losses arising as a result of labor disputes in the recent year up until the publication date of
this annual report and disclosure of potential current and future losses and countermeasures:

59
The Company has adopted a people-centric management, and harmonious relations between labor and management have been established. There were no labor disputes or losses in the most recent year and up to the publication date of the Annual Report.
5.6 Important contracts:
Nature of Contract
Principal Contract Start/End
Date Main Contents
Restrictive Terms
Construction contract
Kedge Construction
Co., Ltd. 2015.3
New Plant and Office Construction Project in Phase 1 Industrial Land (I) in the Taichung City Precision Machinery Innovation Technology Park
-
Chung Jui Engineering
Co., Ltd. 2015.5
Mechanical and Electrical Installation in the New Plant and Office Construction Project in the Taichung City Precision Machinery Innovation Technology Park
-
Yankey Engineering
Co., Ltd. 2016.6
Clean Room Construction and Equipment -

60
6. Financial Highlights
6.1 Condensed Balance Sheet and Condensed Consolidated Income Statement for the Last Five Years 6.1.1 International Financial Reporting Standards
Condensed Consolidated Balance Sheet Unit: NT$ thousands
Year Financial data for the last five years (Note 1) Financial data in the current year, as of March 31, 2019Item 2018 2017 2016 2015 2014
Current assets 101,306,345 88,136,397 74,342,664 61,500,008 44,809,301 105,526,305Equity-accounted investments
209,445 160,594 92,224 105,391 111,183 226,967
Property, plant, and equipment
27,850,051 24,861,461 20,246,851 20,114,909 13,721,745 27,882,968
Intangible assets 80,566 84,159 34,828 27,747 32,728 92,875Other assets 3,202,017 2,658,622 2,357,893 2,238,521 2,378,627 5,802,495Total assets 132,648,424 115,901,233 97,074,460 83,986,576 61,053,584 139,531,610
Current liabilities
Before distribution
24,930,979 23,409,706 20,141,260 20,527,062 14,783,207 26,453,962
After distribution
Note 2 33,134,870 28,659,163 29,044,965 21,624,357 Note 2
Non-current liabilities
117,874 94,296 90,685 73,215 72,208 197,813
Total liabilities
Before distribution
25,048,853 23,504,002 20,231,945 20,600,277 14,855,415 26,651,775
After distribution
Note 2 33,229,166 28,749,848 29,118,180 21,696,565 Note 2
Equity attributable to owners of the parent company
107,599,571 92,397,231 76,842,515 63,386,299 46,198,169 112,879,835
Capital stock 1,341,402 1,341,402 1,341,402 1,341,402 1,341,402 1,341,402Capital surplus 1,557,011 1,556,388 1,555,729 1,555,729 1,555,729 1,557,011
Retained earnings
Before distribution
106,503,622 91,870,266 74,432,221 60,226,867 42,918,856 111,557,596
After distribution
Note 2 82,145,102 65,914,318 51,708,964 36,077,706 Note 2
Other equity (1,802,464) (2,370,825) (486,837) 262,301 382,182 (1,576,174)Total equity
Before distribution
107,599,571 92,397,231 76,842,515 63,386,299 46,198,169 112,879,835
After distribution
Note 2 82,672,067 68,324,612 54,868,396 39,357,019 Note 2
Note 1: The financial data for the last five years have been audited and certified by CPAs. Note 2: The 2018 earnings distribution is subject to the approval of the Shareholders' Meeting.

61
Condensed Consolidated Statement of Comprehensive Income Unit: NT$ thousands
Year Financial data for the last five years (Note)
Financial data in the current year, as of March 31, 2019
Item 2018 2017 2016 2015 2014
Operating revenue 49,952,158 53,127,510 48,351,791 55,868,893 45,810,263 9,823,506
Gross profit 34,351,475 36,855,930 32,421,250 32,056,785 24,519,695 6,310,725
Operating profit (loss) 29,611,940 32,093,302 27,913,957 27,654,632 21,066,834 5,233,748
Non-operating income and expenses
1,583,931 (133,781) 337,242 1,505,330 1,896,257 885,288
Profit before tax 31,195,871 31,959,521
28,251,199 29,159,962 22,963,091 6,119,036
Net profit from continuing operations for the period
24,369,534 25,975,623 22,733,025 24,156,528 19,438,094
5,053,974
Net profit for the period 24,369,534 25,975,623 22,733,025 24,156,528 19,438,094
5,053,974
Other comprehensive income (loss )(net of tax) for the period
557,347 (1,901,763) (758,906) (127,248) 137,914 226,290
Total comprehensive income for the period
24,926,881 24,073,860
21,974,119 24,029,280 19,576,008 5,280,264
Earnings per share 181.67 193.65 169.47 180.08 144.91 37.68
Note: The financial data of the last five years have been audited and certified by CPAs.

62
Condensed Parent Company Only Balance Sheet Unit: NT$ thousands
Year Financial data for the last five years (Note 1)
Item 2018 2017 2016 2015 2014
Current assets 72,191,515 62,529,852 47,889,108 39,099,042 31,544,672
Equity-accounted investments
30,107,282 27,482,428 27,117,248 25,199,472 21,180,579
Property, plant and equipment
27,487,598 24,426,973 19,798,137 19,558,205 13,069,862
Intangible assets 80,345 83,718 34,215 26,526 30,972
Other assets 3,175,080 2,643,901 2,333,367 2,209,611 2,350,514
Total assets 133,041,820 117,166,872 97,172,075 86,092,856 68,176,599
Current liabilities
Before distribution
25,324,375 24,675,423 20,238,954 22,633,427 21,906,310
After distribution
Note 2 34,400,587 28,756,857 31,151,330 28,747,460
Non-current liabilities 117,874 94,218 90,606 73,130 72,120
Total liabilities
Before distribution
25,442,249 24,769,641 20,329,560 22,706,557 21,978,430
After distribution
Note 2 34,494,805 28,847,463 31,224,460 28,819,580
Equity attributable to owners of the parent company
107,599,571 92,397,231 76,842,515 63,386,299 46,198,169
Capital stock 1,341,402 1,341,402 1,341,402 1,341,402 1,341,402
Capital surplus 1,557,011 1,556,388 1,555,729 1,555,729 1,555,729
Retained earnings
Before distribution
106,503,622 91,870,266 74,432,221 60,226,867 42,918,856
After distribution
Note 2 82,145,102 65,914,318 51,708,964 36,077,706
Other equity (1,802,464) (2,370,825) (486,837) 262,301 382,182
Total equity
Before distribution
107,599,571 92,397,231 76,842,515 63,386,299 46,198,169
After distribution
Note 2 82,672,067 68,324,612 54,868,396 39,357,019
Note 1: The financial data of the last five years have been audited and certified by CPAs. Note 2: The 2018 earnings distribution is subject to the approval of the Shareholders' Meeting.

63
Condensed Parent Company Only Statement of Comprehensive Income Unit: NT$ thousands
Year Financial data for the last five years (Note)
Item 2018 2017 2016 2015 2014
Operating revenue 47,178,620 49,497,163 44,417,341 51,486,015 44,027,082
Gross profit 32,390,727 34,445,454 29,931,865 27,992,948 20,350,090
Operating profit 27,766,406 29,785,722 25,852,059 23,860,671 17,085,149
Non-operating income and expenses 3,147,331 1,871,196 2,095,816 4,991,241 5,524,554
Profit before tax 30,913,737 31,656,918 27,947,875 28,851,912 22,609,703
Net profit from continuing operations for the period
24,369,534 25,975,623 22,733,025 24,156,528 19,438,094
Net profit for the period 24,369,534 25,975,623 22,733,025 24,156,528 19,438,094
Other comprehensive income (loss) (net of tax)for the period
557,347 (1,901,763) (758,906) (127,248) 137,914
Total comprehensive incomefor the period
24,926,881 24,073,860 21,974,119 24,029,280 19,576,008
Earnings per share 181.67 193.65 169.47 180.08 144.91
Note: The financial data of the last five years have been audited and certified by CPAs. 6.1.2 Names of CPAs for the last five years and their audit opinions 2018 2017 2016 2015 2014
Certifying CPA
Tzu-Hsin Chang Chun-Man Chen
Tzu-Hsin ChangChun-Man Chen
Chun-Man ChenTzu-Hsin Chang
Tzu-Hsin Chang Chun-Man Chen
Tzu-Hsin Chang Shih-Hua Kuo
Audit Opinion Unmodified
opinion Unmodified
opinion Unmodified
opinion Unqualified
opinion Modified unqualified
opinion

64
6.2 Financial Analysis for the Last Five Years International Financial Reporting Standards
Consolidated Financial Analysis Year Financial analysis for the last five years Financial
analysis in the current year, as of March 31, 2019
Item 2018 2017 2016 2015 2014
Financial structure
(%)
Debt ratio 18.88 20.28 20.84 24.53 24.33 19.10
Long-term funds to property, plant and equipment ratio
386.78 372.03 379.98 315.48 337.20 405.54
Solvency
Current ratio (%) 406.35 376.50 369.11 299.60 303.11 398.91
Quick ratio (%) 388.33 364.72 355.52 280.68 278.49 380.84
Interest coverage ratio - - - - - -
Operating performance
Receivables turnover rate (times)
3.75 3.50 3.62 4.49 4.54 3.64
Average collection days 97 104 101 81 80 100
Inventory turnover rate (times) 4.82 6.31 5.04 6.55 6.83 3.35
Payables turnover rate (times) 7.84 8.02 6.70 6.06 5.67 8.14
Average inventory turnover days
76 58 72 56 53 109
Property, plant and equipment turnover rate (times)
1.90 2.36 2.40 3.30 3.90 1.41
Total asset turnover (times) 0.40 0.50 0.53 0.77 0.92 0.29
Profitability
Return on assets (%) 19.61 24.39 25.11 33.31 39.01 14.85
Return on equity (%) 24.37 30.70 32.42 44.09 50.72 18.34
Pre-tax income to paid-in capital ratio (%)
2325.62 2382.55 2106.09 2173.84 1711.87 1824.67
Net margin (%) 48.79 48.89 47.02 43.24 42.43 51.45
Earnings per share (NT$) 181.67 193.65 169.47 180.08 144.91 37.68
Cash flow (%)
Cash flow ratio 126.72 134.88 119.15 142.45 133.18 32.36
Cash flow adequacy ratio 206.52 214.64 204.29 202.16 171.43 216.40
Cash flow reinvestment ratio 17.60 21.71 17.49 30.78 29.27 6.57
Leverage Operating leverage 1.42 1.32 1.35 1.35 1.23 1.53
Financial leverage 1 1 1 1 1 1
The decrease in inventory turnover ratio was mainly due to an increase in average inventory. The increase in average inventory turnover days was mainly due to a decrease in inventory turnover rate. The decrease in the total asset turnover ratio was mainly due to an increase in average total assets. The decrease in the return on equity ratio was mainly due to an increase in average net equity.

65
Parent Company Only Financial Analysis Year Financial analysis for the last five years
Item 2018 2017 2016 2015 2014
Financial structure (%)
Debt ratio 19.12 21.14 20.92 26.37 32.24
Long-term funds to property, plant and equipment ratio
391.88 378.64 388.59 324.46 354.02
Solvency
Current ratio (%) 285.07 253.41 236.62 172.75 144.00
Quick ratio (%) 269.22 245.13 227.58 159.77 133.30
Interest coverage ratio - - - - -
Operating performance
Receivables turnover rate (times) 4.32 4.08 3.94 4.81 4.54
Average collection days 84 89 93 76 80
Inventory turnover rate (times) 5.44 8.16 6.53 8.85 13.46
Payables turnover rate (times) 4.76 4.82 3.87 2.56 2.37
Average inventory turnover days 67 45 56 41 27
Property, plant and equipment turnover rate (times)
1.82 2.24 2.26 3.16 3.96
Total asset turnover (times) 0.38 0.46 0.48 0.67 0.79
Profitability
Return on assets (%) 19.48 24.24 24.81 31.32 34.90
Return on equity (%) 24.37 30.70 32.42 44.09 50.72
Pre-tax income to paid-in capital ratio (%) 2304.58 2359.99 2083.48 2150.88 1685.53
Net margin (%) 51.65 52.48 51.18 46.92 44.15
Earnings per share (NT$) 181.67 193.65 169.47 180.08 144.91
Cash flow (%)
Cash flow ratio 102.80 127.72 98.06 87.70 88.78
Cash flow adequacy ratio 174.64 181 171.23 170.35 169.96
Cash flow reinvestment ratio 13.27 21.92 12.99 18.09 29.47
Leverage Operating leverage 1.43 1.37 1.35 1.43 1.46
Financial leverage 1 1 1 1 1
The decrease in inventory turnover ratio was mainly due to an increase in average inventory. The increase in average inventory turnover days was mainly due to a decrease in inventory turnover rate. The decrease in the return on equity was mainly due to an increase in average net equity. The decrease in cash flow ratio was mainly caused by a decrease in net cash flows used in operating activities. The decrease in cash flow reinvestment ratio was mainly due to a decrease in net cash flows used in operating activities.

66
The formula is as follows: 1. Financial structure
(1) Deb ratio = Total liabilities / total assets. (2) Ratio of long-term capital to property, plant, and equipment = (Total equities + non-current liabilities) / (Total net value of property, plant, and equipment).
2. Debt-paying ability (1) Current ratio = current assets / current liabilities (2) Quick ratio = (current asset - inventories - prepaid expenses) / current liabilities. (3) Interest coverage ratio = net profit before tax and interest / interest expenses.
3. Operation performance (1) Receivables turnover rate (including bills receivable resulting from accounts receivable and business operations) = Net sales / average accounts receivable in various periods (including bills receivable resulting from accounts receivable and business operations). (2) Average collection days = 365 / receivables turnover ratio. (3) Inventory turnover rate = cost of sales / average inventory. (4) Payables turnover rate (including bills payable resulting from accounts payable and business operations) = Cost of sales / Average accounts payable in various periods (including bills payable resulting from accounts payable and business operations). (5) Average inventory turnover days = 365 / inventory turnover rate. (6) Property, plant, and equipment turnover rate = net sales / average net property, plant, and equipment.
(7) Total asset turnover rate = net sales / average total assets. Profitability (1) Return on assets (ROA) = [ gain (loss) after tax + interest expenses x (1 - interest rates)] / average total asset value. (2) Return on equity = net income after tax / average equity. (3) Net margin = net income / net sales. (4) Earnings per share = (profit or loss attributable to owners of the parent company – dividends on preferred stock) / weighted average number of shares issued.
4. Cash flow (1) Cash flow ratio = net operating cash flow / current liabilities. (2) Cash flow adequacy ratio = net cash flow from operating activities for the most recent five years / (capital expenditures + inventory increase + cash dividend) for the most recent five years. (3) Cash flow reinvestment ratio = (net cash flow from operating activities – cash dividend) / (gross fixed assets value + long-term investment + other assets + working capital).
5. Degree of leverage: (1) Operating leverage (DOL) = (net operating revenue - variable operating costs and expenses) / operation income. (2) Financial leverage = operating income / (operating income - interest expenses).

67
6.3 2018 Supervisors' Review Report for the Financial Report
Largan Precision Co., Ltd.
Supervisors' Review Report We hereby approve
The Company's 2018 Financial Statements (Parent Company Only Financial
Statements and Consolidated Financial Statements) prepared and delivered by the Board of
Directors have been audited by KPMG Taiwan who found them to be reasonably expressed
to present the financial status, business performance, and cash flow of the Company. The
Supervisors have reviewed and verified the Financial Statements along with the Business
Report and earnings distribution proposal and found them to be compliant with applicable
regulations. We hereby produce this report in accordance with Article 219 of the Company
Act for your review.
The above is respectfully submitted to
Largan Precision 2019 Annual General Shareholders' Meeting
Largan Precision, Co., Ltd.
Supervisor: Chung-Jen Liang
Hsiao-Pei Su
Hui-Fen Chen
Date: April 22nd, 2019

68
6.4 Consolidated Financial Statements of the Most Recent Year with Independent Auditors’ Report and Notes
Representation Letter
The entities that are required to be included in the combined financial statements of Largan Precision Co., Ltd. as of and for the year ended December 31, 2018 under the Criteria Governing the Preparation of Affiliation Re-ports, Consolidated Business Reports, and Consolidated Financial Statements of Affiliated Enterprises are the same as those included in the consolidated financial statements prepared in conformity with International Finan-cial Reporting Standards No. 10 by the Financial Supervisory Commission, "Consolidated Financial State-ments." In addition, the information required to be disclosed in the combined financial statements is included in the consolidated financial statements. Consequently, Largan Precision Co., Ltd. and subsidiaries do not prepare a separate set of combined financial statements. Company name: Largan Precision Co., Ltd. Chairman: En-Chou Lin Date: February 25, 2019

69
Independent Auditors’ Report
To the Board of Directors of Largan Precision Co., Ltd.:
Opinion
We have audited the consolidated financial statements of Largan Precision Co., Ltd. (the ”Company”) and its subsidiaries (the” Group”), which comprise the consolidated balance sheets as of December 31, 2018 and 2017, the consolidated statement of comprehensive income, changes in equity and cash flows for the years ended December 31, 2018 and 2017, and notes to the consolidated financial statements, including a summary of signif-icant accounting policies.
In our opinion, the accompanying consolidated financial statements present fairly, in all material respects, the consolidated financial position of the Group as at December 31, 2018 and 2017, and its consolidated financial performance and its consolidated cash flows for the years then ended in accordance with the Regulations Gov-erning the Preparation of Financial Reports by Securities Issuers and with the International Financial Reporting Standards (“IFRSs”), International Accounting Standards (“IASs”), Interpretations developed by the Inter-national Financial Reporting Interpretations Committee (“IFRIC”) or the former Standing Interpretations Committee (“SIC”) endorsed and issued into effect by the Financial Supervisory Commission of the Republic of China.
Basis for Opinion
We conducted our audit in accordance with the Regulations Governing Auditing and Certification of Financial Statements by Certified Public Accountants and the auditing standards generally accepted in the Republic of China. Our responsibilities under those standards are further described in the Auditors’ Responsibilities for the Audit of the Consolidated Financial Statements section of our report. We are independent of the Group in ac-cordance with the Certified Public Accountants Code of Professional Ethics in Republic of China (“the Code”), and we have fulfilled our other ethical responsibilities in accordance with the Code. We believe that the audit evidence we have obtained is sufficient and appropriate to provide a basis of our opinion.
Key Audit Matters
Key audit matters are those matters that, in our professional judgment, were of most significance in our audit of the consolidated financial statements of the current period. These matters were addressed in the context of our audit of the consolidated financial statements as a whole, and in forming our opinion thereon, and we do not provide a separate opinion on these matters. We have determined the matters described below to be the key audit matters to be communicated in our report.
1. Inventory valuation
Please refer to Note 4(h), Note 5(a), and Note 6(g) for accounting policies, uncertainty of accounting esti-mates and assumptions, and related disclosures for inventory valuation.

70
Description of key audit matter:
Inventories are stated at the lower of cost or net realizable value. With the rapid development of technology, and significant changes in market demand, the severe volatility to sales may lead to risks, wherein the costs of inventories may exceed its net realizable values. Therefore, the valuation of inventories has been identified as one of the key audit matters.
How the matter was addressed in our audit:
In relation to the key audit matter above, our principal audit procedures include obtaining an inventory aging report, analyzing the movement of inventory aging and evaluating the reasonableness of the Group’s ac-counting policies, such as allowance for inventory valuation and obsolescence; performing a retrospective test of the Group’s historical accuracy of judgments with reference to inventory valuation and comparing with the current period to evaluate the appropriateness of the estimation and assumptions used; examining whether the valuation of inventories are in compliance with the accounting policies of the Group; under-standing the basis of the selling price the management used to ensure the reasonableness of net realizable value of inventories; reviewing sales in the subsequent period, as well as assessing the basis of the net realiz-able value the Group used to determine the sufficiency of allowance of inventories and whether the related disclosures are appropriate.
2. Accounts Receivable Valuation
Please refer to Note 4(g), note 5(b), and Note 6(e) for accounting policies, uncertainty of accounting esti-mates and assumptions, and related disclosures for accounts receivables valuation, respectively.
Description of key audit matter:
The Group’s accounts receivable are concentrated within certain customers, and the determination of al-lowance for accounts receivable relies on the management’s subjective judgment. Therefore, the valuation of accounts receivables is one of the key audit matters.
How the matter was addressed in our audit:
In relation to the key audit matter above, our principal audit procedures include estimating the loss allowance of trade receivables that is based on the risk of a default occurring and the rate of expected credit loss; re-viewing the historical collection records, understanding the industry economic environment and the credit risk of receivables among limited customers to evaluate whether the method of estimation, assumptions, and related disclosures are appropriate.
Other Matter
The Company has additionally prepared its parent company only financial statements as of and for the years ended December 31, 2018 and 2017, on which we have issued an unqualified opinion.
Responsibilities of Management and Those Charged with Governance for the Consolidated Financial Statements
Management is responsible for the preparation and fair presentation of the consolidated financial statements in accordance with the Regulations Governing the Preparation of Financial Reports by Securities Issuers and with the IFRSs, IASs, IFRC, SIC endorsed and issued into effect by the Financial Supervisory Commission of the Republic of China, and for such internal control as management determines is necessary to enable the prepara-tion of consolidated financial statements that are free from material misstatement, whether due to fraud or error. In preparing the consolidated financial statements, management is responsible for assessing the Group’s ability to continue as a going concern, disclosing, as applicable, matters related to going concern and using the going concern basis of accounting unless management either intends to liquidate the Group or to cease operations, or has no realistic alternative but to do so.

71
Those charged with governance (including the supervisors) are responsible for overseeing the Group’s finan-cial reporting process.
Auditor’s Responsibilities for the Audit of the Consolidated Financial Statements
Our objectives are to obtain reasonable assurance about whether the consolidated financial statements as a whole are free from material misstatement, whether due to fraud or error, and to issue an auditor’s report that includes our opinion. Reasonable assurance is a high level of assurance, but is not a guarantee that an audit conducted in accordance with the auditing standards generally accepted in the Republic of China will always detect a material misstatement when it exists. Misstatements can arise from fraud or error and are considered material if, individ-ually or in the aggregate, they could reasonably be expected to influence the economic decisions of users taken on the basis of these consolidated financial statements.
As part of an audit in accordance with auditing standards generally accepted in the Republic of China, we exer-cise professional judgment and maintain professional skepticism throughout the audit. We also:
1. Identify and assess the risks of material misstatement of the consolidated financial statements, whether due to fraud or error, design and perform audit procedures responsive to those risks, and obtain audit evidence that is sufficient and appropriate to provide a basis for our opinion. The risk of not detecting a material misstatement resulting from fraud is higher than for one resulting from error, as fraud may involve collusion, forgery, in-tentional omissions, misrepresentations, or the override of internal control.
2. Obtain an understanding of internal control relevant to the audit in order to design audit procedures that are appropriate in the circumstances, but not for the purpose of expressing an opinion on the effectiveness of the Group’s internal control.
3. Evaluate the appropriateness of accounting policies used and the reasonableness of accounting estimates and related disclosures made by management.
4. Conclude on the appropriateness of management’s use of the going concern basis of accounting and, based on the audit evidence obtained, whether a material uncertainty exists related to events or conditions that may cast significant doubt on the Group’s ability to continue as a going concern. If we conclude that a material uncertainty exists, we are required to draw attention in our auditors’ report to the related disclosures in the consolidated financial statements or, if such disclosures are inadequate, to modify our opinion. Our conclu-sions are based on the audit evidence obtained up to the date of our auditors’ report. However, future events or conditions may cause the Group to cease to continue as a going concern.
5. Evaluate the overall presentation, structure and content of the consolidated financial statements, including the disclosures, and whether the consolidated financial statements represent the underlying transactions and events in a manner that achieves fair presentation.
6. Obtain sufficient appropriate audit evidence regarding the financial information of the entities or business activities within the Group to express an opinion on the consolidated financial statements. We are responsible for the direction, supervision and performance of the group audit. We remain solely responsible for our audit opinion.
We communicate with those charged with governance regarding, among other matters, the planned scope and timing of the audit and significant audit findings, including any significant deficiencies in internal control that we identify during our audit.
We also provide those charged with governance with a statement that we have complied with relevant ethical requirements regarding independence, and to communicate with them all relationships and other matters that may reasonably be thought to bear on our independence, and where applicable, related safeguards.

Notes to Readers
The accompanying consolidated financial statements are intended only to present the consolidated statement of financial position, finan-cial performance and its cash flows in accordance with the accounting principles and practices generally accepted in the Republic of Chi-na and not those of any other jurisdictions. The standards, procedures and practices to audit such consolidated financial statements are those generally accepted and applied in the Republic of China.
The independent auditors’ report and the accompanying consolidated financial statements are the English translation of the Chinese version prepared and used in the Republic of China. If there is any conflict between, or any difference in the interpretation of the English and Chinese language independent auditors’ report and consolidated financial statements, the Chinese version shall prevail.
72
From the matters communicated with those charged with governance, we determine those matters that were of most significance in the audit of the consolidated financial statements of the current period and are therefore the key audit matters. We describe these matters in our auditors’ report unless law or regulation precludes public disclosure about the matter or when, in extremely rare circumstances, we determine that a matter should not be communicated in our report because the adverse consequences of doing so would reasonably be expected to outweigh the public interest benefits of such communication.
The engagement partners on the audit resulting in this independent auditors’ report are Tza-Hsin, Chang and Chiun-Mang, Chen.
KPMG
Taipei, Taiwan (Republic of China) February 25, 2019

(English Translation of Consolidated Financial Statements and Report Originally Issued in Chinese) LARGAN PRECISION CO., LTD. AND SUBSIDIARIES
Consolidated Balance Sheets
December 31, 2018 and 2017
(Expressed in Thousands of New Taiwan Dollars)
See accompanying notes to consolidated financial statements. 73
December 31, 2018 December 31, 2017
Assets Amount % Amount % Current assets:
1100 Cash and cash equivalents(Note6(a) and (w)) $ 83,403,426 62 67,896,008 59
1110 Current financial assets at fair value through profit or loss(Note6(b) and (w)) 1,291,809 1 - -
1120 Current financial assets at fair value through other comprehensive income (Note6(c) and (w)) 139,944 - - -
1125 Current available-for-sale financial assets(Note6(d) and (w)) - - 2,010,555 2
1150 Notes receivable, net(Note6(e) and (w)) 827,521 1 734,036 1
1170 Accounts receivable, net(Note6(e) and (w)) 10,646,493 8 14,405,770 12
1180 Accounts receivable from related parties, net(Note6(e)、(w) and7) 12,596 - 28,552 -
1200 Other receivables(Note6(f) and (w)) 468,095 1 265,690 -
1210 Other receivables from related parties(Note6(f)、(w) and7) 15,638 - 39,968 -
1220 Current tax assets 9,661 - - -
1310 Inventories(Note6(g)) 3,893,350 2 2,576,832 2
1470 Other current assets(Note6(k) and8) 597,812 1 178,986 -
101,306,345 76 88,136,397 76
Non-current assets:
1550 Investments accounted for using equity method(Note6(h)) 209,445 - 160,594 -
1600 Property, plant and equipment(Note6(i)) 27,850,051 21 24,861,461 22
1780 Intangible assets(Note6(j)) 80,566 - 84,159 -
1840 Deferred tax assets(Note6(n)) 402,872 1 367,511 -
1900 Other non-current assets(Note6(k) and8) 2,799,145 2 2,291,111 2
31,342,079 24 27,764,836 24
Total assets $ 132,648,424 100 115,901,233 100
December 31, 2018 December 31, 2017 Liabilities and Equity Amount % Amount % Current liabilities:
2100 Short-term borrowings(Note6(l) and (w)) $ 552,868 1 395,774 -
2150 Notes payable(Note6(w)) 846 - 2,346 -
2170 Accounts payable(Note6(w)) 1,794,692 1 2,149,716 2
2180 Accounts payable to related parties(Note6(w) and7) 10,469 - 21,890 -
2200 Other payables(Note6(o) and (w)) 18,266,827 14 16,908,441 15
2220 Other payables to related parties(Note6(w) and7) 540 - 465 -
2230 Current tax liabilities 4,241,295 3 3,881,421 3
2300 Other current liabilities 63,442 - 49,653 -
24,930,979 19 23,409,706 20
Non-Current liabilities:
2570 Deferred tax liabilities(Note6(n)) 15,560 - 598 -
2600 Other non-current liabilities(Note6(w)) 4,473 - 3,257 -
2640 Net defined benefit liabilities(Note6(m)) 97,841 - 90,441 -
117,874 - 94,296 -
Total liabilities 25,048,853 19 23,504,002 20
Equity attributable to owners of parent:(Note6(p))
3110 Share capital 1,341,402 1 1,341,402 1
3200 Capital surplus 1,557,011 1 1,556,388 2
3300 Retained earnings 106,503,622 80 91,870,266 79
3400 Other equity interest (1,802,464) (1) (2,370,825) (2)
Total equity attributable to owners of parent 107,599,571 81 92,397,231 80
Total liabilities and equity $ 132,648,424 100 115,901,233 100

See accompanying notes to consolidated financial statements. 74
(English Translation of Consolidated Financial Statements and Report Originally Issued in Chinese) LARGAN PRECISION CO., LTD. AND SUBSIDIARIES
Consolidated Statements of Comprehensive Income
For the years ended December 31, 2018 and 2017
(Expressed in Thousands of New Taiwan Dollars , Except for Earnings Per Common Share)
2018 2017
Amount % Amount %
4000 Operating revenues(Note6(r)、(s) and 7) $ 49,952,158 100 53,127,510 100 5000 Operating costs(Note6(g) and (m)) 15,594,576 31 16,279,606 31 34,357,582 69 36,847,904 69 5910 Realized (unrealized) profit from sales (6,107) - 8,026 - 5900 Gross profit from operations 34,351,475 69 36,855,930 69 6000 Operating expenses(Note6(m) and 7): 6100 Selling expenses 353,440 1 364,139 1 6200 Administrative expenses 1,127,650 2 1,120,777 2 6300 Research and development expenses 3,258,445 7 3,277,712 6 Total operating expenses 4,739,535 10 4,762,628 9 6900 Operating income 29,611,940 59 32,093,302 60 7000 Non-operating income and expenses: 7010 Other income(Note6(u) and 7) 1,192,752 2 663,469 1 7020 Other gains and losses(Note6(u) and 7) 343,583 1 (756,800) (1) 7060 Share of profit (losses) of associates accounted for using equity meth-
od(Note6(h)) 47,596 - (40,450) -
1,583,931 3 (133,781) - 7900 Profit before income tax 31,195,871 62 31,959,521 60 7950 Less: Income tax expense(Note6(n)) 6,826,337 13 5,983,898 11 Profit for the period 24,369,534 49 25,975,623 49 8300 Other comprehensive income: 8310 Components of other comprehensive income that will not be reclassified
to profit or loss: 8311 Remeasurements of defined benefit obligation(Note6(m)) (12,995) - (17,775) - 8316 Unrealized loss on investments in equity instruments measured at fair value
through other comprehensive income (51,935) - - -
8349 Income tax related to components of other comprehensive income that will not be reclassified to profit or loss - - - -
(64,930) - (17,775) - 8360 Components of other comprehensive income that will be reclassified to
profit or loss: 8361 Exchange differences on translation of foreign financial statement 622,277 1 (1,885,780) (4) 8362 Unrealized gains on valuation of available-for-sale financial as-
sets(Note6(v)) - - 1,792 -
8399 Income tax related to components of other comprehensive income that will be reclassified to profit or loss - - - -
622,277 1 (1,883,988) (4) Other comprehensive income (loss) for the period, net of tax 557,347 1 (1,901,763) (4) 8500 Total comprehensive income for the period $ 24,926,881 50 24,073,860 45
Earnings per share(NT dollars)(Note6(q))
9750 Basic earnings per share $ 181.67 193.65 9850 Diluted earnings per share $ 180.05 191.77

See accompanying notes to consolidated financial statements. 75
(English Translation of Consolidated Financial Statements and Report Originally Issued in Chinese)
LARGAN PRECISION CO., LTD. AND SUBSIDIARIES Consolidated Statements of Changes in Equity
For the years ended December 31, 2018 and 2017 (Expressed in Thousands of New Taiwan Dollars)
Equity attributable to owners of parent
Other equity interest Retained earnings Unrealized
gains
Share Capital
Capital surplus
Legal reserve
Special reserve
Unappropriated retained earn-
ings
Total
Exchange dif-
ferences on translation of foreign finan-cial statements
(losses) on financial assets
measured at fair value
through other comprehensive
income
Unrealized
gains (losses) on availa-
ble-for-sale financial assets
Total
Total equity attributable to
owners of parent
Balance at January 1, 2017 $ 1,341,402 1,555,729 8,711,955 - 65,720,266 74,432,221 (484,100) - (2,737) (486,837) 76,842,515
Appropriation and distribution of retained earnings:
Legal reserve - - 2,273,302 - (2,273,302) - - - - - -
Special reserve - - - 486,837 (486,837) - - - - - -
Cash dividends of common stock - - - - (8,517,903) (8,517,903) - - - - (8,517,903)
- - 2,273,302 486,837 (11,278,042) (8,517,903) - - - - (8,517,903)
Other changes in capital surplus - 659 - - - - - - - - 659
Profit for the period - - - - 25,975,623 25,975,623 - - - - 25,975,623
Other comprehensive income for the period - - - - (17,775) (17,775) (1,885,780) - 1,792 (1,883,988) (1,901,763)
Total comprehensive income for the period - - - - 25,957,848 25,957,848 (1,885,780) - 1,792 (1,883,988) 24,073,860
Changes in equity of associates accounted for using equity method - - - - (1,900) (1,900) - - - - (1,900)
Balance at December 31, 2017 $ 1,341,402 1,556,388 10,985,257 486,837 80,398,172 91,870,266 (2,369,880) - (945) (2,370,825) 92,397,231 Balance at January 1, 2018 $ 1,341,402 1,556,388 10,985,257 486,837 80,398,172 91,870,266 (2,369,880) - (945) (2,370,825) 92,397,231
Effect of retrospective application - - - - 1,967 1,967 - (2,912) 945 (1,967) -
Balance of January 1, 2018 after adjustments 1,341,402 1,556,388 10,985,257 486,837 80,400,139 91,872,233 (2,369,880) (2,912) - (2,372,792) 92,397,231
Appropriation and distribution of retained earnings:
Legal reserve - - 2,597,562 - (2,597,562) - - - - - -
Special reserve - - - 1,883,988 (1,883,988) - - - - - -
Cash dividends of common stock - - - - (9,725,164) (9,725,164) - - - - (9,725,164)
- - 2,597,562 1,883,988 (14,206,714) (9,725,164) - - - - (9,725,164)
Other changes in capital surplus - 623 - - - - - - - - 623
Profit for the period - - - - 24,369,534 24,369,534 - - - - 24,369,534
Other comprehensive income for the period - - - - (12,995) (12,995) 622,277 (51,935) - 570,342 557,347
Total comprehensive income for the period - - - - 24,356,539 24,356,539 622,277 (51,935) - 570,342 24,926,881
Disposal of investments in equity instruments designated at fair value through other comprehensive income - - - - 14 14 - (14) - (14) -
Balance at December 31, 2018 $ 1,341,402 1,557,011 13,582,819 2,370,825 90,549,978 106,503,622 (1,747,603) (54,861) - (1,802,464) 107,599,571

See accompanying notes to consolidated financial statements. 76
(English Translation of Consolidated Financial Statements and Report Originally Issued in Chinese) LARGAN PRECISION CO., LTD. AND SUBSIDIARIES
Consolidated Statements of Cash Flows
For the years ended December 31, 2018 and 2017
(Expressed in Thousands of New Taiwan Dollars)
2018 2017
Cash flows from operating activities: Profit before income tax $ 31,195,871 31,959,521 Adjustments:
Adjustments to reconcile profit (loss): Depreciation expense 2,833,776 2,269,919 Amortization expense 61,692 30,649 Interest income (1,182,871) (656,050) Share of (profit) loss of associates accounted for using equity method (47,596) 40,450 Losses (Gains) on disposal of property, plant and equipment 22,971 (3,647) Property, plant and equipment transferred to expenses 1,072 - Gain on disposal of investment - (17,541) Unrealized (realized) profit from sales 6,107 (8,026) Unrealized foreign exchange loss 38,279 -
Total adjustments to reconcile profit 1,733,430 1,655,754 Changes in operating assets and liabilities:
Changes in operating assets: Decrease in financial assets mandatorily measured at fair value through profit or loss 680,158 - Increase in notes receivable (93,485) (3,807) Decrease in accounts receivable(including from related parties) 3,775,233 2,658 (Increase) decrease in inventories (1,316,518) 16,759 Increase in other current assets (510,642) (103,795) Decrease in other operating assets 494 489
Total changes in operating assets 2,535,240 (87,696) Changes in operating liabilities:
(Decrease) increase in notes payable (1,500) 2,247 (Decrease) increase in accounts payable(including to related parties) (366,445) 288,330 Increase in other current liabilities 1,911,157 2,887,910 Decrease in net defined benefit liabilities (5,595) (2,024)
Total changes in operating liabilities 1,537,617 3,176,463 Total changes in operating assets and liabilities 4,072,857 3,088,767
Cash inflow generated from operations 37,002,158 36,704,042 Interest received 1,096,612 634,710 Income taxes paid (6,507,317) (5,763,025)
Net cash flows from operating activities 31,591,453 31,575,727 Cash flows from investing activities:
Acquisition of available-for-sale financial assets - (14,420,000) Proceeds from disposal of available-for-sale financial assets - 15,919,653 Acquisition of financial assets at fair value through other comprehensive income (154,386) - Proceeds from disposal of financial assets at fair value through other comprehensive income 1,233 - Acquisition of investments accounted for using equity method (8,800) (110,898) Acquisition of property, plant and equipment (6,412,320) (7,442,496) Proceeds from disposal of property, plant and equipment 640 4,154 (Increase) decrease in refundable deposits (395,839) 2,526 Increase in other non-current assets (112,983) (249,995) Acquisition of intangible assets (47,712) (79,555)
Net cash flows used in investing activities (7,130,167) (6,376,611) Cash flows from financing activities:
Increase in short-term borrowings 137,000 358,167 Increase (decrease) in guarantee deposits received 1,216 (1,350) Cash dividend paid (9,725,164) (8,517,903) Overdue dividend transferred to capital surplus 623 659
Net cash flows used in financing activities (9,586,325) (8,160,427) Effect of exchange rate changes on cash and cash equivalents 632,457 (1,883,088) Net increase in cash and cash equivalents 15,507,418 15,155,601 Cash and cash equivalents at beginning of period 67,896,008 52,740,407 Cash and cash equivalents at end of period $ 83,403,426 67,896,008

77 (Continued)
(English Translation of Consolidated Financial Statements and Report Originally Issued in Chinese) LARGAN PRECISION CO., LTD. AND SUBSIDIARIES
Notes to the Consolidated Financial Statements
For the years ended December 31, 2018 and 2017
(Expressed in Thousands of New Taiwan Dollars, Unless Otherwise Specified)
(1) Company history
Largan Precision Co., Ltd. (the “Company”) was incorporated in April 1987 as a company limited by shares under the Company Act of the Republic of china (R .O. C). The registered address is No.11, Jingke Rd., Nantun Dist., Taichung City 40852, Taiwan (R.O.C.). The major business activities of the Company and subsidiaries (together referred to as the "Group") are the design, manufacture and sale of lens for per-spective mirror, camera, single and double binoculars, fax machine, microscope and scanner etc. Please refer to Note 14.
The Company's common shares were listed on the Taiwan Stock Exchange (TWSE) in March, 2002.
(2) Approval date and procedures of the consolidated financial statements:
These consolidated financial statements were authorized for issuance by the Board of Directors on Febru-ary 25, 2019.
(3) New standards, amendments and interpretations adopted
(a) The impact of the International Financial Reporting Standards (“IFRSs”) endorsed by the Finan-cial Supervisory Commission, R.O.C. (“FSC”) which have already been adopted.
The following new standards, interpretations and amendments have been endorsed by the FSC and are effective for annual periods beginning on or after January 1, 2018.
New, Revised or Amended Standards and Interpretations Effective date
per IASB Amendment to IFRS 2 “Classification and Measurement of Share-based Pay-ment Transactions”
January 1, 2018
Amendments to IFRS 4 “Applying IFRS 9 Financial Instruments with IFRS 4 Insurance Contracts”
January 1, 2018
IFRS 9 “Financial Instruments” January 1, 2018
IFRS 15 “Revenue from Contracts with Customers” January 1, 2018
Amendment to IAS 7 “Statement of Cash Flows -Disclosure Initiative” January 1, 2017
Amendment to IAS 12 “Income Taxes- Recognition of Deferred Tax Assets for Unrealized Losses”
January 1, 2017
Amendments to IAS 40 “Transfers of Investment Property” January 1, 2018
Annual Improvements to IFRS Standards 2014–2016 Cycle:
Amendments to IFRS 12 January 1, 2017
Amendments to IFRS 1 and Amendments to IAS 28 January 1, 2018
IFRIC 22 “Foreign Currency Transactions and Advance Consideration” January 1, 2018

LARGAN PRECISION CO., LTD. AND SUBSIDIARIES
Notes to the Consolidated Financial Statements
78 (Continued)
Except for the following items, the Group believes that the adoption of the above IFRSs would not have any material impact on its consolidated financial statements. The extent and impact of significa-tion changes are as follows:
(i) IFRS 15 “Revenue from Contracts with Customers”
IFRS 15 establishes a comprehensive framework for determining whether, how much and when revenue is recognized. It replaces the existing revenue recognition guidance, including IAS 18 “Revenue” and IAS 11 “Construction Contracts”. The Group applies this standard ret-rospectively with the cumulative effect, it need not restate those contracts, but instead, contin-ues to apply IAS 11, IAS 18, and the related Interpretations for comparative reporting period. The Group recognizes the cumulative effect upon its initially application of this Standard as an adjustment to the opening balance of retained earnings on January 1, 2018.
The Group uses the practical expedients for completed contracts, which means it need not re-state those contracts that have been completed on January 1, 2018.
The following are the nature and impacts on changing of accounting policies:
1) Sales of goods
For the sale of the Group's products, in the past, the export sales were recognized when the goods are shipped to the port, the domestic sales were recognized when the goods are delivered to the customer’s premises, which is taken to be the point in time at which the customer accepts the goods and the related risks and rewards of ownership transfer. Rev-enue is recognized at this point provided that the revenue and costs can be measured reli-ably, the recovery of the consideration is probable and there is no continuing manage-ment involvement with the goods. Under IFRS 15, revenue will be recognized when a customer obtains control of the goods.
2) Impacts on financial statements
There was no significant impact on the Group’s consolidated financial statements upon the adoption of IFRS 15.
(ii) IFRS 9 “Financial Instruments”
IFRS 9 replaces IAS 39 “Financial Instruments: Recognition and Measurement” which contains classification and measurement of financial instruments, impairment and hedge ac-counting.
As a result of the adoption of IFRS 9, the Group adopted the consequential amendments to IAS 1 “Presentation of Financial Statements” which requires impairment of financial assets to be presented in a separate line item in the statement of profit or loss and OCI. Previously, the Group’s approach was to include the impairment of trade receivables in administrative ex-penses. Additionally, the Group adopted the consequential amendments to IFRS 7 Financial In-struments: Disclosures that are applied to disclosures about 2018 but generally have not been applied to comparative information.
The detail of new significant accounting policies and the nature and effect of the changes to previous accounting policies are set out below:

LARGAN PRECISION CO., LTD. AND SUBSIDIARIES
Notes to the Consolidated Financial Statements
79 (Continued)
1) Classification of financial assets and financial liabilities
IFRS 9 contains three principal classification categories for financial assets: measured at amortized cost, fair value through other comprehensive income (FVOCI) and fair value through profit or loss (FVTPL). The classification of financial assets under IFRS 9 is generally based on the business model in which a financial asset is managed and its con-tractual cash flow characteristics. The standard eliminates the previous IAS 39 categories of held to maturity, loans and receivables and available for sale. Under IFRS 9, deriva-tives embedded in contracts, where the host is a financial asset in the scope of the stand-ard, are never bifurcated. Instead, the hybrid financial instrument as a whole is assessed for classification. For an explanation of how the Group classifies and measures its finan-cial assets and accounts for related gains and losses under IFRS 9, please see note 4(g).
The adoption of IFRS 9 did not have any significant impact on its accounting policies on financial liabilities.
2) Impairment of financial assets
IFRS 9 replaces the ‘incurred loss’ model in IAS 39 with the ‘expected credit loss’ (ECL) model. The new impairment model applies to financial assets measured at amor-tized cost, contract assets and debt investments at FVOCI, but not to investments in equi-ty instruments.
3) Transition
The adoption of IFRS 9 have been applied retrospectively, except as described below,
Differences in the carrying amounts of financial assets and financial liabilities re-sulting from the adoption of IFRS 9 are recognized in retained earnings and reserves as on January 1, 2018. Accordingly, the information presented for 2017 does not generally reflect the requirements of IFRS 9, and therefore, is not comparable to the information presented for 2018 under IFRS 9.
The following assessments have been made on the basis of the facts and circum-stances that existed at the date of initial application:
-The determination of the business model within which a financial asset is held.
-The designation and revocation of previous designations of certain financial as-sets and financial liabilities as measured at FVTPL.
-The designation of certain investments in equity instruments not held for trading as at FVOCI.
If an investment in a debt security had low credit risk at the date of initial applica-tion of IFRS 9, then the Group assumes that the credit risk on its asset will not in-crease significantly since its initial recognition.

LARGAN PRECISION CO., LTD. AND SUBSIDIARIES
Notes to the Consolidated Financial Statements
80 (Continued)
4) Classification of financial assets on the date of initial application of IFRS 9
The following table shows the original measurement categories under IAS 39 and the new measurement categories under IFRS 9 for each class of the Group’s financial assets as of January 1, 2018.
IAS39 IFRS9
Measurement categories Carrying Amount Measurement categories
Carrying Amount
Financial Assets
Cash and cash equivalents Loans and receivables $ 67,896,008 Amortized cost $ 67,896,008
Debt securities Available-for-sale (note 1) 1,971,967 Mandatorily at FVTPL 1,971,967
Equity instruments Available-for-sale (note 2) 38,588 FVOCI 38,588
Trade and other receivables Loans and receivables (note 3) 15,363,507 Amortized cost 15,363,507
Other financial assets (re-
fundable deposits)
Loans and receivables 994,484 Amortized cost 994,484
Note1: The corporate debt securities categorized as available-for-sale under IAS 39 are held by the Group’s treasury unit in a separate portfolio to provide interest income; however, they may be sold to meet liquidity requirements arising in the normal course of business. The Group considers that these securities are held within a business model whose objective is achieved by selling securities. These assets have therefore been classified as financial assets at FVTPL under IFRS 9. An allowance for impairment of $1,967 thousand was recognized in opening retained earnings on transition to IFRS 9 on January 1, 2018.
Note2: These equity securities represent investments that the Group intends to hold for the long term for strategic purposes. As permitted by IFRS 9, the Group has desig-nated these investments at the date of initial application as measured at FVOCI.
Note3: Trade, lease and other receivables that were classified as loans and receivables under IAS 39 are now classified at amortized cost.
The following table reconciles the carrying amounts of financial assets under IAS 39 to the carrying amounts under IFRS 9 upon transition to IFRS 9 on 1 January, 2018.
2017.12.31 2018.1.1 2018.1.1 2018.1.1
IAS 39 Car-
rying Amount Reclassifications Remeasurements
IFRS 9 Carrying Amount
Retained earnings
effect
Other equi-ty
effect Fair value through profit or loss
Beginning balance of FVTPL (IAS 39) $ - - - - -
Additions – debt instruments:
From available for sale - 1,971,967 - 1,967 (1,967)
Total $ - 1,971,967 - 1,971,967 1,967 (1,967)
Fair value through other comprehensive income
Beginning balance of available for sale (IAS 39) $ 2,010,555 - - - -
Subtractions – debt instruments:
To FVTPL– required reclassification based on classification criteria
- (1,971,967) - - -
Total $ 2,010,555 (1,971,967) - 38,588 - -

LARGAN PRECISION CO., LTD. AND SUBSIDIARIES
Notes to the Consolidated Financial Statements
81 (Continued)
(iii) Amendments to IAS 7 “Disclosure Initiative”
The amendments require disclosures that enable users of financial statements to evaluate changes in liabilities arising from financing activities, including both changes arising from cash flow and non-cash changes.
To satisfy the new disclosure requirements, the Group present a reconciliation between the opening and closing balances for liabilities with changes arising from financing activities as note 6(z).
(b) The impact of IFRS endorsed by FSC but not yet effective
The following new standards, interpretations and amendments have been endorsed by the FSC and are effective for annual periods beginning on or after January 1, 2019 in accordance with Ruling No. 1070324857 issued by the FSC on July 17, 2018:
New, Revised or Amended Standards and Interpretations Effective date
per IASB IFRS 16 “Leases” January 1, 2019
IFRIC 23 “Uncertainty over Income Tax Treatments” January 1, 2019
Amendments to IFRS 9 “Prepayment features with negative compensation” January 1, 2019
Amendments to IAS 19 “Plan Amendment, Curtailment or Settlement” January 1, 2019
Amendments to IAS 28 “Long-term interests in associates and joint ventures” January 1, 2019
Annual Improvements to IFRS Standards 2015–2017 Cycle January 1, 2019
Except for the following items, the Group believes that the adoption of the above IFRSs would not have any material impact on its consolidated financial statements. The extent and impact of significa-tion changes are as follows:
(i) IFRS 16“Leases”
IFRS 16 replaces the existing leases guidance, including IAS 17 ” Leases ” , IFRIC 4 ”Determining whether an Arrangement contains a Lease”, SIC-15 ”Operating Leases – Incentives” and SIC-27 ”Evaluating the Substance of Transactions Involving the Legal Form of a Lease”.
IFRS 16 introduces a single and an on-balance sheet lease accounting model for lessees. A les-see recognizes a right-of-use asset representing its right to use the underlying asset and a lease liability representing its obligation to make lease payments. In addition, the nature of expenses related to those leases will now be changed since IFRS 16 replaces the straight-line operating lease expense with a depreciation charge for right-of-use assets and interest expense on lease liabilities. There are recognition exemptions for short-term leases and leases of low-value items. The lessor accounting remains similar to the current standard – i.e. the lessors will continue to classify leases as finance or operating leases.

LARGAN PRECISION CO., LTD. AND SUBSIDIARIES
Notes to the Consolidated Financial Statements
82 (Continued)
1) Determining whether an arrangement contains a lease
On transition to IFRS 16, the Group can choose to apply either of the following:
IFRS 16 definition of a lease to all its contracts; or
a practical expedient that does not need any reassessment whether a contract is, or contains, a lease.
The Group plans to apply the practical expedient to grandfather the definition of a lease upon transition. This means that it will apply IFRS 16 to all contracts entered into before January 1, 2019 and identified as leases in accordance with IAS 17 and IFRIC 4. The Group is assessing the potential impact of using the practical expedient.
2) Transition
As a lessee, the Group can-apply the standard using either of the following:
retrospective approach; or
modified retrospective approach with optional practical expedients.
The lessee applies the election consistently to all of its leases.
On January 1, 2019, the Group plans to initially apply IFRS 16 using the modified retro-spective approach. Therefore, the cumulative effect of adopting IFRS 16 will be recog-nized as an adjustment to the opening balance of retained earnings at January 1, 2019, with no restatement of comparative information.
When applying the modified retrospective approach to leases previously classified as op-erating leases under IAS 17, the lessee can elect, on a lease-by-lease basis, whether to ap-ply a number of practical expedients on transition. The Group chooses to elect the fol-lowing practical expedients:
apply a single discount rate to a portfolio of leases with similar characteristics.
adjust the right-of-use assets, based on the amount reflected in IAS 37 onerous contract provision, immediately before the date of initial application, as an alternative to an im-pairment review.
apply the exemption not to recognize the right-of-use assets and liabilities to leases with lease term that ends within 12 months of the date of initial application.
exclude the initial direct costs from measuring the right-of-use assets at the date of ini-tial application.
use hindsight when determining the lease term if the contract contains options to extend or terminate the lease.

LARGAN PRECISION CO., LTD. AND SUBSIDIARIES
Notes to the Consolidated Financial Statements
83 (Continued)
3) So far, the most significant impact identified is that the Group will have to recognize the new assets and liabilities for the operating leases of its offices, warehouses, and factory facilities. The Group estimated its right-of-use assets and lease liabilities to increase by $106,407 thousand and $90,364 thousand respectively on January 1, 2019. Besides, The Group does not expect the adoption of IFRS 16 to have any impact on its ability to com-ply with the revised maximum leverage threshold loan covenant.
(ii) IFRIC 23 Uncertainty over Income Tax Treatments
In assessing whether and how an uncertain tax treatment affects the determination of taxable profit (tax loss), tax bases, unused tax losses, unused tax credits, as well as tax rates, an entity shall assume that a taxation authority will examine the amounts it has the right to examine and have a full knowledge on all related information when making those examinations.
If an entity concludes that it is probable that the taxation authority will accept an uncertain tax treatment, the entity shall determine the taxable profit (tax loss), tax bases, unused tax losses, unused tax credits, as well as tax rates consistently with the tax treatment used or planned to be used in its income tax filings. Otherwise, an entity shall reflect the effect of uncertainty for each uncertain tax treatment by using either the most likely amount or the expected value, de-pending on which method the entity expects to better predict the resolution of the uncertainty.
So far, the Group estimated the application of the amendments will not have any significant impact on its deferred tax liabilities and retained earnings on January 1, 2019.
The actual impacts of adopting the standards may change depending on the economic conditions and events which may occur in the future.
(c) The impact of IFRS issued by IASB but not yet endorsed by the FSC
As of the date, the following IFRSs that have been issued by the International Accounting Standards Board (IASB), but have yet to be endorsed by the FSC:
New, Revised or Amended Standards and Interpretations Effective date
per IASB Amendments to IFRS 3 “Definition of a Business” January 1, 2020
Amendments to IFRS 10 and IAS 28 “Sale or Contribution of Assets Between an Investor and Its Associate or Joint Venture”
Effective date to be determined by IASB
IFRS 17 “Insurance Contracts” January 1, 2021
Amendments to IAS 1 and IAS 8 “Definition of Material” January 1, 2020
The Group is evaluating the impact on its consolidated financial position and consolidated financial performance upon the initial adoption of the abovementioned standards or interpretations. The results thereof will be disclosed when the Group completes its evaluation.

LARGAN PRECISION CO., LTD. AND SUBSIDIARIES
Notes to the Consolidated Financial Statements
84 (Continued)
(4) Summary of significant accounting policies
The accompanying consolidated financial statements are the English translation of the Chinese version prepared and used in the Republic of China. If there is any conflict between, or any difference in the inter-pretation of, the English and Chinese language consolidated financial statements, the Chinese version shall prevail.
The significant accounting policies presented in the consolidated financial statements are summarized be-low. Except for those specifically indicated, the following accounting policies were applied consistently throughout the periods presented in the consolidated financial statements.
(a) Statement of compliance
These consolidated financial statements have been prepared in accordance with the Regulations Governing the Preparation of Financial Reports by Securities Issuers (hereinafter referred to as “the Regulations”) and the International Financial Reporting Standards, International Accounting Stand-ards, IFRIC Interpretations, and SIC Interpretations endorsed by the Financial Supervisory Commis-sion, R.O.C.
(b) Basis of preparation
(i) Basis of measurement
Except for the following significant accounts, the consolidated financial statements have been prepared on the historical cost basis:
1) Financial instruments measured at fair value through profit or loss are measured at fair value;
2) Fair value through other comprehensive income (Available-for-sale financial assets) are measured at fair value.
(ii) Functional and presentation currency
The functional currency of each entity is determined based on the primary economic environ-ment in which the entity operates. The Company’s financial statements are presented in New Taiwan Dollar, which is the Company’s functional currency. All financial information pre-sented in New Taiwan Dollar has been rounded to the nearest thousand.
(c) Basis of consolidation
(i) Principle of preparation of the consolidated financial statements
The consolidated financial statements comprised of the Company and its subsidiaries. The Group accounted an entity when it is exposed, or has rights, to variable returns from its in-volvement with the entity and has the ability to affect those returns through its control over the entity.

LARGAN PRECISION CO., LTD. AND SUBSIDIARIES
Notes to the Consolidated Financial Statements
85 (Continued)
The financial statements of subsidiaries are included in the consolidated financial statements from the date that control commences until the date that the control ceases. Intra-group balanc-es and transactions, and any unrealized income and expenses arising from intra- group transac-tions, are eliminated in preparing the consolidated financial statements. Losses applicable to the non-controlling interests in a subsidiary are allocated to the non-controlling interests even if doing so causes the non-controlling interests to have a deficit balance.
Accounting policies of subsidiaries have been adjusted to ensure consistency with the policies adopted by the Group.
Changes in the Group’s ownership interest in a subsidiary that do not result in a loss of con-trol are accounted for as equity transactions. Any differences between the Group’s share of net assets before and after the change, and any considerations received or paid, are adjusted to or against the Group reserves.
(ii) List of subsidiaries in the consolidated financial statements
Percentage of Owner-ship
Name of investor
Name of subsidiary Principal activity
December 31, 2018
December 31, 2017
The Company Largan (Hong Kong) Lim-ited. (Largan Hong Kong)
Investment 100% 100%
The Company Astro International Ltd. (As-tro)
Investment 100% 100%
Astro Amtai International Ltd. (Amtai)
Manufacture and sale of optical components
100% 100%
Astro Net International Trading Ltd. (Net)
Investment 100% 100%
Net Largan (Dongguan) Optronic Ltd. (Largan Dongguan)
Manufacture of optical components
100% 100%
Net Suzhou Largan Co., Ltd. (Suzhou Largan)
Manufacture of optical components
100% 100%
The Company Ba Fang Co., Ltd. (Ba Fang)
Investment 100% 100%
Ba Fang In-vestment
Fang Yuan Co., Ltd. (Fang Yuan)
Investment 100% 100%
(iii) Subsidiaries excluded from consolidation:
Percentage of Owner-ship
Name of investor
Name of subsidiary Principal activity
December 31, 2018
Decem-ber 31, 2017
The Company Largan Digital Co., Ltd. (Largan Digital)
Manufacture of image capture device, image reader, camera and play-er
49.37% 49.37%
The Company has the ability to control over Largan Digital. However, based on material con-sideration the total assets and operating revenue of Largan Digital account for a small propor-tion of the total assets and operating revenue of the Group and Largan Digital, respectively; therefore, they are excluded from the consolidation.

LARGAN PRECISION CO., LTD. AND SUBSIDIARIES
Notes to the Consolidated Financial Statements
86 (Continued)
(d) Foreign currency
(i) Foreign currency transaction
Transactions in foreign currencies are translated to the respective functional currencies of the Group at exchange rates at the dates of the transactions. Monetary assets and liabilities denom-inated in foreign currencies at the reporting date are retranslated to the functional currency at the exchange rate at that date. The foreign currency gain or loss on monetary items is the dif-ference between the amortized cost in the functional currency at the beginning of the year ad-justed for the effective interest and payments during the period, and the amortized cost in for-eign currency translated at the exchange rate at the reporting date.
Non-monetary assets and liabilities denominated in foreign currencies that are measured at fair value are retranslated to the functional currency at the exchange rate at the date that the fair value was determined. Non-monetary items in a foreign currency that are measured based on historical cost are translated using the exchange rate at the date of translation.
Foreign currency differences arising on retranslation are recognized in profit or loss, except for the following differences which are recognized in other comprehensive income arising on the retranslation:
Fair value through other comprehensive income(available-for-sale) equity investment;
A financial liability designated as a hedge of the net investment in a foreign operation to the extent that the hedge is effective; or
Qualifying cash flow hedges to the extent the hedge is effective.
(ii) Foreign operations
The assets and liabilities of foreign operations, including goodwill and fair value adjustments arising on acquisition, are translated to the Company's functional currency at exchange rates at the reporting date. The income and expenses of foreign operations, excluding foreign opera-tions in hyperinflationary economies, are translated to the Company's functional currency at average rate. Foreign currency differences are recognized in other comprehensive income, and presented in the foreign currency translation reserve (translation reserve) in equity.
When a foreign operation is disposed of such that control, significant influence or joint control is lost, the cumulative amount in the translation reserve related to that foreign operation is re-classified to profit or loss as part of the gain or loss on disposal. When the Company's disposes any part of its interest in a subsidiary that includes a foreign operation while retaining control, the relevant proportion of the cumulative amount is reattributed to non-controlling interest. When the Group disposes only part of investment in an associate of joint venture that includes a foreign operation while retaining significant or joint control, the relevant proportion of the cumulative amount is reclassified to profit or loss.

LARGAN PRECISION CO., LTD. AND SUBSIDIARIES
Notes to the Consolidated Financial Statements
87 (Continued)
When the settlement of a monetary item receivable from, or payable to, a foreign operation is neither planned nor likely in the foreseeable future, foreign currency gains and losses arising from such items are considered to form part of a net investment in the foreign operation and are recognized in other comprehensive income, and presented in the translation reserve in equity.
(e) Classification of current and non-current assets and liabilities
An asset is classified as current under one of the following criteria, and all other assets are classified as noncurrent.
(i) It expected to be realized, or intended to be sold or consumed, in its normal operating cycle;
(ii) It holds primarily for the purpose of trading;
(iii) It expected to be realized within twelve months after the reporting period; or
(iv) The asset is cash or a cash equivalent, unless the asset is restricted from being exchanged or used to settle a liability for at least twelve months after the reporting period.
A liability is classified as current under one of the following criteria, and all other liabilities are clas-sified as non-current.
(i) It is expected to settled in the normal operating cycle;
(ii) It is held primarily for the purpose of trading;
(iii) It is due to be settled within twelve months after the reporting period; or
(iv) It does not have an unconditional right to defer settlement of the liability for at least twelve months after the reporting period. Terms of a liability that could, at the option of the counter-party, result in its settlement by the issue of equity instruments do not affect its classification.
(f) Cash and cash equivalents
Cash and cash equivalents comprise cash on hand, demand deposits and short-term, highly liquid in-vestments that are readily convertible to known amounts of cash and are subject to an insignificant risk of changes in value. Time deposits which meet the above definition and are held for the purpose of meeting short-term cash commitments rather than for investment or other purposes should be rec-ognized as cash equivalents.
(g) Financial instruments
(i) Financial assets (policy applicable commencing January 1, 2018)
Financial assets are classified into the following categories: measured at amortized cost, fair value through other comprehensive income (FVOCI) and fair value through profit or loss (FVTPL).
The Group shall reclassify all affected financial assets only when it changes its business model for managing its financial assets.

LARGAN PRECISION CO., LTD. AND SUBSIDIARIES
Notes to the Consolidated Financial Statements
88 (Continued)
1) Financial assets measured at amortized cost
A financial asset is measured at amortized cost if it meets both of the following condi-tions and is not designated as at FVTPL:
it is held within a business model whose objective is to hold financial assets to col-lect contractual cash flows; and
it is contractual terms give rise on specified dates to cash flows that are solely pay-ments of principal and interest on the principal amount outstanding.
A financial asset measured at amortized cost is initially recognized at fair value, plus any directly attributable transaction costs. These assets are subsequently measured at amor-tized cost using the effective interest method, less any impairment losses. Interest income, foreign exchange gains and losses, and recognition (reversal) of impairment loss, are recognized in profit or loss. Any gain or loss on derecognition is recognized in profit or loss. A regular way purchase or sale of financial assets is recognized and derecognized, as applicable, using trade date accounting.
2) Fair value through other comprehensive income (FVOCI)
A debt investment is measured at FVOCI if it meets both of the following conditions and is not designated as at FVTPL:
it is held within a business model whose objective is achieved by both collecting contractual cash flows and selling financial assets; and
its contractual terms give rise on specified dates to cash flows that are solely pay-ments of principal and interest on the principal amount outstanding.
On initial recognition of an equity investment that is not held for trading, the Group may irrevocably elect to present subsequent changes in the investment’s fair value in other comprehensive income. This election is made on an instrument-by-instrument basis.
A financial asset measured at FVOCI is initially recognized at fair value, plus any direct-ly attributable transaction costs. These assets are subsequently measured at fair value. In-terest income calculated using the effective interest method, foreign exchange gains and losses, and impairment losses, deriving from debt investments are recognized in profit or loss; whereas dividends deriving from equity investments are recognized as income in profit or loss, unless the dividend clearly represents a recovery of part of the cost of the investment. Other net gains and losses of financial assets measured at FVOCI are recog-nized in OCI and accumulated in other equity-unrealized gains (losses) on financial assets measure at FVOCI. On derecognition, gains and losses accumulated in OCI of debt in-vestments are reclassified to profit or loss. However, gains and losses accumulated in OCI of equity investments are reclassified to retain earnings instead of profit or loss.

LARGAN PRECISION CO., LTD. AND SUBSIDIARIES
Notes to the Consolidated Financial Statements
89 (Continued)
Dividend income derived from equity investments is recognized on the date that the Group’s right to receive payment is established, which in the case of quoted securities is normally the ex-dividend date. A regular way purchase or sale of financial assets is rec-ognized and derecognized, as applicable, using trade date accounting.
3) Fair value through profit or loss (FVTPL)
All financial assets not classified as amortized cost or FVOCI described as above are measured at FVTPL. On initial recognition, the Group may irrevocably designate a fi-nancial asset, which meets the requirements to be measured at amortized cost or at FVOCI, as at FVTPL if doing so eliminates or significantly reduces an accounting mis-match that would otherwise arise.
Financial assets in this category are measured at fair value at initial recognition. At-tributable transaction costs are recognized in profit or loss as incurred. Subsequent changes that are measured at fair value, which take into account any dividend and interest income, are recognized in profit or loss. A regular way purchase or sale of financial assets is recognized and derecognized, as applicable, using trade date accounting.
4) Business model assessment
The Group makes an assessment of the objective of the business model in which a finan-cial asset is held at portfolio level because this best reflects the way the business is man-aged and information is provided to management. The information considered includes:
the stated policies and objectives for the portfolio and the operation of those policies in practice. These include whether management’s strategy focuses on earning con-tractual interest income, maintaining a particular interest rate profile, matching the duration of the financial assets to the duration of any related liabilities or expected cash outflows or realizing cash flows through the sale of the assets;
how the performance of the portfolio is evaluated and reported to the Group’s management;
the risks that affect the performance of the business model (and the financial assets held within that business model) and how those risks are managed;
how managers of the business are compensated ─ e.g. whether compensation is based on the fair value of the assets managed or the contractual cash flows collected; and
the frequency, volume and timing of sales of financial assets in prior periods, the reasons for such sales and expectations about future sales activity.
Transfers of financial assets to third parties in transactions that do not qualify for derec-ognition are not considered sales for this purpose, and are consistent with the Group’s continuing recognition of the assets.

LARGAN PRECISION CO., LTD. AND SUBSIDIARIES
Notes to the Consolidated Financial Statements
90 (Continued)
Financial assets that are held for trading or are managed and whose performance is eval-uated on a fair value basis are measured at FVTPL.
5) Assessment whether contractual cash flows are solely payments of principal and interest
For the purposes of this assessment, ‘principal’ is defined as the fair value of the fi-nancial assets on initial recognition. ‘Interest’ is defined as consideration for the time value of money and for the credit risk associated with the principal amount outstanding during a particular period of time and for other basic lending risks and costs, as well as a profit margin.
In assessing whether the contractual cash flows are solely payments of principal and in-terest, the Group considers the contractual terms of the instrument. This includes as-sessing whether the financial asset contains a contractual term that could change the tim-ing or amount of contractual cash flows such that it would not meet this condition. In making this assessment, the Group considers:
contingent events that would change the amount or timing of cash flows;
terms that may adjust the contractual coupon rate, including variable rate features;
prepayment and extension features;and
terms that limit the Group’s claim to cash flows from specified assets(e.g. non-recourse features)
6) Impairment of financial assets
The Group recognizes its loss allowances for expected credit losses on financial assets measured at amortized cost (including cash and cash equivalents, notes and accounts re-ceivable, other receivables, guarantee deposit paid and other financial assets).
The Group measures its loss allowances at an amount equal to lifetime expected credit loss (ECL), except for the following which are measured as 12-month ECL:
debt securities that are determined to have low credit risk at the reporting date;and
other debt securities and bank balances for which the credit risk (i.e. the risk of de-fault occurring over the expected life of the financial instrument) has not increased significantly since initial recognition.
Loss allowance for trade receivables and contract assets are always measured at an amount equal to lifetime ECL.
Lifetime ECLs are the ECLs that result from all possible default events over the expected life of a financial instrument.
12-month ECLs are the portion of ECLs resulting from default events that are possible within the 12 month after the reporting date (or a shorter period if the expected life of the instrument is less than 12 months).

LARGAN PRECISION CO., LTD. AND SUBSIDIARIES
Notes to the Consolidated Financial Statements
91 (Continued)
The maximum period considered when estimating ECLs is the maximum contractual pe-riod over which the Group is exposed to credit risk.
When determining whether the credit risk of a financial asset has increased significantly since initial recognition and when estimating ECL, the Group considers reasonable and supportable information that is relevant and available without undue cost or effort. This includes both quantitative and qualitative information and analysis based on the Group’
s historical experience and informed credit assessment, as well as forward-looking infor-mation.
The Group considers a debt security to have low credit risk when its credit risk rating is equivalent to the globally understood definition of ‘investment grade which is consid-ered to be twA or higher per Taiwan Ratings’.
The Group assumes that the credit risk on a financial asset has increased significantly if it is more than 180 days past due.
The Group considers a financial asset to be in default when the financial asset is more than 360 days past due or the borrower is unlikely to fully pay its credit obligations to the Group.
ECLs are a probability-weighted estimate of credit losses. Credit losses are measured as the present value of all cash shortfalls (i.e the difference between the cash flows due to the Group in accordance with the contract and the cash flows that the Group expects to receive). ECLs are discounted at the effective interest rate of the financial asset.
At each reporting date, the Group assesses whether financial assets carried at amortized cost are credit-impaired. A financial asset is ‘credit-impaired’ when one or more events that have a detrimental impact on the estimated future cash flows of the financial asset have occurred. Evidence that a financial assets is credit-impaired includes the fol-lowing observable data:
significant financial difficulty of the borrower or issuer;
a breach of contract such as a default or being more than 360 days past due;
the lender of the borrower, for economic or contractual reasons relating to the bor-rower's financial difficulty, having granted to the borrower a concession that the lender would not otherwise consider;
it is probable that the borrower will enter bankruptcy or other financial reorganiza-tion;or
the disappearance of an active market for a security because of financial difficulties.

LARGAN PRECISION CO., LTD. AND SUBSIDIARIES
Notes to the Consolidated Financial Statements
92 (Continued)
Loss allowances for financial assets measured at amortized cost are deducted from the gross carrying amount of the assets. For debt securities at FVOCI, the loss allowance is recognized in other comprehensive income instead of reducing the carrying amount of the asset. The Group recognizes the amount of expected credit losses (or reversal) in profit or loss, as an impairment gain or loss.
The gross carrying amount of a financial asset is written off (either partially or in full) to the extent that there is no realistic prospect of recovery. This is generally the case when the Group determines that the debtor does not have assets or sources of income that could generate sufficient cash flows to repay the amounts subject to the write-off. However, fi-nancial assets that are written off could still be subject to enforcement activities in order to comply with the Group’s procedures for recovery of amounts due.
7) Derecognition of financial assets
Financial assets are derecognized when the contractual rights to the cash flows from the assets expire, or when the Group transfers substantially all the risks and rewards of own-ership of the financial assets.
On derecognition of a debt instrument in its entirety, the Group recognizes the difference between its carrying amount and the sum of the consideration received or receivable and any cumulative gain or loss that had been recognized in other comprehensive income and presented in “other equity – unrealized gains or losses on fair value through other com-prehensive income”, in profit or loss, and presented it in the line item of non-operating income and expenses.
On derecognition of a financial asset other than in its entirety, the Group allocates the previous carrying amount of the financial asset between the part it continues to recognize under continuing involvement, and the part it no longer recognizes on the basis of the rel-ative fair values of those parts on the date of the transfer. The difference between the carrying amount allocated to the part that is no longer recognized and the sum of the con-sideration received for the part no longer recognized and any cumulative gain or loss al-located to it that had been recognized in other comprehensive income is recognized in profit or loss, and presented in the line item of non-operating income and expenses. A cumulative gain or loss that had been recognized in other comprehensive income is allo-cated between the part that continues to be recognized and the part that is no longer rec-ognized on the basis of the relative fair values of those parts.
LARGAN PRECISION CO., LTD. AND SUBSIDIARIES
Notes to the Consolidated Financial Statements
93 (Continued)
(ii) Financial assets (Policy applicable before January 1, 2018)
Financial assets are classified into the following categories: available-for-sale financial assets and loans and receivables.
1) Available-for-sale financial assets
Available-for-sale financial assets are non-derivative financial assets that are designated as available for sale or are not classified in any of the other categories of financial assets. Available-for-sale financial assets are recognized initially at fair value, plus any directly attributable transaction costs. Subsequent to initial recognition, they are measured at fair value, and changes therein, other than impairment losses, interest income calculated using the effective interest method, dividend income, and foreign currency differences on available-for-sale debt instruments, are recognized in other comprehensive income and presented in the fair value reserve in equity. When an investment is derecognized, the gain or loss accumulated in equity is reclassified to profit or loss, and included in non-operating income and expense. A regular way purchase or sale of financial assets is recognized and derecognized, as applicable, using trade date accounting.
Investments in equity instruments that do not have a quoted market price in an active market and whose fair value cannot be reliably measured are measured at amortized cost, less any impairment losses and included in financial assets measured at cost.
Dividend income is recognized in profit or loss on the date that the Company's right to receive payment is established, which in the case of quoted securities is normally the ex-dividend date. Such dividend income is included in non-operating income and ex-pense.
Interest income from investment in bond security is recognized in profit or loss, under other income of non-operating income and expense.
2) Loans and receivables
Loans and receivables are financial assets with fixed or determinable payments that are not quoted in an active market. Such assets are recognized initially at fair value, plus any directly attributable transaction costs. Subsequent to initial recognition, loans and receiv-ables other than insignificant interest on short-term receivables are measured at amortized cost using the effective interest method, less any impairment losses. A regular way pur-chase or sale of financial assets is recognized and derecognized, as applicable, using trade-date accounting.
Interest income is recognized in profit or loss, and it is included in non-operating income and expense.
3) Impairment of financial assets
Except for financial assets at fair value through profit or loss, financial assets are assessed for impairment at each reporting date. A financial asset is impaired if, and only if, there is objective evidence of impairment as a result of one or more events that occurred after the initial recognition of the asset (a ‘loss event’) and that loss event (or events) has an impact on the estimated future cash flows of the financial asset that can be estimated re-liably.
LARGAN PRECISION CO., LTD. AND SUBSIDIARIES
Notes to the Consolidated Financial Statements
94 (Continued)
Objective evidence that financial assets are impaired includes default or delinquency by a debtor, restructuring of an amount due to the Group on terms that the Group would not consider otherwise, indications that a debtor or issuer will enter bankruptcy, adverse changes in the payment status of borrowers or issuers, economic conditions that correlate with defaults, or the disappearance of an active market for a security. In addition, for an investment in an equity security, a significant or prolonged decline in its fair value below its cost is considered objective evidence of impairment.
All individually significant receivables are assessed for specific impairment. Receivables that are not individually significant are collectively assessed for impairment by grouping together assets with similar risk characteristics. In assessing collective impairment, the Group uses historical trends of the probability of default, the timing of recoveries, and the amount of loss incurred, adjusted for management’s judgment as to whether current economic and credit conditions are such that the actual losses are likely to be greater or less than the those suggested by historical trends.
An impairment loss in respect of a financial asset measured at amortized cost is calculat-ed as the difference between its carrying amount and the present value of the estimated future cash flows discounted at the asset’s original effective interest rate.
An impairment loss in respect of a financial asset measured at cost is calculated as the difference between its carrying amount and the present value of the estimated future cash flows discounted at the current market rate of return for a similar financial asset. Such impairment loss is not reversible in subsequent periods.
An impairment loss in respect of a financial asset is deducted from the carrying amount, except for accounts receivable, for which an impairment loss is reflected in an allowance account against the receivables. When it is determined a receivable is uncollectible, it is written off from the allowance account. Changes in the amount of the allowance account are recognized in profit or loss.
Impairment losses on available-for-sale financial assets are recognized by reclassifying the losses accumulated in the fair value reserve in equity to profit or loss.
If, in a subsequent period, the amount of impairment loss on a financial asset measured at amortized cost decreases and the decrease can be related objectively to an event occurring after the impairment was recognized, the decrease in impairment loss is reversed through profit or loss to the extent that the carrying value of the asset does not exceed its amor-tized cost before impairment was recognized at the reversal date.
Impairment losses recognized on an available-for-sale equity security are not reversed through profit or loss. Any subsequent recovery in the fair value of an impaired availa-ble-for-sale equity security is recognized in other comprehensive income, and accumu-lated in other equity. If, in a subsequent period, the fair value of an impaired availa-ble-for-sale debt security increases and the increase can be related objectively to an event occurring after the impairment loss was recognized, then the impairment loss is reversed, with the amount of the reversal recognized in profit or loss.

LARGAN PRECISION CO., LTD. AND SUBSIDIARIES
Notes to the Consolidated Financial Statements
95 (Continued)
Bad debt expenses and reversal of allowance for doubtful debts for trade receivables are recognized in general and administrative expenses while impairment losses and reversal of impairment for financial assets other than receivables are recognized under non-operating income and expenses.
4) Derecognition of financial assets
Financial assets are derecognized when the contractual rights of the cash inflow from the assets are terminated, or when the Group transfers substantially all the risks and rewards of ownership of the financial assets.
On derecognition of a financial asset in its entirety, the difference between the carrying amount and the sum of the consideration received or receivable and any cumulative gain or loss that had been recognized in other comprehensive income and presented in “oth-er equity – unrealized gains or losses on available-for-sale financial assets” in profit or loss is included in non-operating income and expenses.
On derecognition of a financial asset other than in its entirely, the Group separates the part that continues to be recognized and the part that is derecognized based on the relative fair values of those parts on the date of the transfer. The difference between the carrying amount allocated to the part derecognized and the sum of the consideration received for the part derecognized, and any cumulative gain or loss allocated to it that had been rec-ognized in other comprehensive income, shall be recognized in profit or loss and pre-sented in the line item of non-operating income and expenses. A cumulative gain or loss that had been recognized in other comprehensive income is allocated between the part that continues to be recognized and the part that is no longer recognized on the basis of the relative fair values of those parts.
(iii) Financial liabilities and equity instrument
1) Classification of debt or equity
Debt or equity instruments issued by the Group are classified as financial liabilities or equity in accordance with the substance of the contractual agreement.
An equity instrument is any contract that evidences residual interest in the assets of an entity after deducting all of its liabilities. Equity instruments issued are recognized as the amount of consideration received, less the direct cost of issuing.
Interest related to the financial liability is recognized in profit or loss, and included in non-operating income and expenses.
On conversion, the financial liability is reclassified to equity, and no gain or loss is rec-ognized.

LARGAN PRECISION CO., LTD. AND SUBSIDIARIES
Notes to the Consolidated Financial Statements
96 (Continued)
2) Other financial liabilities
Financial liabilities not classified as held for trading or designated as at fair value through profit or loss are measured at fair value, plus any directly attributable transaction costs at the time of initial recognition. Subsequent to initial recognition, they are measured at amortized cost calculated using the effective interest method. Interest expense not capi-talized as capitalized cost is recognized in profit or loss, and included in non-operating income and expense.
3) Derecognition of financial liabilities
The Group derecognizes a financial liability when its contractual obligation has been discharged or cancelled, or has expired. The difference between the carrying amount of a financial liability removed and the consideration paid (including any non-cash assets transferred or liabilities assumed) is recognized in profit or loss, and included in non-operating income or expenses.
4) Offsetting of financial assets and liabilities
The Group presents its financial assets and liabilities on a net basis when the Group has the legally enforceable right to offset and intends to settle such financial assets and liabil-ities on a net basis or to realize the assets and settle the liabilities simultaneously.
(h) Inventories
Inventories are measured at the lower of cost and net realizable value. The cost of inventories is based on the weighted-average method and includes expenditure incurred in acquiring the inventories, production or conversion costs, and other costs incurred in bringing them to their existing location and condition. In the case of manufactured inventories and work in progress, cost includes an appro-priate share of production overheads based on normal operating capacity.
Net realizable value is the estimated selling price in the ordinary course of business, less the esti-mated costs of completion and selling expenses.
(i) Property, plant and equipment
(i) Recognition and measurement
Items of property, plant and equipment are measured at cost, less accumulated depreciation and accumulated impairment losses. Cost includes expenditure that is directly attributed to the ac-quisition of the asset. The cost of a self-constructed asset comprises material, labor, any cost directly attributable to bringing the asset to the location and condition necessary for it to be ca-pable of operating in the manner intended by management, the initial estimate of the costs of dismantling and removing the item and restoring the site on which it is located, and any bor-rowing cost that is eligible for capitalization. Cost also includes transfers from equity of any gain or loss on qualifying cash flow hedges of foreign currency purchases of property, plant and equipment. The cost of software is capitalized as part of the property, plant and equipment if the purchase of the software is necessary for the property, plant and equipment to be capable of operating.

LARGAN PRECISION CO., LTD. AND SUBSIDIARIES
Notes to the Consolidated Financial Statements
97 (Continued)
Each part of an item of property, plant and equipment with a cost that is significant in relation to the total cost of the item shall be depreciated separately, unless the useful life and deprecia-tion method of that significant part are the same as those of another significant part of that same item.
The gain or loss arising from the derecognition of an item of property, plant and equipment is determined as the difference between the net disposal proceeds, if any, and the carrying amount of the item, and it shall be recognized in profit or loss, under net other income and expenses.
(ii) Subsequent cost
Subsequent expenditure is capitalized only when it is probable that future economic benefits associated with the expenditure will flow to the Group. The carrying amount of those parts of fixed assets that are replaced is derecognized. Ongoing repairs and maintenance are expensed as incurred.
(iii) Depreciation
Depreciation is calculated on the cost of an asset, less its residual value and is recognized in profit or loss on a straight-line basis over the estimated useful lives of each component of an item of property, plant and equipment. Items of property, plant and equipment with the same useful life may be grouped in determining the depreciation charge. The remainder of the items may be depreciated separately.
Leased assets are depreciated by using the straight-line method during the period of expected use, consistent with the depreciation policy the lessee adopts for depreciable assets that are owned. If there is reasonable certainty that the lessee will obtain ownership by the end of the lease term, the period of expected use is the useful life of the asset; otherwise, the asset is de-preciated over the shorter of the lease term and its useful life.
Land has an unlimited useful life, and therefore, is not depreciated.
The estimated useful lives for the current and comparative years of significant items of proper-ty, plant and equipment are as follows:
1) Buildings 35 ~55years 2) Machinery and equipment 2 ~ 10 years
Plant constitutes mainly building, electromechanical power engineering and cleanroom air conditioning project. Each such part is depreciated based on its useful life of 35~55 years, 8~ 10 years and 8~10 years, respectively.
The depreciation methods, useful lives, and residual values are reviewed at each reporting date. If expectations differ from the previous estimates, the changes are accounted for as changes in accounting estimates.

LARGAN PRECISION CO., LTD. AND SUBSIDIARIES
Notes to the Consolidated Financial Statements
98 (Continued)
(j) Leases
(i) Lessor
Lease income from an operating lease is recognized in income on a straight-line basis over the lease term. Initial direct costs incurred in negotiating and arranging an operating lease are add-ed to the carrying amount of the leased asset, and recognized as an expense over the lease term on the same basis as the lease income. Incentives granted to the lessee to enter into an operating lease are spread over the lease term on a straight-line basis so that the lease income received is reduced accordingly.
(ii) Lessee
Leases of the group are operating leases and are not recognized in the Group’s balance sheets. Payments made under operating leases (excluding insurance and maintenance expenses) are recognized in profit or loss on a straight-line basis over the term of the lease. Incentives granted to the lessee to enter into an operating lease are spread over the lease term on a straight-line basis so that the lease payments is reduced accordingly.
(k) Intangible assets
(i) Other intangible assets
Other intangible assets that are acquired by the Group are measured at cost, less, accumulated amortization and any accumulated impairment losses.
(ii) Subsequent expenditure
Subsequent expenditure is capitalized only when it increases the future economic benefits em-bodied in the specific asset to which it relates. All other expenditure, including expenditure on internally generated goodwill and brands, is recognized in profit or loss as incurred.
(iii) Amortization
The amortizable amount is the cost of an asset, less, its residual value. Except for goodwill and intangible assets with indefinite useful lives, amortization is recognized in profit or loss on a straight-line basis over the estimated useful lives of intangible assets from the date that they are available for use. The estimated useful lives for the current and comparative periods are as fol-lows:
Computer software cost 1~3 years
The residual value, amortization period and the amortization method for an intangible asset with a finite useful life shall be reviewed at least annually at each fiscal year-end. Any changes shall be accounted for as a changes in accounting estimates.

LARGAN PRECISION CO., LTD. AND SUBSIDIARIES
Notes to the Consolidated Financial Statements
99 (Continued)
(l) Impairment of non-financial assets
The Group assesses non-derivative financial assets for impairment (except for inventories, deferred income tax assets and employee benefits) at every reporting date, and estimates its recoverable amount. If it is not possible to determine the recoverable amount (fair value, less, cost to sell and value in use) for the individual asset, then the Group will have to determine the recoverable amount for the asset's cash-generating unit (CGU).
The recoverable amount for an individual asset or a CGU is the higher of its fair value, less, costs to sell and its value in use. If, and only if, the recoverable amount of an asset is less than its carrying amount, the carrying amount of the asset shall be reduced to its recoverable amount; and that reduc-tion will be accounted as an impairment loss, which shall be recognized immediately in profit or loss.
The Group assesses at the end of each reporting period whether there is any indication that an im-pairment loss recognized in prior periods for an asset other than goodwill may no longer exist or may have decreased. An impairment loss recognized in prior periods for an asset other than goodwill shall be reversed if, and only if, there has been a change in the estimates used to determine the asset’s recoverable amount since the last impairment loss was recognized. In this case, the carrying amount of the asset shall be increased to its recoverable amount. That increase is a reversal of an impairment loss.
(m) Provisions
A provision is recognized if, as a result of a past event, the Group has a present legal or constructive obligation that can be estimated reliably, and it is probable that an outflow of economic benefits will be required to settle the obligation. Provisions are determined by discounting the expected future cash flows at a pre-tax rate that reflects the current market assessments of the time value of money and the risks specific to the liability. The unwinding of the discount is recognized as finance cost.
(n) Revenue
(i) Revenue from contracts with customers (policy applicable commencing January 1, 2018)
Revenue is measured based on the consideration to which the Group expects to be entitled in exchange for transferring goods or services to a customer. The Group recognizes revenue when it satisfies a performance obligation by transferring control of a good or a service to a customer. The accounting policies for the Group’s main types of revenue are explained below.
1) Sale of goods
The Group manufactures and sells various multiples lens to mobile phone manufacturers. The Group recognizes revenue when control of the products has transferred, being when the products are delivered to the customer, the customer has full discretion over the channel and price to sell the products, and there is no unfulfilled obligation that could af-fect the customer’s acceptance of the products. Delivery occurs when the products have been shipped to the specific location, the risks of obsolescence and loss have been trans-ferred to the customer, and either the customer has accepted the products in accordance with the sales contract, the acceptance provisions have lapsed, or the Group has objective evidence that all criteria for acceptance have been satisfied.

LARGAN PRECISION CO., LTD. AND SUBSIDIARIES
Notes to the Consolidated Financial Statements
100 (Continued)
A receivable is recognized when the goods are delivered as this is the point in time that the Group has a right to an amount of consideration that is unconditional.
2) Financing components
The Group does not expect to have any contracts where the period between the transfer of the promised goods or services to the customer and payment by the customer exceeds one year. As a consequence, the Group does not adjust any of the transaction prices for the time value of money.
(ii) Revenue (Policy applicable before January 1, 2018)
1) Goods sold
Revenue from the sale of goods in the course of ordinary activities is measured at the fair value of the consideration received or receivable, net of returns, trade discounts and volume rebates. Revenue is recognized when persuasive evidence exists, usually in the form of an executed sales agreement, that the significant risks and rewards of ownership have been transferred to the customer, recovery of the consideration is probable, the as-sociated costs and possible return of goods can be estimated reliably, there is no continu-ing management involvement with the goods, and the amount of revenue can be meas-ured reliably. If it is probable that discounts will be granted and the amount can be meas-ured reliably, then the discount is recognized as a reduction of revenue as the sales are recognized.
The timing of the transfers of risks and rewards varies depending on the individual terms of the sales agreement. For international shipments, transfer occurs upon loading the goods onto the relevant carrier at the client’s designated location. For domestic ship-ments, transfer occurs upon loading the goods delivered to the customer's premises.
2) Services
The Group provides consultancy services and management services to its customers. Revenue from services rendered is recognized in profit or loss in proportion to the stage of completion of the transaction at the reporting date.
3) Commissions
When the Group acts in the capacity of an agent rather than as the principal in a transac-tion, the revenue recognized is the net amount of commission made by the Group.
(iii) Contract costs (policy applicable from January 1, 2018)
1) Incremental costs of obtaining a contract
The Group recognizes as an asset the incremental costs of obtaining a contract with a customer if the Group expects to recover those costs. The incremental costs of obtaining a contract are those costs that the Group incurs to obtain a contract with a customer that it would not have incurred if the contract had not been obtained. Costs to obtain a contract that would have been incurred regardless of whether the contract was obtained shall be recognized as an expense when incurred, unless those costs are explicitly chargeable to the customer regardless of whether the contract is obtained.

LARGAN PRECISION CO., LTD. AND SUBSIDIARIES
Notes to the Consolidated Financial Statements
101 (Continued)
The Group applies the practical expedient to recognize the incremental costs of obtaining a contract as an expense when incurred if the amortization period of the asset that the en-tity otherwise would have recognized is one year or less.
2) Costs to fulfil a contract
If the costs incurred in fulfilling a contract with a customer are not within the scope of another Standard (for example, IAS 2 Inventories, IAS 16 Property, Plant and Equipment or IAS 38 Intangible Assets), the Group recognizes an asset from the costs incurred to fulfil a contract only if those costs meet all of the following criteria:
the costs relate directly to a contract or to an anticipated contract that the Group can specifically identify;
the costs generate or enhance resources of the Group that will be used in satisfying (or in continuing to satisfy) performance obligations in the future; and
the costs are expected to be recovered.
For general and administrative costs, costs of wasted materials, labor or other resources to fulfil the contract that were not reflected in the price of the contract, costs that relate to satisfied performance obligations (or partially satisfied performance obligations), and costs for which the Group cannot distinguish whether the costs relate to unsatisfied per-formance obligations or to satisfied performance obligations(or partially satisfied perfor-mance obligations), the Group recognizes these costs as expenses when incurred.
(o) Employee benefits
(i) Defined contribution plans
Obligations for contributions to defined contribution pension plans are recognized as an em-ployee benefit expense in profit or loss in the periods during which services are rendered by employees.
(ii) Defined benefit plans
A defined benefit plan is a post-employment benefit plan other than a defined contribution plan. The Group’s net obligation in respect of defined benefit pension plans is calculated separately for each plan by estimating the amount of future benefit that employees have earned in return for their service in the current and prior periods based on the discounted present value of the said defined benefit obligation. Any unrecognized past service costs and the fair value of any plan assets are deducted for purposes of determining the Group’s net defined benefit obliga-tion. The discount rate used in calculating the present value is the market yield at the reporting date of government bonds that have maturity dates approximating the terms of the Group’s obligations and that are denominated in the same currency in which the benefits are expected to be paid.

LARGAN PRECISION CO., LTD. AND SUBSIDIARIES
Notes to the Consolidated Financial Statements
102 (Continued)
The calculation is performed annually by a qualified actuary using the projected unit credit method. If the calculation results in a benefit to the Group, the recognized asset is limited to the total of any unrecognized past service costs and the present value of economic benefits availa-ble in the form of any future refunds from the plan or reductions in future contributions to the plan. In calculating the present value of economic benefits, consideration is given to any mini-mum funding requirements that apply to any plan in the Group. An economic benefit is availa-ble to the Group if it is realizable during the life of the plan, or on settlement of the plan liabili-ties.
If the benefits of a plan are improved, the pension cost incurred from the portion of the in-creased benefit relating to service by employees, is recognized immediately in profit or loss.
Remeasurements of the net defined benefit liability (asset), which comprise (1) actuarial gains and losses, (2) the return on plan assets (excluding interest), and (3) the effect of the asset ceil-ing (if any, excluding interest), are recognized immediately in other comprehensive income. Remeasurements of the net defined benefit plan of the Group shall be recognized in retained earnings.
Gains or losses on the curtailment or settlement of a defined benefit plan are recognized when the curtailment or settlement occurs. The gains or losses on curtailment arise from any changes in the fair value of plan assets, any changes in the present value of the defined benefit obliga-tion, and any related actuarial gains or losses and past service cost which had not previously been recognized.
(iii) Short-term employee benefits
Short-term employee benefit obligations are measured on an undiscounted basis and are ex-pensed when related services are provided.
A liability is recognized for the amount expected to be paid under short-term cash bonus or profit-sharing plans if the Group has a present legal or constructive obligation to pay this amount as a result of past service provided by the employee, and the obligation can be estimat-ed reliably.
(p) Income taxes
Income tax expenses include both current taxes and deferred taxes. Except for expenses related to business combinations, or those recognized directly in equity or other comprehensive income, all current and deferred taxes shall be recognized in profit or loss.
Current taxes include tax payables and tax deduction receivables on taxable gains (losses) for the year calculated using the statutory tax rate on the reporting date or the actual legislative tax rate; they also include tax adjustments related to prior years.
Deferred taxes arise due to temporary differences between the carrying amounts of assets and liabili-ties for financial reporting purposes and their respective tax bases. Deferred taxes are recognized ex-cept for the following:
(i) Assets and liabilities that are initially recognized but not related to the business combination, and have no effect on net income or taxable gains (losses) during the transaction.
(ii) Temporary differences arising from equity investments on subsidiaries or joint ventures, where
LARGAN PRECISION CO., LTD. AND SUBSIDIARIES
Notes to the Consolidated Financial Statements
103 (Continued)
there is a high probability that such temporary differences, will not reverse.
(iii) Initial recognition of goodwill.
Deferred tax assets and liabilities shall be measured at the tax rates that are expected to apply to the period when the asset is realized or the liability is settled, which are normally the tax rates that have been enacted or substantively enacted by the end of the reporting period.
Deferred tax assets and liabilities may be offset against each other if the following criteria are met:
(i) the entity has the legal right to settle tax assets and liabilities on a net basis; and
(ii) the taxing of deferred tax assets and liabilities fulfill one of the below scenarios:
1) levied by the same taxing authority; or
2) levied by different taxing authorities, but where each such authority intend to settle tax assets and liabilities (where such amounts are significant) on a net basis every year of the period of expected asset realization or debt liquidation; or where the timing of asset real-ization and debt liquidation is matched.
A deferred tax asset should be recognized for the carry-forward of unused tax losses, unused tax credits, and deductible temporary differences, to the extent that it is probable that future taxable prof-it will be available against which the unused tax losses, unused tax credits, and deductible temporary differences can be utilized. Such unused tax losses, unused tax credits, and deductible temporary dif-ferences are also reevaluated every year on the financial reporting date, and adjusted based on the probability that the future taxable profit will be available against which the unused tax losses, unused tax credits, and deductible temporary differences can be utilized.
(q) Earnings per share
The Group discloses the Company’s basic and diluted earnings per share attributable to ordinary shareholders of the Company. Basic earnings per share are calculated as the profit attributable to or-dinary shareholders of the Company, divided by the weighted-average number of ordinary shares outstanding. Diluted earnings per share are calculated as the profit attributable to ordinary sharehold-ers of the Company, divided by the weighted-average number of ordinary shares outstanding after adjustment for the effects of all potentially dilutive ordinary shares, such as employee bonus.
(r) Operating segments
An operating segment is a component of the Group that engages in business activities from which it may incur revenues and incur expenses (including revenues and expenses relating to transactions with other components of the Group). Operating results of the operating segment are regularly re-viewed by the Group’s chief operating decision maker to make decisions about resources to be al-located to the segment and to assess its performance. Each operating segment consists of standalone financial information.
(5) Significant accounting assumptions and judgments, and major sources of estimation uncertainty
The preparation of the consolidated financial statements in conformity with the Regulations and the IFRSs endorsed by the FSC requires management to make judgments, estimates and assumptions that affect the

LARGAN PRECISION CO., LTD. AND SUBSIDIARIES
Notes to the Consolidated Financial Statements
104 (Continued)
application of the accounting policies and the reported amount of assets, liabilities, income and expenses. Actual results may differ from these estimates.
The management continues to monitor the accounting estimates and assumptions. It recognizes any chang-es in accounting estimates during the period and the impact of those changes in accounting estimates in the following period.
Information about assumptions and estimation uncertainties that have a significant risk of resulting in a material adjustment within the next financial year is as follows:
(a) Valuation of inventories
As inventories are stated at the lower of cost or net realizable value, the Group estimates the net real-izable value of inventories for obsolescence and unmarketable items at the end of the reporting peri-od and then writes down the cost of inventories to net realizable value. The net realizable value of the inventory is mainly determined based on assumptions as to future demand within a specific time horizon. Due to the rapid industrial transformation, there may be significant changes in the net real-izable value of inventories. Please refer to note 6(g) for further description of the valuation of inven-tories.
(b) The loss allowance of trade receivable
The Group has estimated the loss allowance of trade receivable that is based on the risk of a default occurring and the rate of expected credit loss. The Group has considered historical experience, cur-rent economic conditions and forward-looking information at the reporting date to determine the as-sumptions to be used in calculating the impairments and the selected inputs. For relevant assump-tions and input values, please refer to note 6(e).
(6) Explanation of significant accounts
(a) Cash and cash equivalents
December 31, 2018
December 31, 2017
Petty cash and cash on hand $ 2,953 1,678
Demand deposits 7,162,962 7,863,665
Time deposits 76,237,511 60,030,665
Cash and cash equivalents in the consolidated state-ment of cash flows $ 83,403,426 67,896,008
Please refer to note 6(w) for the exchange rate risk and sensitivity analysis of the financial assets and liabilities of the Group.

LARGAN PRECISION CO., LTD. AND SUBSIDIARIES
Notes to the Consolidated Financial Statements
105 (Continued)
(b) Financial assets at fair value through profit or loss
December 31, 2018
December 31, 2017
Mandatorily measured at fair value through profit or loss:
Non-derivative financial assets
Stocks unlisted in domestic markets $ - -
Beneficiary Certificate-open-end funds 1,291,809 -
Total $ 1,291,809 -
For market risk, please refer to note 6(w).
(c) Financial assets at fair value through other comprehensive income
December 31, 2018
Equity investments at fair value through other comprehensive income
Listed common shares
Domestic Company - AVISION INC. $ 23,389
Hong Kong Company - XIAOMI CORP-CLASS B 116,555
Total $ 139,944
(i) Equity investments at fair value through other comprehensive income
On January 1, 2018, the Group designated the investments shown above as equity securities as at fair value through other comprehensive income because these equity securities represent those investments that the Group intends to hold for long-term for strategic purposes. These investments were classified as available-for-sale financial assets on December 31, 2017.
On March 12, 2018, the Group has sold 165 thousands of its shares in AVISION INC. due to financial management reason. The shares sold had a fair value of $1,233 thousand, and the Group realized a gain of $14 thousand, which is already included in other comprehensive in-come. The gain has been transferred to retained earnings.
(ii) For market risk, please refer to note 6(w).
(iii) As of December 31, 2018, the financial assets at fair value through other comprehensive in-come of the Group had not been pledged as collateral for long-term borrowing.

LARGAN PRECISION CO., LTD. AND SUBSIDIARIES
Notes to the Consolidated Financial Statements
106 (Continued)
(d) Available-for-sale financial assets
(i) Available - for-sale financial assets-current was as follows:
December 31, 2017
Stocks listed on domestic markets $ 38,588
Beneficiary certificate-open-end funds 1,971,967
Total 2,010,555
(ii) These investments were classified as financial assets at fair value through other comprehensive income and financial assets at fair value through profit or loss on December 31, 2018; please refer to note 6(b) and (c).
(iii) For market risk, please refer to note 6(w).
(iv) As of December 31, 2017, the available-for-sale financial assets of the Group had not been pledged as collateral for long-term borrowings.
(e) Notes and accounts receivable
December 31, 2018
December 31, 2017
Notes receivable from operating activities $ 827,518 734,036
Notes receivable from non-operating activities 3 -
Accounts receivable-measured as amortized cost 10,650,136 14,409,370
Accounts receivable from related parties-measured as amortized cost 12,596 28,552
Less: Loss allowance (3,643) (3,600)
$ 11,486,610 15,168,358
The Group applies the simplified approach to provide for its expected credit losses, i.e. the use of lifetime expected loss provision for all receivables on December 31, 2018. To measure the expected credit losses, accounts receivable have been grouped based on shared credit risk characteristics and the days past due, as well as incorporated forward looking information, including macroeconomic and relevant industry information. The loss allowance provision as of December 31, 2018 was de-termined as follows:
Gross carrying amount
Weighted-average loss rate
Loss allowance provision
Current $ 11,062,037 - -
Overdue 1 to 60 days 428,216 0.8507% 3,643
$ 11,490,253 3,643
LARGAN PRECISION CO., LTD. AND SUBSIDIARIES
Notes to the Consolidated Financial Statements
107 (Continued)
As of December 31, 2017, the Group applied the incurred loss model to consider the loss allowance on provision for notes and accounts receivable, and the aging analysis of notes and accounts receiva-ble, which were past due but not impaired, as follows:
December 31, 2017Overdue 1 to 60 days $ 376,093
The movement in the allowance for notes and accounts receivable was as follows:
December 31, 2017
December 31, 2018
Individually assessed im-
pairment
Collectively assessed im-
pairment Balance on January 1, 2018 and 2017 per IAS 39 $ 3,600 3,713 -
Adjustment on initial application of IFRS 9 - - -
Balance on January 1, 2018 per IFRS 9 3,600 - -
Foreign exchange gains/(losses) 43 (113) -
Balance on December 31, 2018 and 2017 $ 3,643 3,600 -
The Group applied the incurred loss model to consider the allowance of its notes and accounts re-ceivable as of December 31, 2017. The allowance for doubtful receivables were assessed by using the reference to collectability of notes and accounts receivable. The Group considered any changes in the credit quality of the accounts receivable since the date credit was initially granted to the end of the reporting period. The Group recognized an allowance for impairment loss of 100% against all receivables over one year due to historical experience showing that such receivables are uncollectible. Allowance for impairment loss was recognized against accounts receivable within a year based on the estimated irrecoverable amounts determined by reference to past default experience of the coun-terparties and an analysis of their current financial position.
Impairment loss recognized for individually assessed impairment is the difference between the car-rying amount and the amount expected to be collected as of December 31, 2017.
The notes and accounts receivable of the Group had not been pledged as collateral as of December 31, 2018 and 2017.
For further credit risk information, please refer to note 6(w).

LARGAN PRECISION CO., LTD. AND SUBSIDIARIES
Notes to the Consolidated Financial Statements
108 (Continued)
(f) Other receivables
December 31, 2018
December 31, 2017
Other accounts receivable-Tax receivables $ 112,000 110,510
Other accounts receivable-Interest receivables 162,430 76,170
Other accounts receivable-Others 193,665 79,010
Other accounts receivable-Related parties 15,638 39,968
$ 483,733 305,658
As of December 31, 2017, the Group had no past due but not impaired other receivables.
The movement in the allowance for other receivables was as follows:
Individually as-sessed impair-
ment
Collectively assessed im-
pairment Balance as of January 1 and December 31, 2017 $ - -
For further credit risk information, please refer to note 6(w).
(g) Inventories
December 31, 2018
December 31, 2017
Finished goods $ 1,591,427 862,465
Work in progress 1,387,913 900,062
Raw materials 861,245 764,575
Supplies 52,765 49,729
Goods - 1
$ 3,893,350 2,576,832
For the years ended December 31, 2018 and 2017, the amounts of inventories that were charged to cost of sales, and the net of provisions that were charged to cost of sales in the consolidated state-ment of comprehensive income for inventories written down to net realizable value, were $690,291 thousand and $1,915,012 thousand, respectively.
As of December 31, 2018 and 2017, the Group did not provide any inventories as collateral for its loans.

LARGAN PRECISION CO., LTD. AND SUBSIDIARIES
Notes to the Consolidated Financial Statements
109 (Continued)
(h) Investments accounted for using equity method
A summary of the Group’s financial information for investments accounted for using equity meth-od at the reporting date is as follows:
December 31, 2018
December 31, 2017
Subsidiaries $ 200,645 160,594
Prepayments for long-term investment 8,800 -
$ 209,445 160,594
The Group’s investments accounted for its subsidiaries were unquoted. The prepayments for long-term investment was used for the investment in Largan Health AI-Tech Co., Ltd., as of December 31, 2018, wherein the registration of incorporation has yet to be completed.
In 2018 and 2017, the Group’s shares on the net income of its subsidiaries was as follows:
2018 2017 The Group's shares on the net income of its subsidiaries $ 47,596 (40,450)
The Group’s financial information for subsidiaries was as follows. The financial information is not adjusted according to the percentage of ownership.
December 31, 2018
December 31, 2017
Total assets $ 931,448 963,155
Total liabilities 31,138 123,087
$ 900,310 840,068
2018 2017 Revenue $ 285,277 433,243
Net income $ 61,890 39,658
As of December 31, 2018 and 2017, the Group did not provide any investment accounted for using equity method as collaterals for its loans.

LARGAN PRECISION CO., LTD. AND SUBSIDIARIES
Notes to the Consolidated Financial Statements
110 (Continued)
(i) Property, plant and equipment
The cost, depreciation, and impairment of the property, plant and equipment of the Group in 2018 and 2017, were as follows:
Land
Building and construction
Machinery and
equipment
Transportationequipment
Office equipment and other facilities
Rental assets
Construction in
progress and testing equip
Total Cost or deemed cost: Balance on January 1, 2018 $ 4,709,398 2,245,588 16,714,374 26,642 5,852,171 54,898 9,074,097 38,677,168 Additions 771,850 231,464 3,295,718 1,777 976,416 - 588,797 5,866,022 Disposal - - (18,587) (2,361) (64,444) - - (85,392) Reclassification - 3,854,971 683,695 - 4,019,632 - (8,569,796) (11,498) ct of movements in exchange rates
- (7,287) (11,251) (154) (4,125) - - (22,817)
Balance on December 31, 2018 $ 5,481,248 6,324,736 20,663,949 25,904 10,779,650 54,898 1,093,098 44,423,483 Balance on January 1,2017 $ 3,694,827 2,214,462 13,780,583 24,361 5,263,065 54,898 6,848,759 31,880,955 Additions 1,014,571 31,386 2,761,975 2,816 607,082 - 2,470,865 6,888,695 Disposal - - (53,558) (464) (26,174) - - (80,196) Reclassification - 3,926 228,364 - 12,752 - (245,527) (485) ct of movements in exchange rates
- (4,186) (2,990) (71) (4,554) - - (11,801)
Balance on December 31, 2017 $ 4,709,398 2,245,588 16,714,374 26,642 5,852,171 54,898 9,074,097 38,677,168 Depreciation and impairment loss: Balance on January 1,2018 $ - 513,206 9,218,425 17,154 4,046,492 20,430 - 13,815,707 Depreciation for the year - 104,182 1,851,978 3,389 873,821 406 - 2,833,776 Disposal - - (15,954) (2,198) (43,629) - - (61,781) Reclassification - - - - (35) - - (35) ffect of movements in exchange rates
- (4,086) (6,559) (109) (3,481) - - (14,235)
Balance on December 31, 2018 $ - 613,302 11,047,890 18,236 4,873,168 20,836 - 16,573,432 Balance on January 1, 2017 $ - 462,333 7,711,501 13,767 3,426,479 20,024 - 11,634,104 Depreciation for the year - 52,793 1,563,254 3,771 649,695 406 - 2,269,919 Disposal - - (53,157) (361) (26,171) - - (79,689) Reclassification - - - - (35) - - (35) Effect of movements in exchange rates - (1,920) (3,173) (23) (3,476) - - (8,592) Balance on December 31, 2017 $ - 513,206 9,218,425 17,154 4,046,492 20,430 - 13,815,707 Carrying amounts: Balance on December 31, 2018 $ 5,481,248 5,711,434 9,616,059 7,668 5,906,482 34,062 1,093,098 27,850,051 Balance on January 1, 2017 $ 3,694,827 1,752,129 6,069,082 10,594 1,836,586 34,874 6,848,759 20,246,851 Balance on December 31,2017 $ 4,709,398 1,732,382 7,495,949 9,488 1,805,679 34,468 9,074,097 24,861,461
In 2013, the Company acquired a piece of land, for the expansion of its factory, amounting to $120,086 thousand, which was recognized under property, plant and equipment. The title of the said land cannot be transferred to the Company due to its classification. Therefore, it was registered under the name of a different person. To ensure the right of both parties (including that of the Com-pany’s shareholders), the two parties entered into an agreement, with the notarization of the court. In the future, the Company will file an application to the relevant authorities, and go through proper procedures, for the land to be reclassified in order to make it possible for the deed to be transferred to the Company.

LARGAN PRECISION CO., LTD. AND SUBSIDIARIES
Notes to the Consolidated Financial Statements
111 (Continued)
(j) Intangible assets
The costs and amortization of the intangible assets of Group in 2018 and 2017 were as follows:
Computer Software
Costs: Balance at January 1, 2018 $ 194,046 Additions 47,712 Disposals (483) Reclassification 10,391 Effect of movement in exchange rates 21 Balance at December 31,2018 $ 251,687 Balance at January 1, 2017 $ 121,718 Additions 79,555 Disposals (7,598) Reclassification 485 Effect of movement in exchange rates (114) Balance at December 31,2017 $ 194,046 Amortization and impairment Loss: Balance at January 1, 2018 $ 109,887 Amortization for the year 61,692 Disposals (483) Reclassification - Effect of movement in exchange rates 25 Balance at December 31, 2018 $ 171,121 Balance at January 1, 2017 $ 86,890 Amortization for the year 30,649 Disposals (7,598) Reclassification 35 Effect of movement in exchange rates (89) Balance at December 31, 2017 $ 109,887 Carrying value: Balance at December 31,2018 $ 80,566 Balance at December 31, 2017 $ 84,159 Balance at January 1,2017 $ 34,828
The following amortizations of intangible assets are included in the statement of comprehensive in-come:
2018 2017 Operating cost $ 21,683 7,713
Operating expense 40,009 22,936
$ 61,692 30,649

LARGAN PRECISION CO., LTD. AND SUBSIDIARIES
Notes to the Consolidated Financial Statements
112 (Continued)
(k) Other current assets and other non-current assets
The other current assets and other non-current assets of the Group were as follows:
December 31, 2018
December 31, 2017
Other current financial assets $ 6,000 45,089
Other current assets 591,812 133,897
Other non-current financial assets 315,296 312,847
Refundable deposits 1,032,378 636,548
Prepayment for equipment 1,437,813 1,327,279
Long-term prepaid rents 13,658 14,437
$ 3,396,957 2,470,097
(i) Other current (non-current) financial assets were restricted deposits pledged as collateral; please refer to note 8.
(ii) Other current assets were off-set against business tax payables and temporary payments.
(iii) Refundable deposits had been pledged as collateral; please refer to note 8.
(iv) Long-term prepaid rents
In order to build a factory, the Group and the Ministry of Land and Resources of the People’s Republic of China signed a contract to obtain access of the land in Tutang Management District, Dongwan City.
(v) For further credit risk information, please refers to note6 (w).
(l) Short-term borrowings
The short-term borrowings were summarized as follows:
December 31, 2018
December 31, 2017
Letters of credit $ 552,868 395,774
Unused credit Lines $ 747,132 904,226
Range of interest rates 0.89%~1.05% 0.88%~0.93%

LARGAN PRECISION CO., LTD. AND SUBSIDIARIES
Notes to the Consolidated Financial Statements
113 (Continued)
(m) Employee benefits
(i) Defined benefit plans
Reconciliation of the defined benefit obligations at present value and plan asset at fair value are as follows:
December 31, 2018
December 31, 2017
Present value of the defined benefit obligations $ 156,042 143,579
Fair value of plan assets (58,201) (53,138)
Net defined benefit liability $ 97,841 90,441
The Company makes defined benefit plan contributions to the pension fund account with Bank of Taiwan that provides pensions for employees upon retirement. Plans (covered by the Labor Standards Law) entitle a retired employee to receive retirement benefits based on years of ser-vice and average salary for the six months prior to retirement.
1) Composition of plan assets
The Company allocates pension funds in accordance with the Regulations for Revenues, Expenditures, Safeguard and Utilization of the Labor Retirement Fund, and such funds are managed by the Bureau of the Labor Funds, Ministry of Labor. With regards to the utilization of the funds, minimum earnings in the annual distribution on the final financial statements shall be no less than the earnings attainable from two-year time deposits with interest rates offered by local banks.
The Company’s Bank of Taiwan labor pension reserve account balance amounted to $57,836 thousand at the end of the reporting period. For information on the utilization of the labor pension fund assets, including the asset allocation and yield of the fund, please refer to the website of the Bureau of Labor Funds, Ministry of Labor.
2) Movements in present value of the defined benefit obligations
The movements in present value of the defined benefit obligations of the Company were as follows:
2018 2017 Defined benefit obligations at January 1 $ 143,579 125,266
Benefit paid by the plan (5,030) (1,808)
Current service costs and interest cost (income) 3,056 2,428
Remeasurements loss (gain): -Financial assumptions 14,437 17,693
Defined benefit obligations at December 31 $ 156,042 143,579

LARGAN PRECISION CO., LTD. AND SUBSIDIARIES
Notes to the Consolidated Financial Statements
114 (Continued)
3) Movements of the fair value of defined benefit plan assets
The movements in the fair value of the defined benefit plan assets of the Company were as follows:
2018 2017 Fair value of plan assets at January 1 $ 53,138 50,576
Contributions paid by the employer 7,955 3,858
Benefits paid from plan assets (5,030) (1,808)
Remeasurements loss (gain):
-Return on plan assets excluding interest in-come 696 594
-Financial assumptions 1,442 (82)
Fair value of plan assets at December 31 $ 58,201 53,138
4) Expenses recognized in profit or loss
The expenses recognized in profits or losses for the years ended December 31, 2018 and 2017, were as follows:
2018 2017 Current service costs $ 916 828
Net interest of net liabilities for the defined bene-fit obligations 2,140 1,601
Remeasurements loss (gain) —Return on plan assets excluding interest
income
(696)
(594)
$ 2,360 1,835
Operating Costs $ 1,806 1,380
Selling expenses 19 18
Administrative expenses 117 95
Research and development expenses 418 342
$ 2,360 1,835
Return on plan assets $ 2,138 512

LARGAN PRECISION CO., LTD. AND SUBSIDIARIES
Notes to the Consolidated Financial Statements
115 (Continued)
5) Remeasurement in net defined benefit liability recognized in other comprehensive in-come
The Company’s remeasurement in the net defined benefit liability recognized in other comprehensive income for the years ended December 31, 2018 and 2017 were as follows:
2018 2017
Accumulated amount at January 1 $ 49,445 31,670
Recognized during the period 12,995 17,775
Accumulated amount at December 31 $ 62,440 49,445
6) Actuarial assumptions
The principal actuarial assumptions at the reporting date were as follows:
December 31, 2018
December 31, 2017
Discount rate 1.375% 1.625%
Increase in future salary rate 2% 2%
The expected allocation payment to be made by the Company to the defined benefit plans for the one year period after the reporting date is $3,090 thousand.
The weighted average lifetime of the defined benefit plans is 18.44 years.
7) Sensitivity analysis
On December 31, 2018 and 2017, if the actuarial assumptions had changed, the impact on the present value of the defined benefit obligation shall be as follows:
Influences of defined benefit obligations Increase0.25% Decrease0.25% December 31, 2018
Discount rate $ (4,356) 4,548
Future salary increases rate 4,412 (4,248)
December 31, 2017
Discount rate $ (4,177) 4,367
Future salary increases rate 4,276 (4,111)
Reasonably possible changes at the reporting date to one of the relevant actuarial as-sumptions, holding other assumptions remain constant, would have affected the defined benefit obligation by the amounts shown above. The method used in the sensitivity anal-ysis is consistent with the calculation of pension liabilities in the balance sheets.

LARGAN PRECISION CO., LTD. AND SUBSIDIARIES
Notes to the Consolidated Financial Statements
116 (Continued)
There were no changes in the method and assumptions used in the preparation of sensi-tivity analysis for 2018 and 2017.
(ii) Defined contribution plans
The Company allocates 6% of each employee’s monthly wages to the labor pension personal account at the Bureau of Labor Insurance in accordance with the provisions of the Labor Pen-sion Act. Under these defined contribution plans, the Company allocates a fixed amount to the Bureau of Labor Insurance without additional legal or constructive obligation.
The pension costs incurred from the contributions to the Bureau of the Labor Insurance amounted to $159,102 thousand and $133,863 thousand for the years ended December 31, 2018 and 2017, respectively.
Except for the Company, other subsidiaries adopted the defined contribution method under their local law, wherein the pension costs amounted to $23,915 thousand and $30,231 thousand for the years ended December 31, 2018 and 2017, respectively.
(iii) Short-term employee benefit
The Company’s employee benefit liabilities were as follows:
December 31, 2018
December 31, 2017
Compensated absences liability $ 82,213 69,307
(n) Income taxes
According to the amendments to the "Income Tax Act” enacted by the office of the President of the Republic of China (Taiwan) on February 7, 2018, an increase in the corporate income tax rate from 17% to 20% is applicable commencing 2018.
(i) Income tax expense
The components of income tax in the years 2018 and 2017 were as follows:
2018 2017 Current tax expense:
Current period $ 5,731,915 4,919,157
10% surtax on unappropriated earnings 1,174,827 1,144,521
Adjustment for prior periods (60,007) (15,060)
Deferred tax expense:
Origination and reversal of temporary differences 44,351 (64,720)
Adjustment in tax rate (64,749) -
$ 6,826,337 5,983,898

LARGAN PRECISION CO., LTD. AND SUBSIDIARIES
Notes to the Consolidated Financial Statements
117 (Continued)
Reconciliation of income tax and profit before tax 2018 and 2017 is as follows:
2018 2017 Profit before income tax $ 31,195,871 31,959,521
Income tax using the Company's domestic tax rate 6,239,174 5,433,119
Effect of tax rates in foreign jurisdiction (not applica-ble for separate financial statements) 209,271 265,791
Adjustment in tax rate (64,749) -
Investment tax credits (239,818) (198,114)
Changes in unrecognized temporary differences (429,859) (381,995)
Gains on disposal of investment (2,962) (2,982)
Five-year exemption - (264,931)
Others income tax adjustments 232 3,339
Current-year losses for which no deferred tax asset was recognized
228
210
Changes in provision in prior periods (60,007) (15,060)
10% surtax on unappropriated earnings 1,174,827 1,144,521
Total $ 6,826,337 5,983,898
(ii) Deferred tax assets and liabilities
1) Unrecognized deferred tax liabilities
The consolidated entity is able to control the timing of the reversal of the temporary dif-ferences associated with the investments in subsidiaries as of December 31, 2018 and 2017. Also, the management considers it probable that the temporary differences will not reverse in the foreseeable future. Hence, such temporary differences are not recognized under deferred tax liabilities. Details are as follows:
December 31, 2018
December 31, 2017
Aggregated amount of temporary differences re-lated to investments in subsidiaries $ 30,739,784 28,134,950

LARGAN PRECISION CO., LTD. AND SUBSIDIARIES
Notes to the Consolidated Financial Statements
118 (Continued)
2) Recognized deferred tax assets and liabilities
Changes in the amount of deferred tax assets and liabilities for 2018 and 2017 were as follows:
Deferred Tax Assets:
Unrealized profit from associates
Others
Total
Balance at January 1, 2018 $ 224,749 142,762 367,511
Recognized profit or loss 63,172 (27,811) 35,361
Balance at December 31, 2018 $ 287,921 114,951 402,872
Balance at January 1, 2017 $ 225,739 87,842 313,581
Recognized profit or loss (990) 54,920 53,930
Balance at December 31, 2017 $ 224,749 142,762 367,511
Deferred Tax Liabilities:
Unrealized ex-change gains
Other
Total
Balance at January 1, 2018 $ - 598 598
Recognized profit or loss 13,738 1,224 14,962
Balance at December 31, 2018 $ 13,738 1,822 15,560
Balance at January 1, 2017 $ 11,135 253 11,388
Recognized profit or loss (11,135) 345 (10,790)
Balance at December 31, 2017 $ - 598 598
3) Assessment of tax
The Company’s tax returns for the years through 2016 were assessed by the Taipei Na-tional Tax Administration.
(o) Other payables
The other payables were summarized as follows:
December 31, 2018
December 31, 2017
Payables on remuneration to employees, directors and supervisors $ 14,574,957 12,626,213
Payables for plant and equipment 2,064,523 2,592,704
Others 1,627,347 1,689,524
$ 18,266,827 16,908,441

LARGAN PRECISION CO., LTD. AND SUBSIDIARIES
Notes to the Consolidated Financial Statements
119 (Continued)
(p) Capital and other equity
(i) Ordinary Shares
As of December 31, 2018 and 2017, the Company's authorized ordinary shares each amounted to $2,000,000 thousand (including the amount of $100,000 thousand allocated for the exer-cise of employee stock options), and the outstanding ordinary shares each amounted to $1,341,402 thousand, with a par value of $10 per share.
(ii) Capital Surplus
The balance of capital surplus was as following:
December 31, 2018
December 31, 2017
Additional paid-in capital $ 817,574 817,574
Capital surplus-premium from merger 738,155 738,155
Dividend timeout not received by shareholder 1,282 659
$ 1,557,011 1,556,388
According to the R.O.C. Company Act, capital surplus can only be used to offset a deficit, and only the realized capital surplus can be used to increase the common stock or be distributed as cash dividends. The aforementioned realized capital surplus includes capital surplus resulting from premium on issuance of capital stock and earnings from donated assets received. Accord-ing to the Regulations Governing the Offering and Issuance of Securities by Securities Issuers, capital increases by transferring capital surplus in excess of par value should not exceed 10% of the total common stock outstanding.
(iii) Retained earnings
The Company's article of incorporation stipulate that Company's net earnings should first be used to offset the prior years' deficits, if any, before paying any income taxes. Of the remaining balance, 10% is to be appropriated as legal reserve until the accumulated legal reserve equals the Company's paid-in capital. In addition, a special reserve, in accordance with applicable laws and regulations, shall also be set aside. Then, any remaining profit, together with any un-distributed retained earnings, shall be distributed according to the distribution plan proposed by the Board of Directors and submitted to the stockholders’ meeting for approval.
Before the distribution of dividends, the Company shall first take into consideration its operating environment, industry developments, and the long-term interests of its stockholders, as well as its programs to maintain its operating efficiency and meet its capital expenditure budget and financial goals in determining the stock or cash divi-dends to be paid. After the above appropriations, dividend to be distributed shall be no less than 10% of the current-year retained earnings available for distribution. The cash dividends shall not be less than 30% of the total dividends.

LARGAN PRECISION CO., LTD. AND SUBSIDIARIES
Notes to the Consolidated Financial Statements
120 (Continued)
1) Legal reserve
According to the amendment of the R.O.C. Company Act, the Company must retain 10% of its after-tax annual earnings as legal reserve until such retention equals the amount of total capital. When a company incurs no loss, it may, pursuant to a resolution by a share-holders’ meeting, distribute its legal reserve by issuing new shares or by distributing cash, and only the portion of legal reserve which exceeds 25% of capital may be distrib-uted.
2) Special reserve
In accordance with the regulation set by the Financial Supervisory Commission, a portion of current period earnings and undistributed prior period earnings shall be reclassified as a special earnings reserve during earnings distribution. Amounts of subsequent reversals pertaining to the net reduction of other shareholders’ equity shall qualify for additional distributions. The special reserve for the years ended December 31, 2018 and 2017 were $2,370,825 thousand and $486,837 thousand, respectively.
3) Earnings distribution
The earnings distribution for 2017 and 2016 were decided by the general meeting of the shareholders held on June 12, 2018 and June 14, 2017 as follows:
2017 2016 Amount
per share Total
amount Amount
per share Total
amount Dividends distributed to
common shareholders:
Cash $ 72.5 9,725,164 63.5 8,517,903
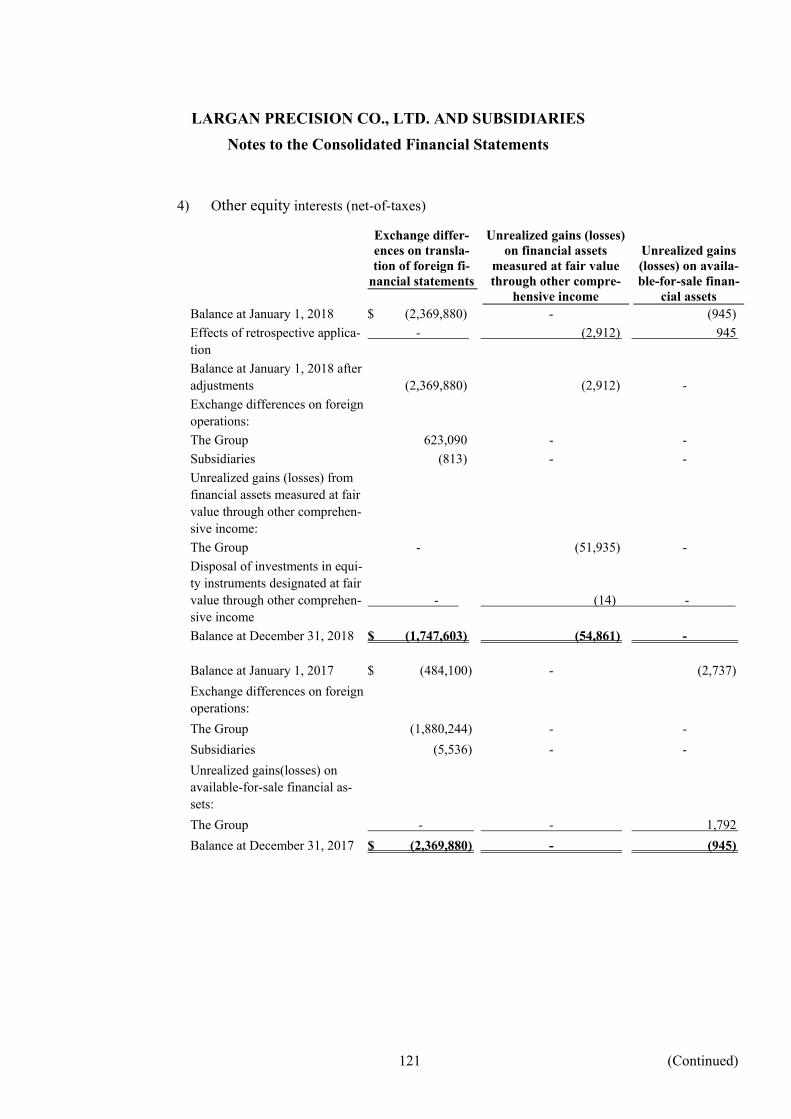
LARGAN PRECISION CO., LTD. AND SUBSIDIARIES
Notes to the Consolidated Financial Statements
121 (Continued)
4) Other equity interests (net-of-taxes)
Exchange differ-ences on transla-tion of foreign fi-
nancial statements
Unrealized gains (losses) on financial assets
measured at fair value through other compre-
hensive income
Unrealized gains (losses) on availa-ble-for-sale finan-
cial assets Balance at January 1, 2018 $ (2,369,880) - (945)
Effects of retrospective applica-tion
- (2,912) 945
Balance at January 1, 2018 after adjustments (2,369,880) (2,912) -
Exchange differences on foreign operations:
The Group 623,090 - -
Subsidiaries (813) - -
Unrealized gains (losses) from financial assets measured at fair value through other comprehen-sive income:
The Group - (51,935) -
Disposal of investments in equi-ty instruments designated at fair value through other comprehen-sive income
-
(14)
-
Balance at December 31, 2018 $ (1,747,603) (54,861) -
Balance at January 1, 2017 $ (484,100) - (2,737)
Exchange differences on foreign operations:
The Group (1,880,244) - -
Subsidiaries (5,536) - -
Unrealized gains(losses) on available-for-sale financial as-sets:
The Group - - 1,792
Balance at December 31, 2017 $ (2,369,880) - (945)

LARGAN PRECISION CO., LTD. AND SUBSIDIARIES
Notes to the Consolidated Financial Statements
122 (Continued)
(q) Earnings per share
The calculation of basic earnings per share and diluted earnings per share for years 2018 and 2017 were as follows:
2018 2017
Basic earnings per share
Profit of the Company for the year $ 24,369,534 25,975,623
Weighted-average number of outstanding ordinary shares
(in thousands)
134,140
134,140
$ 181.67 193.65
Diluted earnings per share
Profit of the Company for the year $ 24,369,534 25,975,623
Weighted-average number of outstanding ordinary shares (in
thousands)
134,140 134,140
Effect of dilutive potential common shares (thousand
shares)
Effect of employee share bonus 1,212 1,309
Weightier-average number of ordinary shares (in thousands)
(after adjustment of potential diluted ordinary shares) 135,352 135,449
$ 180.05 191.77
(r) Revenue from contracts with customers
Disaggregation of revenue
2018 Primary geographical markets
China $ 28,516,473
Japan 9,849,805
Korea 7,234,540
Other 4,351,340
$ 49,952,158
Major products
Optical lens $ 49,952,158
For details on revenue in 2017, please refer to note 6 (s).

LARGAN PRECISION CO., LTD. AND SUBSIDIARIES
Notes to the Consolidated Financial Statements
123 (Continued)
(s) Revenue
The details of revenue for the years ended December 31, 2017 were as follows:
2017 Sale of goods $ 53,127,510
For details on revenue in 2018, please refer to note 6 (r).
(t) Employee compensation and directors’ and supervisors’ remuneration
According to the Company’s articles of incorporation, the Company should distribute its remunera-tion of not less than 1%~30% and not more than 5% of annual profits to its employees and directors respectively, after offsetting accumulated deficits, if any. Employees, including employees of affili-ate companies that meet certain conditions, are subject to the abovementioned remuneration, which is to be distributed in stock or cash.
For the year ended December 31, 2018 and 2017, the Company estimated its employee remuneration amounting to $4,383,828 thousand and $4,677,131 thousand, and directors' and supervisors' remu-neration amounting to $328,787 thousand and $350,785 thousand, respectively. The estimated amounts mentioned above are calculated based on the net profit before tax, excluding the remunera-tion to employees, directors and supervisors of each period, multiplied by the percentage of remuner-ation to employees, directors and supervisors as specified in the Company's articles. These remunera-tions were expensed under operating costs or operating expenses during 2018 and 2017. The amounts, as stated in the consolidated financial statements, are identical to those of the actual distributions for 2018 and 2017.
(u) Non-operating income and expenses
(i) Other income
The details of other income for the years 2018 and 2017 were as follows:
2018 2017 Interest income-bank deposits $ 1,182,871 656,050
Rent income 9,881 7,419
$ 1,192,752 663,469

LARGAN PRECISION CO., LTD. AND SUBSIDIARIES
Notes to the Consolidated Financial Statements
124 (Continued)
(ii) Other gains and losses
The details of other gains and losses for the years 2018 and 2017 were as follows:
2018 2017 Foreign exchange gains (loss) $ 237,386 (944,823)
Gains (Losses) on disposals of property, plant and equipment
(22,971)
3,647
Gains on disposals of available-for-sale financial assets
-
17,541
Gains on disposals of financial assets at fair value through profit or loss
14,809
-
Losses on financial assets at fair value through profit or loss
(1,157) -
Others 115,516 166,835
$ 343,583 (756,800)
(v) Reclassification adjustments on components of other comprehensive income
The details of the reclassification adjustments on components of other comprehensive income for the years 2018 and 2017 were as follows:
2018 2017 Available-for-sale financial assets
Net change in fair value $ - 19,333
Net change in fair value reclassified to profit or loss
-
(17,541)
Net change in fair value recognized in other com-prehensive income
$ -
1,792
(w) Financial Instruments
(i) Credit risk
1) Credit risk exposure
The carrying amount of financial assets represents the maximum amount exposed to credit risk.
2) Concentration of credit risk
To minimize credit risk, the Group periodically evaluates the Company’s financial posi-tions and the possibility of collecting trade receivables. Besides, the Group monitors and reviews the recoverable amount of its trade receivables to ensure the uncollectible amount are recognized appropriately as impairment loss. As of December 31, 2018 and 2017, 75% and 86%, respectively, of accounts receivable were derived from several ma-jor customers. Thus, the credit risk is significantly centralized.

LARGAN PRECISION CO., LTD. AND SUBSIDIARIES
Notes to the Consolidated Financial Statements
125 (Continued)
3) Receivables
For credit risk exposure of notes and accounts receivable, please refer to note 6 (e). Other financial assets at amortized cost includes other receivables, refundable deposits and other financial assets. For the details and loss allowance on December 31, 2017, please refer to note 6 (f). All of these financial assets are considered to have low risk, and thus, the impairment provision recognized during the period was limited to 12 months expected losses. Regarding how the financial instruments are considered to have low credit risk, please refer to note 4 (g). The loss allowance provision as of December 31, 2018 was determined as follows:
Other financial assets at amor-
tized cost Balance on January 1 per IAS 39 $ -
Adjustment on initial application of IFRS 9 -
Balance on January 1 per IFRS 9 -
Impairment loss recognized -
Balance on December 31 $ -
(ii) Liquidity risk
The following table shows the contractual maturities of financial liabilities, without the impact of netting agreements.
Carrying amount
Contractual cash flows
Within a year
Over 1 year
December 31, 2018
Non-derivative financial liabilities
Short-term borrowings $ 552,868 552,868 552,868 -
Accounts and notes payable (in-cluding related parties) 1,806,007 1,806,007 1,806,007 -
Other payables (including related parties) 3,082,982 3,082,982 3,082,982 -
Guarantee deposits received 4,473 4,473 - 4,473
$ 5,446,330 5,446,330 5,441,857 4,473
December 31, 2017
Non-derivative financial liabilities
Short-term borrowings $ 395,774 395,774 395,774 -
Accounts and notes payable (in-cluding related parties) 2,173,952 2,173,952 2,173,952 -
Other payables (including related parties) 3,760,896 3,760,896 3,760,896 -
Guarantee deposits received 3,257 3,257 - 3,257
$ 6,333,879 6,333,879 6,330,622 3,257

LARGAN PRECISION CO., LTD. AND SUBSIDIARIES
Notes to the Consolidated Financial Statements
126 (Continued)
The Group does not expect the cash flows included in the maturity analysis to occur sig-nificantly earlier or at significantly different amounts.
(iii) Currency risk
1) Exposure to foreign currency risk
The Group’s significant exposure to foreign currency risk was as follows:
December 31, 2018 December 31, 2017 Foreign
Currency Exchange
Rates New Taiwan
Dollars Foreign
Currency Exchange
Rates New Taiwan
Dollars Financial Assets
Monetary items
USD $ 577,484 30.715 17,737,417 629,705 29.76 18,740,021
JPY 4,131,745 0.2782 1,149,451 3,163,929 0.2642 835,910
CNY 3,034,324 4.472 13,569,499 1,878,255 4.565 8,574,234
Financial Liabilities
Monetary items
USD 69,235 30.715 2,126,550 134,044 29.76 3,989,159
JPY 3,503,465 0.2782 974,664 3,706,381 0.2642 979,226
2) Sensitivity analysis
The Group’s exposure to foreign currency risk arises from the translation of the foreign currency exchange gains and losses on cash and cash equivalents, accounts and other re-ceivables, and accounts and other payables that are denominated in foreign currency. A strengthening (weakening) 1% of the TWD against the USD, JPY, and CNY as of De-cember 31, 2018 and 2017 would have increased (decreased) the net profit after tax by $234,841 thousand and $192,409 thousand, respectively. The analysis assumes that all other variables remain constant and ignores any impact of forecasted sales and purchases. The analysis is performed on the same basis for both periods.
3) Foreign exchange gain and loss on monetary items
Since the Group has many kinds of functional currency, the information on foreign ex-change gain (loss) on monetary items is disclosed by total amount. For the years 2018 and 2017, the foreign exchange gain (loss) (including realized and unrealized portions) amounted to $237,386 thousand and $(944,823) thousand, respectively.
(iv) Interest rate analysis
Please refer to the note on liquidity risk management and the interest rate exposure of the Group’s financial assets and liabilities.
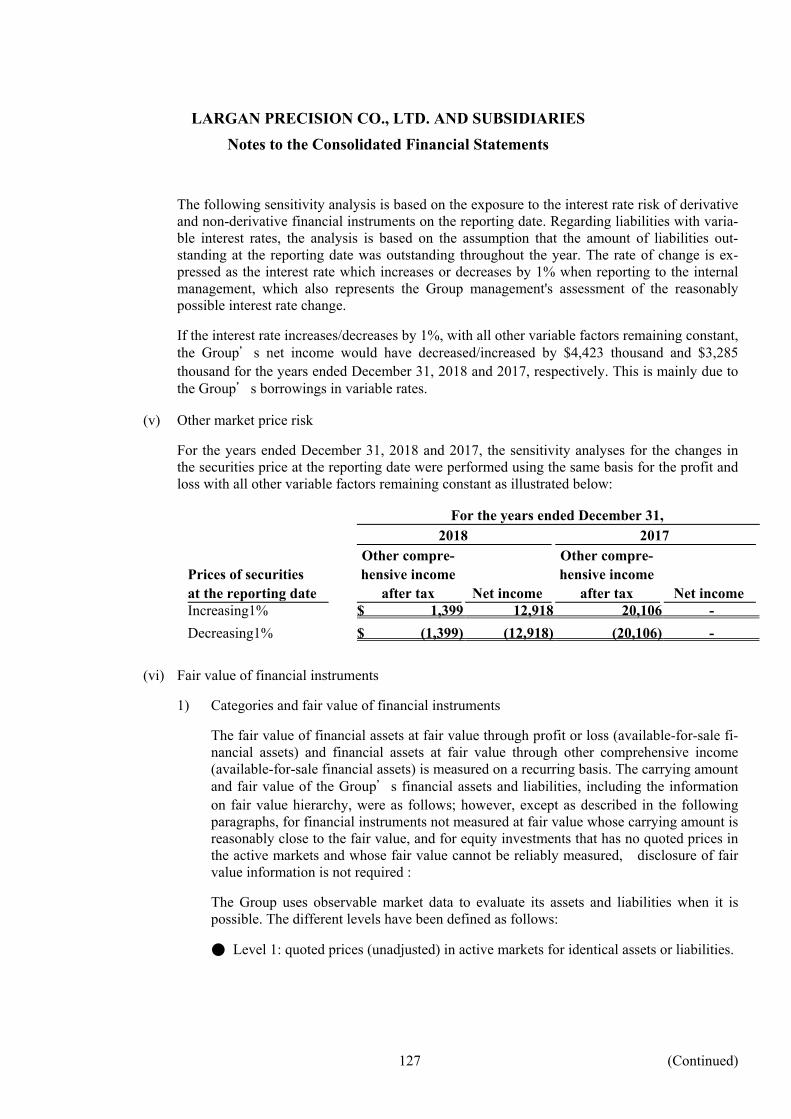
LARGAN PRECISION CO., LTD. AND SUBSIDIARIES
Notes to the Consolidated Financial Statements
127 (Continued)
The following sensitivity analysis is based on the exposure to the interest rate risk of derivative and non-derivative financial instruments on the reporting date. Regarding liabilities with varia-ble interest rates, the analysis is based on the assumption that the amount of liabilities out-standing at the reporting date was outstanding throughout the year. The rate of change is ex-pressed as the interest rate which increases or decreases by 1% when reporting to the internal management, which also represents the Group management's assessment of the reasonably possible interest rate change.
If the interest rate increases/decreases by 1%, with all other variable factors remaining constant, the Group’s net income would have decreased/increased by $4,423 thousand and $3,285 thousand for the years ended December 31, 2018 and 2017, respectively. This is mainly due to the Group’s borrowings in variable rates.
(v) Other market price risk
For the years ended December 31, 2018 and 2017, the sensitivity analyses for the changes in the securities price at the reporting date were performed using the same basis for the profit and loss with all other variable factors remaining constant as illustrated below:
For the years ended December 31, 2018 2017
Prices of securities at the reporting date
Other compre-hensive income
after tax
Net income
Other compre-hensive income
after tax
Net income Increasing1% $ 1,399 12,918 20,106 -
Decreasing1% $ (1,399) (12,918) (20,106) -
(vi) Fair value of financial instruments
1) Categories and fair value of financial instruments
The fair value of financial assets at fair value through profit or loss (available-for-sale fi-nancial assets) and financial assets at fair value through other comprehensive income (available-for-sale financial assets) is measured on a recurring basis. The carrying amount and fair value of the Group’s financial assets and liabilities, including the information on fair value hierarchy, were as follows; however, except as described in the following paragraphs, for financial instruments not measured at fair value whose carrying amount is reasonably close to the fair value, and for equity investments that has no quoted prices in the active markets and whose fair value cannot be reliably measured, disclosure of fair value information is not required :
The Group uses observable market data to evaluate its assets and liabilities when it is possible. The different levels have been defined as follows:
● Level 1: quoted prices (unadjusted) in active markets for identical assets or liabilities.

LARGAN PRECISION CO., LTD. AND SUBSIDIARIES
Notes to the Consolidated Financial Statements
128 (Continued)
● Level 2: inputs other than quoted prices included within Level 1 that are observable for the asset or liability, either directly (i.e. as prices) or indirectly (i.e. de-rived from prices).
● Level 3: inputs for the assets or liability that are not based on observable market data (unobservable inputs).
The categories and fair value of financial instruments were as follows:
December 31, 2018 Fair Value Book Value Level 1 Level 2 Level 3 Total Financial assets at fair value through
profit or loss
Non derivative financial assets manda-
torily measured at fair value through
profit or loss
$ 1,291,809
1,291,809
-
-
1,291,809
Financial assets at fair value through
other comprehensive income
Stocks listed on domestic and foreign
markets 139,944 139,944 - - 139,944
Financial assets measured at amortized
cost
Cash and cash equivalents 83,403,426 - - - -
Notes and accounts receivable and other
receivables (including related parties
and excluding tax receivable)
11,858,343
-
-
-
-
Other financial assets-current and
non-current 321,296 - - - -
Refundable deposits 1,032,378 - - - - Subtotal 96,615,443 - - - -
Total $ 98,047,196 1,431,753 - - 1,431,753
Financial liabilities at amortized cost
Short-term borrowings $ 552,868 - - - -
Notes and accounts payable
(including related parties) 1,806,007 - - - -
Other payables
(including related parties) 3,082,982 - - - -
Guarantee deposits received 4,473 - - - -
Total $ 5,446,330 - - - -

LARGAN PRECISION CO., LTD. AND SUBSIDIARIES
Notes to the Consolidated Financial Statements
129 (Continued)
December 31, 2017
Fair Value Book Value Level 1 Level 2 Level 3 Total
Available-for sale financial assets $ 2,010,555 2,010,555 - - 2,010,555 Loans and receivable
Cash and cash equivalent 67,896,008 - - - -
Notes and accounts receivable and
other receivables (including related
parties and excluding tax receiva-
ble) 15,363,507 - - - -
Other financial assets-current and
non-current 357,936 - - - -
Refundable deposits 636,548 - - - - Subtotal 84,253,999 - - - -
Total $ 86,264,554 2,010,555 - - 2,010,555
Financial liabilities at amortized cost
Short-term borrowings $ 395,774 - - - -
Notes and accounts payable
(including related parties) 2,173,952 - - - -
Other payables
(including related parties)
3,760,896 - - - -
Guarantee deposits received 3,257 - - - -
Total $ 6,333,879 - - - -
2) Valuation techniques of financial instruments not measured at fair value
The Group estimates its financial instruments, that are not measured at fair value, by methods and assumption as follows:
If there is quoted price generated by transactions for financial liabilities at amortized cost, the recent transaction price and quoted price data is used as the basis for fair value meas-urement. However, if no quoted prices are available, the discounted cash flows are used to estimate fair values. In addition, if the expiration date is approaching, or the future payable or receivable price is similar to the carrying amount, the fair value shall be as-sumed in the carrying amount in the balance sheets.
3) Valuation techniques for financial instruments measured at fair value.
Non-derivative financial instruments
Financial instruments traded in active markets are based on quoted market prices. The quoted price of a financial instrument obtained from main exchanges and on-the-run bonds from Taipei Exchange can be used as a basis to determine the fair value of the listed companies’ equity instrument and debt instrument of the quoted price in an ac-tive market.

LARGAN PRECISION CO., LTD. AND SUBSIDIARIES
Notes to the Consolidated Financial Statements
130 (Continued)
If a quoted price of a financial instrument can be obtained in time and often from ex-changes, brokers, underwriters, industrial union, pricing institute, or authorities, and such price can reflect those actual trading and frequently happen in the market, then the finan-cial instrument is considered to have a quoted price in an active market. If a financial in-strument is not in accord with the definition mentioned above, then it is considered to be without a quoted price in an active market. In general, market with low trading volume or high bid-ask spreads is an indication of a non-active market.
The fair value of the listed common shares and funds held by the Group are determined by reference to the market quotation.
4) Transfer between Level 1 and Level 2
There were no transfers from one level to another level in 2018 and 2017.
(x) Financial risk management
(i) Overview
The Group is exposed to the following risks from its financial instruments:
1) Credit risk
2) Liquidity risk
3) Market risk
In this note expressed the information on risk exposure and objectives, policies and procedures of risk measurement and management. For detailed information, please refer to the related notes of each risk.
(ii) Structure of risk management
The Group’s finance management department provides business services for the overall in-ternal department. It sets the objectives, policies and processes for managing the risk and the methods used to measure the risk arising from both the domestic and international financial market operations. The Group minimizes the risk exposure through derivative financial instru-ments. The Board of Directors regulates the use of derivative financial instruments in accord-ance with the Group’s policy on risks arising from financial instruments such as currency risk, interest rate risk, credit risk, the use of derivative and non-derivative financial instruments, and the investments of excess liquidity. The internal auditors of the Group continue to review the amount of the risk exposure in accordance with the Group’s policies and the risk manage-ment's policies and procedures. The Group has no transactions in financial instruments (in-cluding derivative financial instruments) for the purpose of speculation.
(iii) Credit risk
Credit risk is the risk of financial loss to the Group if a customer or counterparty to a financial instrument fails to meet its contractual obligations, and arises principally from the Group’s receivables from customers and investment securities.

LARGAN PRECISION CO., LTD. AND SUBSIDIARIES
Notes to the Consolidated Financial Statements
131 (Continued)
1) Accounts receivable and other receivables
The Group's customers is significantly concentrated in a few customers, In order to re-duce credit risk, the Group continuously evaluates the financial status of its major cus-tomers and their condition, and also regularly assesses the possibility of receivables re-covery.
The Group did not have any collateral or other credit enhancement to avoid credit risk of the financial assets.
The Group has losses allowance for bad debts to reflect the estimated losses of its ac-counts receivable, other receivables and investments. The main components of the al-lowance account contain specific losses associated with individual major risks. The component, and the component of the combined loss established for the loss of a similar group of assets, has occurred but not yet identified. The loss allowance account is based on the occurring risk of a default and the rate of expected credit loss.
2) Investments
The exposure to credit risk for bank deposits, fixed income investments, and other finan-cial instruments, is measured and monitored by the Group’s finance department. The Group only deals with banks, other external parties, corporate organizations, government agencies and financial institutions with good credit rating. The Group does not expect any of the counterparties above to fail in meeting their obligations; hence, there is no signifi-cant credit risk arising from these counterparties.
(iv) Liquidity risk
Liquidity risk is the risk that the Group will encounter difficulty in meeting the obligations as-sociated with its financial liabilities that are settled by delivering cash or another financial asset. The Group’s approach to managing liquidity is to ensure, as far as possible, that it always has sufficient liquidity to meet its liabilities when due, under both normal and stressed conditions, without incurring unacceptable losses or risking damage to the Group’s reputation.
(v) Market risk
Market risk is the risk that changes in market prices, such as foreign exchange rates, interest rates, and equity prices, that will affect the Group’s income or the value of its holdings of fi-nancial instruments. The objective of market risk management is to manage and control market risk exposures within acceptable parameters, while optimizing the return.
1) Currency risk
The Group is exposed to currency risk on sales, purchases and borrowings that are de-nominated in a currency other than the respective functional currencies of the Group’s entities, primarily the New Taiwan Dollars (NTD). The currencies used in these transac-tions are the NTD, USD, CNY and JPY.

LARGAN PRECISION CO., LTD. AND SUBSIDIARIES
Notes to the Consolidated Financial Statements
132 (Continued)
2) Interest rate risk
Please refer to note on the liquidity risk for interest rate risk of financial assets and finan-cial liabilities.
3) Other market price risk
Please refer to note 6(w) for the sensitivity analysis of equity price risk.
(y) Capital management
The Group must maintain sufficient capital to establish and expand production capacity and equip-ment. Because the optical lens industry is highly subject to fluctuations in the booming cycle; the capital management of the Group is to ensure that it has sufficient and necessary financial resources to support its working capital requirements, capital expenditures, research and development activities, dividends and other business needs in the next 12 months.
(z) Investing and financing activities not affecting current cash flow
During 2018 and 2017, the Group’s investment activity (without affecting its current cash flow) was to acquire equipment under finance lease.
Reconciliation of liabilities arising from financing activities were as follows:
Non-cash changes
January 1,
2018
Cash flows
Foreign exchange movement
Fair value changes
December 31, 2018
Short-term borrowings $ 395,774 137,000 20,094 - 552,868
Guarantee deposits received 3,257 1,216 - - 4,473
Total liabilities from financing
activities $ 399,031 138,216 20,094 - 557,341

LARGAN PRECISION CO., LTD. AND SUBSIDIARIES
Notes to the Consolidated Financial Statements
133 (Continued)
(7) Related-party transactions
(a) Names and relationship with related parties
The followings are entities that have had transactions with related party during the periods covered in the consolidated financial statements.
Name of related party Relationship with the Group Largan Digital Co., Ltd. (Largan Digital) Subsidiaries Largan Medical Co., Ltd. (Largan Medical) Subsidiaries
Largan Health Technology Inc. (LHT) Subsidiaries
Nanjing Largan Health Technology Co., Ltd. (Nanjing Largan Health)
Subsidiaries
Largan Health Technology Co., Ltd. (Largan Health )
Subsidiaries

LARGAN PRECISION CO., LTD. AND SUBSIDIARIES
Notes to the Consolidated Financial Statements
134 (Continued)
(b) Significant related-party transactions
(i) Sale of goods to related parties
The amounts of significant sales and receivables by the Group to its related parties were as fol-lows:
Sale Receivables from relate parties
2018
2017 December 31,
2018 December 31,
2017 Subsidiaries $ 88,283 72,674 12,596 28,522
The sales price of the Group to its related parties is not comparable to other sales due to the differences in the sales of the goods. During 2018 and 2017, the collection terms for sales to related parties were month-end 30 to 60 days, which were not materially different from those of the third parties.
(ii) Purchases from related parties
The amounts of significant purchases and payables by the Group from its related parties were as follows:
Purchases Payables to related-parties
2018
2017 December 31, 2018
December 31, 2017
Subsidiaries $ 204,949 268,429 10,469 21,890
The purchases price of the Group to its related parties is not comparable to other purchases due to the differences in the purchases of the goods. During 2018 and 2017, the payment terms for purchases to related parties were month-end 30 to 60 days, which were not materially dif-ferent from those of the third parties.
(iii) Provides and purchase technical services to related parties
During 2018 and 2017, the Group's income from providing technical services to its related par-ties were as follows (classified under the other gains):
2018 2017 Subsidiaries-Largan Medical $ 49,865 32,156
During 2018 and 2017, the Group's expense from technical services from its related parties were as follows (classified under the other expense):
2018 2017 Subsidiaries-Largan Digital $ 3,168 2,929

LARGAN PRECISION CO., LTD. AND SUBSIDIARIES
Notes to the Consolidated Financial Statements
135 (Continued)
(iv) Purchases and disposals of property, plant and equipment
1) During 2018 and 2017, the Group's disposals of its equipment to its related parties are summarized as follows:
2018 2017
Subsidiaries:
Carrying amount
Disposal
price
Gain from
disposal
Carrying amount
Disposal
price
Gain from
disposal
Largan Digital $ 68 73 5 148 156 8 Largan Medical 38 38 - 118 128 10 Nanjing Largan Health 35 61 26 - - - $ 141 172 31 266 284 18
2) During 2018 and 2017, the Group's purchase of its equipment from its related parties are summarized as follows:
2018 2017 Subsidiaries $ 102,551 123,174
3) During 2018 and 2017, the Group assisted its related parties to purchase other facilities as follows:
2018 2017
Subsidiaries-Largan Digital $ 1,048 69,274
Subsidiaries-Largan Medical 7,654 13,003
$ 8,702 82,277
(v) Rental income
During 2018 and 2017, the Group's rental income on offices to the subsidiaries are summarized as follows:
2018 2017
Subsidiaries-Largan Digital $ 2,694 1,474
Subsidiaries-Largan Medical 3,415 2,585
$ 6,109 4,059

LARGAN PRECISION CO., LTD. AND SUBSIDIARIES
Notes to the Consolidated Financial Statements
136 (Continued)
(vi) Other
For the years ended December 31, 2018 and 2017, the amounts of receivables and payables from property transactions、rental income, technical service and other transactions, which were classified under other receivables from related parties, and other payables to related parties, are summarized as follows:
December 31, 2018 December 31, 2017 other re-
ceivables from related
parties
other payables to related
parties
other re-ceivables
from related parties
other pay-ables to related parties
Subsidiar-
ies-Largan Digital
$ 1,961 472 35,691 455
Subsidiar-
ies-Largan Medical
13,617 68 4,217 10
Subsidiaries-LHT 60 - 60 -
$ 15,638 540 39,968 465
(c) Key management personnel compensation
Key management personnel compensation comprised the following:
2018 2017 Short-term employee benefits $ 247,236 221,721
Post-employment benefits 338 326
Other long-term benefits - -
Termination benefits - -
Share-based payments - -
$ 247,574 222,047

LARGAN PRECISION CO., LTD. AND SUBSIDIARIES
Notes to the Consolidated Financial Statements
137 (Continued)
(8) Pledged assets:
The carrying values of pledged assets were as follow:
Pledged assets
Object
December 31, 2018
December 31, 2017
Time deposit (classified
under other current as-
sets)
Customs office deposit
$ 6,000 6,000
Time deposit (classified
under other current as-
sets)
Completion deposit
- 7,133
Time deposit (classified
under other current as-
sets)
Customs deposit
- 31,956
Time deposit (classified
under other non-current
assets)
Litigation deposit
1,021,711 625,711
Time deposit (classified
under other non-current
assets)
Completion deposit
315,296 312,847
$ 1,343,007 983,647
(9) Commitments and contingencies
(i) As at December 31, 2018 and 2017, the Group’s outstanding letters of credit were $40,317 thousand and $0, respectively.
(ii) As at December 31, 2018 and 2017, the Group’s outstanding purchase commitments for construction in progress, property and plant were $2,106,300 thousand and $2,738,897 thousand, respectively;The amount of construction that has not yet oc-curred were $261,638 thousand and $712,159 thousand, respectively.
(10) Losses Due to Major Disasters: None
(11) Subsequent Events: None
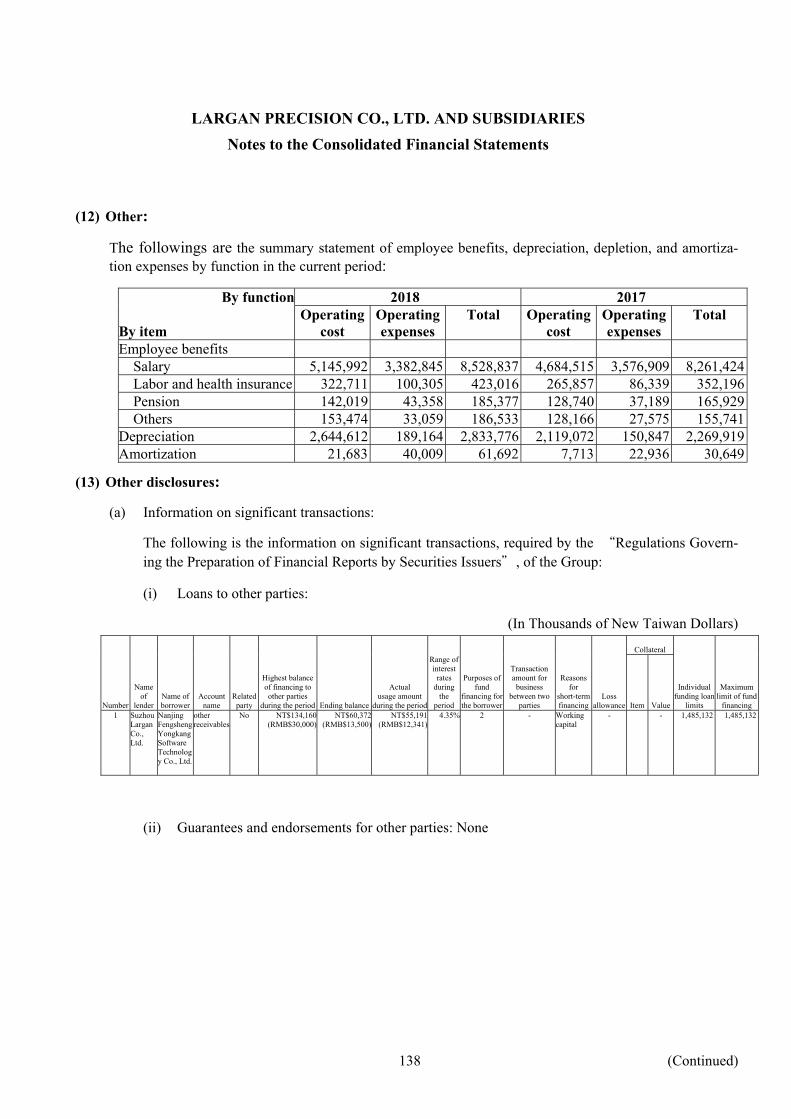
LARGAN PRECISION CO., LTD. AND SUBSIDIARIES
Notes to the Consolidated Financial Statements
138 (Continued)
(12) Other:
The followings are the summary statement of employee benefits, depreciation, depletion, and amortiza-tion expenses by function in the current period:
By function 2018 2017
By item Operating
cost Operating expenses
Total Operating cost
Operating expenses
Total
Employee benefits Salary 5,145,992 3,382,845 8,528,837 4,684,515 3,576,909 8,261,424 Labor and health insurance 322,711 100,305 423,016 265,857 86,339 352,196 Pension 142,019 43,358 185,377 128,740 37,189 165,929 Others 153,474 33,059 186,533 128,166 27,575 155,741 Depreciation 2,644,612 189,164 2,833,776 2,119,072 150,847 2,269,919 Amortization 21,683 40,009 61,692 7,713 22,936 30,649
(13) Other disclosures:
(a) Information on significant transactions:
The following is the information on significant transactions, required by the “Regulations Govern-ing the Preparation of Financial Reports by Securities Issuers”, of the Group:
(i) Loans to other parties:
(In Thousands of New Taiwan Dollars)
Collateral
Number
Name of
lender
Name of borrower
Account name
Related party
Highest balance of financing to other parties
during the period
Ending balance
Actual usage amount
during the period
Range ofinterest
rates during
the period
Purposes of fund
financing for the borrower
Transactionamount for
business between two
parties
Reasons for
short-term financing
Loss allowance
Item
Value
Individualfunding loan
limits
Maximumlimit of fund
financing 1 Suzhou
Largan Co., Ltd.
Nanjing Fengsheng Yongkang Software Technology Co., Ltd.
other receivables
No NT$134,160(RMB$30,000)
NT$60,372(RMB$13,500)
NT$55,191(RMB$12,341)
4.35% 2 - Working capital
- - 1,485,132 1,485,132
(ii) Guarantees and endorsements for other parties: None

LARGAN PRECISION CO., LTD. AND SUBSIDIARIES
Notes to the Consolidated Financial Statements
139 (Continued)
(iii) Securities held as of December 31, 2018 (excluding those investments in subsidiaries, associates and joint ventures):
(In Thousands of New Taiwan Dollars) Category and Relationship Ending balance
Note Name of holder name of security with company Account title Shares/Units (thousands)
Carrying value Percentage of ownership (%)
Fair value
The Company Stock -Micro Win Tech Inc.
- Non-current finan-cial assets at fair value through profit or loss
1.25 - 20.66 - (Note)
The Company Stock -Kintech Technology Co., Ltd.
- Non-current finan-cial assets at fair value through profit or loss
570 - 0.33 - (Note)
The Company Stock-AETAS TECHNOLOGY INCORPORATED
- Non-current finan-cial assets at fair value through profit or loss
125 - 0.25 - (Note)
The Company Open-end fund- Franklin Templeton Sinoam Money Mar-ket Fund
- Current financial assets mandatorily measured fair value through profit or loss
38,815 400,605 - 400,605
The Company Open-end fund- Yuanta Wan Tai Money Market Fund
- Current financial assets mandatorily measured fair value through profit or loss
23,144 350,067 - 350,067
The Company. Open-end fund- Jih Sun Money Mar-ket Fund
- Current financial assets mandatorily measured fair value through profit or loss
4,799 71,000 - 71,000
The Company Open-end fund- TCB Taiwan Money Market Fund
- Current financial assets mandatorily measured fair value through profit or loss
26,620 270,075 - 270,075
The Company Open-end fund- Taishin 1699 Money Market Fund
- Current financial assets mandatorily measured fair value through profit or loss
14,811 200,062 - 200,062
The Company Stock-AVISION INC.
- Current Equity Investments at fair value through other comprehensive income
5,452 23,389 - 23,389
Astro Interna-tional Ltd.
Stock-XIAOMI CORP-CLASS B
- Current Equity Investments at fair value through other comprehensive income
2,300 116,555 - 116,555
Note:The shares were not listed on public market and had no specific fair value. Therefore, the Company discloses the net equity at the percentage of its ownership. As of December 31, 2018, all shares have been recognized as impairment losses, without value.

LARGAN PRECISION CO., LTD. AND SUBSIDIARIES
Notes to the Consolidated Financial Statements
140 (Continued)
(iv) Individual securities acquired, or disposed, with an accumulated amount exceeding the lower of NT$300 million or 20% of the capital stock:
Name of Category
and
Name of
Relationship
Beginning Balance
Purchases
Sales
Ending Balance
company name of security
Account name
counter-party with the com-pany
Shares
Amount
Shares
Amount
Shares
Price
Cost
Gain (loss) on disposal
Shares
Amount
The Com-
pany
Open-end
fund-
Franklin
Templeton
Sinoam
Money
Market Fund
Current finan-
cial assets
mandatorily
measured fair
value through
profit or loss
- - 32,161 330,399 58,254 600,000 51,600 531,725 530,000 1,725 38,815 400,605
The Com-
pany
Open-end
fund-
capital
money
market fund
Current finan-
cial assets
mandatorily
measured fair
value through
profit or loss
- - - - 75,617 1,215,000 75,617 1,215,752 1,215,000 752 - -
The Com-
pany
Open-end
fund-
Yuanta Wan
Tai
Money
Market Fund
Current finan-
cial assets
mandatorily
measured fair
value through
profit or loss
- - - - 78,174 1,180,000 55,030 830,496 830,000 496 23,144 350,067
The Com-
pany
Open-end
fund-
Jih Sun
Money
Market Fund
Current finan-
cial assets
mandatorily
measured fair
value through
profit or loss
- - 13,597 200,248 78,013 1,151,000 86,811 1,281,437 1,280,000 1,437 4,799 71,000
The Com-
pany
Open-end
fund-
FSITC
Taiwan
Money
Market
Current finan-
cial assets
mandatorily
measured fair
value through
profit or loss
- - 36,176 550,132 42,004 640,000 78,180 1,191,830 1,190,000 1,830 - -
The Com-
pany
Open-end
fund-
FSITC
Money
Market
Current finan-
cial assets
mandatorily
measured fair
value through
profit or loss
- - - - 4,729 840,000 4,729 840,491 840,000 491 - -
The Com-
pany
Open-end
fund-
Eastspring
Investments
Well Pool
Money
Market Fund
Current finan-
cial assets
mandatorily
measured fair
value through
profit or loss
- - - - 67,248 910,000 67,248 911,282 910,000 1,282 - -
The Com-
pany
Open-end
fund-
Union
Money
Market Fund
Current finan-
cial assets
mandatorily
measured fair
value through
profit or loss
- - 15,996 210,014 7,611 100,000 23,607 310,438 310,000 438 - -
The Com-
pany
Open-end
fund-
TCB Taiwan
Money
Market Fund
Current finan-
cial assets
mandatorily
measured fair
value through
profit or loss
- - 49,614 501,174 41,444 420,000 64,438 652,802 650,000 2,802 26,620 270,075
The Com-
pany
Open-end
fund-
UPAMC
James Bond
Money
Market Fund
Current finan-
cial assets
mandatorily
measured fair
value through
profit or loss
- - - - 31,566 525,000 31,566 525,942 525,000 942 - -

LARGAN PRECISION CO., LTD. AND SUBSIDIARIES
Notes to the Consolidated Financial Statements
141 (Continued)
The Com-
pany
Open-end
fund-
Fubon
Chi-Hsiang
Money
Market Fund
Current
financial
assets man-
datorily
measured
fair value
through
profit or loss
-
- - - 51,832 810,000 51,832 810,577 810,000 577 - -
The Com-
pany
Open-end
fund-
Taishin 1699
Money
Market Fund
Current
financial
assets man-
datorily
measured
fair value
through
profit or loss
- - 13,386 180,000 109,066 1,470,000 107,641 1,451,140 1,450,000 1,140 14,811 200,062
The Com-
pany
Open-end
fund-
Cathay
Taiwan
Money
Market Fund
Current
financial
assets man-
datorily
measured
fair value
through
profit or loss
- - - - 40,319 500,000 40,319 500,476 500,000 476 - -
The Com-
pany
Open-end
fund-
Fuh Hwa
Money
Market
Current
financial
assets man-
datorily
measured
fair value
through
profit or loss
- - - - 23,615 340,000 23,615 340,090 340,000 90 - -
(v) Acquisition of individual real estate with amount exceeding the lower of NT$300 million or 20% of the capital stock:
If the counter-party is a related party, disclose the previous transfer information
References
Purpose of
Name of company
Name of property
Transaction
date
Transaction
amount
Status ofpayment
Coun-
ter-party
Relationshipwith the
Company
Owner
Relationship with the
Company
Date of transfer
Amount
for determining
price
acquisitionand current condition
Others The Com-pany
Land and buildings
2018.9 804,648 As of De-cember 31, 2018, $804,648 thousand has been paid
Natural person
None - Professional Appraisal Report
Future Op-erational Needs
None
(vi) Disposal of individual real estate with an amount exceeding the lower of NT$300 million or 20% of the capital stock: None

LARGAN PRECISION CO., LTD. AND SUBSIDIARIES
Notes to the Consolidated Financial Statements
142 (Continued)
(vii) Related-party transactions for purchases and sales with amounts exceeding the lower of NT$100 million or 20% of the capital stock:
Transaction details
Transactions with terms different from others
Notes/Accounts receivable (payable)
Name of company
Related party
Nature of relationship
Purchase/Sale
Amount
Percentage of total
purchases/sales
Payment terms
Unit price
Payment terms
Ending balance
Percentage of total notes/accounts
receivable (payable)
Note
The Company Amtai International Ltd.
The Company's subsidiary
Purchases 2,692,182 34% 120Days - - (695,917) (29)%
The Company Amtai International Ltd.
The Company's subsidiary
Sale (11,950,301) (25)% 30Days - - 1,054,264 10%
The Company Suzhou Largan Co., Ltd.
The Company's subsidiary
Sale (9,881,631) (20)% 120Days - - - -%
The Company Largan (Dongguan) Optronic Ltd.
The Company's subsidiary
Sale (13,052,869) (27)% 120Days - - 6,650,134 64%
Amtai International Ltd.
The Company The Company's subsidiary
Purchases 11,986,411 67% 30Days - - (1,054,264) (76)%
Amtai International Ltd.
The Company The Company's subsidiary
Sale (2,688,611) (15)% 120Days - - 695,918 21%
Amtai International Ltd.
Largan (Dongguan) Optronic Ltd.
The Company's subsidiary
Purchases 4,316,996 25% 30Days - - (200,463) (14)%
Amtai International Ltd.
Largan (Dongguan) Optronic Ltd.
The Company's subsidiary
Sale (3,064,172) (17)% 90Days - - 197,999 6%
Amtai International Ltd.
Suzhou Largan Co., Ltd.
The Company's subsidiary
Purchases 296,589 2% 30Days - - - -%
Amtai International Ltd.
Suzhou Largan Co., Ltd.
The Company's subsidiary
Sale (135,784) (1)% 90Days - - - -%
LARGAN (DONGGUAN) OPTRONIC LTD.
Amtai International Ltd.
The Company's subsidiary
Purchases 3,053,625 18% 90Days - - (197,919) (3)%
LARGAN (DONGGUAN) OPTRONIC LTD.
Amtai International Ltd.
The Company's subsidiary
Sale (4,314,624) (25)% 30Days - - 200,319 3%
LARGAN (DONGGUAN) OPTRONIC LTD.
The Company The Company's subsidiary
Purchases 13,103,854 80% 120Days - - (6,650,289) (97)%
LARGAN (DONGGUAN) OPTRONIC LTD.
Suzhou Largan Co., Ltd.
The Company's subsidiary
Purchases 259,178 2% 30Days - - (1,358) -%
Suzhou Largan Co., Ltd.
Amtai International Ltd.
The Company's subsidiary
Purchases 134,829 1% 90Days - - - -%
Suzhou Largan Co., Ltd.
Amtai International Ltd.
The Company's subsidiary
Sale (297,253) (3)% 30Days - - - -%
Suzhou Largan Co., Ltd.
The Company The Company's subsidiary
Purchases 10,035,818 98% 120Days - - - -%
Suzhou Largan Co., Ltd.
Largan (Dongguan) Optronic Ltd.
The Company's subsidiary
Sale (259,178) (2)% 30Days - - 1,358 -%
Note:The nature and the amounts of the purchases and sales transaction of the two parties are different due to their different categories of accounts. Therefore, the above transaction have been adjusted.

LARGAN PRECISION CO., LTD. AND SUBSIDIARIES
Notes to the Consolidated Financial Statements
143
(viii) Receivables from related parties with amounts exceeding the lower of NT$100 million or 20% of the capital stock:
Name of Nature of Ending Turnover Overdue Amounts received in Loss company Related-party relationship balance(Note2) rate Amount Action taken subsequent period allowance
The Company Amtai International Ltd.
The Company'ssubsidiary
1,106,856 7.83 - None 922,470(Note1)
-
The Company Largan (Dongguan) Optronic Ltd.
The Company'ssubsidiary
6,650,134 3.92 - None 1,970,270(Note1)
-
Amtai International Ltd. The Company The Company'ssubsidiary
696,157 1.84 - None 184,086(Note1)
-
Amtai International Ltd. Largan (Dongguan) Optronic Ltd.
The Company'ssubsidiary
198,707 7.82 - None 193,330(Note1)
-
LARGAN (DONGGUAN)OPTRONIC LTD.
Amtai International Ltd.
The Company'ssubsidiary
200,478 9.97 - None 200,478(Note1)
-
Note1: Until February 5, 2019.
Note2: Including other receivables.
(ix) Trading in derivative instruments: None
(x) Business relationships and significant intercompany transactions:
Nature of Intercompany transactions 2018
No. Name of company Name of counter-party relationship(Note2) Account name Amount Trading terms Percentage of the consolidated
net revenue or total assets 0 The Company Amtai International Ltd. 1 Purchases 2,692,182 The sales prices and
payment terms were same as those of sales to third parties.
5.00%
0 The Company Amtai International Ltd. 1 Sales 11,950,301 The sales prices and payment terms were same as those of sales to third parties.
24.00%
0 The Company Suzhou Largan Co., Ltd. 1 Sales 9,881,631 The sales prices and payment terms were same as those of sales to third parties.
20.00%
0 The Company Largan (Dongguan) Optronic Ltd.
1 Sales 13,052,869 The sales prices and payment terms were same as those of sales to third parties.
26.00%
1 Amtai International Ltd.
The Company 2 Purchases 11,986,411 The sales prices and payment terms were same as those of sales to third parties.
24.00%
1 Amtai International Ltd.
The Company 2 Sales 2,688,611 The sales prices and payment terms were same as those of sales to third parties.
5.00%
1 Amtai International Ltd.
Largan (Dongguan) Optronic Ltd.
3 Purchases 4,316,996 The sales prices and payment terms were same as those of sales to third parties.
9.00%
1 Amtai International Ltd.
Largan (Dongguan) Optronic Ltd.
3 Sales 3,064,172 The sales prices and payment terms were same as those of sales to third parties.
6.00%
1 Amtai International Ltd.
Suzhou Largan Co., Ltd. 3 Purchases 296,589 The sales prices and payment terms were same as those of sales to third parties.
1.00%
1 Amtai International Ltd.
Suzhou Largan Co., Ltd. 3 Sales 135,784 The sales prices and payment terms were same as those of sales to third parties.
-%
2 Largan (Dongguan) Optronic Ltd.
Amtai International Ltd. 3 Purchases 3,053,625 The sales prices and payment terms were same as those of sales to third parties.
6.00%
2 LALargan (Dongguan) Optronic Ltd.
Amtai International Ltd. 3 Sales 4,313,624 The sales prices and payment terms were same as those of sales to third parties.
9.00%
2 Largan (Dongguan) Optronic Ltd.
Suzhou Largan Co., Ltd. 3 Purchases 259,178 The sales prices and payment terms were same as those of sales to third parties.
1.00%

LARGAN PRECISION CO., LTD. AND SUBSIDIARIES
Notes to the Consolidated Financial Statements
144
2 Largan (Dongguan) Op-tronic Ltd.
The Company 2 Purchases 13,103,854 The sales prices and payment terms were same as those of sales to third parties.
26.00%
3 Suzhou Largan Co., Ltd.
Amtai International Ltd. 3 Purchases 134,829 The sales prices and payment terms were same as those of sales to third parties.
-%
3 Suzhou Largan Co., Ltd.
Amtai International Ltd. 3 Sales 297,253 The sales prices and payment terms were same as those of sales to third parties.
1.00%
3 Suzhou Largan Co., Ltd.
The Company 2 Purchases 10,035,818 The sales prices and payment terms were same as those of sales to third parties.
20.00%
3 Suzhou Largan Co., Ltd.
Largan (Dongguan) Op-tronic Ltd.
3 Sales 259,178 The sales prices and payment terms were same as those of sales to third parties.
1.00%
Note1:The number filled in as follows : 1) 0 represents the company. 2) Subsidiaries are sorted in a numerical order starting from 1. Note2:Transactions labeled as follows : 1) 1 represents the transactions form parent company to subsidiaries. 2) 2 represents the transactions from subsidiaries to parent company. 3) 3 represents the transactions between subsidiaries. Note3:The nature and the amounts of the purchase and sales transaction of the two parties are different due to their different categories of accounts. Therefore, the above transaction have been adjusted and offset in the consolidated financial state-ments.
(b) Information on investees:
The following is the information on investees (excluding information on investees in Mainland China):
(In Thousands of New Taiwan Dollars) Main Original investment amount Balance as of December 31, 2018 Net income Share of
Name of investor
Name of investee
Location
businesses and products
December 31, 2018
December 31, 2017
Shares (thousands)
Percentage of ownership
Carrying value (losses) of investee
profits/losses of investee
Note
The Company
Largan Digital Co., Ltd.
Taichung, Taiwan
Manufacturing of image capture device、image reader、camera and player etc.
411,359 411,359 26,636 49.37% 167,944 61,890 54,546 The Company's subsidiary
The Company
Largan (Hong Kong) Ltd.
Hong Kong Investment 658,555 658,555 31,100 100% 341,593 7,611 7,611 The Company's subsidiary
The Company
Astro International Ltd.
Samoa Investment 247,104 247,104 7,600 100% 29,566,165 1,974,133 2,088,277 The Company's subsidiary
The Company
Ba Fang Co., Ltd.
Taichung, Taiwan
Investment、building construction etc.
28,000 28,000 2,800
100% 22,780 (1,139) (1,139) The Company's subsidiary
Largan Digital Co., Ltd.
Largan Medical Co. Ltd.
Taichung, Taiwan
Manufacturing of Optical Instruments、Medical and Photo instruments sale etc.
428,252 428,252 40,497 40.50% 267,917 13,326 5,397 The Company's subsidiary
Largan Digital Co., Ltd.
Alpha Holding Inc.
Samoa Investment 118,415 118,415 3,700 100% 35,686 (6,967) (6,967) The Company's subsidiary
Astro International Ltd.
Net International Trading Ltd.
British Virgin Islands
Investment 756,599 756,599 24,300 100% 6,391,334 783,070 783,070 The Company's subsidiary
Astro International Ltd.
Amtai International Ltd.
Samoa Manufacturing of Optical part etc.
50,600 50,600 1,500 100% 21,053,600 1,114,190 1,121,708 The Company's subsidiary
Astro International Ltd.
Largan Health Technology Inc.
Samoa Investment 110,898 110,898 1,476 12% 32,701 (57,916) (6,950) The Company's subsidiary
Ba Fang Co., Ltd.
Fang Yuan Co., Ltd.
Taichung, Taiwan
Investment 14,800 14,800 1,480 100% 9,692 (1,133) (1,133) The Company's subsidiary
Largan Medical Co. Ltd.
Beta International Ltd.
Samoa investment 120,334 120,334 3,700 100% 79,867 (18,550) (18,550) The Company's subsidiary

LARGAN PRECISION CO., LTD. AND SUBSIDIARIES
Notes to the Consolidated Financial Statements
Main Original investment amount Balance as of December 31, 2018 Net income Share of Name of investor
Name of investee
Location
businesses and products
December 31, 2018
December 31, 2017
Shares (thousands)
Percentage of ownership
Carrying value
(losses) of investee
profits/losses of investee
Note
145
Alpha Holding Inc.
Largan Health Technology Inc.
Samoa investment 110,898 110,898 1,476 12% 32,701 (57,916) (6,950) The Company's subsidiary
Beta Interna-tional Ltd.
Largan Health Technology Inc.
Samoa investment 110,898 110,898 3,936 32% 76,881 (57,916) (18,533) The Company's subsidiary
Largan Health Technology Inc.
Dynadx Corporation
U.S.A Development of the software
10,629 8,483 10,617 100% 6,557 (2,007) (2,007) The Company's subsidiary
Largan Health Technology Inc.
Largan Health Technology Co., Ltd.
Taichung, Taiwan
Sales of medical equipment
40,797 34,797 2,845 100% 2,586 (18,397) (18,397) The Company's subsidiary
(c) Information on investment in mainland China:
(i) The names of investees in Mainland China, their main businesses and products, and other information:
(In Thousands of New Taiwan Dollars)
Main
Total Accumulated
outflow of
Investment flows Accumulated
outflow of Net
income
Accumulated
Name of investee
businesses and
products
amount of capital surplus
Method of
investment
investment from Taiwan as of
January 1, 2018
Outflow
Inflow
investment from Taiwan as of
December 31, 2018
(losses) of the
investee
Percentageof
ownership
Investmentincome (losses)
Book value
remittance of earnings in
current periodLargan (Dongguan) Optronic Ltd.
Production and sales of camera lenses, scanner lens optoelectronic devices, viewing windows, digital elec-tronic cameras
HK$ 178,076 Note1(a) HK$ 85,986US$ 7,474
- - HK$ 85,986US$ 7,474
RMB$ 85,948
100.00% NT$ 393,041
NT$ 2,659,889
-
Suzhou Largan Co., Ltd.
Production of digital camer-as and key components, optoelectronic devices
US$ 5,000 Note1(a) US$ 5,000 - - US$ 5,000 RMB$ 85,435
100.00% NT$ 389,463
NT$ 3,712,916
US$ 5,206
Nanjing Largan Health Technology Co., Ltd.
Health man-agement, computer and medical device tech-nology de-velopment, production and sales of medical devices
US$ 3,000 Note1(b) - - - - RMB$ (7,217)
24.32% NT$ (8,054)
NT$ 11,238
-
NEO (Shanghai) Medical Technology Co., Ltd.
Technical development and technical services in the field of medi-cal device technology
RMB$ 20,000 Note1(b) - - - - RMB$ (737)
9.80% NT$ (331)
NT$ 8,341
-
(ii) Limitation on investment in Mainland China:
Accumulated Investment in Mainland China as of December 31, 2018
Investment Amounts Authorized by In-vestment Commission, MOEA Upper Limit on Investment
NT$720,290 (HK$85,986 and US$12,474)
NT$881,421 (HK$85,986 and US$17,720)
NT$64,559,743
Note 1(a): Indirectly investment in Mainland China through an existing company registered in the third region.
Note 2(b): Other method of investment.

LARGAN PRECISION CO., LTD. AND SUBSIDIARIES
Notes to the Consolidated Financial Statements
146
(iii) Significant transactions:
The significant inter-company transactions with the subsidiary in Mainland China, which were eliminated in the preparation of consolidated financial statements, are disclosed in the “In-formation on significant transactions” and “Business relationships and significant inter-company transactions”.
(14) Segment information
(a) General information
The Group has only one reportable segment which is optical lens seg-ment. The optical lens segment engages mainly in the designing, man-ufacturing and selling of lens for perspective mirror, camera, single binoculars, microscope and scanner.
The profit or loss of the reportable segment of the Group includes de-preciation, income tax expense, any extraordinary activity and other material non-cash items.
Accounting policies for the operating segments correspond to those stated in note 4. The profit after tax of the operating segment of the Group is measured by earnings after taxes and as the basis for perfor-mance measurement.
(b) The Group's operating segment information:
Optical lens segment
2018 2017
Revenue Revenue from external customers $ 49,952,158 53,127,510 Intersegment revenues - - Interest revenue 1,182,871 656,050 Total revenue $ 51,135,029 53,783,560 Depreciation and amortization $ 2,895,468 2,300,568 Reportable segment profit or loss $ 24,369,534 25,975,623 Investments accounted for using equity method $ 209,445 160,594 Reportable segment assets $ 132,648,424 115,901,233 Reportable segment liabilities $ 25,048,853 23,504,002
(c) Production information
Since the main industrial department of Group is the optical lens de-partment, and its operating income, operating interests and the identifi-able assets account for more than 90% of operating income and total assets, therefore, the Group is classified as a single product.

LARGAN PRECISION CO., LTD. AND SUBSIDIARIES
Notes to the Consolidated Financial Statements
147
(d) Geographical information
In presenting the information on the basis of geography, segment revenue is based on the geo-graphical location of the customers and the segment non-current assets are based on the geo-graphical location of the assets.
Revenue from the external customers:
Region 2018 2017
China $ 28,516,473 25,537,708
Japan 9,849,805 12,068,762
Korea 7,234,540 14,657,207
Other countries 4,351,340 863,833
$ 49,952,158 53,127,510
Non-current assets:
Region
December 31, 2018
December 31, 2017
Taiwan $ 29,177,071 25,966,662
China 381,762 440,992
Samoa 32,701 40,276
$ 29,591,534 26,447,930
Non-current assets include property, plant and equipment, intangible assets, and other assets, ex-cluding financial instruments and deferred tax assets.
(e) Major customers’ information
2018 Customer Amount %
653003 $ 9,848,693 20
623119 9,108,365 18
Total $ 18,957,058 38
2017 Customer Amount %
653021 14,647,437 28
653003 11,757,631 22
Total 26,405,068 50

148
6.5 Parent Company Only Financial Statements of the Most Recent Year with Independent Auditors’ Report and Notes
Independent Auditors’ Report
To the Board of Directors of Largan Precision Co., Ltd.:
Opinion
We have audited the financial statements of Largan Precision Co., Ltd. (the ”Company”) which comprise the balance sheets as of December 31, 2018 and 2017, the statement of comprehensive income, changes in equity and cash flows for the years ended December 31, 2018 and 2017, and notes to the parent company only financial statements, including a summary of significant accounting policies.
In our opinion, the accompanying parent company only financial statements present fairly, in all material re-spects, the financial position of the Company as at December 31, 2018 and 2017, and its financial performance and its cash flows for the years then ended in accordance with the Regulations Governing the Preparation of Fi-nancial Reports by Securities Issuers .
Basis for Opinion
We conducted our audit in accordance with the Regulations Governing Auditing and Certification of Financial Statements by Certified Public Accountants and the auditing standards generally accepted in the Republic of China. Our responsibilities under those standards are further described in the Auditors’ Responsibilities for the Audit of the parent company only Financial Statements section of our report. We are independent of the Com-pany in accordance with the Certified Public Accountants Code of Professional Ethics in Republic of China (“the Code”), and we have fulfilled our other ethical responsibilities in accordance with the Code. We believe that the audit evidence we have obtained is sufficient and appropriate to provide a basis of our opinion.
Key Audit Matters
Key audit matters are those matters that, in our professional judgment, were of most significance in our audit of the parent company only financial statements of the current period. These matters were addressed in the con-text of our audit of the parent company only financial statements as a whole, and in forming our opinion thereon, and we do not provide a separate opinion on these matters. We have determined the matters described below to be the key audit matters to be communicated in our report.
1. Inventory valuation
Please refer to Note 4(g), Note 5(a), and Note 6(g) for accounting policies, uncertainty of accounting esti-mates and assumptions, and related disclosures for inventory valuation.
Description of key audit matter:
Inventories are stated at the lower of cost or net realizable value. With the rapid development of technology, and significant changes in market demand, the severe volatility to sales may lead to risks, wherein the costs of inventories may exceed its net realizable values. Therefore, the valuation of inventories has been identified as one of the key audit matters.

149
How the matter was addressed in our audit:
In relation to the key audit matter above, our principal audit procedures include obtaining an inventory aging report, analyzing the movement of inventory aging and evaluating the reasonableness of the Company’s accounting policies, such as allowance for inventory valuation and obsolescence; performing a retrospective test of the Company’s historical accuracy of judgments with reference to inventory valuation and compar-ing with the current period to evaluate the appropriateness of the estimation and assumptions used; examining whether the valuation of inventories are in compliance with the accounting policies of the Company; under-standing the basis of the selling price the management used to ensure the reasonableness of net realizable value of inventories; reviewing sales in the subsequent period, as well as assessing the basis of the net realiz-able value the Company used to determine the sufficiency of allowance of inventories and whether the related disclosures are appropriate.
2. Accounts Receivable Valuation
Please refer to Note 4(f), note 5(b), and Note 6(e) for accounting policies, uncertainty of accounting estimates and assumptions, and related disclosures for accounts receivables valuation, respectively.
Description of key audit matter:
The Company’s accounts receivable are concentrated within certain customers, and the determination of al-lowance for accounts receivable relies on the management’s subjective judgment. Therefore, the valuation of accounts receivables is one of the key audit matters.
How the matter was addressed in our audit:
In relation to the key audit matter above, our principal audit procedures include estimating the loss allowance of trade receivables that is based on the risk of a default occurring and the rate of expected credit loss; re-viewing the historical collection records, understanding the industry economic environment and the credit risk of receivables among limited customers to evaluate whether the method of estimation, assumptions, and related disclosures are appropriate.
Responsibilities of Management and Those Charged with Governance for the Parent Company Only Fi-nancial Statements
Management is responsible for the preparation and fair presentation of the parent company only financial state-ments in accordance with the Regulations Governing the Preparation of Financial Reports by Securities Issuers and with the IFRSs, IASs, IFRC, SIC endorsed and issued into effect by the Financial Supervisory Commission of the Republic of China, and for such internal control as management determines is necessary to enable the preparation of parent company only financial statements that are free from material misstatement, whether due to fraud or error.
In preparing the parent company only financial statements, management is responsible for assessing the Com-pany’s ability to continue as a going concern, disclosing, as applicable, matters related to going concern and using the going concern basis of accounting unless management either intends to liquidate the Company or to cease operations, or has no realistic alternative but to do so.
Those charged with governance (including the supervisors) are responsible for overseeing the Company’s fi-nancial reporting process.

150
Auditor’s Responsibilities for the Audit of the Parent Company Only Financial Statements
Our objectives are to obtain reasonable assurance about whether the parent company only financial statements as a whole are free from material misstatement, whether due to fraud or error, and to issue an auditor’s report that includes our opinion. Reasonable assurance is a high level of assurance, but is not a guarantee that an audit con-ducted in accordance with the auditing standards generally accepted in the Republic of China will always detect a material misstatement when it exists. Misstatements can arise from fraud or error and are considered material if, individually or in the aggregate, they could reasonably be expected to influence the economic decisions of users taken on the basis of these parent company only financial statements.
As part of an audit in accordance with auditing standards generally accepted in the Republic of China, we exer-cise professional judgment and maintain professional skepticism throughout the audit. We also:
1. Identify and assess the risks of material misstatement of the financial statements, whether due to fraud or er-ror, design and perform audit procedures responsive to those risks, and obtain audit evidence that is sufficient and appropriate to provide a basis for our opinion. The risk of not detecting a material misstatement resulting from fraud is higher than for one resulting from error, as fraud may involve collusion, forgery, intentional omissions, misrepresentations, or the override of internal control.
2. Obtain an understanding of internal control relevant to the audit in order to design audit procedures that are appropriate in the circumstances, but not for the purpose of expressing an opinion on the effectiveness of the Company’s internal control.
3. Evaluate the appropriateness of accounting policies used and the reasonableness of accounting estimates and related disclosures made by management.
4. Conclude on the appropriateness of management’s use of the going concern basis of accounting and, based on the audit evidence obtained, whether a material uncertainty exists related to events or conditions that may cast significant doubt on the Company’s ability to continue as a going concern. If we conclude that a mate-rial uncertainty exists, we are required to draw attention in our auditors’ report to the related disclosures in the financial statements or, if such disclosures are inadequate, to modify our opinion. Our conclusions are based on the audit evidence obtained up to the date of our auditors’ report. However, future events or con-ditions may cause the Company to cease to continue as a going concern.
5. Evaluate the overall presentation, structure and content of the financial statements, including the disclosures, and whether the financial statements represent the underlying transactions and events in a manner that achieves fair presentation.
6. Obtain sufficient and appropriate audit evidence regarding the financial information on the investment in other entities accounted for using the equity method in order to express an opinion on this financial state-ments. We are responsible for the direction, supervision and performance of the audit. We remain solely re-sponsible for our audit opinion.
We communicate with those charged with governance regarding, among other matters, the planned scope and timing of the audit and significant audit findings, including any significant deficiencies in internal control that we identify during our audit.
We also provide those charged with governance with a statement that we have complied with relevant ethical requirements regarding independence, and to communicate with them all relationships and other matters that may reasonably be thought to bear on our independence, and where applicable, related safeguards.

Notes to Readers
The accompanying parent company only financial statements are intended only to present the statement of financial position, financial performance and its cash flows in accordance with the accounting principles and practices generally accepted in the Republic of China and not those of any other jurisdictions. The standards, procedures and practices to audit such parent company only financial statements are those generally accepted and applied in the Republic of China.
The independent auditors’ report and the accompanying parent company only financial statements are the English translation of the Chinese version prepared and used in the Republic of China. If there is any conflict between, or any difference in the interpretation of the English and Chinese language independent auditors’ report and parent company only financial statements, the Chinese version shall prevail.
151
From the matters communicated with those charged with governance, we determine those matters that were of most significance in the audit of the parent company only financial statements of the current period and are therefore the key audit matters. We describe these matters in our auditors’ report unless law or regulation pre-cludes public disclosure about the matter or when, in extremely rare circumstances, we determine that a matter should not be communicated in our report because the adverse consequences of doing so would reasonably be expected to outweigh the public interest benefits of such communication.
The engagement partners on the audit resulting in this independent auditors’ report are Tza-Hsin, Chang and Chiun-Mang, Chen.
KPMG
Taipei, Taiwan (Republic of China) February 25, 2019

(English Translation of Parent Company Only Financial Statements and Report Originally Issued in Chinese) LARGAN PRECISION CO., LTD.
Balance Sheets
December 31, 2018 and 2017
(Expressed in Thousands of New Taiwan Dollars)
See accompanying notes to parent company only financial statements. 152
December 31, 2018 December 31, 2017
Assets Amount % Amount % Current assets:
1100 Cash and cash equivalents(Note6(a) and (w)) $ 56,224,190 42 46,724,786 40
1110 Current financial assets at fair value through profit or loss(Note6(b) and (w)) 1,291,809 1 - -
1120 Current financial assets at fair value through other comprehensive income (Note6(c) and (w)) 23,389 - - -
1125 Current available-for-sale financial assets(Note6(d) and (w)) - - 2,010,555 2
1150 Notes receivable, net(Note6(e) and (w)) 3 - - -
1170 Accounts receivable, net(Note6(e) and (w)) 2,639,484 2 4,783,338 4
1180 Accounts receivable from related parties, net(Note6(e)、(w) and7) 7,716,994 6 6,697,809 6
1200 Other receivables(Note6(f) and (w)) 213,210 - 170,515 -
1210 Other receivables from related parties(Note6(f)、(w) and7) 68,234 - 100,111 -
1310 Inventories(Note6(g)) 3,460,712 3 1,933,334 1
1470 Other current assets(Note6(k) and8) 553,490 - 109,404 -
72,191,515 54 62,529,852 53
Non-current assets:
1550 Investments accounted for using equity method(Note6(h)) 30,107,282 23 27,482,428 24
1600 Property, plant and equipment(Note6(i)) 27,487,598 21 24,426,973 21
1780 Intangible assets(Note6(j)) 80,345 - 83,718 -
1840 Deferred tax assets(Note6(n)) 402,872 - 367,511 -
1900 Other non-current assets(Note6(k) and8) 2,772,208 2 2,276,390 2
60,850,305 46 54,637,020 47
Total assets $ 133,041,820 100 117,166,872 100
December 31, 2018 December 31, 2017 Liabilities and Equity Amount % Amount % Current liabilities:
2100 Short-term borrowings(Note6(l) and (w)) $ 552,868 - 395,774 1
2150 Notes payable(Note6(w)) 846 - 2,346 -
2170 Accounts payable(Note6(w)) 1,654,392 1 1,558,887 1
2180 Accounts payable to related parties(Note6(w) and7) 708,418 1 2,240,098 2
2200 Other payables(Note6(o) and (w)) 18,147,993 14 16,603,841 14
2220 Other payables to related parties(Note6(w) and7) 2,529 - 711 -
2230 Current tax liabilities 4,194,745 3 3,825,097 3
2300 Other current liabilities 62,584 - 48,669 -
25,324,375 19 24,675,423 21
Non-Current liabilities:
2570 Deferred tax liabilities(Note6(n)) 15,560 - 598 -
2600 Other non-current liabilities(Note6(w)) 4,473 - 3,179 -
2640 Net defined benefit liabilities(Note6(m)) 97,841 - 90,441 -
117,874 - 94,218 -
Total liabilities 25,442,249 19 24,769,641 21
Equity attributable to owners of parent:(Note6(p))
3110 Share capital 1,341,402 1 1,341,402 1
3200 Capital surplus 1,557,011 1 1,556,388 1
3300 Retained earnings 106,503,622 80 91,870,266 79
3400 Other equity interest (1,802,464) (1) (2,370,825) (2)
Total equity attributable to owners of parent 107,599,571 81 92,397,231 79
Total liabilities and equity $ 133,041,820 100 117,166,872 100

See accompanying notes to parent company only financial statements. 153
(English Translation of Parent Company Only Financial Statements and Report Originally Issued in Chinese) LARGAN PRECISION CO., LTD.
Statements of Comprehensive Income
For the years ended December 31, 2018 and 2017
(Expressed in Thousands of New Taiwan Dollars , Except for Earnings Per Common Share)
2018 2017
Amount % Amount %
4000 Operating revenues(Note6(r)、(s) and 7) $ 47,178,620 100 49,497,163 100 5000 Operating costs(Note6(g) and (m)) 14,668,012 31 15,055,204 30 32,510,608 69 34,441,959 70 5910 Realized (unrealized) profit from sales (119,881) - 3,495 - 5900 Gross profit from operations 32,390,727 69 34,445,454 70 6000 Operating expenses(Note6(m) and 7): 6100 Selling expenses 287,239 1 299,024 1 6200 Administrative expenses 1,084,235 2 1,087,938 2 6300 Research and development expenses 3,252,847 7 3,272,770 7 Total operating expenses 4,624,321 10 4,659,732 10 6900 Operating income 27,766,406 59 29,785,722 60 7000 Non-operating income and expenses: 7010 Other income(Note6(u) and 7) 623,077 1 333,771 1 7020 Other gains and losses(Note6(u) and 7) 374,959 1 (709,609) (1) 7060 Share of profit (losses) of associates accounted for using equity meth-
od(Note6(h)) 2,149,295 5 2,247,034 4
3,147,331 7 1,871,196 4 7900 Profit before income tax 30,913,737 66 31,656,918 64 7950 Less: Income tax expense(Note6(n)) 6,544,203 14 5,681,295 11 Profit for the period 24,369,534 52 25,975,623 53 8300 Other comprehensive income: 8310 Components of other comprehensive income that will not be reclassified
to profit or loss: 8311 Remeasurements of defined benefit obligation(Note6(m)) (12,995) - (17,775) - 8316 Unrealized loss on investments in equity instruments measured at fair value
through other comprehensive income (51,935) - - -
8349 Income tax related to components of other comprehensive income that will not be reclassified to profit or loss - - - -
(64,930) - (17,775) - 8360 Components of other comprehensive income that will be reclassified to
profit or loss: 8361 Exchange differences on translation of foreign financial statement 622,277 1 (1,885,780) (4) 8362 Unrealized gains on valuation of available-for-sale financial as-
sets(Note6(v)) - - 1,792 -
8399 Income tax related to components of other comprehensive income that will be reclassified to profit or loss - - - -
622,277 1 (1,883,988) (4) Other comprehensive income (loss) for the period, net of tax 557,347 1 (1,901,763) (4) 8500 Total comprehensive income for the period $ 24,926,881 53 24,073,860 49
Earnings per share(NT dollars)(Note6(q))
9750 Basic earnings per share $ 181.67 193.65 9850 Diluted earnings per share $ 180.05 191.77

See accompanying notes to parent company only financial statements. 154
(English Translation of Parent Company Only Financial Statements and Report Originally Issued in Chinese)
LARGAN PRECISION CO., LTD. Statements of Changes in Equity
For the years ended December 31, 2018 and 2017 (Expressed in Thousands of New Taiwan Dollars)
Other equity interest Retained earnings Unrealized
gains
Share Capital
Capital surplus
Legal reserve
Special reserve
Unappropriated retained earn-
ings
Total
Exchange dif-
ferences on translation of foreign finan-cial statements
(losses) on financial assets
measured at fair value
through other comprehensive
income
Unrealized
gains (losses) on availa-
ble-for-sale financial assets
Total
Total equity
Balance at January 1, 2017 $ 1,341,402 1,555,729 8,711,955 - 65,720,266 74,432,221 (484,100) - (2,737) (486,837) 76,842,515
Appropriation and distribution of retained earnings:
Legal reserve - - 2,273,302 - (2,273,302) - - - - - -
Special reserve - - - 486,837 (486,837) - - - - - -
Cash dividends of common stock - - - - (8,517,903) (8,517,903) - - - - (8,517,903)
- - 2,273,302 486,837 (11,278,042) (8,517,903) - - - - (8,517,903)
Other changes in capital surplus - 659 - - - - - - - - 659
Profit for the period - - - - 25,975,623 25,975,623 - - - - 25,975,623
Other comprehensive income for the period - - - - (17,775) (17,775) (1,885,780) - 1,792 (1,883,988) (1,901,763)
Total comprehensive income for the period - - - - 25,957,848 25,957,848 (1,885,780) - 1,792 (1,883,988) 24,073,860
Changes in equity of associates accounted for using equity method - - - - (1,900) (1,900) - - - - (1,900)
Balance at December 31, 2017 $ 1,341,402 1,556,388 10,985,257 486,837 80,398,172 91,870,266 (2,369,880) - (945) (2,370,825) 92,397,231 Balance at January 1, 2018 $ 1,341,402 1,556,388 10,985,257 486,837 80,398,172 91,870,266 (2,369,880) - (945) (2,370,825) 92,397,231
Effect of retrospective application - - - - 1,967 1,967 - (2,912) 945 (1,967) -
Balance of January 1, 2018 after adjustments 1,341,402 1,556,388 10,985,257 486,837 80,400,139 91,872,233 (2,369,880) (2,912) - (2,372,792) 92,397,231
Appropriation and distribution of retained earnings:
Legal reserve - - 2,597,562 - (2,597,562) - - - - - -
Special reserve - - - 1,883,988 (1,883,988) - - - - - -
Cash dividends of common stock - - - - (9,725,164) (9,725,164) - - - - (9,725,164)
- - 2,597,562 1,883,988 (14,206,714) (9,725,164) - - - - (9,725,164)
Other changes in capital surplus - 623 - - - - - - - - 623
Profit for the period - - - - 24,369,534 24,369,534 - - - - 24,369,534
Other comprehensive income for the period - - - - (12,995) (12,995) 622,277 (51,935) - 570,342 557,347
Total comprehensive income for the period - - - - 24,356,539 24,356,539 622,277 (51,935) - 570,342 24,926,881 Disposal of investments in equity instruments designated at fair
value through other comprehensive income - - - - 14 14 - (14) - (14) - Balance at December 31, 2018 $ 1,341,402 1,557,011 13,582,819 2,370,825 90,549,978 106,503,622 (1,747,603) (54,861) - (1,802,464) 107,599,571

See accompanying notes to parent company only financial statements. 155
(English Translation of Parent Company Only Financial Statements and Report Originally Issued in Chinese) LARGAN PRECISION CO., LTD.
Statements of Cash Flows
For the years ended December 31, 2018 and 2017
(Expressed in Thousands of New Taiwan Dollars)
2018 2017
Cash flows from operating activities: Profit before income tax $ 30,913,737 31,656,918 Adjustments:
Adjustments to reconcile profit (loss): Depreciation expense 2,766,307 2,202,076 Amortization expense 61,476 30,052 Interest income (613,196) (326,352) Share of loss (profit) of subsidiaries accounted for using equity method (2,149,295) (2,247,034) Losses (Gains) on disposal of property, plant and equipment 1,618 (5,016) Property, plant and equipment transferred to expenses 1,072 - Gain on disposal of investment - (17,541) Unrealized (realized) profit from sales 119,881 (3,495) Unrealized foreign exchange loss 38,279 -
Total adjustments to reconcile profit 226,142 (367,310) Changes in operating assets and liabilities:
Changes in operating assets: Decrease in financial assets mandatorily measured at fair value through profit or loss 680,158 - (Increase) decrease in notes receivable (3) 132 Decrease (Increase) in accounts receivable 2,143,854 (1,059,982) (Increase) decrease in accounts receivable from related parties (1,019,185) 2,350,733 Increase in inventories (1,527,378) (178,515) Increase in other current assets (409,355) (80,584)
Total changes in operating assets (131,909) 1,031,784 Changes in operating liabilities:
(Decrease) increase in notes payable (1,500) 2,247 Increase in accounts payable 95,505 220,523 (Decrease) increase in accounts payable to related parties (1,531,680) 1,136,104 Increase in other current liabilities 2,108,116 2,898,539 Decrease in net defined benefit liabilities (5,595) (2,024)
Total changes in operating liabilities 664,846 4,255,389 Total changes in operating assets and liabilities 532,937 5,287,173
Cash inflow generated from operations 31,672,816 36,576,781 Interest received 567,647 308,592 Income taxes paid (6,205,748) (5,370,382)
Net cash flows from operating activities 26,034,715 31,514,991 Cash flows from investing activities:
Proceeds from disposal of financial assets at fair value through other comprehensive income 1,233 - Acquisition of investments accounted for using equity method (8,800) - Acquisition of available-for-sale financial assets - (14,420,000) Proceeds from disposal of available-for-sale financial assets - 15,919,653 Acquisition of property, plant and equipment (6,398,078) (7,388,555) Proceeds from disposal of property, plant and equipment 111 5,584 (Increase) decrease in refundable deposits (396,100) 2,545 Acquisition of intangible assets (47,712) (79,555) Increase in other non-current assets (99,718) (259,149)
Net cash flows used in investing activities (6,949,064) (6,219,477) Cash flows from financing activities:
Increase in short-term borrowings 137,000 358,167 Increase (decrease) in guarantee deposits received 1,294 (1,349) Cash dividend paid (9,725,164) (8,517,903) Overdue dividend transferred to capital surplus 623 659
Net cash flows used in financing activities (9,586,247) (8,160,426) Net increase in cash and cash equivalents 9,499,404 17,135,088 Cash and cash equivalents at beginning of period 46,724,786 29,589,698 Cash and cash equivalents at end of period $ 56,224,190 46,724,786

156 (Continued)
(English Translation of Parent Company Only Financial Statements and Report Originally Issued in Chinese) LARGAN PRECISION CO., LTD.
Notes to the Parent Company Only Financial Statements
For the years ended December 31, 2018 and 2017
(Expressed in Thousands of New Taiwan Dollars, Unless Otherwise Specified)
(1) Company history
Largan Precision Co., Ltd. (the “Company”) was incorporated in April 1987 as a company limited by shares under the Company Act of the Republic of china (R .O. C). The registered address is No.11, Jingke Rd., Nantun Dist., Taichung City 40852, Taiwan (R.O.C.). The major business activities of the Company are the design, manufacture and sale of lens for perspective mirror, camera, single and double binoculars, fax machine, microscope and scanner etc. Please refer to Note 14.
The Company's common shares were listed on the Taiwan Stock Exchange (TWSE) in March, 2002.
(2) Approval date and procedures of the financial statements:
The accompanying parent company only financial statements were authorized for issuance by the Board of Directors on February 25, 2019.
(3) New standards, amendments and interpretations adopted
(a) The impact of the International Financial Reporting Standards (“IFRSs”) endorsed by the Finan-cial Supervisory Commission, R.O.C. (“FSC”) which have already been adopted.
The following new standards, interpretations and amendments have been endorsed by the FSC and are effective for annual periods beginning on or after January 1, 2018.
New, Revised or Amended Standards and Interpretations Effective date
per IASB Amendment to IFRS 2 “Classification and Measurement of Share-based Pay-ment Transactions”
January 1, 2018
Amendments to IFRS 4 “Applying IFRS 9 Financial Instruments with IFRS 4 Insurance Contracts”
January 1, 2018
IFRS 9 “Financial Instruments” January 1, 2018
IFRS 15 “Revenue from Contracts with Customers” January 1, 2018
Amendment to IAS 7 “Statement of Cash Flows -Disclosure Initiative” January 1, 2017
Amendment to IAS 12 “Income Taxes- Recognition of Deferred Tax Assets for Unrealized Losses”
January 1, 2017
Amendments to IAS 40 “Transfers of Investment Property” January 1, 2018
Annual Improvements to IFRS Standards 2014–2016 Cycle:
Amendments to IFRS 12 January 1, 2017
Amendments to IFRS 1 and Amendments to IAS 28 January 1, 2018
IFRIC 22 “Foreign Currency Transactions and Advance Consideration” January 1, 2018

LARGAN PRECISION CO., LTD.
Notes to the Parent Company Only Financial Statements
157 (Continued)
Except for the following items, the Company believes that the adoption of the above IFRSs would not have any material impact on its financial statements. The extent and impact of signification changes are as follows:
(i) IFRS 15 “Revenue from Contracts with Customers”
IFRS 15 establishes a comprehensive framework for determining whether, how much and when revenue is recognized. It replaces the existing revenue recognition guidance, including IAS 18 “Revenue” and IAS 11 “Construction Contracts”. The Company applies this standard retrospectively with the cumulative effect, it need not restate those contracts, but instead, con-tinues to apply IAS 11, IAS 18, and the related Interpretations for comparative reporting period. The Company recognizes the cumulative effect upon its initially application of this Standard as an adjustment to the opening balance of retained earnings on January 1, 2018.
The Company uses the practical expedients for completed contracts, which means it need not restate those contracts that have been completed on January 1, 2018.
The following are the nature and impacts on changing of accounting policies:
1) Sales of goods
For the sale of the Company's products, in the past, the export sales were recognized when the goods are shipped to the port, the domestic sales were recognized when the goods are delivered to the customer’s premises, which is taken to be the point in time at which the customer accepts the goods and the related risks and rewards of ownership transfer. Revenue is recognized at this point provided that the revenue and costs can be measured reliably, the recovery of the consideration is probable and there is no continu-ing management involvement with the goods. Under IFRS 15, revenue will be recognized when a customer obtains control of the goods.
2) Impacts on financial statements
There was no significant impact on the Company’s financial statements upon the adop-tion of IFRS 15.
(ii) IFRS 9 “Financial Instruments”
IFRS 9 replaces IAS 39 “Financial Instruments: Recognition and Measurement” which contains classification and measurement of financial instruments, impairment and hedge ac-counting.
As a result of the adoption of IFRS 9, the Company adopted the consequential amendments to IAS 1 “Presentation of Financial Statements” which requires impairment of financial assets to be presented in a separate line item in the statement of profit or loss and OCI. Previously, the Company’s approach was to include the impairment of trade receivables in administrative expenses. Additionally, the Company adopted the consequential amendments to IFRS 7 Finan-cial Instruments: Disclosures that are applied to disclosures about 2018 but generally have not been applied to comparative information.
The detail of new significant accounting policies and the nature and effect of the changes to previous accounting policies are set out below:

LARGAN PRECISION CO., LTD.
Notes to the Parent Company Only Financial Statements
158 (Continued)
1) Classification of financial assets and financial liabilities
IFRS 9 contains three principal classification categories for financial assets: measured at amortized cost, fair value through other comprehensive income (FVOCI) and fair value through profit or loss (FVTPL). The classification of financial assets under IFRS 9 is generally based on the business model in which a financial asset is managed and its con-tractual cash flow characteristics. The standard eliminates the previous IAS 39 categories of held to maturity, loans and receivables and available for sale. Under IFRS 9, deriva-tives embedded in contracts, where the host is a financial asset in the scope of the stand-ard, are never bifurcated. Instead, the hybrid financial instrument as a whole is assessed for classification. For an explanation of how the Company classifies and measures its fi-nancial assets and accounts for related gains and losses under IFRS 9, please see note 4(g).
The adoption of IFRS 9 did not have any significant impact on its accounting policies on financial liabilities.
2) Impairment of financial assets
IFRS 9 replaces the ‘incurred loss’ model in IAS 39 with the ‘expected credit loss’ (ECL) model. The new impairment model applies to financial assets measured at amor-tized cost, contract assets and debt investments at FVOCI, but not to investments in equi-ty instruments.
3) Transition
The adoption of IFRS 9 have been applied retrospectively, except as described below,
Differences in the carrying amounts of financial assets and financial liabilities re-sulting from the adoption of IFRS 9 are recognized in retained earnings and reserves as on January 1, 2018. Accordingly, the information presented for 2017 does not generally reflect the requirements of IFRS 9, and therefore, is not comparable to the information presented for 2018 under IFRS 9.
The following assessments have been made on the basis of the facts and circum-stances that existed at the date of initial application:
-The determination of the business model within which a financial asset is held.
-The designation and revocation of previous designations of certain financial as-sets and financial liabilities as measured at FVTPL.
-The designation of certain investments in equity instruments not held for trading as at FVOCI.
If an investment in a debt security had low credit risk at the date of initial applica-tion of IFRS 9, then the Company assumes that the credit risk on its asset will not increase significantly since its initial recognition.

LARGAN PRECISION CO., LTD.
Notes to the Parent Company Only Financial Statements
159 (Continued)
4) Classification of financial assets on the date of initial application of IFRS 9
The following table shows the original measurement categories under IAS 39 and the new measurement categories under IFRS 9 for each class of the Company’s financial assets as of January 1, 2018.
IAS39 IFRS9
Measurement categories Carrying Amount Measurement categories
Carrying Amount
Financial Assets
Cash and cash equivalents Loans and receivables $ 46,724,786 Amortized cost $ 46,724,786
Debt securities Available-for-sale (note 1) 1,971,967 Mandatorily at FVTPL 1,971,967
Equity instruments Available-for-sale (note 2) 38,588 FVOCI 38,588
Trade and other receivables Loans and receivables (note 3) 11,641,264 Amortized cost 11,641,264
Other financial assets (Re-
fundable deposits)
Loans and receivables 962,244 Amortized cost 962,244
Note1: The corporate debt securities categorized as available-for-sale under IAS 39 are held by the Company’s treasury unit in a separate portfolio to provide interest in-come; however, they may be sold to meet liquidity requirements arising in the nor-mal course of business. The Company considers that these securities are held within a business model whose objective is achieved by selling securities. These assets have therefore been classified as financial assets at FVTPL under IFRS 9. An al-lowance for impairment of $1,967 thousand was recognized in opening retained earnings on transition to IFRS 9 on January 1, 2018.
Note2: These equity securities represent investments that the Company intends to hold for the long term for strategic purposes. As permitted by IFRS 9, the Company has designated these investments at the date of initial application as measured at FVOCI.
Note3: Trade, lease and other receivables that were classified as loans and receivables under IAS 39 are now classified at amortized cost.
The following table reconciles the carrying amounts of financial assets under IAS 39 to the carrying amounts under IFRS 9 upon transition to IFRS 9 on 1 January, 2018.
2017.12.31 2018.1.1 2018.1.1 2018.1.1
IAS 39 Car-
rying Amount Reclassifications Remeasurements
IFRS 9 Carrying Amount
Retained earnings
effect
Other equi-ty
effect Fair value through profit or loss
Beginning balance of FVTPL (IAS 39) $ - - - - -
Additions – debt instruments:
From available for sale - 1,971,967 - 1,967 (1,967)
Total $ - 1,971,967 - 1,971,967 1,967 (1,967)
Fair value through other comprehensive income
Beginning balance of available for sale (IAS 39) $ 2,010,555 - - - -
Subtractions – debt instruments:
To FVTPL– required reclassification based on classification criteria
- (1,971,967) - - -
Total $ 2,010,555 (1,971,967) - 38,588 - -

LARGAN PRECISION CO., LTD.
Notes to the Parent Company Only Financial Statements
160 (Continued)
(iii) Amendments to IAS 7 “Disclosure Initiative”
The amendments require disclosures that enable users of financial statements to evaluate changes in liabilities arising from financing activities, including both changes arising from cash flow and non-cash changes.
To satisfy the new disclosure requirements, the Company present a reconciliation between the opening and closing balances for liabilities with changes arising from financing activities as note 6(z).
(b) The impact of IFRS endorsed by FSC but not yet effective
The following new standards, interpretations and amendments have been endorsed by the FSC and are effective for annual periods beginning on or after January 1, 2019 in accordance with Ruling No. 1070324857 issued by the FSC on July 17, 2018:
New, Revised or Amended Standards and Interpretations Effective date
per IASB IFRS 16 “Leases” January 1, 2019
IFRIC 23 “Uncertainty over Income Tax Treatments” January 1, 2019
Amendments to IFRS 9 “Prepayment features with negative compensation” January 1, 2019
Amendments to IAS 19 “Plan Amendment, Curtailment or Settlement” January 1, 2019
Amendments to IAS 28 “Long-term interests in associates and joint ventures” January 1, 2019
Annual Improvements to IFRS Standards 2015–2017 Cycle January 1, 2019
Except for the following items, the Company believes that the adoption of the above IFRSs would not have any material impact on its financial statements. The extent and impact of signification changes are as follows:
(i) IFRS 16“Leases”
IFRS 16 replaces the existing leases guidance, including IAS 17 ” Leases ” , IFRIC 4 ”Determining whether an Arrangement contains a Lease”, SIC-15 ”Operating Leases – Incentives” and SIC-27 ”Evaluating the Substance of Transactions Involving the Legal Form of a Lease”.
IFRS 16 introduces a single and an on-balance sheet lease accounting model for lessees. A les-see recognizes a right-of-use asset representing its right to use the underlying asset and a lease liability representing its obligation to make lease payments. In addition, the nature of expenses related to those leases will now be changed since IFRS 16 replaces the straight-line operating lease expense with a depreciation charge for right-of-use assets and interest expense on lease liabilities. There are recognition exemptions for short-term leases and leases of low-value items. The lessor accounting remains similar to the current standard – i.e. the lessors will continue to classify leases as finance or operating leases.
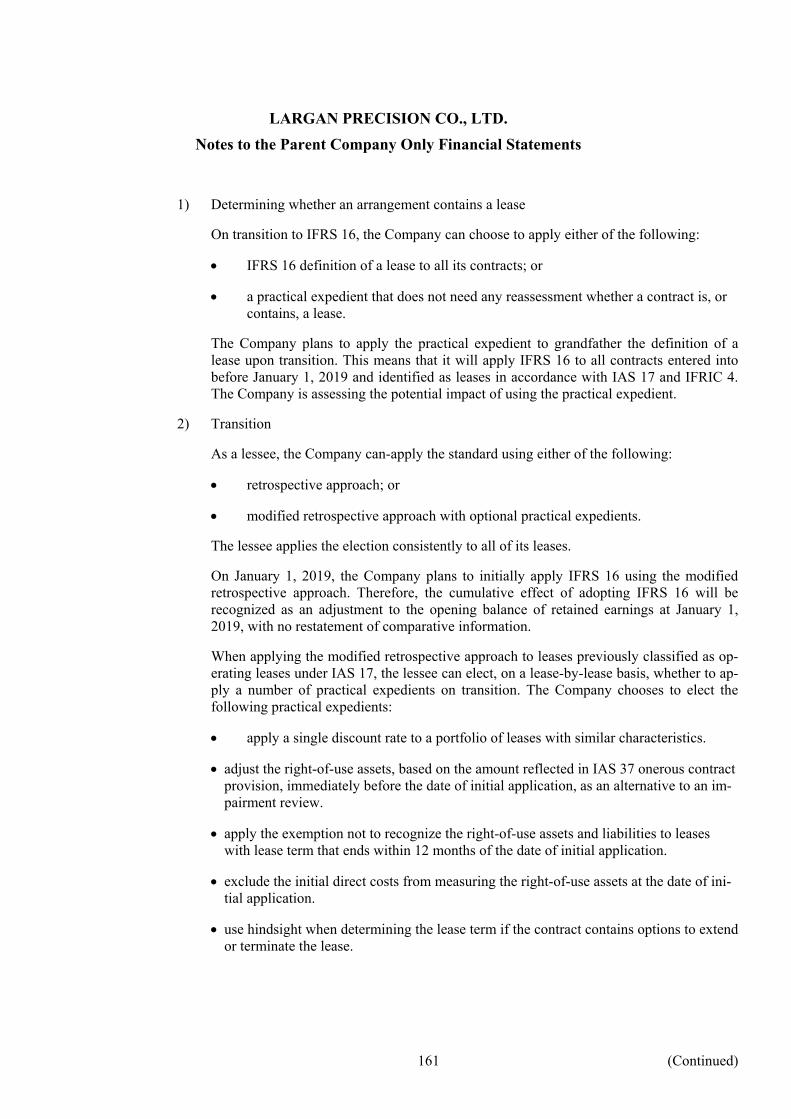
LARGAN PRECISION CO., LTD.
Notes to the Parent Company Only Financial Statements
161 (Continued)
1) Determining whether an arrangement contains a lease
On transition to IFRS 16, the Company can choose to apply either of the following:
IFRS 16 definition of a lease to all its contracts; or
a practical expedient that does not need any reassessment whether a contract is, or contains, a lease.
The Company plans to apply the practical expedient to grandfather the definition of a lease upon transition. This means that it will apply IFRS 16 to all contracts entered into before January 1, 2019 and identified as leases in accordance with IAS 17 and IFRIC 4. The Company is assessing the potential impact of using the practical expedient.
2) Transition
As a lessee, the Company can-apply the standard using either of the following:
retrospective approach; or
modified retrospective approach with optional practical expedients.
The lessee applies the election consistently to all of its leases.
On January 1, 2019, the Company plans to initially apply IFRS 16 using the modified retrospective approach. Therefore, the cumulative effect of adopting IFRS 16 will be recognized as an adjustment to the opening balance of retained earnings at January 1, 2019, with no restatement of comparative information.
When applying the modified retrospective approach to leases previously classified as op-erating leases under IAS 17, the lessee can elect, on a lease-by-lease basis, whether to ap-ply a number of practical expedients on transition. The Company chooses to elect the following practical expedients:
apply a single discount rate to a portfolio of leases with similar characteristics.
adjust the right-of-use assets, based on the amount reflected in IAS 37 onerous contract provision, immediately before the date of initial application, as an alternative to an im-pairment review.
apply the exemption not to recognize the right-of-use assets and liabilities to leases with lease term that ends within 12 months of the date of initial application.
exclude the initial direct costs from measuring the right-of-use assets at the date of ini-tial application.
use hindsight when determining the lease term if the contract contains options to extend or terminate the lease.

LARGAN PRECISION CO., LTD.
Notes to the Parent Company Only Financial Statements
162 (Continued)
3) So far, the most significant impact identified is that the Company will have to recognize the new assets and liabilities for the operating leases of its offices, warehouses, and fac-tory facilities. The Company estimated its right-of-use assets and lease liabilities to in-crease by $92,749 thousand and $90,364 thousand respectively on January 1, 2019. Be-sides, The Company does not expect the adoption of IFRS 16 to have any impact on its ability to comply with the revised maximum leverage threshold loan covenant.
(ii) IFRIC 23 Uncertainty over Income Tax Treatments
In assessing whether and how an uncertain tax treatment affects the determination of taxable profit (tax loss), tax bases, unused tax losses, unused tax credits, as well as tax rates, an entity shall assume that a taxation authority will examine the amounts it has the right to examine and have a full knowledge on all related information when making those examinations.
If an entity concludes that it is probable that the taxation authority will accept an uncertain tax treatment, the entity shall determine the taxable profit (tax loss), tax bases, unused tax losses, unused tax credits, as well as tax rates consistently with the tax treatment used or planned to be used in its income tax filings. Otherwise, an entity shall reflect the effect of uncertainty for each uncertain tax treatment by using either the most likely amount or the expected value, de-pending on which method the entity expects to better predict the resolution of the uncertainty.
So far, the Company estimated the application of the amendments will not have any significant impact on its deferred tax liabilities and retained earnings on January 1, 2019.
The actual impacts of adopting the standards may change depending on the economic conditions and events which may occur in the future.
(c) The impact of IFRS issued by IASB but not yet endorsed by the FSC
As of the date, the following IFRSs that have been issued by the International Accounting Standards Board (IASB), but have yet to be endorsed by the FSC:
New, Revised or Amended Standards and Interpretations Effective date
per IASB Amendments to IFRS 3 “Definition of a Business” January 1, 2020
Amendments to IFRS 10 and IAS 28 “Sale or Contribution of Assets Between an Investor and Its Associate or Joint Venture”
Effective date to be determined by IASB
IFRS 17 “Insurance Contracts” January 1, 2021
Amendments to IAS 1 and IAS 8 “Definition of Material” January 1, 2020
The Company is evaluating the impact on its financial position and financial performance upon the initial adoption of the abovementioned standards or interpretations. The results thereof will be dis-closed when the Company completes its evaluation.

LARGAN PRECISION CO., LTD.
Notes to the Parent Company Only Financial Statements
163 (Continued)
(4) Summary of significant accounting policies
The significant accounting policies presented in the financial statements are summarized below. Except for those specifically indicated, the following accounting policies were applied consistently throughout the pe-riods presented in the financial statements.
(a) Statement of compliance
The parent company only financial statements have been prepared in accordance with the Regula-tions Governing the Preparation of Financial Reports by Securities Issuers.
(b) Basis of preparation
(i) Basis of measurement
Except for the following significant accounts, the parent company only financial statements have been prepared on the historical cost basis:
1) Financial instruments measured at fair value through profit or loss are measured at fair value;
2) Fair value through other comprehensive income (Available-for-sale financial assets) are measured at fair value.
(ii) Functional and presentation currency
The functional currency is determined based on the primary economic environment in which the entity operates. The Company’s financial statements are presented in New Taiwan Dollar, which is the Company’s functional currency. All financial information presented in New Taiwan Dollar has been rounded to the nearest thousand.
(c) Foreign currency
(i) Foreign currency transaction
Transactions in foreign currencies are translated to the respective functional currencies of the Company at exchange rates at the dates of the transactions. Monetary assets and liabilities de-nominated in foreign currencies at the reporting date are retranslated to the functional currency at the exchange rate at that date. The foreign currency gain or loss on monetary items is the difference between the amortized cost in the functional currency at the beginning of the year adjusted for the effective interest and payments during the period, and the amortized cost in foreign currency translated at the exchange rate at the reporting date.
Non-monetary assets and liabilities denominated in foreign currencies that are measured at fair value are retranslated to the functional currency at the exchange rate at the date that the fair value was determined. Non-monetary items in a foreign currency that are measured based on historical cost are translated using the exchange rate at the date of translation.

LARGAN PRECISION CO., LTD.
Notes to the Parent Company Only Financial Statements
164 (Continued)
Foreign currency differences arising on retranslation are recognized in profit or loss, except for the following differences which are recognized in other comprehensive income arising on the retranslation:
Fair value through other comprehensive income(available-for-sale) equity investment;
A financial liability designated as a hedge of the net investment in a foreign operation to the extent that the hedge is effective; or
Qualifying cash flow hedges to the extent the hedge is effective.
(ii) Foreign operations
The assets and liabilities of foreign operations, including goodwill and fair value adjustments arising on acquisition, are translated to the Company's functional currency at exchange rates at the reporting date. The income and expenses of foreign operations, excluding foreign opera-tions in hyperinflationary economies, are translated to the Company's functional currency at average rate. Foreign currency differences are recognized in other comprehensive income, and presented in the foreign currency translation reserve (translation reserve) in equity.
When a foreign operation is disposed of such that control, significant influence or joint control is lost, the cumulative amount in the translation reserve related to that foreign operation is re-classified to profit or loss as part of the gain or loss on disposal. When the Company's disposes any part of its interest in a subsidiary that includes a foreign operation while retaining control, the relevant proportion of the cumulative amount is reattributed to non-controlling interest. When the Company disposes only part of investment in an associate of joint venture that in-cludes a foreign operation while retaining significant or joint control, the relevant proportion of the cumulative amount is reclassified to profit or loss.
When the settlement of a monetary item receivable from, or payable to, a foreign operation is neither planned nor likely in the foreseeable future, foreign currency gains and losses arising from such items are considered to form part of a net investment in the foreign operation and are recognized in other comprehensive income, and presented in the translation reserve in equity.
(d) Classification of current and non-current assets and liabilities
An asset is classified as current under one of the following criteria, and all other assets are classified as noncurrent.
(i) It expected to be realized, or intended to be sold or consumed, in its normal operating cycle;
(ii) It holds primarily for the purpose of trading;
(iii) It expected to be realized within twelve months after the reporting period; or
(iv) The asset is cash or a cash equivalent, unless the asset is restricted from being exchanged or used to settle a liability for at least twelve months after the reporting period.

LARGAN PRECISION CO., LTD.
Notes to the Parent Company Only Financial Statements
165 (Continued)
A liability is classified as current under one of the following criteria, and all other liabilities are clas-sified as non-current.
(i) It is expected to settled in the normal operating cycle;
(ii) It is held primarily for the purpose of trading;
(iii) It is due to be settled within twelve months after the reporting period; or
(iv) It does not have an unconditional right to defer settlement of the liability for at least twelve months after the reporting period. Terms of a liability that could, at the option of the counter-party, result in its settlement by the issue of equity instruments do not affect its classification.
(e) Cash and cash equivalents
Cash and cash equivalents comprise cash on hand, demand deposits and short-term, highly liquid in-vestments that are readily convertible to known amounts of cash and are subject to an insignificant risk of changes in value. Time deposits which meet the above definition and are held for the purpose of meeting short-term cash commitments rather than for investment or other purposes should be rec-ognized as cash equivalents.
(f) Financial instruments
(i) Financial assets (policy applicable commencing January 1, 2018)
Financial assets are classified into the following categories: measured at amortized cost, fair value through other comprehensive income (FVOCI) and fair value through profit or loss (FVTPL).
The Company shall reclassify all affected financial assets only when it changes its business model for managing its financial assets.
1) Financial assets measured at amortized cost
A financial asset is measured at amortized cost if it meets both of the following condi-tions and is not designated as at FVTPL:
it is held within a business model whose objective is to hold financial assets to col-lect contractual cash flows; and
it is contractual terms give rise on specified dates to cash flows that are solely pay-ments of principal and interest on the principal amount outstanding.

LARGAN PRECISION CO., LTD.
Notes to the Parent Company Only Financial Statements
166 (Continued)
A financial asset measured at amortized cost is initially recognized at fair value, plus any directly attributable transaction costs. These assets are subsequently measured at amor-tized cost using the effective interest method, less any impairment losses. Interest income, foreign exchange gains and losses, and recognition (reversal) of impairment loss, are recognized in profit or loss. Any gain or loss on derecognition is recognized in profit or loss. A regular way purchase or sale of financial assets is recognized and derecognized, as applicable, using trade date accounting.
2) Fair value through other comprehensive income (FVOCI)
A debt investment is measured at FVOCI if it meets both of the following conditions and is not designated as at FVTPL:
it is held within a business model whose objective is achieved by both collecting contractual cash flows and selling financial assets; and
its contractual terms give rise on specified dates to cash flows that are solely pay-ments of principal and interest on the principal amount outstanding.
On initial recognition of an equity investment that is not held for trading, the Company may irrevocably elect to present subsequent changes in the investment’s fair value in other comprehensive income. This election is made on an instrument-by-instrument basis.
A financial asset measured at FVOCI is initially recognized at fair value, plus any direct-ly attributable transaction costs. These assets are subsequently measured at fair value. In-terest income calculated using the effective interest method, foreign exchange gains and losses, and impairment losses, deriving from debt investments are recognized in profit or loss; whereas dividends deriving from equity investments are recognized as income in profit or loss, unless the dividend clearly represents a recovery of part of the cost of the investment. Other net gains and losses of financial assets measured at FVOCI are recog-nized in OCI and accumulated in other equity-unrealized gains (losses) on financial assests measure at FVOCI. On derecognition, gains and losses accumulated in OCI of debt investments are reclassified to profit or loss. However, gains and losses accumulated in OCI of equity investments are reclassified to retain earnings instead of profit or loss.
Dividend income derived from equity investments is recognized on the date that the Company’s right to receive payment is established, which in the case of quoted securi-ties is normally the ex-dividend date. A regular way purchase or sale of financial assets is recognized and derecognized, as applicable, using trade date accounting.

LARGAN PRECISION CO., LTD.
Notes to the Parent Company Only Financial Statements
167 (Continued)
3) Fair value through profit or loss (FVTPL)
All financial assets not classified as amortized cost or FVOCI described as above are measured at FVTPL. On initial recognition, the Company may irrevocably designate a financial asset, which meets the requirements to be measured at amortized cost or at FVOCI, as at FVTPL if doing so eliminates or significantly reduces an accounting mis-match that would otherwise arise.
Financial assets in this category are measured at fair value at initial recognition. At-tributable transaction costs are recognized in profit or loss as incurred. Subsequent changes that are measured at fair value, which take into account any dividend and interest income, are recognized in profit or loss. A regular way purchase or sale of financial assets is recognized and derecognized, as applicable, using trade date accounting.
4) Business model assessment
The Company makes an assessment of the objective of the business model in which a fi-nancial asset is held at portfolio level because this best reflects the way the business is managed and information is provided to management. The information considered in-cludes:
the stated policies and objectives for the portfolio and the operation of those policies in practice. These include whether management’s strategy focuses on earning con-tractual interest income, maintaining a particular interest rate profile, matching the duration of the financial assets to the duration of any related liabilities or expected cash outflows or realizing cash flows through the sale of the assets;
how the performance of the portfolio is evaluated and reported to the Company’s management;
the risks that affect the performance of the business model (and the financial assets held within that business model) and how those risks are managed;
how managers of the business are compensated ─ e.g. whether compensation is based on the fair value of the assets managed or the contractual cash flows collected; and
the frequency, volume and timing of sales of financial assets in prior periods, the reasons for such sales and expectations about future sales activity.
Transfers of financial assets to third parties in transactions that do not qualify for derec-ognition are not considered sales for this purpose, and are consistent with the Company’
s continuing recognition of the assets.
Financial assets that are held for trading or are managed and whose performance is eval-uated on a fair value basis are measured at FVTPL.

LARGAN PRECISION CO., LTD.
Notes to the Parent Company Only Financial Statements
168 (Continued)
5) Assessment whether contractual cash flows are solely payments of principal and interest
For the purposes of this assessment, ‘principal’ is defined as the fair value of the fi-nancial assets on initial recognition. ‘Interest’ is defined as consideration for the time value of money and for the credit risk associated with the principal amount outstanding during a particular period of time and for other basic lending risks and costs, as well as a profit margin.
In assessing whether the contractual cash flows are solely payments of principal and in-terest, the Company considers the contractual terms of the instrument. This includes as-sessing whether the financial asset contains a contractual term that could change the tim-ing or amount of contractual cash flows such that it would not meet this condition. In making this assessment, the Company considers:
contingent events that would change the amount or timing of cash flows;
terms that may adjust the contractual coupon rate, including variable rate features;
prepayment and extension features;and
terms that limit the Company’s claim to cash flows from specified assets(e.g. non-recourse features)
6) Impairment of financial assets
The Company recognizes its loss allowances for expected credit losses on financial assets measured at amortized cost (including cash and cash equivalents, notes and accounts re-ceivable, other receivables, guarantee deposit paid and other financial assets).
The Company measures its loss allowances at an amount equal to lifetime expected credit loss (ECL), except for the following which are measured as 12-month ECL:
debt securities that are determined to have low credit risk at the reporting date;and
other debt securities and bank balances for which the credit risk (i.e. the risk of de-fault occurring over the expected life of the financial instrument) has not increased significantly since initial recognition.
Loss allowance for trade receivables and contract assets are always measured at an amount equal to lifetime ECL.
Lifetime ECLs are the ECLs that result from all possible default events over the expected life of a financial instrument.
12-month ECLs are the portion of ECLs resulting from default events that are possible within the 12 month after the reporting date (or a shorter period if the expected life of the instrument is less than 12 months).
The maximum period considered when estimating ECLs is the maximum contractual pe-riod over which the Company is exposed to credit risk.

LARGAN PRECISION CO., LTD.
Notes to the Parent Company Only Financial Statements
169 (Continued)
When determining whether the credit risk of a financial asset has increased significantly since initial recognition and when estimating ECL, the Company considers reasonable and supportable information that is relevant and available without undue cost or effort. This includes both quantitative and qualitative information and analysis based on the Company’s historical experience and informed credit assessment, as well as for-ward-looking information.
The Company considers a debt security to have low credit risk when its credit risk rating is equivalent to the globally understood definition of ‘investment grade which is con-sidered to be twA or higher per Taiwan Ratings’.
The Company assumes that the credit risk on a financial asset has increased significantly if it is more than 180 days past due.
The Company considers a financial asset to be in default when the financial asset is more than 360 days past due or the borrower is unlikely to fully pay its credit obligations to the Company.
ECLs are a probability-weighted estimate of credit losses. Credit losses are measured as the present value of all cash shortfalls (i.e the difference between the cash flows due to the Company in accordance with the contract and the cash flows that the Company ex-pects to receive). ECLs are discounted at the effective interest rate of the financial asset.
At each reporting date, the Company assesses whether financial assets carried at amor-tized cost are credit-impaired. A financial asset is ‘credit-impaired’ when one or more events that have a detrimental impact on the estimated future cash flows of the fi-nancial asset have occurred. Evidence that a financial assets is credit-impaired includes the following observable data:
significant financial difficulty of the borrower or issuer;
a breach of contract such as a default or being more than 360 days past due;
the lender of the borrower, for economic or contractual reasons relating to the bor-rower's financial difficulty, having granted to the borrower a concession that the lender would not otherwise consider;
it is probable that the borrower will enter bankruptcy or other financial reorganiza-tion;or
the disappearance of an active market for a security because of financial difficulties.
Loss allowances for financial assets measured at amortized cost are deducted from the gross carrying amount of the assets. For debt securities at FVOCI, the loss allowance is recognized in other comprehensive income instead of reducing the carrying amount of the asset. The Company recognizes the amount of expected credit losses (or reversal) in prof-it or loss, as an impairment gain or loss.

LARGAN PRECISION CO., LTD.
Notes to the Parent Company Only Financial Statements
170 (Continued)
The gross carrying amount of a financial asset is written off (either partially or in full) to the extent that there is no realistic prospect of recovery. This is generally the case when the Company determines that the debtor does not have assets or sources of income that could generate sufficient cash flows to repay the amounts subject to the write-off. How-ever, financial assets that are written off could still be subject to enforcement activities in order to comply with the Company’s procedures for recovery of amounts due.
7) Derecognition of financial assets
Financial assets are derecognized when the contractual rights to the cash flows from the assets expire, or when the Company transfers substantially all the risks and rewards of ownership of the financial assets.
On derecognition of a debt instrument in its entirety, the Company recognizes the differ-ence between its carrying amount and the sum of the consideration received or receivable and any cumulative gain or loss that had been recognized in other comprehensive income and presented in “other equity – unrealized gains or losses on fair value through other comprehensive income” , in profit or loss, and presented it in the line item of non-operating income and expenses.
On derecognition of a financial asset other than in its entirety, the Company allocates the previous carrying amount of the financial asset between the part it continues to recognize under continuing involvement, and the part it no longer recognizes on the basis of the rel-ative fair values of those parts on the date of the transfer. The difference between the carrying amount allocated to the part that is no longer recognized and the sum of the con-sideration received for the part no longer recognized and any cumulative gain or loss al-located to it that had been recognized in other comprehensive income is recognized in profit or loss, and presented in the line item of non-operating income and expenses. A cumulative gain or loss that had been recognized in other comprehensive income is allo-cated between the part that continues to be recognized and the part that is no longer rec-ognized on the basis of the relative fair values of those parts.

LARGAN PRECISION CO., LTD.
Notes to the Parent Company Only Financial Statements
171 (Continued)
(ii) Financial assets (Policy applicable before January 1, 2018)
Financial assets are classified into the following categories: available-for-sale financial assets and loans and receivables.
1) Available-for-sale financial assets
Available-for-sale financial assets are non-derivative financial assets that are designated as available for sale or are not classified in any of the other categories of financial assets. Available-for-sale financial assets are recognized initially at fair value, plus any directly attributable transaction costs. Subsequent to initial recognition, they are measured at fair value, and changes therein, other than impairment losses, interest income calculated using the effective interest method, dividend income, and foreign currency differences on available-for-sale debt instruments, are recognized in other comprehensive income and presented in the fair value reserve in equity. When an investment is derecognized, the gain or loss accumulated in equity is reclassified to profit or loss, and included in non-operating income and expense. A regular way purchase or sale of financial assets is recognized and derecognized, as applicable, using trade date accounting.
Investments in equity instruments that do not have a quoted market price in an active market and whose fair value cannot be reliably measured are measured at amortized cost, less any impairment losses and included in financial assets measured at cost.
Dividend income is recognized in profit or loss on the date that the Company's right to receive payment is established, which in the case of quoted securities is normally the ex-dividend date. Such dividend income is included in non-operating income and ex-pense.
Interest income from investment in bond security is recognized in profit or loss, under other income of non-operating income and expense.
2) Loans and receivables
Loans and receivables are financial assets with fixed or determinable payments that are not quoted in an active market. Such assets are recognized initially at fair value, plus any directly attributable transaction costs. Subsequent to initial recognition, loans and receiv-ables other than insignificant interest on short-term receivables are measured at amortized cost using the effective interest method, less any impairment losses. A regular way pur-chase or sale of financial assets is recognized and derecognized, as applicable, using trade-date accounting.
Interest income is recognized in profit or loss, and it is included in non-operating income and expense.
3) Impairment of financial assets
Except for financial assets at fair value through profit or loss, financial assets are assessed for impairment at each reporting date. A financial asset is impaired if, and only if, there is objective evidence of impairment as a result of one or more events that occurred after the initial recognition of the asset (a ‘loss event’) and that loss event (or events) has an impact on the estimated future cash flows of the financial asset that can be estimated

LARGAN PRECISION CO., LTD.
Notes to the Parent Company Only Financial Statements
172 (Continued)
reliably.
Objective evidence that financial assets are impaired includes default or delinquency by a debtor, restructuring of an amount due to the Company on terms that the Company would not consider otherwise, indications that a debtor or issuer will enter bankruptcy, adverse changes in the payment status of borrowers or issuers, economic conditions that correlate with defaults, or the disappearance of an active market for a security. In addition, for an investment in an equity security, a significant or prolonged decline in its fair value below its cost is considered objective evidence of impairment.
All individually significant receivables are assessed for specific impairment. Receivables that are not individually significant are collectively assessed for impairment by grouping together assets with similar risk characteristics. In assessing collective impairment, the Company uses historical trends of the probability of default, the timing of recoveries, and the amount of loss incurred, adjusted for management’s judgment as to whether current economic and credit conditions are such that the actual losses are likely to be greater or less than the those suggested by historical trends.
An impairment loss in respect of a financial asset measured at amortized cost is calculat-ed as the difference between its carrying amount and the present value of the estimated future cash flows discounted at the asset’s original effective interest rate.
An impairment loss in respect of a financial asset measured at cost is calculated as the difference between its carrying amount and the present value of the estimated future cash flows discounted at the current market rate of return for a similar financial asset. Such impairment loss is not reversible in subsequent periods.
An impairment loss in respect of a financial asset is deducted from the carrying amount, except for accounts receivable, for which an impairment loss is reflected in an allowance account against the receivables. When it is determined a receivable is uncollectible, it is written off from the allowance account. Changes in the amount of the allowance account are recognized in profit or loss.
Impairment losses on available-for-sale financial assets are recognized by reclassifying the losses accumulated in the fair value reserve in equity to profit or loss.
If, in a subsequent period, the amount of impairment loss on a financial asset measured at amortized cost decreases and the decrease can be related objectively to an event occurring after the impairment was recognized, the decrease in impairment loss is reversed through profit or loss to the extent that the carrying value of the asset does not exceed its amor-tized cost before impairment was recognized at the reversal date.
Impairment losses recognized on an available-for-sale equity security are not reversed through profit or loss. Any subsequent recovery in the fair value of an impaired availa-ble-for-sale equity security is recognized in other comprehensive income, and accumu-lated in other equity. If, in a subsequent period, the fair value of an impaired availa-ble-for-sale debt security increases and the increase can be related objectively to an event occurring after the impairment loss was recognized, then the impairment loss is reversed, with the amount of the reversal recognized in profit or loss.

LARGAN PRECISION CO., LTD.
Notes to the Parent Company Only Financial Statements
173 (Continued)
Bad debt expenses and reversal of allowance for doubtful debts for trade receivables are recognized in general and administrative expenses while impairment losses and reversal of impairment for financial assets other than receivables are recognized under non-operating income and expenses.
4) Derecognition of financial assets
Financial assets are derecognized when the contractual rights of the cash inflow from the assets are terminated, or when the Company transfers substantially all the risks and re-wards of ownership of the financial assets.
On derecognition of a financial asset in its entirety, the difference between the carrying amount and the sum of the consideration received or receivable and any cumulative gain or loss that had been recognized in other comprehensive income and presented in “oth-er equity – unrealized gains or losses on available-for-sale financial assets” in profit or loss is included in non-operating income and expenses.
On derecognition of a financial assets other than in its entirely, the Company separates the part that continues to be recognized and the part that is derecognized based on the rel-ative fair values of those parts on the date of the transfer. The difference between the carrying amount allocated to the part derecognized and the sum of the consideration re-ceived for the part derecognized, and any cumulative gain or loss allocated to it that had been recognized in other comprehensive income, shall be recognized in profit or loss and presented in the line item of non-operating income and expenses. A cumulative gain or loss that had been recognized in other comprehensive income is allocated between the part that continues to be recognized and the part that is no longer recognized on the basis of the relative fair values of those parts.
(iii) Financial liabilities and equity instrument
1) Classification of debt or equity
Debt or equity instruments issued by the Company are classified as financial liabilities or equity in accordance with the substance of the contractual agreement.
An equity instrument is any contract that evidences residual interest in the assets of an entity after deducting all of its liabilities. Equity instruments issued are recognized as the amount of consideration received, less the direct cost of issuing.
Interest related to the financial liability is recognized in profit or loss, and included in non-operating income and expenses.
On conversion, the financial liability is reclassified to equity, and no gain or loss is rec-ognized.

LARGAN PRECISION CO., LTD.
Notes to the Parent Company Only Financial Statements
174 (Continued)
2) Other financial liabilities
Financial liabilities not classified as held for trading or designated as at fair value through profit or loss are measured at fair value, plus any directly attributable transaction costs at the time of initial recognition. Subsequent to initial recognition, they are measured at amortized cost calculated using the effective interest method. Interest expense not capi-talized as capitalized cost is recognized in profit or loss, and included in non-operating income and expense.
3) Derecognition of financial liabilities
The Company derecognizes a financial liability when its contractual obligation has been discharged or cancelled, or has expired. The difference between the carrying amount of a financial liability removed and the consideration paid (including any non-cash assets transferred or liabilities assumed) is recognized in profit or loss, and included in non-operating income or expenses.
4) Offsetting of financial assets and liabilities
The Company presents its financial assets and liabilities on a net basis when the Compa-ny has the legally enforceable right to offset and intends to settle such financial assets and liabilities on a net basis or to realize the assets and settle the liabilities simultaneously.
(g) Inventories
Inventories are measured at the lower of cost and net realizable value. The cost of inventories is based on the weighted-average method and includes expenditure incurred in acquiring the inventories, production or conversion costs, and other costs incurred in bringing them to their existing location and condition. In the case of manufactured inventories and work in progress, cost includes an appro-priate share of production overheads based on normal operating capacity.
Net realizable value is the estimated selling price in the ordinary course of business, less the esti-mated costs of completion and selling expenses.
(h) Investment in subsidiaries
The subsidiaries in which the Company holds controlling interest are accounted for under equity method in the non-consolidated financial statements. Under equity method, the net income, other comprehensive income and equity in the non-consolidated financial statement are the same as those attributable to the owners of the parent in the consolidated financial statements.
The changes in ownership of the subsidiaries are recognized as equity transaction.

LARGAN PRECISION CO., LTD.
Notes to the Parent Company Only Financial Statements
175 (Continued)
(i) Property, plant and equipment
(i) Recognition and measurement
Items of property, plant and equipment are measured at cost, less accumulated depreciation and accumulated impairment losses. Cost includes expenditure that is directly attributed to the ac-quisition of the asset. The cost of a self-constructed asset comprises material, labor, any cost directly attributable to bringing the asset to the location and condition necessary for it to be ca-pable of operating in the manner intended by management, the initial estimate of the costs of dismantling and removing the item and restoring the site on which it is located, and any bor-rowing cost that is eligible for capitalization. Cost also includes transfers from equity of any gain or loss on qualifying cash flow hedges of foreign currency purchases of property, plant and equipment. The cost of software is capitalized as part of the property, plant and equipment if the purchase of the software is necessary for the property, plant and equipment to be capable of operating.
Each part of an item of property, plant and equipment with a cost that is significant in relation to the total cost of the item shall be depreciated separately, unless the useful life and deprecia-tion method of that significant part are the same as those of another significant part of that same item.
The gain or loss arising from the derecognition of an item of property, plant and equipment is determined as the difference between the net disposal proceeds, if any, and the carrying amount of the item, and it shall be recognized in profit or loss, under net other income and expenses.
(ii) Subsequent cost
Subsequent expenditure is capitalized only when it is probable that future economic benefits associated with the expenditure will flow to the Company. The carrying amount of those parts of fixed assets that are replaced is derecognized. Ongoing repairs and maintenance are ex-pensed as incurred.
(iii) Depreciation
Depreciation is calculated on the cost of an asset, less its residual value and is recognized in profit or loss on a straight-line basis over the estimated useful lives of each component of an item of property, plant and equipment. Items of property, plant and equipment with the same useful life may be grouped in determining the depreciation charge. The remainder of the items may be depreciated separately.
Leased assets are depreciated by using the straight-line method during the period of expected use, consistent with the depreciation policy the lessee adopts for depreciable assets that are owned. If there is reasonable certainty that the lessee will obtain ownership by the end of the lease term, the period of expected use is the useful life of the asset; otherwise, the asset is de-preciated over the shorter of the lease term and its useful life.
Land has an unlimited useful life, and therefore, is not depreciated.

LARGAN PRECISION CO., LTD.
Notes to the Parent Company Only Financial Statements
176 (Continued)
The estimated useful lives for the current and comparative years of significant items of proper-ty, plant and equipment are as follows:
1) Buildings 35 ~55years 2) Machinery and equipment 2 ~ 10 years
Plant constitutes mainly building, electromechanical power engineering and cleanroom air conditioning project. Each such part is depreciated based on its useful life of 35~55 years, 8~ 10 years and 8~10 years, respectively.
The depreciation methods, useful lives, and residual values are reviewed at each reporting date. If expectations differ from the previous estimates, the changes are accounted for as changes in accounting estimates.
(j) Leases
(i) Lessor
Lease income from an operating lease is recognized in income on a straight-line basis over the lease term. Initial direct costs incurred in negotiating and arranging an operating lease are add-ed to the carrying amount of the leased asset, and recognized as an expense over the lease term on the same basis as the lease income. Incentives granted to the lessee to enter into an operating lease are spread over the lease term on a straight-line basis so that the lease income received is reduced accordingly.
(ii) Lessee
Leases of the Company are operating leases and are not recognized in the Company’s balance sheets. Payments made under operating leases (excluding insurance and maintenance expenses) are recognized in profit or loss on a straight-line basis over the term of the lease. Incentives granted to the lessee to enter into an operating lease are spread over the lease term on a straight-line basis so that the lease payments is reduced accordingly.
(k) Intangible assets
(i) Other intangible assets
Other intangible assets that are acquired by the Company are measured at cost, less, accumu-lated amortization and any accumulated impairment losses.
(ii) Subsequent expenditure
Subsequent expenditure is capitalized only when it increases the future economic benefits em-bodied in the specific asset to which it relates. All other expenditure, including expenditure on internally generated goodwill and brands, is recognized in profit or loss as incurred.

LARGAN PRECISION CO., LTD.
Notes to the Parent Company Only Financial Statements
177 (Continued)
(iii) Amortization
The amortizable amount is the cost of an asset, less, its residual value. Except for goodwill and intangible assets with indefinite useful lives, amortization is recognized in profit or loss on a straight-line basis over the estimated useful lives of intangible assets from the date that they are available for use. The estimated useful lives for the current and comparative periods are as fol-lows:
Computer software cost 1~3 years
The residual value, amortization period and the amortization method for an intangible asset with a finite useful life shall be reviewed at least annually at each fiscal year-end. Any changes shall be accounted for as a changes in accounting estimates.
(l) Impairment of non-financial assets
The Company assesses non-derivative financial assets for impairment (except for inventories, assets arising from construction contracts, deferred income tax assets and employee benefits) at every re-porting date, and estimates its recoverable amount. If it is not possible to determine the recoverable amount (fair value, less, cost to sell and value in use) for the individual asset, then the Company will have to determine the recoverable amount for the asset's cash-generating unit (CGU).
The recoverable amount for an individual asset or a CGU is the higher of its fair value, less, costs to sell and its value in use. If, and only if, the recoverable amount of an asset is less than its carrying amount, the carrying amount of the asset shall be reduced to its recoverable amount; and that reduc-tion will be accounted as an impairment loss, which shall be recognized immediately in profit or loss.
The Company assesses at the end of each reporting period whether there is any indication that an impairment loss recognized in prior periods for an asset other than goodwill may no longer exist or may have decreased. An impairment loss recognized in prior periods for an asset other than goodwill shall be reversed if, and only if, there has been a change in the estimates used to determine the asset’s recoverable amount since the last impairment loss was recognized. In this case, the carrying amount of the asset shall be increased to its recoverable amount. That increase is a reversal of an impairment loss.
(m) Provisions
A provision is recognized if, as a result of a past event, the Company has a present legal or construc-tive obligation that can be estimated reliably, and it is probable that an outflow of economic benefits will be required to settle the obligation. Provisions are determined by discounting the expected future cash flows at a pre-tax rate that reflects the current market assessments of the time value of money and the risks specific to the liability. The unwinding of the discount is recognized as finance cost.

LARGAN PRECISION CO., LTD.
Notes to the Parent Company Only Financial Statements
178 (Continued)
(n) Revenue
(i) Revenue from contracts with customers (policy applicable commencing January 1, 2018)
Revenue is measured based on the consideration to which the Company expects to be entitled in exchange for transferring goods or services to a customer. The Company recognizes revenue when it satisfies a performance obligation by transferring control of a good or a service to a customer. The accounting policies for the Company’s main types of revenue are explained below.
1) Sale of goods
The Company manufactures and sells various multiples lens to mobile phone manufac-turers. The Company recognizes revenue when control of the products has transferred, being when the products are delivered to the customer, the customer has full discretion over the channel and price to sell the products, and there is no unfulfilled obligation that could affect the customer’s acceptance of the products. Delivery occurs when the prod-ucts have been shipped to the specific location, the risks of obsolescence and loss have been transferred to the customer, and either the customer has accepted the products in accordance with the sales contract, the acceptance provisions have lapsed, or the Com-pany has objective evidence that all criteria for acceptance have been satisfied.
A receivable is recognized when the goods are delivered as this is the point in time that the Company has a right to an amount of consideration that is unconditional.
2) Financing components
The Company does not expect to have any contracts where the period between the trans-fer of the promised goods or services to the customer and payment by the customer ex-ceeds one year. As a consequence, the Company does not adjust any of the transaction prices for the time value of money.
(ii) Revenue (Policy applicable before January 1, 2018)
1) Goods sold
Revenue from the sale of goods in the course of ordinary activities is measured at the fair value of the consideration received or receivable, net of returns, trade discounts and volume rebates. Revenue is recognized when persuasive evidence exists, usually in the form of an executed sales agreement, that the significant risks and rewards of ownership have been transferred to the customer, recovery of the consideration is probable, the as-sociated costs and possible return of goods can be estimated reliably, there is no continu-ing management involvement with the goods, and the amount of revenue can be meas-ured reliably. If it is probable that discounts will be granted and the amount can be meas-ured reliably, then the discount is recognized as a reduction of revenue as the sales are recognized.
The timing of the transfers of risks and rewards varies depending on the individual terms of the sales agreement. For international shipments, transfer occurs upon loading the goods onto the relevant carrier at the client’s designated location. For domestic

LARGAN PRECISION CO., LTD.
Notes to the Parent Company Only Financial Statements
179 (Continued)
shipments, transfer occurs upon loading the goods delivered to the customer's premises.
2) Services
The Company provides consultancy services and management services to its customers. Revenue from services rendered is recognized in profit or loss in proportion to the stage of completion of the transaction at the reporting date.
3) Commissions
When the Company acts in the capacity of an agent rather than as the principal in a transaction, the revenue recognized is the net amount of commission made by the Com-pany.
(iii) Contract costs (policy applicable from January 1, 2018)
1) Incremental costs of obtaining a contract
The Company recognizes as an asset the incremental costs of obtaining a contract with a customer if the Company expects to recover those costs. The incremental costs of obtain-ing a contract are those costs that the Company incurs to obtain a contract with a custom-er that it would not have incurred if the contract had not been obtained. Costs to obtain a contract that would have been incurred regardless of whether the contract was obtained shall be recognized as an expense when incurred, unless those costs are explicitly chargeable to the customer regardless of whether the contract is obtained.
The Company applies the practical expedient to recognize the incremental costs of ob-taining a contract as an expense when incurred if the amortization period of the asset that the entity otherwise would have recognized is one year or less.
2) Costs to fulfil a contract
If the costs incurred in fulfilling a contract with a customer are not within the scope of another Standard (for example, IAS 2 Inventories, IAS 16 Property, Plant and Equipment or IAS 38 Intangible Assets), the Company recognizes an asset from the costs incurred to fulfil a contract only if those costs meet all of the following criteria:
the costs relate directly to a contract or to an anticipated contract that the Company can specifically identify;
the costs generate or enhance resources of the Company that will be used in satisfying (or in continuing to satisfy) performance obligations in the future; and
the costs are expected to be recovered.
For general and administrative costs, costs of wasted materials, labor or other resources to fulfil the contract that were not reflected in the price of the contract, costs that relate to satisfied performance obligations (or partially satisfied performance obligations), and costs for which the Company cannot distinguish whether the costs relate to unsatisfied performance obligations or to satisfied performance obligations(or partially satisfied per-formance obligations), the Company recognizes these costs as expenses when incurred.
(o) Employee benefits

LARGAN PRECISION CO., LTD.
Notes to the Parent Company Only Financial Statements
180 (Continued)
(i) Defined contribution plans
Obligations for contributions to defined contribution pension plans are recognized as an em-ployee benefit expense in profit or loss in the periods during which services are rendered by employees.
(ii) Defined benefit plans
A defined benefit plan is a post-employment benefit plan other than a defined contribution plan. The Company’s net obligation in respect of defined benefit pension plans is calculated sepa-rately for each plan by estimating the amount of future benefit that employees have earned in return for their service in the current and prior periods based on the discounted present value of the said defined benefit obligation. Any unrecognized past service costs and the fair value of any plan assets are deducted for purposes of determining the Company’s net defined benefit obligation. The discount rate used in calculating the present value is the market yield at the re-porting date of government bonds that have maturity dates approximating the terms of the Company’s obligations and that are denominated in the same currency in which the benefits are expected to be paid.
The calculation is performed annually by a qualified actuary using the projected unit credit method. If the calculation results in a benefit to the Company, the recognized asset is limited to the total of any unrecognized past service costs and the present value of economic benefits available in the form of any future refunds from the plan or reductions in future contributions to the plan. In calculating the present value of economic benefits, consideration is given to any minimum funding requirements that apply to any plan in the Company. An economic benefit is available to the Company if it is realizable during the life of the plan, or on settlement of the plan liabilities.
If the benefits of a plan are improved, the pension cost incurred from the portion of the in-creased benefit relating to service by employees, is recognized immediately in profit or loss.
Remeasurements of the net defined benefit liability (asset), which comprise (1) actuarial gains and losses, (2) the return on plan assets (excluding interest), and (3) the effect of the asset ceil-ing (if any, excluding interest), are recognized immediately in other comprehensive income. Remeasurements of the net defined benefit plan of the Group shall be recognized in remained earnings.
Gains or losses on the curtailment or settlement of a defined benefit plan are recognized when the curtailment or settlement occurs. The gains or losses on curtailment arise from any changes in the fair value of plan assets, any changes in the present value of the defined benefit obliga-tion, and any related actuarial gains or losses and past service cost which had not previously been recognized.

LARGAN PRECISION CO., LTD.
Notes to the Parent Company Only Financial Statements
181 (Continued)
(iii) Short-term employee benefits
Short-term employee benefit obligations are measured on an undiscounted basis and are ex-pensed when related services are provided.
A liability is recognized for the amount expected to be paid under short-term cash bonus or profit-sharing plans if the Company has a present legal or constructive obligation to pay this amount as a result of past service provided by the employee, and the obligation can be estimat-ed reliably.
(p) Income taxes
Income tax expenses include both current taxes and deferred taxes. Except for expenses related to business combinations, or those recognized directly in equity or other comprehensive income, all current and deferred taxes shall be recognized in profit or loss.
Current taxes include tax payables and tax deduction receivables on taxable gains (losses) for the year calculated using the statutory tax rate on the reporting date or the actual legislative tax rate; they also include tax adjustments related to prior years.
Deferred taxes arise due to temporary differences between the carrying amounts of assets and liabili-ties for financial reporting purposes and their respective tax bases. Deferred taxes are recognized ex-cept for the following:
(i) Assets and liabilities that are initially recognized but not related to the business combination, and have no effect on net income or taxable gains (losses) during the transaction.
(ii) Temporary differences arising from equity investments on subsidiaries or joint ventures, where there is a high probability that such temporary differences, will not reverse.
(iii) Initial recognition of goodwill.
Deferred tax assets and liabilities shall be measured at the tax rates that are expected to apply to the period when the asset is realized or the liability is settled, which are normally the tax rates that have been enacted or substantively enacted by the end of the reporting period.
Deferred tax assets and liabilities may be offset against each other if the following criteria are met:
(i) the entity has the legal right to settle tax assets and liabilities on a net basis; and
(ii) the taxing of deferred tax assets and liabilities fulfill one of the below scenarios:
1) levied by the same taxing authority; or
2) levied by different taxing authorities, but where each such authority intend to settle tax assets and liabilities (where such amounts are significant) on a net basis every year of the period of expected asset realization or debt liquidation; or where the timing of asset real-ization and debt liquidation is matched.

LARGAN PRECISION CO., LTD.
Notes to the Parent Company Only Financial Statements
182 (Continued)
A deferred tax asset should be recognized for the carry-forward of unused tax losses, unused tax credits, and deductible temporary differences, to the extent that it is probable that future taxable prof-it will be available against which the unused tax losses, unused tax credits, and deductible temporary differences can be utilized. Such unused tax losses, unused tax credits, and deductible temporary dif-ferences are also reevaluated every year on the financial reporting date, and adjusted based on the probability that the future taxable profit will be available against which the unused tax losses, unused tax credits, and deductible temporary differences can be utilized.
(q) Earnings per share
The Company discloses the Company’s basic and diluted earnings per share attributable to ordinary shareholders of the Company. Basic earnings per share are calculated as the profit attributable to or-dinary shareholders of the Company, divided by the weighted-average number of ordinary shares outstanding. Diluted earnings per share are calculated as the profit attributable to ordinary sharehold-ers of the Company, divided by the weighted-average number of ordinary shares outstanding after adjustment for the effects of all potentially dilutive ordinary shares, such as employee bonus.
(r) Operating segments
The Company has disclosed the information on operating segments in its consolidated financial statements. Hence, no further information is disclosed in the parent company only financial state-ments.
(5) Significant accounting assumptions and judgments, and major sources of estimation uncertainty
The preparation of the parent Company only financial statements in conformity with the Regulations Gov-erning the Preparation of Financial Reports by Securities Issuers requires management to make judgments, estimates and assumptions that affect the application of the accounting policies and the reported amount of assets, liabilities, income and expenses. Actual results may differ from these estimates.
The management continues to monitor the accounting estimates and assumptions. It recognizes any chang-es in accounting estimates during the period and the impact of those changes in accounting estimates in the following period.
Information about assumptions and estimation uncertainties that have a significant risk of resulting in a material adjustment within the next financial year is as follows:
(a) Valuation of inventories
As inventories are stated at the lower of cost or net realizable value, the Company estimates the net realizable value of inventories for obsolescence and unmarketable items at the end of the reporting period and then writes down the cost of inventories to net realizable value. The net realizable value of the inventory is mainly determined based on assumptions as to future demand within a specific time horizon. Due to the rapid industrial transformation, there may be significant changes in the net realizable value of inventories. Please refer to note 6(g) for further description of the valuation of in-ventories.

LARGAN PRECISION CO., LTD.
Notes to the Parent Company Only Financial Statements
183 (Continued)
(b) The loss allowance of trade receivable
The Company has estimated the loss allowance of trade receivable that is based on the risk of a de-fault occurring and the rate of expected credit loss. The Company has considered historical experi-ence, current economic conditions and forward-looking information at the reporting date to deter-mine the assumptions to be used in calculating the impairments and the selected inputs. For relevant assumptions and input values, please refer to note 6(e).
(6) Explanation of significant accounts
(a) Cash and cash equivalents
December 31, 2018
December 31, 2017
Petty cash and cash on hand $ 536 516
Demand deposits 6,600,393 6,490,310
Time deposits 49,623,261 40,233,960
Cash and cash equivalents in the consolidated state-ment of cash flows $ 56,224,190 46,724,786
Please refer to note 6(w) for the exchange rate risk and sensitivity analysis of the financial assets and liabilities of the Company.
(b) Financial assets at fair value through profit or loss
December 31, 2018
December 31, 2017
Mandatorily measured at fair value through profit or loss:
Non-derivative financial assets
Stocks unlisted in domestic markets $ - -
Beneficiary Certificate-open-end funds 1,291,809 -
Total $ 1,291,809 -
For market risk, please refer to note 6(w).
(c) Financial assets at fair value through other comprehensive income
December 31, 2018
Equity investments at fair value through other comprehensive income
Listed common shares
Domestic Company - AVISION INC. $ 23,389

LARGAN PRECISION CO., LTD.
Notes to the Parent Company Only Financial Statements
184 (Continued)
(i) Equity investments at fair value through other comprehensive income
On January 1, 2018, the Company designated the investments shown above as equity securities as at fair value through other comprehensive income because these equity securities represent those investments that the Company intends to hold for long-term for strategic purposes. These investments were classified as available-for-sale financial assets on December 31, 2017.
On March 12, 2018, the Company has sold 165 thousands of its share in AVISION INC. due to financial management reason. The shares sold had a fair value of $1,233 thousand, and the Company realized a gain of $14 thousand, which is already included in other comprehensive income. The gain has been transferred to retained earnings.
(ii) For market risk, please refer to note 6(w).
(iii) As of December 31, 2018, the financial assets at fair value through other comprehensive in-come of the Company had not been pledged as collateral for long-term borrowing.
(d) Available-for-sale financial assets
(i) Available - for-sale financial assets-current was as follows:
December 31, 2017
Stocks listed on domestic markets $ 38,588
Beneficiary certificate-open-end funds 1,971,967
Total $ 2,010,555
(ii) These investments were classified as financial assets at fair value through other comprehensive income and financial assets at fair value through profit or loss on December 31, 2018; please refer to note 6(b) and (c).
(iii) For market risk, please refer to note 6(w).
(iv) As of December 31, 2017, the available-for-sale financial assets of the Company had not been pledged as collateral for long-term borrowings.
(e) Notes and accounts receivable
December 31, 2018
December 31, 2017
Notes receivable from non-operating activities $ 3 -
Accounts receivable-measured as amortized cost 2,641,734 4,785,588
Accounts receivable from related parties-measured as amortized cost 7,716,994 6,697,809
Less: Loss allowance (2,250) (2,250)
$ 10,356,481 11,481,147

LARGAN PRECISION CO., LTD.
Notes to the Parent Company Only Financial Statements
185 (Continued)
The Company applies the simplified approach to provide for its expected credit losses, i.e. the use of lifetime expected loss provision for all receivables on December 31, 2018. To measure the expected credit losses, accounts receivable have been grouped based on shared credit risk characteristics and the days past due, as well as incorporated forward looking information, including macroeconomic and relevant industry information. The loss allowance provision as of December 31, 2018 was de-termined as follows:
Gross carrying amount
Weighted-average loss rate
Loss allowance provision
Current $ 10,041,444 - -
Overdue 1 to 60 days 317,287 0.7091% 2,250
$ 10,358,731 2,250
As of December 31, 2017, the Company applied the incurred loss model to consider the loss allow-ance on provision for notes and accounts receivable, and the aging analysis of notes and accounts re-ceivable, which were past due but not impaired, as follows:
December 31, 2017Overdue 1 to 60 days $ 211,472
The movement in the allowance for notes and accounts receivable was as follows:
December 31, 2017
December 31, 2018
Individually assessed im-
pairment
Collectively assessed im-
pairment Balance on January 1, 2018 and 2017 per IAS 39 $ 2,250 2,250 -
Adjustment on initial application of IFRS 9 - - -
Balance on January 1, 2018 per IFRS 9 2,250 - -
Foreign exchange gains/(losses) - - -
Balance on December 31, 2018 and 2017 $ 2,250 2,250 -
The Company applied the incurred loss model to consider the allowance of its notes and accounts receivable as of December 31, 2017. The allowance for doubtful receivables were assessed by using the reference to collectability of notes and accounts receivable. The Company considered any chang-es in the credit quality of the accounts receivable since the date credit was initially granted to the end of the reporting period. The Company recognized an allowance for impairment loss of 100% against all receivables over one year due to historical experience showing that such receivables are uncol-lectible. Allowance for impairment loss was recognized against accounts receivable within a year based on the estimated irrecoverable amounts determined by reference to past default experience of the counterparties and an analysis of their current financial position.
Impairment loss recognized for individually assessed impairment is the difference between the car-rying amount and the amount expected to be collected as of December 31, 2017.
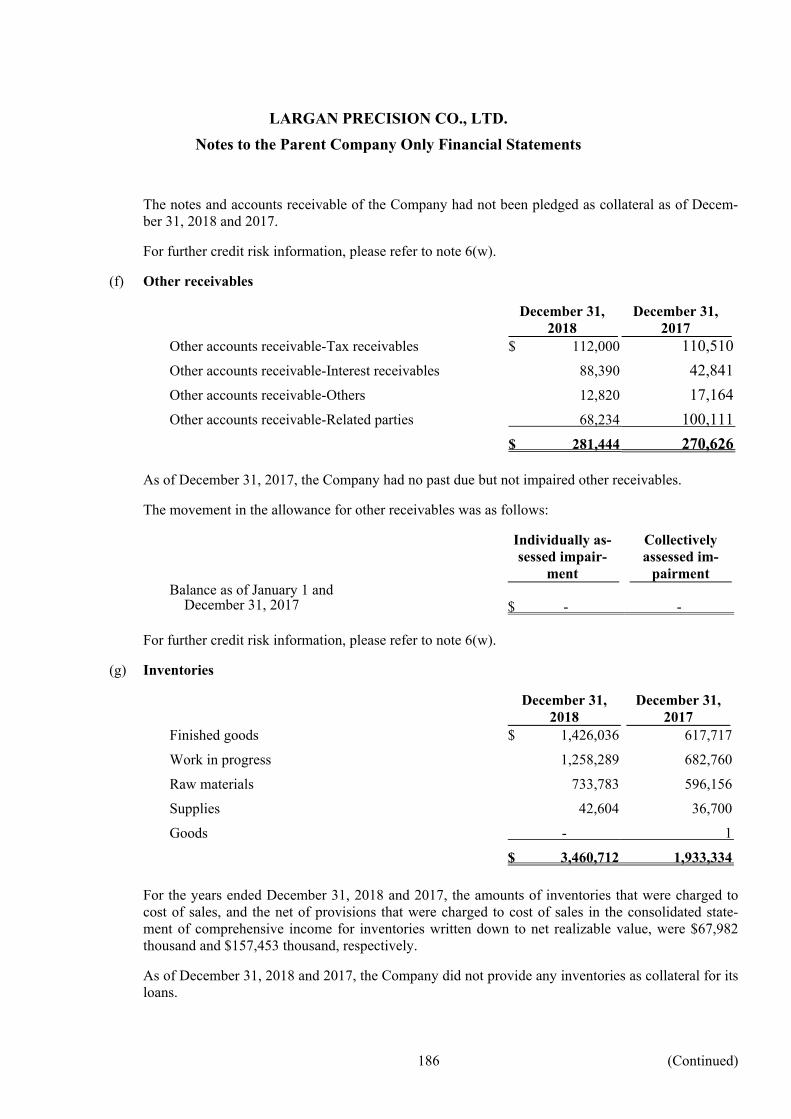
LARGAN PRECISION CO., LTD.
Notes to the Parent Company Only Financial Statements
186 (Continued)
The notes and accounts receivable of the Company had not been pledged as collateral as of Decem-ber 31, 2018 and 2017.
For further credit risk information, please refer to note 6(w).
(f) Other receivables
December 31, 2018
December 31, 2017
Other accounts receivable-Tax receivables $ 112,000 110,510
Other accounts receivable-Interest receivables 88,390 42,841
Other accounts receivable-Others 12,820 17,164
Other accounts receivable-Related parties 68,234 100,111
$ 281,444 270,626
As of December 31, 2017, the Company had no past due but not impaired other receivables.
The movement in the allowance for other receivables was as follows:
Individually as-sessed impair-
ment
Collectively assessed im-
pairment Balance as of January 1 and December 31, 2017 $ - -
For further credit risk information, please refer to note 6(w).
(g) Inventories
December 31, 2018
December 31, 2017
Finished goods $ 1,426,036 617,717
Work in progress 1,258,289 682,760
Raw materials 733,783 596,156
Supplies 42,604 36,700
Goods - 1
$ 3,460,712 1,933,334
For the years ended December 31, 2018 and 2017, the amounts of inventories that were charged to cost of sales, and the net of provisions that were charged to cost of sales in the consolidated state-ment of comprehensive income for inventories written down to net realizable value, were $67,982 thousand and $157,453 thousand, respectively.
As of December 31, 2018 and 2017, the Company did not provide any inventories as collateral for its loans.

LARGAN PRECISION CO., LTD.
Notes to the Parent Company Only Financial Statements
187 (Continued)
(h) Investments accounted for using equity method
A summary of the Company’s financial information for investments accounted for using equity method at the reporting date is as follows:
December 31, 2018
December 31, 2017
Subsidiary-Largan (Hong Kong) Limited. $ 341,593 323,482
Subsidiary-Asto International Ltd. 29,566,165 27,014,709
Subsidiary-Ba Fang Co., Ltd. 22,780 23,919
Subsidiary-Largan Digital Co., Ltd. 167,944 120,318
Prepayments for long-term investment 8,800 -
$ 30,107,282 27,482,428
The prepayments for long-term investment was used for the investment in Largan Health AI-Tech Co., Ltd., as of December 31, 2018, wherein the registration of incorporation has yet to be completed.
(i) Subsidiaries
Please refer to the consolidated financial statements of the year 2018.
(ii) Collateral
As of December 31, 2018 and 2017, the Company did not provide any investment accounted for us-ing equity method as collaterals for its loans.

LARGAN PRECISION CO., LTD.
Notes to the Parent Company Only Financial Statements
188 (Continued)
(i) Property, plant and equipment
The cost, depreciation, and impairment of the property, plant and equipment of the Company in 2018 and 2017, were as follows:
Land
Building and Construction
Machinery and
equipment
Transportationequipment
Office
equipment and other facilities
Rental assets
Construction in progress and
testing equip
Total
Cost or deemed cost:
Balance on January 1, 2018 $ 4,709,398 1,887,298 15,613,060 19,363 5,556,219 54,898 9,071,986 36,912,222
Additions 771,850 231,464 3,276,857 1,723 970,015 - 588,215 5,840,124
Disposal - - (5,992) (534) (3,500) - - (10,026)
Reclassification - 3,854,971 683,695 - 4,019,513 - (8,569,677) (11,498)
Balance on December 31, 2018 $ 5,481,248 5,973,733 19,567,620 20,552 10,542,247 54,898 1,090,524 42,730,822
Balance on January 1,2017 $ 3,694,827 1,851,985 12,696,552 17,948 4,966,450 54,898 6,847,120 30,129,780
Additions 1,014,571 31,386 2,710,125 1,415 603,590 - 2,470,393 6,831,480
Disposal - - (21,981) - (27,057) - - (49,038)
Reclassification - 3,927 228,364 - 13,236 - (245,527) -
Balance on December 31, 2017 $ 4,709,398 1,887,298 15,613,060 19,363 5,556,219 54,898 9,071,986 36,912,222
Depreciation and impairment loss:
Balance on January 1,2018 $ - 323,050 8,320,609 13,280 3,807,880 20,430 - 12,485,249
Depreciation for the year - 93,802 1,812,134 2,220 857,745 406 - 2,766,307
Disposal - - (4,426) (371) (3,500) - - (8,297)
Reclassification - - - - (35) - - (35)
Balance on December 31, 2018 $ - 416,852 10,128,317 15,129 4,662,090 20,836 - 15,243,224
Balance on January 1, 2017 $ - 281,945 6,813,935 10,602 3,205,137 20,024 - 10,331,643
Depreciation for the year - 41,105 1,528,320 2,678 629,567 406 - 2,202,076
Disposal - - (21,646) - (26,824) - - (48,470)
Balance on December 31, 2017 $ - 323,050 8,320,609 13,280 3,807,880 20,430 - 12,485,249
Carrying amounts:
Balance on December 31, 2018 $ 5,481,248 5,556,881 9,439,303 5,423 5,880,157 34,062 1,090,524 27,487,598
Balance on January 1, 2017 $ 3,694,827 1,570,040 5,882,617 7,346 1,761,313 34,874 6,847,120 19,798,137
Balance on December 31,2017 $ 4,709,398 1,564,248 7,292,451 6,083 1,748,339 34,468 9,071,986 24,426,973
In 2013, the Company acquired a piece of land, for the expansion of its factory, amounting to $120,086 thousand, which was recognized under property, plant and equipment. The title of the said land cannot be transferred to the Company due to its classification. Therefore, it was registered under the name of a different person. To ensure the right of both parties (including that of the Com-pany’s shareholders), the two parties entered into an agreement, with the notarization of the court. In the future, the Company will file an application to the relevant authorities, and go through proper procedures, for the land to be reclassified in order to make it possible for the deed to be transferred to the Company.

LARGAN PRECISION CO., LTD.
Notes to the Parent Company Only Financial Statements
189 (Continued)
(j) Intangible assets
The costs and amortization of the intangible assets of Company in 2018 and 2017 were as follows:
Computer Software
Costs: Balance at January 1, 2018 $ 191,715 Additions 47,712 Disposals (483) Reclassification 10,391 Effect of movement in exchange rates - Balance at December 31,2018 $ 249,335 Balance at January 1, 2017 $ 119,758 Additions 79,555 Disposals (7,598) Balance at December 31,2017 $ 191,715 Amortization and impairment Loss: Balance at January 1, 2018 $ 107,997 Amortization for the year 61,476 Disposals (483) Balance at December 31, 2018 $ 168,990 Balance at January 1, 2017 $ 85,543 Amortization for the year 30,052 Disposals (7,598) Balance at December 31, 2017 $ 107,997 Carrying value: Balance at December 31,2018 $ 80,345 Balance at December 31, 2017 $ 83,718 Balance at January 1,2017 $ 34,215
The following amortizations of intangible assets are included in the statement of comprehensive in-come:
2018 2017 Operating cost $ 21,515 7,131
Operating expense 39,961 22,921
$ 61,476 30,052

LARGAN PRECISION CO., LTD.
Notes to the Parent Company Only Financial Statements
190 (Continued)
(k) Other current assets and other non-current assets
The other current assets and other non-current assets of the Company were as follows:
December 31, 2018
December 31, 2017
Other current financial assets $ 6,000 13,133
Other current assets 547,490 96,271
Other non-current financial assets 315,296 312,847
Refundable deposits 1,032,364 636,264
Prepayment for equipment 1,424,548 1,327,279
$ 3,325,698 2,385,794
(i) Other current (non-current) financial assets were restricted deposits pledged as collateral; please refer to note 8.
(ii) Other current assets were prepaid expense and temporary payments.
(iii) Refundable deposits had been pledged as collateral; please refer to note 8.
(iv) For further credit risk information, please refer to note6 (w).
(l) Short-term borrowings
The short-term borrowings were summarized as follows:
December 31, 2018
December 31, 2017
Letters of credit $ 552,868 395,774
Unused credit Lines $ 747,132 904,226
Range of interest rates 0.89%~1.05% 0.88%~0.93%
(m) Employee benefits
(i) Defined benefit plans
Reconciliation of the defined benefit obligations at present value and plan asset at fair value are as follows:
December 31, 2018
December 31, 2017
Present value of the defined benefit obligations $ 156,042 143,579
Fair value of plan assets (58,201) (53,138)
Net defined benefit liability $ 97,841 90,441

LARGAN PRECISION CO., LTD.
Notes to the Parent Company Only Financial Statements
191 (Continued)
The Company makes defined benefit plan contributions to the pension fund account with Bank of Taiwan that provides pensions for employees upon retirement. Plans (covered by the Labor Standards Law) entitle a retired employee to receive retirement benefits based on years of ser-vice and average salary for the six months prior to retirement.
1) Composition of plan assets
The Company allocates pension funds in accordance with the Regulations for Revenues, Expenditures, Safeguard and Utilization of the Labor Retirement Fund, and such funds are managed by the Bureau of the Labor Funds, Ministry of Labor. With regards to the utilization of the funds, minimum earnings in the annual distribution on the final financial statements shall be no less than the earnings attainable from two-year time deposits with interest rates offered by local banks.
The Company’s Bank of Taiwan labor pension reserve account balance amounted to $57,836 thousand at the end of the reporting period. For information on the utilization of the labor pension fund assets, including the asset allocation and yield of the fund, please refer to the website of the Bureau of Labor Funds, Ministry of Labor.
2) Movements in present value of the defined benefit obligations
The movements in present value of the defined benefit obligations of the Company were as follows:
2018 2017 Defined benefit obligations at January 1 $ 143,579 125,266
Benefit paid by the plan (5,030) (1,808)
Current service costs and interest cost (income) 3,056 2,428
Remeasurements loss (gain): -Financial assumptions 14,437 17,693
Defined benefit obligations at December 31 $ 156,042 143,579
3) Movements of the fair value of defined benefit plan assets
The movements in the fair value of the defined benefit plan assets of the Company were as follows:
2018 2017 Fair value of plan assets at January 1 $ 53,138 50,576
Contributions paid by the employer 7,955 3,858
Benefits paid from plan assets (5,030) (1,808)
Remeasurements loss (gain): -Return on plan assets excluding interest in-
come 696
594
-Financial assumptions 1,442 (82)
Fair value of plan assets at December 31 $ 58,201 53,138

LARGAN PRECISION CO., LTD.
Notes to the Parent Company Only Financial Statements
192 (Continued)
4) Expenses recognized in profit or loss
The expenses recognized in profits or losses for the years ended December 31, 2018 and 2017 were as follows:
2018 2017 Current service costs $ 916 828
Net interest of net liabilities for the defined bene-fit obligations 2,140 1,601
Remeasurements loss (gain) —Return on plan assets excluding interest
income
(696)
(594)
$ 2,360 1,835
Operating Costs $ 1,806 1,380
Selling expenses 19 18
Administrative expenses 117 95
Research and development expenses 418 342
$ 2,360 1,835
Return on plan assets $ 2,138 512
5) Remeasurement in net defined benefit liability recognized in other comprehensive in-come
The Company’s remeasurement in the net defined benefit liability recognized in other comprehensive income for the years ended December 31, 2018 and 2017 were as follows:
2018 2017
Accumulated amount at January 1 $ 49,445 31,670
Recognized during the period 12,995 17,775
Accumulated amount at December 31 $ 62,440 49,445
6) Actuarial assumptions
The principal actuarial assumptions at the reporting date were as follows:
December 31, 2018
December 31, 2017
Discount rate 1.375% 1.625%
Increase in future salary rate 2% 2%
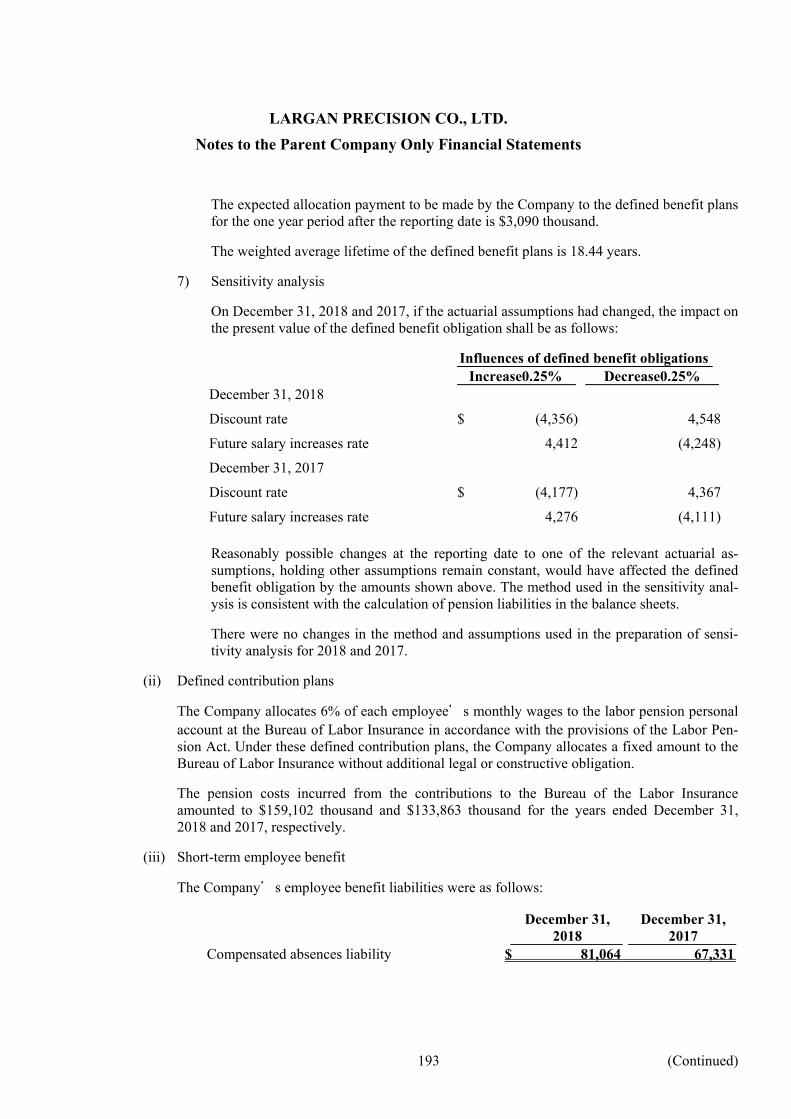
LARGAN PRECISION CO., LTD.
Notes to the Parent Company Only Financial Statements
193 (Continued)
The expected allocation payment to be made by the Company to the defined benefit plans for the one year period after the reporting date is $3,090 thousand.
The weighted average lifetime of the defined benefit plans is 18.44 years.
7) Sensitivity analysis
On December 31, 2018 and 2017, if the actuarial assumptions had changed, the impact on the present value of the defined benefit obligation shall be as follows:
Influences of defined benefit obligations Increase0.25% Decrease0.25% December 31, 2018
Discount rate $ (4,356) 4,548
Future salary increases rate 4,412 (4,248)
December 31, 2017
Discount rate $ (4,177) 4,367
Future salary increases rate 4,276 (4,111)
Reasonably possible changes at the reporting date to one of the relevant actuarial as-sumptions, holding other assumptions remain constant, would have affected the defined benefit obligation by the amounts shown above. The method used in the sensitivity anal-ysis is consistent with the calculation of pension liabilities in the balance sheets.
There were no changes in the method and assumptions used in the preparation of sensi-tivity analysis for 2018 and 2017.
(ii) Defined contribution plans
The Company allocates 6% of each employee’s monthly wages to the labor pension personal account at the Bureau of Labor Insurance in accordance with the provisions of the Labor Pen-sion Act. Under these defined contribution plans, the Company allocates a fixed amount to the Bureau of Labor Insurance without additional legal or constructive obligation.
The pension costs incurred from the contributions to the Bureau of the Labor Insurance amounted to $159,102 thousand and $133,863 thousand for the years ended December 31, 2018 and 2017, respectively.
(iii) Short-term employee benefit
The Company’s employee benefit liabilities were as follows:
December 31, 2018
December 31, 2017
Compensated absences liability $ 81,064 67,331

LARGAN PRECISION CO., LTD.
Notes to the Parent Company Only Financial Statements
194 (Continued)
(n) Income taxes
According to the amendments to the "Income Tax Act” enacted by the office of the President of the Republic of China (Taiwan) on February 7, 2018, an increase in the corporate income tax rate from 17% to 20% is applicable commencing 2018.
(i) Income tax expense
The components of income tax in the years 2018 and 2017 were as follows:
2018 2017 Current tax expense:
Current period $ 5,465,763 4,601,510
10% surtax on unappropriated earnings 1,174,827 1,144,521
Adjustment for prior periods (75,989) (16)
Deferred tax expense:
Origination and reversal of temporary differences 44,351 (64,720)
Adjustment in tax rate (64,749) -
$ 6,544,203 5,681,295
Reconciliation of income tax and profit before tax 2018 and 2017 is as follows:
2018 2017 Profit before income tax $ 30,913,737 31,656,918
Income tax using the Company's domestic tax rate 6,182,747 5,381,676
Adjustment in tax rate (64,749) -
Investment tax credits (239,818) (198,114)
Changes in unrecognized temporary differences (429,859) (381,995)
Gains on disposal of investment (2,962) (2,982)
Five-year exemption - (264,931)
Others income tax adjustments 6 3,136
Changes in provision in prior periods (75,989) (16)
10% surtax on unappropriated earnings 1,174,827 1,144,521
Total $ 6,544,203 5,681,295
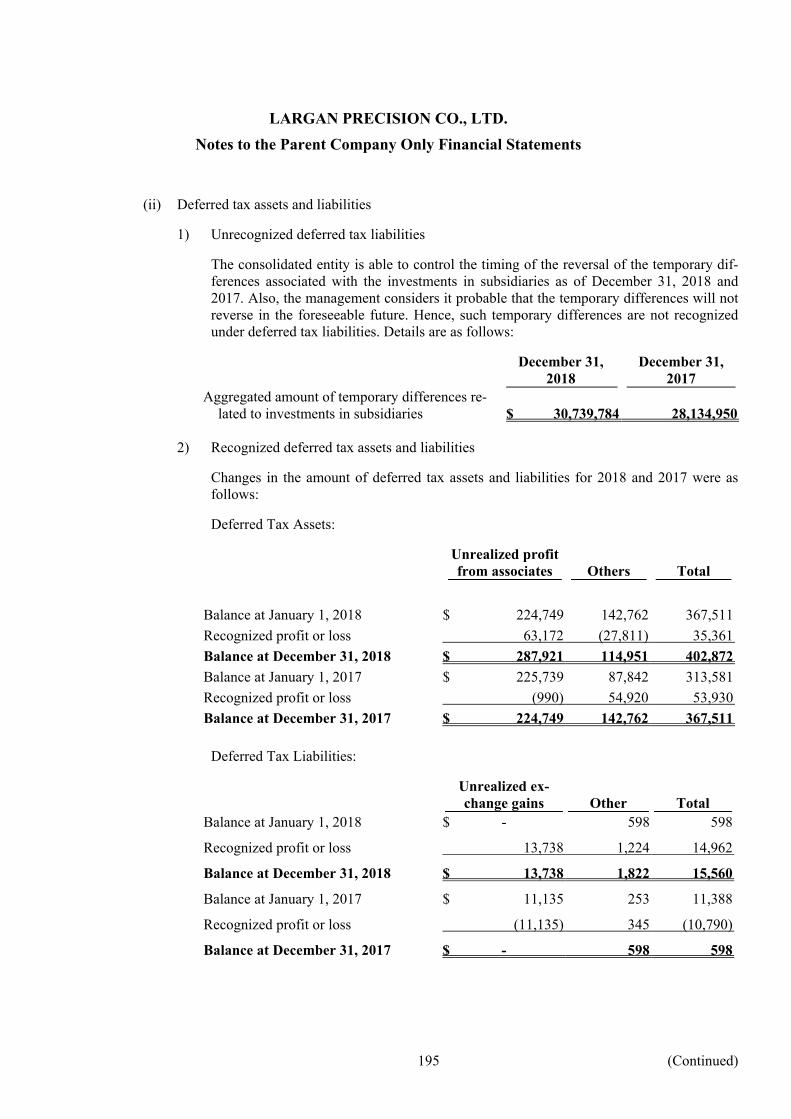
LARGAN PRECISION CO., LTD.
Notes to the Parent Company Only Financial Statements
195 (Continued)
(ii) Deferred tax assets and liabilities
1) Unrecognized deferred tax liabilities
The consolidated entity is able to control the timing of the reversal of the temporary dif-ferences associated with the investments in subsidiaries as of December 31, 2018 and 2017. Also, the management considers it probable that the temporary differences will not reverse in the foreseeable future. Hence, such temporary differences are not recognized under deferred tax liabilities. Details are as follows:
December 31, 2018
December 31, 2017
Aggregated amount of temporary differences re-lated to investments in subsidiaries $ 30,739,784 28,134,950
2) Recognized deferred tax assets and liabilities
Changes in the amount of deferred tax assets and liabilities for 2018 and 2017 were as follows:
Deferred Tax Assets:
Unrealized profit from associates
Others
Total
Balance at January 1, 2018 $ 224,749 142,762 367,511
Recognized profit or loss 63,172 (27,811) 35,361
Balance at December 31, 2018 $ 287,921 114,951 402,872
Balance at January 1, 2017 $ 225,739 87,842 313,581
Recognized profit or loss (990) 54,920 53,930
Balance at December 31, 2017 $ 224,749 142,762 367,511
Deferred Tax Liabilities:
Unrealized ex-change gains
Other
Total
Balance at January 1, 2018 $ - 598 598
Recognized profit or loss 13,738 1,224 14,962
Balance at December 31, 2018 $ 13,738 1,822 15,560
Balance at January 1, 2017 $ 11,135 253 11,388
Recognized profit or loss (11,135) 345 (10,790)
Balance at December 31, 2017 $ - 598 598

LARGAN PRECISION CO., LTD.
Notes to the Parent Company Only Financial Statements
196 (Continued)
3) Assessment of tax
The Company’s tax returns for the years through 2016 were assessed by the Taipei Na-tional Tax Administration.
(o) Other payables
The other payables were summarized as follows:
December 31, 2018
December 31, 2017
Payables on remuneration to employees, directors and supervisors $ 14,574,957 12,626,213
Payables for plant and equipment 2,051,257 2,592,704
Others 1,521,779 1,384,924
$ 18,147,993 16,603,841
(p) Capital and other equity
(i) Ordinary Shares
As of December 31, 2018 and 2017, the Company's authorized ordinary shares each amounted to $2,000,000 thousand (including the amount of $100,000 thousand allocated for the exer-cise of employee stock options), and the outstanding ordinary shares each amounted to $1,341,402 thousand, with a par value of $10 per share.
(ii) Capital Surplus
The balance of capital surplus was as following:
December 31, 2018
December 31, 2017
Additional paid-in capital $ 817,574 817,574
Capital surplus-premium from merger 738,155 738,155
Dividend timeout not received by shareholder 1,282 659
$ 1,557,011 1,556,388
According to the R.O.C. Company Act, capital surplus can only be used to offset a deficit, and only the realized capital surplus can be used to increase the common stock or be distributed as cash dividends. The aforementioned realized capital surplus includes capital surplus resulting from premium on issuance of capital stock and earnings from donated assets received. Accord-ing to the Regulations Governing the Offering and Issuance of Securities by Securities Issuers, capital increases by transferring capital surplus in excess of par value should not exceed 10% of the total common stock outstanding.

LARGAN PRECISION CO., LTD.
Notes to the Parent Company Only Financial Statements
197 (Continued)
(iii) Retained earnings
The Company's article of incorporation stipulate that Company's net earnings should first be used to offset the prior years' deficits, if any, before paying any income taxes. Of the remaining balance, 10% is to be appropriated as legal reserve, until the accumulated legal reserve equals the Company's paid-in capital. In addition, a special, reserve in accordance with applicable laws and regulations shall also be set aside. Then, any remaining profit, together with any un-distributed retained earnings, shall be distributed according to the distribution plan proposed by the Board of Directors and submitted to the stockholders’ meeting for approval.
Before the distribution of dividends, the Company shall first take into consideration its operating environment, industry developments, and the long-term interests of its stockholders, as well as its programs to maintain its operating efficiency and meet its capital expenditure budget and financial goals in determining the stock or cash divi-dends to be paid. After the above appropriations, dividend to be distributed shall be no less than 10% of the current-year retained earnings available for distribution. The cash dividends shall not be less than 30% of the total dividends.
1) Legal reserve
According to the amendment of the R.O.C. Company Act, the Company must retain 10% of its after-tax annual earnings as legal reserve until such retention equals the amount of total capital. When a company incurs no loss, it may, pursuant to a resolution by a share-holders’ meeting, distribute its legal reserve by issuing new shares or by distributing cash, and only the portion of legal reserve which exceeds 25% of capital may be distrib-uted.
2) Special reserve
In accordance with the regulation set by the Financial Supervisory Commission, a portion of current period earnings and undistributed prior period earnings shall be reclassified as a special earnings reserve during earnings distribution. Amounts of subsequent rever-sals pertaining to the net reduction of other shareholders’ equity shall qualify for addi-tional distributions. The special reserve for the years ended December 31, 2018 and 2017 were $2,370,825 thousand and $486,837 thousand, respectively.
3) Earnings distribution
The earnings distribution for 2017 and 2016 were decided by the general meeting of the shareholders held on June 12, 2018 and June 14, 2017 as follows:
2017 2016 Amount
per share Total
amount Amount
per share Total
amount Dividends distributed to
common shareholders:
Cash $ 72.5 9,725,164 63.5 8,517,903
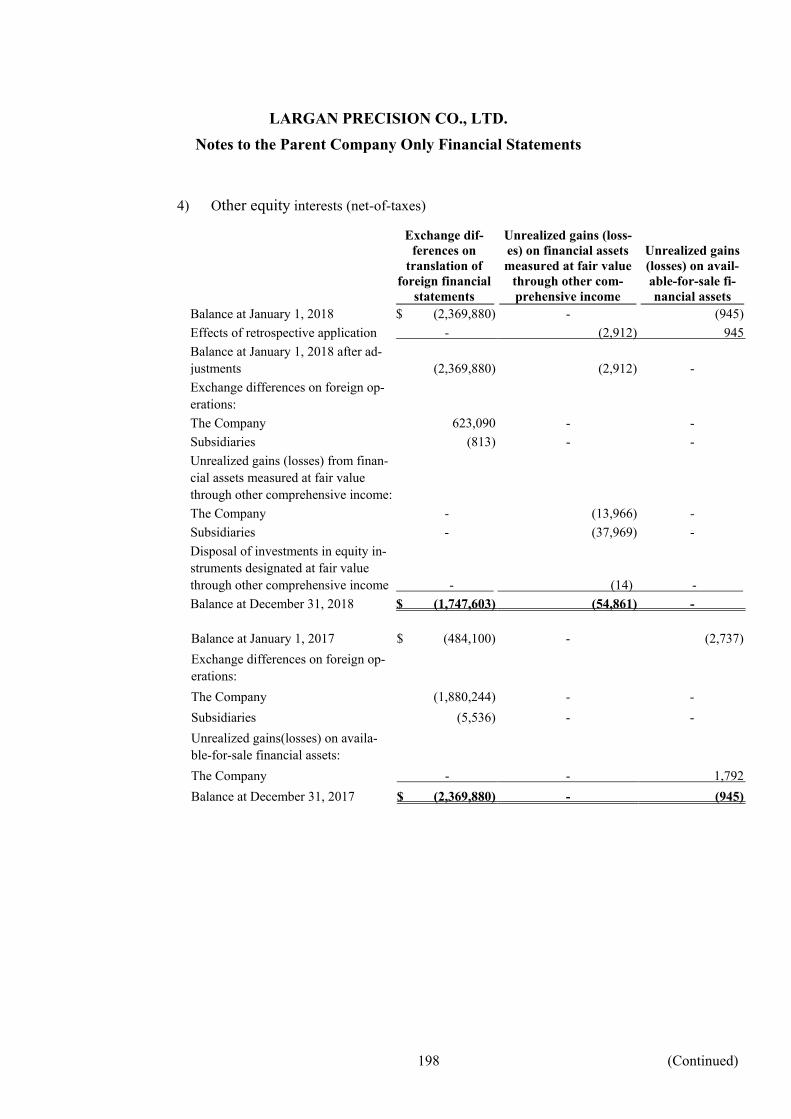
LARGAN PRECISION CO., LTD.
Notes to the Parent Company Only Financial Statements
198 (Continued)
4) Other equity interests (net-of-taxes)
Exchange dif-ferences on
translation of foreign financial
statements
Unrealized gains (loss-es) on financial assets measured at fair value
through other com-prehensive income
Unrealized gains (losses) on avail-able-for-sale fi-nancial assets
Balance at January 1, 2018 $ (2,369,880) - (945)
Effects of retrospective application - (2,912) 945
Balance at January 1, 2018 after ad-justments (2,369,880) (2,912) -
Exchange differences on foreign op-erations:
The Company 623,090 - -
Subsidiaries (813) - -
Unrealized gains (losses) from finan-cial assets measured at fair value through other comprehensive income:
The Company - (13,966) -
Subsidiaries - (37,969) -
Disposal of investments in equity in-struments designated at fair value through other comprehensive income
-
(14)
-
Balance at December 31, 2018 $ (1,747,603) (54,861) -
Balance at January 1, 2017 $ (484,100) - (2,737)
Exchange differences on foreign op-erations:
The Company (1,880,244) - -
Subsidiaries (5,536) - -
Unrealized gains(losses) on availa-ble-for-sale financial assets:
The Company - - 1,792
Balance at December 31, 2017 $ (2,369,880) - (945)

LARGAN PRECISION CO., LTD.
Notes to the Parent Company Only Financial Statements
199 (Continued)
(q) Earnings per share
The calculation of basic earnings per share and diluted earnings per share for years 2018 and 2017 were as follows:
2018 2017
Basic earnings per share
Profit of the Company for the year $ 24,369,534 25,975,623
Weighted-average number of outstanding ordinary shares
(in thousands)
134,140
134,140
$ 181.67 193.65
Diluted earnings per share
Profit of the Company for the year $ 24,369,534 25,975,623
Weighted-average number of outstanding ordinary shares
(in thousands) 134,140 134,140
Effect of dilutive potential common shares (thousand
shares)
Effect of employee share bonus 1,212 1,309
Weightier-average number of ordinary shares (in
thousands) (after adjustment of potential diluted ordinary
shares) 135,352
135,449
$ 180.05 191.77
(r) Revenue from contracts with customers
Disaggregation of revenue
2018 Primary geographical markets
China $ 27,081,768
Japan 8,599,298
Korea 7,234,368
Other 4,263,186
$ 47,178,620
Major products
Optical lens $ 47,178,620
For details on revenue in 2017, please refer to note 6 (s).

LARGAN PRECISION CO., LTD.
Notes to the Parent Company Only Financial Statements
200 (Continued)
(s) Revenue
The details of revenue for the years ended December 31, 2017 were as follows:
2017 Sale of goods $ 49,497,163
For details on revenue in 2018, please refer to note 6 (r).
(t) Employee compensation and directors’ and supervisors’ remuneration
According to the Company’s articles of incorporation, the Company should distribute its remunera-tion of not less than 1%~30% and not more than 5% of annual profits to its employees and directors respectively, after offsetting accumulated deficits, if any. Employees, including employees of affili-ate companies that meet certain conditions, are subject to the abovementioned remuneration, which is to be distributed in stock or cash.
For the year ended December 31, 2018 and 2017, the Company estimated its employee remuneration amounting to $4,383,828 thousand and $4,677,131 thousand, and directors' and supervisors' remu-neration amounting to $328,787 thousand and $350,785 thousand, respectively. The estimated amounts mentioned above are calculated based on the net profit before tax, excluding the remunera-tion to employees, directors and supervisors of each period, multiplied by the percentage of remuner-ation to employees, directors and supervisors as specified in the Company's articles. These remunera-tions were expensed under operating costs or operating expenses during 2018 and 2017. The amounts, as stated in the consolidated financial statements, are identical to those of the actual distributions for 2018 and 2017.
(u) Non-operating income and expenses
(i) Other income
The details of other income for the years 2018 and 2017 were as follows:
2018 2017 Interest income-bank deposits $ 613,196 326,352
Rent income 9,881 7,419
$ 623,077 333,771
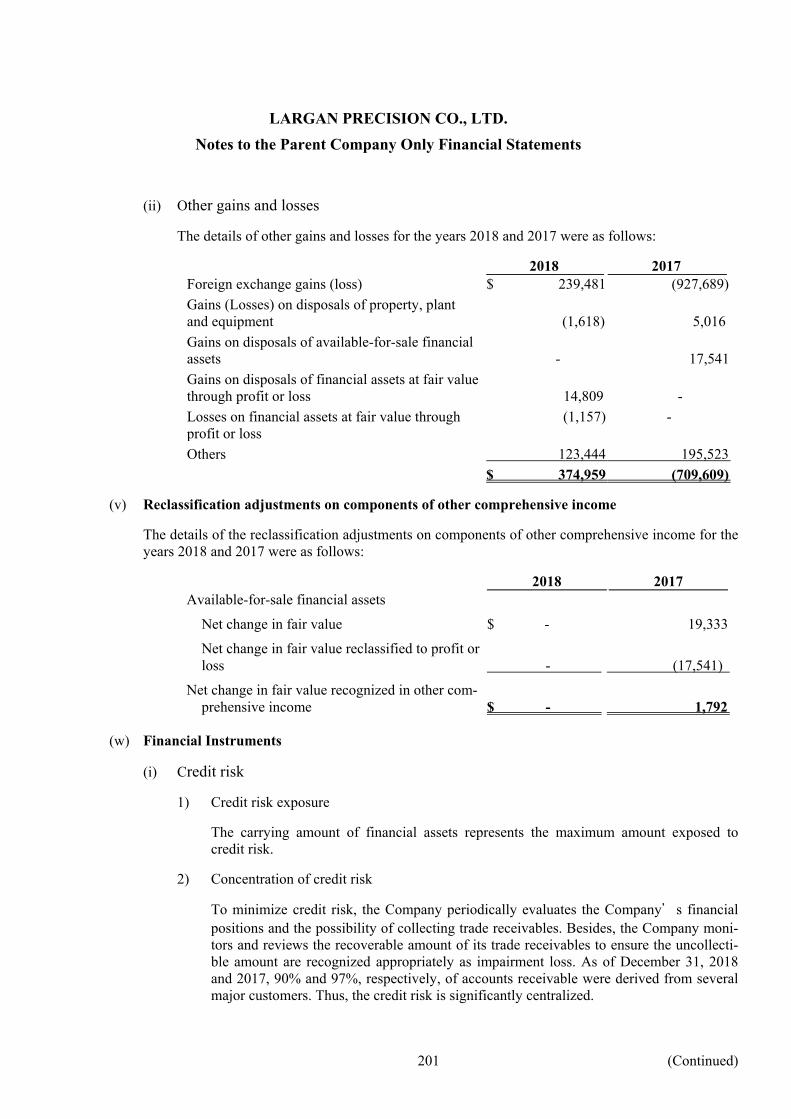
LARGAN PRECISION CO., LTD.
Notes to the Parent Company Only Financial Statements
201 (Continued)
(ii) Other gains and losses
The details of other gains and losses for the years 2018 and 2017 were as follows:
2018 2017 Foreign exchange gains (loss) $ 239,481 (927,689)
Gains (Losses) on disposals of property, plant and equipment
(1,618)
5,016
Gains on disposals of available-for-sale financial assets
-
17,541
Gains on disposals of financial assets at fair value through profit or loss
14,809
-
Losses on financial assets at fair value through profit or loss
(1,157) -
Others 123,444 195,523
$ 374,959 (709,609)
(v) Reclassification adjustments on components of other comprehensive income
The details of the reclassification adjustments on components of other comprehensive income for the years 2018 and 2017 were as follows:
2018 2017 Available-for-sale financial assets
Net change in fair value $ - 19,333
Net change in fair value reclassified to profit or loss
-
(17,541)
Net change in fair value recognized in other com-prehensive income
$ -
1,792
(w) Financial Instruments
(i) Credit risk
1) Credit risk exposure
The carrying amount of financial assets represents the maximum amount exposed to credit risk.
2) Concentration of credit risk
To minimize credit risk, the Company periodically evaluates the Company’s financial positions and the possibility of collecting trade receivables. Besides, the Company moni-tors and reviews the recoverable amount of its trade receivables to ensure the uncollecti-ble amount are recognized appropriately as impairment loss. As of December 31, 2018 and 2017, 90% and 97%, respectively, of accounts receivable were derived from several major customers. Thus, the credit risk is significantly centralized.

LARGAN PRECISION CO., LTD.
Notes to the Parent Company Only Financial Statements
202 (Continued)
3) Receivables
For credit risk exposure of notes and accounts receivable, please refer to note 6 (e). Other financial assets at amortized cost includes other receivables, refundable deposits and other financial assets. For the details and loss allowance on December 31, 2017, please refer to note 6 (f). All of these financial assets are considered to have low risk, and thus, the impairment provision recognized during the period was limited to 12 months expected losses. Regarding how the financial instruments are considered to have low credit risk, please refer to note 4 (f). The loss allowance provision as of December 31, 2018 was determined as follows:
Other financial assets at amor-
tized cost Balance on January 1 per IAS 39 $ -
Adjustment on initial application of IFRS 9 -
Balance on January 1 per IFRS 9 -
Impairment loss recognized -
Balance on December 31 $ -
(ii) Liquidity risk
The following table shows the contractual maturities of financial liabilities, without the impact of netting agreements.
Carrying amount
Contractual cash flows
Within a year
Over 1 year
December 31, 2018
Non-derivative financial liabilities
Short-term borrowings $ 552,868 552,868 552,868 -
Accounts and notes payable (in-cluding related parties) 2,363,656 2,363,656 2,363,656 -
Other payables (including related parties) 2,967,286 2,967,286 2,967,286 -
Guarantee deposits received 4,473 4,473 - 4,473
$ 5,888,283 5,888,283 5,883,810 4,473
December 31, 2017
Non-derivative financial liabilities
Short-term borrowings $ 395,774 395,774 395,774 -
Accounts and notes payable (in-cluding related parties) 3,801,331 3,801,331 3,801,331 -
Other payables (including related parties) 3,458,518 3,458,518 3,458,518 -
Guarantee deposits received 3,179 3,179 - 3,179
$ 7,658,802 7,658,802 7,655,623 3,179

LARGAN PRECISION CO., LTD.
Notes to the Parent Company Only Financial Statements
203 (Continued)
The Company does not expect the cash flows included in the maturity analysis to occur significantly earlier or at significantly different amounts.
(iii) Currency risk
1) Exposure to foreign currency risk
The Company’s significant exposure to foreign currency risk was as follows:
December 31, 2018 December 31, 2017 Foreign
Currency Exchange
Rates New Taiwan
Dollars Foreign
Currency Exchange
Rates New Taiwan
Dollars Financial Assets
Monetary items
USD $ 569,680 30.715 17,497,713 593,580 29.76 17,664,953
JPY 4,074,162 0.2782 1,133,432 3,159,214 0.2642 834,664
CNY 2,962,785 4.472 13,249,577 1,837,914 4.565 8,390,076
December 31, 2018 December 31, 2017
Foreign Currency
Exchange Rates
New Taiwan Dollars
Foreign Currency
Exchange Rates
New Taiwan Dollars
Financial Liabilities
Monetary items
USD 62,766 30.715 1,927,843 112,189 29.76 3,338,758
JPY 3,502,869 0.2782 974,498 3,704,636 0.2642 978,765
2) Sensitivity analysis
The Company’s exposure to foreign currency risk arises from the translation of the for-eign currency exchange gains and losses on cash and cash equivalents, accounts and other receivables, and accounts and other payables that are denominated in foreign currency. A strengthening (weakening) 1% of the TWD against the USD, JPY, and CNY as of De-cember 31, 2018 and 2017 would have increased (decreased) the net profit after tax by $231,827 thousand and $187,349 thousand, respectively. The analysis assumes that all other variables remain constant and ignores any impact of forecasted sales and purchases. The analysis is performed on the same basis for both periods.
3) Foreign exchange gain and loss on monetary items
Since the Company has many kinds of functional currency, the information on foreign exchange gain (loss) on monetary items is disclosed by total amount. For the years 2018 and 2017, the foreign exchange gain (loss) (including realized and unrealized portions) amounted to $239,481 thousand and $(927,689) thousand, respectively.

LARGAN PRECISION CO., LTD.
Notes to the Parent Company Only Financial Statements
204 (Continued)
(iv) Interest rate analysis
Please refer to the note on liquidity risk management and the interest rate exposure of the Company’s financial assets and liabilities.
The following sensitivity analysis is based on the exposure to the interest rate risk of derivative and non-derivative financial instruments on the reporting date. Regarding liabilities with varia-ble interest rates, the analysis is based on the assumption that the amount of liabilities out-standing at the reporting date was outstanding throughout the year. The rate of change is ex-pressed as the interest rate which increases or decreases by 1% when reporting to the internal management, which also represents the Company management's assessment of the reasonably possible interest rate change.
If the interest rate increases/decreases by 1%, with all other variable factors that remaining constant, the Company’s net income would have decreased/increased by $4,423 thousand and $3,285 thousand for the years ended December 31, 2018 and 2017, respectively. This is mainly due to the Company’s borrowings in variable rates.
(v) Other market price risk
For the years ended December 31, 2018 and 2017, the sensitivity analysis for the changes in the securities price at the reporting date were performed using the same basis for the profit and loss with all other variable factors remaining constant as illustrated below:
For the years ended December 31, 2018 2017
Prices of securities at the reporting date
Other compre-hensive income
after tax
Net income
Other compre-hensive income
after tax
Net income Increasing1% $ 234 12,918 20,106 -
Decreasing1% $ (234) (12,918) (20,106) -
(vi) Fair value of financial instruments
1) Categories and fair value of financial instruments
The fair value of financial assets at fair value through profit or loss (available-for-sale fi-nancial assets) and financial assets at fair value through other comprehensive income (available-for-sale financial assets) is measured on a recurring basis. The carrying amount and fair value of the Company’s financial assets and liabilities, including the infor-mation on fair value hierarchy, were as follows; however, except as described in the fol-lowing paragraphs, for financial instruments not measured at fair value whose carrying amount is reasonably close to the fair value, and for equity investments that has no quot-ed prices in the active markets and whose fair value cannot be reliably measured, dis-closure of fair value information is not required :

LARGAN PRECISION CO., LTD.
Notes to the Parent Company Only Financial Statements
205 (Continued)
The Company uses observable market data to evaluate its assets and liabilities when it is possible. The different levels have been defined as follows:
● Level 1: quoted prices (unadjusted) in active markets for identical assets or liabilities.
● Level 2: inputs other than quoted prices included within Level 1 that are observable for the asset or liability, either directly (i.e. as prices) or indirectly (i.e. de-rived from prices).
● Level 3: inputs for the assets or liability that are not based on observable market data (unobservable inputs).
The categories and fair value of financial instruments were as follows:
December 31, 2018 Fair Value Book Value Level 1 Level 2 Level 3 Total Financial assets at fair value through
profit or loss
Non derivative financial assets manda-
torily measured at fair value through
profit or loss
$ 1,291,809
1,291,809
-
-
1,291,809
Financial assets at fair value through
other comprehensive income
Stocks listed on domestic and foreign
markets 23,389 23,389 - - 23,389
Financial assets measured at amortized
cost
Cash and cash equivalents 56,224,190 - - - -
Notes and accounts receivable and other
receivables (including related parties
and excluding tax receivable)
10,525,925
-
-
-
-
Other financial assets-current and
non-current 321,296 - - - -
Refundable deposits 1,032,364 - - - - Subtotal 68,103,775 - - - -
Total $ 69,418,973 1,315,198 - - 1,315,198
Financial liabilities at amortized cost
Short-term borrowings $ 552,868 - - - -
Notes and accounts payable
(including related parties) 2,363,656 - - - -
Other payables
(including related parties) 2,967,286 - - - -
Guarantee deposits received 4,473 - - - -
Total $ 5,888,283 - - - -

LARGAN PRECISION CO., LTD.
Notes to the Parent Company Only Financial Statements
206 (Continued)
December 31, 2017
Fair Value Book Value Level 1 Level 2 Level 3 Total
Available-for sale financial assets $ 2,010,555 2,010,555 - - 2,010,555 Loans and receivable
Cash and cash equivalent 46,724,786 - - - -
Notes and accounts receivable and
other receivables (including related
parties and excluding tax receiva-
ble) 11,641,264 - - - -
Other financial assets-current and
non-current 325,980 - - - -
Refundable deposits 636,264 - - - - Subtotal 59,328,294 - - - -
Total $ 61,338,849 2,010,555 - - 2,010,555
Financial liabilities at amortized cost
Short-term borrowings $ 395,774 - - - -
Notes and accounts payable
(including related parties) 3,801,331 - - - -
Other payables (including related par-
ties) 3,458,518 - - - -
Guarantee deposits received 3,179 - - - -
Total $ 7,658,802 - - - -
2) Valuation techniques of financial instruments not measured at fair value
The Company estimates its financial instruments, that are not measured at fair value, by methods and assumption as follows:
If there is quoted price generated by transactions for financial liabilities at amortized cost, the recent transaction price and quoted price data is used as the basis for fair value meas-urement. However, if no quoted prices are available, the discounted cash flows are used to estimate fair values. In addition, if the expiration date is approaching, or the future payable or receivable price is similar to the carrying amount, the fair value shall be as-sumed in the carrying amount in the balance sheets.
3) Valuation techniques for financial instruments measured at fair value.
Non-derivative financial instruments
Financial instruments traded in active markets are based on quoted market prices. The quoted price of a financial instrument obtained from main exchanges and on-the-run bonds from Taipei Exchange can be used as a basis to determine the fair value of the listed companies’ equity instrument and debt instrument of the quoted price in an ac-tive market.

LARGAN PRECISION CO., LTD.
Notes to the Parent Company Only Financial Statements
207 (Continued)
If a quoted price of a financial instrument can be obtained in time and often from ex-changes, brokers, underwriters, industrial union, pricing institute, or authorities, and such price can reflect those actual trading and frequently happen in the market, then the finan-cial instrument is considered to have a quoted price in an active market. If a financial in-strument is not in accord with the definition mentioned above, then it is considered to be without a quoted price in an active market. In general, market with low trading volume or high bid-ask spreads is an indication of a non-active market.
The fair value of the listed common shares and funds held by the Company are deter-mined by reference to the market quotation.
4) Transfer between Level 1 and Level 2
There were no transfers from one level to another level in 2018 and 2017.
(x) Financial risk management
(i) Overview
The Company is exposed to the following risks from its financial instruments:
1) Credit risk
2) Liquidity risk
3) Market risk
In this note expressed the information on risk exposure and objectives, policies and procedures of risk measurement and management. For detailed information, please refer to the related notes of each risk.
(ii) Structure of risk management
The Company’s finance management department provides business services for the overall internal department. It sets the objectives, policies and processes for managing the risk and the methods used to measure the risk arising from both the domestic and international financial market operations. The Company minimizes the risk exposure through derivative financial in-struments. The Board of Directors regulates the use of derivative financial instruments in ac-cordance with the Company’s policy on risks arising from financial instruments such as cur-rency risk, interest rate risk, credit risk, the use of derivative and non-derivative financial in-struments, and the investments of excess liquidity. The internal auditors of the Company con-tinue to review the amount of the risk exposure in accordance with the Company’s policies and the risk management's policies and procedures. The Company has no transactions in finan-cial instruments (including derivative financial instruments) for the purpose of speculation.
(iii) Credit risk
Credit risk is the risk of financial loss to the Company if a customer or counterparty to a finan-cial instrument fails to meet its contractual obligations, and arises principally from the Compa-ny’s receivables from customers and investment securities.

LARGAN PRECISION CO., LTD.
Notes to the Parent Company Only Financial Statements
208 (Continued)
1) Accounts receivable and other receivables
The Company's customers is significantly concentrated in a few customers, In order to reduce credit risk, the Company continuously evaluates the financial status of its major customers and their condition, and also regularly assesses the possibility of receivables recovery.
The Company did not have any collateral or other credit enhancement to avoid credit risk of the financial assets.
The Company has losses allowance for bad debts to reflect the estimated losses of its ac-counts receivable, other receivables and investments. The main components of the al-lowance account contain specific losses associated with individual major risks. The component, and the component of the combined loss established for the loss of a similar group of assets, has occurred but not yet identified. The loss allowance account is based on the occurring risk of a default and the rate of expected credit loss.
2) Investments
The exposure to credit risk for bank deposits, fixed income investments, and other finan-cial instruments, is measured and monitored by the Company’s finance department. The Company only deals with banks, other external parties, corporate organizations, govern-ment agencies and financial institutions with good credit rating. The Company does not expect any of the counterparties above to fail in meeting their obligations; hence, there is no significant credit risk arising from these counterparties.
(iv) Liquidity risk
Liquidity risk is the risk that the Company will encounter difficulty in meeting the obligations associated with its financial liabilities that are settled by delivering cash or another financial asset. The Company’s approach to managing liquidity is to ensure, as far as possible, that it always has sufficient liquidity to meet its liabilities when due, under both normal and stressed conditions, without incurring unacceptable losses or risking damage to the Company’s repu-tation.
(v) Market risk
Market risk is the risk that changes in market prices, such as foreign exchange rates, interest rates, and equity prices, that will affect the Company’s income or the value of its holdings of financial instruments. The objective of market risk management is to manage and control mar-ket risk exposures within acceptable parameters, while optimizing the return.
1) Currency risk
The Company is exposed to currency risk on sales, purchases and borrowings that are denominated in a currency other than the respective functional currencies of the Compa-ny’s entities, primarily the New Taiwan Dollars (NTD). The currencies used in these transactions are the NTD, USD, CNY and JPY.

LARGAN PRECISION CO., LTD.
Notes to the Parent Company Only Financial Statements
209 (Continued)
2) Interest rate risk
Please refer to note on the liquidity risk for interest rate risk of financial assets and finan-cial liabilities.
3) Other market price risk
Please refer to note 6(w) for the sensitivity analysis of equity price risk.
(y) Capital management
The Company must maintain sufficient capital to establish and expand production capacity and equipment. Because the optical lens industry is highly subject to fluctuations in the booming cycle; the capital management of the Company is to ensure that it has sufficient and necessary financial re-sources to support its working capital requirements, capital expenditures, research and development activities, dividends and other business needs in the next 12 months.
(z) Investing and financing activities not affecting current cash flow
During 2018 and 2017, the Company’s investment activity (without affecting its current cash flow) was to acquire equipment under finance lease.
Reconciliation of liabilities arising from financing activities were as follows:
Non-cash changes
January 1,2018
Cash flows
Foreign exchange movement
Fair value changes
December
31,2018
Short-term borrowings $ 395,774 137,000 20,094 - 552,868
Guarantee deposits received 3,179 1,294 - - 4,473
Total liabilities from financing
activities $ 398,953 138,294 20,094 - 557,341

LARGAN PRECISION CO., LTD.
Notes to the Parent Company Only Financial Statements
210 (Continued)
(7) Related-party transactions
(a) For details of subsidiaries of the Company, please refer to note 4 (c) of the year 2018 consolidated financial report.
(b) Names and relationship with related parties
The followings are entities that have had transactions with related party during the periods covered in the parent Company only financial statements.
Name of related party Relationship with the Company Amtai Internation Ltd. (Amtai) Subsidiaries Largan Digital Co., Ltd. (Largan Digital) Subsidiaries Largan Medical Co., Ltd. (Largan Medical) Subsidiaries
Suzhou Largan Co., Ltd. (Suzhou Largan) Subsidiaries
Largan (Dongguan) Optronic Ltd. (Largan dongguan)
Subsidiaries
Largan Health Technology Inc. (LHT) Subsidiaries
Largan Health Technology Co., Ltd. (Largan Health)
Subsidiaries
Ba Fang Co., Ltd. (Ba Fang) Subsidiaries
(c) Significant related-party transactions
(i) Sale of goods to related parties
The amounts of significant sales and receivables by the Company to its related parties were as follows:
Sale Receivables from related
parties
2018
2017 December 31, 2018
December 31, 2017
Subsidiaries-Largan Dongguan
$ 13,052,869 - 6,650,134 -
Subsidiaries-Amtai 11,950,301 15,128,493 1,054,264 1,996,248
Subsidiaries-Suzhou Largan 9,881,631 19,013,543 - 4,667,876
Subsidiaries-Others 137,676 193,507 12,596 33,685
$ 35,022,477 34,335,543 7,716,994 6,697,809
The sales price of the Company to its related parties is not comparable to other sales due to the differences in the sales of the goods. During 2018 and 2017, the collection terms for sales to related parties were month-end 30 to 120 days, which were not materially different from those of the third parties.

LARGAN PRECISION CO., LTD.
Notes to the Parent Company Only Financial Statements
211 (Continued)
(ii) Purchases from related parties
1) The amounts of significant purchases and payables by the Company from its related parties were as follows:
Purchases Payables to related parties
2018
2017 December 31,
2018 December 31,
2017 Subsidiaries-Amtai $ 2,692,182 5,238,397 695,917 2,233,083
Subsidiaries-Other 116,793 100,866 12,501 7,015
$ 2,808,975 5,339,263 708,418 2,240,098
The purchases price of the Company to its related parties is not comparable to other purchases due to the differences in the purchases of the goods. During 2018 and 2017, the payment terms for purchases to related parties were month-end 30 to 120 days, which were not materially dif-ferent from those of the third parties.
2) The disposed amount of both the purchased finished goods from related parties, and the purchased part of raw materials components from the Company, were included in fi-nancial statements as follows:
2018 2017 Subsidiaries $ 1,405,291 2,307,291
(iii) Provides and purchase technical services to related parties
During 2018 and 2017, the Company's income from providing technical services to its related parties were as follows (classified under the other gains):
2018 2017 Subsidiaries-Amtai $ 27,311 29,727
Subsidiaries-Largan Medical 49,865 32,156
$ 77,176 61,883
During 2018 and 2017, the Company's expense from technical services from its related parties were as follows (classified under the other expense):
2018 2017 Subsidiaries-Largan Digital $ 3,168 2,929

LARGAN PRECISION CO., LTD.
Notes to the Parent Company Only Financial Statements
212 (Continued)
(iv) Purchases and disposals of property, plant and equipment
1) During 2018 and 2017, the Company's disposals of its equipment to its related parties are summarized as follows:
2018 2017
Subsidiaries:
Carrying amount
Disposal
price
Gain from
disposal
Carrying amount
Disposal
price
Gain from
disposal
Amtai $ - - - 233 1,500 1,267 Largan Digital 68 73 5 148 156 8 Largan Medical 38 38 - 118 128 10 $ 106 111 5 499 1,784 1,285
2) During 2018 and 2017, the Company's purchase of its equipment from its related parties are summarized as follows:
2018 2017 Subsidiaries $ 103,696 123,174
3) During 2018 and 2017, the Company assisted its related parties to purchase other facili-ties as follows:
2018 2017
Subsidiaries-Amtai $ 2,720 3,536
Subsidiaries-Largan Digital 1,048 69,274
Subsidiaries-Largan Medical 7,654 13,003
Subsidiaries-Suzhou Largan 1,038 4,222
Subsidiaries-Largan Dongguan 16 -
$ 12,476 90,035
(v) Rental income
During 2018 and 2017, the Company's rental income on offices to the subsidiaries are summa-rized as follows:
2018 2017
Subsidiaries-Largan Digital $ 2,694 1,474
Subsidiaries-Largan Medical 3,415 2,585
$ 6,109 4,059
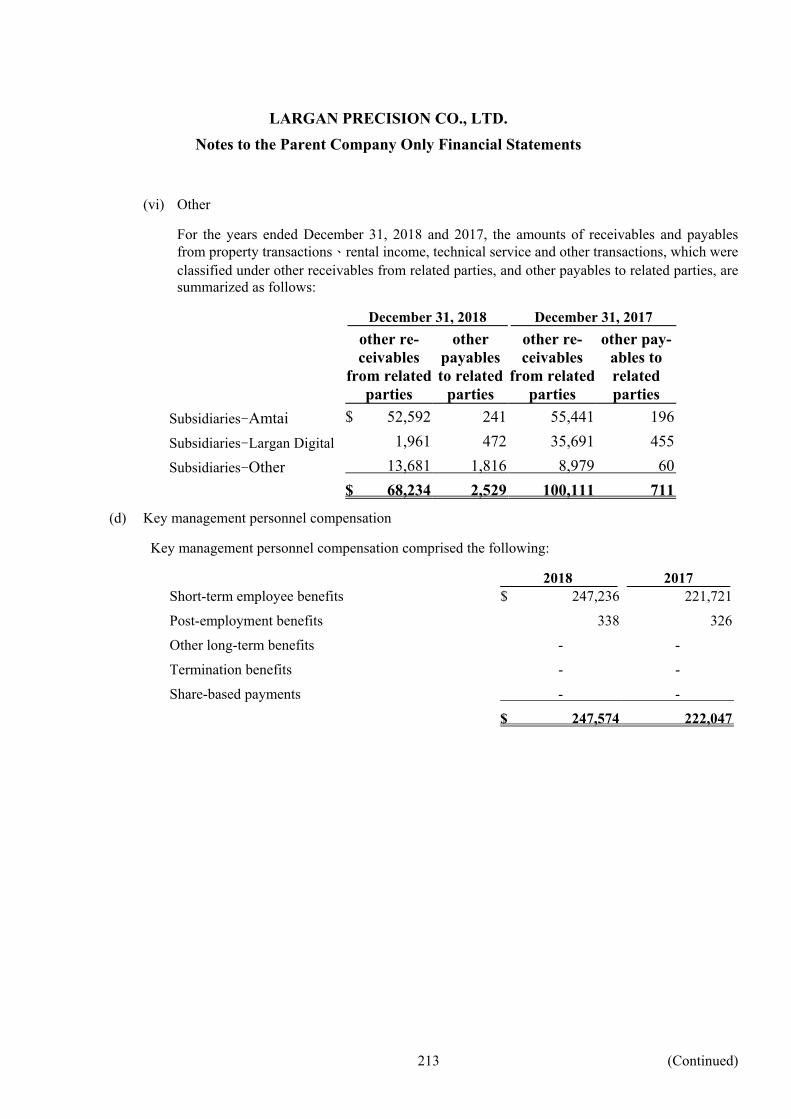
LARGAN PRECISION CO., LTD.
Notes to the Parent Company Only Financial Statements
213 (Continued)
(vi) Other
For the years ended December 31, 2018 and 2017, the amounts of receivables and payables from property transactions、rental income, technical service and other transactions, which were classified under other receivables from related parties, and other payables to related parties, are summarized as follows:
December 31, 2018 December 31, 2017 other re-
ceivables from related
parties
other payables to related
parties
other re-ceivables
from related parties
other pay-ables to related parties
Subsidiaries-Amtai $ 52,592 241 55,441 196
Subsidiaries-Largan Digital 1,961 472 35,691 455
Subsidiaries-Other 13,681 1,816 8,979 60
$ 68,234 2,529 100,111 711
(d) Key management personnel compensation
Key management personnel compensation comprised the following:
2018 2017 Short-term employee benefits $ 247,236 221,721
Post-employment benefits 338 326
Other long-term benefits - -
Termination benefits - -
Share-based payments - -
$ 247,574 222,047

LARGAN PRECISION CO., LTD.
Notes to the Parent Company Only Financial Statements
214 (Continued)
(8) Pledged assets:
The carrying values of pledged assets were as follow:
Pledged assets
Object
December 31, 2018
December 31, 2017
Time deposit (classified
under other current as-
sets)
Customs office deposit
$ 6,000 6,000
Time deposit (classified
under other current as-
sets))
Completion deposit
- 7,133
Time deposit (classified
under other non-current
assets)
Litigation deposit
1,021,711 625,711
Time deposit (classified
under other non-current
assets)
Completion deposit
315,296 312,847
$ 1,343,007 951,691
(9) Commitments and contingencies
(i) As at December 31, 2018 and 2017, the Company’s outstanding letters of credit were $40,317 thousand and $0, respectively.
(ii) As at December 31, 2018 and 2017, the Company’s outstanding purchase commit-ments for construction in progress, property and plant were $2,106,300 thousand and $2,738,897 thousand, respectively;The amount of construction that has not yet oc-curred were $261,638 thousand and $712,159 thousand, respectively.
(10) Losses Due to Major Disasters: None
(11) Subsequent Events: None

LARGAN PRECISION CO., LTD.
Notes to the Parent Company Only Financial Statements
215 (Continued)
(12) Other:
The followings are the summary statement of employee benefits, depreciation, depletion, and amortiza-tion expenses by function in the current period:
By function 2018 2017
By item Operating
cost Operating expenses
Total Operating cost
Operating expenses
Total
Employee benefits Salary 4,755,201 3,150,512 7,905,713 4,265,379 3,336,893 7,602,272 Labor and health insurance 314,333 100,010 414,343 254,735 85,921 340,656 Pension 118,679 42,783 161,462 99,378 36,320 135,698 Remaneration directors - 230,751 230,751 - 246,149 246,149 Others 140,068 30,853 170,921 112,351 25,386 137,737 Depreciation 2,581,604 184,703 2,766,307 2,056,016 146,060 2,202,076 Amortization 21,515 39,961 61,476 7,131 22,921 30,052
The average number of employee of the Company in 2018 and 2017 were 6,394 and 5,243, respec-tively, excluding the 5 directors.
(13) Other disclosures:
(a) Information on significant transactions:
The following is the information on significant transactions, required by the “Regulations Govern-ing the Preparation of Financial Reports by Securities Issuers”, of the Company
(i) Loans to other parties: None
(ii) Guarantees and endorsements for other parties: None
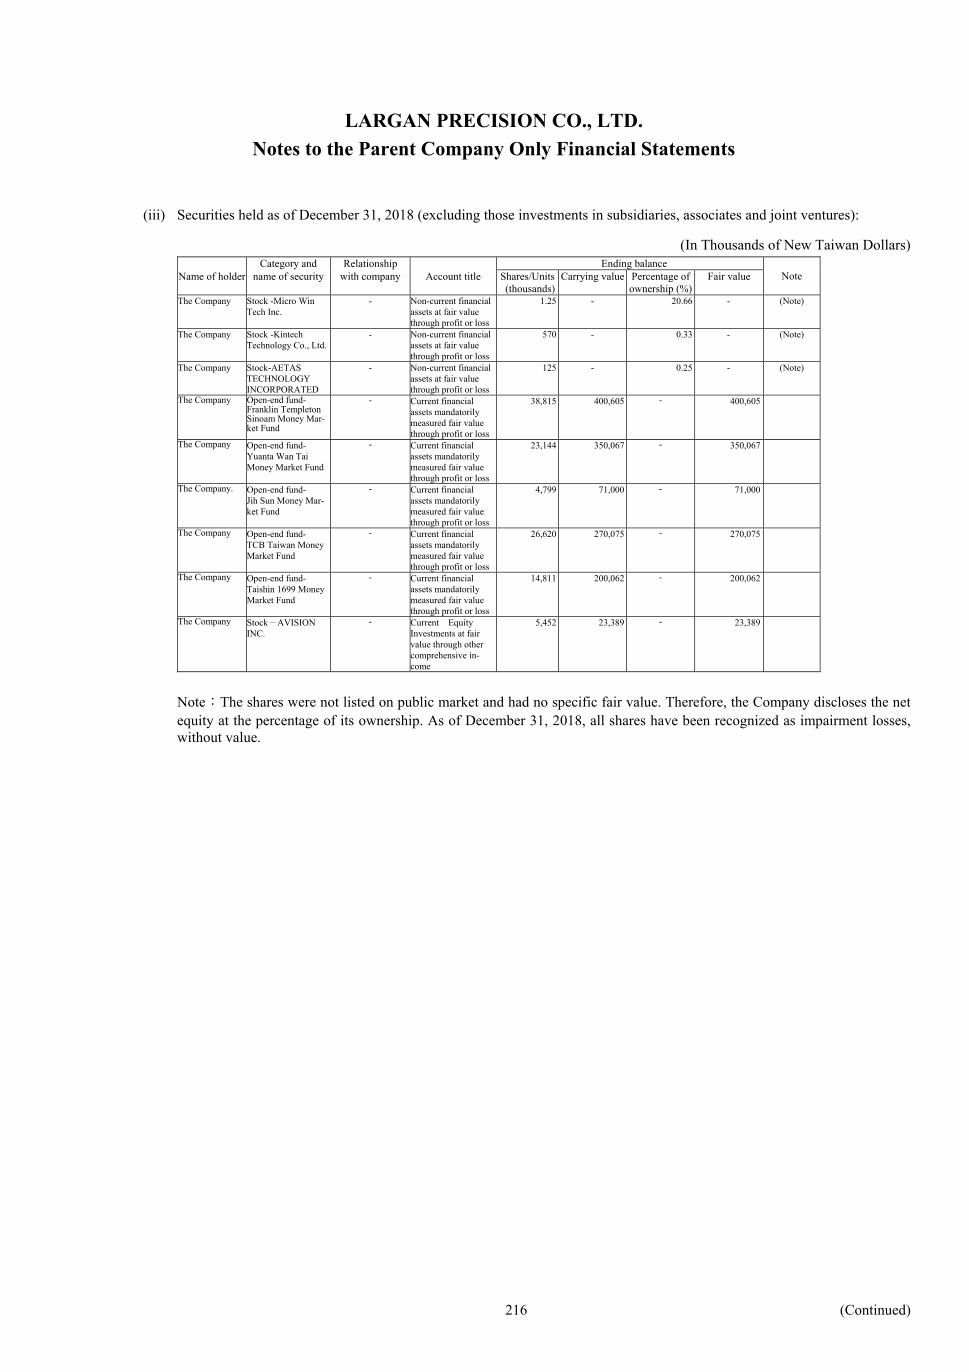
LARGAN PRECISION CO., LTD.
Notes to the Parent Company Only Financial Statements
216 (Continued)
(iii) Securities held as of December 31, 2018 (excluding those investments in subsidiaries, associates and joint ventures):
(In Thousands of New Taiwan Dollars) Category and Relationship Ending balance
Note Name of holder name of security with company Account title Shares/Units (thousands)
Carrying value Percentage of ownership (%)
Fair value
The Company Stock -Micro Win Tech Inc.
- Non-current financial assets at fair value through profit or loss
1.25 - 20.66 - (Note)
The Company Stock -Kintech Technology Co., Ltd.
- Non-current financial assets at fair value through profit or loss
570 - 0.33 - (Note)
The Company Stock-AETAS TECHNOLOGY INCORPORATED
- Non-current financial assets at fair value through profit or loss
125 - 0.25 - (Note)
The Company Open-end fund- Franklin Templeton Sinoam Money Mar-ket Fund
- Current financial assets mandatorily measured fair value through profit or loss
38,815 400,605 - 400,605
The Company Open-end fund- Yuanta Wan Tai Money Market Fund
- Current financial assets mandatorily measured fair value through profit or loss
23,144 350,067 - 350,067
The Company. Open-end fund- Jih Sun Money Mar-ket Fund
- Current financial assets mandatorily measured fair value through profit or loss
4,799 71,000 - 71,000
The Company Open-end fund- TCB Taiwan Money Market Fund
- Current financial assets mandatorily measured fair value through profit or loss
26,620 270,075 - 270,075
The Company Open-end fund- Taishin 1699 Money Market Fund
- Current financial assets mandatorily measured fair value through profit or loss
14,811 200,062 - 200,062
The Company Stock-AVISION INC.
- Current Equity Investments at fair value through other comprehensive in-come
5,452 23,389 - 23,389
Note:The shares were not listed on public market and had no specific fair value. Therefore, the Company discloses the net equity at the percentage of its ownership. As of December 31, 2018, all shares have been recognized as impairment losses, without value.

LARGAN PRECISION CO., LTD.
Notes to the Parent Company Only Financial Statements
217 (Continued)
(iv) Individual securities acquired, or disposed, with an accumulated amount exceeding the lower of NT$300 million or 20% of the capital stock:
Name of Category and
Name of
Relationship
Beginning Balance
Purchases
Sales
Ending Balance
company name of security
Account name
coun-ter-party
with the com-pany
Shares
Amount
Shares
Amount
Shares
Price
Cost
Gain (loss) on disposal
Shares
Amount
The Com-
pany
Open-end
fund-
Franklin
Templeton
Sinoam
Money
Market Fund
Current finan-
cial assets
mandatorily
measured fair
value through
profit or loss
- - 32,161 330,399 58,254 600,000 51,600 531,725 530,000 1,725 38,815 400,605
The Com-
pany
Open-end
fund-
capital
money
market fund
Current finan-
cial assets
mandatorily
measured fair
value through
profit or loss
- - - - 75,617 1,215,000 75,617 1,215,752 1,215,000 752 - -
The Com-
pany
Open-end
fund-
Yuanta Wan
Tai
Money
Market Fund
Current finan-
cial assets
mandatorily
measured fair
value through
profit or loss
- - - - 78,174 1,180,000 55,030 830,496 830,000 496 23,144 350,067
The Com-
pany
Open-end
fund-
Jih Sun
Money
Market Fund
Current finan-
cial assets
mandatorily
measured fair
value through
profit or loss
- - 13,597 200,248 78,013 1,151,000 86,811 1,281,437 1,280,000 1,437 4,799 71,000
The Com-
pany
Open-end
fund-
FSITC
Taiwan
Money
Market
Current finan-
cial assets
mandatorily
measured fair
value through
profit or loss
- - 36,176 550,132 42,004 640,000 78,180 1,191,830 1,190,000 1,830 - -
The Com-
pany
Open-end
fund-
FSITC
Money
Market
Current finan-
cial assets
mandatorily
measured fair
value through
profit or loss
- - - - 4,729 840,000 4,729 840,491 840,000 491 - -
The Com-
pany
Open-end
fund-
Eastspring
Investments
Well Pool
Money
Market Fund
Current finan-
cial assets
mandatorily
measured fair
value through
profit or loss
- - - - 67,248 910,000 67,248 911,282 910,000 1,282 - -
The Com-
pany
Open-end
fund-
Union
Money
Market Fund
Current finan-
cial assets
mandatorily
measured fair
value through
profit or loss
- - 15,996 210,014 7,611 100,000 23,607 310,438 310,000 438 - -
The Com-
pany
Open-end
fund-
TCB Taiwan
Money
Market Fund
Current finan-
cial assets
mandatorily
measured fair
value through
profit or loss
- - 49,614 501,174 41,444 420,000 64,438 652,802 650,000 2,802 26,620 270,075
The Com-
pany
Open-end
fund-
UPAMC
James Bond
Money
Market Fund
Current finan-
cial assets
mandatorily
measured fair
value through
profit or loss
- - - - 31,566 525,000 31,566 525,942 525,000 942 - -

LARGAN PRECISION CO., LTD.
Notes to the Parent Company Only Financial Statements
218 (Continued)
The Com-
pany
Open-end
fund-
Fubon
Chi-Hsiang
Money
Market Fund
Current finan-
cial assets
mandatorily
measured fair
value through
profit or loss
- - - - 51,832 810,000 51,832 810,577 810,000 577 - -
The Com-
pany
Open-end
fund-
Taishin 1699
Money
Market Fund
Current finan-
cial assets
mandatorily
measured fair
value through
profit or loss
- - 13,386 180,000 109,066 1,470,000 107,641 1,451,140 1,450,000 1,140 14,811 200,062
The Com-
pany
Open-end
fund-
Cathay
Taiwan
Money
Market Fund
Current finan-
cial assets
mandatorily
measured fair
value through
profit or loss
- - - - 40,319 500,000 40,319 500,476 500,000 476 - -
The Com-
pany
Open-end
fund-
Fuh Hwa
Money
Market
Current finan-
cial assets
mandatorily
measured fair
value through
profit or loss
- - - - 23,615 340,000 23,615 340,090 340,000 90 - -
(v) Acquisition of individual real estate with amount exceeding the lower of NT$300 million or 20% of the capital stock:
If the counter-party is a related party, disclose the previous transfer information
References
Purpose of
Name of company
Name of property
Transaction
date
Transaction
amount
Status ofpayment
Coun-
ter-party
Relationshipwith the
Company
Owner
Relationship with the
Company
Date of transfer
Amount
for determining
price
acquisitionand current condition
Others The Com-pany
Land and buildings
2018.9 804,648 As of De-cember 31, 2018, $804,648 thousand has been paid
Natural Person
None - Professional Appraisal Report
Future Op-erational Needs
None
(vi) Disposal of individual real estate with an amount exceeding the lower of NT$300 million or 20% of the capital stock: None
(vii) Related-party transactions for purchases and sales with amounts exceeding the lower of NT$100 million or 20% of the capi-tal stock:
Transaction details
Transactions with terms differ-ent from others
Notes/Accounts receivable (paya-ble)
Name of company
Related party
Nature of relationship
Purchase/Sale
Amount
Percentage of total purchas-
es/sales
Payment terms
Unit price
Payment terms
Ending balance
Percentage of total notes/accounts
receivable (paya-ble)
Note
The Company Amtai Interna-tional Ltd.
The Company's subsidiary
Purchases 2,692,182 34% 120Days - - (695,917) (29)%
The Company Amtai Interna-tional Ltd.
The Company's subsidiary
Sale (11,950,301) (25)% 30Days - - 1,054,264 10%
The Company Suzhou Largan Co., Ltd.
The Company's subsidiary
Sale (9,881,631) (20)% 120Days - - - -%
The Company Largan (Dongguan) Optronic Ltd.
The Company's subsidiary
Sale (13,052,869) (27)% 120Days - - 6,650,134 64%

LARGAN PRECISION CO., LTD.
Notes to the Parent Company Only Financial Statements
219 (Continued)
(viii) Receivables from related parties with amounts exceeding the lower of NT$100 million or 20% of the capital stock:
Name of Nature of Ending Turnover Overdue Amounts received in Loss company Related-party relationship balance(Note2) rate Amount Action taken subsequent period allowance
The Company Amtai International Ltd.
The Company's subsidiary
1,106,856 7.83 - None 922,470(Note1)
-
The Company Largan (Dongguan) Optronic Ltd.
The Company's subsidiary
6,650,134 3.92 - None 1,970,270(Note1)
-
Note1: Until February 5, 2019.
Note2: Including other receivables.
(ix) Trading in derivative instruments: None
(b) Information on investees:
The following is the information on investees (excluding information on investees in Mainland China):
(In Thousands of New Taiwan Dollars) Main Original investment amount Balance as of December 31, 2018 Net income Share of
Name of investor
Name of investee Location
businesses and products
December 31, 2018
December 31, 2017
Shares (thousands)
Percentage of ownership
Carrying value
(losses) of investee
profits/losses of investee
Note
The Com-pany
Largan Digital Co., Ltd.
Taichung, Taiwan
Manufacturing of image capture device、image reader、camera and player etc.
411,359 411,359 26,636 49.37% 167,944 61,890 54,546 The Company's subsidiary
The Com-pany
Largan (Hong Kong) Ltd.
Hong Kong Investment 658,555 658,555 31,100 100% 341,593 7,611 7,611 The Company's subsidiary
The Com-pany
Astro Interna-tional Ltd.
Samoa Investment 247,104 247,104 7,600 100% 29,566,165 1,974,133 2,088,277 The Company's subsidiary
The Com-pany
Ba Fang Co., Ltd.
Taichung, Taiwan
Investment、building construc-tion etc.
28,000 28,000 2,800
100% 22,780 (1,139) (1,139) The Company's subsidiary
Largan Digital Co., Ltd.
Largan Medical Co. Ltd.
Taichung, Taiwan
Manufacturing of Optical Instru-ments、Medical and Photo instruments sale etc.
428,252 428,252 40,497 40.5% 267,917 13,326 5,397 The Company's subsidiary
Largan Digital Co., Ltd.
Alpha Holding Inc.
Samoa Investment 118,415 118,415 3,700 100% 35,686 (6,967) (6,967) The Company's subsidiary
Astro International Ltd.
Net International Trading Ltd.
British Virgin Islands
Investment 756,599 756,599 24,300 100% 6,391,334 783,070 783,070 The Company's subsidiary
Astro International Ltd.
Amtai Interna-tional Ltd.
Samoa Manufacturing of Optical part etc.
50,600 50,600 1,500 100% 21,053,600 1,114,190 1,121,708 The Company's subsidiary
Astro International Ltd.
Largan Health Technology Inc.
Samoa Investment 110,898 110,898 1,476 12% 32,701 (57,916) (6,950) The Company's subsidiary
Ba Fang Co., Ltd.
Fang Yuan Co., Ltd.
Taichung, Taiwan
Investment 14,800 14,800 1,480 100% 9,692 (1,133) (1,133) The Company's subsidiary
Largan Medical Co. Ltd.
Beta Internation-al Ltd.
Samoa investment 120,334 120,334 3,700 100% 79,867 (18,550) (18,550) The Company's subsidiary
Alpha Holding Inc.
Largan Health Technology Inc.
Samoa investment 110,898 110,898 1,476 12% 32,701 (57,916) (6,950) The Company's subsidiary
Beta Interna-tional Ltd.
Largan Health Technology Inc.
Samoa investment 110,898 110,898 3,936 32% 76,881 (57,916) (18,533) The Company's subsidiary
Largan Health Technology Inc.
Dynadx Corpo-ration
U.S.A Development of the software
10,629 8,483 10,617 100% 6,557 (2,007) (2,007) The Company's subsidiary
Largan Health Technology Inc.
Largan Health Technology Co., Ltd.
Taichung, Taiwan
Sales of medical equipment
40,797 34,797 2,845 100% 2,586 (18,397) (18,397) The Company's subsidiary

LARGAN PRECISION CO., LTD.
Notes to the Parent Company Only Financial Statements
220
(c) Information on investment in mainland China:
(i) The names of investees in Mainland China, their main businesses and products, and other information:
(In Thousands of New Taiwan Dollars)
Main
Total Accumulated
outflow of
Investment flows Accumulated
outflow of Net
income
Accumulated
Name of investee
businesses and
products
amount of capital surplus
Method of
investment
investment from Taiwan as of
January 1, 2018
Outflow
Inflow
investment from Taiwan as of
December 31, 2018
(losses) of the
investee
Percentageof
ownership
Investment income (losses)
Book value
remittance of earnings in
current periodLARGAN (DONGGUAN) OP-TRONIC LTD.
Production and sales of camera lenses, scanner lens optoelectronic devices, viewing windows, digital elec-tronic cameras
HK$ 178,076 Note1(a) HK$ 85,986US$ 7,474
- - HK$ 85,986US$ 7,474
RMB$ 85,948
100.00% NT$ 393,041
NT$ 2,659,889
-
Suzhou Largan Co., Ltd.
Production of digital camer-as and key components, optoelectronic devices
US$ 5,000 Note1(a) US$ 5,000 - - US$ 5,000 RMB$ 85,435
100.00% NT$ 389,463
NT$ 3,712,916
US$ 5,206
Nanjing Largan Health Technology Co., Ltd.
Health man-agement, computer and medical device tech-nology de-velopment, production and sales of medical devices
US$ 3,000 Note1(b) - - - - RMB$ (7,217)
24.32% NT$ (8,054)
NT$ 11,238
-
NEO (Shanghai) Medical Technology Co., Ltd.
Technical development and technical services in the field of medi-cal device technology
RMB$ 20,000 Note1(b) - - - - RMB$ (737)
9.80% NT$ (331)
NT$ 8,341
-
(ii) Limitation on investment in Mainland China:
Accumulated Investment in Mainland China as of December 31, 2018
Investment Amounts Authorized by In-vestment Commission, MOEA Upper Limit on Investment
NT$720,290 (HK$85,986 and US$12,474)
NT$881,421 (HK$85,986 and US$17,720)
NT$64,559,743
Note 1(a): Indirectly investment in Mainland China through an existing company registered in the third region.
Note 2(b): Other method of investment.
(iii) Significant transactions:
The significant inter-company transactions with the subsidiary in Mainland China, which were eliminated in the prepara-tion of consolidated financial statements, are disclosed in the “Information on significant transactions”.
(14) Segment information
Please refer to the 2018 consolidated financial statement.

221
LARGAN PRECISION CO., LTD.
Statement of cash on hand and demand deposits
December 31, 2018
(Expressed in Thousands of NTD; Expressed in
Dollars of Foreign Currencies)
Items Description Amount
Cash Cash $ 58
Cash on foreign Currency 478
Subtotal 536
Cash in banks Demand deposits 4,288,875
Demand deposit on foreign Currency
(USD35,606,287.03×30.715
GBP59,967.27×38.88
JPY4,073,792,215.33×0.2782
EUR1,954,760.85 × 35.20
HKD1,060.36×3.921
CNY2,993,594.69 ×4.472
CHF348.96×31.185) 2,311,518
Time deposits 30,392,900
Time deposits on foreign currency
(USD412,500,000 × 30.715
CNY1,467,000,000.00×4.472) 19,230,361
Subtotal 56,223,654
Total $ 56,224,190

222
LARGAN PRECISION CO., LTD.
Statement of Current Financial Assets at Fair Value
through Profit or Loss
December 31, 2018
(Expressed in Thousands of NTD; Expressed in Dollars of
Unit cost and price)
Fair Value
Names of financial investment Description Unit in thousands Acquisition Unit price Total amount
Franklin Templeton Sinoam Money
Market Fund
Open-end fund 38,815 $ 400,000 10.32 400,605
Yuanta Wan Tai Money Market Fund Open-end fund 23,144 350,000 15.13 350,067
TCB Taiwan Money Market Fund Open-end fund 26,620 270,000 10.15 270,075
Taishen 1699 Money Market Fund Open-end fund 14,811 200,000 13.51 200,062
Jih Sun Money Market Fund Open-end fund 4,799 71,000 14.79 71,000
$ 1,291,000 1,291,809
Statement of Current Financial Assets at Fair Value through Comprehensive Income
Equity Securities
AVISION Stock 5,452 $ 40,280 4.29 23,389

223
LARGAN PRECISION CO., LTD.
Statement of Notes and Accounts Receivable
December 31, 2018
(Expressed in Thousands of NTD)
Client No. Description Amount
Accounts receivable-unrelated parties
653021 Operating $ 924,678
643006 Operating 683,381
633036 Operating 538,986
Other (Note) Operating 494,689
Total 2,641,734
Impairment loss on allowance (2,250)
Net amount $ 2,639,484 Note: The amount of each item in others does not exceed 5% of the account balance.
Statement of Other Receivables
Items Description Amount
Tax receivables Income tax refund of exercise tax $ 112,000
Interest receivables Income interest of cash in bank 88,390
Others (Note) 12,820
Total $ 213,210
Note: The amount of each item in others does not exceed 5% of the account balance.

224
LARGAN PRECISION CO., LTD.
Statement of Inventories
December 31, 2018
(Expressed in Thousands of NTD)
Amount Item Cost Market Value Note
Goods $ - - Market value of net realizable value
Finish goods 1,944,693 5,638,250 Market value of net realizable value
Work in progress 1,258,289 3,823,060 Market value of net realizable value
Raw materials 807,863 776,386 Market value of net realizable value
4,010,845 10,237,696
Loss on allowance for doubtful
accounts
(550,133)
Total $ 3,460,712
Statement of Other Current Assets
Items Description Amount Other current assets Temporary payment $ 538,641
Others (Note) 14,849
$ 553,490
Note: The amount of each item in others does not exceed 5% of the account balance.

225
LARGAN PRECISION CO., LTD.
Statement of Changes in Investments Accounted for Equity
Method
January 1, 2018 to December 31, 2018
(Expressed in Thousands of NTD)
Beginning balance
Addition
Decrease
Amount of ex-change on
Ending balance
translation of Names of Investee
Shares
Percentage of ownership
Amount
Shares
Amount
Shares
Amount
Profit or loss of investment
foreign financial statement
Retainedearnings
Other (Note)
Shares
Percentage of ownership
Amount
Pledge of collateral
Largan (Hong Kong) Limited
31,100 100.00 $ 323,48 - - - - 7,611 10,500 - - 31,100 100.00 341,593 None
Largan Digital Co., Ltd. 26,636 49.37 120,31 - - - - 54,546 (814) - (6,106) 26,636 49.37 167,944 None
Astro International Ltd. 7,600 100.00 27,014,70 - - - - 2,088,277 612,591 (37,969) (111,443) 7,600 100.00 29,566,165 None
Ba Fang Co., Ltd. 2,800 100.00 23,91 - - - - (1,139) - - - 2,800 100.00 22,780 None
Prepayments for long-term investment
- - - - 8,800 - - - - - - - - 8,800 None
Total $ 27,482,42 8,800 - 2,149,295 622,277 (37,969) (117,549) 30,107,282
Note: The unrealized gain (loss) is refer to the downstream transactions and upstream transactions.

226
LARGAN PRECISION CO., LTD.
Statement of changes in Property, Plant, and
Equipment
January 1, 2018 to December 31, 2018
(Expressed in Thousands of NTD)
Please refer to note (6)(i).
Statement of Other Non-current Assets
December 31, 2018
Items Description Amount
Refundable deposits Litigation deposit $ 1,021,711
Others (Note) 10,653
1,032,364
Restricted cash in bank-non-current Completion deposit 315,296
Prepayment for equipment Prepaid machine equipment 1,424,548
Total $ 2,772,208
Note: The amount of each item in others does not exceed 5% of the account balance.

227
LARGAN PRECISION CO., LTD.
Statement of Bank Loan
December 31, 2018
(Expressed in Thousands of NTD)
Creditor
Type of loan
Ending balance
Contract Pe-riod
Range of interest rate
Loan Commit-
ment
Collateral
Mega Bank Credit loan $ 552,868 Due within a year 0.89~1.05% 1,300,000 None
Statement of Notes and Accounts Payable
Vendor Name Description Amount
Notes payable-unrelated parties non-operating $ 846
Accounts payable-unrelated parties
110185 operating $ 438,499
110181 operating 234,929
100230 operating 201,730
100236 operating 161,885
110059 operating 151,638
110184 operating 138,973
170426 operating 84,950
Others (Note) operating 241,788
Total $ 1,654,392

228
Note: The amount of each item in others does not exceed 5% of the account balance.
LARGAN PRECISION CO., LTD.
Statement of Other Payables
December 31, 2018
(Expressed in Thousands of NTD)
Please refer to note (6)(o).
Statement of Other Non-current Liabilities
Items Description Amount
Other non-current liabilities Guarantee deposits received $ 4,473

229
LARGAN PRECISION CO., LTD.
Statement of Operating Income
For 2018
(Expressed in Thousands of NTD)
Items Quantity (unit in thousands) Amount
Lens 1,211,972 $ 46,890,530
Others (Note) 288,090
Total $ 47,178,620
Note: The amount of each item in others does not exceed 10% of the account balance.

230
LARGAN PRECISION CO., LTD.
Statement of Opening Costs
For 2018
(Expressed in Thousands of NTD)
Items Amount Goods
Goods, beginning of year $ 1
Goods purchased 14,280
Goods, end of year -
Cost of goods 14,281
Raw materials and supplies
Raw materials and supplies, beginning of year 651,647
Addition:Raw materials and supplies purchased 5,194,139
Raw materials and supplies surplus 1,183
Decrease:Raw materials and supplies, end of year 807,863
Sale of raw materials and supplies 3,565
Others 452,420
Raw materials and supplies used 4,583,121
Direct labor 1,841,127
Manufacturing expense 8,424,124
Manufacturing Cost 14,848,372
Addition :Work in progress, beginning of year 682,760
Decrease: Work in progress, end of year 1,258,289
Cost of finished goods 14,272,843
Addition:Finished goods, beginning of year 1,149,059
Finished goods purchased 1,289,323
Finished goods surplus 2,176
Decrease:Finished goods, end of year 1,944,693
Scrapped 137,570
Other 60,367
Production and marketing costs 14,570,771
Processing cost 11,413
Sale of raw materials and supplies 3,565
Inventory surplus and shortage (3,359)
Revenue from sale of scraps (66,266)
Inventory scrap loss 137,570
Inventories related to profit or loss 37
Operating costs $ 14,668,012

231
LARGAN PRECISION CO., LTD.
Statement of Operating Expenses
For 2018
(Expressed in Thousands of NTD)
Items
Selling expenses
Administrative Expenses
Research and devel-opment expenses
Payroll $ 193,120 540,820 2,416,572
Import and export expense 54,061 - -
Consumable expense - - 452,766
Others (note) 40,058 543,415 383,509
$ 287,239 1,084,235 3,252,847
Note: The amount of each item in others does not exceed 5% of the account balance. 6.6 Impact on the Company's financial status due to financial difficulties experienced by the Company and its affiliate companies in the most recent year and as of the publication date of this Annual Report: None.
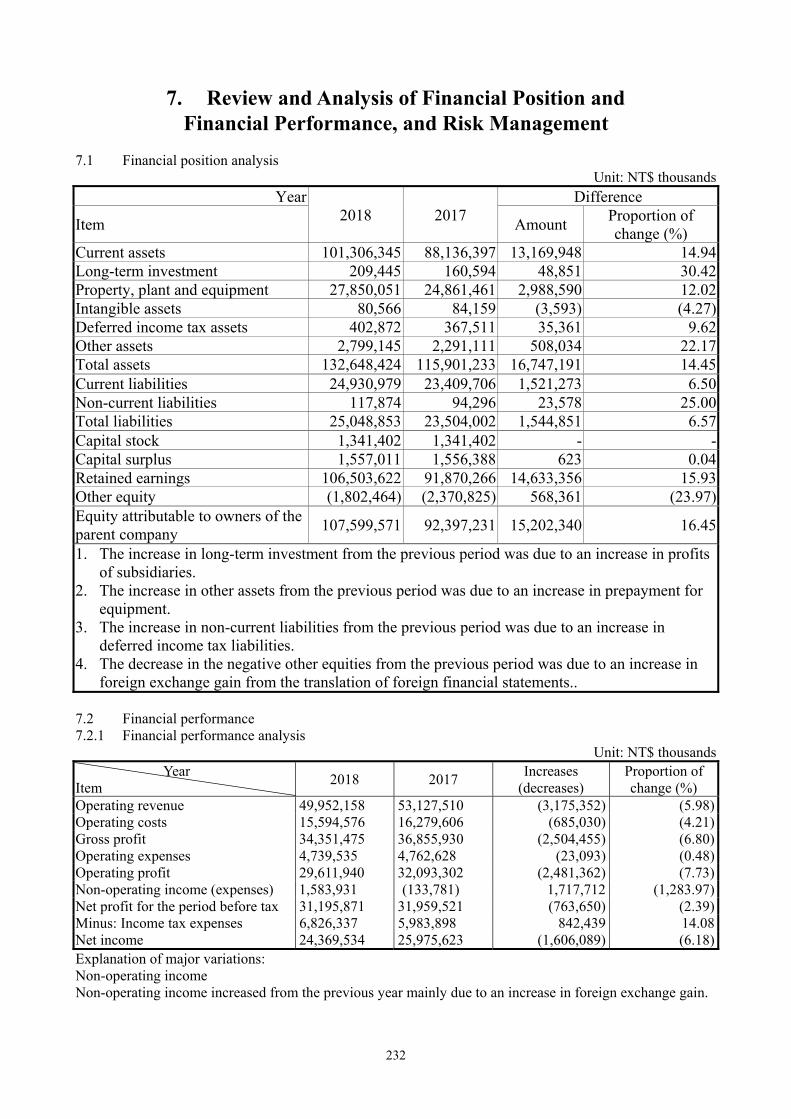
232
7. Review and Analysis of Financial Position and Financial Performance, and Risk Management
7.1 Financial position analysis Unit: NT$ thousands
Year 2018 2017
Difference
Item Amount Proportion of change (%)
Current assets 101,306,345 88,136,397 13,169,948 14.94Long-term investment 209,445 160,594 48,851 30.42Property, plant and equipment 27,850,051 24,861,461 2,988,590 12.02Intangible assets 80,566 84,159 (3,593) (4.27)Deferred income tax assets 402,872 367,511 35,361 9.62Other assets 2,799,145 2,291,111 508,034 22.17Total assets 132,648,424 115,901,233 16,747,191 14.45Current liabilities 24,930,979 23,409,706 1,521,273 6.50Non-current liabilities 117,874 94,296 23,578 25.00Total liabilities 25,048,853 23,504,002 1,544,851 6.57Capital stock 1,341,402 1,341,402 - -Capital surplus 1,557,011 1,556,388 623 0.04Retained earnings 106,503,622 91,870,266 14,633,356 15.93Other equity (1,802,464) (2,370,825) 568,361 (23.97)Equity attributable to owners of the parent company
107,599,571 92,397,231 15,202,340 16.45
1. The increase in long-term investment from the previous period was due to an increase in profits of subsidiaries.
2. The increase in other assets from the previous period was due to an increase in prepayment for equipment.
3. The increase in non-current liabilities from the previous period was due to an increase in deferred income tax liabilities.
4. The decrease in the negative other equities from the previous period was due to an increase in foreign exchange gain from the translation of foreign financial statements..
7.2 Financial performance 7.2.1 Financial performance analysis
Unit: NT$ thousands Year
Item 2018 2017
Increases (decreases)
Proportion of change (%)
Operating revenue 49,952,158 53,127,510 (3,175,352) (5.98)Operating costs 15,594,576 16,279,606 (685,030) (4.21)Gross profit 34,351,475 36,855,930 (2,504,455) (6.80)Operating expenses 4,739,535 4,762,628 (23,093) (0.48)Operating profit 29,611,940 32,093,302 (2,481,362) (7.73)Non-operating income (expenses) 1,583,931 (133,781) 1,717,712 (1,283.97)Net profit for the period before tax 31,195,871 31,959,521 (763,650) (2.39)Minus: Income tax expenses 6,826,337 5,983,898 842,439 14.08Net income 24,369,534 25,975,623 (1,606,089) (6.18)Explanation of major variations: Non-operating income Non-operating income increased from the previous year mainly due to an increase in foreign exchange gain.

233
7.3 Cash flow 7.3.1 Change in cash flow in the most recent fiscal year
Analysis: There were no significant changes in cash flow in the recent fiscal year. 7.3.2 Cash flow projection for the following year: The Company does not provide financial forecasts,
including cash flow projections, for the following year. 7.4 Impact of major capital expenditures on the Company’s financial operations for the most recent
fiscal year 7.4.1 Use and source of funding of major capital expenditures:
Unit: NT$ thousands April 14, 2019
Plan Actual or Expected Source of Capital
Total Capital Required
Actual or Expected Capital Expenditure
Actual Expenditures
Expected Expenditures
Land and building Own funds 3,611,607 3,447,440 3,447,440 7.4.2 Expected potential benefits:
The Company's capital expenditures are necessary to grow the business and to maintain competitiveness.
7.5 Reinvestment policies, main reasons for profits/losses generated thereby, improvement plans, and
investment plans for the coming year: The Company's reinvestments in the most recent year were related to upstream and downstream industries within the scope of the Company's main business. For reinvestments with weaker business performance, the Company will dedicate efforts to improve product quality and channel distribution in order to improve profitability.
7.6 Risk management and assessment 7.6.1 Impacts of interest and foreign exchange rate fluctuations and inflation on the Company’s profit and
loss, and countermeasures: 1. Interest rate: The Company mainly adopts L/C loans and changes in interest rates have little impact
on the Company's profitablity. 2. Exchange rate: The Company may engage in forward contracts to hedge risks to currency exposure
in its net asset positions by using research reports from financial institutions as a reference. 3. Inflation: The Company's products are used in consumer electronics, which are not significantly
impacted by inflation risks. 7.6.2 Policies for high-risk, high-leverage investments, capital lending, endorsements, guarantees, and
derivatives transaction, main reasons for the profits or losses generated thereby, and countermeasures:
1. Engagement in high-risk and high-leverage investments, endorsements, guarantees, or derivatives transactions: None.
2. Policies for loaning of funds, main reasons, and future countermeasures: (1) Policy:
Conducted in accordance with the Company's "Regulations for Loaning of Funds". (2) Main reasons:
Loans are provided in response to the counterparties' short-term financing requirements. (3) Future response measures:
Control measures are implemented in accordance with the Company’s “Regulations for
Year 2018 2017
Proportion of change (%) Item
Cash flow ratio 126.72% 134.88% (6.05%) Cash flow adequacy ratio 206.52% 214.64% (3.78%) Cash flow reinvestment ratio 17.60% 21.71% (18.93%)

234
Loaning of Funds”. 7.6.3 Research and development (R&D) projects and estimated R&D expenditures:
The Company has two development strategies. The first is to continuously refine product precision, and the second is to diversify product application. As such, the Company will continue to invest in R&D, and R&D expenses are expected to grow each year.
7.6.4 Impacts of changes in domestic and foreign government policies and laws on the Company’s financial operations, and future countermeasures: The Company's financial operations are conducted in accordance with applicable regulations and so far there has been no material impact to the Company due to government policy changes.
7.6.5 Impacts of industry and technology changes to the Company’s financial operations, and future countermeasures: Improvements in technology help the adoption of new product applications, improve business scale and product design capabilities as well as help to lower production costs, which should all have positive impacts on the Company's operations.
7.6.6 Impacts of changes in corporate image on the company's crisis management and future countermeasures: The Company’s policy is to disclose financial and business information as required by applicable regulation, and to not make false representations. The Company shall continue to uphold this principle in the future.
7.6.7 Expected benefits and potential risks related to mergers and acquisitions: The Company does not have any recent merger or acquisition plans.
7.6.8 Expected benefits and potential risks of capacity expansion: The Company continues to expand capacity and upgrade equipment with its own funds, and the expected benefits are in line with the Company’s expectations as of the publication date of this Annual Report.
7.6.9 Risk of procurement and sales concentration, and future countermeasures: Sales: The Company's revenues are concentrated in a small number of customers. To lower credit risks, the Company constantly monitors the financial payment status of its main customers and regularly evaluates the collectibility of accounts receivables. Purchases: The Company has long standing relationships with its raw materials suppliers which consist of major domestic and foreign companies, thus ensuring a stable and sufficient supply of raw materials.
7.6.10 Impacts and risks arising from major transfer or replacement of shares by Directors, Supervisors, or shareholders with over 10% of shares in the Company: None.
7.6.11 Impact of change in Company management and associated risks: None. 7.6.12 Litigious or non-litigious matters: None. 7.6.13 Other material risks: None.
7.7 Other Material Matters: None.
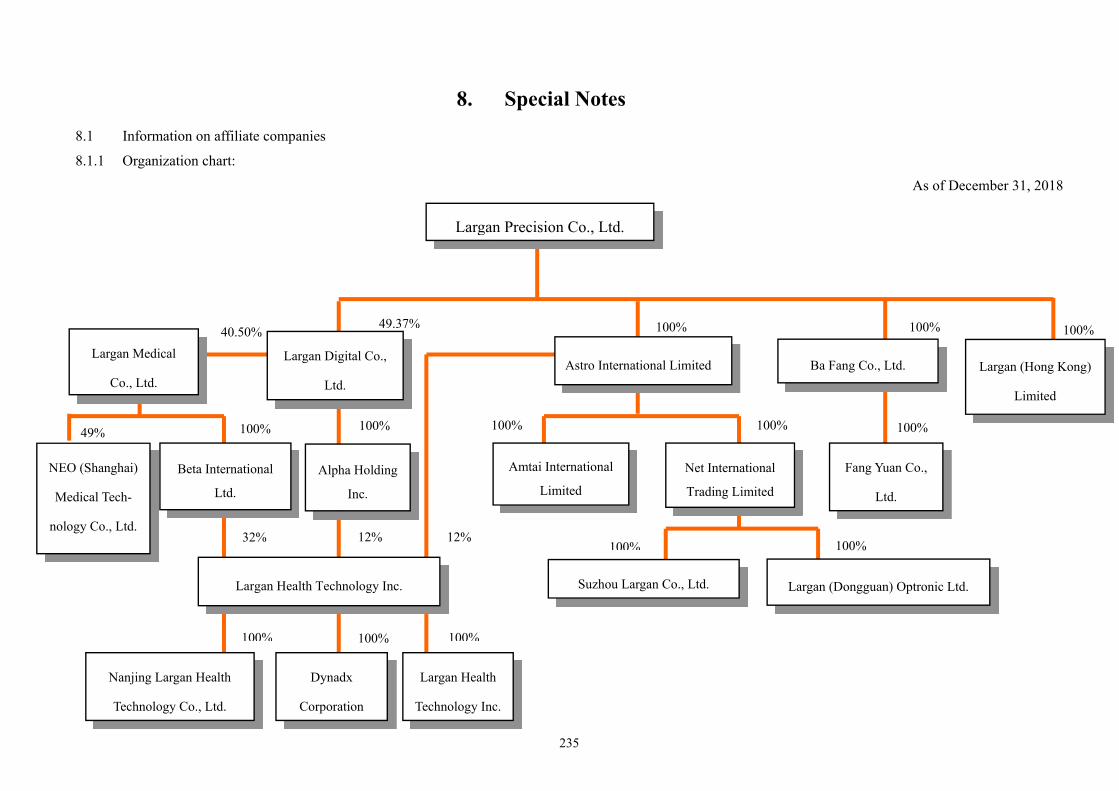
235
8. Special Notes
8.1 Information on affiliate companies
8.1.1 Organization chart:
As of December 31, 2018
Astro International Limited
Amtai International
Limited
Net International
Trading Limited
Largan (Hong Kong)
Limited
Largan Digital Co.,
Ltd.
Suzhou Largan Co., Ltd. Largan (Dongguan) Optronic Ltd.
49% 100%
40.50% 100%
100%100%
Largan Medical
Co., Ltd.
49.37% 100%
Ba Fang Co., Ltd.
100%
Fang Yuan Co.,
Ltd.
100%
Beta International
Ltd.
Alpha Holding
Inc.
NEO (Shanghai)
Medical Tech-
nology Co., Ltd.
Largan Health Technology Inc.
Nanjing Largan Health
Technology Co., Ltd.
Dynadx
Corporation
Largan Health
Technology Inc.
100% 100% 100%
32% 12% 12%
100%100%100%
Largan Precision Co., Ltd.

236
8.1.2 Basic information of affiliated companies: As of December 31, 2018
Unit: $
Name of Business Date of
Incorporation Address Capital Stock
Business Activities
NET International Trading Ltd.
1998.11.19
TrustNet Limited of TrustNet Chambers, P.O. Box 3444, Road Town, Tortola, British Virgin Islands.
USD 24,300,000 Investment
Largan (Hong Kong) Limited
1993.03.25
Room 912, Champion Building, 301-309 Nathan Road, (Jordan Mtr Station) Kowloon.
HKD 31,100,000 Investment
Largan (Dongguan) Optronic Ltd.
1996.03.22
No. 18, First Industrial Zone, Tutang Management Area, Changping Town, Dongguan
HKD 178,076,100
Production of lenses and optical components for digital cameras
Suzhou Largan Co., Ltd.
2003.09.15 No. 188-3, Shanhu Road, Yundong District, Wujiang City
USD 5,000,000
Production of digital cameras, key components, and optoelectronic devices
Largan Digital Co., Ltd. 1997.03.12 3F-5, No. 210, Gongyequ 38th Road, Xitun District, Taichung City
NTD 539,577,500
Production and processing of image capture devices, image readers, cameras, and video cameras
Astro International Ltd. 2004.02.02
Vistra Corporate Services Centre, Ground Floor NPF Building, Beach Road, Apia, Samoa
USD 7,600,000 Investment
Amtai International Ltd. 2004.02.02
Vistra Corporate Services Centre, Ground Floor NPF Building, Beach Road, Apia, Samoa
USD 1,500,000
Trading of lenses and optical components
Largan Medical Co., Ltd.
2004.10.25 2F, No. 14, Gongyequ 23rd Road, Nantun District, Taichung City
NTD 1,000,000,000
Production of optical instruments; wholesale and retail of medical and imaging equipment
Ba Fang Co., Ltd. 2013.4.24 1F, No. 4, Gongyequ 16th Road, Xitun District, Taichung City
NTD 28,000,000
General investment, buildings lease construction and development, and industrial plant development and lease

237
Name of Business Date of
Incorporation Address Capital Stock
Business Activities
Fang Yuan Co., Ltd. 2013.4.26 3F-5, No. 210, Gongyequ 38th Road, Xitun District, Taichung City
NTD 14,800,000
General investment, buildings lease construction and development, and industrial plant development and lease
Alpha Holding Inc. 2017.2.18 2nd Floor, Building B, SNPF Plaza, Savalalo, Apia, Samoa
USD 3,700,000 Investment
Beta International Limited
2017.2.18 2nd Floor, Building B, SNPF Plaza, Savalalo, Apia, Samoa
USD 3,700,000 Investment
Largan Health Technology Inc.
2017.2.18
Vistra Corporate Services Centre, Ground Floor NPF Building, Beach Road, Apia, Samoa
USD 12,300,000 Investment
Largan Health Technology Inc.
2011.2.17 3F, No. 14, Gongyequ 23rd Road, Nantun District, Taichung City
NTD 28,452,910 Wholesale and retail of medical equipment
Nanjing Largan Health Technology Co., Ltd.
2017.7.26
14F, Building 2, Yuhua Salon, No. 109, Software Boulevard, Yuhua District, Nanjing
USD 3,000,000
Health management, computer and medical equipment technology development, production and development of medical equipment
DynaDx Corporation 2005.2.17 335 Alicia Way, Los Altos, CA 94022
USD 1,144,455.91 Software development
NEO (Shanghai) Medical Technology
Co., Ltd. 2017.9.12
Room 1008, No. 258, Guoxia Road, Yangpu District, Shanghai
RMB 20,000,000
Technology development and technical services for medical equipment technologies
8.1.3 Information on shareholders with deemed control and affiliation: None. 8.1.4 Businesses included in the affiliated companies' overall operations:
The Company and affiliate companies' businesses mainly include the research, development, production, manufacturing, and sales of various photoscopes, video cameras, cameras, telescopes, microscopes, fax machines, scanners, multiple signal reader lenses, lenses, mobile phone lenses and cameras.

238
8.1.5 Directors, Supervisors and Presidents of all affiliated companies: Unit: NT$ thousands ; shares; %
Name of Business Title Name or
Representative
Shares Held Number of
Shares Shareholding
Ratio
NET International Trading Ltd.
Director Representative
Astro International Ltd. 24,300,000 100 Representative: En-Chou Lin
- -
Largan (Hong Kong) Limited Director En-Chou Lin, En-Ping
Lin - -
Largan (Dongguan) Optronic Ltd.
Chairman/DirectorEn-Chou Lin/ En-Ping Lin, Chung-Shih Lin
- -
Suzhou Largan Co., Ltd. Chairman/DirectorEn-Chou Lin/ En-Ping Lin, Chung-Shih Lin
- -
Largan Digital Co., Ltd. Chairman En-Ping Lin 1,109,000 2.06 Largan Digital Co., Ltd. Director Shih-Ching Chen 1,039,500 1.93 Largan Digital Co., Ltd. Director En-Chou Lin 572,500 1.06 Largan Digital Co., Ltd. Director Yao-Ying Lin 30,000 0.06 Largan Digital Co., Ltd. Director Po-Jen Liang 515,000 0.95 Largan Digital Co., Ltd. Supervisor Chung-Jen Liang 1,428,000 2.65 Astro International Ltd. Director En-Chou Lin - - Amtai International Ltd. Chairman En-Chou Lin - - Largan Medical Co., Ltd. Director Yao-Ying Lin 119,434 0.12 Largan Medical Co., Ltd. Director Shih-Ching Chen 2,297,417 2.30 Largan Medical Co., Ltd. Director En-Chou Lin 561,184 0.56 Largan Medical Co., Ltd. Chairman En-Ping Lin 1,078,826 1.08 Largan Medical Co., Ltd. Supervisor Chung-Jen Liang 3,315,959 3.32
Ba Fang Co., Ltd. Chairman/DirectorRepresentative:
Largan Precision Co., Ltd.
2,800,000 100
Representative: En-Chou Lin/ En-Ping Lin, Shih-Ching Chen
- -
Ba Fang Co., Ltd. Supervisor
Representative
Largan Precision Co., Ltd.
2,800,000 100
Hsing-Ju Tsao - -
Fang Yuan Co., Ltd. Chairman/Director
Representative:
Ba Fang Co., Ltd. 1,480,000 100 Representative:
Mei-Yu Lin/Chia-Wen Li Su-Ching Chou
- -
Fang Yuan Co., Ltd. Supervisor
Representative
Ba Fang Co., Ltd. 1,480,000 100 Representative: Ya-Wen Chang
- -
Alpha Holding Inc. Director En-Ping Lin - - Beta International Limited Director En-Ping Lin - -
Largan Health Technology Inc.
Director
En-Ping Lin, Sheng-Lien Wang, Cheng-Kuo Lai,
Hsiao-Feng Chang, Yu-I Tseng, Yen-Hui
Liu
- -
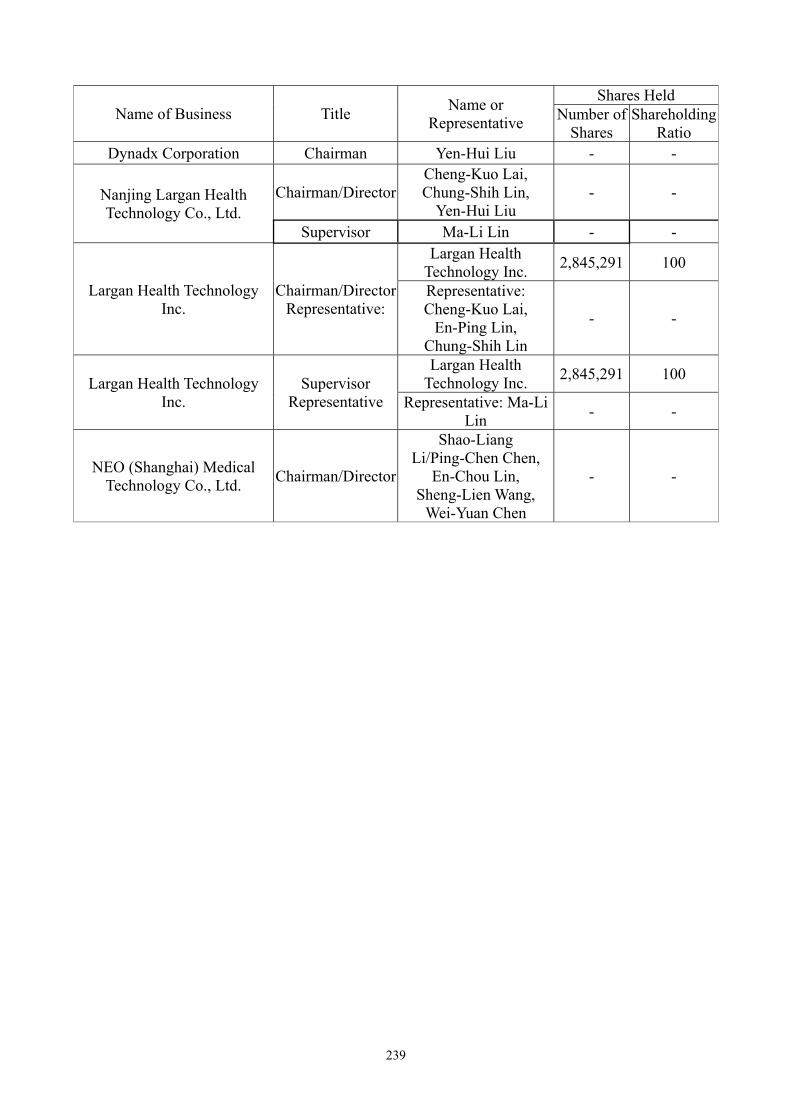
239
Name of Business Title Name or
Representative
Shares Held Number of
Shares Shareholding
Ratio Dynadx Corporation Chairman Yen-Hui Liu - -
Nanjing Largan Health Technology Co., Ltd.
Chairman/DirectorCheng-Kuo Lai, Chung-Shih Lin,
Yen-Hui Liu - -
Supervisor Ma-Li Lin - -
Largan Health Technology Inc.
Chairman/DirectorRepresentative:
Largan Health Technology Inc.
2,845,291 100
Representative: Cheng-Kuo Lai,
En-Ping Lin, Chung-Shih Lin
- -
Largan Health Technology Inc.
Supervisor Representative
Largan Health Technology Inc.
2,845,291 100
Representative: Ma-Li Lin
- -
NEO (Shanghai) Medical Technology Co., Ltd.
Chairman/Director
Shao-Liang Li/Ping-Chen Chen,
En-Chou Lin, Sheng-Lien Wang,
Wei-Yuan Chen
- -

240
8.1.6 Operational highlight of affiliated companies: Unit: NT$ thousands
Name of Business
Capital Stock Assets Liabilities Net Worth Revenue
Operating Income (loss)
Net Income
(Loss) for the Period
Earnings Per Share
(after tax) (NT$)
(after tax)Largan (Hong Kong) Limited 121,943 341,644 52 341,592 0 (96) 7,611 0.24
Net International
Trading Limited 746,375 6,391,668 482 6,391,186 0 (855) 783,070 32.22
Astro - Samoa 233,434 30,727,780 0 30,727,780 0 (28) 1,974,133 259.75Amtai - Samoa 46,073 22,960,250 1,464,547 21,495,703 18,595,490 678,658 1,114,190 742.79Largan
(Dongguan) Optronic Ltd. 698,236 9,662,506 7,137,588 2,524,918 16,926,081 563,711 392,956 Note 1
Suzhou Largan Co.,
Ltd. 153,575 3,715,085 2,255 3,712,830 11,599,199 454,029 389,443 Note 1Largan Digital
Co., Ltd. 539,578 931,448 31,138 900,310 285,277 60,362 61,890 1.15Largan
Medical Co., Ltd. 1,000,000 706,718 65,599 641,119 315,623 31,653 13,326 0.13
Ba Fang Co., Ltd. 28,000 22,786 6 22,780 84 (67) (1,139) (0.41)
Fang Yuan Co., Ltd. 14,800 9,692 0 9,692 0 (1,147) (1,133) (0.77)
Alpha Holding Inc. 113,646 35,686 0 35,686 0 (28) (6,967) (1.88)Beta
International Limited 113,646 79,867 0 79,867 0 (28) (18,550) (5.01)
Largan Health Technology
Inc. 377,795 272,565 60 272,505 0 (9,273) (57,916) (4.71)Nanjing
Largan Health Technology
Co., Ltd. 92,145 47,394 1,186 46,208 0 (33,105) (33,112) Note 1Largan Health
Technology Inc. 28,453 7,652 691 6,961 0 (18,430) (18,397) (6.47)
Dynadx Corporation 35,152 3,746 17 3,729 9 (1,978) (2,007) (0.19)
NEO (Shanghai)
Medical Technology
Co., Ltd. 89,440 85,189 56 85,133 0 (3,378) (3,378) Note 1
Note 1: Not applicable as these companies are not limited by shares 8.1.7 Consolidated financial report of affiliated companies:
Description: The companies that should be incorporated in the consolidated financial statements of affiliated companies are the same as those that should be incorporated in the consolidated financial

241
statements of parent and subsidiary companies in accordance with IFRS 27 recognized by the Financial Supervisory Commission. In addition, the related information that must be disclosed in the consolidated financial report of affiliated companies has been fully disclosed in the consolidated financial statements of parent and subsidiary companies. Therefore, the Company only issued a statement on the first page of the consolidated financial statements of parent and subsidiary companies and shall not prepare separate consolidated financial statements of affiliated companies or issue a statement for the consolidated financial statements of affiliated companies. (Please refer to page 68 of the Annual Report)
8.1.8 Affiliation report: Not applicable. Description: The Company is not a subordinate company of other affiliated companies and an affiliation report is thus not required.
8.2 Private placement of securities of the past year as of the publication date of this Annual Report: None.
8.3 Holding or disposal of the Company's shares by the subsidiaries of the most recent year as of the publication date of this Annual Report: None.
8.4 Other necessary supplementary items to be included: None.

242
9. Any event which has a material impact on the shareholders' equity or securities prices as prescribed in Subparagraph 2, Paragraph 2, Article 36 of the Securities and Exchange Act that has occurred in the most recent year as of the publication date of this Annual Report: None.