Embed Size (px)
Citation preview


doi:10.1016/j.jcmg.2009.06.004 2009;2;1009-1023 J. Am. Coll. Cardiol. Img.
K. Lance Gould Does Coronary Flow Trump Coronary Anatomy?
This information is current as of August 11, 2009
http://imaging.onlinejacc.org/cgi/content/full/2/8/1009located on the World Wide Web at:
The online version of this article, along with updated information and services, is
by K. Lance Gould on August 11, 2009 imaging.onlinejacc.orgDownloaded from

S
D
K
H
C
m
i
g
s
s
c
C
St(nchifliIpgstnirrstca
t
Fa
M
J A C C : C A R D I O V A S C U L A R I M A G I N G V O L . 2 , N O . 8 , 2 0 0 9
© 2 0 0 9 B Y T H E A M E R I C A N C O L L E G E O F C A R D I O L O G Y F O U N D A T I O N I S S N 1 9 3 6 - 8 7 8 X / 0 9 / $ 3 6 . 0 0
P U B L I S H E D B Y E L S E V I E R I N C . D O I : 1 0 . 1 0 1 6 / j . j c m g . 2 0 0 9 . 0 6 . 0 0 4
T A T E - O F - T H E - A R T P A P E R
oes Coronary Flow Trump Coronary Anatomy?
. Lance Gould, MD
ouston, Texas
oronary function versus anatomy, flow versus stenosis: which optimizes coronary artery disease (CAD)
anagement? In patients, coronary flow is poorly related to stenosis severity, and revascularization fails to
mprove mortality over medical treatment in randomized trials. Yet percutaneous intervention (PCI)
uided by fractional flow reserve reduces coronary events more than PCI guided by arteriographic
tenosis. These paradoxes are explained by the poor relation between coronary flow reserve (CFR) and
tenosis severity due to diffuse CAD, with surprising clinical implications. Should the concept of anatomi-
ally “critical” coronary stenosis be replaced by the concept of “critical” CFR reduction for managing
AD? (J Am Coll Cardiol Img 2009;2:1009 –23) © 2009 by the American College of Cardiology Foundation
btlepmflwmwptmtip
ML
TTwd
g At
everal major paradoxes remain unresolved inhe management of coronary artery diseaseCAD). The first is that percent stenosis doesot predict or reliably relate to maximum flowapacity or coronary flow reserve (CFR) inuman CAD. The second is that revascular-
zation procedures to improve coronary bloodow do not reduce coronary events more than
ntense medical treatment in randomized trials.n contrast to these revascularization trials,ercutaneous coronary intervention (PCI)uided by fractional flow reserve (FFR) hadignificantly fewer follow-up coronary eventshan PCI based on angiographic percent ste-osis. Finally, as an example of the underlying
ssues, a fixed mild stenosis on a clinical arte-iogram may, in some circumstances, markedlyeduce maximum coronary flow and flow re-erve, reduce FFR, and warrant revasculariza-ion despite similar mild stenosis not signifi-antly reducing CFR in precise stenosis ofnimal models.
These paradoxes are so counterintuitive thathey evoke a wide range of explanations, de-
rom the Weatherhead P.E.T. Center for Preventing and Reversint Houston and Memorial Hermann Hospital, Houston, Texas.
anuscript received March 31, 2009; revised manuscript received June
by K.imaging.onlinejacc.orgDownloaded from
ate, or disregard, all of which have elements ofruth but lack cohesive explanation. This ana-ytical review addresses these paradoxes with anxplanation leading to a surprising clinical hy-othesis: for equal optimal medical manage-ent, revascularization to improve coronary
ow may reduce coronary events in patientsith initial severe reduction in absolute maxi-um coronary flow or CFR, but not in patientsith adequate flow capacity, independent ofercent stenosis. In other words, revasculariza-ion in patients with low coronary flow capacityay show mortality benefit over revasculariza-
ion in populations chosen for the revascular-zation trials based on percent stenosis that isoorly related to coronary flow capacity.
ild Stenosis Causing Low CFR,ow FFR, Indicating PCI
he following case illustrates these paradoxes.he patient in Figure 1 is a 68-year-old manith hypertension, past smoking, low high-ensity lipoprotein (HDL) level, and acute
herosclerosis, University of Texas Medical School
10, 2009, accepted June 17, 2009.
Lance Gould on August 11, 2009

mwdapimftns1d(mLH
ri
scqatpwlppd
d
aadsdflrdho
C
SW“utiyi5dts
isporgtrea
A
Hrrprtarrpdprf
A
A
C
C
C
F
H
I
L
c
L
a
P
i
P
t
S
computed tomography
J A C C : C A R D I O V A S C U L A R I M A G I N G , V O L . 2 , N O . 8 , 2 0 0 9
A U G U S T 2 0 0 9 : 1 0 0 9 – 2 3
Gould
Coronary Stenosis or Blood Flow
1010
yocardial infarction 13 years previously, treatedith thrombolysis and PCI of the left anteriorescending coronary artery (LAD). Seven yearsfter myocardial infarction, rest-dipyridamoleositron emission tomography (PET) perfusionmaging showed a mild anterior resting defect with
ild stress-induced worsening. Left ventricularunction was normal. He gained weight, from 198o 242 lbs, did not maintain a healthy diet, and didot exercise. His lipid profile during these yearshowed total cholesterol 118 mg/dl, triglycerides42 mg/dl, low-density lipoprotein (LDL) 59 mg/l, HDL 31 mg/dl on simvastatin 5 mg, NiaspanAbbott Laboratories, Abbott Park, Illinois) 2,000g, and fenofibrate 160 mg daily. Although theDL level was optimal on drug treatment, the lowDL and unhealthy lifestyle remained uncon-
trolled risk factors for progression.Routine follow-up PET 6 years after
the first PET showed progression with arelative stress-induced defect in the mid-LAD distribution that was 0.65, or only65% of the activity in adjacent proximalareas of the heart. There was also a severestress-induced defect in the distribution ofa small ramus intermedius or 1st obtusemarginal branch. Computed tomography(CT) done for attenuation correction ofPET data showed dense coronary calcifi-cation of all coronary arteries. Absolutemaximal myocardial perfusion in the midto distal LAD distribution was markedlyreduced to 1.2 cc/min/g compared with2.5 to 3.0 cc/min/g or higher in healthyyoung volunteers. The CFR in the distalLAD distribution was reduced to 1.8compared with an average of 3.0 in the
est of the heart proximally and compared with 4.0n healthy young volunteers.
In view of past myocardial infarction and progres-ive disease, a coronary arteriogram was done showingoncentric 57% mid-LAD stenosis by automateduantitative coronary arteriographic analysis (QCA)nd FFR of 0.65 by pressure wire measurements inhe aorta and distal to the stenosis. A LAD stent waslaced in view of significant progression associatedith low CFR, low FFR, low HDL, and uncontrolled
ifestyle despite optimal drug treatment. After stentlacement, FFR improved to 0.92, indicating im-rovement but also a residual pressure gradient due toiffuse disease proximal to the stent.In precise experimental stenosis models with no
se
ein
und
ing
ry
y
ssion
iffuse disease, a 57% stenosis has little effect on CFR, 0
by K. Lancimaging.onlinejacc.orgDownloaded from
s shown below in Figure 2A (1). In this patient,bsolute perfusion in cc/min/gm showed that the 57%iameter stenosis was superimposed on moderatelyevere diffuse disease, thereby making the cumulativeiffuse and focal disease functionally severe. Relativeow reserve, or flow-derived FFR, expressed as theatio of absolute CFR of 1.8 in the distal LADistribution to average CFR of 3.0 in the rest of theeart is 0.6, comparable to the pressure-derived FFRf 0.65 at coronary arteriography.
ritical Coronary Artery Stenosis and CFR
ome of the basic concepts here were published beforeeb- and PDF-based literature and hence are not
widely in mind.” Therefore, original illustrations aresed to explain these paradoxes, abetted by the adagehat durability supports validity. The concept of “crit-cal” coronary artery stenosis was first documented 35ears ago in animal studies as 85% diameter narrow-ng, at which resting coronary flow began to fall, and0% diameter narrowing, at which CFR began toiminish, illustrated in Figure 2A (1). The experimen-al canine models used external coronary artery con-triction with no atherosclerosis or diffuse disease.
Thus, in principle, a 50% to 85% diameter narrow-ng became the anatomic criterion for classifyingeverity of stenosis and the basis for revascularizationrocedures. A single clinical end point of this thresh-ld range evolved as �70% diameter stenosis, whichemains the anatomic “gold standard” of severity anduide to procedures. Many experimental studies sincehat time have confirmed the initial observationselating stenosis dimensions of absolute arterial diam-ter, length, relative stenosis, the pressure-flow char-cteristics of coronary stenosis, and CFR (2–11).
natomy Versus Flow in Coronary Atherosclerosis
owever, human studies 25 years ago showed noelation between CFR and percent stenosis on arte-iogram (Fig. 2B) (12). Recently, this dissociation inatients between anatomic and functional severity waseconfirmed by the poor correlation among quantita-ive percent stenosis on invasive or CT coronaryrteriograms and FFR by pressure wire as a measure ofelative CFR (Fig. 3) (13). The FFR is a validated,eproducible measure of relative CFR, derived fromressure measurements in the aorta or proximal andistal to a localized coronary stenosis at maximumharmacologic arteriolar vasodilation (13–20). Likeelative CFR (10), it is expressed as a fraction of 1.0or no flow-limiting stenosis, decreasing toward 0.1 or
B B R E V I A T I O N S
N D A C R O N YM S
AD � coronary artery disea
FR � coronary flow reserve
T � computed tomography
FR � fractional flow reserve
DL � high-density lipoprot
VUS � intravascular ultraso
AD � left anterior descend
oronary artery
Cx � left circumflex corona
rtery
CI � percutaneous coronar
ntervention
ET � positron emission
omography
PECT � single-photon emi
.2 for very severe stenosis.
e Gould on August 11, 2009

fdrptCins
dcnwetiai
ET �
J A C C : C A R D I O V A S C U L A R I M A G I N G , V O L . 2 , N O . 8 , 2 0 0 9
A U G U S T 2 0 0 9 : 1 0 0 9 – 2 3
Gould
Coronary Stenosis or Blood Flow
1011
In humans, the dissociation of anatomic andunctional measures of coronary stenosis severity isue to diffuse atherosclerosis and extent of arterialemodeling. Figure 4A illustrates this simple, butrofound, concept that underlies most diagnostic,herapeutic, and interventional management ofAD. However, the broad conceptual and clinical
mplications of this fact are commonly not recog-ized in cardiovascular medicine, or at least may notubstantially influence its practice.
Figure 1. Coronary Function and Anatomic Stenosis Severity
Relative uptake PET perfusion images are scaled by the color bar frthe next highest, and color gradations from red to yellow, green, aA generic coronary map based on arteriographic-PET correlations into show arterial distributions. The arteriogram shows quantitative cDS � diameter stenosis; FFR � fractional flow reserve; LAD � left aobtuse marginal branch; OM2 � second obtuse marginal branch; P
Co
ron
ary
Flo
w R
eser
ve
% Diameter Narrowing
1974A
Resting Flow
Maximum Flow5
4
3
2
1
0
0 20 40 60 80
Figure 2. Experimental Versus Clinical Stenosis Severity
(A) Coronary flow reserve versus arteriographic percent diameter stGould et al. (1). (B) Coronary flow reserve in open-chest humans ator open circles or squares indicate different coronary arteries. Repr
artery; other abbreviations as in Figure 1.imaging.onlineDownloaded from
In Figure 4A for an otherwise normal artery,rawn to scale, an arteriographic 63% diameteronstriction mildly reduces CFR to 3.5 from theormal of 4.0 that characterizes young volunteersithout risk factors. An arteriographic 87% diam-
ter constriction in a coronary artery reduces CFRo 1.0, i.e., eliminates capacity for increasing flow,n the absence of diffuse disease (1). Now considerdifferent artery with 38% diameter diffuse narrow-
ng without arterial remodeling and no segmental
0% to 100% for maximum relative uptake (white), with red beingblue indicating progressively lower relative myocardial perfusion.r 1,000 patients is superimposed on the relative perfusion imagesary arteriographic analysis (QCA). CFR � coronary flow reserve;ior descending coronary artery; LCx � left circumflex; OM1 � 1stpositron emission tomography; RI � ramus intermedius.
9.6
8.4
7.2
6.0
4.8
3.6
2.4
1.2
0
RCA LAD
Co
ron
ary
Rea
ctiv
e H
yper
emia
Pea
k/R
esti
ng
Vel
oci
ty R
atio
Normal
1984
Coronary Disease(% Diameter Stenosis)
9.6
8.4
7.2
6.0
4.8
3.6
2.4
1.2
0
200 40 8060 100
sis in canine experimental model. Adapted, with permission, fromass surgery versus arteriographic percent diameter stenosis. Solidced, with permission, from White et al. (12). RCA � right coronary
omndove
oronnter
B
100
enobypodu
by K. Lance Gould on August 11, 2009 jacc.org

swdsdtc
AC
Afddotmt“admc
p
beFscDrbfdptmmatsca
cdaCa
epro
J A C C : C A R D I O V A S C U L A R I M A G I N G , V O L . 2 , N O . 8 , 2 0 0 9
A U G U S T 2 0 0 9 : 1 0 0 9 – 2 3
Gould
Coronary Stenosis or Blood Flow
1012
tenosis. This modest, diffuse narrowing along thehole length of the artery has a dramatic fluidynamic effect, reducing CFR to 1.4 (11). Theame diffuse narrowing plus an arteriographic 60%iameter stenosis without remodeling reduces CFRo 1.0, essentially eliminating the capacity for in-reasing flow.
natomy Versus Flow Withoronary Artery Remodeling
rterial remodeling markedly alters the anatomic-unctional measures of severity of both segmental andiffuse disease. With remodeling, despite comparableiffuse disease and arteriographic stenosis, CFR isnly mildly reduced to 3.5 in this example. For each ofhese cases, intravascular ultrasound (IVUS) wouldeasure percent stenosis of the lumen compared with
he elastic external membrane of the artery, therebyseeing” diffuse disease and more severe stenosis notpparent on the arteriogram. However, for diffuseisease with no “normal” segments, IVUS does noteasure the extent of remodeling or account for the
umulative effect of narrowing length on flow.For each of these schematic examples, Figure 4B
Diameter Stenosis by QCA, %
FF
R0.5
0.75
0.80
1.0
10 30 50 70 90
Diameter Stenosis by CCA, %
FF
R
0.5
0.75
0.80
1.0
<50% >50%
2
Figure 3. Coronary Function Versus Stenosis Anatomy
Fractional flow reserve (FFR) by pressure wire versus percent diametive coronary computed tomography (QCT) angiogram, by visually enary CT angiography (CTCA) for 50% diameter stenosis threshold. R
lots anatomic percent stenosis by arteriogram and (
by K. Lancimaging.onlinejacc.orgDownloaded from
y IVUS compared with CFR. It is a scattergram,ssentially the same as observed in patients inigure 2B, explaining why anatomic measures oftenosis, even by precise dimensions of IVUS, fail toorrelate with maximum flow or CFR in humans.epending on the extent of diffuse disease and of
emodeling, anatomic measures of stenosis severityy either arteriogram or IVUS do not indicate theunctional severity of stenosis or flow capacityespite their role in documenting regression orrogression of coronary atherosclerosis. In reality,he coronary arteries in CAD have a heterogeneousix of all the combinations illustrated in the sche-atic of Figure 4A in any single artery and/or
mong all the coronary arteries of any individual,hereby making the relation between percent steno-is by either arteriogram or IVUS and coronary flowapacity even more unpredictable than illustrated byny one of the alternative schemas in Figure 4A.
The challenge to current anatomically drivenardiology is even more profound in view of theocumented errors of visually interpreted invasiverteriograms, and inadequacy of even quantitativeT angiography to differentiate among intermedi-
te stenosis of 30% to 75% diameter stenosis
Diameter Stenosis by QCT, %
0.5
0.75
0.80
1.0
10 30 50 70 90
Diameter Stenosis by CTCA, %
0.5
0.75
0.80
1.0
<50% >50%
tenosis by quantitative coronary arteriogram (QCA), by quantita-ated coronary arteriogram (CCA), and by visually estimated coro-duced, with permission, from Meijboom et al. (13).
008
ter sstim
13,21).
e Gould on August 11, 2009

acdid3illAw
df
AA
Issln
orre
J A C C : C A R D I O V A S C U L A R I M A G I N G , V O L . 2 , N O . 8 , 2 0 0 9
A U G U S T 2 0 0 9 : 1 0 0 9 – 2 3
Gould
Coronary Stenosis or Blood Flow
1013
Although it is well established in the literaturend widely accepted intellectually, cardiologistsommonly disbelieve that their “eyeball scale” is soifferent from actual or objectively measured sever-
ty. Figure 5 shows cine views of precisely knownimensions and percent diameter stenosis of a-mm model “artery” filled with contrast mediummmersed in water with no motion. The 0.5-mmumen of the 83% stenosis is mottled due to theimited resolution of even the invasive arteriogram.
so-called 90% diameter stenosis of a 3-mm artery
Blood Flow1
2
3
4
5
6
0
0.5
1
1.5
2
2.5
3
3.5
4
4.5
0 20
1
4 4
40
Co
ron
ary
Flo
w R
eser
ve
% Diame
A
B
Figure 4. Coronary Function Versus Anatomy With Diffuse Coro
(A) Schematic illustrating limitations of anatomic measures of stenodue to diffuse disease with and without remodeling compared to cscatter plot of coronary flow reserve (CFR) versus percent diameterlow circles). The numbers beside each point of the scatter gram c
ill not have a visible lumen on cine, and fluid t
imaging.onlineDownloaded from
ynamic analysis requires over 400 mm Hg pressureor forward contrast flow to fill the artery.
natomic Stenosis May Mislead Both for andgainst Revascularization Procedures
n the absence of diffuse disease, the 63% diametertenosis in Figure 4 would have a CFR of 3.4 ashown in Figure 2A. However, visual reading wouldikely be of greater severity leading to PCI that isot necessary, given the capacity to increase flow 3
No stenosis
87% stenosis
63% stenosis
Diffuse no stenosisIVUS 38%
Diffuse + 60% ArtgmIVUS 75%
Diffuse + 62% ArtgmIVUS 75% & adaptiveremodeling
CFR = 4.0
CFR = 1.0
CFR = 3.4
CFR = 1.4
CFR = 1.0
CFR = 3.5
5 5 2
66
3
60 80 100
Stenosis
y Artery Disease and Remodeling
everity by arteriogram (Artgm) or intravascular ultrasound (IVUS)ary flow reserve. (B) For the schematic arteries illustrated in A, aosis (%DS) by arteriogram (brown diamonds) and by IVUS (yel-spond to the numbered schematic examples of A.
ter
nar
sis soronsten
imes baseline. However, moderate diffuse disease
by K. Lance Gould on August 11, 2009 jacc.org

wsttosnpti
A
Fisedtfcb(d
sthmm2ig
catcvistwdPgim
F
WpIfapeewsyd
asmtfmAsuptfs
ing” refere
J A C C : C A R D I O V A S C U L A R I M A G I N G , V O L . 2 , N O . 8 , 2 0 0 9
A U G U S T 2 0 0 9 : 1 0 0 9 – 2 3
Gould
Coronary Stenosis or Blood Flow
1014
ithout remodeling and a 60% stenosis wouldeverely reduce CFR to 1.0 and cause ischemia suchhat PCI might be indicated to improve flow up tohe limit imposed by the diffuse disease. On thether hand, severe diffuse disease might limit flowo severely that doing PCI on the stenosis wouldot improve flow. Only FFR or quantitative PETerfusion imaging can sort out the contribution ofhe localized stenosis versus the diffuse disease asllustrated in the patient examples below.
natomy Versus FFR: Clinical Outcomes
or deciding revascularization procedures, the clin-cal advantage of functional measures of stenosiseverity as opposed to anatomic measures is wellstablished. In patients with greater than 50%iameter stenosis visually on invasive coronary ar-eriogram, those randomized to FFR-guided PCIor FFR �0.8 had fewer PCI procedures and betterlinical outcomes than patients randomized to PCIased on visual judgments of arteriographic severityFig. 6A) (13,17–19). Furthermore, in many ran-
eference Standard for Visual Percent Stenosis
s of a precise stenosis phantom consisting of contras-filled chan-lastic block immersed in water without motion, as a visual “train-nce. Abbreviation as in Figure 4.
omized trials of patients with stable CAD and n
by K. Lancimaging.onlinejacc.orgDownloaded from
tenosis arteriographically suitable for revasculariza-ion, those undergoing revascularization proceduresad no benefit on mortality or coronary events overedical management, illustrated for PCI in theost recent of these trials in Figure 6B (22). At the
- to 5- year follow-up, there was also no differencen angina between the PCI and medically treatedroups.
These studies indicate that anatomic measures oforonary stenosis are suboptimal guides to the man-gement of CAD from every viewpoint—physiology,echnology, clinical management, outcomes, risks, andosts—yet remain the central guide to current cardio-ascular practice. Based on current data, FFR is thenvasive definitive physiologic gold standard for as-essing stenosis severity as the basis for revasculariza-ion procedures that reduces unnecessary procedures,ith better clinical outcomes than revascularizationecisions based on anatomic severity. QuantitativeET perfusion imaging is the noninvasive definitiveold standard for assessing physiologic stenosis sever-ty by absolute maximal myocardial perfusion in cc/
in/g and CFR.
ixed Anatomic Viewpoint?
hat explains this anatomic focus of cardiologicractice against substantial opposing scientific data?nvasive cardiologists provide a verbatim answer asollows: “Although cardiologists might believe theyre benefiting their stable patients with CAD byerforming PCI, this belief appears to be based onmotional and psychological factors rather than onvidence of clinical benefit.” “The only thing thatould really change is if there had been an imaging
tudy—and it would have changed it, not by howou responded to the catheterization, but by notoing the catheterization at all” (23).This conclusion by an invasive cardiologist frompeer-reviewed published survey on use of PCI in
table CAD may help explain why FFR is seldomeasured at coronary arteriography prior to PCI in
he U.S. despite hard data on its benefits as the basisor these procedures. The same anatomic viewpointay also help explain why, despite guidelines of themerican College of Cardiology recommending
tress testing before PCI, only 45% of patientsndergoing elective PCI for stable CAD have arior stress test, with great geographic variation inhe U.S. (24). The literature shows the followingacts: 1) systematic visual overestimation of stenosiseverity compared with objective quantitative coro-
Figure 5. R
Cine imagenels in a p
ary arteriographic analysis; 2) in the U.S., 55% of
e Gould on August 11, 2009

etCbowns
odiinvapacn
atgb
psfilmtI
mgbstiw
Ac
Acopoorasdcmfmmecc2l3i
en
J A C C : C A R D I O V A S C U L A R I M A G I N G , V O L . 2 , N O . 8 , 2 0 0 9
A U G U S T 2 0 0 9 : 1 0 0 9 – 2 3
Gould
Coronary Stenosis or Blood Flow
1015
lective PCI procedures do not have a prior stressest despite guidelines of the American College ofardiology; 3) revascularization procedures have noenefit over medical treatment for coronary eventsr mortality in randomized trials; and 4) FFR is notidely used in the U.S. as a basis for doing PCI orot despite randomized trials on its efficacy forelecting patients for PCI.
Emphasizing these facts does not imply that cardi-logists are making conscious decisions to do proce-ures that are recognized as unnecessary. Rather, the
mplication is that the procedures are done in thentuitive belief that revascularization of anatomic ste-osis generally improves coronary flow despite contra-ening data that remain inadequately explained. Thisnalytical review provides an integrated concept ex-laining these paradoxes and associated skepticismbout the “no added benefit data” that are intuitivelyontrary to the envisioned benefit of improving coro-ary flow by revascularization procedures.The oculoanatomic reflex, invasive technology,
nd contravening coronary physiology, noninvasiveechnology, and outcomes of medical treatment, allood medical science, are here to stay but needetter integration or balance.A potential solution to these conflicting view-
oints is outlined in this integrated analysis: mea-ure resting and maximal absolute myocardial per-usion in cc/min/g and CFR as the primary guide tonvasive procedures, revascularization, and for fol-owing changes in CAD using available technology,
aximal pharmacologic treatment, and lifestyle in-ervention, all of which are already proven effective.
A
Days since Randomization
Angiography-guided PCI
FFR-guided PCI
Su
rviv
al F
ree
fro
m M
ajo
r A
dve
rse
Car
dia
c E
ven
ts (
%)
700
75
80
85
90
95
100
0 60 120 180 240 300 3
2009
Figure 6. Coronary Function Versus Stenosis and Clinical Outco
(A) Randomized trial of fractional flow reserve (FFR)-guided percutaguided PCI in 1,008 patients. Reproduced, with permission, from Toand a significantly lower composite end point of death, nonfatal m(B) Randomized trial of PCI compared with medical treatment in 2,2riogram, showing no mortality advantage of PCI over medical treatm
f a stenosis does not markedly limit regional C
imaging.onlineDownloaded from
yocardial perfusion or CFR, an invasive arterio-ram and revascularization procedure will not likelye beneficial. For residual uncertainty about steno-is severity, FFR measured by pressure wire at theime of the coronary arteriogram provides reliablenvasive confirmation for proceeding or pulling outithout PCI.
bsolute Myocardial Perfusion inc/min/g and CFR by PET
lthough coronary flow is a major focus of theardiology profession that justifies procedures basedn improving it, few cardiologists quantify myocardialerfusion or measure CFR or have ever measured it,r even understand how to use the information ifbtained, here addressed. For several years, this lab hasoutinely quantified myocardial perfusion in cc/min/gnd CFR in all patients undergoing diagnostic cardiactress perfusion PET using rubidium-82. For thisiscussion, CFR is used interchangeably with myo-ardial perfusion reserve. Absolute perfusion is deter-ined using our “simple” method particularly suitable
or rubidium-82, validated experimentally with mini-al methodologic variability (25,26), and semiauto-ated for routine clinical application. Attenuation-
mission misregistration is routinely checked andorrected for every patient using cine CT attenuationorrection that accounts for breathing motion (27–9). Our PET perfusion images are displayed as ifooking at 90° quadrants of the heart rotating through60°, with a superimposed generalized arterial map asn the illustrations below for the various categories of
B 2007
YearsNo. at RiskMedical Therapy 1138 1017 959 834 638 408 192 30
PCI 1149 1013 952 833 637 417 200 35
PCIMedical Therapy
Hazard Ratio, 1.05; 95% CI (0.87-1.27);P=0.62
Su
rviv
al F
ree
of
Dea
th f
rom
An
yC
ause
an
d M
yoca
rdia
l In
farc
tio
n
0.5
0
0.6
0.7
0.8
1.0
0.9
0 1 2 3 4 765
us coronary intervention (PCI) compared to arteriographicallyet al. (18). The FFR-guided group had fewer invasive proceduresrdial infarction, and repeat revascularization at 1 year (p � 0.02).patients with coronary stenosis that was suitable for PCI by arte-t. Reproduced, with permission, from Boden et al. (22).
60
mes
neoninoyoca87
AD.
by K. Lance Gould on August 11, 2009 jacc.org

a7tccpL8aloasdsr(tst
cwttdi
ch3ctrptqiTiw
pgsatcqigcnot
ral;
J A C C : C A R D I O V A S C U L A R I M A G I N G , V O L . 2 , N O . 8 , 2 0 0 9
A U G U S T 2 0 0 9 : 1 0 0 9 – 2 3
Gould
Coronary Stenosis or Blood Flow
1016
Figure 7 illustrates a common clinical problem ofssessing coronary calcification. The patient is a5-year-old man with hypertension, hypercholes-erolemia, atypical chest pain, dense coronary cal-ification with a calcium score �4,000, and aoronary CT angiogram reported as the followingercent diameter stenosis of the left main 50%,AD 75% to 80%, left circumflex (LCx) 70% to0%, and right coronary artery 50%. A coronaryrteriogram and bypass surgery were recommended,eading him to request a PET scan and secondpinion. His rest-dipyridamole PET perfusion im-ges, Figure 7A, show resting heterogeneity andmall, mild-to-moderate, stress-induced perfusionefects in the basal left lateral distribution of aecond obtuse marginal (OM2) branch (white ar-ow) and in the distal inferoapical distributionwhite arrow) typical of a LAD wrapping aroundhe apex. Although there are no large severe perfu-ion defects, “balanced” coronary disease might failo reveal severe, localized, relative perfusion defects.
However, Figure 7B shows good absolute myo-ardial perfusion and CFR. The maximal perfusionith dipyridamole stress averaged 2.9 cc/min/g for
he whole heart, and CFR averaged 3.7, comparableo 4.0 for young healthy volunteers. The septalistribution has a CFR of 4.1, indicating no signif-
Figure 7. Quantitative PET for Stenosis Severity and Determinin
(A) Topographic 3-D displays of PET relative perfusion in 90° quadrscaled as for Figure 1. (B) Absolute myocardial perfusion in cc/min/for 4 � 4 pixel sample volumes throughout the left ventricle. The qlarge square grid lines for semiautomated processing into cc/min/gues, the apical region and the region of the membranous septum aaverage quadrant values. ANT � anterior; INF � inferior; LAT � late
cant left main stenosis since myocardial perfusion n
by K. Lancimaging.onlinejacc.orgDownloaded from
an increase 4 times baseline, comparable to youngealthy volunteers. In the LCx distribution, CFR is.7, and in the LAD distribution, CFR is 3.4,onsistent with mild narrowing. In the small, mild-o-moderate, basal-lateral, and distal inferoapicalelative stress-induced defects, maximum absoluteerfusion is 1.8 cc/min/g and CFR is 2.7. Even inhese small “worst” regions, maximum perfusion isuite good, far above ischemic levels, with flowncreasing during stress to 270% of baseline flows.he regions of resting flow heterogeneity that
mprove with dipyridamole stress are associatedith coronary atherosclerosis (30).The quantitative PET findings explain why this
atient can do hard physical exertion without an-ina, including heavy weight lifting that causedome nonexertional musculoskeletal pain, but notngina. He has diffuse, severe, calcific, nonobstruc-ive coronary atherosclerosis, but does not havelinically significant flow-limiting stenosis that re-uires invasive coronary arteriogram or revascular-zation. The reported stenosis severity on CT an-iogram is not accurate and fails to indicateoronary flow capacity. The CT spatial resolution isot adequate for determining severity (21) that wasverestimated, as also documented for invasive ar-eriograms. Even with precise high-resolution ste-
rocedures
from left lateral, to inferior, septal (right), and anterior views,rest, with dipyridamole stress and CFR as scaled by the color bartitative image is displayed in square quadrants delineated by theFR. To avoid partial volume errors biasing average quadrant val-e the upper and lower horizontal grid lines are excluded fromSEP � septal; other abbreviations as in Figure 1.
g P
antsg atuanor Cbov
osis measurements, anatomic severity is not reli-
e Gould on August 11, 2009

adm
pwbqiaawiosaoi
iFCfmccioar0do
ria
ptdensCiarcacid#ebbfwPs
pwmw
bbre
J A C C : C A R D I O V A S C U L A R I M A G I N G , V O L . 2 , N O . 8 , 2 0 0 9
A U G U S T 2 0 0 9 : 1 0 0 9 – 2 3
Gould
Coronary Stenosis or Blood Flow
1017
bly related to maximal perfusion or CFR due toiffuse disease and varying degrees of arterial re-odeling, as shown in Figure 4A.Figure 8 illustrates what absolute myocardial
erfusion and CFR “tell” us in 3 different patientsith severe CAD. Except for the single restingaseline inferior views shown in Figure 8A, all otheruadrant views of the resting relative perfusionmages were normal for all 3 patients and not showns redundant. Patient #1 with hyperlipidemia hadn inferior myocardial infarction at age 29 yearsith a residual inferior scar (blue) on the resting
mage. Patients #2 and #3 had no myocardial scarn the resting standard relative uptake images. Thetandard relative stress uptake images in Figure 8Are all similar, with a severe inferior perfusion defectn stress images and mild-to-moderate stress-nduced perfusion defects elsewhere.
However, myocardial perfusion in cc/min/g dur-ng dipyridamole stress for each of these patients inigure 8B reveals dramatically diverse extent ofAD. For Patient #1, CFR in noninfarct regions is
airly good, ranging from 2.9 to 3.2, indicating onlyild flow-limiting narrowing other than the oc-
luded posterior descending coronary artery (PDA)ausing the inferior scar. The CFR in the scar is 1.0,ndicating no change in perfusion with dipyridam-le stress other than modest, small border zonereas. For Patient #2, CFR is severely, diffuselyeduced with severe inferior myocardial steal (CFR.4), indicating collaterals to viable inferior myocar-ium (no resting defect) in the distribution of an
Figure 8. Quantitative PET for Assessing Severe Stenosis
(A) PET relative perfusion images in 3 different patients with severeviews shown for each patient, all other quadrant views of resting renormal for all 3 patients. (B) For each of the same 3 patients, CFR theart and average quadrant values are shown for each quadrant. A
ccluded PDA. The severity of 3-vessel disease f
imaging.onlineDownloaded from
educing CFR throughout and the myocardial stealndicate that the arteries supplying the collateralsre all severely diseased.
For Patient #3, CFR ranges from 2.5 to 4.4 inroximal LCx and proximal LAD distributions,apering to 1.5 to 2.0 in mid to distal arterialistributions. This longitudinal base-to-apex gradi-nt or tapering of CFR is characteristic of diffusearrowing (31,32). An obtuse marginal branchupplies part of the mid inferolateral region with aFR of 3.0. The CFR of 0.9 in basal inferior and
nferolateral distributions indicates myocardial stealssociated with collaterals to viable myocardium (noesting scar) beyond an occluded PDA and oc-luded distal LCx. As part of our clinical studies ofbsolute myocardial perfusion, all 3 patients hadoronary arteriograms that confirmed these find-ngs. Patient #1 needed no revascularization proce-ure as indicated by quantitative PET. For Patient2, arteriogram showed diffuse and segmental dis-ase for which he refused bypass surgery for 2 years,ut with progressive angina, then had successfulypass. Patient #3 did not show anatomy suitableor revascularization due to severe diffuse disease,ith collateralized occluded arteries as predicted byET, but became asymptomatic on vigorous life-tyle and medical treatment.
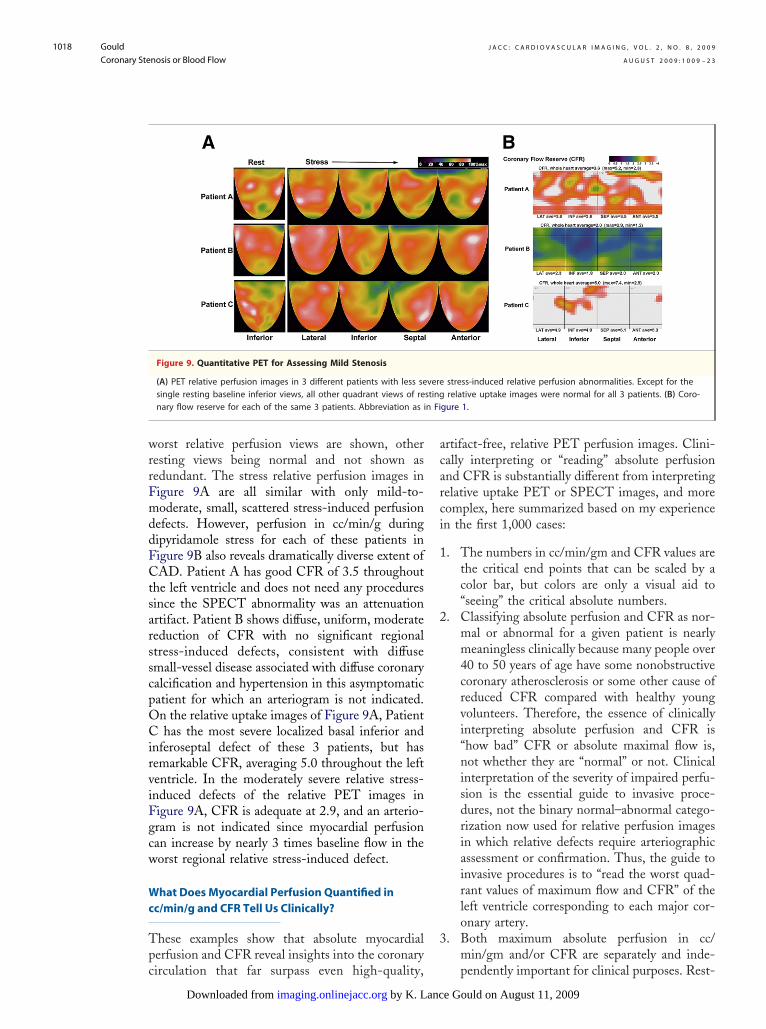
Figure 9 illustrates what absolute myocardialerfusion and CFR tell us for 3 different patientsith positive single-photon emission computed to-ography (SPECT) stress tests and/or chest painho sought a second opinion after recommendation
onary artery disease. Except for the single resting baseline inferiore uptake images (lateral, anterior, and septal quadrants) wereghout the left ventricle is shown. Average CFR for the wholeviations as in Figure 1.
corlativhrou
or an invasive procedure. Again, only the resting
by K. Lance Gould on August 11, 2009 jacc.org
wrrFmddFCtsarsscpOCirviFgcw
Wc
Tpc
acarci
1
2
3
n Fi
J A C C : C A R D I O V A S C U L A R I M A G I N G , V O L . 2 , N O . 8 , 2 0 0 9
A U G U S T 2 0 0 9 : 1 0 0 9 – 2 3
Gould
Coronary Stenosis or Blood Flow
1018
orst relative perfusion views are shown, otheresting views being normal and not shown asedundant. The stress relative perfusion images inigure 9A are all similar with only mild-to-oderate, small, scattered stress-induced perfusion
efects. However, perfusion in cc/min/g duringipyridamole stress for each of these patients inigure 9B also reveals dramatically diverse extent ofAD. Patient A has good CFR of 3.5 throughout
he left ventricle and does not need any proceduresince the SPECT abnormality was an attenuationrtifact. Patient B shows diffuse, uniform, moderateeduction of CFR with no significant regionaltress-induced defects, consistent with diffusemall-vessel disease associated with diffuse coronaryalcification and hypertension in this asymptomaticatient for which an arteriogram is not indicated.n the relative uptake images of Figure 9A, Patienthas the most severe localized basal inferior and
nferoseptal defect of these 3 patients, but hasemarkable CFR, averaging 5.0 throughout the leftentricle. In the moderately severe relative stress-nduced defects of the relative PET images inigure 9A, CFR is adequate at 2.9, and an arterio-ram is not indicated since myocardial perfusionan increase by nearly 3 times baseline flow in theorst regional relative stress-induced defect.
hat Does Myocardial Perfusion Quantified inc/min/g and CFR Tell Us Clinically?
hese examples show that absolute myocardialerfusion and CFR reveal insights into the coronary
Figure 9. Quantitative PET for Assessing Mild Stenosis
(A) PET relative perfusion images in 3 different patients with less sesingle resting baseline inferior views, all other quadrant views of renary flow reserve for each of the same 3 patients. Abbreviation as i
irculation that far surpass even high-quality,
by K. Lancimaging.onlinejacc.orgDownloaded from
rtifact-free, relative PET perfusion images. Clini-ally interpreting or “reading” absolute perfusionnd CFR is substantially different from interpretingelative uptake PET or SPECT images, and moreomplex, here summarized based on my experiencen the first 1,000 cases:
. The numbers in cc/min/gm and CFR values arethe critical end points that can be scaled by acolor bar, but colors are only a visual aid to“seeing” the critical absolute numbers.
. Classifying absolute perfusion and CFR as nor-mal or abnormal for a given patient is nearlymeaningless clinically because many people over40 to 50 years of age have some nonobstructivecoronary atherosclerosis or some other cause ofreduced CFR compared with healthy youngvolunteers. Therefore, the essence of clinicallyinterpreting absolute perfusion and CFR is“how bad” CFR or absolute maximal flow is,not whether they are “normal” or not. Clinicalinterpretation of the severity of impaired perfu-sion is the essential guide to invasive proce-dures, not the binary normal–abnormal catego-rization now used for relative perfusion imagesin which relative defects require arteriographicassessment or confirmation. Thus, the guide toinvasive procedures is to “read the worst quad-rant values of maximum flow and CFR” of theleft ventricle corresponding to each major cor-onary artery.
. Both maximum absolute perfusion in cc/min/gm and/or CFR are separately and inde-
stress-induced relative perfusion abnormalities. Except for therelative uptake images were normal for all 3 patients. (B) Coro-
gure 1.
veresting
pendently important for clinical purposes. Rest-
e Gould on August 11, 2009

4
5
6
7
Wi
Imrfsr0emsitHctni
mmtcipflhesafdmwfml
J A C C : C A R D I O V A S C U L A R I M A G I N G , V O L . 2 , N O . 8 , 2 0 0 9
A U G U S T 2 0 0 9 : 1 0 0 9 – 2 3
Gould
Coronary Stenosis or Blood Flow
1019
ing perfusion may be increased at higher heartrates or blood pressure, thereby reducing CFRdespite high maximum perfusion values. Theargument of CFR or maximum absolute perfu-sion as “better” than the other fails to recognizethe complexity of coronary physiology in whicheither may be important depending on restingperfusion and diffuse disease as addressed in thenext section.
. Regional maximal stress-induced perfusion incc/min/g, coronary flow reserve, and relativeperfusion images are all necessary for completeunderstanding of segmental and diffuse CAD asthe basis for invasive procedures. Diffusely re-duced maximum perfusion or CFR with nofocal worse stress-induced defect indicates dif-fuse disease without sufficient additional local-ized stenosis that revascularization would ben-efit. With both diffusely reduced absolutemaximum perfusion or CFR and regional worsedefects, the relative importance and potentialvalue of revascularization is judged from theregional absolute maximal cc/min/gm and ofthe regional values versus other areas.
. In our experience, the threshold for clinicallysignificant flow-limiting stenosis that mightjustify an invasive procedure requires an abso-lute maximum perfusion below 1.0 to 1.2 cc/min/g after dipyridamole stress and/or CFR of1.5 to 1.7 or lower and a corresponding regionalstress-induced abnormality on relative perfusionimages, or other regions with substantially bet-ter absolute perfusion/CFR, indicating severesegmental disease in addition to whatever dif-fuse narrowing is present. These limits aresubject to modification with more data andexperience, probably toward lower flows as thethreshold for intervention. Of course, all quan-tification needs to be viewed from a clinicalperspective, including symptoms, response tomedical treatment, comorbidities, physiologic–clinical judgment, and ongoing evolving data onmanagement of CAD.
. Myocardial steal associated with collateralizationbeyond an occluded coronary artery is valuableclinical information that can be assessed only bymeasuring absolute perfusion and CFR. A CFRof �1.0 indicates a fall in perfusion during stressto below resting levels, or myocardial steal. Al-though the term steal is widely used, it is amisnomer in a sense because blood is not pulledfrom one myocardial region into another region.
Rather, during dipyridamole-induced high flow, vimaging.onlineDownloaded from
the pressure drop along a diseased artery supplyingthe collaterals decreases the perfusion pressure atthe collateral source, thereby decreasing collateralflow (11).
. Absolute perfusion and CFR provide essentialphysiologic information about isolated stenosisseverity, multiple stenosis, diffuse CAD, or com-bined multiple stenosis and diffuse disease thatcharacterizes most CAD. If the coronary arterio-gram is truly normal without stenosis and withoutdiffusely small arteries, then absolute perfusionand CFR may also quantify small-vessel disease.
hich Is Best: Maximum Myocardial Perfusionn cc/min/g or CFR?
n many patients, maximum myocardial perfusionay be severely reduced to the 1.0 to 1.2 cc/min/gm
ange. However, with beta-blockade and good riskactor control, heart rate of 45 to 50 beats/min, andystolic blood pressure of 100 to 110 mm Hg, theesting myocardial perfusion is commonly as low as.4 cc/min/g with CFR of 2.5 to 3.0 and noxertional angina. Therefore, continued medicalanagement is a valid option to revascularization
ince the coronary arteries retain the capacity forncreasing flow to meet increased demand withinhis overall lower reset demand–supply balance.
owever, if the resting perfusion were 0.8 to 0.9c/min/g with the same maximum perfusion of 1.0o 1.2 cc/min/g, as in a diabetic patient who doesot feel cardiac pain, then CFR is profoundly
mpaired and revascularization is indicated.Another reason for considering CFR as well asaximum perfusion alone is technical, related to theethodology of determining absolute perfusion. De-
ermining the arterial input function of the radionu-lide may be somewhat difficult. If the imaged arterialnput were lower than the real value, the absoluteerfusion would be too high and would underestimateow restriction both regionally and throughout theeart at rest and stress, thereby underestimating dis-ase severity. However, to some extent, partially, thetress–rest ratio or CFR would be somewhat lessffected by a systematic error in arterial input. There-ore, a low regional CFR with a big severe relativeefect, with ECG changes or exertional angina, butaximum absolute perfusion of 2.5 to 3.0 cc/min/g,ould make one suspect an error in the arterial input
unction. Hence, CFR may provide confirming infor-ation important for major decisions about people’s
ives. Finally, CFR based on absolute perfusion pro-
ides some comparison to other measures of severityby K. Lance Gould on August 11, 2009 jacc.org

sdi
F
P
Pit(fsdsra
ahh0itflepTiadtpht202i
uirpasspana
TP
Sactcobemir
qrwkirnAfl(atnsshc
CP
Tsoefprvwpirfd4cq
J A C C : C A R D I O V A S C U L A R I M A G I N G , V O L . 2 , N O . 8 , 2 0 0 9
A U G U S T 2 0 0 9 : 1 0 0 9 – 2 3
Gould
Coronary Stenosis or Blood Flow
1020
uch as the relative uptake images and invasive FFRetermined from pressure measurements as confirm-
ng data.
FR, Relative CFR, Absolute CFR, and
erfusion Images
ressure-derived FFR is equivalent to relative CFR,.e., the ratio of maximum flow in the stenotic arteryo maximum flow of the same nonstenotic artery13–20) expressed as a fraction of 1. FFR derivedrom pressures just proximal and distal to a specifictenosis does not account for and is not affected byiffuse disease. However, FFR derived from pres-ures in the aorta and just distal to the stenosiseflects the combined effects of both the stenosisnd diffuse disease proximal to the stenosis.
Rephrasing the same paradox above gives andditional insight into the diffuse disease issue. Inealthy young volunteers, CFR is typically 4.0 origher by quantitative PET in our lab. An FFR of.75 or lower has been associated with clinicalschemia and indication for PCI. However, 0.75imes a normal CFR of 4.0 indicates a remainingow reserve of 3.0 that never causes ischemia in ourxperience and is higher than many asymptomaticeople over 40 years of age without known CAD.herefore, why does an FFR threshold of 0.75
ndicate ischemia in clinical trials of its use? Thenswer to this version of the paradox is the same:iffuse disease in addition to whatever stenosis is onhe arteriogram. The FFR studies were done onopulations at risk for CAD due to risk factors andigh prevalence of diffuse disease. Consequently,heir absolute CFR is not 4.0, but averages 2.0 to.5 in our experience, so that the FFR threshold of.75 corresponds to an absolute CFR of 0.75 times.2, or 1.7, which is approximately what we observen untreated patients with mild exertional angina.
Relative perfusion images (standard radionuclideptake images) also show relative perfusion defectsn the stenotic region compared with an adjacentegion expressed as a ratio or fraction of 1, similar toressure FFR and relative CFR determined frombsolute perfusion. However, if the adjacent arteryupplying the adjacent myocardial region is alsotenotic, the relative defect severity on relativeerfusion images is reduced, whereas pressure FFRnd relative CFR by absolute perfusion in 1 coro-ary artery do not depend on the status of the
djacent coronary artery. vby K. Lancimaging.onlinejacc.orgDownloaded from
echnical Issues in Quantitative CardiacET Perfusion Imaging
tandard cardiac PET-CT protocols and software aressociated with misregistration errors causing signifi-ant artifactual abnormalities in 20% to 40% of pa-ients (27–29). Therefore, we developed software forine CT attenuation correction by acquiring continu-us low-dose CT scans during 2 breathing cycles thatetter matches emission data without added radiationxposure (28,29). In principle, a 3-rod rotating trans-ission system for attenuation correction would min-
mize misregistration problems of PET-CT, reduceadiation dose, cost less, and be comparably fast.
For radionuclides with complex kinetics, ade-uate curve fitting of mathematical low modelsequires frequent brief images that are count poorith high noise and limited clinical value. Theinetic model for rubidium-82, a potassium analog,s “simple” since cellular trapping of potassium andubidium is nonlinearly proportional to flow witho exiting from the myocardial cell during imaging.s validated in Figure 10, the “simple” rubidiumow model accounts for flow-dependent extraction25,26,33) with a single 2-min arterial input imagend a single 5-min myocardial uptake image,hereby providing high-quality, high-count, low-oise images from which absolute perfusion isimply and reproducibly determined for routineemiautomated clinical imaging. N-13 ammoniaas also proven to be an excellent quantitativelinical radionuclide.
linical Impact of Quantitative MyocardialET Perfusion Imaging
he PET-guided management of coronary athero-clerosis integrated with intense lifestyle and vigor-us pharmacologic treatment reduce coronaryvents and invasive procedures by 80% over 5-yearollow-up (Fig. 11) (34). Serial changes in PETerfusion images, illustrated in Figure 12A, showesponse to treatment, predict outcomes, and pro-ide insights into progression/regression of theorst baseline stenosis as well as new lesions, orrevention of new lesions, at follow-up (34,35),llustrated in Figure 12B. The left ventricular quad-ant with the maximal change from baseline toollow-up PET, for either better or worse, wasifferent from the baseline worst quadrant in 77% of09 patients in this 5-year study; the maximumhange quadrant coincided with the worst baselineuadrant in only 23% of patients (35). This obser-
ation indicates that for most patients, the greateste Gould on August 11, 2009

pica
mwcdAqqtoicbgi
C
BarflPdaaputs
mpcfiiGv
n, fr
J A C C : C A R D I O V A S C U L A R I M A G I N G , V O L . 2 , N O . 8 , 2 0 0 9
A U G U S T 2 0 0 9 : 1 0 0 9 – 2 3
Gould
Coronary Stenosis or Blood Flow
1021
erfusion changes over 5-year follow-up were seenn regions other than the baseline worst quadrantorresponding to the most severe stenosis, again annatomic–functional dichotomy.
The economic impact of PET-guided manage-ent in clinical practice has also been demonstratedith reduced invasive procedures, lowered overall
osts, and good outcomes compared with the stan-ard anatomic diagnostic treatment paradigm (36).lthough providing powerful clinical insights,uantitative cardiac PET perfusion imaging re-uires substantial care, commitment, specific PETraining, knowledge of the technology and of cor-nary physiology, and physiologically oriented clin-cal judgment. The physiologic data are sufficientlyomplex to need integration into clinical decisionsy a thought process beyond binary anatomic cate-orization of “critical” coronary artery stenosis driv-ng current cardiovascular practice.
onclusions
ased on an extensive literature, the concept ofnatomically “critical” coronary stenosis should beeplaced by the concept of “critical” reduction ofow capacity initially by noninvasive quantitativeET perfusion imaging as the optimal guide forecisions on invasive procedures, for medical man-gement, and for following changes in coronarytherosclerosis before clinical events, with invasiveressure-derived FFR as needed for any remainingncertainty about stenosis severity. Randomizedrials of revascularization procedures in patients
Microsphere Flow (ml/min/g)
AFRb = 0.16(± 0.06) + 0.91(± 0.02)Fµn = 106r = 0.97p < 0.001
Ru
bid
ium
Flo
w (
ml/m
in/g
)
0
1
2
3
4
7
8
9
5
6
0 1 2 3 4 5 6 7 8
Figure 10. Experimental Verification of Rubidium-82 for Measur
(A) Initial validation of absolute myocardial perfusion using rubidiummicrospheres. Reproduced, with permission, from Goldstein et al. (3using the “simple flow model” compared with the more complex cotion with CFR measured by flow meter. Reproduced, with permissio
elected for severe reduction in maximum absolute
imaging.onlineDownloaded from
yocardial perfusion and CFR as compared withatients selected for revascularization based on per-ent stenosis, which is poorly related to CFR, mightnally fulfill the intuitive expectation that improv-
ng coronary blood flow benefits clinical outcomes.iven the prevalent overestimation of stenosis se-
erity on arteriogram, the anatomic severity neces-
0
5
10
15
20
25 24%
31%
8%
P=0.001
30
35
% o
f P
atie
nts
Any Event*
Max: TC=140; TG=87; LDL=74; HDL=
Moderate: TC=184; TG=158; LDL=111;
Poor: TC=226; TG=169; LDL=143; HDL
19%
23%
5%
P=0.007
CABG/PTCA
15%1
3%
P=0.0
Death aNonfata
Figure 11. 5-Year Survival for PET-Guided Maximal MedicalManagement
Cumulative events over 5-year follow-up after PET-guided managemmaximal intense combined lifestyle–pharmacologic treatment compwith moderate standard lipid drug treatment and casual (poor) compractice as a nonrandomized pilot trial in 409 patients with coronarsclerosis. Any event includes death, nonfatal myocardial infarction,bypass surgery, PCI, or stroke. Adapted, with permission, from Sdrinal. (34). CABG � coronary artery bypass graft; HDL � high-density ltein; LDL � low-density lipoprotein; MI � myocardial infarction; PTCpercutaneous transluminal coronary angioplasty; TC � total cholest
Compartmental Model R (ml/min/g)
Rubidium- 82
B
y = 0.33 + 1.06xr = 0.98
Sim
ple
Mo
del
(m
l/min
/g)
On
e M
inu
te Im
age
0
1
2
3
4
5
6
0 1 2 3 4 5 6
Myocardial Perfusion
measured by epicardial radiation detectors compared withB) Validation of CFR measured by PET imaging of rubidium-82lete compartmental modeling, both having comparable correla-om Yoshida et al. (25). Abbreviations as in Figure 1.
49
HDL=45
=51
3%
2
ndl MI
ent witharedmunityy athero-coronarygola etipopro-A �
erol;
9
ing
-823). (mp
TG � triglyceride; other abbreviations as in Figures 1 and 6.
by K. Lance Gould on August 11, 2009 jacc.org

spps
RGT4
R
J A C C : C A R D I O V A S C U L A R I M A G I N G , V O L . 2 , N O . 8 , 2 0 0 9
A U G U S T 2 0 0 9 : 1 0 0 9 – 2 3
Gould
Coronary Stenosis or Blood Flow
1022
ary to reduce substantially maximal myocardialerfusion or CFR, and extent of diffuse disease,atient selection based on quantitative PET perfu-ion imaging would also likely reduce the numbers
Figure 12. PET for Following Changes in CAD
(A) Single views of stress PET relative perfusion images at baselineregression of coronary artery stenosis in the single view with a perfSchematic of stress PET images at baseline compared with follow-ufrom Sdringola et al. (35). Abbreviations as in Figures 1 and 3.
basis and experimental validation.Am J Cardiol 1978;41:267–78. Coll Cardiol 1990;
by K. Lancimaging.onlinejacc.orgDownloaded from
eprint requests and correspondence: Dr. K. Lanceould, The Weatherhead P.E.T. Center, University ofexas Medical School, 6431 Fannin Street, Room.256MSB, Houston, Texas 77030. E-mail: k.lance.
follow-up of 2 different patients, illustrating progression andn abnormality, other normal views not shown as redundant. (B)T in various quadrant pairings. Reproduced, with permission,
of procedures by optimal patient selection. [email protected].
1
1
1
1
1
E F E R E N C E S
1. Gould KL, Lipscomb K, HamiltonGW. Physiologic basis for assessingcritical coronary stenosis. Instanta-neous flow response and regional dis-tribution during coronary hyperemiaas measures of coronary flow reserve.Am J Cardiol 1974;33:87–94.
2. Gould KL, Lipscomb K. Effects ofcoronary stenoses on coronary flowreserve and resistance. Am J Cardiol1974;34:48–55.
3. Gould KL. Pressure-flow characteris-tics of coronary stenoses in unsedateddogs at rest and during coronary vaso-dilation. Circ Res 1978;43:242–53.
4. Feldman RL, Nichols WW, PepineCJ, Conti CR. Hemodynamic effectsof long and multiple coronary arterialnarrowings. Chest 1978;74:280–5.
5. Gould KL, Kelley KO, Bolson EL.Experimental validation of quantita-tive coronary arteriography for deter-mining pressure-flow characteristicsof coronary stenosis. Circulation 1982;66:930–7.
6. Gould KL. Noninvasive assessment ofcoronary stenoses by myocardial per-fusion imaging during pharmacologiccoronary vasodilatation. I. Physiologic
7. Gould KL, Schelbert HR, Phelps ME,Hoffman EJ. Noninvasive assessment ofcoronary stenoses with myocardial per-fusion imaging during pharmacologiccoronary vasodilatation. V. Detection of47 percent diameter coronary stenosiswith intravenous nitrogen-13 ammoniaand emission-computed tomography inintact dogs. Am J Cardiol 1979;43:200–8.
8. Kirkeeide RL, Gould KL, Parsel L.Assessment of coronary stenoses bymyocardial perfusion imaging duringpharmacologic coronary vasodilation.VII. Validation of coronary flow re-serve as a single integrated functionalmeasure of stenosis severity reflectingall its geometric dimensions. J AmColl Cardiol 1986;7:103–13.
9. Gould KL, Goldstein RA, MullaniNA, et al. Noninvasive assessment ofcoronary stenoses by myocardial per-fusion imaging during pharmacologiccoronary vasodilation. VIII. Clinicalfeasibility of positron cardiac imagingwithout a cyclotron using generator-produced rubidium-82. J Am CollCardiol 1986;7:775–89.
10. Gould KL, Kirkeeide RL, Buchi M.Coronary flow reserve as a physiologicmeasure of stenosis severity. J Am
15:459–74.
e Gould on August
1. Gould KL. Coronary Artery Stenosisand Reversing Atherosclerosis. 2nd edi-tion. London: Arnold Publishers, 1999.
2. White CW, Wright CB, Doty DB, etal. Does visual interpretation of thecoronary arteriogram predict the physi-ologic importance of a coronary steno-sis? N Engl J Med 1984;310:819–24.
3. Meijboom WB, Van Mieghem CA,van Pelt N, et al. Comprehensive as-sessment of coronary artery stenoses:computed tomography coronary an-giography versus conventional coro-nary angiography and correlation withfractional flow reserve in patients withstable angina. J Am Coll Cardiol2008;52:636–43.
4. Pijls NH, van Son JA, Kirkeeide RL,De Bruyne B, Gould KL. Experimen-tal basis of determining maximumcoronary, myocardial, and collateralblood flow by pressure measurementsfor assessing functional stenosis sever-ity before and after percutaneoustransluminal coronary angioplasty.Circulation 1993;87:1354–67.
5. De Bruyne B, Baudhuin T, Melin JA,et al. Coronary flow reserve calculatedfrom pressure measurements in hu-mans. Validation with positron emis-sion tomography. Circulation 1994;
andusiop PE
89:1013–22.
11, 2009

1
1
1
1
2
2
2
2
2
3
3
3
3
3
Kmqc
J A C C : C A R D I O V A S C U L A R I M A G I N G , V O L . 2 , N O . 8 , 2 0 0 9
A U G U S T 2 0 0 9 : 1 0 0 9 – 2 3
Gould
Coronary Stenosis or Blood Flow
1023
6. De Bruyne B, Pijls NH, HeyndrickxGR, Hodeige D, Kirkeeide R, GouldKL. Pressure-derived fractional flowreserve to assess serial epicardial ste-noses: theoretical basis and animalvalidation. Circulation 2000;101:1840–7.
7. Pijls NH, van Schaardenburgh P, Ma-noharan G, et al. Percutaneous coro-nary intervention of functionally non-significant stenosis: 5-year follow-upof the DEFER study. J Am CollCardiol 2007;49:2105–11.
8. Tonino PA, De Bruyne B, Pijls NH,et al. Fractional flow reserve versusangiography for guiding percutaneouscoronary intervention. N Engl J Med2009;360:213–24.
9. Koolen JJ, Pijls NH. Coronary pres-sure never lies. Catheter CardiovascInterv 2008;72:248–56.
0. Kern MJ, Lerman A, Bech JW, et al.Physiological assessment of coronaryartery disease in the cardiac catheter-ization laboratory: a scientific state-ment from the American Heart Asso-ciation Committee on Diagnostic andInterventional Cardiac Catheteriza-tion, Council on Clinical Cardiology.Circulation 2006;114:1321–41.
1. Nissen SE. Limitations of computedtomography coronary angiography.J Am Coll Cardiol 2008;52:2145–7.
2. Boden WE, O’Rourke RA, Teo KK, etal. Optimal medical therapy with orwithout PCI for stable coronary disease.N Engl J Med 2007;356:1503–16.
3. Lin GA, Dudley RA, Redberg RF.Cardiologists’ use of percutaneouscoronary interventions for stable cor-onary artery disease. Arch Intern Med2007;167:1604–9.
4. Lin GA, Dudley RA, Lucas FL,Malenka DJ, Vittinghoff E, RedbergRF. Frequency of stress testing to
document ischemia prior to electiveDownloaded
percutaneous coronary intervention.JAMA 2008;300:1765–73.
25. Yoshida K, Mullani N, Gould KL.Coronary flow and flow reserve by PETsimplified for clinical applications usingrubidium-82 or nitrogen-13-ammonia.J Nucl Med 1996;37:1701–12.
26. Coxson PG, Huesman RH, BorlandL. Consequences of using a simplifiedkinetic model for dynamic PET data.J Nucl Med 1997;38:660–7.
27. Loghin C, Sdringola S, Gould KL.Common artifacts in PET myocardialperfusion images due to attenuation-emission misregistration: clinical sig-nificance, causes, and solutions. J NuclMed 2004;45:1029–39.
28. Gould KL, Pan T, Loghin C, JohnsonNP, Guha A, Sdringola S. Frequentdiagnostic errors in cardiac PET/CTdue to misregistration of CT attenua-tion and emission PET images: a de-finitive analysis of causes, conse-quences, and corrections. J Nucl Med2007;48:1112–21.
29. Gould KL, Pan T, Loghin C, JohnsonNP, Sdringola S. Reducing radiationdose in rest-stress cardiac PET/CT bysingle poststress cine CT for attenua-tion correction: quantitative valida-tion. J Nucl Med 2008;49:738–45.
30. Johnson NP, Gould KL. Clinicalevaluation of a new concept: restingmyocardial perfusion heterogeneityquantified by Markovian analysis ofPET identifies coronary microvasculardysfunction and early atherosclerosisin 1,034 subjects. J Nucl Med 2005;46:1427–37.
31. Gould KL, Nakagawa Y, NakagawaK, et al. Frequency and clinical impli-cations of fluid dynamically significantdiffuse coronary artery disease mani-fest as graded, longitudinal, base-to-apex myocardial perfusion abnormali-
ties by noninvasive positron emission sby K. Lancimaging.onlinejacc.org from
tomography. Circulation 2000;101:1931–9.
2. De Bruyne B, Hersbach F, Pijls NH,et al. Abnormal epicardial coronaryresistance in patients with diffuse ath-erosclerosis but “Normal” coronaryangiography. Circulation 2001;104:2401–6.
3. Goldstein RA, Mullani NA, FisherD, Marani S, Gould KL, O’BrienHA. Myocardial perfusion withrubidium-82. II. The effects of meta-bolic and pharmacologic interven-tions. J Nucl Med 1983;24:907–15.
4. Sdringola S, Nakagawa K, NakagawaY, et al. Combined intense lifestyleand pharmacologic lipid treatmentfurther reduce coronary events andmyocardial perfusion abnormalitiescompared with usual-care cholesterol-lowering drugs in coronary artery dis-ease. J Am Coll Cardiol 2003;41:263–72.
5. Sdringola S, Loghin C, BoccalandroF, Gould KL. Mechanisms of pro-gression and regression of coronaryartery disease by PET related to treat-ment intensity and clinical events atlong-term follow-up. J Nucl Med2006;47:59–67.
6. Merhige ME, Breen WJ, Shelton V,Houston T, D’Arcy BJ, Perna AF.Impact of myocardial perfusion imag-ing with PET and 82-Rb on down-stream invasive procedure utilization,costs, and outcomes in coronary dis-ease management. J Nucl Med2007;48:1069–76.
ey Words: quantitativeyocardial perfusion y
uantitative cardiac PET yoronary flow y coronary
tenosis y CAD.e Gould on August 11, 2009

doi:10.1016/j.jcmg.2009.06.004 2009;2;1009-1023 J. Am. Coll. Cardiol. Img.
K. Lance Gould Does Coronary Flow Trump Coronary Anatomy?
This information is current as of August 11, 2009
& ServicesUpdated Information
http://imaging.onlinejacc.org/cgi/content/full/2/8/1009including high-resolution figures, can be found at:
References
http://imaging.onlinejacc.org/cgi/content/full/2/8/1009#BIBLfree at: This article cites 35 articles, 29 of which you can access for
Rights & Permissions
http://imaging.onlinejacc.org/misc/permissions.dtltables) or in its entirety can be found online at: Information about reproducing this article in parts (figures,
Reprints http://imaging.onlinejacc.org/misc/reprints.dtl
Information about ordering reprints can be found online:
by K. Lance Gould on August 11, 2009 imaging.onlinejacc.orgDownloaded from

doi:10.1016/j.jcmg.2008.12.024 2009;2;664-669 J. Am. Coll. Cardiol. Img.
K. Lance Gould Beginnings and Evolution
Coronary Flow Reserve and Pharmacologic Stress Perfusion Imaging:
This information is current as of May 13, 2009
http://imaging.onlinejacc.org/cgi/content/full/2/5/664located on the World Wide Web at:
The online version of this article, along with updated information and services, is
by K. Lance Gould on May 13, 2009 imaging.onlinejacc.orgDownloaded from

H
CSB
K
H
C
Pissrtdirssscdnpst
H
Thcncmib
FfMH
M
J A C C : C A R D I O V A S C U L A R I M A G I N G V O L . 2 , N O . 5 , 2 0 0 9
© 2 0 0 9 B Y T H E A M E R I C A N C O L L E G E O F C A R D I O L O G Y F O U N D A T I O N I S S N 1 9 3 6 - 8 7 8 X / 0 9 / $ 3 6 . 0 0
P U B L I S H E D B Y E L S E V I E R I N C . D O I : 1 0 . 1 0 1 6 / j . j c m g . 2 0 0 8 . 1 2 . 0 2 4
I S T O R I C A L P E R S P E C T I V E
oronary Flow Reserve and Pharmacologictress Perfusion Imagingeginnings and Evolution
. Lance Gould, MD
ouston, Texas
Maneagccd
P
WtntIe“nnVCs
dfiotacasmh
oronary Flow Reserve
harmacologic stress for myocardial perfusionmaging fell out of my first experiment mea-uring coronary flow during progressive steno-is in 1972, published in 1974 (1). The arte-iogram and flowmeter dramatically showedhe 3 fundamental physiological concepts un-erlying all stress myocardial perfusion imag-
ng. The first was the concept of coronary floweserve as a physiological measure of stenosiseverity separately from anatomical or dimen-ional severity and shown in Figure 1. Theecond was the correlation of this physiologicaloronary function with arteriographic stenosisimensions and demonstration of critical ste-osis that lowers resting flow. The third washarmacologic arteriolar vasodilation as thetressor for stimulating maximal coronary flowhat, in these early studies, was contrast media.
uman Coronary Physiology
he relevance of the initial animal studies toumans was an open question then. Humanoronary physiology and stenosis fluid dy-amics were not well known. To test theoncept of coronary flow reserve and phar-acologic stress imaging in humans, we
njected intracoronary macroaggregated al-umin labeled with technetium 99 (Tc-
rom the Department of Medicine, The Weatherhead PET Centeror Preventing and Reversing Atherosclerosis, University of Texas
edical School at Houston and Memorial Hermann Hospital,ouston, Texas.
vanuscript received November 30, 2008; December July 16, 2009.
by Kimaging.onlinejacc.orgDownloaded from
AA) during the hyperemia immediatelyfter intracoronary contrast media for coro-ary arteriography. Planar images of hyper-mic Tc-MAA in patients with coronaryrtery stenosis showed corresponding re-ional perfusion defects, confirming the con-epts of coronary flow reserve and pharma-ologic stress imaging in coronary arteryisease (CAD) (2).
harmacologic Stress: Dipyridamole
ith the basic concepts established, an al-ernative to intracoronary contrast media waseeded, with some literature suggesting in-ravenous dipyridamole as a possibility (3,4).t was the basis for a series of integratedxperimental and human studies entitledNoninvasive Assessment of Coronary Ste-oses by Myocardial Imaging During Coro-ary Vasodilation: Part I Through PartIII,” published in the American Journal ofardiology (5–12) under the creative editor-
hip of Simon Dack.The first 3 parts of this series addressed
ipyridamole perfusion imaging, including therst human dipyridamole perfusion study, donen myself, using thallium-201 at the start ofhe clinical cases. However, these initial studieslso revealed the limitations of planar imagingompared to direct flow measurements forssessing stenosis severity. The fourth studyhowed the power of experimental post-ortem imaging of short-axis sections of the
eart after dipyridamole hyperemia and intra-
enous thallium-201, leading to positron emis-. Lance Gould on May 13, 2009
so
P
ISafipwtfismr
S
Issadlflwte
lfhtt
F
Hflststsspp1
ccirflICc
J A C C : C A R D I O V A S C U L A R I M A G I N G , V O L . 2 , N O . 5 , 2 0 0 9
M A Y 2 0 0 9 : 6 6 4 – 9
Gould
Coronary Flow Reserve and Pharmacologic Stress
665
ion tomography (PET) and the remaining reportsf the series (9,10,12,13).
ET
n an intense 3-week collaboration with Heinrichchelbert, I flew a group of chronically instrumentednimals to the University of California at Los Angelesor the first study of dipyridamole PET perfusionmaging. It showed dipyridamole-induced myocardialerfusion defects for 47% diameter coronary stenosis,ith the severity of the defects proportional to quan-
itative arteriographic severity. As the last experimentnished, the scanner went down with a blown powerupply. An all-night data analysis and writing sessionade the deadline and won the von Hevesy Prize for
esearch in 1978 (9).
tenosis Pressure-Flow Characteristics
n retrospect, at this point a very important issuelipped by me because of my intense focus ontenosis. My pressure-flow data with quantitativerteriographic dimension of stenosis fit classic qua-ratic equations described in the fluid dynamic
iterature (14) at resting conditions. At maximumow, the data failed to fit the same equations thatorked at rest. This discrepancy was deeply dis-
urbing for 1 year because it called into question
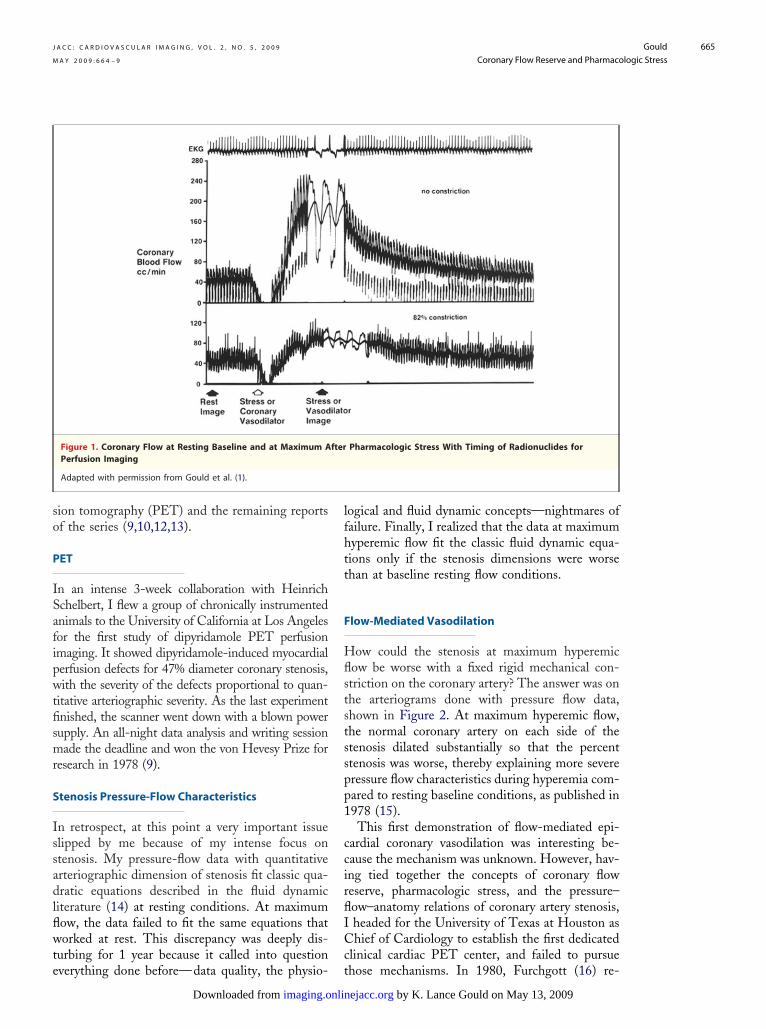
Figure 1. Coronary Flow at Resting Baseline and at Maximum APerfusion Imaging
Adapted with permission from Gould et al. (1).
verything done before—data quality, the physio- t
imaging.onlinDownloaded from
ogical and fluid dynamic concepts—nightmares ofailure. Finally, I realized that the data at maximumyperemic flow fit the classic fluid dynamic equa-ions only if the stenosis dimensions were worsehan at baseline resting flow conditions.
low-Mediated Vasodilation
ow could the stenosis at maximum hyperemicow be worse with a fixed rigid mechanical con-triction on the coronary artery? The answer was onhe arteriograms done with pressure flow data,hown in Figure 2. At maximum hyperemic flow,he normal coronary artery on each side of thetenosis dilated substantially so that the percenttenosis was worse, thereby explaining more severeressure flow characteristics during hyperemia com-ared to resting baseline conditions, as published in978 (15).This first demonstration of flow-mediated epi-
ardial coronary vasodilation was interesting be-ause the mechanism was unknown. However, hav-ng tied together the concepts of coronary floweserve, pharmacologic stress, and the pressure–ow–anatomy relations of coronary artery stenosis,headed for the University of Texas at Houston ashief of Cardiology to establish the first dedicated
linical cardiac PET center, and failed to pursue
Pharmacologic Stress With Timing of Radionuclides for
fterhose mechanisms. In 1980, Furchgott (16) re-
by K. Lance Gould on May 13, 2009 ejacc.org

pv
C
Iodiitbtw
idttipisato(pio
p
CiprvAali
Ta
TtnrlCsavfpacbdaim
. (15
J A C C : C A R D I O V A S C U L A R I M A G I N G , V O L . 2 , N O . 5 , 2 0 0 9
M A Y 2 0 0 9 : 6 6 4 – 9
Gould
Coronary Flow Reserve and Pharmacologic Stress
666
orted the mechanism of flow-mediated coronaryasodilation as endothelial acetylcholine.
linical Cardiac PET
n Texas, my PET technical team, under the directionf Nizar Mullani, Ross Hartz, and David Bristow,esigned and built the first multiring PET scanner for
maging the entire heart in 1 acquisition withoutndexed repositioning for each tomographic slice. Ashis scanner was completed, before the cyclotronuilding was finished, we did the first large clinicalrial of generator-produced rubidium-82 comparedith quantitative coronary arteriography (12,13).Dipyridamole PET perfusion imaging was also
dentifying early asymptomatic CAD, raising theifficult issue of management not found in tradi-ional paradigms of cardiovascular medicine at theime. However, cardiac PET perfusion imaging wasncorporated into a trial of extremely low-fat, com-lete intravenous alimentation in patients withnoperable CAD. Dipyridamole PET showedmaller stress-induced perfusion defects immedi-tely after 90 days of low-fat intravenous alimenta-ion compared with baseline PET before treatmentr with PET at 60 days after treatment was ended17). We hypothesized that this short-term im-rovement in myocardial perfusion was caused bymproved endothelial function, later confirmed bythers.The Lifestyle Heart Trial (18) confirmed im-
Figure 2. Coronary Arteriogram and Arterial Diameter at RestinInstrumented Animal Model
The radiopaque sphere is a steel ball bearing 3.18 mm in diameterFlowmeter wires and an external additional reference bar are also sindicate maximum flow. Adapted with permission from Gould et al
roved myocardial perfusion by PET imaging in m
by K. Lanimaging.onlinejacc.orgDownloaded from
AD patients after 1 year on a low-fat diet; PETmaging further confirmed improved myocardialerfusion in association with and predictive ofeduced coronary events after 5 years of combinedigorous lifestyle and lipid-lowering drugs (19,20).dditional experimental studies defined relative
nd absolute coronary flow reserve as the physio-ogical basis for quantitative PET perfusion imag-ng (21).
he Weatherhead PET Center for Preventingnd Reversing Atherosclerosis
he technology has evolved to PET-computedomography (CT) that has strengths but also sig-ificant complexities and potential errors not widelyecognized or resolved (22). Having developed so-utions to these problems, the Weatherhead PETenter for Preventing and Reversing Atherosclero-
is now routinely uses PET for identifying early ordvanced CAD, for assessing its physiological se-erity as the basis for invasive procedures or not, forollowing up changes in severity, and for improvingatient adherence. Quantitative PET perfusion im-ges show the entire range of absolute flows andoronary flow reserves of each artery down to smallranches with single or multiple stenosis, diffuseisease, and/or myocardial steal indicating collater-lization, illustrated in Figure 3. Here, PET imag-ng has become integral to and inseparable from
anagement of CAD—integrated diagnosis, treat-
seline Conditions and at Maximum Flow in a Chronically
lanted next to the coronary artery at surgery as a size reference.. Black arrows indicate resting baseline conditions; white arrows).
g Ba
impeen
ent, and procedural guide (23–25).
ce Gould on May 13, 2009

J A C C : C A R D I O V A S C U L A R I M A G I N G , V O L . 2 , N O . 5 , 2 0 0 9
M A Y 2 0 0 9 : 6 6 4 – 9
Gould
Coronary Flow Reserve and Pharmacologic Stress
667
Figure 3. PET of Myocardial Perfusion
(A) Orientation of views. Adapted with permission from Sdringola et al. (20). (B) Myocardial uptake of rubidium-82 at rest and during dipyridamole stress show-ing relative myocardial perfusion reserve according to the color bar scale, ranging from maximum (white) in steps down to next highest (red), intermediate nor-mal (yellow), intermediate low (green), low (blue), and lowest (black). The superimposed generic arterial map based on 1,000 PET-arteriogram correlationsshows the precision of coronary arterial distributions by PET. In the lowest panel, values for absolute coronary flow reserve based on absolute myocardial perfu-sion in ml/min/g range from normal of 4.1 to intermediate low of 2.2 to 0.9, indicating myocardial steal characterizing collateralized occluded coronary arteries.In this example, the PET scans indicate severe diffuse disease of the left anterior descending, the left circumflex, and the distal posterior descending coronaryarteries with collateralized occluded diagonal and obtuse marginal branches without myocardial scar on resting images, confirmed by coronary arteriogram.
PET � positron emission tomography.by K. Lance Gould on May 13, 2009 imaging.onlinejacc.orgDownloaded from

festcba
T
C
outmrha
R
TMH
R
J A C C : C A R D I O V A S C U L A R I M A G I N G , V O L . 2 , N O . 5 , 2 0 0 9
M A Y 2 0 0 9 : 6 6 4 – 9
Gould
Coronary Flow Reserve and Pharmacologic Stress
668
Assessing myocardial perfusion has evolvedrom initial concepts shown by flowmeter inxperimental models to integration with detailedtenosis geometry to complex endothelial func-ion to routine measurements of absolute myo-ardial flow and flow reserve of every artery andranch of the coronary tree as a guide to man-gement of CAD.
he Future
ardiovascular medicine and procedures are
aging during pharmacologic coronaryvasodilatation. IV. Limits of stenosis
duced stenoses in tof dogs. Circ Res 1
by K. Lanimaging.onlinejacc.orgDownloaded from
r indirectly. However, few people measure ornderstand it in humans. Artifact-free, quantita-ive perfusion images, absolute myocardial flow inilliliters per minute per gram, and coronary flow
eserve open profound new windows into theeart with awaiting discoveries and clinicalpplications.
eprint requests and correspondence: Dr. K. Lance Gould,he Weatherhead PET Center, University of Texasedical School, 6431 Fannin Street, Room 4.256MSB,ouston, Texas 77030. E-mail: k.lance.gould@uth.
largely involved with coronary blood flow directly tmc.edu.
1
1
1
1
1
2
2
E F E R E N C E S
1. Gould KL, Lipscomb K, HamiltonGW. A physiological basis for assess-ing critical coronary stenosis: instan-taneous flow response and regionaldistribution during coronary hyper-emia as measures of coronary flowreserve. Am J Cardiol 1974;33:87–94.
2. Gould KL, Hamilton GW, LipscombK, Kennedy JW. A method for assess-ing stress induced regional malperfu-sion during coronary arteriography:experimental validation and clinicalapplication. Am J Cardiol 1974;34:557–64.
3. Gregg DE. Physiology of the coronarycirculation—The George E. BrownMemorial Lecture. Circulation 1963;27:1128–37.
4. Winbury MM, Losada M, Kissil D,Howe BB, Pensinger RR. Pentaeryth-ritoltetranitrate and dipyridamole oncardiac nutritive flow and blood content.Am J Physiol 1971;220:1558–63.
5. Gould KL. Noninvasive assessment ofcoronary stenoses by myocardial imag-ing during coronary vasodilation. I.Physiological principles and experi-mental validation. Am J Cardiol 1978;41:267–78.
6. Gould KL, Westcott JR, HamiltonGW. Noninvasive assessment of cor-onary stenoses by myocardial imagingduring coronary vasodilation. II. Clin-ical methodology and feasibility. Am JCardiol 1978;41:279–89.
7. Albro PC, Gould KL, Westcott RJ,Hamilton GW, Ritchie JL, WilliamsDL. Noninvasive assessment of coro-nary stenoses by myocardial imagingduring pharmacologic coronary vaso-dilation. III. Clinical trial. Am J Car-diol 1978;42:751–60.
8. Gould KL. Assessment of coronarystenoses by myocardial perfusion im-
detection by idealized, experimental,cross-sectional myocardial imaging.Am J Cardiol 1978;42:761–8.
9. Gould KL, Schelbert H, Phelps M,Hoffman E. Noninvasive assessmentof coronary stenoses by myocardialperfusion imaging during pharmaco-logic coronary vasodilation. V. Detec-tion of 47% diameter coronary steno-sis with intravenous 13NH4� andemission computed tomography in in-tact dogs. Am J Cardiol 1979;43:200–8.
10. Schelbert HR, Wisenberg G, PhelpsME, et al. Noninvasive assessment ofcoronary stenosis by myocardial imag-ing during pharmacologic coronaryvasodilation. VI. Detection of coro-nary artery disease in man with intra-venous N-13 ammonia and positroncomputed tomography. Am J Cardiol1982;49:1197–207.
11. Kirkeeide R, Gould KL, Parsel L.Assessment of coronary stenoses bymyocardial imaging during coronaryvasodilation. VII. Validation of coro-nary flow reserve as a single integratedmeasure of stenosis severity account-ing for all its geometric dimensions.J Am Coll Cardiol 1986;7:103–13.
12. Gould KL, Goldstein RA, Mullani N,et al. Noninvasive assessment of cor-onary stenoses by myocardial imagingduring pharmacologic coronary vaso-dilation. VIII. Feasibility of 3D car-diac positron imaging without a cyclo-tron using generator produced Rb-82.J Am Coll Cardiol 1986;7:775–92.
13. Demer LL, Gould KL, GoldsteinRA, Kirkeeide RL. Diagnosis of cor-onary artery disease by positron emis-sion tomography: comparison toquantitative coronary arteriography in193 patients. Circulation 1989;79:825–35.
14. Young DF, Cholvin NR, Roth AC.Pressure drop across artificially in-
he femoral arteries975;36:735–43.
ce Gould on May 1
5. Gould KL. Pressure-flow characteris-tics of coronary stenoses in intactunsedated dogs at rest and duringcoronary vasodilation. Circ Res 1978;43:242–53.
6. Furchgott RF, Zawadzki JV. Theobligatory role of endothelial cells inthe relaxation of arterial smooth mus-cle by acetylcholine. Nature 1980;288:373–6.
7. Gould KL, Martucci JP, GoldbergDI, et al. Short-term cholesterol low-ering decreases size and severity ofperfusion abnormalities by positronemission tomography after dipyridam-ole in patients with coronary arterydisease. Circulation 1994;89:1530–8.
8. Gould KL, Ornish D, Scherwitz L, etal. Changes in myocardial perfusionabnormalities by positron emission to-mography after long term, intense riskfactor modification. JAMA 1995;274:894–901.
9. Sdringola S, Nakagawa K, NakagawaY, et al. Combined intense lifestyleand pharmacologic lipid treatmentfurther reduce coronary events andmyocardial perfusion abnormalitiescompared to usual care cholesterollowering drugs in coronary artery dis-ease. J Am Coll Cardiol 2003;41:262–72
0. Sdringola S, Boccalandro F, LoghinC, Gould KL. Mechanisms of pro-gression and regression of coronaryartery disease by PET related to treat-ment intensity and clinical events atlong-term follow-up. J Nucl Med2006;47:59–67
1. Gould KL, Kirkeeide RL, Buchi M.Coronary flow reserve as a physiolog-ical measure of stenosis severity. PartI. Relative and absolute coronary flowreserve during changing aortic pres-sure and cardiac workload. Part II.Determination from arteriographicstenosis dimensions under standard-
ized conditions. J Am Coll Cardiol1990;15:459–74.3, 2009

2
2
Kry
J A C C : C A R D I O V A S C U L A R I M A G I N G , V O L . 2 , N O . 5 , 2 0 0 9
M A Y 2 0 0 9 : 6 6 4 – 9
Gould
Coronary Flow Reserve and Pharmacologic Stress
669
2. Gould KL, Pan T, Loghin C. JohnsonN, Guha A, Sdringola S. Frequentdiagnostic errors in cardiac PET-CTdue to misregistration of CT attenua-tion and emission PET images: a de-finitive analysis of causes, conse-quences and corrections. J Nucl Med2007;48:1112–21.
3. Gould KL. Assessing progression or
regression of CAD: the role of perfu-Downloade
sion imaging. J Nucl Cardiol 2005;12:625–38.
24. Gould KL. Cardiac positron emissiontomography. In: Willerson JT, CohnJN, Wellens HJJ, Holmes DR, edi-tors. Cardiovascular Medicine. 3rdedition. London, United Kingdom:Springer, 2007:855–69.
25. Gould KL. Positron emission tomog-
raphy in the routine management of sby K. Lanimaging.onlinejacc.orgd from
coronary artery disease. Curr OpinCardiol 2007;22:422–8.
ey Words: coronary floweserve y myocardial perfusion
pharmacologic stress y
tenosis fluid dynamics.ce Gould on May 13, 2009

doi:10.1016/j.jcmg.2008.12.024 2009;2;664-669 J. Am. Coll. Cardiol. Img.
K. Lance Gould Beginnings and Evolution
Coronary Flow Reserve and Pharmacologic Stress Perfusion Imaging:
This information is current as of May 13, 2009
& ServicesUpdated Information
http://imaging.onlinejacc.org/cgi/content/full/2/5/664including high-resolution figures, can be found at:
References
http://imaging.onlinejacc.org/cgi/content/full/2/5/664#BIBLfree at: This article cites 24 articles, 12 of which you can access for
Rights & Permissions
http://imaging.onlinejacc.org/misc/permissions.dtltables) or in its entirety can be found online at: Information about reproducing this article in parts (figures,
Reprints http://imaging.onlinejacc.org/misc/reprints.dtl
Information about ordering reprints can be found online:
by K. Lance Gould on May 13, 2009 imaging.onlinejacc.orgDownloaded from