Embed Size (px)
Citation preview

UNITED STATES
SECURITIES AND EXCHANGE COMMISSIONWashington, D.C. 20549
FORM 10-Q(Mark One)
☒ QUARTERLY REPORT PURSUANT TO SECTION 13 OR 15(d) OF THE SECURITIES EXCHANGE ACT OF 1934For the quarterly period ended September 30, 2019
or
☐ TRANSITION REPORT PURSUANT TO SECTION 13 OR 15(d) OF THE SECURITIES EXCHANGE ACT OF 1934 For the transition period from_________ to_________
Commission file number: 001-34501
JUNIPER NETWORKS, INC.(Exact name of registrant as specified in its charter)
Delaware 77-0422528(State or other jurisdiction of incorporation or organization) (I.R.S. Employer Identification No.)
1133 Innovation Way Sunnyvale, California 94089
(Address of principal executive offices) (Zip code)(408) 745-2000
(Registrant's telephone number, including area code)
Securities registered pursuant to Section 12(b) of the Act:
Title of each class Trading Symbol Name of each exchange on which registeredCommon Stock, par value $0.00001 per share JNPR New York Stock Exchange
Indicate by check mark whether the registrant (1) has filed all reports required to be filed by Section 13 or 15(d) of the Securities Exchange Act of 1934 during thepreceding 12 months (or for such shorter period that the registrant was required to file such reports), and (2) has been subject to such filing requirements for the past 90 days.Yes x No o
Indicate by check mark whether the registrant has submitted electronically every Interactive Data File required to be submitted pursuant to Rule 405 of Regulation S-T(§232.405 of this chapter) during the preceding 12 months (or for such shorter period that the registrant was required to submit and post such files). Yes x No o
Indicate by check mark whether the registrant is a large accelerated filer, an accelerated filer, a non-accelerated filer, a smaller reporting company, or an emerging growthcompany. See the definitions of “large accelerated filer,” “accelerated filer,” “smaller reporting company”, and "emerging growth company" in Rule 12b-2 of the Exchange Act.
Large accelerated filer ☒ Accelerated filer ☐ Non-accelerated filer ☐ Smaller reporting company ☐ Emerging growth company ☐
If an emerging growth company, indicate by check mark if the registrant has elected not to use the extended transition period for complying with any new or revisedfinancial accounting standards provided pursuant to Section 13(a) of the Exchange Act. o
Indicate by check mark whether the registrant is a shell company (as defined in Rule 12b-2 of the Exchange Act). Yes ☐ No x
There were 334,707,050 shares of the Company's Common Stock, par value $0.00001, outstanding as of November 4, 2019.

Juniper Networks, Inc.
Table of Contents
PART I - FINANCIAL INFORMATION Page
Item 1. Financial Statements (Unaudited) 3
Condensed Consolidated Statements of OperationsThree and Nine Months Ended September 30, 2019 and September 30, 2018 3
Condensed Consolidated Statements of Comprehensive Income Three and Nine Months Ended September 30, 2019 and September 30, 2018 4
Condensed Consolidated Balance Sheets September 30, 2019 and December 31, 2018 5
Condensed Consolidated Statements of Cash Flows Nine Months Ended September 30, 2019 and September 30, 2018 6
Condensed Consolidated Statements of Changes in Stockholders' Equity Three and Nine Months Ended September 30, 2019 and September 30, 2018 7
Notes to Condensed Consolidated Financial Statements 9
Item 2. Management’s Discussion and Analysis of Financial Condition and Results of Operations 37
Item 3. Quantitative and Qualitative Disclosures About Market Risk 49
Item 4. Controls and Procedures 49
PART II - OTHER INFORMATION
Item 1. Legal Proceedings 50
Item 1A. Risk Factors 50
Item 2. Unregistered Sales of Equity Securities and Use of Proceeds 72
Item 6. Exhibits 73
SIGNATURES 74
2
Table of Contents
PART I — FINANCIAL INFORMATION
Item 1. Financial Statements (Unaudited)
Juniper Networks, Inc.
Condensed Consolidated Statements of Operations(In millions, except per share amounts)
(Unaudited)
Three Months Ended September 30, Nine Months Ended September 30, 2019 2018 2019 2018
Net revenues: Product $ 743.2 $ 794.7 $ 2,075.8 $ 2,330.4Service 389.9 385.1 1,161.5 1,136.1
Total net revenues 1,133.1 1,179.8 3,237.3 3,466.5Cost of revenues:
Product 304.0 312.5 888.3 955.5Service 150.7 156.3 451.5 480.7
Total cost of revenues 454.7 468.8 1,339.8 1,436.2Gross margin 678.4 711.0 1,897.5 2,030.3Operating expenses:
Research and development 244.5 253.8 716.1 772.0Sales and marketing 235.3 224.8 692.8 702.5General and administrative 61.2 67.9 189.4 178.1Restructuring (benefits) charges (1.1) 4.4 35.6 2.3
Total operating expenses 539.9 550.9 1,633.9 1,654.9Operating income 138.5 160.1 263.6 375.4Other expense, net (20.4) (8.1) (23.2) (31.1)Income before income taxes 118.1 152.0 240.4 344.3Income tax provision (benefit) 18.8 (71.8) 63.8 (30.4)
Net income $ 99.3 $ 223.8 $ 176.6 $ 374.7
Net income per share:
Basic $ 0.29 $ 0.65 $ 0.51 $ 1.07
Diluted $ 0.29 $ 0.64 $ 0.50 $ 1.05
Shares used in computing net income per share: Basic 342.2 346.2 345.5 350.1
Diluted 345.5 350.5 350.1 355.2
See accompanying Notes to Condensed Consolidated Financial Statements
3

Table of Contents
Juniper Networks, Inc.
Condensed Consolidated Statements of Comprehensive Income(In millions)(Unaudited)
Three Months Ended September 30, Nine Months Ended September 30,
2019 2018 2019 2018
Net income $ 99.3 $ 223.8 $ 176.6 $ 374.7Other comprehensive (loss) income, net of tax:
Available-for-sale debt securities: Change in net unrealized gains and losses, net of tax(provision) of zero and ($0.8) during the three and ninemonths ended September 30, 2019, respectively, and tax(provision) benefit of ($0.3) and $0.9 for the comparableperiods in 2018, respectively — 0.9 3.8 (0.6)
Net realized losses reclassified into net income, net of taxprovisions of zero for each period (0.1) — (0.1) 0.9
Net change on available-for-sale debt securities, net of tax (0.1) 0.9 3.7 0.3Cash flow hedges:
Change in net unrealized gains and losses, net of taxprovisions of $0.2 and $1.3 during the three and nine monthsended September 30, 2019, respectively, and tax benefits of$1.5 and $2.7 for the comparable periods in 2018,respectively (12.6) (4.6) (12.3) (5.9)
Net realized (gains) and losses reclassified into net income,net of tax provisions of $0.7 and $1.5 during the three andnine months ended September 30, 2019, respectively, and tax(benefit) provision of ($0.5) and $0.3 for the comparableperiods in 2018, respectively 1.5 2.6 3.0 (5.5)
Net change on cash flow hedges, net of tax (11.1) (2.0) (9.3) (11.4)Change in foreign currency translation adjustments (4.3) (7.0) (3.0) (13.7)
Other comprehensive (loss) income, net of tax (15.5) (8.1) (8.6) (24.8)
Comprehensive income $ 83.8 $ 215.7 $ 168.0 $ 349.9
See accompanying Notes to Condensed Consolidated Financial Statements
4
Table of Contents
Juniper Networks, Inc.
Condensed Consolidated Balance Sheets(In millions, except par values)
September 30,
2019 December 31,
2018
(Unaudited) ASSETS
Current assets: Cash and cash equivalents $ 1,204.8 $ 2,489.0Short-term investments 1,040.8 1,070.1Accounts receivable, net of allowances 635.8 754.6Prepaid expenses and other current assets 306.1 268.1
Total current assets 3,187.5 4,581.8Property and equipment, net 848.7 951.7Operating lease assets 171.9 —Long-term investments 581.1 199.0Purchased intangible assets, net 195.7 118.5Goodwill 3,338.3 3,108.8Other long-term assets 430.4 403.5
Total assets $ 8,753.6 $ 9,363.3
LIABILITIES AND STOCKHOLDERS' EQUITY Current liabilities:
Accounts payable $ 229.0 $ 208.8Accrued compensation 176.9 221.0Deferred revenue 741.6 829.3Short-term portion of long-term debt — 349.9Other accrued liabilities 275.4 233.5
Total current liabilities 1,422.9 1,842.5Long-term debt 1,687.6 1,789.1Long-term deferred revenue 377.1 384.3Long-term income taxes payable 402.0 404.4Long-term operating lease liabilities 163.5 —Other long-term liabilities 58.1 119.8
Total liabilities 4,111.2 4,540.1Commitments and contingencies (Note 15) Stockholders' equity:
Convertible preferred stock, $0.00001 par value; 10.0 shares authorized; none issued and outstanding — —Common stock, $0.00001 par value; 1,000.0 shares authorized; 341.0 shares and 346.4 shares issued and
outstanding as of September 30, 2019 and December 31, 2018, respectively — —Additional paid-in capital 7,501.9 7,672.8Accumulated other comprehensive loss (26.8) (18.2)Accumulated deficit (2,832.7) (2,831.4)
Total stockholders' equity 4,642.4 4,823.2
Total liabilities and stockholders' equity $ 8,753.6 $ 9,363.3
See accompanying Notes to Condensed Consolidated Financial Statements
5

Table of Contents
Juniper Networks, Inc.
Condensed Consolidated Statements of Cash Flows(In millions)(Unaudited)
Nine Months Ended September 30,
2019 2018
Cash flows from operating activities: Net income $ 176.6 $ 374.7Adjustments to reconcile net income to net cash provided by operating activities:
Share-based compensation expense 147.1 180.2Depreciation, amortization, and accretion 155.5 159.2Operating lease assets expense 32.0 —Loss on extinguishment of debt 15.3 —Other 3.6 3.5
Changes in operating assets and liabilities, net of acquisitions: Accounts receivable, net 125.2 200.9Prepaid expenses and other assets (33.8) 43.9Accounts payable 19.1 (27.6)Accrued compensation (45.4) (4.2)Income taxes payable (8.7) (244.0)Other accrued liabilities (49.5) (14.5)Deferred revenue (103.8) (23.4)
Net cash provided by operating activities 433.2 648.7Cash flows from investing activities: Purchases of property and equipment (83.5) (110.9)Purchases of available-for-sale debt securities (2,789.6) (608.1)Proceeds from sales of available-for-sale debt securities 1,035.0 1,012.2Proceeds from maturities and redemptions of available-for-sale debt securities 1,410.1 446.6Purchases of equity securities (10.2) (8.1)Proceeds from sales of equity securities 5.0 29.8Payments for business acquisitions, net of cash and cash equivalents acquired (270.9) —Subsequent payments related to acquisitions in prior years — (31.5)
Net cash (used in) provided by investing activities (704.1) 730.0Cash flows from financing activities: Repurchase and retirement of common stock (354.9) (755.5)Proceeds from issuance of common stock 55.4 56.8Payment of dividends (196.4) (187.0)Payment of debt (950.0) —Issuance of debt, net 495.2 —Payment for debt extinguishment costs (14.6) —Change in customer financing arrangement — (16.9)Other — (1.5)
Net cash used in financing activities (965.3) (904.1)Effect of foreign currency exchange rates on cash, cash equivalents, and restricted cash (3.6) (10.9)
Net (decrease) increase in cash, cash equivalents, and restricted cash (1,239.8) 463.7Cash, cash equivalents, and restricted cash at beginning of period 2,505.8 2,059.1
Cash, cash equivalents, and restricted cash at end of period $ 1,266.0 $ 2,522.8
See accompanying Notes to Condensed Consolidated Financial Statements
6

Table of Contents
Juniper Networks, Inc.
Condensed Consolidated Statements of Changes in Stockholders' Equity(In millions, except per share amounts)
(Unaudited)
Three Months Ended September 30, 2019
Common Stock andAdditional Paid-in
Capital Accumulated OtherComprehensive Loss
AccumulatedDeficit
Total Stockholders'
Equity Shares Balance at June 30, 2019 344.5 $ 7,491.2 $ (11.3) $ (2,888.7) $ 4,591.2
Net income — — — 99.3 99.3
Other comprehensive loss, net — — (15.5) — (15.5)
Issuance of common stock 1.7 25.7 — — 25.7
Repurchase and retirement of common stock (5.2) (67.8) — (43.3) (111.1)
Purchase of forward contract under accelerated sharerepurchase program ("ASR") — 60.0 — — 60.0
Share-based compensation expense — 57.5 — — 57.5Payments of cash dividends ($0.19 per share of common stock) — (64.7) — — (64.7)
Balance at September 30, 2019 341.0 $ 7,501.9 $ (26.8) $ (2,832.7) $ 4,642.4
Three Months Ended September 30, 2018
Common Stock andAdditional Paid-in
Capital Accumulated OtherComprehensive Loss
AccumulatedDeficit
Total Stockholders'
Equity Shares Balance at June 30, 2018 349.4 $ 7,609.8 $ (16.4) $ (3,175.7) $ 4,417.7
Net income — — — 223.8 223.8
Other comprehensive loss, net — — (8.1) — (8.1)
Issuance of common stock 1.7 27.3 — — 27.3
Repurchase and retirement of common stock (6.0) (80.2) — (71.1) (151.3)
Purchase of equity forward contract — 150.0 — — 150.0
Share-based compensation expense — 53.6 — — 53.6Payments of cash dividends ($0.18 per share of common stock) — (62.1) — — (62.1)
Balance at September 30, 2018 345.1 $ 7,698.4 $ (24.5) $ (3,023.0) $ 4,650.9
See accompanying Notes to Condensed Consolidated Financial Statements
7

Table of Contents
Juniper Networks, Inc.
Condensed Consolidated Statements of Changes in Stockholders' Equity (Continued)(In millions, except per share amounts)
(Unaudited)
Nine Months Ended September 30, 2019
Common Stock andAdditional Paid-in
Capital Accumulated OtherComprehensive Loss
AccumulatedDeficit
Total Stockholders'Equity Shares
Balance at December 31, 2018 346.4 $ 7,672.8 $ (18.2) $ (2,831.4) $ 4,823.2
Net income — — — 176.6 176.6
Other comprehensive loss, net — — (8.6) — (8.6)
Issuance of common stock 8.5 55.4 — — 55.4
Repurchase and retirement of common stock (13.9) (181.7) — (173.2) (354.9)
Common stock assumed upon business combination — 4.7 — — 4.7
Share-based compensation expense — 147.1 — — 147.1Payments of cash dividends ($0.57 per share of common stock) — (196.4) — — (196.4)
Cumulative adjustment upon adoption of Accounting Standards Update ("ASU") 2017-12 ("Topic 815"), net — — — 0.1 0.1
Cumulative adjustment upon adoption of ASU 2016-02 ("Topic 842"), net — — — (4.8) (4.8)
Balance at September 30, 2019 341.0 $ 7,501.9 $ (26.8) $ (2,832.7) $ 4,642.4
Nine Months Ended September 30, 2018
Common Stock andAdditional Paid-in
Capital Accumulated OtherComprehensive Loss
AccumulatedDeficit
Total Stockholders'Equity Shares
Balance at December 31, 2017 365.5 $ 8,042.1 $ (5.4) $ (3,355.8) $ 4,680.9
Net income — — — 374.7 374.7
Other comprehensive loss, net — — (24.8) — (24.8)
Issuance of common stock 9.1 56.8 — — 56.8
Repurchase and retirement of common stock (29.5) (394.6) — (360.9) (755.5)
Share-based compensation expense — 181.1 — — 181.1Payments of cash dividends ($0.54 per share of common stock) — (187.0) — — (187.0)Cumulative adjustment upon adoption of ASU 2014-09 ("Topic 606"), net — — — 324.7 324.7Reclassification of tax effects upon adoption of ASU 2018-02 ("Topic 220"), net — — 5.7 (5.7) —
Balance at September 30, 2018 345.1 $ 7,698.4 $ (24.5) $ (3,023.0) $ 4,650.9
See accompanying Notes to Condensed Consolidated Financial Statements
8
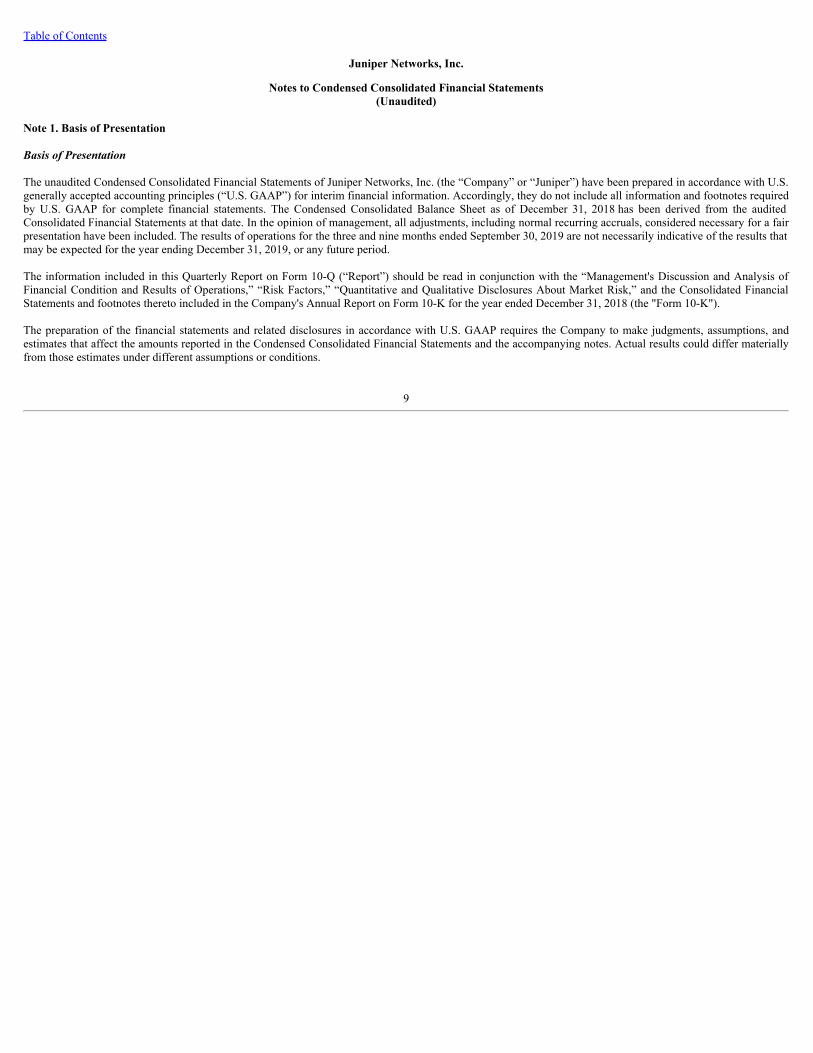
Table of Contents
Juniper Networks, Inc.
Notes to Condensed Consolidated Financial Statements(Unaudited)
Note 1. Basis of Presentation
Basis of Presentation
The unaudited Condensed Consolidated Financial Statements of Juniper Networks, Inc. (the “Company” or “Juniper”) have been prepared in accordance with U.S.generally accepted accounting principles (“U.S. GAAP”) for interim financial information. Accordingly, they do not include all information and footnotes requiredby U.S. GAAP for complete financial statements. The Condensed Consolidated Balance Sheet as of December 31, 2018 has been derived from the auditedConsolidated Financial Statements at that date. In the opinion of management, all adjustments, including normal recurring accruals, considered necessary for a fairpresentation have been included. The results of operations for the three and nine months ended September 30, 2019 are not necessarily indicative of the results thatmay be expected for the year ending December 31, 2019, or any future period.
The information included in this Quarterly Report on Form 10-Q (“Report”) should be read in conjunction with the “Management's Discussion and Analysis ofFinancial Condition and Results of Operations,” “Risk Factors,” “Quantitative and Qualitative Disclosures About Market Risk,” and the Consolidated FinancialStatements and footnotes thereto included in the Company's Annual Report on Form 10-K for the year ended December 31, 2018 (the "Form 10-K").
The preparation of the financial statements and related disclosures in accordance with U.S. GAAP requires the Company to make judgments, assumptions, andestimates that affect the amounts reported in the Condensed Consolidated Financial Statements and the accompanying notes. Actual results could differ materiallyfrom those estimates under different assumptions or conditions.
9

Table of Contents
Juniper Networks, Inc.
Notes to Condensed Consolidated Financial Statements (Continued)(Unaudited)
Note 2. Summary of Significant Accounting Policies
Except for the change in certain policies upon adoption of the accounting standards described below, there have been no material changes to the Company'ssignificant accounting policies, compared to the accounting policies described in Note 2, Significant Accounting Policies, in Notes to Consolidated FinancialStatements in Item 8 of Part II of the Form 10-K.
Recently Adopted Accounting Standards
Cloud Computing Arrangement: On January 1, 2019, the Company early adopted FASB ASU No. 2018-15 (Subtopic 350-40) Intangibles — Goodwill and Other-Internal-Use Software: Customer's Accounting for Implementation Costs Incurred in a Cloud Computing Arrangement That Is a Service Contract, which providesguidance on a customer's accounting for implementation, set-up, and other upfront costs incurred in a cloud computing arrangement that is hosted by a servicecontract. The Company has adopted the standard prospectively, and the adoption did not have a material impact on all applicable implementation costs incurredafter the adoption date.
Derivatives and Hedging: On January 1, 2019, the Company adopted FASB ASU No. 2017-12 (Topic 815) Derivatives and Hedging — Targeted Improvements toAccounting for Hedging Activities, and an amendment thereafter, which expands an entity's ability to hedge financial and nonfinancial risk components and amendshow companies assess effectiveness as well as changes to the presentation and disclosure requirements. The Company adopted the standard under the modifiedretrospective approach, and its amendment and presentation and disclosure requirements on a prospective basis. The adoption did not have a material impact on theCondensed Consolidated Financial Statements. See Note 6, Derivative Instruments for additional disclosures required upon adopting the standard.
Amortization on Purchased Callable Debt Securities: On January 1, 2019, the Company adopted FASB ASU No. 2017-08 Receivables—Nonrefundable Fees andOther Costs (Subtopic 310-20): Premium Amortization on Purchased Callable Debt Securities, which shortens the amortization period for the premium on certainpurchased callable debt securities to the earliest call date. The standard will not impact debt securities held at a discount. The Company adopted the standard underthe modified retrospective approach. The adoption did not have a material impact on the Condensed Consolidated Financial Statements.
Leases: On January 1, 2019, the Company adopted FASB ASU No. 2016-02, Leases (Topic 842) , and the related subsequent amendments ("ASC 842"), whichrequire recognition by the lessees of right-of-use ("ROU") assets and lease liabilities for most leases on the Company's Condensed Consolidated Balance Sheets.The Company adopted the new standard under the modified retrospective approach and recorded a cumulative-effect adjustment to the opening balance ofaccumulated deficit as of the effective date. Under the modified retrospective method, financial results reported in periods prior to 2019 are unchanged. TheCompany elected the package of practical expedients, which did not require the reassessment of existing leases under the new guidance. The Company also electednot to separate non-lease components from lease components and to not recognize ROU assets and lease liabilities for short-term leases.
10
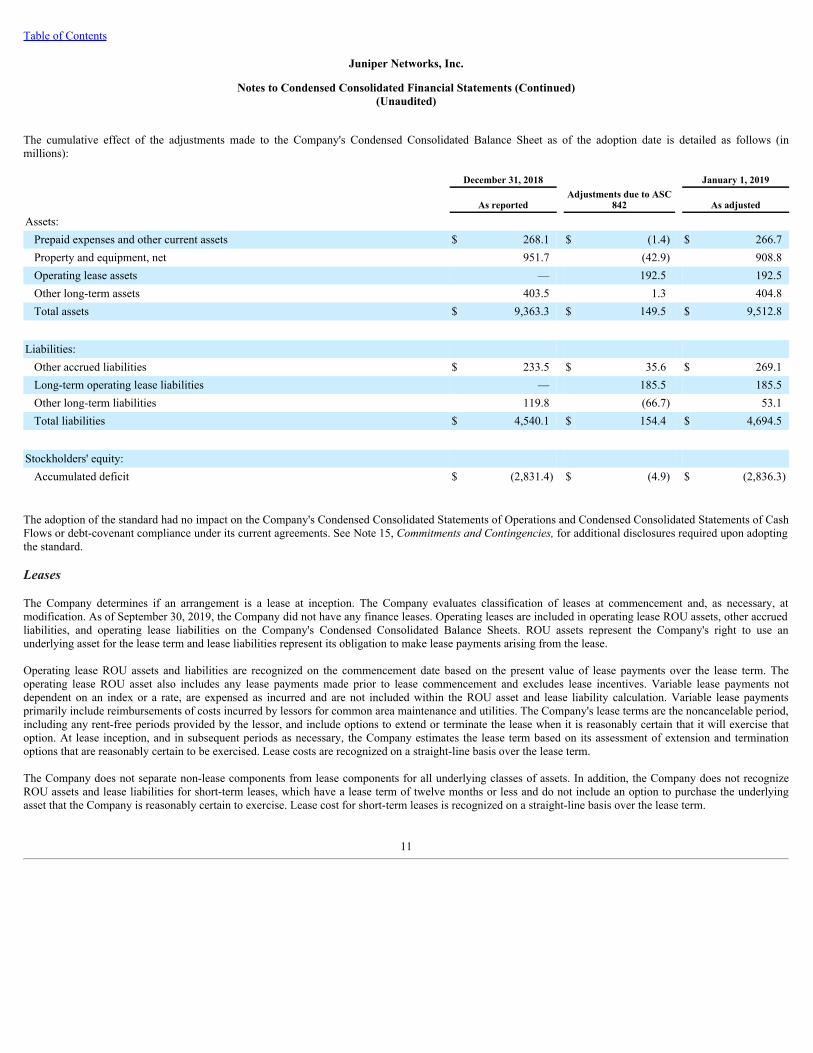
Table of Contents
Juniper Networks, Inc.
Notes to Condensed Consolidated Financial Statements (Continued)(Unaudited)
The cumulative effect of the adjustments made to the Company's Condensed Consolidated Balance Sheet as of the adoption date is detailed as follows (inmillions):
December 31, 2018 January 1, 2019
As reported Adjustments due to ASC
842 As adjusted
Assets: Prepaid expenses and other current assets $ 268.1 $ (1.4) $ 266.7Property and equipment, net 951.7 (42.9) 908.8Operating lease assets — 192.5 192.5Other long-term assets 403.5 1.3 404.8Total assets $ 9,363.3 $ 149.5 $ 9,512.8
Liabilities: Other accrued liabilities $ 233.5 $ 35.6 $ 269.1Long-term operating lease liabilities — 185.5 185.5Other long-term liabilities 119.8 (66.7) 53.1Total liabilities $ 4,540.1 $ 154.4 $ 4,694.5
Stockholders' equity: Accumulated deficit $ (2,831.4) $ (4.9) $ (2,836.3)
The adoption of the standard had no impact on the Company's Condensed Consolidated Statements of Operations and Condensed Consolidated Statements of CashFlows or debt-covenant compliance under its current agreements. See Note 15, Commitments and Contingencies, for additional disclosures required upon adoptingthe standard.
Leases
The Company determines if an arrangement is a lease at inception. The Company evaluates classification of leases at commencement and, as necessary, atmodification. As of September 30, 2019, the Company did not have any finance leases. Operating leases are included in operating lease ROU assets, other accruedliabilities, and operating lease liabilities on the Company's Condensed Consolidated Balance Sheets. ROU assets represent the Company's right to use anunderlying asset for the lease term and lease liabilities represent its obligation to make lease payments arising from the lease.
Operating lease ROU assets and liabilities are recognized on the commencement date based on the present value of lease payments over the lease term. Theoperating lease ROU asset also includes any lease payments made prior to lease commencement and excludes lease incentives. Variable lease payments notdependent on an index or a rate, are expensed as incurred and are not included within the ROU asset and lease liability calculation. Variable lease paymentsprimarily include reimbursements of costs incurred by lessors for common area maintenance and utilities. The Company's lease terms are the noncancelable period,including any rent-free periods provided by the lessor, and include options to extend or terminate the lease when it is reasonably certain that it will exercise thatoption. At lease inception, and in subsequent periods as necessary, the Company estimates the lease term based on its assessment of extension and terminationoptions that are reasonably certain to be exercised. Lease costs are recognized on a straight-line basis over the lease term.
The Company does not separate non-lease components from lease components for all underlying classes of assets. In addition, the Company does not recognizeROU assets and lease liabilities for short-term leases, which have a lease term of twelve months or less and do not include an option to purchase the underlyingasset that the Company is reasonably certain to exercise. Lease cost for short-term leases is recognized on a straight-line basis over the lease term.
11
Table of Contents
Juniper Networks, Inc.
Notes to Condensed Consolidated Financial Statements (Continued)(Unaudited)
Recent Accounting Standards Not Yet Adopted
Fair Value Measurement: In August 2018, the FASB issued ASU No. 2018-13 (Topic 820) Disclosure Framework — Changes to the Disclosure Requirementsfor Fair Value Measurement, which eliminates, adds, and modifies certain disclosure requirements for fair value measurements under ASC 820. This ASU is to beapplied on a prospective basis for certain modified or new disclosure requirements, and all other amendments in the standard are to be applied on a retrospectivebasis. The new standard is effective for interim and annual periods beginning after December 15, 2019, with early adoption permitted. The Company is currentlyevaluating the impact of adoption on the Consolidated Financial Statements.
Simplifying the Test for Goodwill Impairment: In January 2017, the FASB issued ASU No. 2017-04 (Topic 350) Intangibles—Goodwill and Other: Simplifyingthe Test for Goodwill Impairment, which removes Step 2 of the goodwill impairment test, which requires a hypothetical purchase price allocation. Under theamended guidance, a goodwill impairment charge will now be recognized for the amount by which the carrying value of a reporting unit exceeds its fair value, notto exceed the carrying amount of goodwill. This ASU will be applied on a prospective basis and is effective for interim and annual periods beginning afterDecember 15, 2019, with early adoption permitted for any impairment tests performed after January 1, 2017. The Company does not expect the adoption to have amaterial impact on the Consolidated Financial Statements.
Credit Losses on Financial Instruments: In June 2016, the FASB issued ASU No. 2016-13 (Topic 326) Financial Instruments—Credit Losses: Measurement ofCredit Losses on Financial Instruments, which provides more decision-useful information about the expected credit losses on financial instruments and changesthe loss impairment methodology. An amendment issued by the FASB in November 2018 clarifies that receivables arising from operating leases are not within thescope of Topic 326 and should be accounted for in accordance with Topic 842. This pronouncement and its amendments are effective for reporting periodsbeginning after December 15, 2019, and interim periods within those fiscal years, using a modified retrospective adoption method. Early adoption is permitted. TheCompany is currently evaluating the impact of adoption on the Consolidated Financial Statements.
12

Table of Contents
Juniper Networks, Inc.
Notes to Condensed Consolidated Financial Statements (Continued)(Unaudited)
Note 3. Business Combinations
On April 1, 2019, the Company acquired 100% ownership of Mist Systems, Inc. (“Mist”) for $359.2 million. The purchase consideration consisted of cash of$354.5 million and $4.7 million in share-based awards attributable to services prior to the acquisition. The acquisition of Mist, a company that provides cloud-managed wireless networks powered by artificial intelligence, is expected to enhance Juniper's enterprise networking portfolio by combining Mist’s next-generation Wireless LAN platform with Juniper's wired LAN, SD-WAN, and security solutions to deliver integrated end-to-end user and IT experiences.
The following table summarizes the estimated fair value of the assets acquired and liabilities assumed at the acquisition date (in millions):
Amount
Cash and cash equivalents $ 38.9Goodwill 228.9Intangible assets 102.0Other assets acquired 15.8Liabilities assumed (26.4)
Total $ 359.2
The goodwill recognized in connection with the acquisition is primarily attributable to anticipated synergies from future growth and will not be deductible forincome tax purposes.
The following table summarizes the fair value of the separately identifiable intangible assets at the time of acquisition (in millions):
Amount
Intangible assets(*): Developed technology $ 81.0Customer relationships 15.0Trade name 6.0
Total intangible assets acquired $ 102.0 ________________________________(*) Estimated useful life of each of the assets is 5 years.
Acquisition-related costs were not material during the three and nine months ended September 30, 2019 and were expensed in the period incurred within generaland administrative expense in the Company's Condensed Consolidated Statements of Operations.
The Company's Condensed Consolidated Financial Statements include the operating results of this business combination from the date of acquisition. Pro formaresults of operations for this acquisition have not been presented, as the financial impact to the Company's consolidated results of operations is not material. Theprimary areas of the preliminary purchase price allocation that are subject to change relate to certain legal and income tax matters.
13

Table of Contents
Juniper Networks, Inc.
Notes to Condensed Consolidated Financial Statements (Continued)(Unaudited)
Note 4. Cash Equivalents and Investments
Investments in Available-for-Sale Debt Securities
The following table summarizes the Company's unrealized gains and losses and fair value of investments designated as available-for-sale debt securities as ofSeptember 30, 2019 and December 31, 2018 (in millions):
As of September 30, 2019 As of December 31, 2018
Amortized Cost
GrossUnrealized
Gains
GrossUnrealized
LossesEstimated Fair
ValueAmortized
Cost
GrossUnrealized
Gains
GrossUnrealized
LossesEstimated Fair
Value
Fixed income securities:Asset-backed securities $ 77.4 $ 0.1 $ — $ 77.5 $ 46.8 $ — $ (0.3) $ 46.5Certificates of deposit 70.6 — (0.1) 70.5 152.9 — — 152.9Commercial paper 259.9 — — 259.9 393.6 — — 393.6Corporate debt securities 713.0 0.6 (0.3) 713.3 416.1 — (3.1) 413.0Foreign government debt
securities 15.2 — — 15.2 20.0 — (0.1) 19.9Time deposits 17.4 — — 17.4 278.6 — — 278.6U.S. government agency
securities 52.0 — — 52.0 87.2 — (0.2) 87.0U.S. government securities 578.7 0.4 (0.4) 578.7 811.8 — (0.5) 811.3
Total fixed incomesecurities 1,784.2 1.1 (0.8) 1,784.5 2,207.0 — (4.2) 2,202.8
Privately-held debt andredeemable preferred stocksecurities 16.1 37.4 — 53.5 16.6 37.4 — 54.0
Total available-for-saledebt securities $ 1,800.3 $ 38.5 $ (0.8) $ 1,838.0 $ 2,223.6 $ 37.4 $ (4.2) $ 2,256.8
Reported as:Cash equivalents $ 163.2 $ — $ — $ 163.2 $ 936.5 $ — $ — $ 936.5Short-term investments 1,039.4 0.9 (0.1) 1,040.2 1,069.2 — (1.9) 1,067.3Long-term investments 581.6 0.2 (0.7) 581.1 201.3 — (2.3) 199.0Other long-term assets 16.1 37.4 — 53.5 16.6 37.4 — 54.0
Total $ 1,800.3 $ 38.5 $ (0.8) $ 1,838.0 $ 2,223.6 $ 37.4 $ (4.2) $ 2,256.8
The following table presents the contractual maturities of the Company's total fixed income securities as of September 30, 2019 (in millions):
Amortized
Cost Estimated Fair
Value
Due in less than one year $ 1,202.6 $ 1,203.4Due between one and five years 581.6 581.1
Total $ 1,784.2 $ 1,784.5
14

Table of Contents
Juniper Networks, Inc.
Notes to Condensed Consolidated Financial Statements (Continued)(Unaudited)
The following tables present the Company's total fixed income securities that were in an unrealized loss position as of September 30, 2019 and December 31, 2018(in millions):
As of September 30, 2019
Less than 12 Months 12 Months or Greater Total
Fair
Value Unrealized
Loss Fair
Value Unrealized
Loss Fair
Value Unrealized
Loss
Fixed income securities: Asset-backed securities $ 11.3 $ — $ 12.0 $ — $ 23.3 $ —Certificates of deposit 4.9 (0.1) — — 4.9 (0.1)Corporate debt securities 222.6 (0.3) 64.3 — 286.9 (0.3)Foreign government debt securities — — 6.8 — 6.8 —U.S. government agency securities 46.0 — — — 46.0 —U.S. government securities 203.5 (0.4) 4.0 — 207.5 (0.4)
Total fixed income securities $ 488.3 $ (0.8) $ 87.1 $ — $ 575.4 $ (0.8)
As of December 31, 2018
Less than 12 Months 12 Months or Greater Total
Fair
Value Unrealized
Loss Fair
Value Unrealized
Loss Fair
Value Unrealized
Loss
Fixed income securities: Asset-backed securities $ 3.1 $ — $ 43.0 $ (0.3) $ 46.1 $ (0.3)Corporate debt securities 72.6 (0.1) 330.7 (3.0) 403.3 (3.1)Foreign government debt securities 1.5 — 18.4 (0.1) 19.9 (0.1)U.S. government agency securities 2.0 — 45.2 (0.2) 47.2 (0.2)U.S. government securities 344.0 — 63.5 (0.5) 407.5 (0.5)
Total fixed income securities $ 423.2 $ (0.1) $ 500.8 $ (4.1) $ 924.0 $ (4.2)
For available-for-sale debt securities that have unrealized losses, the Company assesses impairment by evaluating various factors, including whether (i) it has theintention to sell any of these investments and (ii) whether it is more likely than not that it will be required to sell any of these investments before recovery of theentire amortized cost basis. As of September 30, 2019, the Company had 290 investments in unrealized loss positions. The gross unrealized losses related to theseinvestments were primarily due to changes in market interest rates. The Company anticipates that it will recover the entire amortized cost basis of such available-for-sale debt securities and has determined that no other-than-temporary impairments associated with credit losses were required to be recognized during the threeand nine months ended September 30, 2019 and September 30, 2018.
During the three and nine months ended September 30, 2019 and September 30, 2018, there were no material gross realized gains or losses from available-for-saledebt securities.
15
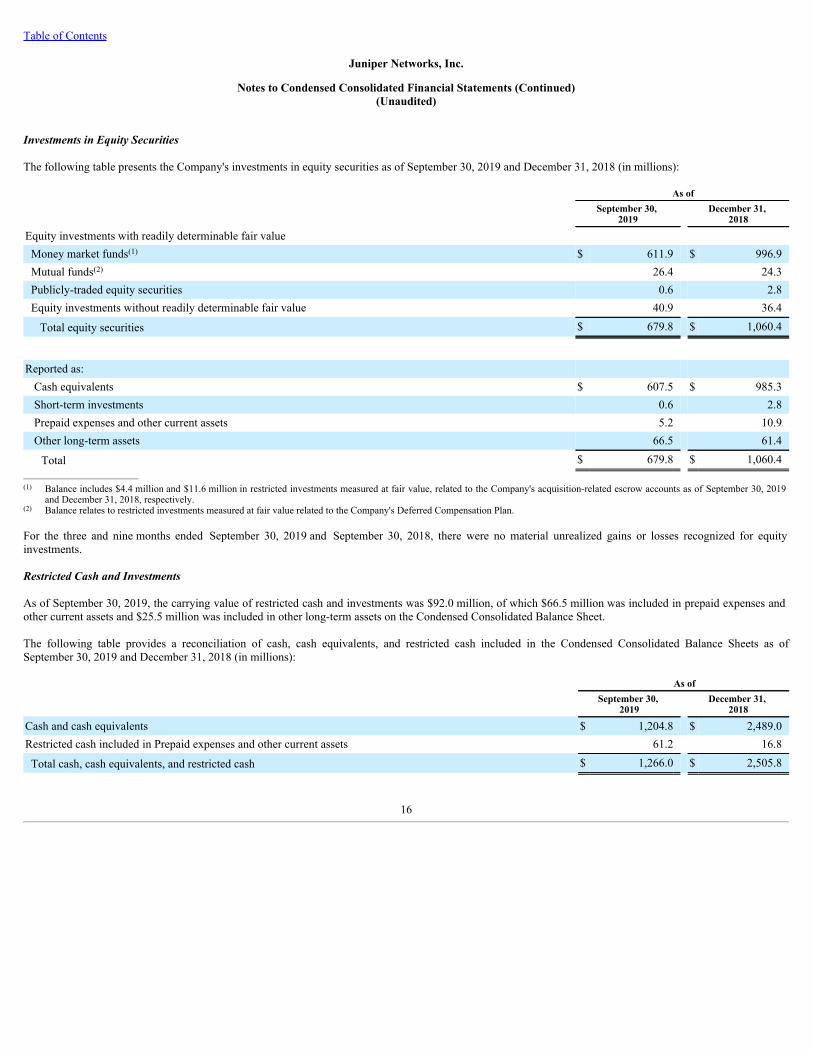
Table of Contents
Juniper Networks, Inc.
Notes to Condensed Consolidated Financial Statements (Continued)(Unaudited)
Investments in Equity Securities
The following table presents the Company's investments in equity securities as of September 30, 2019 and December 31, 2018 (in millions):
As of
September 30,
2019 December 31,
2018
Equity investments with readily determinable fair value Money market funds(1) $ 611.9 $ 996.9 Mutual funds(2) 26.4 24.3 Publicly-traded equity securities 0.6 2.8 Equity investments without readily determinable fair value 40.9 36.4
Total equity securities $ 679.8 $ 1,060.4
Reported as: Cash equivalents $ 607.5 $ 985.3Short-term investments 0.6 2.8Prepaid expenses and other current assets 5.2 10.9Other long-term assets 66.5 61.4
Total $ 679.8 $ 1,060.4________________________________(1) Balance includes $4.4 million and $11.6 million in restricted investments measured at fair value, related to the Company's acquisition-related escrow accounts as of September 30, 2019
and December 31, 2018, respectively.(2) Balance relates to restricted investments measured at fair value related to the Company's Deferred Compensation Plan.
For the three and nine months ended September 30, 2019 and September 30, 2018, there were no material unrealized gains or losses recognized for equityinvestments.
Restricted Cash and Investments
As of September 30, 2019, the carrying value of restricted cash and investments was $92.0 million, of which $66.5 million was included in prepaid expenses andother current assets and $25.5 million was included in other long-term assets on the Condensed Consolidated Balance Sheet.
The following table provides a reconciliation of cash, cash equivalents, and restricted cash included in the Condensed Consolidated Balance Sheets as ofSeptember 30, 2019 and December 31, 2018 (in millions):
As of
September 30,
2019 December 31,
2018
Cash and cash equivalents $ 1,204.8 $ 2,489.0Restricted cash included in Prepaid expenses and other current assets 61.2 16.8
Total cash, cash equivalents, and restricted cash $ 1,266.0 $ 2,505.8
16
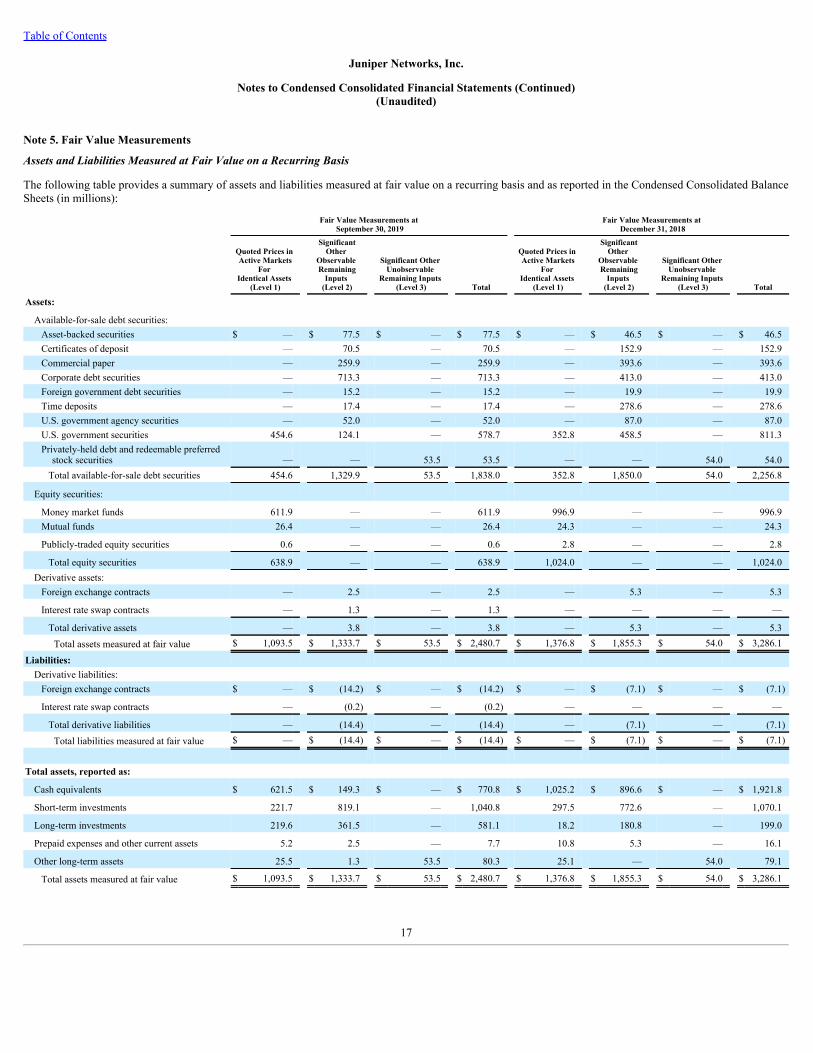
Table of Contents
Juniper Networks, Inc.
Notes to Condensed Consolidated Financial Statements (Continued)(Unaudited)
Note 5. Fair Value Measurements
Assets and Liabilities Measured at Fair Value on a Recurring Basis
The following table provides a summary of assets and liabilities measured at fair value on a recurring basis and as reported in the Condensed Consolidated BalanceSheets (in millions):
Fair Value Measurements at September 30, 2019
Fair Value Measurements at December 31, 2018
Quoted Prices in Active Markets
For Identical Assets
(Level 1)
SignificantOther
Observable Remaining
Inputs (Level 2)
Significant Other Unobservable
Remaining Inputs (Level 3) Total
Quoted Prices in Active Markets
For Identical Assets
(Level 1)
SignificantOther
Observable Remaining
Inputs (Level 2)
Significant Other Unobservable
Remaining Inputs (Level 3) Total
Assets:
Available-for-sale debt securities:Asset-backed securities $ — $ 77.5 $ — $ 77.5 $ — $ 46.5 $ — $ 46.5Certificates of deposit — 70.5 — 70.5 — 152.9 — 152.9Commercial paper — 259.9 — 259.9 — 393.6 — 393.6Corporate debt securities — 713.3 — 713.3 — 413.0 — 413.0Foreign government debt securities — 15.2 — 15.2 — 19.9 — 19.9Time deposits — 17.4 — 17.4 — 278.6 — 278.6U.S. government agency securities — 52.0 — 52.0 — 87.0 — 87.0U.S. government securities 454.6 124.1 — 578.7 352.8 458.5 — 811.3Privately-held debt and redeemable preferred
stock securities — — 53.5 53.5 — — 54.0 54.0Total available-for-sale debt securities 454.6 1,329.9 53.5 1,838.0 352.8 1,850.0 54.0 2,256.8
Equity securities:
Money market funds 611.9 — — 611.9 996.9 — — 996.9Mutual funds 26.4 — — 26.4 24.3 — — 24.3
Publicly-traded equity securities 0.6 — — 0.6 2.8 — — 2.8
Total equity securities 638.9 — — 638.9 1,024.0 — — 1,024.0Derivative assets:
Foreign exchange contracts — 2.5 — 2.5 — 5.3 — 5.3
Interest rate swap contracts — 1.3 — 1.3 — — — —
Total derivative assets — 3.8 — 3.8 — 5.3 — 5.3Total assets measured at fair value $ 1,093.5 $ 1,333.7 $ 53.5 $ 2,480.7 $ 1,376.8 $ 1,855.3 $ 54.0 $ 3,286.1
Liabilities:Derivative liabilities:
Foreign exchange contracts $ — $ (14.2) $ — $ (14.2) $ — $ (7.1) $ — $ (7.1)
Interest rate swap contracts — (0.2) — (0.2) — — — —
Total derivative liabilities — (14.4) — (14.4) — (7.1) — (7.1)Total liabilities measured at fair value $ — $ (14.4) $ — $ (14.4) $ — $ (7.1) $ — $ (7.1)
Total assets, reported as:
Cash equivalents $ 621.5 $ 149.3 $ — $ 770.8 $ 1,025.2 $ 896.6 $ — $ 1,921.8
Short-term investments 221.7 819.1 — 1,040.8 297.5 772.6 — 1,070.1
Long-term investments 219.6 361.5 — 581.1 18.2 180.8 — 199.0
Prepaid expenses and other current assets 5.2 2.5 — 7.7 10.8 5.3 — 16.1
Other long-term assets 25.5 1.3 53.5 80.3 25.1 — 54.0 79.1
Total assets measured at fair value $ 1,093.5 $ 1,333.7 $ 53.5 $ 2,480.7 $ 1,376.8 $ 1,855.3 $ 54.0 $ 3,286.1
17
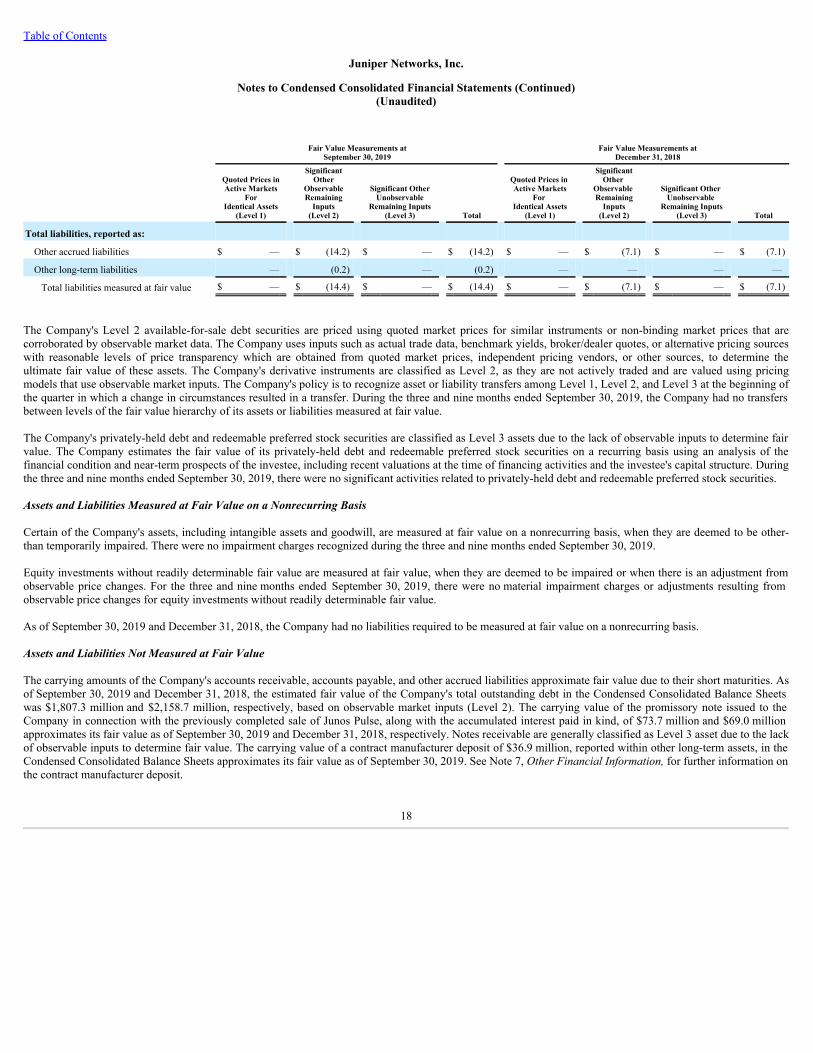
Table of Contents
Juniper Networks, Inc.
Notes to Condensed Consolidated Financial Statements (Continued)(Unaudited)
Fair Value Measurements atSeptember 30, 2019 Fair Value Measurements at
December 31, 2018
Quoted Prices inActive Markets
ForIdentical Assets
(Level 1)
SignificantOther
ObservableRemaining
Inputs(Level 2)
Significant OtherUnobservable
Remaining Inputs(Level 3) Total
Quoted Prices in Active Markets
For Identical Assets
(Level 1)
SignificantOther
Observable Remaining
Inputs(Level 2)
Significant Other Unobservable
Remaining Inputs(Level 3) Total
Total liabilities, reported as:
Other accrued liabilities $ — $ (14.2) $ — $ (14.2) $ — $ (7.1) $ — $ (7.1)
Other long-term liabilities — (0.2) — (0.2) — — — —
Total liabilities measured at fair value $ — $ (14.4) $ — $ (14.4) $ — $ (7.1) $ — $ (7.1)
The Company's Level 2 available-for-sale debt securities are priced using quoted market prices for similar instruments or non-binding market prices that arecorroborated by observable market data. The Company uses inputs such as actual trade data, benchmark yields, broker/dealer quotes, or alternative pricing sourceswith reasonable levels of price transparency which are obtained from quoted market prices, independent pricing vendors, or other sources, to determine theultimate fair value of these assets. The Company's derivative instruments are classified as Level 2, as they are not actively traded and are valued using pricingmodels that use observable market inputs. The Company's policy is to recognize asset or liability transfers among Level 1, Level 2, and Level 3 at the beginning ofthe quarter in which a change in circumstances resulted in a transfer. During the three and nine months ended September 30, 2019, the Company had no transfersbetween levels of the fair value hierarchy of its assets or liabilities measured at fair value.
The Company's privately-held debt and redeemable preferred stock securities are classified as Level 3 assets due to the lack of observable inputs to determine fairvalue. The Company estimates the fair value of its privately-held debt and redeemable preferred stock securities on a recurring basis using an analysis of thefinancial condition and near-term prospects of the investee, including recent valuations at the time of financing activities and the investee's capital structure. Duringthe three and nine months ended September 30, 2019, there were no significant activities related to privately-held debt and redeemable preferred stock securities.
Assets and Liabilities Measured at Fair Value on a Nonrecurring Basis
Certain of the Company's assets, including intangible assets and goodwill, are measured at fair value on a nonrecurring basis, when they are deemed to be other-than temporarily impaired. There were no impairment charges recognized during the three and nine months ended September 30, 2019.
Equity investments without readily determinable fair value are measured at fair value, when they are deemed to be impaired or when there is an adjustment fromobservable price changes. For the three and nine months ended September 30, 2019, there were no material impairment charges or adjustments resulting fromobservable price changes for equity investments without readily determinable fair value.
As of September 30, 2019 and December 31, 2018, the Company had no liabilities required to be measured at fair value on a nonrecurring basis.
Assets and Liabilities Not Measured at Fair Value
The carrying amounts of the Company's accounts receivable, accounts payable, and other accrued liabilities approximate fair value due to their short maturities. Asof September 30, 2019 and December 31, 2018, the estimated fair value of the Company's total outstanding debt in the Condensed Consolidated Balance Sheetswas $1,807.3 million and $2,158.7 million, respectively, based on observable market inputs (Level 2). The carrying value of the promissory note issued to theCompany in connection with the previously completed sale of Junos Pulse, along with the accumulated interest paid in kind, of $73.7 million and $69.0 millionapproximates its fair value as of September 30, 2019 and December 31, 2018, respectively. Notes receivable are generally classified as Level 3 asset due to the lackof observable inputs to determine fair value. The carrying value of a contract manufacturer deposit of $36.9 million, reported within other long-term assets, in theCondensed Consolidated Balance Sheets approximates its fair value as of September 30, 2019. See Note 7, Other Financial Information, for further information onthe contract manufacturer deposit.
18

Table of Contents
Juniper Networks, Inc.
Notes to Condensed Consolidated Financial Statements (Continued)(Unaudited)
Note 6. Derivative Instruments
The Company uses derivative instruments to manage a variety of risks, including risks related to fluctuations in foreign currency exchange rates and interest rateson debt instruments. We do not use derivative financial instruments for speculative purposes.
The notional amount of the Company's derivatives is summarized as follows (in millions):
As of
September 30,
2019 December 31,
2018
Designated derivatives: Cash flow hedges $ 533.4 $ 497.7Interest rate swap contracts 300.0 —Total designated derivatives 833.4 497.7
Non-designated derivatives 161.9 158.7
Total $ 995.3 $ 656.4
Designated Derivatives
The Company uses foreign currency forward contracts to hedge the Company's planned cost of revenues and operating expenses denominated in foreigncurrencies. These derivatives are designated as cash flow hedges. Execution of cash flow hedge derivatives typically occurs every month with maturities ofeighteen months or less. As of September 30, 2019, an estimated $8.8 million of unrealized net loss within accumulated other comprehensive loss is expected to bereclassified into earnings within the next twelve months.
The Company recognized an unrealized loss of $12.4 million and $11.1 million in accumulated other comprehensive income for the effective portion of itsderivative instruments for the three and nine months ended September 30, 2019, respectively; and an unrealized loss of $6.1 million and $8.6 million for thecomparable periods in fiscal 2018, respectively. The Company reclassified a loss of $0.8 million and $1.5 million out of accumulated other comprehensive incometo cost of revenues and operating expenses in the Condensed Consolidated Statements of Operations during the three and nine months ended September 30, 2019,respectively, and a loss of $3.1 million and a gain of $5.8 million for the comparable periods in fiscal 2018, respectively.
In September 2019, the Company entered into interest rate swaps with an aggregate notional amount of $300.0 million designated as fair value hedges of our fixed-rate 2041 Notes. These swaps convert the fixed interest rates of the notes to floating interest rates based on the London InterBank Offered Rate (LIBOR). Most ofthe interest rate swaps will expire within ten years or less. The Company recognizes the change in fair value of the derivative instrument, as well as the offsettingchange in the fair value of the hedged item, in Other expense, net in the Condensed Consolidated Statements of Operations in the period of change. Thesederivatives are classified in the Condensed Consolidated Statements of Cash Flows in the same section as the underlying item.
See Note 5, Fair Value Measurements, for the fair values of the Company's derivative instruments in the Condensed Consolidated Balance Sheets.
Non-Designated Derivatives
The Company also uses foreign currency forward contracts to mitigate variability in gains and losses generated from the remeasurement of certain monetary assetsand liabilities denominated in foreign currencies. These foreign exchange forward contracts typically have maturities of approximately one to four months. Theoutstanding non-designated derivative instruments are carried at fair value. Changes in the fair value of these derivatives recorded in other expense, net within theCondensed Consolidated Statements of Operations were not material during the three and nine months ended September 30, 2019 and September 30, 2018.
19

Table of Contents
Juniper Networks, Inc.
Notes to Condensed Consolidated Financial Statements (Continued)(Unaudited)
Note 7. Other Financial Information
Inventory
Total inventory consisted of the following (in millions):
As ofSeptember 30,
2019 December 31,
2018
Production and service materials $ 68.1 $ 60.6Finished goods 25.3 21.4
Inventory $ 93.4 $ 82.0
Reported as: Prepaid expenses and other current assets $ 90.1 $ 80.6Other long-term assets 3.3 1.4
Total $ 93.4 $ 82.0
Deposit
The Company has a non-interest bearing deposit balance of $36.9 million, net of an unamortized discount balance of $1.9 million, to a contract manufacturer perthe terms of the agreement. The discount is calculated based on an imputed interest rate of 5.0% at September 30, 2019. The imputed interest will be amortizedover the term of the deposit to interest income along with a corresponding charge to cost of revenues. The deposit is due in the third quarter of 2020 and has beenclassified as other long-term assets on the Condensed Consolidated Balance Sheets.
Warranties
Changes during the nine months ended September 30, 2019 in the Company’s warranty reserve as reported within other accrued liabilities in the CondensedConsolidated Balance Sheets were as follows (in millions):
Balance as of December 31, 2018 $ 28.0Provisions made during the period 28.5Actual costs incurred during the period (25.0)
Balance as of September 30, 2019 $ 31.5
20

Table of Contents
Juniper Networks, Inc.
Notes to Condensed Consolidated Financial Statements (Continued)(Unaudited)
Deferred Revenue
Details of the Company's deferred revenue, as reported in the Condensed Consolidated Balance Sheets, were as follows (in millions):
As of
September 30,
2019 December 31,
2018
Deferred product revenue: Undelivered product commitments and other product deferrals $ 138.4 $ 163.3
Deferred gross product revenue 138.4 163.3Deferred cost of product revenue (9.4) (18.9)
Deferred product revenue, net 129.0 144.4Deferred service revenue 989.7 1,069.2
Total $ 1,118.7 $ 1,213.6
Reported as: Current $ 741.6 $ 829.3Long-term 377.1 384.3
Total $ 1,118.7 $ 1,213.6
Revenue
See Note 12, Segments, for disaggregated revenue by product and service, customer vertical, and geographic region.
Product revenue of $13.7 million and $54.3 million included in deferred revenue at January 1, 2019 was recognized during the three and nine months endedSeptember 30, 2019, respectively. Service revenue of $152.3 million and $609.1 million included in deferred revenue at January 1, 2019 was recognized during thethree and nine months ended September 30, 2019, respectively.
The following table summarizes the transaction price for contracts that have not yet been recognized as revenue as of September 30, 2019 and when the Companyexpects to recognize the amounts as gross revenue (in millions):
Revenue Recognition Expected by Period
Total Less than 1 year 1-3 years More than 3 years
Product $ 138.4 $ 114.5 $ 21.1 $ 2.8Service 998.2 645.0 297.3 55.9
Total $ 1,136.6 $ 759.5 $ 318.4 $ 58.7
Deferred Commissions
Deferred commissions were $20.4 million as of September 30, 2019. For the three and nine months ended September 30, 2019, amortization expense for thedeferred commissions was $27.9 million and $94.0 million, respectively. There were no impairment charges recognized during the three and nine months endedSeptember 30, 2019.
21

Table of Contents
Juniper Networks, Inc.
Notes to Condensed Consolidated Financial Statements (Continued)(Unaudited)
Other Expense, Net
Other expense, net, consisted of the following (in millions):
Three Months Ended September 30, Nine Months Ended September 30,
2019 2018 2019 2018Interest income $ 19.7 $ 18.9 $ 63.0 $ 49.8Interest expense (22.1) (25.8) (68.3) (77.7)Loss on extinguishment of debt (15.3) — (15.3) —Loss on investments, net (3.4) (1.9) (4.6) (1.8)Other 0.7 0.7 2.0 (1.4)
Other expense, net $ (20.4) $ (8.1) $ (23.2) $ (31.1)
22

Table of Contents
Juniper Networks, Inc.
Notes to Condensed Consolidated Financial Statements (Continued)(Unaudited)
Note 8. Restructuring Charges
During the first quarter of 2019, the Company initiated a restructuring plan (the "2019 Restructuring Plan") designed to realign its workforce with the Company'ssales strategy, improve productivity, and enhance cost efficiencies. During the second quarter of 2019, the Company amended the 2019 Restructuring Plan andundertook certain further actions that resulted in additional severance, additional facility consolidation, and contract termination costs.
During the three months ended September 30, 2019, the Company recorded $0.3 million and $0.8 million for changes in previous estimates associated withseverance and contract termination costs, respectively. During the nine months ended September 30, 2019, the Company recorded $21.8 million of severance costsrelated to workforce reductions, $2.1 million of facility consolidations, and $11.7 million of contract termination costs, respectively, to restructuring charges in theCondensed Consolidated Statements of Operations.
Restructuring liabilities are reported within other accrued liabilities in the Condensed Consolidated Balance Sheets. The following table provides a summary ofchanges in the restructuring liabilities for the Company's 2019 and prior year restructuring plans (in millions):
December 31,
2018 Charges Cash
Payments Other September 30,
2019
Severance $ 1.1 $ 21.8 $ (20.7) $ — $ 2.2Facility consolidations — 2.1 (0.1) (2.0) —Contract terminations — 11.7 (10.9) (0.2) 0.6
Total $ 1.1 $ 35.6 $ (31.7) $ (2.2) $ 2.8
The Company expects to pay the remaining restructuring liabilities by the end of the second quarter of 2020.
23

Table of Contents
Juniper Networks, Inc.
Notes to Condensed Consolidated Financial Statements (Continued)(Unaudited)
Note 9. Debt
Debt
The following table summarizes the Company's total debt (in millions, except percentages):
As of September 30, 2019
Issuance date Maturity Date Amount Effective Interest
Rates
Senior Notes ("Notes"): 4.500% fixed-rate notes(1) ("2024 Notes") March 2014 March 2024 $ 350.0 4.63%4.500% fixed-rate notes(1) ("2024 Notes") February 2016 March 2024 150.0 4.87%4.350% fixed-rate notes ("2025 Notes") March 2015 June 2025 300.0 4.47%3.750% fixed-rate notes ("2029 Notes") August 2019 August 2029 500.0 3.86%5.950% fixed-rate notes ("2041 Notes") March 2011 March 2041 400.0 6.03%
Total Notes 1,700.0 Unaccreted discount and debt issuance costs (13.5) Hedge accounting fair value adjustments(2) 1.1
Total $ 1,687.6 ________________________________(1) 2024 Notes issued in March 2014 and February 2016 form a single series and are fully fungible.(2) Represents the fair value adjustments for interest rate swap contracts with an aggregate notional amount of $300.0 million designated as fair value hedges of our fixed-rate
2041 Notes. See Note 6, Derivative Instruments, for a discussion of the Company's interest rate swaps.
In August 2019, the Company issued $500.0 million aggregate principal amount of 3.75% senior notes due 2029. The net proceeds from the issuance of the 2029Notes, together with cash on hand, were used for the repayment of $600.0 million aggregate principal amount of the Company's 3.30% senior notes due 2020 and4.60% senior notes due 2021. The repayments were made in August and September 2019. The repayments resulted in a loss on extinguishment of debt of $15.3million, which was recorded under other expense, net within the Condensed Consolidated Statements of Operations.
The Notes above are the Company’s senior unsecured and unsubordinated obligations, ranking equally in right of payment to all of the Company’s existing andfuture senior unsecured and unsubordinated indebtedness, and senior in right of payment to any of the Company’s future indebtedness that is expresslysubordinated to the Notes.
The Company may redeem the 2025 Notes and the 2029 Notes, either in whole or in part, at any time three months prior to the maturity date of the 2025 Notes, andthree months prior to the maturity date of the 2029 Notes, respectively, at a redemption price equal to the greater of (i) 100% of the aggregate principal amount ofthe 2025 Notes and the 2029 Notes to be redeemed or (ii) the sum of the present values of the remaining scheduled payments discounted at the Treasury rate plus37.5 basis points for the 2025 Notes, or the Treasury rate plus 35.0 basis points for the 2029 Notes, plus, in the case of each of the clauses (i) and (ii) above,accrued and unpaid interest, if any. At any time on or after March 15, 2025, in the case of the 2025 Notes, and at any time on or after March 15, 2029, in the caseof the 2029 Notes, the Company may redeem Notes of such series, in whole or in part, at a redemption price equal to 100% of the principal amount of the 2025Notes and the 2029 Notes to be redeemed, plus accrued and unpaid interest, if any. The Company may redeem the other Notes, either in whole or in part, at anytime at a redemption price equal to the greater of (i) 100% of the aggregate principal amount of the Notes to be redeemed or (ii) the sum of the present values of theremaining scheduled payments discounted to the redemption date, plus, in either case, accrued and unpaid interest, if any.
In the event of a change of control repurchase event, the holders of the Notes may require the Company to repurchase for cash all or part of the Notes at a purchaseprice equal to 101% of the aggregate principal amount, plus accrued and unpaid interest, if any.
Interest on the Notes is payable in cash semiannually. The effective interest rates for the Notes include the interest on the Notes, accretion of the discount, andamortization of issuance costs. The indentures that govern the Notes also contain various covenants, including limitations on the Company's ability to incur liens orenter into sale-leaseback transactions over certain dollar thresholds.
24
Table of Contents
Juniper Networks, Inc.
Notes to Condensed Consolidated Financial Statements (Continued)(Unaudited)
As of September 30, 2019, the Company was in compliance with all covenants in the indentures governing the Notes.
Revolving Credit Facility
In April 2019, the Company entered into a new credit agreement with certain institutional lenders that provides for a five-year $500.0 million unsecured revolvingcredit facility (the "Revolving Credit Facility"), with an option to increase the Revolving Credit Facility by up to an additional $200.0 million, subject to thelenders' approval. Proceeds of loans made under the Revolving Credit Facility may be used by the Company for working capital and general corporate purposes.The Revolving Credit Facility will terminate in April 2024, subject to two one-year maturity extension options, on the terms and conditions as set forth in the creditagreement. As of September 30, 2019, there were no amounts outstanding under the Revolving Credit Facility.
Borrowings under the Revolving Credit Facility will bear interest, at either (i) a floating rate per annum equal to the base rate plus a margin ofbetween 0.00% and 0.375%, depending on the Company's public debt rating or (ii) a per annum rate equal to the reserve adjusted Eurocurrency rate, plus a marginof between 0.910% and 1.375%, depending on the Company's public debt rating. Base rate is defined as the greatest of (A) Citibank's base rate, (B) the federalfunds rate plus 0.500% or (C) the ICE Benchmark Administration Settlement Rate applicable to dollars for a period of one month plus 1.00%. The Eurocurrencyrate is determined for U.S. dollars and Pounds Sterling as the rate at which deposits in such currency are offered in the London interbank market for the applicableinterest period and for Euro as the rate specified for deposits in Euro with a maturity comparable to the applicable interest period.
The Revolving Credit Facility requires the Company to maintain a leverage ratio no greater than 3.0x (provided that if a material acquisition has beenconsummated, the Company is permitted to maintain a leverage ratio no greater than 3.5x for up to four quarters) and an interest coverage ratio no less than 3.0xduring the term of the credit facility. As of September 30, 2019, the Company was in compliance with all covenants in the Credit Agreement.
25
Table of Contents
Juniper Networks, Inc.
Notes to Condensed Consolidated Financial Statements (Continued)(Unaudited)
Note 10. Equity
The following table summarizes dividends paid, stock repurchases and retirements under the Company's stock repurchase program (in millions, except per shareamounts):
Three Months Ended September 30, Nine Months Ended September 30,
2019 2018 2019 2018
Dividends Per share $ 0.19 $ 0.18 $ 0.57 $ 0.54Amount $ 64.7 $ 62.1 $ 196.4 $ 187.0
Repurchased under the 2018 Stock Repurchase Program Shares 5.1 6.0 13.7 29.3Average price per share(*) $ 24.90 $ 25.62 $ 25.45 $ 25.62Amount $ 50.0 $ — $ 350.0 $ 750.0
________________________________(*) Represents the average price per share of the ASR and open market purchases for the three and nine months ended September 30, 2019.
Cash Dividends on Shares of Common Stock
During the three and nine months ended September 30, 2019, the Company declared a quarterly cash dividend of $0.19 per share of common stock on January 29,2019, April 25, 2019 and July 25, 2019, respectively, which was paid on March 22, 2019, June 24, 2019 and September 25, 2019, respectively, to stockholders ofrecord on March 1, 2019, June 3, 2019 and September 4, 2019, respectively. Any future dividends, and the establishment of record and payment dates, are subjectto approval by the Board of Directors (the “Board”) of Juniper or an authorized committee thereof. See Note 16, Subsequent Events, for discussion of theCompany's dividend declaration subsequent to September 30, 2019.
Stock Repurchase Activities
In January 2018, the Board approved a $2.0 billion share repurchase program ("2018 Stock Repurchase Program"). As part of the 2018 Stock Repurchase Program,in February 2018, the Company entered into an ASR to repurchase $750.0 million of its common stock. The Company made an up-front payment of $750.0 millionpursuant to the ASR to repurchase its common stock. The aggregate number of shares ultimately repurchased of 29.3 million shares of common stock wasdetermined based on a volume weighted average repurchase price, less an agreed upon discount, of $25.62 per share.
On April 29, 2019, the Company entered into an ASR, to repurchase an aggregate of approximately $300.0 million of the Company’s outstanding common stock.During the three months ended June 30, 2019, the Company made an up-front payment of $300.0 million pursuant to the ASR and received and retired an initial8.6 million shares of the Company’s common stock for an aggregate price of $240.0 million, based on the market price of $27.94 per share of the Company’scommon stock on the date of the transaction. During the three months ended September 30, 2019, the ASR was completed and an additional 3.0 million shareswere received for a total repurchase of 11.6 million shares of the Company's common stock at a volume weighted average repurchase price, less an agreed upondiscount, of $25.79 per share. The shares received by the Company were retired, accounted for as a reduction to stockholder’s equity in the CondensedConsolidated Balance Sheets, and treated as a repurchase of common stock for purposes of calculating earnings per share.
During the three months ended September 30, 2019, the Company also repurchased 2.1 million shares of its common stock in the open market for an aggregatepurchase price of $50.0 million at an average price of $23.63 per share, under the 2018 Stock Repurchase Program.
As of September 30, 2019, there was approximately $900.0 million of authorized funds remaining under the 2018 Stock Repurchase Program. The 2018 StockRepurchase Program does not have a specified termination date. See Note 16, Subsequent Events, for discussion of the Company's stock repurchase activity,increased repurchase authorization and ASR subsequent to September 30, 2019.
26

Table of Contents
Juniper Networks, Inc.
Notes to Condensed Consolidated Financial Statements (Continued)(Unaudited)
Future share repurchases under the 2018 Stock Repurchase Program will be subject to a review of the circumstances at that time and will be made from time totime in private transactions or open market purchases as permitted by securities laws and other legal requirements. The Company's 2018 Stock RepurchaseProgram may be discontinued at any time.
In addition to repurchases under the 2018 Stock Repurchase Program, the Company also withholds shares of common stock from certain employees in connectionwith the vesting of stock awards issued to such employees to satisfy applicable tax withholding requirements. Such withheld shares are treated as common stockrepurchases in our financial statements as they reduce the number of shares that would have been issued upon vesting. Repurchases associated with taxwithholdings were not material during the three and nine months ended September 30, 2019 and September 30, 2018.
Accumulated Other Comprehensive Loss, Net of Tax
The components of accumulated other comprehensive loss, net of related taxes, for the nine months ended September 30, 2019 were as follows (in millions):
UnrealizedGains/Losses
on Available-for-Sale Debt Securities
Unrealized Gains/Losseson Cash Flow
Hedges
ForeignCurrency
TranslationAdjustments Total
Balance as of December 31, 2018 $ 25.5 $ (0.9) $ (42.8) $ (18.2)Other comprehensive income before reclassifications 3.8 (12.3) (3.0) (11.5)Amount reclassified from accumulated other comprehensive loss (0.1) 3.0 — 2.9Other comprehensive income, net 3.7 (9.3) (3.0) (8.6)
Balance as of September 30, 2019 $ 29.2 $ (10.2) $ (45.8) $ (26.8)
27
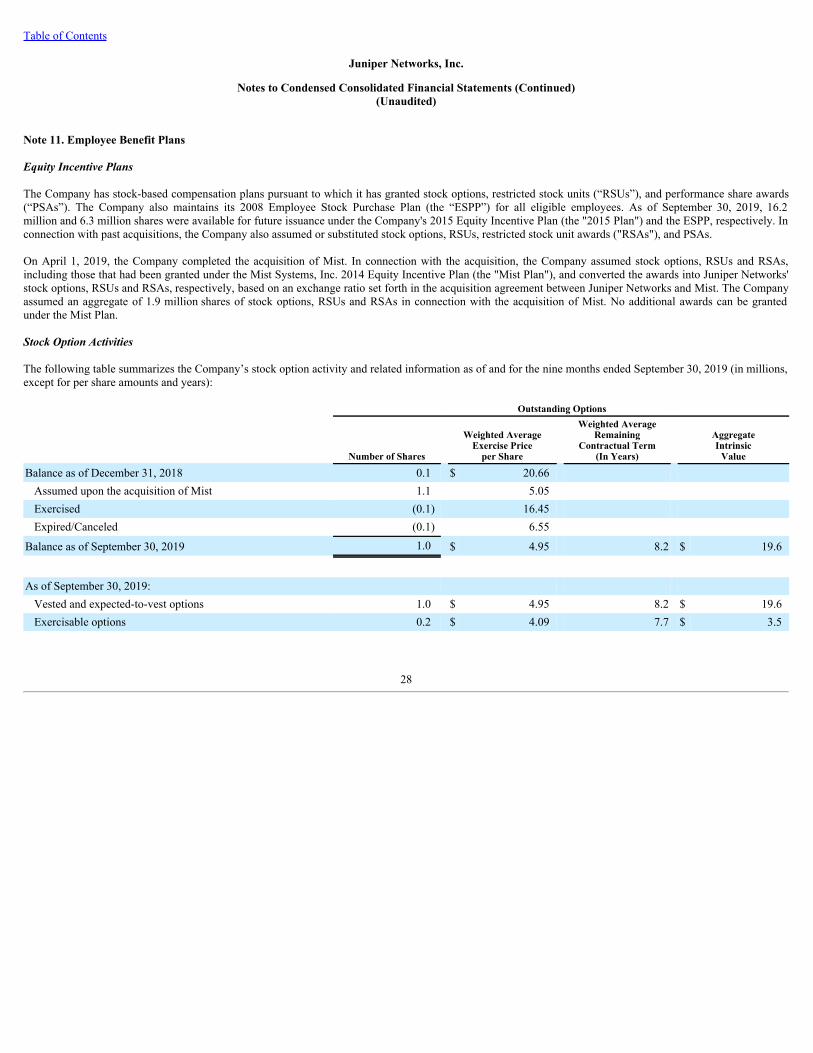
Table of Contents
Juniper Networks, Inc.
Notes to Condensed Consolidated Financial Statements (Continued)(Unaudited)
Note 11. Employee Benefit Plans
Equity Incentive Plans
The Company has stock-based compensation plans pursuant to which it has granted stock options, restricted stock units (“RSUs”), and performance share awards(“PSAs”). The Company also maintains its 2008 Employee Stock Purchase Plan (the “ESPP”) for all eligible employees. As of September 30, 2019, 16.2million and 6.3 million shares were available for future issuance under the Company's 2015 Equity Incentive Plan (the "2015 Plan") and the ESPP, respectively. Inconnection with past acquisitions, the Company also assumed or substituted stock options, RSUs, restricted stock unit awards ("RSAs"), and PSAs.
On April 1, 2019, the Company completed the acquisition of Mist. In connection with the acquisition, the Company assumed stock options, RSUs and RSAs,including those that had been granted under the Mist Systems, Inc. 2014 Equity Incentive Plan (the "Mist Plan"), and converted the awards into Juniper Networks'stock options, RSUs and RSAs, respectively, based on an exchange ratio set forth in the acquisition agreement between Juniper Networks and Mist. The Companyassumed an aggregate of 1.9 million shares of stock options, RSUs and RSAs in connection with the acquisition of Mist. No additional awards can be grantedunder the Mist Plan.
Stock Option Activities
The following table summarizes the Company’s stock option activity and related information as of and for the nine months ended September 30, 2019 (in millions,except for per share amounts and years):
Outstanding Options
Number of Shares
Weighted AverageExercise Price
per Share
Weighted AverageRemaining
Contractual Term(In Years)
AggregateIntrinsic
Value
Balance as of December 31, 2018 0.1 $ 20.66 Assumed upon the acquisition of Mist 1.1 5.05 Exercised (0.1) 16.45 Expired/Canceled (0.1) 6.55
Balance as of September 30, 2019 1.0 $ 4.95 8.2 $ 19.6
As of September 30, 2019: Vested and expected-to-vest options 1.0 $ 4.95 8.2 $ 19.6Exercisable options 0.2 $ 4.09 7.7 $ 3.5
28

Table of Contents
Juniper Networks, Inc.
Notes to Condensed Consolidated Financial Statements (Continued)(Unaudited)
Restricted Stock Unit and Performance Share Award Activities
The Company’s RSU and PSA activity and related information as of and for the nine months ended September 30, 2019 were as follows (in millions, except pershare amounts and years):
Outstanding RSUs, RSAs and PSAs(4)
Number of Shares
Weighted AverageGrant-Date FairValue per Share
Weighted AverageRemaining
Contractual Term(In Years)
AggregateIntrinsic
Value
Balance as of December 31, 2018 17.4 $ 25.32 RSUs granted (1)(3) 7.3 25.36 RSUs assumed upon the acquisition of Mist 0.1 25.81 RSAs assumed upon the acquisition of Mist 0.7 27.20 PSAs granted (2)(3) 1.5 25.06 RSUs vested (4.7) 25.93 RSAs vested (0.1) 23.10 PSAs vested (0.5) 26.77 RSUs canceled (2.0) 26.03 PSAs canceled (0.9) 23.64
Balance as of September 30, 2019 18.8 $ 25.20 1.2 $ 465.9________________________________(1) Includes service-based and market-based RSUs. The number of shares subject to market-based condition represents the aggregate maximum number of shares that may be
issued pursuant to the award over its full term. The aggregate number of shares subject to market-based conditions that would be issued if market criteria are achieved attarget is 0.2 million shares. Depending on achievement of such market criteria, the range of shares that could be issued under these awards is zero to 0.4 million shares.
(2) The number of shares subject to PSAs granted represents the aggregate maximum number of shares that may be issued pursuant to the award over its full term. Theaggregate number of shares subject to these PSAs that would be issued if performance goals are achieved at target is 0.4 million shares. Depending on achievement of suchperformance goals, the range of shares that could be issued under these awards is zero to 0.7 million shares.
(3) The grant date fair value of RSUs and PSAs was reduced by the present value of dividends expected to be paid on the underlying shares of common stock during therequisite and derived service period as these awards are not entitled to receive dividends until vested. During the nine months ended September 30, 2019, the Companydeclared a quarterly cash dividend of $0.19 per share of common stock on January 29, 2019, April 25, 2019 and July 25, 2019.
(4) 1.5 million shares of PSAs were modified during the nine months ended September 30, 2019, which relate to PSAs granted in 2018 and PSAs assumed by the Company inconnection with acquisitions consummated in 2016. Compensation cost resulting from the modifications totaled $30.2 million to be recognized over the remaining terms ofthe modified awards.
Employee Stock Purchase Plan
The following table summarizes employee stock purchases through the ESPP (in millions, except per share amounts):
Three Months Ended September 30, Nine Months Ended September 30,
2019 2018 2019 2018
Shares purchased 1.2 1.2 2.4 2.5Average exercise price per share $ 22.03 $ 22.39 $ 22.04 $ 22.31
The ESPP provides 24 month offering periods with four 6-month purchase periods. A new 24-month offering period will commence every six months thereafter.The purchase price for the Company’s common stock under the ESPP is 85% of the lower of the fair market value of the shares at (1) the beginning of theapplicable offering period or (2) the end of each 6-month purchase period during such offering period. The ESPP will continue in effect until February 25, 2028,unless terminated earlier under the provisions of the ESPP.
29

Table of Contents
Juniper Networks, Inc.
Notes to Condensed Consolidated Financial Statements (Continued)(Unaudited)
Share-Based Compensation Expense
Share-based compensation expense associated with stock options, RSUs, RSAs, PSAs, and the ESPP was recorded in the following cost and expense categories inthe Condensed Consolidated Statements of Operations (in millions):
Three Months Ended September 30, Nine Months Ended September 30,
2019 2018 2019 2018
Cost of revenues - Product $ 0.8 $ 1.5 $ 4.3 $ 5.1Cost of revenues - Service 4.1 4.5 13.0 14.2Research and development 29.6 28.1 68.0 101.8Sales and marketing 15.5 12.9 40.0 40.4General and administrative 7.5 6.2 21.8 18.7
Total $ 57.5 $ 53.2 $ 147.1 $ 180.2
The following table summarizes share-based compensation expense by award type (in millions):
Three Months Ended September 30, Nine Months Ended September 30,
2019 2018 2019 2018
Stock options $ 2.3 $ 0.1 $ 5.6 $ 0.3RSUs, RSAs, and PSAs 50.9 48.2 127.7 165.8ESPP 4.3 4.9 13.8 14.1
Total $ 57.5 $ 53.2 $ 147.1 $ 180.2
As of September 30, 2019, the total unrecognized compensation cost related to unvested share-based awards was $330.2 million to be recognized over a weighted-average period of 1.7 years.
30
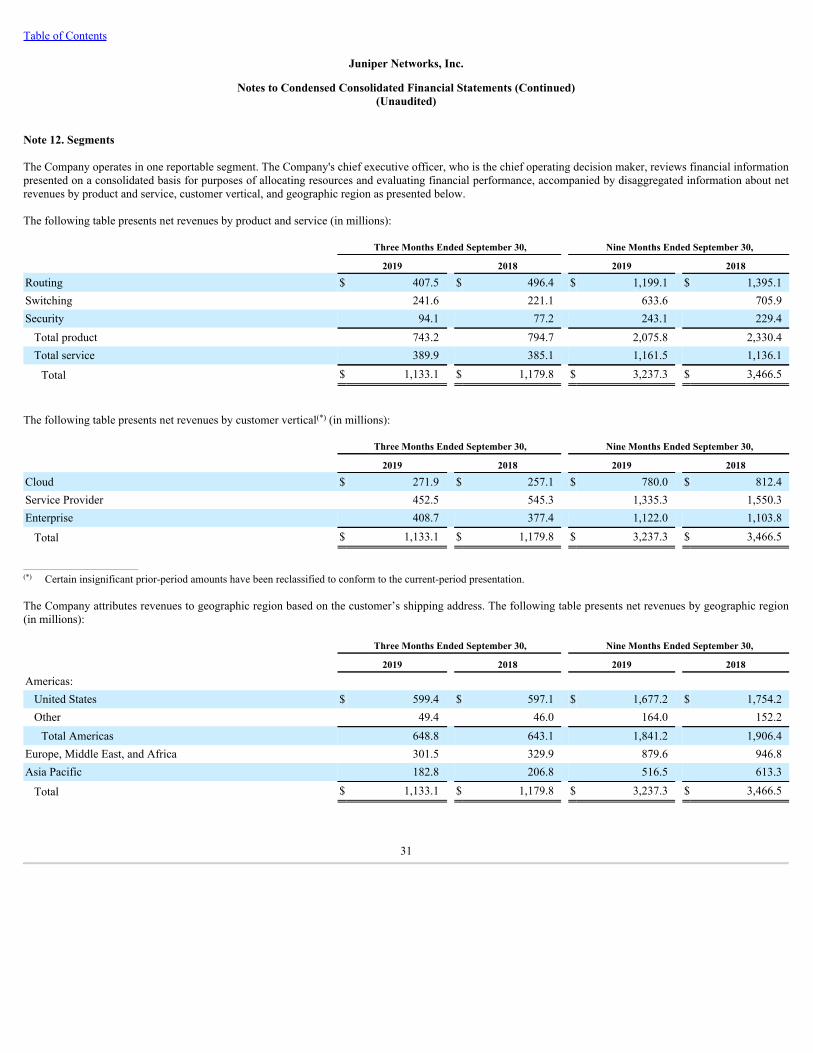
Table of Contents
Juniper Networks, Inc.
Notes to Condensed Consolidated Financial Statements (Continued)(Unaudited)
Note 12. Segments
The Company operates in one reportable segment. The Company's chief executive officer, who is the chief operating decision maker, reviews financial informationpresented on a consolidated basis for purposes of allocating resources and evaluating financial performance, accompanied by disaggregated information about netrevenues by product and service, customer vertical, and geographic region as presented below.
The following table presents net revenues by product and service (in millions):
Three Months Ended September 30, Nine Months Ended September 30,
2019 2018 2019 2018
Routing $ 407.5 $ 496.4 $ 1,199.1 $ 1,395.1Switching 241.6 221.1 633.6 705.9Security 94.1 77.2 243.1 229.4
Total product 743.2 794.7 2,075.8 2,330.4Total service 389.9 385.1 1,161.5 1,136.1
Total $ 1,133.1 $ 1,179.8 $ 3,237.3 $ 3,466.5
The following table presents net revenues by customer vertical(*) (in millions):
Three Months Ended September 30, Nine Months Ended September 30,
2019 2018 2019 2018
Cloud $ 271.9 $ 257.1 $ 780.0 $ 812.4Service Provider 452.5 545.3 1,335.3 1,550.3Enterprise 408.7 377.4 1,122.0 1,103.8
Total $ 1,133.1 $ 1,179.8 $ 3,237.3 $ 3,466.5
________________________________(*) Certain insignificant prior-period amounts have been reclassified to conform to the current-period presentation.
The Company attributes revenues to geographic region based on the customer’s shipping address. The following table presents net revenues by geographic region(in millions):
Three Months Ended September 30, Nine Months Ended September 30,
2019 2018 2019 2018
Americas: United States $ 599.4 $ 597.1 $ 1,677.2 $ 1,754.2Other 49.4 46.0 164.0 152.2
Total Americas 648.8 643.1 1,841.2 1,906.4Europe, Middle East, and Africa 301.5 329.9 879.6 946.8Asia Pacific 182.8 206.8 516.5 613.3
Total $ 1,133.1 $ 1,179.8 $ 3,237.3 $ 3,466.5
31

Table of Contents
Juniper Networks, Inc.
Notes to Condensed Consolidated Financial Statements (Continued)(Unaudited)
Note 13. Income Taxes
The following table provides details of income taxes (in millions, except percentages):
Three Months Ended September 30, Nine Months Ended September 30,
2019 2018 2019 2018
Income before income taxes $ 118.1 $ 152.0 $ 240.4 $ 344.3Income tax provision (benefit) $ 18.8 $ (71.8) $ 63.8 $ (30.4)Effective tax rate (benefit) 15.9% (47.2)% 26.5% (8.8)%
The Company’s effective tax rate differs from the statutory rate of 21%, primarily due to the tax impact of state taxes, geographic mix of earnings includingforeign-derived intangible income deductions and global intangible low-taxed income, research and development (“R&D") tax credits, tax audit settlements,nondeductible compensation, international realignments, and transfer pricing adjustments.
The Company's effective tax rate during the three and nine months ended September 30, 2019 reflects a benefit of discrete items, including the recognition of $8.3million in previously unrecognized tax benefits, including interest, due to a lapse in statutes of limitations partially offset by the impact of an internationalrealignment including the write-down of certain deferred tax assets and the inability to fully benefit certain discrete charges recorded in prior quarters.
The Company’s effective tax rate during the three and nine months ended September 30, 2018 included a $67.6 million in previously unrecognized tax benefits,including interest, due to a lapse in statutes of limitations and a $33.2 million benefit as a result of filing a change in accounting method for the tax recognition ofdeferred product revenue.
As of September 30, 2019, the total amount of gross unrecognized tax benefits was $174.9 million, of which $171.9 million, if recognized, would affect theeffective tax rate.
The Company engages in continuous discussions and negotiations with tax authorities regarding tax matters in various jurisdictions. It is reasonably possible thatthe balance of unrecognized tax benefits could decrease by up to $32.6 million within the next twelve months due to lapses of applicable statutes of limitations andthe completion of tax review cycles in various tax jurisdictions.
32
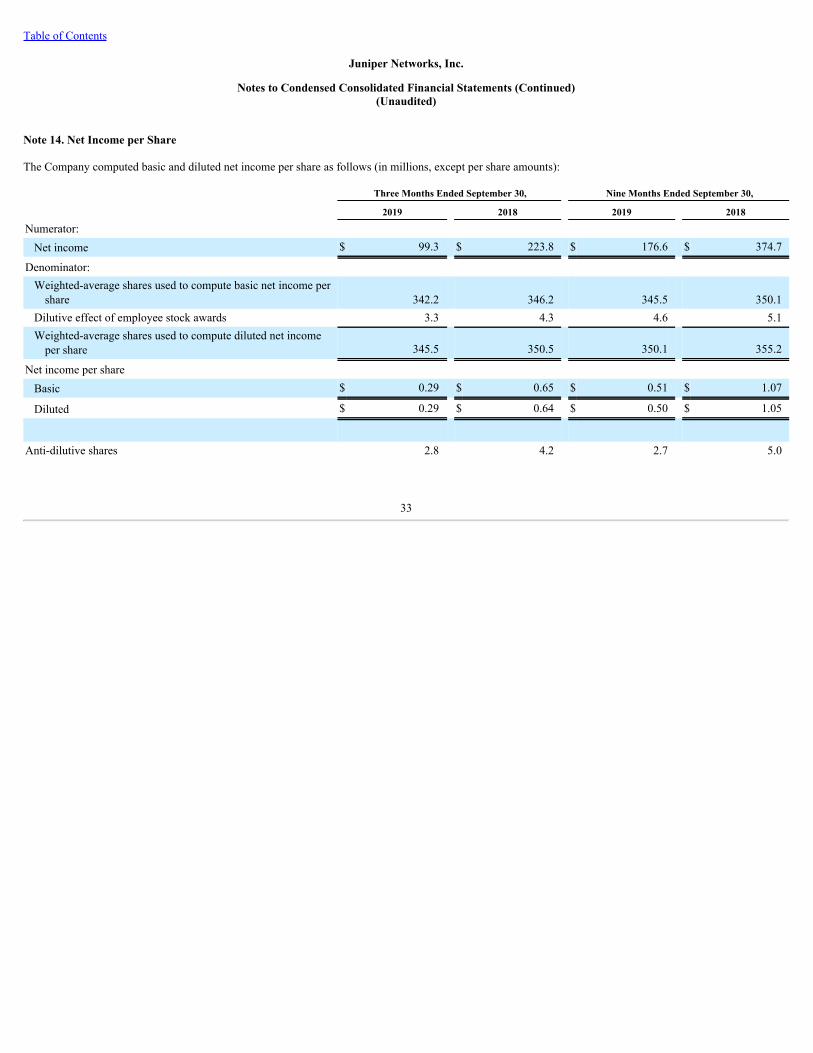
Table of Contents
Juniper Networks, Inc.
Notes to Condensed Consolidated Financial Statements (Continued)(Unaudited)
Note 14. Net Income per Share
The Company computed basic and diluted net income per share as follows (in millions, except per share amounts):
Three Months Ended September 30, Nine Months Ended September 30,
2019 2018 2019 2018
Numerator: Net income $ 99.3 $ 223.8 $ 176.6 $ 374.7
Denominator: Weighted-average shares used to compute basic net income per
share 342.2 346.2 345.5 350.1Dilutive effect of employee stock awards 3.3 4.3 4.6 5.1Weighted-average shares used to compute diluted net income
per share 345.5 350.5 350.1 355.2
Net income per share Basic $ 0.29 $ 0.65 $ 0.51 $ 1.07
Diluted $ 0.29 $ 0.64 $ 0.50 $ 1.05
Anti-dilutive shares 2.8 4.2 2.7 5.0
33

Table of Contents
Juniper Networks, Inc.
Notes to Condensed Consolidated Financial Statements (Continued)(Unaudited)
Note 15. Commitments and Contingencies
Commitments
Except for the items below, there have been no material changes to the Company's commitments compared to the commitments described in Note 16,Commitments and Contingencies, in Notes to Consolidated Financial Statements in Item 8 of Part II of the Form 10-K.
Leases
The Company leases its facilities and certain equipment under non-cancelable operating leases that have remaining lease terms of 1 to 11 years and 1 to 5 years,respectively. Each leased facility is subject to an individual lease or sublease, which could provide various options to extend or terminate the lease agreement.Facilities are primarily comprised of corporate offices, data centers, and R&D facilities. Equipment includes vehicles and various office equipment. The Companyalso has variable lease payments that are primarily comprised of common area maintenance and utility charges. The Company's lease agreements do not containany residual value guarantees or restrictive covenants.
The components of lease costs and other information related to leases were as follows (in millions, except years and percentages):
Three Months EndedSeptember 30, 2019
Nine Months EndedSeptember 30, 2019
Operating lease cost $ 12.2 $ 38.1Variable lease cost 3.4 9.1
Total lease cost $ 15.6 $ 47.2
Operating cash outflows from operating leases $ 12.7 $ 36.4ROU assets obtained in exchange for new operating lease liabilities $ 3.9 $ 5.1 Weighted average remaining lease term (years) 6.0 6.0Weighted average discount rate 4.4% 4.4%
As of September 30, 2019, future minimum operating lease payments for each of the next five years and thereafter is as follows (in millions):
Years Ending December 31, Amount
2019 $ 10.52020 49.92021 42.42022 34.52023 30.4Thereafter 63.7
Total lease payments 231.4Less: interest (27.5)
Total $ 203.9
Balance Sheet Information Other accrued liabilities 40.4Long-term operating lease liabilities 163.5
Total $ 203.9
34

Table of Contents
Juniper Networks, Inc.
Notes to Condensed Consolidated Financial Statements (Continued)(Unaudited)
Purchase Commitments with Contract Manufacturers and Suppliers
In order to reduce manufacturing lead times and in the interest of having access to adequate component supply, the Company enters into agreements with contractmanufacturers and certain suppliers to procure inventory based on the Company's requirements. A significant portion of the Company's purchase commitmentsarising from these agreements consists of firm and non-cancelable commitments. These purchase commitments totaled $1,370.5 million as of September 30, 2019.
The Company establishes a liability in connection with purchase commitments related to quantities in excess of its demand forecasts or obsolete materials chargesfor components purchased by the contract manufacturers based on the Company’s demand forecast or customer orders. As of September 30, 2019, the Companyhad accrued $29.7 million based on its estimate of such charges.
Legal Proceedings
Investigations
The Company previously disclosed that it has been the subject of investigations by the U.S. Securities and Exchange Commission ("SEC") and the U.S.Department of Justice ("DOJ") into possible violations by the Company of the U.S. Foreign Corrupt Practices Act. In cooperation with these investigations, theCompany and the Audit Committee of the Board of Directors, with the assistance of outside counsel and other independent advisors, conducted a thorough internalinvestigation. As a result of its internal investigation, the Company made significant improvements in its internal controls and carried out a number of disciplinaryactions. In the fourth quarter of 2017, the DOJ notified the Company that the DOJ has closed its investigation related to these matters without taking any actionagainst the Company, and in August 2019, the Company, without admitting or denying any fault or wrongdoing, entered into a settlement with the SEC thatresolved this government investigation. As part of the settlement with the SEC, the Company made a payment of $11.8 million. The Company had previouslyaccrued approximately $12.0 million with respect to these matters.
Other Litigations and Investigations
In addition to the investigations discussed above, the Company is involved in other investigations, disputes, litigations, and legal proceedings. The Companyrecords an accrual for loss contingencies for legal proceedings when it believes that an unfavorable outcome is both (a) probable and (b) the amount or range ofany possible loss is reasonably estimable. The Company intends to aggressively defend itself in these matters, and while there can be no assurances and theoutcome of these matters is currently not determinable, the Company currently believes that none of these existing claims or proceedings are likely to have amaterial adverse effect on its financial position. Notwithstanding the foregoing, there are many uncertainties associated with any litigation and these matters orother third-party claims against the Company may cause the Company to incur costly litigation and/or substantial settlement charges. In addition, the resolution ofany intellectual property litigation may require the Company to make royalty payments, which could adversely affect gross margins in future periods. If any ofthose events were to occur, the Company's business, financial condition, results of operations, and cash flows could be adversely affected. The actual liability inany such matters may be materially different from the Company's estimates, if any, which could result in the need to adjust the liability and record additionalexpenses.
35

Table of Contents
Juniper Networks, Inc.
Notes to Condensed Consolidated Financial Statements (Continued)(Unaudited)
Note 16. Subsequent Events
Dividend Declaration
On October 24, 2019, the Company announced that the Board declared a cash dividend of $0.19 per share of common stock to be paid on December 23, 2019 tostockholders of record as of the close of business on December 2, 2019.
Stock Repurchase Program and Activities
On October 24, 2019, the Company announced that the Board authorized the repurchase of up to an additional $1.0 billion of common stock under the 2018 StockRepurchase Program.
On October 28, 2019, the Company entered into an ASR with a financial institution to repurchase an aggregate of $200.0 million of the Company's outstandingcommon stock. The Company made an up-front payment of $200.0 million pursuant to the ASR and received and retired an initial 6.4 million shares of theCompany's common stock for an aggregate price of $160.0 million based on the market value of the Company's common stock on the date of the transaction. TheCompany has an aggregate of $1.7 billion of authorized funds remaining under the 2018 Stock Repurchase Program, as of the filing date of this Quarterly Reporton Form 10-Q.
Future share repurchases under the 2018 Stock Repurchase Program will be subject to a review of the circumstances at that time and will be made from time totime in private transactions or open market purchases as permitted by securities laws and other legal requirements. The Company's 2018 Stock RepurchaseProgram does not have a specified termination date, but may be discontinued at any time.
36

Table of Contents
Item 2. Management's Discussion and Analysis of Financial Condition and Results of Operations
This Quarterly Report on Form 10-Q, which we refer to as the Report, including “Management’s Discussion and Analysis of Financial Condition and Results ofOperations,” contains forward-looking statements regarding future events and the future results of Juniper Networks, Inc., which we refer to as “we,” “us,”"Juniper," or the “Company,” that are based on our current expectations, estimates, forecasts, and projections about our business, economic and market outlook,our results of operations, the industry in which we operate and the beliefs and assumptions of our management. Words such as “expects,” “anticipates,”“targets,” “goals,” “projects,” “would,” “will,” “could,” “may,” “intends,” “plans,” “believes,” “seeks,” “estimates,” variations of such words, and similarexpressions are intended to identify such forward-looking statements. Forward-looking statements by their nature address matters that are, to different degrees,uncertain, and these forward-looking statements are only predictions and are subject to risks, uncertainties, and assumptions that are difficult to predict.Therefore, actual results may differ materially and adversely from those expressed in any forward-looking statements. Factors that might cause or contribute tosuch differences include, but are not limited to, those discussed in this Report under the section entitled “Risk Factors” in Item 1A of Part II and elsewhere, and inother reports we file with the U.S. Securities and Exchange Commission, or the SEC. While forward-looking statements are based on reasonable expectations ofour management at the time that they are made, you should not rely on them. We undertake no obligation to revise or update publicly any forward-lookingstatements for any reason, except as required by applicable law.
The following discussion is based upon our unaudited Condensed Consolidated Financial Statements included in Part 1, Item I, of this Report, which have beenprepared in accordance with U.S. generally accepted accounting principles, or U.S. GAAP. In the course of operating our business, we routinely make decisions asto the timing of the payment of invoices, the collection of receivables, the manufacturing and shipment of products, the fulfillment of orders, the purchase ofsupplies, and the building of inventory and spare parts, among other matters. In making these decisions, we consider various factors, including contractualobligations, customer satisfaction, competition, internal and external financial targets and expectations, and financial planning objectives. Each of these decisionshas some impact on the financial results for any given period.
To aid in understanding our operating results for the periods covered by this Report, we have provided an executive overview, which includes a summary of ourbusiness and market environment along with a financial results and key performance metrics overview. These sections should be read in conjunction with the moredetailed discussion and analysis of our condensed consolidated financial condition and results of operations in this Item 2, our “Risk Factors” section included inItem 1A of Part II of this Report, and our unaudited Condensed Consolidated Financial Statements and Notes included in Item 1 of Part I of this Report, as well asour audited Consolidated Financial Statements and Notes included in Item 8 of Part II of our Annual Report on Form 10-K for the fiscal year ended December 31,2018, or Form 10-K.
Business and Market Environment
Juniper designs, develops, and sells products and services for high-performance networks to enable customers to build scalable, reliable, secure and cost-effectivenetworks for their businesses, while achieving agility and improved operating efficiency through automation.
Our products are sold in three geographic regions: Americas; Europe, Middle East and Africa, or EMEA; and Asia Pacific, or APAC. We sell our high-performance network products and service offerings across routing, switching, and security technologies. In addition to our products, we offer our customersservices, including maintenance and support, professional services, and education and training programs. Our products and services address high-performancenetwork requirements for our customers within our verticals: Cloud, Service Provider, and Enterprise, who view their network as critical to their success. Webelieve our silicon, systems, and software represent innovations that transform the economics and experience of networking, helping our customers achievesuperior performance, greater choice, and flexibility, while reducing overall total cost of ownership.
Further, our intent is to expand our software business by introducing new software solutions to our product portfolio that simplify the operation of networks, andallow our customers across our key verticals flexibility in consumption and deployment. We believe our software and related services revenues as a percentage oftotal revenues will increase over time as we introduce new software solutions designed to better monetize the value of software functionality in our offerings.
We believe the network needs for our customers in our Cloud, Service Provider, and Enterprise verticals are converging, as these customers recognize the need forhigh performance networks and are adopting cloud architectures for their infrastructure and service delivery, such as large public and private data centers andservice provider edge data centers, for improved agility and greater levels of operating efficiency.
37

Table of Contents
We remain confident in our strategy and we are executing against our innovation roadmap, as each of our industry verticals transitions to cloud architectures. Webelieve our understanding of high-performance networking technology and cloud architecture and our strategy position us to capitalize on the industry transition tomore automated, cost-efficient, scalable networks.
In the third quarter of 2019, we experienced weakness within our Service Provider vertical, which we believe is due to continued business challenges facing someof our largest Service Provider customers. We believe our relationships with our existing Service Provider customers generally remain strong and we expectService Provider revenues to decline more modestly year-over-year in 2020 as compared to 2019. Enterprise has increased sequentially over the past two quartersdriven by demand in our U.S. federal business as well as broad Enterprise strength, and we expect another sequential increase in the fourth quarter of 2019. OurCloud vertical has returned to year-over-year growth for the past two quarters and we expect our Cloud vertical to grow in the fourth quarter of 2019 as comparedto the same quarter in 2018, as we continued to see momentum within our customers' wide area networks, particularly from certain of our switching products.
38

Table of Contents
Financial Results and Key Performance Metrics Overview
The following table provides an overview of our financial results and key financial metrics (in millions, except per share amounts, percentages, and days salesoutstanding, or DSO):
Three Months Ended September 30, Nine Months Ended September 30,
2019 2018 $ Change % Change 2019 2018 $ Change % Change
Net revenues $ 1,133.1 $ 1,179.8 $ (46.7) (4)% $ 3,237.3 $ 3,466.5 $ (229.2) (7)%Gross margin $ 678.4 $ 711.0 $ (32.6) (5)% $ 1,897.5 $ 2,030.3 $ (132.8) (7)%Percentage of net revenues 59.9% 60.3% 58.6% 58.6% Operating income $ 138.5 $ 160.1 $ (21.6) (13)% $ 263.6 $ 375.4 $ (111.8) (30)%Percentage of net revenues 12.2% 13.6% 8.1% 10.8% Net income $ 99.3 $ 223.8 $ (124.5) (56)% $ 176.6 $ 374.7 $ (198.1) (53)%Percentage of net revenues 8.8% 19.0% 5.5% 10.8% Net income per share:
Basic $ 0.29 $ 0.65 $ (0.36) (55)% $ 0.51 $ 1.07 $ (0.56) (52)%Diluted $ 0.29 $ 0.64 $ (0.35) (55)% $ 0.50 $ 1.05 $ (0.55) (52)%
Operating cash flows $ 433.2 $ 648.7 $ (215.5) (33)%Stock repurchase plan activity $ 50.0 $ — $ 50.0 N/M $ 350.0 $ 750.0 $ (400.0) (53)%Cash dividends declared per
common stock $ 0.19 $ 0.18 $ 0.01 6 % $ 0.57 $ 0.54 $ 0.03 6 %
DSO 51 49 2 4 % As of
September 30,
2019 December 31,
2018 $ Change % Change
Deferred revenue $ 1,118.7 $ 1,213.6 $ (94.9) (8)%Product deferred revenue $ 129.0 $ 144.4 $ (15.4) (11)%Service deferred revenue $ 989.7 $ 1,069.2 $ (79.5) (7)%
______________________N/M - Not meaningful
• Net Revenues: Net revenues decreased during the three and nine months ended September 30, 2019, compared to the same periods in 2018, primarily dueto lower routing revenues from our Service Provider and Cloud verticals. We experienced a decline in our Service Provider vertical, which we believe isdue to continued business challenges facing some of our largest Service Provider customers. Our service net revenues increased during the three and ninemonths ended September 30, 2019, compared to the same periods in 2018, primarily due to strong renewal and attach rates of support contracts.
Of our top ten customers for the third quarter of 2019, three were in Cloud, six were in Service Provider, and one was in Enterprise. Of these customers,three were located outside of the U.S.
• Gross Margin: Our gross margin as a percentage of net revenues decreased during the three and nine months ended September 30, 2019, compared to thesame periods in 2018, primarily due to higher amortization of intangible assets associated with the acquisition of Mist, lower product revenue and to alesser extent, China tariffs, partially offset by higher service revenues and lower service delivery costs.
• Operating Margin: Our operating income as a percentage of net revenues decreased during the three and nine months ended September 30, 2019,compared to the same periods in 2018, primarily due to the drivers described in the gross margin discussion above, and higher restructuring costs duringthe first half of 2019 that we did not incur during the same period in 2018. These decreases, compared to the same periods in 2018, were partially offsetby lower litigation settlement charges and lower personnel-related expenses.
39

Table of Contents
• Operating Cash Flows: Net cash provided by operations decreased during the nine months ended September 30, 2019, compared to the same period in2018. The decrease was primarily due to lower cash collections from customers as a result of lower invoicing, partially offset by a decrease in cashpayments to suppliers.
• Capital Return: We continue to return capital to our stockholders. During the second quarter of 2019, we entered into an accelerated share repurchaseprogram (the "ASR") to purchase an aggregate of $300.0 million in shares. Under the ASR, we made an upfront payment of $300.0 million and receivedand retired 8.6 million shares of our common stock during the second quarter of 2019. During the third quarter of 2019, the ASR was completed, and wereceived and retired an additional 3.0 million shares for a total repurchase of 11.6 million shares of our common stock. During the third quarter of 2019,we also repurchased 2.1 million shares of our common stock in the open market at an average price of $23.63 per share for an aggregate purchase price of$50.0 million. During the three and nine months ended September 30, 2019, we also paid quarterly dividends of $0.19 per share, for an aggregate amountof $64.7 million and $196.4 million, respectively.
• DSO: DSO is calculated as the ratio of ending accounts receivable, net of allowances, divided by average daily net revenues for the preceding 90 days.DSO for the third quarter of 2019 slightly increased, compared to the same period in 2018, primarily due to lower customer collections.
• Deferred Revenue: Total deferred revenue decreased as of September 30, 2019, compared to December 31, 2018, primarily due to the timing of thedelivery of contractual commitments and contract renewals.
Critical Accounting Policies and Estimates
The preparation of financial statements and related disclosures in conformity with U.S. GAAP requires us to make judgments, assumptions, and estimates thataffect the amounts reported in the Condensed Consolidated Financial Statements and the accompanying notes. On an ongoing basis, we evaluate our estimates andassumptions. These estimates and assumptions are based on current facts, historical experience, and various other factors that we believe are reasonable under thecircumstances to determine reported amounts of assets, liabilities, revenues, and expenses that are not readily apparent from other sources.
During the nine months ended September 30, 2019, except for the change in accounting estimates and changes in certain accounting policies related to the adoptionof Topic 842 described in Note 2, Summary of Significant Accounting Policies, in the Notes to Condensed Consolidated Financial Statements in Item 1 of Part I ofthis Report, there were no material changes to our critical accounting policies and estimates as compared to the critical accounting policies and estimates disclosedin Management's Discussion and Analysis of Financial Condition and Results of Operations contained in Part II, Item 7 of our Form 10-K.
Recent Accounting Pronouncements
See Note 2, Summary of Significant Accounting Policies, in the Notes to Condensed Consolidated Financial Statements in Item 1 of Part I of this Report, for a fulldescription of the recently adopted accounting standards and recent accounting standards not yet adopted, including the actual and expected dates of adoption andestimated effects on our consolidated results of operations and financial condition, which is incorporated herein by reference.
40

Table of Contents
Results of Operations
Revenues
The following table presents net revenues by product and service, customer vertical(*), and geographic region (in millions, except percentages):
Three Months Ended September 30, Nine Months Ended September 30,
2019 2018 $ Change % Change 2019 2018 $ Change % Change
Routing $ 407.5 $ 496.4 $ (88.9) (18)% $ 1,199.1 $ 1,395.1 $ (196.0) (14)%Switching 241.6 221.1 20.5 9 % 633.6 705.9 (72.3) (10)%Security 94.1 77.2 16.9 22 % 243.1 229.4 13.7 6 %
Total Product 743.2 794.7 (51.5) (6)% 2,075.8 2,330.4 (254.6) (11)%Percentage of net revenues 65.6% 67.4% 64.1% 67.2% Total Service 389.9 385.1 4.8 1 % 1,161.5 1,136.1 25.4 2 %Percentage of net revenues 34.4% 32.6% 35.9% 32.8%
Total net revenues $ 1,133.1 $ 1,179.8 $ (46.7) (4)% $ 3,237.3 $ 3,466.5 $ (229.2) (7)%
Cloud $ 271.9 $ 257.1 $ 14.8 6 % $ 780.0 $ 812.4 $ (32.4) (4)%Percentage of net revenues 24.0% 21.8% 24.1% 23.4% Service Provider 452.5 545.3 (92.8) (17)% 1,335.3 1,550.3 (215.0) (14)%Percentage of net revenues 39.9% 46.2% 41.2% 44.7% Enterprise 408.7 377.4 31.3 8 % 1,122.0 1,103.8 18.2 2 %Percentage of net revenues 36.1% 32.0% 34.7% 31.9%
Total net revenues $ 1,133.1 $ 1,179.8 $ (46.7) (4)% $ 3,237.3 $ 3,466.5 $ (229.2) (7)%
Americas:
United States $ 599.4 $ 597.1 $ 2.3 — % $ 1,677.2 $ 1,754.2 $ (77.0) (4)%Other 49.4 46.0 3.4 7 % 164.0 152.2 11.8 8 %
Total Americas 648.8 643.1 5.7 1 % 1,841.2 1,906.4 (65.2) (3)%Percentage of net revenues 57.3% 54.5% 56.9% 55.0% EMEA 301.5 329.9 (28.4) (9)% 879.6 946.8 (67.2) (7)%Percentage of net revenues 26.6% 28.0% 27.2% 27.3% APAC 182.8 206.8 (24.0) (12)% 516.5 613.3 (96.8) (16)%Percentage of net revenues 16.1% 17.5% 15.9% 17.7%
Total net revenues $ 1,133.1 $ 1,179.8 $ (46.7) (4)% $ 3,237.3 $ 3,466.5 $ (229.2) (7)%________________________________(*) Certain insignificant prior-period amounts have been reclassified to conform to the current-period presentation.
Three Months Ended September 30, 2019 compared with the Three Months Ended September 30, 2018
Product net revenues decreased during the three months ended September 30, 2019, compared to the same period in 2018, primarily due to Service Provider andCloud, impacting routing, partially offset by Enterprise.
Routing revenue decreased during the three months ended September 30, 2019, compared to the same period in 2018, primarily due to a decrease in our ServiceProvider vertical resulting from lower net revenues from our MX product family.
Switching revenue increased during the three months ended September 30, 2019, compared to the same period in 2018, primarily resulting from higher netrevenues from our QFX product family in our Cloud vertical, partially offset by lower net revenues from our EX product family.
Security revenue increased during the three months ended September 30, 2019, compared to the same period in 2018, primarily driven by Enterprise, and to alesser extent, Service Provider.
Service net revenues increased slightly during the three months ended September 30, 2019, compared to the same period in 2018.
41

Table of Contents
Nine Months Ended September 30, 2019 compared with the Nine Months Ended September 30, 2018
Product net revenues decreased during the nine months ended September 30, 2019, compared to the same period in 2018, primarily due to Service Provider andCloud, impacting routing and switching.
Routing revenue decreased during the nine months ended September 30, 2019, compared to the same period in 2018, primarily due to a decrease in our ServiceProvider and Cloud verticals resulting from lower net revenues from our MX product family, partially offset by Enterprise.
Switching revenue decreased during the nine months ended September 30, 2019, compared to the same period in 2018, primarily due to a decrease, in the first halfof 2019, across all verticals resulting in lower net revenues from our QFX and EX product families.
Security revenue increased during the nine months ended September 30, 2019, compared to the same period in 2018, primarily driven by Service Provider, and to alesser extent, Enterprise.
Service net revenues increased during the nine months ended September 30, 2019, compared to the same period in 2018, due to strong renewal and attach rates ofsupport contracts.
Gross Margins
The following table presents gross margins (in millions, except percentages):
Three Months Ended September 30, Nine Months Ended September 30,
2019 2018 $ Change % Change 2019 2018 $ Change % Change
Product gross margin $ 439.2 $ 482.2 $ (43.0) (9)% $ 1,187.5 $ 1,374.9 $ (187.4) (14)%Percentage of product
revenues 59.1% 60.7% 57.2% 59.0% Service gross margin 239.2 228.8 10.4 5 % 710.0 655.4 54.6 8 %Percentage of servicerevenues 61.3% 59.4% 61.1% 57.7%
Total gross margin $ 678.4 $ 711.0 $ (32.6) (5)% $ 1,897.5 $ 2,030.3 $ (132.8) (7)%
Percentage of net revenues 59.9% 60.3% 58.6% 58.6%
Our gross margins as a percentage of net revenues have been and will continue to be affected by a variety of factors, including the mix and average selling prices ofour products and services, new product introductions and enhancements, manufacturing, component and logistics costs, expenses for inventory obsolescence andwarranty obligations, cost of support and service personnel, customer mix as we continue to expand our footprint with certain strategic customers, the mix ofdistribution channels through which our products and services are sold, and import tariffs. For example, the United States imposed a tariff on networking productsimported from China, which includes certain products that we import into and sell within the United States. For more information on the potential impact of tariffson our business, see the “Risk Factors” section of Item 1A of Part II of this Report.
Three Months Ended September 30, 2019 compared with the Three Months Ended September 30, 2018
Product gross margin
Product gross margin as a percentage of product revenues decreased during the three months ended September 30, 2019, compared to the same period in 2018,primarily due to higher amortization of intangible assets associated with the recent acquisition of Mist, lower revenues and to a lesser extent, China tariffs. Wecontinue to undertake specific efforts to address certain factors impacting our product gross margin. These efforts include performance and quality improvementsthrough engineering to increase value across our products; optimizing our supply chain and service business; pricing management; and increasing software andsolution sales; however, there can be no guarantee that these efforts will be successful or that they will be realized in the time frame we anticipate.
Service gross margin
Service gross margin as a percentage of service net revenues increased during the three months ended September 30, 2019, compared to the same period in 2018,primarily due to lower service delivery costs and higher revenue.
42
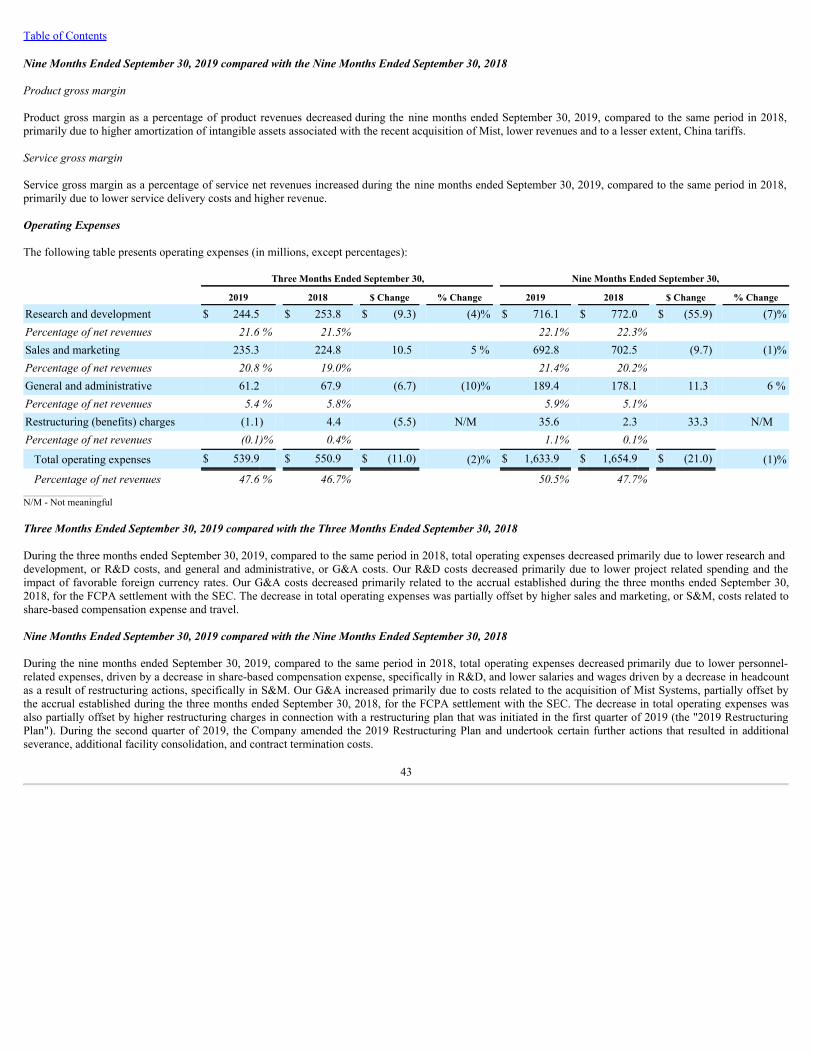
Table of Contents
Nine Months Ended September 30, 2019 compared with the Nine Months Ended September 30, 2018
Product gross margin
Product gross margin as a percentage of product revenues decreased during the nine months ended September 30, 2019, compared to the same period in 2018,primarily due to higher amortization of intangible assets associated with the recent acquisition of Mist, lower revenues and to a lesser extent, China tariffs.
Service gross margin
Service gross margin as a percentage of service net revenues increased during the nine months ended September 30, 2019, compared to the same period in 2018,primarily due to lower service delivery costs and higher revenue.
Operating Expenses
The following table presents operating expenses (in millions, except percentages):
Three Months Ended September 30, Nine Months Ended September 30,
2019 2018 $ Change % Change 2019 2018 $ Change % Change
Research and development $ 244.5 $ 253.8 $ (9.3) (4)% $ 716.1 $ 772.0 $ (55.9) (7)%Percentage of net revenues 21.6 % 21.5% 22.1% 22.3% Sales and marketing 235.3 224.8 10.5 5 % 692.8 702.5 (9.7) (1)%Percentage of net revenues 20.8 % 19.0% 21.4% 20.2% General and administrative 61.2 67.9 (6.7) (10)% 189.4 178.1 11.3 6 %Percentage of net revenues 5.4 % 5.8% 5.9% 5.1% Restructuring (benefits) charges (1.1) 4.4 (5.5) N/M 35.6 2.3 33.3 N/MPercentage of net revenues (0.1)% 0.4% 1.1% 0.1%
Total operating expenses $ 539.9 $ 550.9 $ (11.0) (2)% $ 1,633.9 $ 1,654.9 $ (21.0) (1)%
Percentage of net revenues 47.6 % 46.7% 50.5% 47.7% ______________________N/M - Not meaningful
Three Months Ended September 30, 2019 compared with the Three Months Ended September 30, 2018
During the three months ended September 30, 2019, compared to the same period in 2018, total operating expenses decreased primarily due to lower research anddevelopment, or R&D costs, and general and administrative, or G&A costs. Our R&D costs decreased primarily due to lower project related spending and theimpact of favorable foreign currency rates. Our G&A costs decreased primarily related to the accrual established during the three months ended September 30,2018, for the FCPA settlement with the SEC. The decrease in total operating expenses was partially offset by higher sales and marketing, or S&M, costs related toshare-based compensation expense and travel.
Nine Months Ended September 30, 2019 compared with the Nine Months Ended September 30, 2018
During the nine months ended September 30, 2019, compared to the same period in 2018, total operating expenses decreased primarily due to lower personnel-related expenses, driven by a decrease in share-based compensation expense, specifically in R&D, and lower salaries and wages driven by a decrease in headcountas a result of restructuring actions, specifically in S&M. Our G&A increased primarily due to costs related to the acquisition of Mist Systems, partially offset bythe accrual established during the three months ended September 30, 2018, for the FCPA settlement with the SEC. The decrease in total operating expenses wasalso partially offset by higher restructuring charges in connection with a restructuring plan that was initiated in the first quarter of 2019 (the "2019 RestructuringPlan"). During the second quarter of 2019, the Company amended the 2019 Restructuring Plan and undertook certain further actions that resulted in additionalseverance, additional facility consolidation, and contract termination costs.
43

Table of Contents
Other Expense, Net
The following table presents other expense, net (in millions, except percentages):
Three Months Ended September 30, Nine Months Ended September 30,
2019 2018 $ Change % Change 2019 2018 $ Change % Change
Interest income $ 19.7 $ 18.9 $ 0.8 4 % $ 63.0 $ 49.8 $ 13.2 27 %Interest expense (22.1) (25.8) 3.7 (14)% (68.3) (77.7) 9.4 (12)%Loss on extinguishment of debt (15.3) — (15.3) N/M (15.3) — (15.3) N/MLoss on investments, net (3.4) (1.9) (1.5) 79 % (4.6) (1.8) (2.8) 156 %Other 0.7 0.7 — — % 2.0 (1.4) 3.4 N/M
Total other expense, net $ (20.4) $ (8.1) $ (12.3) 152 % $ (23.2) $ (31.1) $ 7.9 (25)%
Percentage of net revenues (1.8)% (0.7)% (0.7)% (0.9)% ______________________N/M - Not meaningful
Three Months Ended September 30, 2019 compared with the Three Months Ended September 30, 2018
Total other expense, net increased during the three months ended September 30, 2019, compared to the same period in 2018, primarily due to a loss onextinguishment of debt.
Nine Months Ended September 30, 2019 compared with the Nine Months Ended September 30, 2018
Total other expense, net decreased during the nine months ended September 30, 2019, compared to the same period in 2018, primarily due to an increase in interestincome related to our fixed income investment portfolio, as a result of higher yields, partially offset by a loss on extinguishment of debt.
44

Table of Contents
Income Tax Provision (Benefit)
Three Months Ended September 30, Nine Months Ended September 30,
2019 2018 $ Change % Change 2019 2018 $ Change % ChangeIncome tax provision(benefit) $ 18.8 $ (71.8) $ 90.6 (126)% $ 63.8 $ (30.4) $ 94.2 (310)%Effective tax rate (benefit) 15.9% (47.2)% 26.5% (8.8)%
The effective tax rate increased during the three and nine months ended September 30, 2019, compared to the same periods in 2018, primarily due to a change inthe level of discrete items in the comparative period. For further explanation of our income tax provision, see Note 13, Income Taxes, in Notes to CondensedConsolidated Financial Statements in Item 1 of Part I of this Report.
On July 24, 2018, the Ninth Circuit Court of Appeals, or the Court, issued an opinion in Altera Corp. v. Commissioner requiring related parties in an intercompanycost-sharing arrangement to share expenses related to share-based compensation. On June 7, 2019, the Court upheld the cost-sharing regulations, subject to theright of appeal by Altera. On July 22, 2019, Altera petitioned the Court for rehearing. We will continue to monitor ongoing developments and potential impacts toour financial statements. If a judicial decision against Altera had been finalized in the reporting period, our effective tax rate for the three and nine months endedSeptember 30, 2019 would have been higher.
Our effective tax rate may fluctuate significantly on a quarterly basis and may be adversely affected by lower than anticipated earnings in countries that have lowerstatutory rates or higher than anticipated earnings in countries that have higher statutory rates, by the effect of U.S. income tax on certain foreign earnings andthrough the imposition of base-erosion prevention measures, which may limit the deduction of certain transfer pricing payments. Our effective tax rate may alsofluctuate due to changes in the valuation of our deferred tax assets or liabilities, or by changes in tax laws, regulations, or accounting principles, as well as certaindiscrete items. See the "Risk Factors" section of Item 1A of Part II of this Report for a description of relevant risks which may adversely affect our results.
As a result of recommendations by the Organisation for Economic Cooperation and Development (OECD), on Base Erosion and Profit Shifting, certain countrieshave either enacted new corporate tax legislation or are considering enacting such legislation in the near future. We expect the effect of these reform measures topotentially impact long-standing tax principles, particularly in regard to transfer pricing. Consequently, we expect global tax authorities to increasingly challengeour cost sharing and other intercompany arrangements, and the related sourcing of taxable profits in global jurisdictions.
45
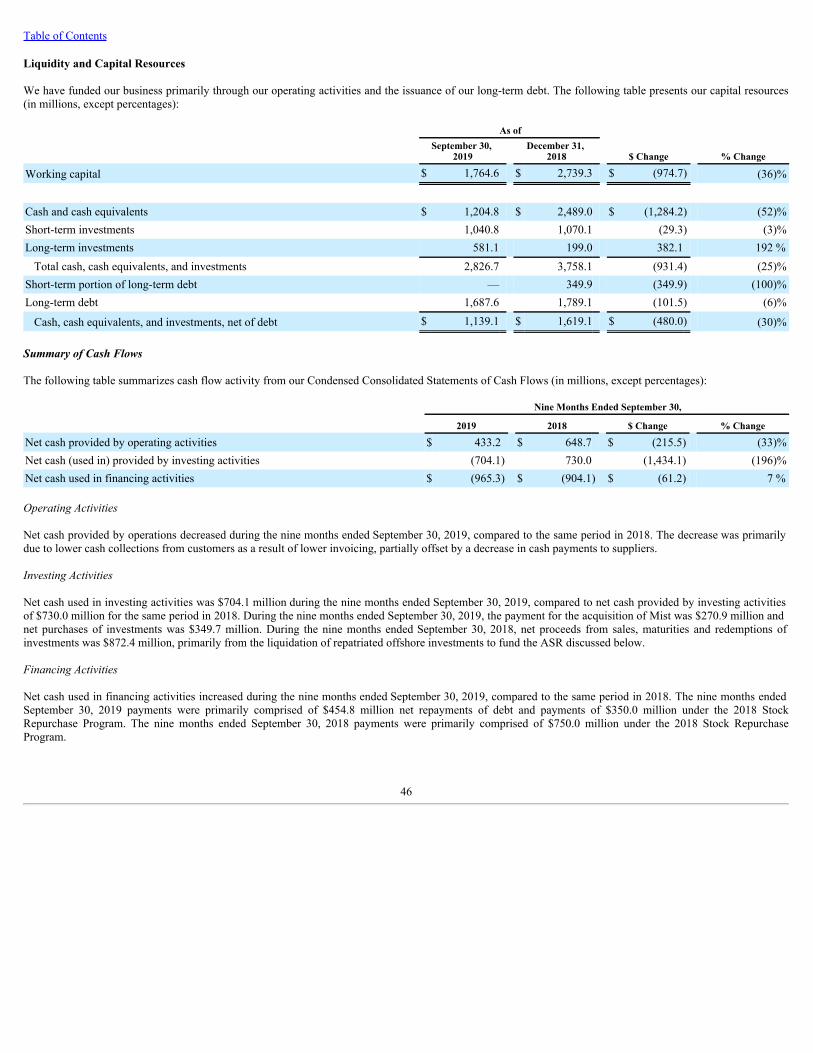
Table of Contents
Liquidity and Capital Resources
We have funded our business primarily through our operating activities and the issuance of our long-term debt. The following table presents our capital resources(in millions, except percentages):
As of
September 30,
2019 December 31,
2018 $ Change % Change
Working capital $ 1,764.6 $ 2,739.3 $ (974.7) (36)% Cash and cash equivalents $ 1,204.8 $ 2,489.0 $ (1,284.2) (52)%Short-term investments 1,040.8 1,070.1 (29.3) (3)%Long-term investments 581.1 199.0 382.1 192 %
Total cash, cash equivalents, and investments 2,826.7 3,758.1 (931.4) (25)%Short-term portion of long-term debt — 349.9 (349.9) (100)%Long-term debt 1,687.6 1,789.1 (101.5) (6)%
Cash, cash equivalents, and investments, net of debt $ 1,139.1 $ 1,619.1 $ (480.0) (30)%
Summary of Cash Flows
The following table summarizes cash flow activity from our Condensed Consolidated Statements of Cash Flows (in millions, except percentages):
Nine Months Ended September 30,
2019 2018 $ Change % Change
Net cash provided by operating activities $ 433.2 $ 648.7 $ (215.5) (33)%Net cash (used in) provided by investing activities (704.1) 730.0 (1,434.1) (196)%Net cash used in financing activities $ (965.3) $ (904.1) $ (61.2) 7 %
Operating Activities
Net cash provided by operations decreased during the nine months ended September 30, 2019, compared to the same period in 2018. The decrease was primarilydue to lower cash collections from customers as a result of lower invoicing, partially offset by a decrease in cash payments to suppliers.
Investing Activities
Net cash used in investing activities was $704.1 million during the nine months ended September 30, 2019, compared to net cash provided by investing activitiesof $730.0 million for the same period in 2018. During the nine months ended September 30, 2019, the payment for the acquisition of Mist was $270.9 million andnet purchases of investments was $349.7 million. During the nine months ended September 30, 2018, net proceeds from sales, maturities and redemptions ofinvestments was $872.4 million, primarily from the liquidation of repatriated offshore investments to fund the ASR discussed below.
Financing Activities
Net cash used in financing activities increased during the nine months ended September 30, 2019, compared to the same period in 2018. The nine months endedSeptember 30, 2019 payments were primarily comprised of $454.8 million net repayments of debt and payments of $350.0 million under the 2018 StockRepurchase Program. The nine months ended September 30, 2018 payments were primarily comprised of $750.0 million under the 2018 Stock RepurchaseProgram.
46
Table of Contents
Capital Return
In January 2018, our Board of Directors, which we refer to as the Board, approved a $2.0 billion share repurchase program, which we refer to as the 2018 StockRepurchase Program. As part of the 2018 Stock Repurchase Program, in February 2018, we entered into an ASR to repurchase $750.0 million of our commonstock. We made an up-front payment of $750.0 million pursuant to the ASR to repurchase our common stock. The aggregate number of shares ultimatelyrepurchased of 29.3 million shares of common stock was determined based on a volume weighted average repurchase price, less an agreed upon discount, of$25.62 per share.
On April 29, 2019, we entered into an ASR, to repurchase an aggregate of approximately $300.0 million of our outstanding common stock. During the secondquarter of 2019, we made an up-front payment of $300.0 million pursuant to the ASR and received and retired an initial 8.6 million shares of our common stock foran aggregate price of $240.0 million based on the market value of our common stock on the date of the transaction. During the third quarter of 2019, the ASR wascompleted, and we received and retired an additional 3.0 million shares, based on volume weighted average repurchase price, less an agreed upon discount, of$25.79 per share. The completion of the ASR resulted in a total repurchase of 11.6 million shares of our common stock.
During the third quarter of 2019, we also repurchased 2.1 million shares of our common stock in the open market for an aggregate purchase price of $50.0 millionat an average price of $23.63 per share.
As of September 30, 2019, there was approximately $900.0 million of authorized funds remaining under the 2018 Stock Repurchase Program.
On October 24, 2019, we announced that the Board authorized the repurchase of up to an additional $1.0 billion of common stock under the 2018 StockRepurchase Program. On October 28, 2019, we entered into an ASR with a financial institution to repurchase an aggregate of $200.0 million of our outstandingcommon stock (the “October 2019 ASR”). We made an up-front payment of $200.0 million pursuant to the October 2019 ASR and received and retired an initial6.4 million shares of our common stock for an aggregate price of $160.0 million based on the market value of our common stock on the date of the transaction. Wehave an aggregate of $1.7 billion of authorized funds remaining under the 2018 Stock Repurchase Program, as of the filing of this Quarterly Report on Form 10-Q.
Future share repurchases under the 2018 Stock Repurchase Program will be subject to a review of the circumstances at that time and will be made from time totime in private transactions or open market purchases as permitted by securities laws and other legal requirements. Our 2018 Stock Repurchase Program does nothave a specified termination date, but may be discontinued at any time. See Note 10, Equity, in the Notes to Condensed Consolidated Financial Statements in Item1 of Part I of this Report for further discussion of our share purchase program.
We declared and paid a quarterly cash dividend of $0.19 per share, totaling $64.7 million and $196.4 million during the three and nine months endedSeptember 30, 2019, respectively. Any future dividends, and the establishment of record and payment dates, are subject to approval by the Board or an authorizedcommittee thereof. See Note 16, Subsequent Events, in the Notes to Condensed Consolidated Financial Statements in Item 1 of Part I of this Report for discussionof our dividend declaration subsequent to September 30, 2019.
Contractual Obligations
As of September 30, 2019, our principal commitments consist of obligations under operating leases, purchase commitments, debt, and other contractualobligations. There have been no significant changes to these obligations, during the three months ended September 30, 2019 compared to the contractualobligations disclosed in Management's Discussion and Analysis of Financial Condition and Results of Operations, set forth in Part II, Item 7, of our Annual Reporton Form 10-K for the fiscal year ended December 31, 2018, other than the obligations listed in the table below (in millions):
Payments Due by Period
Total Less than
1 year 1-3 years 3-5 years More than
5 years
3.750% fixed-rate notes(*) $ 500.0 $ — $ — $ — $ 500.0_______________________________(*) See Note 9, Debt, in Notes to Condensed Consolidated Financial Statements in Item 1 of Part I of this Report for additional information regarding our debt.
47
Table of Contents
Revolving Credit Facility
In April 2019, we entered into a new credit agreement with certain institutional lenders that provides for a five-year $500.0 million unsecured revolving creditfacility (the “Revolving Credit Facility”), with an option to increase the Revolving Credit Facility by up to an additional $200.0 million, subject to the lenders'approval. The Prior Revolving Credit Facility was terminated substantially concurrently with our entering into the Revolving Credit Facility. The Revolving CreditFacility will terminate in April 2024, subject to two one-year maturity extension options, on the terms and conditions as set forth in the credit agreement. As ofSeptember 30, 2019, we were in compliance with all covenants in the Credit Agreement, and no amounts were outstanding.
Liquidity and Capital Resource Requirements
Liquidity and capital resources may be impacted by our operating activities as well as acquisitions, investments in strategic relationships, repurchases of additionalshares of our common stock, and payment of cash dividends on our common stock. Following the enactment of the Tax Cuts and Jobs Act of 2017 (the “Tax Act”),we repatriated approximately $3.0 billion of our cash, cash equivalents, and investments balance from outside of the U.S. as of September 30, 2019. We expect thenew territorial tax system to provide us with lower cost access to nearly all of our global free cash flow on an ongoing basis. Free cash flow is calculated as netcash provided by operating activities less capital expenditures. We intend to use the repatriated cash to invest in the business, support value-enhancing merger andacquisitions, or M&A, and fund our return of capital to stockholders. See Note 16, Subsequent Events, in Notes to Condensed Consolidated Financial Statements inItem 1 of Part I of this Report for our subsequent events impacting liquidity.
Based on past performance and current expectations, we believe that our existing cash and cash equivalents, short-term, and long-term investments, together withcash generated from operations and access to capital markets and the revolving credit facility will be sufficient to fund our operations; planned stock repurchasesand dividends; capital expenditures; commitments and other liquidity requirements; and anticipated growth for at least the next twelve months. However, ourfuture liquidity and capital requirements may vary materially from those now planned depending on many factors, including, but not limited to, our growth rate;the timing and amount we spend to support development efforts; the expansion of sales and marketing activities; the introduction of new and enhanced productsand services; the costs to acquire or invest in businesses and technologies; an increase in manufacturing or component costs; and the risks and uncertainties detailedin the “Risk Factors” section of Item 1A of Part II of this Report.
48

Table of Contents
Item 3. Quantitative and Qualitative Disclosures About Market Risk
Our exposures to market risk have not changed materially since December 31, 2018. For quantitative and qualitative disclosures about market risk, see Item 7AQuantitative and Qualitative Disclosures about Market Risk, in our Form 10-K.
Item 4. Controls and Procedures
Evaluation of Disclosure Controls and Procedures
Attached as exhibits to this Report are certifications of our principal executive officer and principal financial officer, which are required in accordance withRule 13a-14 of the Securities Exchange Act of 1934, as amended (the “Exchange Act”). This “Controls and Procedures” section includes information concerningthe controls and related evaluations referred to in the certifications and it should be read in conjunction with the certifications for a more complete understanding ofthe topics presented.
We carried out an evaluation, under the supervision and with the participation of our management, including our principal executive officer and principal financialofficer, of the effectiveness of the design and operation of our disclosure controls and procedures, as defined in Rules 13a-15(e) and 15d-15(e) under the ExchangeAct. Based upon that evaluation, our principal executive officer and principal financial officer concluded that, as of the end of the period covered in this Report,our disclosure controls and procedures were effective to ensure that information required to be disclosed by us in reports that we file or submit under the ExchangeAct is recorded, processed, summarized, and reported within the time periods specified in SEC rules and forms and is accumulated and communicated to ourmanagement, including our principal executive officer and principal financial officer, as appropriate to allow timely decisions regarding required disclosure.
Changes in Internal Controls Over Financial Reporting
There were no changes in our internal control over financial reporting during the third quarter of 2019 that have materially affected, or are reasonably likely tomaterially affect, our internal control over financial reporting.
49

Table of Contents
PART II — OTHER INFORMATION
Item 1. Legal Proceedings
The information set forth under the “Legal Proceedings” section in Note 15, Commitments and Contingencies, in Notes to Condensed Consolidated FinancialStatements in Item 1 of Part I of this Report, is incorporated herein by reference.
Item 1A. Risk Factors
Factors That May Affect Future Results
Investments in our securities involve significant risks. Even small changes in investor expectations for our future growth and earnings, whether as a result of actualor rumored financial or operating results, changes in the mix of the products and services sold, acquisitions, industry changes, or other factors, could trigger, andhave triggered in the past, significant fluctuations in the market price of our common stock. Investors in our securities should carefully consider all of the relevantfactors disclosed by us, including, but not limited to, the following factors, that could affect our business, operating results, and stock price.
Our quarterly results are unpredictable and subject to substantial fluctuations; as a result, we may fail to meet the expectations of securities analysts andinvestors, which could adversely affect the trading price of our common stock.
Our revenues and operating results may vary significantly from quarter-to-quarter due to a number of factors, many of which are outside of our control and any ofwhich may cause our stock price to fluctuate.
The factors that may cause our quarterly results to vary quarter by quarter and be unpredictable include, but are not limited to:
• unpredictable ordering patterns and limited or reduced visibility into our customers’ spending plans and associated revenue;• changes in customer mix;• changes in the demand for our products and services;• changes in the mix of products and services sold;• changes in the mix of geographies in which our products and services are sold;• changing market and economic conditions, including the impact of tariffs;• current and potential customer, partner and supplier consolidation and concentration;• price and product competition;• long sales, qualification and implementation cycles;• success in new and evolving markets and emerging technologies;• how well we execute on our strategy and operating plans and the impact of changes in our business model that could result in significant restructuring
charges;• ability of our customers, channel partners, contract manufacturers and suppliers to purchase, market, sell, manufacture or supply our products (or
components of our products) and services;• financial stability of our customers, including the solvency of private sector customers and statutory authority for government customers to purchase
goods and services;• our ability to achieve targeted cost reductions;• changes in tax laws or accounting rules, or interpretations thereof;• changes in the amount and frequency of share repurchases or dividends;• regional economic and political conditions; and• seasonality.
For example, we, and many companies in our industry, experience adverse seasonal fluctuations in customer spending, particularly in the first quarter. In addition,while we may have backlog orders for products that have not shipped, we believe that our backlog may not be a reliable indicator of future operating results for anumber of reasons, including, but not limited to, project delays, changes in project scope and the fact that our customers may cancel purchase orders or changedelivery schedules without significant penalty. Furthermore, market trends, competitive pressures, commoditization of products, rebates and discounting, increasedcomponent, manufacturing or logistics costs, issues with product or service quality (including the quality of our components), regulatory impacts, tariffs and otherfactors may result in reductions in revenue or pressure on gross margins in a given period, which may necessitate adjustments to our operations. Such adjustmentsmay be difficult or impossible to execute in the short or medium term.
50

Table of Contents
As a result of the factors described above, as well as other variables affecting our operating results, we believe that quarter-to-quarter comparisons of operatingresults are not necessarily a good indication of what our future performance will be. In some prior periods, our operating results have been below our guidance, ourlong-term financial model or the expectations of securities analysts or investors, which has at times coincided with a decline in the price of our common stock. Thismay happen again in the future, in which case the price of our common stock may decline. Such a decline could also occur, and has occurred in the past, even whenwe have met our publicly stated revenues and/or earnings guidance.
We expect our gross margins and operating margins to vary over time.
We expect our product and service gross margins to vary, both in the near-term and in the long-term, and may be adversely affected in the future by numerousfactors, some of which have occurred and may occur in the future, including customer, vertical, product and geographic mix shifts, an increase or decrease in oursoftware sales or services we provide, increased price competition in one or more of the markets in which we compete, changes in the actions of our competitors ortheir pricing strategies, which may be difficult to predict and respond to, modifications to our pricing strategy in order to gain footprint in certain markets or withcertain customers, currency fluctuations that impact our costs or the cost of our products and services to our customers, increases in material, labor, logistics,warranty costs, or inventory carrying costs, excess product component or obsolescence charges from our contract manufacturers, issues with manufacturing orcomponent availability, quality or efficiencies, increased costs due to changes in component pricing or charges incurred due to inaccurately forecasting productdemand, warranty related issues, the impact of tariffs, or our introduction of new products and enhancements or entry into new markets with different pricing andcost structures. For example, in fiscal year 2018, our margins decreased as compared to fiscal year 2017, primarily due to lower net revenues and product mix. Infiscal year 2017, our margins decreased as compared to fiscal year 2016, primarily due to lower product net revenues and product mix, resulting from the year-over-year decline in routing revenues, our customers' architectural shifts, and higher costs of certain memory components. In fiscal year 2016, our marginsdecreased compared to fiscal year 2015, primarily due to elevated pricing pressure and product mix. Failure to sustain or improve our gross margins reduces ourprofitability and may have a material adverse effect on our business and stock price.
Further, while we will continue to remain diligent in our long-term financial objective to increase revenue and operating margins and manage our operatingexpenses as a percentage of revenue, we expect that our margins will vary with our ability to achieve these goals. We can provide no assurance that we will be ableto achieve all or any of the goals of these plans or meet our announced expectations, in whole or in part, or that our plans will have the intended effect of improvingour margins on the expected timeline, or at all.
A limited number of our customers comprise a material portion of our revenues and any changes in the way they purchase products and services from us couldaffect our business. In addition, there is an ongoing trend toward consolidation in the industry in which our customers and partners operate. Any decrease inrevenues from our customers or partners could have an adverse effect on our net revenues and operating results.
A material portion of our net revenues, across each customer vertical, depends on sales to a limited number of customers and distribution partners. Changes in thebusiness requirements or focus, vendor selection, project prioritization, financial prospects, capital resources, and expenditures, or purchasing behavior (includingproduct mix purchased or delays in deployment) of our key customers could significantly decrease our sales to such customers or could lead to delays orcancellations of planned purchases of our products or services, which increases the risk of quarterly fluctuations in our revenues and operating results. Any of thesefactors could adversely affect our business, financial condition, and results of operations.
In addition, in recent years, there has been movement towards consolidation in the telecommunications industry (for example, CenturyLink, Inc.'s acquisition ofLevel 3 Communications, Inc., Vodafone India’s acquisition of Idea Cellular Ltd. and T-Mobile US, Inc.'s proposed acquisition of Sprint Corp., which wasrecently approved by the U.S. Justice Department.) and that consolidation trend has continued. Certain telecommunications companies have also moved towardsvertical consolidation through acquisitions of media and content companies, such as Verizon’s acquisition of Yahoo, AT&T’s acquisition of Time Warner, andComcast's acquisition of Sky. If our customers or partners are parties to consolidation transactions they may delay, suspend or indefinitely reduce or cancel theirpurchases of our products or other direct or indirect unforeseen consequences could harm our business, financial condition, and results of operations.
Fluctuating economic conditions make it difficult to predict revenues and gross margin for a particular period and a shortfall in revenues or increase in costsof production may harm our operating results.
Our revenues and gross margin depend significantly on general economic conditions and the demand for products in the markets in which we compete. Economicweakness or uncertainty, customer financial difficulties, and constrained spending on network
51
Table of Contents
expansion and enterprise infrastructure have in the past resulted in, and may in the future result in, decreased revenues and earnings. Such factors could make itdifficult to accurately forecast revenues and operating results and could negatively affect our ability to provide accurate forecasts to our contract manufacturers andmanage our contract manufacturer relationships and other expenses. In addition, economic instability or uncertainty, as well as continued turmoil in thegeopolitical environment in many parts of the world, have, and may continue to, put pressure on economic conditions, which has led and could lead, to reduceddemand for our products, to delays or reductions in network expansions or infrastructure projects, and/or higher costs of production. More generally-speaking,economic weakness may also lead to longer collection cycles for payments due from our customers, an increase in customer bad debt, restructuring initiatives andassociated expenses, and impairment of investments. Furthermore, instability in the global markets may adversely impact the ability of our customers to adequatelyfund their expected expenditures, which could lead to delays or cancellations of planned purchases of our products or services. Our operating expenses are largelybased on anticipated revenue trends and a high percentage of our expenses is, and will continue to be, fixed in the short and medium term. Uncertainty about futureeconomic conditions also makes it difficult to forecast operating results and to make decisions about future investments. Future or continued economic weakness,failure of our customers and markets to recover from such weakness, customer financial difficulties, increases in costs of production, and reductions in spending onnetwork maintenance and expansion could result in price concessions in certain markets or have a material adverse effect on demand for our products andconsequently on our business, financial condition, and results of operations.
Our success depends upon our ability to effectively plan and manage our resources and restructure our business through rapidly fluctuating economic andmarket conditions, and such actions may have an adverse effect on our financial and operating results.
Our ability to successfully offer our products and services in a rapidly evolving market requires an effective planning, forecasting, and management process toenable us to effectively scale and adjust our business and business models in response to fluctuating market opportunities and conditions.
From time to time, we have increased investment in our business by, for example, increasing headcount, acquiring companies, and increasing our investment inR&D, sales and marketing, and other parts of our business. Conversely, in 2017, 2018, and 2019, we initiated restructuring plans to realign our workforce as aresult of organizational and leadership changes, align our execution priorities, increase operational efficiencies, and to consolidate facilities which resulted inrestructuring charges in each of these years. Some of our expenses related to such efforts are fixed costs that cannot be rapidly or easily adjusted in response tofluctuations in our business or numbers of employees. Rapid changes in the size, alignment or organization of our workforce, including sales account coverage,could adversely affect our ability to develop and deliver products and services as planned or impair our ability to realize our current or future business and financialobjectives. Our ability to achieve the anticipated cost savings and other benefits from our restructuring initiatives within the expected time frame is subject to manyestimates and assumptions, which are subject to significant economic, competitive and other uncertainties, some of which are beyond our control. If these estimatesand assumptions are incorrect, if we are unsuccessful at implementing changes, or if other unforeseen events occur, our business and results of operations could beadversely affected.
We face intense competition that could reduce our revenues and adversely affect our business and financial results.
Competition is intense in the markets that we serve. The routing and switching markets have historically been dominated by Cisco Systems, Inc., or Cisco, withcompetition coming from other companies such as Nokia Corporation, Arista Networks, Inc., and Huawei Technologies Co., Ltd. In the security market, we faceintense competition from Cisco and Palo Alto Networks, Inc., as well as companies such as Check Point Software Technologies, Ltd., and Fortinet, Inc. Further, anumber of other small public and private companies have products or have announced plans for new products to address the same challenges and markets that ourproducts address.
In addition, actual or speculated consolidation among competitors, or the acquisition by, or of, our partners and/or resellers by competitors can increase thecompetitive pressures faced by us as customers may delay spending decisions or not purchase our products at all. A number of our competitors have substantiallygreater resources and can offer a wider range of products and services for the overall network equipment market than we do. In addition, some of our competitorshave become more integrated, including through consolidation and vertical integration, and offer a broader range of products and services, which could make theirsolutions more attractive to our customers. Many of our competitors sell networking products as bundled solutions with other IT products, such as computer andstorage systems. If we are unable to compete successfully against existing and future competitors on the basis of product offerings or price, we could experience aloss in market share and revenues and/or be required to reduce prices, which could reduce our gross margins, and which could materially and adversely affect ourbusiness, financial condition, and results of operations. Our partners and resellers generally sell or resell competing products on a non-exclusive basis andconsolidation could delay spending or require us to increase discounts to compete, which could also adversely affect our business.
52
Table of Contents
The long sales and implementation cycles for our products, as well as our expectation that some customers will sporadically place large orders with short leadtimes, may cause our revenues and operating results to vary significantly from quarter-to-quarter.
A customer's decision to purchase certain of our products, particularly new products, involves a significant commitment of its resources and a lengthy evaluationand product qualification process. As a result, the sales cycle may be lengthy. In particular, customers making critical decisions regarding the design andimplementation of large network deployments may engage in very lengthy procurement processes that may delay or impact expected future orders. Throughout thesales cycle, we may spend considerable time educating and providing information to prospective customers regarding the use and benefits of our products. Evenafter making the decision to purchase, customers may deploy our products slowly and deliberately. Timing of deployment can vary widely and depends on the skillset of the customer, the size of the network deployment, the complexity of the customer's network environment, and the degree of hardware and operating systemconfiguration necessary to deploy the products. Customers with large networks usually expand their networks in large increments on a periodic basis. Accordingly,we may receive purchase orders for significant dollar amounts on an irregular basis. These long cycles, as well as our expectation that customers will tend tosporadically place large orders with short lead times, both of which may be exacerbated by the impact of global economic weakness, may cause revenues andoperating results to vary significantly and unexpectedly from quarter-to-quarter.
The timing of product orders and deliveries and/or our reliance on revenue from sales of certain software or subscriptions and professional, support andmaintenance services may cause us to recognize revenue in a different period than the one in which a transaction takes place.
Due to the cost, complexity and custom nature of configurations required by our customers, we generally build our network equipment products as orders arereceived. The volume of orders received late in any given fiscal quarter remains unpredictable. If orders for certain products are received late in any quarter, wemay not be able to recognize revenue for these orders in the same period, which could adversely affect our ability to meet our expected revenues for such quarter.Similarly, if we were to take actions to encourage customers to place orders or accept deliveries earlier than anticipated, our ability to meet our expected revenuesin future quarters could be adversely affected.
In addition, services revenue accounts for a significant portion of our revenue, comprising 33%, 31%, and 29% of total revenue in fiscal year 2018, 2017, and2016, respectively. Sales of new or renewal professional services, support and maintenance contracts may decline and/or fluctuate as a result of a number offactors, including end-customers’ level of satisfaction with our products and services, the prices of our products and services or those offered by our competitors,and reductions in our end-customers’ spending levels. We recognize professional services, support and maintenance revenue periodically over the term of therelevant service period.
The introduction of new software products and services is part of our intended strategy to expand our software business, and certain software revenues may berecognized periodically over the term of the relevant use period or subscription period. As a result, certain software, subscription and support and maintenancerevenue we report each fiscal quarter is the recognition of deferred revenue from contracts entered into during previous fiscal quarters. Consequently, a decline insuch new or renewed contracts in any one fiscal quarter will not be fully or immediately reflected in revenue in that fiscal quarter but will negatively affect ourrevenue in future fiscal quarters. Accordingly, the effect of significant downturns in new or renewed sales of certain software products, subscriptions or supportand maintenance is not reflected in full in our operating results until future periods. Also, it is difficult for us to rapidly increase such software or services revenuethrough additional sales in any period, as revenue from those software, subscription and support and maintenance contracts must be recognized over the applicableperiod.
Additionally, we determine our operating expenses largely on the basis of our anticipated revenues and technology roadmap and a high percentage of our expensesare fixed in the short and medium term. As a result, a failure or delay in generating or recognizing revenue could cause significant variations in our operatingresults and operating margin from quarter-to-quarter.
We sell our products to customers that use those products to build networks and IP infrastructure, and if the demand for network and IP systems does notcontinue to grow, our business, financial condition, and results of operations could be adversely affected.
A substantial portion of our business and revenues depends on the growth of secure IP infrastructure and customers that depend on the continued growth of IPservices to deploy our products in their networks and IP infrastructures. As a result of changes in the economy, capital spending or the building of network capacityin excess of demand (all of which, have in the past, particularly affected telecommunications service providers), spending on IP infrastructure can vary, whichcould have a material adverse effect
53

Table of Contents
on our business, financial condition, and results of operations. In addition, a number of our existing customers are evaluating the build-out of their next generationnetworks. During the decision-making period when our customers are determining the design of those networks and the selection of the software and equipmentthey will use in those networks, such customers may greatly reduce or suspend their spending on secure IP infrastructure. For example, in recent years, ourswitching and routing results were adversely affected by spending delays from our largest Cloud customers, who we believe are in the process of implementing anetworking architectural shift. The duration of the delay is difficult to predict, in part because each Cloud customer will migrate their network architecture based ontheir own constraints. Such delays in purchases can make it more difficult to predict revenues from customers, can cause fluctuations in the level of spending bycustomers and, even where our products are ultimately selected, can have a material adverse effect on our business, financial condition, and results of operations.
If we do not successfully anticipate technological shifts, market needs and opportunities, and develop products, product enhancements and business strategiesthat meet those technological shifts, needs and opportunities, or if those products are not made available or strategies are not executed in a timely manner ordo not gain market acceptance, we may not be able to compete effectively and our ability to generate revenues will suffer.
The markets for our products are characterized by rapid technological change, frequent new product introductions, changes in customer requirements, continuouspricing pressures and a constantly evolving industry. We may not be able to anticipate future technological shifts, market needs and opportunities or be able todevelop new products, product enhancements or business strategies to meet such technological shifts, needs or opportunities in a timely manner or at all. Forexample, the move from traditional wide area network, or WAN, infrastructures towards software-defined WAN, or SD-WAN, has been receiving considerableattention. In our view, it will take several years to see the full impact of SD-WAN, and we believe the successful products and solutions in this market willcombine hardware and software elements. If we fail to anticipate market requirements or opportunities or fail to develop and introduce new products, productenhancements or business strategies to meet those requirements or opportunities in a timely manner, it could cause us to lose customers, and such failure couldsubstantially decrease or delay market acceptance and sales of our present and future products and services, which would significantly harm our business, financialcondition, and results of operations. In addition, if we invest time, energy and resources in developing products for a market that does not develop, it could likewisesignificantly harm our business, financial condition, and results of operations. Even if we are able to anticipate, develop, and commercially introduce new products,enhancements or business strategies, there can be no assurance that new products, enhancements or business strategies will achieve widespread market acceptance.
In recent years, we have announced a number of new products and enhancements to our hardware and software products across routing, switching and security.The success of our new products depends on several factors, including, but not limited to, component costs, timely completion and introduction of these products,prompt resolution of any defects or bugs in these products, our ability to support these products, differentiation of new products from those of our competitors andmarket acceptance of these products.
The introduction of new software products is part of our intended strategy to expand our software business. We have also begun to disaggregate certain softwarefrom certain hardware products, such that customers would be able to purchase or license our hardware and software products independently, which we expectcould in time enable our hardware to be deployed with third- party networking applications and services and our software to be used with third-party hardware. Thesuccess of our strategy to expand our software business, including our strategy to disaggregate software from certain hardware products, is subject to a number ofrisks and uncertainties, including:
• the additional development efforts and costs required to create new software products and/or to make our disaggregated products compatible withmultiple technologies;
• the possibility that our new software products or disaggregated products may not achieve widespread customer adoption;
• the possibility that our strategy could erode our revenue and gross margins;
• the impact on our financial results of longer periods of revenue recognition for certain types of software productsand changes in tax treatment associated with software sales;
• the additional costs associated with regulatory compliance and changes we need to make to our distribution chain in connection with increased softwaresales;
• the ability of our disaggregated hardware and software products to operate independently and/or to integrate with current and future third-partyproducts; and
54

Table of Contents
• issues with third-party technologies used with our disaggregated products may be attributed to us.
If any of our new products or business strategies do not gain market acceptance or meet our expectations for growth, our ability to meet future financial targets maybe adversely affected and our competitive position and our business and financial results could be harmed.
We are dependent on contract manufacturers with whom we do not have long-term supply contracts, and changes to or disruptions in those relationships ormanufacturing processes, expected or unexpected, may result in delays that could cause us to lose revenues and damage our customer relationships.
We depend on independent contract manufacturers (each of which is a third-party manufacturer for numerous companies) to manufacture our products. Althoughwe have contracts with our contract manufacturers, these contracts do not require them to manufacture our products on a long-term basis in any specific quantity orat any specific price. In addition, it is time-consuming and costly to qualify and implement additional contract manufacturer relationships. Therefore, if we fail toeffectively manage our contract manufacturer relationships, which could include failing to provide accurate forecasts of our requirements, or if one or more ofthem experiences delays, disruptions, or quality control problems in their manufacturing operations, or if we had to change or add additional contractmanufacturers or contract manufacturing sites, our ability to ship products to our customers could be delayed. We have experienced in the past and may experiencein the future an increase in the expected time required to manufacture our products or ship products. Such delays could result in supply shortfalls that damage ourability to meet customer demand for those products and could cause our customers to purchase alternative products from our competitors. Also, the addition ofmanufacturing locations or contract manufacturers or the introduction of new products by us would increase the complexity of our supply chain management.Moreover, a significant portion of our manufacturing is performed in China and other foreign countries and is therefore subject to risks associated with doingbusiness outside of the United States, including import tariffs, disruptions to our supply chain, or regional conflicts. For example, the United States recentlyimposed a tariff on networking products imported from China; this includes certain products that we import into and sell within the United States. If we cannotfully mitigate the impact of the tariffs, the increased cost could translate into higher prices for our customers, reduced customer demand or increased cost of goodssold. Similarly, many of the products that we source from China are transported by air cargo from Hong Kong, which has experienced recent politicaldemonstrations that have resulted in cancellations or delays in flights in and out of Hong Kong. If these demonstrations and their impact on air shipments continue,we could experience delays in product deliveries or be required to change our shipping practices. In addition, increased costs of production or delays in productioncaused by any relocation of contract manufacturing facilities or delays in product deliveries could impact the global competitiveness of our products. Each of thesefactors could adversely affect our business, financial condition and results of operations.
We are dependent on sole source and limited source suppliers, including for key components, which makes us susceptible to shortages, quality issues or pricefluctuations in our supply chain, and we may face increased challenges in supply chain management in the future.
We rely on single or limited sources for many of our components. During periods of high demand for electronic products, component shortages are possible, andthe predictability of the availability of such components may be limited. For example, we have experienced industry-wide supply constraints related to powermanagement components. In addition, some components used in our networking solutions have in the past and may in the future experience extended lead timesand higher pricing, given the demand in the market. Any future spike in growth in our business, the use of certain components we share in common with othercompanies, in IT spending or the economy in general, is likely to create greater short-term pressures on us and our suppliers to accurately forecast overallcomponent demand and to establish optimal component inventories. If shortages or delays persist, we may not be able to secure enough components at reasonableprices or of acceptable quality to build and deliver products in a timely manner, and our revenues, gross margins and customer relationships could suffer.Additionally, if certain components that we receive from our suppliers have defects or other quality issues, we may have to replace or repair such components, andwe could be subject to claims based on warranty, product liability, epidemic or delivery failures that could lead to significant expenses. We maintain productliability insurance, but there is no guarantee that such insurance will be available or adequate to protect against all such claims. We have experienced, and fromtime-to-time may experience, component shortages or quality issues that resulted, or could result, in delays of product shipments, revenue charges that impact ourgross margins, and/or warranty or other claims or costs. We also currently purchase numerous key components, including ASICs and other semiconductor chips,from single or limited sources and many of our component suppliers are concentrated in China and Korea. In addition, there has been consolidation among certainsuppliers of our components. For example, GLOBALFOUNDRIES acquired IBM’s semiconductor manufacturing business, Avago Technologies Limited acquiredBroadcom Corporation and Intel Corporation acquired Altera Corporation. Consolidation among suppliers can result in the reduction of the number of independentsuppliers of components available to us, which could negatively impact our ability to access certain component parts or the prices we have to pay for such partswhich may impact our gross margins. In addition, our suppliers may determine not to continue a business relationship with us for other reasons
55

Table of Contents
that may be beyond our control or may seek to impose significant price increases. Any disruptions to our supply chain or significant increase in components costcould decrease our sales, earnings and liquidity or otherwise adversely affect our business and result in increased costs. Such a disruption could occur as a result ofany number of events, including, but not limited to, increases in wages that drive up prices, the imposition of regulations, quotas or embargoes on components,labor stoppages, transportation failures affecting the supply chain and shipment of materials and finished goods, third-party interference in the integrity of theproducts sourced through the supply chain, the unavailability of raw materials, severe weather conditions, natural disasters, civil unrest, military conflicts,geopolitical developments, war or terrorism and disruptions in utility and other services.
The development of alternate sources for components is time-consuming, difficult, and costly. In addition, the lead times associated with certain components arelengthy and preclude rapid changes in quantities and delivery schedules. Also, long-term supply and maintenance obligations to customers increase the duration forwhich specific components are required, which may further increase the risk of component shortages or the cost of carrying inventory. In the event of a componentshortage, supply interruption or significant price increase from these suppliers, we may not be able to develop alternate or second sources in a timely manner. If weare unable to buy these components in quantities sufficient to meet our requirements on a timely basis, we will not be able to deliver products and services to ourcustomers, which would seriously affect present and future sales, which would, in turn, adversely affect our business, financial condition, and results of operations.
In addition, the development, licensing, or acquisition of new products in the future may increase the complexity of supply chain management. Failure toeffectively manage the supply of components and products would adversely affect our business.
If we fail to accurately predict our manufacturing requirements, we could incur additional costs or experience manufacturing delays, which would harm ourbusiness.
We provide demand forecasts for our products to our contract manufacturers and original design manufacturers, who order components and plan capacity based onthese forecasts. If we overestimate our requirements, our original design or contract manufacturers may assess charges, or we may have liabilities for excessinventory, each of which could negatively affect our gross margins. For example, in certain prior quarters, our gross margins were reduced as a result of aninventory charge resulting from inventory we held in excess of forecasted demand. In addition, some optical modules we use are experiencing faster producttransitions than our other products, which increases the risk that we could have excess inventory of those modules. Conversely, lead times for required materialsand components vary significantly and depend on factors such as the specific supplier, contract terms, and the demand for each component at a given time. Giventhat our contract manufacturers are third-party manufacturers for numerous other companies, if we underestimate our requirements, as we have in certain priorquarters with respect to certain products, our contract manufacturers may have inadequate time, materials, and/or components required to produce our products.This could increase costs or delay or interrupt manufacturing of our products, resulting in delays in shipments and deferral or loss of revenues and could negativelyimpact customer satisfaction.
System security risks, data protection breaches, and cyber-attacks could compromise our and our customers’ proprietary information, disrupt our internaloperations and harm public perception of our products, which could cause our business and reputation to suffer and adversely affect our stock price.
In the ordinary course of business, we store sensitive data, including intellectual property, personal data, our proprietary business information and that of ouremployees, contractors, customers, suppliers and business partners on our networks. In addition, we store sensitive data through cloud-based services that may behosted by third parties and in data center infrastructure maintained by third parties. The secure maintenance of this information is critical to our operations andbusiness strategy. The growing cyber risk environment means that individuals, companies, and organizations of all sizes, including Juniper, have been and areincreasingly subject to attacks and attempted intrusions, including recent attempts, on their and their vendors' networks and systems by a wide range of actors,including but not limited to nation states, criminal enterprises, and terrorist organizations, on an ongoing and regular basis. Despite our security measures, andthose of our third-party vendors, our information technology and infrastructure has experienced breaches and may be subject or vulnerable in the future to breachesor attacks by computer programmers, hackers or sophisticated nation-state and nation-state supported actors or breaches due to employee error or wrongfulconduct, malfeasance, or other disruptions. If any breach or attack compromises our networks or those of our vendors', creates system disruptions or slowdowns orexploits security vulnerabilities of our products, the information stored on our networks or those of our customers, suppliers or business partners could be accessedand modified, publicly disclosed, lost, destroyed or stolen, and we may be subject to liability to our customers, suppliers, business partners and others, includingregulatory entities, and suffer reputational and financial harm. In addition, hardware, components and software (including operating system software) andapplications that we produce or procure from third parties may contain defects in design or manufacture, including "bugs", vulnerabilities and other problems thatcould unexpectedly interfere with the operation of our networks, or expose us or our products to cyber attacks, or be exploited to gain unauthorized access to our orour customers’ systems or information we maintain. This can be true even for
56
Table of Contents
“legacy” products that have been determined to have reached an end of life engineering status but will continue to operate for a limited amount of time.Furthermore, third parties may attempt to exfiltrate data through the introduction into the Information and Communications Technology supply chain of maliciousproducts and components that are designed to defeat or circumvent encryption and other cybersecurity measures, and if successful, such actions could diminishcustomer trust in our products, harm our business reputation, and adversely affect our business and financial condition.
When vulnerabilities are discovered, we evaluate the risk, apply patches or take other remediation actions and notify customers, business partners, and suppliers asappropriate. All of this requires significant resources and time and attention from management and our employees.
As a result of any actual or perceived breach of network security that occurs in our network or in the network of a customer of our products, regardless of whetherthe breach is attributable to our products, the market perception of the effectiveness of our products and our overall reputation could be harmed. As a large, wellknown provider of networking products, cyber attackers regularly and specifically target our products or attempt to imitate us or our products in order tocompromise a network. Because the techniques used by attackers, many of whom are highly sophisticated and well-funded, to access or sabotage networks changefrequently and generally are not recognized until after they are used, we may be unable to anticipate or immediately detect these techniques or the vulnerabilitiesthey have caused. This could impede our sales, manufacturing, distribution or other critical functions, which could have an adverse impact on our financial results.The economic costs to us to eliminate or alleviate cyber or other security problems, bugs, viruses, worms, malicious software systems and security vulnerabilitiescould be significant and may be difficult to anticipate or measure, because the damage may differ based on the identity and motive of the attacker, which are oftendifficult to pinpoint. Additionally, we could be subject to regulatory investigations, potential fines and litigation in connection with a security breach or relatedissue and be liable to third parties for these types of breaches.
We rely on value-added and other resellers, as well as distribution partners, to sell our products, and disruptions to, or our failure to effectively develop andmanage, our distribution channel and the processes and procedures that support it could adversely affect our ability to generate revenues from the sale of ourproducts.
Our future success is highly dependent upon establishing and maintaining successful relationships with a variety of value-added and other reseller and distributionpartners, including our worldwide strategic partners such as Ericsson, IBM, Dimension Data and NEC Corporation. The majority of our revenues are derivedthrough value-added resellers and distributors, most of which also sell our competitors’ products, and some of which sell their own competing products. Ourrevenues depend in part on the performance of these partners. The loss of or reduction in sales to our resellers or distributors could materially reduce our revenues.Our competitors may in some cases be effective in leveraging their market share positions or in providing incentives to current or potential resellers anddistributors to favor their products or to prevent or reduce sales of our products. If we fail to develop and maintain relationships with our partners, fail to developnew relationships with value-added resellers and distributors in new markets, fail to expand the number of distributors and resellers in existing markets, fail tomanage, train or motivate existing value-added resellers and distributors effectively, determine that we cannot continue to do business with these partners for anyreason or if these partners are not successful in their sales efforts, sales of our products may decrease, and our business, financial condition, and results ofoperations would suffer.
In addition, we recognize a portion of our revenues at the time we sell products to our distributors. If these sales are made based on inaccurate or untimelyinformation, the amount or timing of our revenues could be adversely impacted. Further, our distributors may increase orders during periods of product shortages,cancel orders if their inventory is too high, or delay orders in anticipation of new products. They also may adjust their orders in response to the supply of ourproducts and the products of our competitors that are available to them, and in response to seasonal fluctuations in end-user demand.
We are also vulnerable to third parties who illegally distribute or sell counterfeit, stolen or unfit versions of our products, which has happened in the past and couldhappen in the future. Such sales could have a negative impact on our reputation and business.
Further, in order to develop and expand our distribution channel, we must continue to offer attractive channel programs to potential partners and scale and improveour processes and procedures that support the channel. As a result, our programs, processes and procedures may become increasingly complex and inherentlydifficult to manage. We have previously entered into OEM agreements with partners pursuant to which they rebrand and resell our products as part of their productportfolios. These types of relationships are complex and require additional processes and procedures that may be challenging and costly to implement, maintainand manage. Our failure to successfully manage and develop our distribution channel and the programs, processes and procedures that support it could adverselyaffect our ability to generate revenues from the sale of our products. We also depend on our global channel partners to comply with applicable legal and regulatoryrequirements. To the extent that they fail to do so, that could have
57
Table of Contents
a material adverse effect on our business, operating results, and financial condition.
Our ability to process orders and ship products in a timely manner is dependent in part on our business systems and performance of the systems and processesof third parties as well as the interfaces between our systems and the systems of such third parties. Dependence on outsourced information technology andother administrative functions may impair our ability to operate effectively.
Some of our business processes depend upon our IT systems, the systems and processes of third parties, and the interfaces between the two. For example, onDecember 31, 2018, we entered into a Master Services Agreement and certain Statements of Work with IBM pursuant to which we will outsource significantportions of our IT and other administrative functions following a transition period. These cloud providers, third party providers, and off-site facilities arevulnerable to damage, interruption, including performance problems from earthquakes, hurricanes, floods, fires, power loss, telecommunications failures,equipment failure, adverse events caused by operator error, cybersecurity attacks and similar events. In addition, because we lease off-site data center facilities, wecannot be assured that we will be able to expand our data center infrastructure to meet user demand in a timely manner, or on favorable economic terms. If we haveissues receiving and processing data, this may delay our ability to provide products and services to our customers and business partners and damage our business.We also rely upon the performance of the systems and processes of our contract manufacturers to build and ship our products. If those systems and processesexperience interruption or delay, our ability to build and ship our products in a timely manner may be harmed. Since IT is critical to our operations, any failure toperform on the part of our IT providers could impair our ability to operate effectively. In addition to the risks outlined above, problems with any of the third partieswe rely on for our IT systems could result in liabilities to our customers and business partners, lower revenue and unexecuted efficiencies, and impact our results ofoperations and our stock price.
Integration of acquisitions could disrupt our business and harm our financial condition and stock price and may dilute the ownership of our stockholders.
We have made, and may continue to make, acquisitions in order to enhance our business. For example, we acquired Mist Systems in 2019, HTBase in 2018 andCyphort in 2017. Acquisitions involve numerous risks, including, but not limited to, problems combining the purchased operations, technologies or products,unanticipated costs, liabilities, litigation, and diversion of management's attention from our core businesses, adverse effects on existing business relationships withsuppliers and customers, risks associated with entering markets in which we have no or limited prior experience, and where competitors in such markets havestronger market positions, initial dependence on unfamiliar supply chains or relatively small supply partners, and the potential loss of key employees, customers,distributors, vendors and other business partners of the companies we acquire. There can be no assurance that we will be able to integrate successfully anybusinesses, products, technologies, or personnel that we might acquire. The integration of businesses that we may acquire is likely to be a complex, time-consuming, and expensive process and we may not realize the anticipated revenues or other benefits associated with our acquisitions. If we fail to successfullymanage, operate or integrate any acquired business or if we are unable to efficiently operate as a combined organization, including through the use of commoninformation and communication systems, operating procedures, financial controls, and human resources practices, our business, financial condition, and results ofoperations may be adversely affected.
In connection with certain acquisitions, we may agree to issue common stock , or assume equity awards, that dilute the ownership of our current stockholders, use asubstantial portion of our cash resources, assume liabilities (both known and unknown), record goodwill and amortizable intangible assets that will be subject toimpairment testing on a regular basis and potential periodic impairment charges, incur amortization expenses related to certain intangible assets, and incur largeand immediate write-offs and restructuring and other related expenses, all of which could harm our financial condition and results of operations.
We are a party to lawsuits, investigations, proceedings, and other disputes, which are costly to defend and, if determined adversely to us, could require us to payfines or damages, undertake remedial measures or prevent us from taking certain actions, any or all of which could harm our business, results of operations,financial condition or cash flows.
We, and certain of our current and former officers and current and former members of our Board of Directors, have been or are subject to various lawsuits. Wehave been served with lawsuits related to employment matters, commercial transactions and patent infringement, as well as securities laws. In addition, the U.S.Securities and Exchange Commission, or the SEC, and the U.S. Department of Justice, or the DOJ, previously conducted investigations into possible violations bythe Company of the U.S. Foreign Corrupt Practices Act, or the FCPA, in a number of countries which ultimately resulted in the Company, without admitting ordenying any fault or wrongdoing, entering into a settlement with the SEC in August 2019. The SEC settlement concerned alleged conduct in two specific countries,found that the specific accounting controls over customer entertainment and travel were ineffective during the period from 2009 through 2013, and required theCompany to make a payment of $11.8 million.
58

Table of Contents
Generally, we cannot predict the duration, scope, outcome or consequences of litigation and government investigations. In connection with any governmentinvestigations, if the government takes action against us or we agree to settle the matter, we may be required to pay substantial fines and incur other sanctions,which may be material, and suffer reputational harm. In addition, if we fail to comply with the terms of any settlement agreement, we could face more substantialfines or sanctions. The lawsuits and investigations are expensive and time-consuming to defend, settle, and/or resolve, and may require us to implement certainremedial measures that could prove costly or disruptive to our business and operations. The unfavorable resolution of one or more of these matters could have amaterial adverse effect on our business, results of operations, financial condition or cash flows.
We are a party to litigation and claims regarding intellectual property rights, resolution of which may be time-consuming and expensive, as well as require asignificant amount of resources to prosecute, defend, or make our products non-infringing.
Our industry is characterized by the existence of a large number of patents and frequent claims and related litigation regarding patent and other intellectualproperty rights. We expect that infringement claims may increase as the number of products and competitors in our market increases and overlaps occur. Thirdparties have asserted and may in the future assert claims or initiate litigation related to patent, copyright, trademark, and other intellectual property rights totechnologies and related standards that are relevant to our products. The asserted claims and/or initiated litigation may include claims against us or ourmanufacturers, suppliers, partners, or customers, alleging that our products or services infringe proprietary rights. In addition, increased patent litigation brought bynon-practicing entities in recent years may result, and in some cases has resulted, in our customers requesting or requiring us to absorb a portion of the costs ofsuch litigation or providing broader indemnification for litigation, each of which could increase our expenses and negatively affect our business, financial conditionand results of operations. Regardless of the merit of these claims, they have been and can be time-consuming, result in costly litigation, and may require us todevelop non-infringing technologies, enter into license agreements, or cease engaging in certain activities or offering certain products or services. Furthermore,because of the potential for high awards of damages or injunctive relief that are not necessarily predictable, even arguably unmeritorious claims may be settled forsignificant amounts of money. If any infringement or other intellectual property claim made against us or anyone we are required to indemnify by any third-party issuccessful, if we are required to settle litigation for significant amounts of money, if we fail to develop non-infringing technology, if we incorporate infringingtechnology in our products or if we license required proprietary rights at material expense, our business, financial condition, and results of operations could bematerially and adversely affected.
As we seek to sell more products to telecommunications, cable and cloud service provider companies and other large customers, we may be required to agree toterms and conditions that could have an adverse effect on our business or impact the amount of revenues to be recognized.
Telecommunications, cable and cloud service provider companies, which comprise a significant portion of our customer base, and other large companies, generallyhave greater purchasing power than smaller entities and, accordingly, often request and receive more favorable terms from suppliers. As we seek to sell moreproducts to this class of customer, we may be required to agree to such terms and conditions, which may include terms that affect the timing of our ability torecognize revenue, increase our costs and have an adverse effect on our business, financial condition, and results of operations. Consolidation among such largecustomers can further increase their buying power and ability to require onerous terms.
In addition, service providers have purchased products from other vendors who promised but failed to deliver certain functionality and/or had products that causedproblems or outages in the networks of these customers. As a result, these customers may request additional features from us and require substantial penalties forfailure to deliver such features or may require substantial penalties for any network outages that may be caused by our products. These additional requests andpenalties, if we are required to agree to them, may impact the amount of revenue recognition from such sales, which may negatively affect our business, financialcondition and results of operations. In addition, increased patent litigation brought against customers in recent years, may result, and in some cases has resulted, incustomers requesting or requiring vendors to absorb a portion of the costs of such litigation or providing broader indemnification for litigation, each of which couldincrease our expenses and negatively affect our business, financial condition and results of operations.
59
Table of Contents
Regulation of our industry in general and the telecommunications industry in particular could harm our operating results and future prospects.
We are subject to laws and regulations affecting the sale of our products in a number of areas. For example, some governments have regulations prohibitinggovernment entities from purchasing security products that do not meet country-specific safety, conformance or security certification criteria or in-country testrequirements. Other regulations that may negatively impact our business include local content or local manufacturing requirements most commonly applicable forgovernment, state-owned enterprise or regulated industry procurements. These types of regulations are in effect or under consideration in several jurisdictionswhere we do business.
The Dodd-Frank Wall Street Reform and Consumer Protection Act includes disclosure requirements applicable to public companies regarding the use of “conflictminerals” mined from the Democratic Republic of Congo and adjoining countries, which we refer to collectively as the DRC, and procedures regarding amanufacturer's efforts to prevent the sourcing of such “conflict minerals.” These minerals are present in our products. In addition, the European Union reachedagreement in late 2016 on an EU-wide conflict minerals rule under which most EU importers of tin, tungsten, tantalum, gold and their ores will have to conductdue diligence to ensure the minerals do not originate from conflict zones and do not fund armed conflicts. Large manufacturers also will have to disclose how theyplan to monitor their sources to comply with the rules. The regulation was adopted in 2017 with compliance required by 2021.
In addition, environmental laws and regulations relevant to electronic equipment manufacturing or operations, including laws and regulations governing thehazardous material content of our products and laws relating to the collection of and recycling of electrical and electronic equipment, may adversely impact ourbusiness and financial condition. These laws and regulations include, among others, the European Union, or EU, Restriction on the Use of Certain HazardousSubstances Directive, or RoHS. The EU RoHS and the similar laws of other jurisdictions limit the content of certain hazardous materials, such as lead, mercury,and cadmium, in electronic equipment, including our products. Currently, our products comply with the EU RoHS requirements. However, certain exemptions arescheduled to lapse. The lapse of any exemption, further changes to this or other laws, or passage of similar laws in the EU or other jurisdictions, would require usto cease selling non-compliant products and to reengineer our products to use components compatible with these regulations. This reengineering and componentsubstitution could result in additional costs to us, disrupt our operations or logistics, and result in an adverse impact on our operating results. In addition, invalidating the compliance of our products with applicable hazardous materials restrictions, we rely substantially on affirmations by our component suppliers as tothe compliance of their products with respect to those same restrictions. Failure by our component suppliers to furnish accurate and timely information couldsubject us to penalties or liability for violation of such hazardous materials restrictions, interrupt our supply of products to the EU, and result in our customersrefusing or being unable to purchase our products. Additionally, the EU and a number of other jurisdictions have adopted regulations requiring producers ofelectrical and electronic equipment to assume certain responsibilities for collecting, treating, recycling and disposing of products when they have reached the endof their useful life. Finally, the EU REACH regulations regulate the handling of certain chemical substances that may be used in our products.
In addition, as a contractor and subcontractor to U.S. government departments and agencies, we are subject to federal regulations pertaining to our IT systems. Forinstance, as a subcontractor to the U.S. Department of Defense, or DOD, the Defense Federal Acquisition Regulation Supplement, or DFARS, required that our ITsystems comply with the security and privacy controls described in National Institute of Standards and Technology Special Publication 800-171, or NIST SP 800-171. The DFARS also requires that we flow the security control requirement down to certain of our own subcontractors. Failure to comply with these requirementscould result in a loss of federal government business, subject us to claims or other remedies for non-compliance and negatively impact our business, financialcondition, and results of operations.
The telecommunications industry is highly regulated, and our business and financial condition could be adversely affected by changes in regulations relating to theInternet telecommunications industry. Similarly, while there are currently few laws or regulations that apply directly to access to or commerce on IP networks,future regulations could include sales taxes on products sold via the Internet and Internet service provider access charges. We could be adversely affected byregulation of IP networks and commerce in any country where we market equipment and services to service providers or cloud provider companies. Regulationsgoverning the range of services and business models that can be offered by service providers or cloud provider companies could adversely affect those customers'needs for products. For instance, in December 2017, the U.S. Federal Communications Commission repealed its 2015 regulations governing aspects of fixedbroadband networks and wireless networks. This change in regulatory treatment of networks might impact service provider and cloud provider business modelsand their need for Internet telecommunications equipment and services. At the same time, several states have enacted their own laws and regulations governingcertain aspects of fixed and wireless networks in the manner of the 2015 FCC regulations. These laws and regulations enacted by the states are or will be subject tolegal challenges from the federal government and/or regulated providers. Also, many
60

Table of Contents
jurisdictions are evaluating or implementing regulations relating to cyber security, supply chain integrity, privacy and data protection, any of which can affect themarket and requirements for networking and security equipment.
The adoption and implementation of additional regulations could reduce demand for our products, increase the cost of building and selling our products, result inproduct inventory write-offs, impact our ability to ship products into affected areas and recognize revenue in a timely manner, require us to spend significant timeand expense to comply, and subject us to fines and civil or criminal sanctions or claims if we were to violate or become liable under such regulations. Any of theseimpacts could have a material adverse effect on our business, financial condition, and results of operations.
Governmental regulations and economic sanctions affecting the import or export of products generally or affecting products containing encryptioncapabilities, in particular, could negatively affect our revenues and operating results.
The United States and various foreign governments have imposed controls and restrictions on the export of, among other things, products that contain or useencryption technology. Most of our products contain or use encryption technology and, consequently, are subject to such controls, requirements and restrictions.Certain governments, like those of Russia and China, control importation and in-country use of encryption items and technology. The scope, nature and severity ofsuch controls vary widely across different countries and may change frequently over time.
Increasingly, governments have begun using export and import controls not only to further national security objectives but also to protect local industries andrestrict proliferation of locally developed “emerging or foundational technology." For example, in 2018 the U.S. enacted the Export Control Reform Act, whichexpands the power of the Commerce Department to use export controls to protect domestic industry and to restrict the export of emerging and foundationaltechnologies not currently subject to controls. In furtherance of that law, on November 19, 2018, the United States Department of Commerce sought publiccomment on how to define emerging technologies. Our ability to market and sell our products overseas may be impacted by such export controls.
In addition, the U.S. and other governments have especially broad sanctions and embargoes prohibiting provision of goods or services to certain countries, andterritories, and to certain sanctioned governments, legal entities and individuals. Some of these restrictions have been imposed not just to protect national securitybut also to protect domestic industries and to achieve political aims. For instance, the U.S. Department of Commerce in 2018 added to its Entity List a Chinesesemiconductor manufacturer on the express basis that it threatens the viability of U.S. competitors; the Entity List traditionally is used to restrict exports to endusers that pose a security risk. Particularly far reaching and complex are restrictions imposed by the U.S. and EU on exports to Russia and, in particular, to thedisputed region of Crimea. We have implemented systems to detect and prevent sales into these restricted countries or to prohibited entities or individuals, butthere can be no assurance that our third party, downstream resellers and distributors will abide by these restrictions or have processes in place to ensurecompliance, especially where local government regulation might prohibit adherence to such restrictions.
Certain governments also impose special local content, certification, testing, source code review, escrow and governmental recovery of private encryption keys, orother cybersecurity feature requirements to protect network equipment and software procured by or for the government. Similar requirements also may be imposedin procurements by state owned entities (“SOE’s”) or even private companies forming part of “critical network infrastructure” or supporting sensitive industries.For example, China, Vietnam and India have promulgated cybersecurity regulations affecting networking products that may impair our ability to profitably marketand sell our products there. China, in particular, is expected to require implementation of non-standard Chinese encryption algorithms in products sold into certaingovernment, SOE, critical infrastructure and sensitive industry (such as financial institutions) markets. In the U.S., there are new restrictions on the use of certainChinese-origin components or systems either (1) in items sold to the U.S. government or (2) in the internal networks of government contractors and subcontractors(even if those networks are not used for government-related projects). The U.S. government also might restrict or ban the use of certain Chinese-origin componentsand systems in next generation mobile communications networks (e.g. 5G).
In addition, governments sometimes impose additional taxes on certain imported products. For example, the United States and Chinese governments each haveimposed tariffs on certain products originating from the other country. In 2018, the United States imposed tariffs on a large variety of products of China origin. Asa result, beginning September 24, 2018, a large portion of Juniper products manufactured in China became subject to a 10% tariff on importation into the U.S.pursuant to the U.S. government’s List 3 tariff proceeding. The U.S. President announced on May 5, 2019, that the 25% rate would go into effect on May 10, 2019due to the lack of negotiation progress. On August 1, 2019, the President stated his intent to increase the List 3 tariff to 30%, which he announced would occur onOctober 15, 2019; this planned increase to 30% has been postponed indefinitely. Similarly, in July 2019, the U.S. President reiterated his readiness to impose -tariffs on all remaining Chinese imports (List 4 tariff proceeding) if US-China negotiations remained unresolved. In August 2019, he announced that he wouldimpose a 15% tariff on all remaining
61

Table of Contents
Chinese imports effective September 1, 2019. Depending upon their duration and implementation, as well as our ability to mitigate their impact, these tariffs couldmaterially affect our business, including in the form of increased cost of goods sold, increased pricing for customers, and reduced sales.
On May 30, 2019, the U.S. President announced his intention to impose a tariff on imports from Mexico effective June 10, 2019. The tariff rate was to start at 5%and gradually increase to 25% over the course of several months unless and until Mexico took steps to reduce the number of migrant crossings over the US-Mexicoborder. While the President subsequently announced a delay of the tariff, he left open the possibility that the United States could impose a tariff in the near future.As the President never issued an order imposing the tariff, its exact scope was not known. Juniper does obtain products having Mexico as their country-of-origin,so it is possible that we would be subject to any such tariff. Should the United States impose the tariff, we will determine its impact on our operations andconditions.
Governmental regulation of encryption or IP networking technology and regulation of imports or exports, or our failure to obtain required import or exportapproval for our products, or related economic sanctions could harm our international and domestic sales and adversely affect our revenues and operating results.In addition, failure to comply with such regulations could result in harm to our reputation and ability to compete in international markets, penalties, costs, seizureof assets (including source code) and restrictions on import or export privileges or adversely affect sales to government agencies or government-funded projects.
Our actual or perceived failure to adequately protect personal data could adversely affect our business, financial condition and results of operations.
A wide variety of provincial, state, national, foreign, and international laws and regulations apply to the collection, use, retention, protection, disclosure, transfer,and other processing of personal data. These privacy- and data protection-related laws and regulations are evolving, with new or modified laws and regulationsproposed and implemented frequently and existing laws and regulations subject to new or different interpretations. Further, our legal and regulatory obligations inforeign jurisdictions are subject to unexpected changes, including the potential for regulatory or other governmental entities to enact new or additional laws orregulations, to issues rulings that invalidate prior laws or regulations, or to increase penalties significantly. Compliance with these laws and regulations can becostly and can delay or impede the development and offering of new products and services.
For example, the General Data Protection Regulation (“GDPR”), which became effective in May 2018, imposes more stringent data protection requirements, andprovides for significantly greater penalties for noncompliance, than the EU laws that previously applied. Additionally, California recently enacted legislation, theCalifornia Consumer Privacy Act (“CCPA”), which will become effective January 1, 2020. The CCPA will, among other requirements, require covered companiesto provide new disclosures to California consumers, and allow such consumers new abilities to opt-out of certain sales of personal information. Legislators havestated that they intend to propose amendments to the CCPA before the effective date. It remains unclear the extent or timing of any modifications that will be madeto the CCPA, or how such modifications will be interpreted. The effects of the CCPA potentially are significant and may require us to modify our data processingpractices and policies and to incur substantial costs and expenses in an effort to comply. We may also be subject to additional obligations relating to personal databy contract that industry standards apply to our practices. Our actual or perceived failure to comply with applicable laws and regulations or other obligations towhich we may be subject relating to personal data, or to protect personal data from unauthorized access, use, or other processing, could result in enforcementactions and regulatory investigations against us, claims for damages by customers and other affected individuals, fines, damage to our reputation, and loss ofgoodwill, any of which could have a material adverse effect on our operations, financial performance, and business. Further, evolving and changing definitions ofpersonal data and personal information, within the EU, the U.S., U.K., and elsewhere, including the classification of IP addresses, machine identificationinformation, location data, and other information, may limit or inhibit our ability to operate or expand our business, including limiting business relationships andpartnerships that may involve the sharing or uses of data, and may require significant costs, resources, and efforts in order to comply.
Our ability to develop, market, and sell products could be harmed if we are unable to retain or hire key personnel.
Our future success depends upon our ability to recruit and retain the services of executive, engineering, sales and marketing, and support personnel. The supply ofhighly qualified individuals, in particular engineers in very specialized technical areas, or sales people with specialized industry expertise, is limited andcompetition for such individuals is intense. None of our officers or key employees is bound by an employment agreement for any specific term. The loss of theservices of any of our key employees, the inability to attract or retain personnel in the future or delays in hiring required personnel, engineers and sales people, andthe complexity and time involved in replacing or training new employees, could delay the development and introduction of new products, and negatively impactour ability to market, sell, or support our products.
62

Table of Contents
A number of our team members are foreign nationals who rely on visas and entry permits in order to legally work in the United States and other countries. In recentyears, the United States has increased the level of scrutiny in granting H-1(B), L-1 and other business visas. In addition, the current U.S. administration has madeimmigration reform a priority. Compliance with United States immigration and labor laws could require us to incur additional unexpected labor costs and expensesor could restrain our ability to retain skilled professionals. Any of these restrictions could have a material adverse effect on our business, results of operations andfinancial conditions.
Our financial condition and results of operations could suffer if there is an impairment of goodwill or other intangible assets with indefinite lives.
We are required to test intangible assets with indefinite lives, including goodwill, annually or more frequently if certain circumstances change that would morelikely than not reduce the fair value of a reporting unit and intangible assets below their carrying values. As of September 30, 2019, our goodwill was $3,338.3million and our intangible assets with indefinite lives was $49.0 million. When the carrying value of a reporting unit’s goodwill exceeds its implied fair value ofgoodwill, or if the carrying amount of an intangible asset with an indefinite life exceeds its fair value, a charge to operations is recorded. Either event would resultin incremental expenses for that quarter, which would reduce any earnings or increase any loss for the period in which the impairment was determined to haveoccurred. We have in the past recorded goodwill impairment charges. Declines in our level of revenues or declines in our operating margins, or sustained declinesin our stock price, increase the risk that goodwill and intangible assets with indefinite lives may become impaired in future periods.
Our goodwill impairment analysis is sensitive to changes in key assumptions used in our analysis, such as expected future cash flows, the degree of volatility inequity and debt markets, and our stock price. If the assumptions used in our analysis are not realized, it is possible that an impairment charge may need to berecorded in the future. We cannot accurately predict the amount and timing of any impairment of goodwill or other intangible assets. However, any suchimpairment would have an adverse effect on our results of operations.
Changes in effective tax rates or adverse outcomes resulting from examination of our income or other tax returns could adversely affect our results.
Our future effective tax rates could be subject to volatility or adversely affected by the following: earnings being lower than anticipated in countries where we havelower statutory rates and higher than anticipated earnings in countries where we have higher statutory rates; changes in the valuation of our deferred tax assets andliabilities; expiration of, or lapses in, the R&D tax credit laws applicable to us; transfer pricing adjustments related to certain acquisitions, including the license ofacquired intangibles under our intercompany R&D cost sharing arrangement; costs related to intercompany restructuring; tax effects of share-based compensation;challenges to our methodologies for valuing developed technology or intercompany arrangements; limitations on the deductibility of net interest expense; orchanges in tax laws, regulations, accounting principles, or interpretations thereof. For example, on July 24, 2018, the Ninth Circuit Court of Appeals, or the Court,issued an opinion in Altera Corp. v. Commissioner requiring related parties in an intercompany cost-sharing arrangement to share expenses related to share-basedcompensation. On June 7, 2019, the Court upheld the cost-sharing regulations. On July 22, 2019, Altera petitioned the Court for a rehearing. Pending finalresolution of the Altera case, the Company’s position on cost-sharing of share-based compensation remains unchanged. If the final judicial decision is not in favorof Altera, we expect our effective tax rate and current income tax payable to be higher. We are monitoring this case and any impact the final resolution may haveon our financial statements. In addition, the Tax Act made significant changes to the taxation of U.S. business entities that may have a meaningful impact to ourprovision for income taxes. These changes included a reduction to the federal corporate income tax rate, the current taxation of certain foreign earnings, theimposition of base-erosion prevention measures which may limit the deduction of certain transfer pricing payments, and possible limitations on the deductibility ofnet interest expense or corporate debt obligations. Accounting for the income tax effects of the Tax Act required significant judgments and estimates that are basedon current interpretations of the Tax Act. The U.S. Department of the Treasury continues to issue regulations that affect various components of the Act. Our futureeffective tax rate may be impacted by changes in interpretation of the regulations, as well as additional legislation and guidance regarding the Act.
Furthermore, on October 5, 2015, the Organisation for Economic Co-operation and Development, or OECD, an international association of 35 countries includingthe U.S., published final proposals under its Base Erosion and Profit Shifting, or BEPS, Action Plan. The BEPS Action Plan includes fifteen Actions to addressBEPS in a comprehensive manner and represents a significant change to the international corporate tax landscape. These proposals, as adopted by countries, mayincrease tax uncertainty and adversely affect our provision for income taxes. In addition, we are subject to the continuous examination of our income tax returns bythe Internal Revenue Service, or IRS, and other tax authorities. It is possible that tax authorities may disagree with certain positions we have taken and any adverseoutcome of such a review or audit could have a negative effect on our financial position and operating results. We regularly assess the likelihood of adverseoutcomes resulting from these examinations to determine the
63

Table of Contents
adequacy of our provision for income taxes, but the determination of our worldwide provision for income taxes and other tax liabilities requires significantjudgment by management, and there are transactions where the ultimate tax determination is uncertain. Although we believe that our estimates are reasonable, theultimate tax outcome may differ from the amounts recorded in our consolidated financial statements and may materially affect our financial results in the period orperiods for which such determination is made. There can be no assurance that the outcomes from continuous examinations will not have an adverse effect on ourbusiness, financial condition, and results of operations.
We may face difficulties enforcing our proprietary rights, which could adversely affect our ability to compete.
We generally rely on a combination of patents, copyrights, trademarks, and trade secret laws and contractual restrictions on disclosure of confidential andproprietary information, to establish and maintain proprietary rights in our technology and products. Although we have been issued numerous patents and otherpatent applications are currently pending, there can be no assurance that any of our patent applications will result in issued patents or that any of our patents orother proprietary rights will not be challenged, invalidated, infringed or circumvented or that our rights will, in fact, provide competitive advantages to us orprotect our technology, any of which could result in costly product redesign efforts, discontinuance of certain product offerings and other competitive harm.
In addition, despite our efforts to protect our proprietary rights, unauthorized parties may attempt to copy aspects of our products or obtain and use information thatwe regard as proprietary. We generally enter into confidentiality or license agreements with our employees, consultants, vendors, and customers, and generallylimit access to and distribution of our proprietary information. However, we cannot assure you that we have entered into such agreements with all parties who mayhave or have had access to our confidential information or that the agreements we have entered into will not be breached. We cannot guarantee that any of themeasures we have taken will prevent misappropriation of our technology.
Furthermore, the laws of some foreign countries may not protect our proprietary rights to the same extent as do the laws of the United States. The outcome of anyactions taken in these foreign countries may be different than if such actions were determined under the laws of the United States. Although we are not dependenton any individual patents or group of patents for particular segments of the business for which we compete, if we are unable to protect our proprietary rights in amarket, we may find ourselves at a competitive disadvantage to others who need not incur the substantial expense, time, and effort required to create innovativeproducts that have enabled our success.
We are subject to risks arising from our international operations, which may adversely affect our business, financial condition, and results of operations.
We derive a substantial portion of our revenues from our international operations, and we plan to continue expanding our business in international markets. Weconduct significant sales and customer support operations directly and indirectly through our distributors and value-added resellers in countries throughout theworld and depend on the operations of our contract manufacturers and suppliers that are located outside of the United States. In addition, a portion of our R&D andour general and administrative operations are conducted outside the United States. In some countries, we may experience reduced intellectual property protection.
As a result of our international operations, we are affected by economic, business regulatory, social, and political conditions in foreign countries, including thefollowing:
• changes in general IT spending,
• the imposition of government controls, inclusive of critical infrastructure protection;
• changes or limitations in trade protection laws or other regulatory requirements, which may affect our ability to import or export our products fromvarious countries;
• laws that restrict sales of products developed or manufactured outside of the country;
• varying and potentially conflicting laws and regulations;
• political uncertainty, including demonstrations, that could have an impact on product delivery from and into the China region.
• fluctuations in local economies;
64
Table of Contents
• wage inflation or a tightening of the labor market;
• tax policies that could have a business impact;
• import tariffs imposed by the United States and reciprocal tariffs imposed by foreign countries;
• data privacy rules and other regulations that affect cross border data flow; and
• the impact of the following on customer spending patterns: political considerations, unfavorable changes in tax treaties or laws, natural disasters,epidemic disease, labor unrest, earnings expatriation restrictions, misappropriation of intellectual property, military actions, acts of terrorism, politicaland social unrest and difficulties in staffing and managing international operations.
Any or all of these factors could have a material adverse impact on our business, financial condition, and results of operations.
In addition, the U.K.’s exit from the EU, commonly referred to as Brexit, has caused, and may continue to cause, uncertainty in the global markets. Brexit, ifimplemented, will take some period of time to complete and could result in regulatory changes that impact our business. For example, changes to the way serviceproviders conduct business and transmit data between the U.K. and the EU could require us to make changes to the way we handle customer data. We will alsoreview the impact of any resulting changes to EU or U.K. law that could affect our operations, such as labor policies, financial planning, product manufacturing,and product distribution. Political and regulatory responses to the vote are still developing and we are in the process of assessing the impact the vote may have onour business as more information becomes available. Nevertheless, because we conduct business in the EU, including the U.K., any of the effects of Brexit,including those we cannot anticipate, could have a material adverse effect on our business, operating results, financial condition and cash flows.
There remains significant risk that the U.K. will exit from the EU without agreement between the EU and U.K. on terms addressing customs and trade matters. TheU.K.’s new Prime Minister has indicated that the U.K. must prepare for a no-deal Brexit. If it occurs, this “Hard Brexit” scenario would mean, among other things,that U.K. Customs would have to clear a far greater daily volume of imports than it has ever had to before. If U.K. Customs is not able to handle such increasedvolume, significant delays in imports may very well result, thereby potentially producing a short-term material adverse effect on our business. Hard Brexit couldresult in further short-term uncertainty and currency volatility. Additional currency volatility could drive a weaker British pound, which increases the cost of goodsimported into our U.K. operations and may decrease the profitability of our U.K. operations. A weaker British pound versus the U.S. dollar also causes localcurrency results of our U.K. operations to be translated into fewer U.S. dollars during a reporting period. Any adjustments we make to our business and operationsas a result of Brexit could result in significant time and expense to complete.
Our business is also impacted by the negotiation and implementation of free trade agreements between the United States and other nations. Such agreements canreduce barriers to international trade and thus the cost of conducting business overseas. For instance, the United States recently reached a new trilateral tradeagreement with the Governments of Canada and Mexico to replace the North American Free Trade Agreement (NAFTA). If the United States either withdrawsfrom NAFTA or fails to ratify the new agreement, known as the United States-Mexico-Canada Agreement (U.S.MCA), our cost of doing business within the threecountries could increase.
Many of the products that we have manufactured in China are transported by air cargo from Hong Kong. Recently, there have been political demonstrations inHong Kong that have resulted in cancellations or delays in flights in and out of China. If these demonstrations and their impact on air shipments continue, we couldexperience delays in product deliveries from China or be required to change our shipping practices, which could adversely impact our business.
Moreover, local laws and customs in many countries differ significantly from or conflict with those in the United States or in other countries in which we operate.In many foreign countries, it is common for others to engage in business practices that are prohibited by our internal policies and procedures or U.S. regulationsapplicable to us. There can be no assurance that our employees, contractors, channel partners, and agents will not take actions in violation of our policies andprocedures, which are designed to ensure compliance with U.S. and foreign laws and policies. Violations of laws or key control policies by our employees,contractors, channel partners, or agents could result in termination of our relationship, financial reporting problems, fines, and/or penalties for us, or prohibition onthe importation or exportation of our products, and could have a material adverse effect on our business, financial condition and results of operations.
65

Table of Contents
Our products are highly technical and if they contain undetected defects, errors or malware or do not meet customer quality expectations, our business couldbe adversely affected, and we may be subject to additional costs or lawsuits or be required to pay damages in connection with any alleged or actual failure ofour products and services.
Our products are highly technical and complex, are critical to the operation of many networks, and, in the case of our security products, provide and monitornetwork security and may protect valuable information. Our products have contained and may contain one or more undetected errors, defects, malware, or securityvulnerabilities. These errors may arise from hardware or software we produce or procure from third parties. Some errors in our products may only be discoveredafter a product has been installed and used by end-customers.
Any errors, defects, malware or security vulnerabilities discovered in our products after commercial release could result in monetary penalties, negative publicity,loss of revenues or delay in revenue recognition, loss of customers, loss of future business and reputation, penalties, and increased service and warranty cost, any ofwhich could adversely affect our business, financial condition, and results of operations. In addition, in the event an error, defect, malware, or vulnerability isattributable to a component supplied by a third-party vendor, we may not be able to recover from the vendor all of the costs of remediation that we may incur. Inaddition, we could face claims for product liability, tort, or breach of warranty or indemnification. Defending a lawsuit, regardless of its merit, is costly and maydivert management’s attention. If our business liability insurance coverage is inadequate, or future coverage is unavailable on acceptable terms or at all, ourfinancial condition and results of operations could be harmed. Moreover, if our products fail to satisfy our customers' quality expectations for whatever reason, theperception of and the demand for our products could be adversely affected.
We are exposed to fluctuations in currency exchange rates, which could negatively affect our financial condition and results of operations.
Because a substantial portion of our business is conducted outside the United States, we face exposure to adverse movements in non-U.S. currency exchange rates.These exposures may change over time as business practices evolve and could have a material adverse impact on our financial condition and results of operations.
The majority of our revenues and expenses are transacted in U.S. Dollars. We also have some transactions that are denominated in foreign currencies, primarily theBritish Pound, Chinese Yuan, Euro, and Indian Rupee related to our sales and service operations outside of the United States. An increase in the value of the U.S.Dollar could increase the real cost to our customers of our products in those markets outside the United States in which we sell in U.S. Dollars. This couldnegatively affect our ability to meet our customers' pricing expectations in those markets and may result in erosion of gross margin and market share. A weakenedU.S. Dollar could increase the cost of local operating expenses and procurement of raw materials to the extent we must purchase components in foreign currencies.
Currently, we hedge currency exposures associated with certain assets and liabilities denominated in nonfunctional currencies and periodically hedge anticipatedforeign currency cash flows, with the aim of offsetting the impact of currency fluctuations on these exposures. However, hedge activities can be costly, andhedging cannot fully offset all risks, including long-term declines or appreciation in the value of the U.S. Dollar. If our attempts to hedge against these risks are notsuccessful, or if long-term declines or appreciation in the value of the U.S. Dollar persist, our financial condition and results of operations could be adverselyimpacted.
If we fail to adequately evolve our financial and managerial control and reporting systems and processes, our ability to manage and grow our business will benegatively affected.
Our ability to successfully offer our products and implement our business plan in a rapidly evolving market requires an effective planning, forecasting, andmanagement process to enable us to effectively scale and adjust our business and business models in response to fluctuating market opportunities and conditions.We will need to continue to improve our financial and managerial control and our reporting systems and procedures in order to manage our business effectively inthe future. If we fail to effectively improve our systems and processes or we fail to monitor and ensure that these systems and processes are being used correctly,our ability to manage our business, financial condition, and results of operations may be negatively affected.
If our products do not interoperate with our customers’ networks, installations will be delayed or cancelled and could harm our business.
Our products are designed to interface with our customers’ existing networks, each of which have different specifications and utilize multiple protocol standardsand products from other vendors. Many of our customers’ networks contain multiple generations of products that have been added over time as these networkshave grown and evolved. Our products must interoperate with many
66
Table of Contents
or all of the products within these networks as well as future products in order to meet our customers’ requirements. If we find errors in the existing software ordefects in the hardware used in our customers’ networks, we may need to modify our software or hardware to fix or overcome these errors so that our products willinteroperate and scale with the existing software and hardware, which could be costly and could negatively affect our business, financial condition, and results ofoperations. In addition, if our products do not interoperate with those of our customers’ networks, demand for our products could be adversely affected or ordersfor our products could be cancelled. This could hurt our operating results, damage our reputation, and seriously harm our business and prospects.
Our products incorporate and rely upon licensed third-party technology, and if licenses of third-party technology do not continue to be available to us or arenot available on terms acceptable to us, our revenues and ability to develop and introduce new products could be adversely affected.
We integrate licensed third-party technology into certain of our products. From time to time, we may be required to renegotiate our current third-party licenses orlicense additional technology from third-parties to develop new products or product enhancements or to facilitate new business models. Third-party licenses maynot be available or continue to be available to us on commercially reasonable terms. The failure to comply with the terms of any license, including free open sourcesoftware, may result in our inability to continue to use such license. Some of our agreements with our licensors may be terminated for convenience by them. Inaddition, we cannot be certain that our licensors are not infringing the intellectual property rights of third parties or that our licensors have sufficient rights to thelicensed intellectual property in all jurisdictions in which we may sell our products. Third- party technology we incorporate into our products that is deemed toinfringe on the intellectual property of others may result, and in some cases has resulted, in limitations on our ability to source technology from those third parties,restrictions on our ability to sell products that incorporate the infringing technology, increased exposure to liability that we will be held responsible forincorporating the infringing technology in our products and increased costs involved in removing that technology from our products or developing substitutetechnology. Our inability to maintain or re-license any third-party licenses required in our products or our inability to obtain third-party licenses necessary todevelop new products and product enhancements, could require us, if possible, to develop substitute technology or obtain substitute technology of lower quality orperformance standards or at a greater cost, any of which could delay or prevent product shipment and harm our business, financial condition, and results ofoperations.
We rely on the availability and performance of information technology services provided by third parties, including IBM which will manage a significantportion of our systems.
Under the terms of our recent Master Services Agreement and certain Statements of Work, following a transition period, IBM will provide us with a broad range ofinformation technology services, such as applications, including support, development and maintenance; infrastructure management and support, including forservers storage and network devices; and end user support including service desk. We expect that our businesses will become dependent on the services providedand systems operated for us by IBM and its third-party providers. The failure of one or more of these entities to meet our performance standards and expectations,including with respect to data security, may have a material adverse effect on our business, results of operations or financial condition.
Our success is dependent on our ability to maintain effective relationships with IBM and other third-party technology and service providers as well as the ability ofIBM and any other third-party providers to perform as expected. We may terminate our agreement with IBM and any and all Statements of Work at any time onshort notice for cause, convenience, certain specific performance failures, a breach of warranties by IBM, failure to transition, failure to transform, changes in law,force majeure, or a change in the control of either IBM or us. Depending on the type and timing of a termination, we may be required to pay certain terminationamounts to IBM. IBM's only right to terminate the Master Services Agreement is based on our failure to comply with certain terms applying to disputed payments.
Our ability to realize the expected benefits of this arrangement is subject to various risks, some of which are not within our control. These risks include, but are notlimited to, disruption in services and the failure to protect the security and integrity of our data under the terms of the agreement. We are unable to provideassurances that some or all of these risks will not occur. Failure to effectively mitigate these risks, if they occur, could have a material adverse effect on ouroperations and financial results. In addition, we could face significant additional costs or business disruption if our arrangement with IBM is terminated orimpaired and we cannot find alternative IT services or support on commercially reasonable terms or on a timely basis or if we are unable to hire new employees inorder to return these services in-house.
67

Table of Contents
We are required to evaluate the effectiveness of our internal control over financial reporting and publicly disclose material weaknesses in our controls. Anyadverse results from such evaluation may adversely affect investor perception, and our stock price.
Section 404 of the Sarbanes-Oxley Act of 2002 requires our management to assess the effectiveness of our internal control over financial reporting and to disclosein our filing if such controls were unable to provide assurance that a material error would be prevented or detected in a timely manner. We have an ongoingprogram to review the design of our internal controls framework in keeping with changes in business needs, implement necessary changes to our controls designand test the system and process controls necessary to comply with these requirements. If in the future, our internal controls over financial reporting are determinedto be not effective resulting in a material weakness or significant deficiency, investor perceptions regarding the reliability of our financial statements may beadversely affected which could cause a decline in the market price of our stock and otherwise negatively affect our liquidity and financial condition.
Failure to maintain our credit ratings could adversely affect our cost of funds and related margins, liquidity, competitive position and access to capital markets.
The major credit rating agencies routinely evaluate our indebtedness. This evaluation is based on a number of factors, which include financial strength as well astransparency with rating agencies and timeliness of financial reporting. There can be no assurance that we will be able to maintain our credit ratings and failure todo so could adversely affect our cost of funds and related margins, liquidity, competitive position and access to capital markets.
We may be unable to generate the cash flow to satisfy our expenses, make anticipated capital expenditures or service our debt obligations, including the Notesand the Revolving Credit Facility.
As of September 30, 2019, we have issued $1,700.0 million in aggregate principal amount of senior notes, which we refer to collectively as the Notes, and had$1,687.6 million in total outstanding debt. In April 2019, we entered into a new credit agreement with certain institutional lenders that provides for a five-year$500.0 million unsecured revolving credit facility, which we refer to as the Revolving Credit Facility, with an option to increase the Revolving Credit Facility byup to an additional $200.0 million, subject to the lenders' approval. The credit agreement will terminate in April 2024, at which point all amounts borrowed mustbe repaid (subject to two one-year maturity extension options).
We may not be able to generate sufficient cash flow to enable us to satisfy our expenses, make anticipated capital expenditures or service our indebtedness,including the Notes and the Revolving Credit Facility (if drawn upon). Our ability to pay our expenses, satisfy our debt obligations, refinance our debt obligationsand fund planned capital expenditures will depend on our future performance, which will be affected by general economic, financial, competitive, legislative,regulatory and other factors beyond our control. Based upon current levels of operations, we believe cash flow from operations and available cash will be adequatefor at least the next twelve months to meet our anticipated requirements for working capital, capital expenditures and scheduled payments of principal and intereston our indebtedness, including the Notes and the Revolving Credit Facility (if drawn upon). However, if we are unable to generate sufficient cash flow fromoperations or to borrow sufficient funds in the future to service our debt, we may be required to sell assets, reduce capital expenditures, refinance all or a portion ofour existing debt (including the Notes) or obtain additional financing. There is no assurance that we will be able to refinance our debt, sell assets or borrow moremoney on terms acceptable to us, or at all.
The indentures that govern the Notes contain various covenants that limit our ability and the ability of our subsidiaries to, among other things:
• incur liens;
• incur sale and leaseback transactions; and
• consolidate or merge with or into, or sell substantially all of our assets to, another person.
68
Table of Contents
The Credit Agreement contains two financial covenants along with customary affirmative and negative covenants that include the following:
• maintenance of a leverage ratio no greater than 3.0x (provided that if a material acquisition has been consummated,we are permitted to maintain a leverage ratio no greater than 3.5x for up to four quarters) and an interest coverage ratio no less than 3.0x
• covenants that limit or restrict the ability of the Company and its subsidiaries to, among other things, grant liens, merge or consolidate, dispose of all orsubstantially all of its assets, change their accounting or reporting policies, change their business and incur subsidiary indebtedness, in each case subjectto customary exceptions for a credit facility of this size and type.
As a result of these covenants, we are limited in the manner in which we can conduct our business, and we may be unable to engage in favorable business activitiesor finance future operations or capital needs. Accordingly, these restrictions may limit our ability to successfully operate our business. A failure to comply withthese restrictions could lead to an event of default, which could result in an acceleration of the indebtedness, which could result in an event of default under ourother debt instruments. Our future operating results may not be sufficient to enable compliance with these covenants to remedy any such default. In addition, in theevent of an acceleration, we may not have or be able to obtain sufficient funds to make any accelerated payments, including those under the Notes, and theRevolving Credit Facility (if drawn upon).
In addition, certain changes under the Tax Act may result in limitations on the deductibility of our net business interest expenses. The Tax Act generally limits theannual deduction for net business interest expense to an amount equal to 30% of adjusted taxable income. As a result, if our taxable income were to decline, wemay not be able to fully deduct our net interest expense. These changes, among others under the Tax Act, could result in increases to our future U.S. tax expenses,which could have a material impact on our business.
A portion of the transaction consideration we received from the divestiture of our Junos Pulse product portfolio is in the form of a non-contingent sellerpromissory note and we may not receive the amount owed to us (including accrued interest), including in the time frame contemplated, by the buyer under thenote.
In the fourth quarter of fiscal 2014, we completed the sale of our Junos Pulse product portfolio to an affiliate of Siris Capital, a private equity firm, for totalconsideration of $230.7 million, of which $125.0 million was in the form of an 18-month non-contingent interest-bearing promissory note issued to the Company.On May 1, 2017, we received a principal payment in the amount of $75.0 million and outstanding interest on the note, and we and the issuer agreed to furtheramend the terms of the note with respect to the remaining approximately $58.0 million to, among other things, extend the maturity date from December 31, 2018 toSeptember 30, 2022, provided that interest due can be paid in kind by increasing the outstanding principal amount of the note and subordinate the note to other debtissued by senior lenders. Since a portion of the transaction consideration is in the form of a non-contingent seller promissory note and the note is subordinated todebt issued by senior lenders, there is the risk that we may not receive the amount owed to us (including accrued interest), including in the time framecontemplated, under the note. In the event that the promissory note is not repaid on the terms we contemplate, any collection or restructuring efforts we undertakemay be costly and require significant time and attention from our management and there is no guarantee that we will be able to recover the amounts owed to us infull.
Our failure to pay quarterly dividends to our stockholders or the failure to meet our commitments to return capital to our stockholders could have a materialadverse effect on our stock price.
Our ability to pay quarterly dividends or achieve our intended capital return policy will be subject to, among other things, our financial position and results ofoperations, available cash and cash flow, capital and debt service requirements, use of cash for acquisitions and other factors. Any failure to pay or increase futuredividends as announced, or a reduction or discontinuation of quarterly dividends could have a material adverse effect on our stock price.
In January 2018, we announced that our Board of Directors approved a new $2.0 billion buyback authorization, which replaced our prior authorization and inOctober 2019, the Board authorized the repurchase of up to an additional $1.0 billion of common stock under the 2018 Stock Repurchase Program. In January2019, our Board of Directors declared an increase to our quarterly cash dividend to $0.19 per share. In October 2019, we entered into an ASR for an amount up to$200.0 million under the 2018 Stock Repurchase Program. Any failure to meet our commitments to return capital to our stockholders could have a material adverseeffect on our stock price.
69

Table of Contents
The investment of our cash balance and our investments in government and corporate debt securities and equity securities are subject to risks, which maycause losses and affect the liquidity of these investments.
At September 30, 2019, we had $1,204.8 million in cash and cash equivalents and $1,621.9 million in short-and long-term investments. We have invested theseamounts primarily in asset-backed securities, certificates of deposit, commercial paper, corporate debt securities, foreign government debt securities, money marketfunds, mutual funds, time deposits, U.S. government agency securities, and U.S. government securities. We also have $94.4 million in other long-term assets forour investments in privately-held companies. Certain of our investments are subject to general credit, liquidity, market, sovereign debt, and interest rate risks. Ourfuture investment income may fall short of expectations due to changes in interest rates or if the decline in fair value of our publicly traded debt or equityinvestments is judged to be other-than-temporary. These market risks associated with our investment portfolio may have a material adverse effect on our liquidity,financial condition, and results of operations.
Changes in the method of determining the London Interbank Offered Rate, or LIBOR, or the replacement of LIBOR with an alternative reference rate, mayadversely affect our financial condition and results of operations.
Certain of our financial obligations and instruments, including our credit facility, Pulse note, supplier finance programs, and floating rate notes that we haveinvested in, as well as interest rate swaps that we use as fair value hedges of our fixed-rate 2041 Notes, are or may be made at variable interest rates that useLIBOR (or metrics derived from or related to LIBOR) as a benchmark for establishing the interest rate. On July 27, 2017, the United Kingdom’s Financial ConductAuthority announced that it intends to stop persuading or compelling banks to submit LIBOR rates after 2021. These reforms may cause LIBOR to performdifferently than in the past or to disappear entirely. These reforms may also result in new methods of calculating LIBOR to be established, or alternative referencerates to be established. For example, the Federal Reserve Bank of New York has begun publishing a Secured Overnight Funding Rate, or SOFR, which is intendedto replace U.S. dollar LIBOR, and central banks in several other jurisdictions have also announced plans for alternative reference rates for other currencies. Thepotential consequences of these actions cannot be fully predicted and could have an adverse impact on the market value for or value of LIBOR-linked securities,loans, and other financial obligations or extensions of credit held by or due to us. Changes in market interest rates may influence our financing costs, returns onfinancial investments and the valuation of derivative contracts and could reduce our earnings and cash flows. In addition, any transition process may involve,among other things, increased volatility or illiquidity in markets for instruments that rely on LIBOR, reductions in the value of certain instruments or theeffectiveness of related transactions such as hedges, increased borrowing costs, uncertainty under applicable documentation, or difficult and costly consentprocesses. This could materially and adversely affect our results of operations, cash flows, and liquidity.
Our amended and restated bylaws provide that the Court of Chancery of the State of Delaware will be the sole and exclusive forum for substantially alldisputes between us and our stockholders, which could limit our stockholders’ ability to obtain a favorable judicial forum for disputes with us or our directors,officers, or employees.
Our amended and restated bylaws provide that, unless we consent to the selection of an alternative forum, the Court of Chancery of the State of Delaware (or if theCourt of Chancery does not have jurisdiction, the U.S. District Court for the District of Delaware) is the sole and exclusive forum for (i) any derivative action orproceeding brought on our behalf; (ii) any action asserting a claim of breach of fiduciary duty owed by any of our current or former directors, officers, or otheremployees to us or to our stockholders; (iii) any action asserting a claim arising pursuant to the Delaware General Corporation Law, our restated certificate ofincorporation, or our bylaws; (iv) any action or proceeding asserting a claim as to which Delaware General Corporation Law confers jurisdiction on the Court ofChancery or (v) any action asserting a claim governed by the internal affairs doctrine. The exclusive forum provisions in our bylaws may limit a stockholder’sability to bring a claim in a judicial forum that it finds favorable for disputes with us or our current or former directors, officers, or other employees, which maydiscourage such lawsuits against us and our current or former directors, officers, and other employees. Alternatively, if a court were to find the exclusive forumprovisions contained in our bylaws to be inapplicable or unenforceable in an action, we may incur additional costs associated with resolving such action in otherjurisdictions, which could have a material and adverse impact on our business.
Uninsured losses could harm our operating results.
We self-insure against many business risks and expenses, such as intellectual property litigation, cybersecurity and our medical benefit programs, where we believewe can adequately self-insure against the anticipated exposure and risk or where insurance is either not deemed cost-effective or is not available. We also maintaina program of insurance coverage for various types of property, casualty, and other risks. We place our insurance coverage with various carriers in numerousjurisdictions. The types and amounts of insurance that we obtain vary from time to time and from location to location, depending on availability, cost, and ourdecisions with respect to risk retention. The policies are subject to deductibles, policy limits, and exclusions that result in our retention of a level of risk on a self-insurance basis. In addition, our insurance coverage may not be adequate to compensate us for all losses or
70

Table of Contents
failures that may occur. Losses not covered by insurance could be substantial and unpredictable and could adversely affect our financial condition and results ofoperations.
Our stock price may fluctuate.
Historically, our common stock has experienced substantial price volatility, particularly as a result of variations between our actual financial results and thepublished expectations of analysts and as a result of announcements by our competitors and us. Furthermore, speculation in the press or investment communityabout our strategic position, financial condition, results of operations, business, security of our products, liabilities or significant transactions can cause changes inour stock price. In addition, the stock market has experienced extreme price and volume fluctuations that have affected the market price of many technologycompanies in particular and that have often been unrelated to the operating performance of these companies. From time to time, economic weakness hascontributed to extreme price and volume fluctuations in global stock markets that have also reduced the market price of many technology company stocks,including ours. These factors, as well as general economic and political conditions and the announcement of proposed and completed acquisitions or othersignificant transactions, or any difficulties associated with such transactions, by us or our current or potential competitors, may materially adversely affect themarket price of our common stock in the future.
71

Table of Contents
Item 2. Unregistered Sales of Equity Securities and Use of Proceeds
Purchases of Equity Securities by the Issuer and Affiliated Purchasers
The following table provides stock repurchase activity during the three months ended September 30, 2019 (in millions, except per share amounts):
Period
Total Numberof Shares
Purchased (1)
AveragePrice Paid
per Share (1)(2)
Total Numberof Shares
Purchased asPart of Publicly
AnnouncedPlans or
Programs(1)
Approximate DollarValue of Sharesthat May Yet Be
PurchasedUnder the Plans or
Programs(1)
July 1 - July 31, 2019 — $ — — $ 1,010.0August 1 - August 31, 2019 5.1 $ 24.90 5.1 $ 900.0September 1 - September 30, 2019 — $ — — $ 900.0
Total 5.1 $ — 5.1 ________________________________(1) Shares were repurchased under our Board approved 2018 Stock Repurchase Program, which authorized us to purchase an aggregate of up to $2.0 billion of our common
stock. Future share repurchases will be subject to a review of the circumstances in place at that time and will be made from time to time in private transactions or openmarket purchases as permitted by securities laws and other legal requirements, including Rule 10b-18 promulgated under the Exchange Act. This program may bediscontinued at any time. See Note 16, Subsequent Events, for discussion of the Company's stock repurchase activity, increased repurchase authorization and ASRsubsequent to September 30, 2019. For the majority of restricted stock units granted to executive officers of the Company, the number of shares issued on the date therestricted stock units vest is net of shares withheld to meet applicable tax withholding requirements. Although these withheld shares are not issued or considered commonstock repurchases under our stock repurchase program and therefore are not included in the preceding table, they are treated as common stock repurchases in our financialstatements as they reduce the number of shares that would have been issued upon vesting, see Note 10, Equity, in Notes to Condensed Consolidated Financial Statements inItem 1 of Part I of this Report.
(2) Represents the average price per share of the ASR and open market purchases.
As part of the 2018 Stock Repurchase Program, on April 29, 2019, we entered into an ASR to repurchase an aggregate of approximately $300.0 million of ouroutstanding common stock. During the second quarter of 2019, we made an up-front payment of $300.0 million pursuant to the ASR and received and retired aninitial 8.6 million shares of our common stock for an aggregate price of $240.0 million, based on the market price of $27.94 per share of our common stock on thedate of the transaction. During the third quarter of 2019, the ASR was completed and we received and retired an additional 3.0 million shares, based on volumeweighted average repurchase price, less an agreed upon discount, of $25.79 per share. The completion of the ASR resulted in a total repurchase of 11.6 millionshares of our common stock.
During the three months ended September 30, 2019, the Company also repurchased 2.1 million shares of its common stock in the open market for an aggregatepurchase price of $50.0 million at an average price of $23.63 per share, under the 2018 Stock Repurchase Program.
The shares received by us were retired, accounted for as a reduction to stockholder’s equity in the Condensed Consolidated Balance Sheets, and treated as arepurchase of common stock for purposes of calculating earnings per share. For further explanation of our ASR, see Note 10, Equity, in Notes to CondensedConsolidated Financial Statements in Item 1 of Part I of this Report.
72

Table of Contents
Item 6. Exhibits
ExhibitNumber Description of Document
4.1
Sixth Supplemental Indenture, dated August 26, 2019, by and between Juniper Networks, Inc. and The Bank of New York Mellon Trust Company, N.A., astrustee (which is incorporated herein by reference to Exhibit 4.1 of the Registrant's Current Report on Form 8-K filed on August 26, 2019)
4.2
Form of Note for Juniper Networks, Inc.’s 3.750% Senior Notes due 2029 (which is incorporated herein by reference to Exhibit 4.1 of the Registrant's CurrentReport on Form 8-K filed on August 26, 2019)
10.1 Employment Letter Agreement, dated July 30, 2019, between Juniper Networks, Inc. and Thomas A. Austin*+
31.1 Certification of Chief Executive Officer pursuant to Rule 13a-14(a)/15d-14(a) of the Securities Exchange Act of 1934*
31.2 Certification of Chief Financial Officer pursuant to Rule 13a-14(a)/15d-14(a) of the Securities Exchange Act of 1934*
32.1 Certification of Chief Executive Officer pursuant to 18 U.S.C. Section 1350**
32.2 Certification of Chief Financial Officer pursuant to 18 U.S.C. Section 1350**
101
The following materials from Juniper Network Inc.'s Quarterly Report on Form 10-Q for the quarter ended September 30, 2019, formatted in iXBRL (inlineeXtensible Business Reporting Language): (i) the Condensed Consolidated Statements of Operations (ii) the Condensed Consolidated Statements ofComprehensive Income, (iii) the Condensed Consolidated Balance Sheets, (iv) the Condensed Consolidated Statements of Cash Flows, (v) the CondensedConsolidated Statements of Changes in Stockholders' Equity, and (vi) Notes to Condensed Consolidated Financial Statements, tagged as blocks of text*
101.INS
XBRL Instance Document - the instance document does not appear in the Interactive Data File because its XBRL tags are embedded within the Inline XBRLdocument.
101.SCH XBRL Taxonomy Extension Schema Document*
101.CAL XBRL Taxonomy Extension Calculation Linkbase Document*
101.DEF XBRL Taxonomy Extension Definition Linkbase Document*
101.LAB XBRL Taxonomy Extension Label Linkbase Document*
101.PRE XBRL Taxonomy Extension Presentation Linkbase Document*
104
The cover page from the Company’s Quarterly Report on Form 10-Q for the quarter ended September 30, 2019, formatted in Inline XBRL (included inExhibit 101).
*Filed herewith. **Furnished herewith. +Indicates management contract or compensatory plan, contract or arrangement.
73

Table of Contents
SIGNATURES
Pursuant to the requirements of the Securities Exchange Act of 1934, the Registrant had duly caused this Report to be signed on its behalf by the undersignedthereunto duly authorized.
Juniper Networks, Inc.
November 6, 2019 By: /s/ Thomas A. Austin Thomas A. Austin
Vice President, Corporate Controller and Chief Accounting Officer(Duly Authorized Officer and Principal Accounting Officer)
74

EXHIBIT 10.1July 30, 2019
Thomas Austin[redacted]
Dear Thomas:
We are pleased to offer you the position of VP Corp Controller at Juniper Networks Inc. reporting to Ken Miller. Your primary work location will beWestford, MA (Technology Park). Your designation as Chief Accounting Officer, or CAO, is subject to the formal approval of the Board of Directors (or oneof its authorized committees).
This offer is contingent upon a successful background investigation.
Your offer is composed of the following components:
Offer Component Offer Amount Currency FrequencyBase Compensation 320,000.00 USD AnnualRSU 20,000 RSU Standard Vesting
Base Compensation: In consideration of your services, you will be paid an annual salary rate as mentioned above which will be paid semi-monthly, lessapplicable taxes and deductions in accordance with the Company’s normal payroll processing.
Bonus: You will be eligible to participate in Juniper's Company Performance Bonus Program (the "Program") with an annualized bonus target 50% of basesalary. This bonus could be higher or lower depending on Company and individual performance. This Program is a discretionary bonus program that Juniperfunds based on the achievement of business results and objectives established by Juniper, such as corporate financial results and results of company strategicgoals. Once the total funding level is established by Juniper, managers will determine in their discretion the award level for their employees based on themanager's assessment of individual performance. Accordingly, there is no specified or guaranteed amount that you will receive or become entitled to, and theProgram is subject to change or discontinuation at any time.
Starting next fiscal year, subject to approval by the Compensation Committee of the Board of Directors, you will be eligible to participate in the Plan. The Planmay include a performance share award component, which will be subject to your acceptance of a performance share agreement, which along with the Juniper’sequity incentive plan governing the award and applicable sub-plans, will set out additional terms and conditions of the grant.
Restricted Stock Units: Subject to compliance with applicable U.S. federal and state securities laws, we will recommend to the Stock Committee of the Board ofDirectors that you be granted Restricted Stock Units (RSU) of Juniper Networks, Inc. (Juniper) Common Stock. The RSUs will vest cumulatively over a periodof three years as long as you remain an employee of Juniper or one of its subsidiaries, with 34% of the shares vesting on the one-year anniversary of the vestingstart date and 33% vesting on second and third anniversaries of the vesting start date. The RSU grant will be subject to your acceptance of an RSU awardagreement, which, along with the Juniper equity incentive plan governing the RSU award and applicable sub-plans, will set out additional terms and conditions ofthe grant.
Other Company Agreements: Upon commencement of your employment, as a condition of your employment, you will sign the Company's ConfidentialInformation and Invention Assignment Agreement, the Worldwide Code of Business Conduct and Ethics Acknowledgment, the Reporting Ethics ConcernsAcknowledgement and Agreement and the Executive Compensation Recovery Agreement. You will also be eligible to enter into a change in control agreementconsistent with the Company’s standard form for individuals in your position and renewal of such agreement upon its expiration to the extent it is renewed forsimilar situated officers.
Confidentiality: Except as required by applicable laws, neither party shall disclose the contents of this agreement without first obtaining the prior written consentof the other party, provided, however, that you may disclose this agreement to your attorney, financial planner and tax advisor if such persons agree to keep theterms hereof confidential.
Page | 2
For purposes of federal immigration law, you will be required to provide to Juniper documentary evidence of your identity and eligibility for employment in theUnited States. Such documentation must be provided to us within three business days of your date of hire with Juniper, or our employment relationship with youmay be terminated. Please bring the appropriate documents on your first day of employment.
This offer is contingent upon your obtaining the requisite immigration status and employment authorization. If you are a foreign national requiring workauthorization to begin employment, you must contact the Company's Immigration Department at [email protected] to initiate the visa process. TheCompany will submit a petition on your behalf to obtain employment authorization, as well as file visa applications for your immediate dependent familymembers. The Company will pay the legal fees and costs related to these filings. Because the number of work visas available each year is limited by the U.S.government, the Company reserves the right to withdraw or suspend this offer if the Company is not able to obtain work authorization for you in a reasonableperiod of time. Please note that if you currently have employment authorization such as practical, curricular or academic training (F-1 or J-1), you must contactthe Company's Immigration Department before beginning employment.
In the event your employment includes frequent business travel, the time you spend working outside your home state may result in additional tax reporting andtax payment liabilities. Although Juniper may pro-rate your state tax withholdings, it will be your responsibility to determine and comply with any resultingincome tax obligations.
At-Will Employment: If you accept this offer, you understand and agree that your employment with the Company is for no specified period and constitutes “atwill” employment. As a result, you will be free to resign at any time, for any reason or no reason. The Company will similarly have the right to end itsemployment relationship with you at any time, with or without notice and with or without cause. You understand and agree that any representation to the contraryis unauthorized and not valid unless obtained in writing and signed by the Chief Executive Officer, the Senior Vice President of Human Resources or the GeneralCounsel.
Please keep in mind that this offer will expire on August 06, 2019.
If you accept this offer, your start date will be on September 3, 2019.
We are delighted to have you join us at Juniper Networks. Welcome Aboard!
Very truly yours,
p.p. /s/ Eva Andres 8/2/2019SVP, Human ResourcesSigning on behalf of; Brian Robinson, Juniper Networks, Inc.
Brian RobinsonSenior Director, Talent AcquisitionJuniper Networks, Inc.
I accept the terms of this letter and agree to keep the terms of this letter confidential.
/s/ Thomas A. AustinSignature - Thomas Austin
7/31/2019Date Signed
Start Date: Tuesday, 9/3/2019

EXHIBIT 31.1
Certification of Principal Executive OfficerPursuant to
Exchange Act Rules 13a-14(a) and 15d-14(a),As Adopted Pursuant to
Section 302 of the Sarbanes-Oxley Act of 2002
I, Rami Rahim, certify that:
1. I have reviewed this Quarterly Report on Form 10-Q of Juniper Networks, Inc.;
2. Based on my knowledge, this report does not contain any untrue statement of a material fact or omit to state a material fact necessary to make the statementsmade, in light of the circumstances under which such statements were made, not misleading with respect to the period covered by this report;
3. Based on my knowledge, the financial statements, and other financial information included in this report, fairly present in all material respects the financialcondition, results of operations and cash flows of the registrant as of, and for, the periods presented in this report;
4. The registrant's other certifying officer(s) and I are responsible for establishing and maintaining disclosure controls and procedures (as defined in Exchange ActRules 13a-15(e) and 15d-15(e)) and internal control over financial reporting (as defined in Exchange Act Rules 13a-15(f) and 15d-15(f)) for the registrant andhave:
(a) Designed such disclosure controls and procedures, or caused such disclosure controls and procedures to be designed under our supervision, to ensure thatmaterial information relating to the registrant, including its consolidated subsidiaries, is made known to us by others within those entities, particularlyduring the period in which this report is being prepared;
(b) Designed such internal control over financial reporting, or caused such internal control over financial reporting to be designed under our supervision, toprovide reasonable assurance regarding the reliability of financial reporting and the preparation of financial statements for external purposes inaccordance with generally accepted accounting principles;
(c) Evaluated the effectiveness of the registrant's disclosure controls and procedures and presented in this report our conclusions about the effectiveness ofthe disclosure controls and procedures, as of the end of the period covered by this report based on such evaluation; and
(d) Disclosed in this report any change in the registrant's internal control over financial reporting that occurred during the registrant's most recent fiscalquarter (the registrant's fourth fiscal quarter in the case of an annual report) that has materially affected, or is reasonably likely to materially affect, theregistrant's internal control over financial reporting; and
5. The registrant's other certifying officer(s) and I have disclosed, based on our most recent evaluation of internal control over financial reporting, to theregistrant's auditors and the audit committee of the registrant's board of directors (or persons performing the equivalent functions):
(a) All significant deficiencies and material weaknesses in the design or operation of internal control over financial reporting which are reasonably likely toadversely affect the registrant's ability to record, process, summarize, and report financial information; and
(b) Any fraud, whether or not material, that involves management or other employees who have a significant role in the registrant's internal control overfinancial reporting.
Date: November 6, 2019
/s/ Rami Rahim Rami RahimChief Executive Officer(Principal Executive Officer)

EXHIBIT 31.2
Certification of Principal Financial OfficerPursuant to
Exchange Act Rules 13a-14(a) and 15d-14(a),As Adopted Pursuant to
Section 302 of the Sarbanes-Oxley Act of 2002
I, Kenneth B. Miller, certify that:
1. I have reviewed this Quarterly Report on Form 10-Q of Juniper Networks, Inc.;
2. Based on my knowledge, this report does not contain any untrue statement of a material fact or omit to state a material fact necessary to make the statementsmade, in light of the circumstances under which such statements were made, not misleading with respect to the period covered by this report;
3. Based on my knowledge, the financial statements, and other financial information included in this report, fairly present in all material respects the financialcondition, results of operations and cash flows of the registrant as of, and for, the periods presented in this report;
4. The registrant's other certifying officer(s) and I are responsible for establishing and maintaining disclosure controls and procedures (as defined in Exchange ActRules 13a-15(e) and 15d-15(e)) and internal control over financial reporting (as defined in Exchange Act Rules 13a-15(f) and 15d-15(f)) for the registrant andhave:
(a) Designed such disclosure controls and procedures, or caused such disclosure controls and procedures to be designed under our supervision, to ensure thatmaterial information relating to the registrant, including its consolidated subsidiaries, is made known to us by others within those entities, particularlyduring the period in which this report is being prepared;
(b) Designed such internal control over financial reporting, or caused such internal control over financial reporting to be designed under our supervision, toprovide reasonable assurance regarding the reliability of financial reporting and the preparation of financial statements for external purposes inaccordance with generally accepted accounting principles;
(c) Evaluated the effectiveness of the registrant's disclosure controls and procedures and presented in this report our conclusions about the effectiveness ofthe disclosure controls and procedures, as of the end of the period covered by this report based on such evaluation; and
(d) Disclosed in this report any change in the registrant's internal control over financial reporting that occurred during the registrant's most recent fiscalquarter (the registrant's fourth fiscal quarter in the case of an annual report) that has materially affected, or is reasonably likely to materially affect, theregistrant's internal control over financial reporting; and
5. The registrant's other certifying officer(s) and I have disclosed, based on our most recent evaluation of internal control over financial reporting, to theregistrant's auditors and the audit committee of the registrant's board of directors (or persons performing the equivalent functions):
(a) All significant deficiencies and material weaknesses in the design or operation of internal control over financial reporting which are reasonably likely toadversely affect the registrant's ability to record, process, summarize, and report financial information; and
(b) Any fraud, whether or not material, that involves management or other employees who have a significant role in the registrant's internal control overfinancial reporting.
Date: November 6, 2019
/s/ Kenneth B. Miller Kenneth B. MillerExecutive Vice President, Chief Financial Officer(Principal Financial Officer)

EXHIBIT 32.1
Certification of Chief Executive OfficerPursuant to 18 U.S.C. Section 1350 As Adopted
Pursuant to Section 906 of the Sarbanes-Oxley Act of 2002
I, Rami Rahim, certify, pursuant to 18 U.S.C. Section 1350, as adopted pursuant to Section 906 of the Sarbanes-Oxley Act of 2002, that the Quarterly Report ofJuniper Networks, Inc. on Form 10-Q for the three months ended September 30, 2019, fully complies with the requirements of Section 13(a) or 15(d) of theSecurities Exchange Act of 1934 and that information contained in such Quarterly Report on Form 10-Q fairly presents, in all material respects, the financialcondition and results of operations of Juniper Networks, Inc.
/s/ Rami Rahim Rami RahimChief Executive OfficerNovember 6, 2019

EXHIBIT 32.2
Certification of Chief Financial OfficerPursuant to 18 U.S.C. Section 1350 As Adopted
Pursuant to Section 906 of the Sarbanes-Oxley Act of 2002
I, Kenneth B. Miller, certify, pursuant to 18 U.S.C. Section 1350, as adopted pursuant to Section 906 of the Sarbanes-Oxley Act of 2002, that the QuarterlyReport of Juniper Networks, Inc. on Form 10-Q for the three months ended September 30, 2019, fully complies with the requirements of Section 13(a) or 15(d) ofthe Securities Exchange Act of 1934 and that information contained in such Quarterly Report on Form 10-Q fairly presents, in all material respects, the financialcondition and results of operations of Juniper Networks, Inc.
/s/ Kenneth B. Miller Kenneth B. MillerExecutive Vice President, Chief Financial OfficerNovember 6, 2019