Embed Size (px)
Citation preview

NDMA Nyeri County Kieni Sub-County Drought Monitoring Bulletin for June 2014 Page 1 Email: [email protected]
KIENI SUB-COUNTY DROUGHT MONTHLY BULLETIN FOR JULY 2014
July 2014 Nyeri County Early Warning
Stages and Trends
Early Alert: Worsening
Early Alert: Worsening

NDMA Nyeri County Kieni Sub-County Drought Monitoring Bulletin for June 2014 Page 2 Email: [email protected]
Situation Overview
The month of July was generally dry and windy. Light showers were realized in some parts of
the Kieni Sub County which had no significant impact on both crops and livestock production.
On average, 39.95 mm of rainfall were realized during the month.
Due to the erratic and depressed rains experienced in the area, the current river flows are at the
minimum base flow. Water holding structures and pans are drying up while the boreholes are
currently not recharged though the static levels have been maintained. Average distances to
water sources have increased in the region
Livestock body condition was fair tending to poor. Observed body conditions could be
attributed to deteriorating pasture conditions as well as long trekking distances to and from
watering points and grazing areas. Available pastures are expected to last for 2 to 3 weeks if the
current situation does not change. Browse condition remained good across all the livelihood
zones.
March-April-May (MAM) season crop suffered from moisture stress as the season rains were
below average. Crop were affected at critical production stages as maize dried at tasseling stage,
wheat dried at knee height while beans were lost at flowering and pod formation stage.
However, only small yields might be realized by few households that planted early before MAM
season onset.
Due to the deteriorating livestock body conditions cattle average prices dropped by 28 percent,
from Kshs 36,083.30 in June to 25,964 in July. Sheep and goat prices also declined by 27.2
percent and 11.8 percent from Kshs 4,051.80 and Kshs 3,800 in June to Ksh 2,947.90 and Ksh
3,350 in July respectively.
Milk production was on a downward trend registering a 9.8 percent drop from 6.8 bottles in
June to 6.1 bottles in July. Drop in the production is attributed to the deteriorating pasture
condition and long trekking distance in search of pasture. Milk consumption decreased by 10.5
percent from 2.0 bottles in June to 1.79 bottles in July. A bottle of milk retailed for 1.04 percent
more from Kshs 20.48 in June to 20.77 in July.
Majority of the household relied on markets to meet household needs during the month under
review. A kilo of maize retailed for 5.3 percent higher from Kshs 47.47 June to Kshs 50 July.
A kilo of beans retailed for 4.4 percent less from Kshs 83.1 last month to Kshs 79.45 in July.
Nutrition status of children below the age of five during the month under review stood at 3.07
percent. Highest malnutrition rates were reported in Naromoru of 7.3 percent followed by Thegu
at 2.4 percent, Mwiyogo 2.1 percent and Kabaru at 1.3 percent. Observed status was above the
normal threshold. This could be attributed to poor feeding habits, decline in exclusive
breastfeeding and food shortage.
Recommendations to CSG and KFSSG
Vaccination for cattle against Lumpy Skin Disease. (LSD) and Foot and Mouth Disease
(FMD). In addition, livestock disease surveillance should be intensified (Action: CDVS)
Provision of certified seeds to needy households in preparation for the October to December
short rains planting season (Action CDA)
Campaigns on early destocking and promotion of supplementary feeding as a dry season
feeding strategy should be undertaken (Action CDLP)
Hold peace building meetings to enhance dialogue, cohesion and negotiation on resource
sharing between pastoralists and Kieni residents (Action: CSG)
Provision of supplementary feeding for children at risk of malnutrition (Action DNO)
Provision of water for irrigation purposes should be increased to improve on food production.
Water harvesting at community and household level should also be promoted (Action CDW)
NDMA Nyeri County Kieni Sub-County Drought Monitoring Bulletin for June 2014 Page 3 Email: [email protected]
1.0 ENVIRONMENTAL INDICATORS (STABILITY) 1.1 Rainfall
The month of July had been dry and windy. On average 39.95 mm were realized in the region,
which were poorly distributed. The rains did not have any positive impact on the livestock and
crop production.
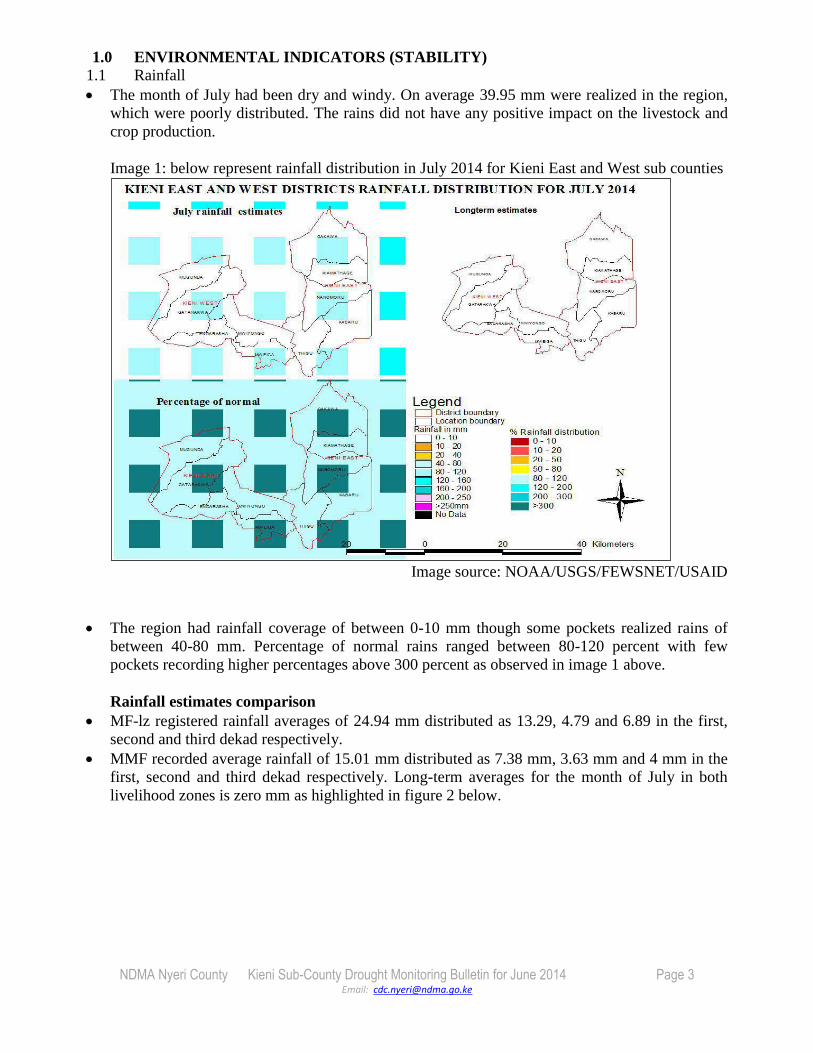
Image 1: below represent rainfall distribution in July 2014 for Kieni East and West sub counties
Image source: NOAA/USGS/FEWSNET/USAID
The region had rainfall coverage of between 0-10 mm though some pockets realized rains of
between 40-80 mm. Percentage of normal rains ranged between 80-120 percent with few
pockets recording higher percentages above 300 percent as observed in image 1 above.
Rainfall estimates comparison
MF-lz registered rainfall averages of 24.94 mm distributed as 13.29, 4.79 and 6.89 in the first,
second and third dekad respectively.
MMF recorded average rainfall of 15.01 mm distributed as 7.38 mm, 3.63 mm and 4 mm in the
first, second and third dekad respectively. Long-term averages for the month of July in both
livelihood zones is zero mm as highlighted in figure 2 below.

NDMA Nyeri County Kieni Sub-County Drought Monitoring Bulletin for June 2014 Page 4 Email: [email protected]
Figure 2: Shows rainfall distribution estimates in MF and MMF livelihood zones
1.2 Condition of natural vegetation and pasture
Quality:
Pasture quality was below normal as compared to a similar period last year. This is attributed to
the low precipitation, frost attacks and windy conditions. However the browse situation was
good.
Kieni low lands were the most affected with most of its natural pastures having dried up. High
attitude zones bordering the mountains registered fair pasture quality, which was also on a
deteriorating trend.
Quantity:.
Pastures quantity was low throughout the region and are fast getting diminished due to over
grazing, vagaries of weather most specifically frequent frost attacks coupled with strong winds
blowing off loose pasture. Influx of pastoralists and about 300 herds of cattle have been reported
in Kieni East areas of Gakawa, Naromoru, Solio ranch headed to Mt Kenya and Kabaru
depleted visible pastures.
Livestock hardly have enough for their upkeep with most farmers opting to fetching pastures
along road reserves through cut and carry methods, while others are secretly moving their
livestock into private ranches. The available pastures are expected to last for 2-3 weeks if the
current situation does not revert..
Average Tropical Livestock Unit in mixed farming livelihood zone was 3.5 while in the
marginal mixed livelihood zones stood at 4.5, registering a high carrying capacity compared to
normal.
Distance to grazing areas
Average grazing distance for July increased by 2.04 percent from 1.47 Km in June to 1.5 Km in
July. Registered distances were however lower by 21 percent, compared to the 2011-2013 long
term averages of 1.9 Km as highlighted in the image 3 below.

NDMA Nyeri County Kieni Sub-County Drought Monitoring Bulletin for June 2014 Page 5 Email: [email protected]
Figure 3: presentation of average return distances from grazing fields and households’ to water
points
<Source: NDMA sentinile sites. Total sample size (n) 330 HH.>
Trekking distances to watering point in FE/CWL/B-lz and MMF-lz registered a 14.2 percent
and 5.8 percent rise from 0.7 Km and 1.7 Km in June to 0.8km and 1.8Km in July respectively.
However, distances at MF-lz dropped by 5.2 percent from 2 Km in June to 1.9 Km in July.
1.3 Water Sources and Availability
Tapped water and natural rivers were the main water sources for the majority of household
during the month under review as highlighted in figure 4 below. There was a drop in water
usage from natural rivers to stand at 33 percent.
Figure 4: Shows main water sources for the region
Jan Feb Mar Apr May Jun Jul
11-13 ave. grazing dist 1.7 1.9 1.9 1.8 1.9 1.7 1.9
11-13 ave. hh dist 1.3 1.4 1.5 1.2 1.2 1.2 1.3
2014 ave grazing dist 1.7 1.6 1.3 1.4 1.4 1.5 1.5
2014 ave hh dist 1.2 1.2 0.8 0.8 0.9 0.9 0.9
0.0
0.5
1.0
1.5
2.0
2.5
Dis
tan
ces i
n k
m
Average 2014 grazing and household return distances to water points for Kieni vs 2011-2013
averages
33%
67%
Main water sources and % of users in July 2014
Natural rivers
Other water sources

NDMA Nyeri County Kieni Sub-County Drought Monitoring Bulletin for June 2014 Page 6 Email: [email protected]
1.3.1 Households’ access to water
Household distances to water sources increased by 3.33 percent from 0.9 Km in June to 0.93
Km in July. Average waiting time also dropped by 21.25 percent from 0.8hr in June to 0.63hr in
July. Compared to the 2011-2013 long term averages of 1.3 Km the distances were good as
indicaed in figure 3 below.
MMF-lz and FE/CWL/B-lz registered a rise in distances from 1.3 Km and 0.7 Km in June to 1.4
and 0.8 in July respectively. Distances in MF-lz dropped by 33.3 percent from last month to
stand at 0.6 Km.
1.4 Emerging issues
1.4.1 Insecurity/Conflict/Human Displacement
No conflicts incidences were reported during the period of monitoring.
1.4.2 Migrations.
Influx of pastoralists and about 300 herds of cattle have been reported in Kieni East areas of
Gakawa, Naromoru, Solio ranch headed to Mt Kenya and Kabaru in search of pasture of water.
1.5 Implications on Food Security
Due poor performance of the MAM season and below normal precipitation during the month
under review the current pasture is poor in quality and quantity. Current pastures are expected to
last for 2-3 weeks. Livestock body condition has also deteriorated leading to a drop in milk
production
River flows are at the base flow while the water holding structures have dried up. Distances to
water source from grazing field and household level have increased leading to a deterioration of
the body condition further. Issues of water related conflict and rationing are expected to
increase.
In migration of large herds of animals from neigbouring counties combined with livestock
disease outbreaks as a result of uncontrolled livestock movements will only worsen an already
deteriorating situation. Increased cases of livestock diseases and conflict among communities
are expected.
2.0 RURAL ECONOMY INDICATORS (FOOD AVAILABILITY)
2.1 Livestock Production
2.1.1 Livestock Body Condition
Livestock body condition was fair in high attitude zones and fair tending to poor in lower zones
of Kieni Plains. Observed body conditions could be attributed to deteriorating pasture
conditions as well as long trekking distances to and from watering points and grazing areas to
those doing roadside and forest grazing. Road side grazing did contribute to deteriorating
livestock body conditions as most grass species along the road reserves consists of
unpalatable species.
2.1.2 Livestock Diseases
Suspected cases of Lumpy Skin Disease (LSD) have been reported in Mweiga- Kieni West and
a ring vaccination is being undertaken. In addition, unconfirmed cases of the same were
reported in Solio settlement. Cases of Foot and Mouth disease (FMD) have been reported in
Maragima in Kieni East Sub County, and investigations are still ongoing for necessary action
to be taken. Common livestock diseases in Kieni sub county include ECF, Anaplasmosis, Eye
infections and NCD in fowls.

NDMA Nyeri County Kieni Sub-County Drought Monitoring Bulletin for June 2014 Page 7 Email: [email protected]
2.1.3 Milk production
Milk production was on a downward, registering a 9.8 percent drop from 6.8 bottles in June to
6.1 bottles in July. Drop in the production is attributed to the deteriorating pasture condition,
which has an effect in the livestock body condition and health. Compared to 2011-2013 long-
term averages of 4.8 bottles the observed production was above threshold.
Deteriorating livestock body condition due to poor pasture conditions and long trekking
distances from grazing field and watering points has led to a 12.8 percent and 8.9 percent drop
production in MMF-lz and MF-lz from 8.7 bottles and 11.24 bottles to 7.6 bottles and 10.22
bottles in July.
Figure 5: Presentation of average milk production and consumption for the region
<Source: NDMA sentinile sites. Total sample size (n) 330 HH.>
2.2 Crop Production
2.2.1 Timeliness and condition of various crop production activities
The March-April-May (MAM) season crops suffered moisture stress at various critical stages of
development, with little or no yields expected if any. Maize and wheat dried at tussling and knee
height stage, while beans dried at flowering and pod formation stage. Horticulture crops are
doing fair under supplemental irrigation.
The region is on the brink of fourth consecutive season of total crop failure if current weather
conditions persist.
2.2.3 Harvest
Minimal crop harvests continued being realized in high attitude zones bordering the mountains
Jan Feb Mar Apr May Jun Jul
Milk consumption(2011-2013
ave) 1.8 1.6 1.7 1.8 1.8 1.8 1.6
Milk consumption yr. 2014 1.8 1.9 2.0 2.0 2.0 2.0 1.8
Milk production(2011-2013 ave) 5.1 4.7 5.1 5.4 5.3 5.4 4.8
Milk production yr. 2014 6.8 6.5 7.2 7.6 7.2 6.8 6.1
0.0
0.5
1.0
1.5
2.0
2.5
0.0
1.0
2.0
3.0
4.0
5.0
6.0
7.0
8.0
9.0
Mil
k c
on
sum
pti
on
in
75
0 m
l b
ott
les
Mil
k p
rod
uct
in i
n
75
0 m
l b
ott
les
Average household daily milk production and consumption in year
2014 as compared to 2011-2013 averages

NDMA Nyeri County Kieni Sub-County Drought Monitoring Bulletin for June 2014 Page 8 Email: [email protected]
where households are harvesting Irish potato chats. However, some households in upper
livelihood zones are currently harvesting beans though negligible.
2.2.4 Implications on Food Security
There is a drop in on farm activities and in extension a drop in casual engagements to majority
of the households. Crops performance was also poor as season loses were massive having
experienced a fourth total crop failure.
Negligible yields will be realized to few households. More so none of the household monitored
held food reserves thus majority of the households continue to rely on markets as their main
food supply.
Reported losses were further aggravated by frost bites and emergence of pests and diseases like
Tuta abosoluta and MLND.
3.0 ACCESS TO FOOD
3.1 Livestock marketing
3.1.1 Cattle prices
Markets reacted to deteriorating livestock body conditions, with a 28 percent drop in prices.
Cattle sold for an average of Ksh 25,964.30 in July, down from Ksh 36,083.30 registered in
June. Compared to 2011-2013 price averages of Ksh 19,2601.10 the months prices were high
as highlighted in figure 6 below.
There was a decline in prices across livelihood zones with MMF-lz and Mf-lz registering
average prices of Kshs 24,928.60 and 27,000 in July down from Kshs 39,333.30 and 32,833.30
in June respectively.
Figure 6: Presentation of average cattle and sheep prices
<Source: NDMA sentinile sites. Total sample size (n) 330 HH.>
3.1.2 Sheep prices
Jan Feb Mar Apr May Jun Jul
2011-2013 ave sheep prices 2676.6 2719.4 2582.3 2452.6 2422.7 2512.2 2415.6
Yr 2014 ave. sheep prices 3910.0 3598.8 3740.5 3669.1 3733.4 4051.8 2947.9
2011-2013 ave cattle prices 21079.3 20841.0 22306.2 22565.1 21448.4 21765.6 19260.1
Yr 2014 ave. cattle prices 26500.0 0.0 22375.8 24450.0 29632.0 36083.3 25964.3
0.0
500.0
1000.0
1500.0
2000.0
2500.0
3000.0
3500.0
4000.0
4500.0
5000.0
0.0
5000.0
10000.0
15000.0
20000.0
25000.0
30000.0
35000.0
40000.0
Sh
eep
pri
ces
in k
sh
Ca
ttle
pri
ces
in k
sh
Average prices of cattle and sheep year 2014 as compared
to 2011-2013 average prices

NDMA Nyeri County Kieni Sub-County Drought Monitoring Bulletin for June 2014 Page 9 Email: [email protected]
Sheep prices dropped by 27.2 percent, from Ksh 4051.80 in June to Kshs 2947.9 in July.
Compared to 2011-2013 long-term averages of Kshs 2415.60, current prices were above
average.
Prices of Ksh 3,345.80 and Kshs 2,550 were registered in MMF and MF livelihood zones during
the month under review.
3.2 Livestock sales
During the period of monitoring, livestock sale numbers increase by 75 percent for goats while
for sheep decreased by 13.2 percent. Number of cattle offered for sale remained the same as for
last month. 11 cattle, 38 sheep and 16 goats were sold during the month under review.
3.2 Milk consumption.
Milk consumption decreased by 10.5 percent from 2.0 bottles in June to 1.79 bottles in July.
The month’s consumption was below 2011-2013 long term averages of 1.6 bottles as outlined in
figure 5 above.
MMF and MF-lz registered 12.2 percent and 11.1 percent drop in consumption from 2.8 bottles
and 3.1 bottles in June, to 2.4 bottle and 2.7 bottles in July. FE/CWL/B-lz recorded 17.6 percent
rise in consumption from 0.15 bottles in June to 0.18 bottles in July.
3.4 Crop Marketing
3.4.1 Maize prices
Maize prices increased by 5.5 percent as compared to last month, to retail for Kshs 50.0 a kilo
in July up from Ksh 47.40 in June. Compared to the 2011-2013 long term averages of Kshs
41.9 the prices were above normal averages as outlined in figure 7 below.
FE/CWL/B-lz and MF-lz registered 1.47 percent and 3.5 percent rise in price, with a kilo
retailing for Ksh 48 and Ksh 47.7 respectively in July, up from Ksh 47.3 and 46.1 in June
Figure 7: Outlines average price trends for maize and beans
<Source: NDMA sentinile sites. Total sample size (n) 330 HH.
3.4.2. Beans prices
Beans prices were on a downward trend, dropping by 4.2 to retail at Ksh 79.45 a kilo in July

NDMA Nyeri County Kieni Sub-County Drought Monitoring Bulletin for June 2014 Page 10 Email: [email protected]
from Ksh 83.10 in June. Observed drop in beans prices was attributed to realization of some
beans yields from the MAM season harvests. Compared to the 2011-2013 long term averages
of Ksh 75.10, the prices were within the normal threshold as can be observed in figure 7 above.
At livelihood zones, a kilo retailed for 83.1 in MF-lz down from 92.1 last month while in
MMF-lz prices registered 9.5 percent increase in prices from Ksh 69.20 in June to 75.8 in July.
3.5 Incomes
3.5.1 Crop income
Income from sale of crops dropped by 47% as compared to last month. Sales were mainly from
onions, carrots, cabbages and potatoes although in small scales. Sale of crops income
accounted for 2.8 percent of total households’ source of income.
In MMF-lz crop sales decreased by 62 percent while in MMF-lz they remained as was reported
last month.
Reported sales especially for potatoes and carrots were obtained from forest farming under
plantation establishment and livelihood improvement scheme (PELIS).
Figure 8 below is a tabulation of household’s income sources.
Figure 8: Tabulation of households’ income sources
<Source: NDMA sentinile sites. Total sample size (n) 330 HH.>
3.5.2 Livestock incomes.
Sale of livestock products and specifically milk sales is the second most relied upon source
of household income from casual labour, accounting for 24.5 percent of total household
income sources. During the month under review, income from sale of livestock products
slightly dropped by 1.2 percent compared to the previous month.
A 750 ml bottle retailed for 1.42 percent more, from Ksh 20.48 in June to Ksh 20.77 in
July.
3.5.3 Other sources of income
Number of persons in employment dropped 2.3 percent from last month. Casual labour

NDMA Nyeri County Kieni Sub-County Drought Monitoring Bulletin for June 2014 Page 11 Email: [email protected]
increased by 3.7 percent with wage incomes from casual labour accounting for 34.6 percent of
total household source of incomes in July up from 33.4 percent reported in June. Daily wage
rate registered 0.5 percent rise from Ksh 203.67 in June to Ksh 204.67 in July.
Petty trading increased by 2 percent and accounted for 15.8 percent of total household source
of income. Remittances and formal employment declined by 33.3 percent and 8 percent
accounting for 2.5 percent and 8 percent of total household source of income respectively
3.6 Households terms of trade;
Cereal : meat price ratio
Terms of trade ratio increased by 27 percent from 0.33 in June to 0.42 percent in July as
pointed out in the figure below.
A kilo of maize-posho retailed for an average of Ksh 49.50 up from Kshs 48.87 while a kilo of
shoat live meat retailed for Kshs 121.58 down from Kshs 151.03 last month. A kilo of live
meat was equivalent to 2.5 kilograms of cereals during the month under review.
Figure 9: Analysis of households terms of trade
<Source: NDMA sentinile sites. Total sample size (n) 330 HH.>
4.0 HUMAN WELFARE INDICATORS (UTILIZATION OF FOOD)
4.1 Nutrition Status
Nutrition status of children below the age of five during the month under review stood at 3.07
percent. Observed status was above the 2011-2013 long term averages of 1.3 as outlined in
figure 10.
Figure 10: Presentation of nutrition status of children below five years
Jan Feb Mar Apr May Jun Jul
Cereal:meat price ratio(11-13 ave)
0.4 0.3 0.4 0.4 0.5 0.5 0.5
Cereal:meat price ratio yr 2014
0.3 0.3 0.3 0.3 0.3 0.3 0.4
0.0
0.1
0.2
0.3
0.4
0.5
0.6
July 2014 vs (2011-2013) averages Cereal:Meat price ratio

NDMA Nyeri County Kieni Sub-County Drought Monitoring Bulletin for June 2014 Page 12 Email: [email protected]
<Source: NDMA sentinile sites. Total sample size (n) 330 HH.>
Out of 1143 children monitored during the month, 16 registered MUAC below 135 mm with
Narumoru registering the highest percentage of children at risk of malnutrition of 7.3 percent
followed by Thegu at 2.4 percent.
4.2 Health
No observable human diseases outbreaks were noted in the region for the period of monitoring.
5. CURRENT INTERVENTION MEASURES AND COPING STRATEGIES
5.1 Non-food interventions
No interventions were ongoing.
5.2 Food Aid
No food assistance was reported during the period of monitoring.
5.3 Coping strategies Coping strategy index stood at 1.17 in July down from 1.2 in June accounting for 2.5 percent drop as
indicated in the figure 11 below.
Most households in the region employed low coping strategies below the score of 14. Gatarakwa
registered high coping in the region of 1.7 score, Kabaru 0.9 and Gakawa 0.5 and Endarasha at 0.3.
Figure 11: presentation of the region coping strategies
Jan Feb Mar Apr May Jun Jul
2011-2013 % of under fives at risk of mulnutrition
0.9 1.4 1.6 1.3 1.3 1.6 1.3
Yr 2014 % of under fives at risk of malnutrition
1.7 1.2 2.4 3.9 4.1 4.3 3.1
0
1
2
3
4
5
% a
t ri
sk o
f m
aln
utr
itio
n
Percentage Nutritional status of children aged between 13-59 months at risk of malnutrition compared to 2011-2013 averages

NDMA Nyeri County Kieni Sub-County Drought Monitoring Bulletin for June 2014 Page 13 Email: [email protected]
<Source: NDMA sentinile sites. Total sample size (n) 330 HH.>
Some of the coping mechanisms employed by households included borrowing from friends and
relatives, remittances, gifts, charcoal burning and skipping meals.
6.0 RECOMMENDATIONS TO CSG AND KFSSG
Vaccination for cattle against Lumpy Skin Disease. (LSD) and Foot and Mouth Disease
(FMD). In addition, livestock disease surveillance should be intensified (Action: CDVS)
Provision of certified seeds to needy households in preparation for the October to December
short rains planting season (Action CDA)
Campaigns on early destocking and promotion of supplementary feeding as a dry season
feeding strategy should be undertaken (Action CDLP)
Hold peace building meetings to enhance dialogue, cohesion and negotiation on resource
sharing between pastoralists and Kieni residents (Action: CSG)
Provision of supplementary feeding for children at risk of malnutrition (Action DNO)
Provision of water for irrigation purposes should be increased to improve on food production.
Water harvesting at community and household level should also be promoted (Action CDW)
Jan Feb Mar Apr May Jun Jul
Coping strategy index yr.2013
0.9 0.9 1.1 1.6 1.5 1.2 1.2
Coping strategy index(11-13 ave)
0.9 1.1 1.0 1.2 0.9 1.0 1.0
0.0
0.2
0.4
0.6
0.8
1.0
1.2
1.4
1.6
1.8
Household coping strategy index year 2014 vs (2011-2013) averages