Embed Size (px)
Citation preview
Powering BeyondMacquarie investor meetingsJuly 17 ‐ 18, 2018
Safe harborThis presentation contains statements that may be considered forward looking statements, such as management’s expectations of financial objectives and projections, capital expenditures, earnings growth, plant retirements, rate base, and new generation plans. These statements speak of the Company’s plans, goals, beliefs, or expectations, refer to estimates or use similar terms. Actual results could differ materially, because the realization of those results is subject to many uncertainties including regulatory approvals and results, unanticipated construction costs or delays, economic conditions in our service territories, and other factors, some of which are discussed in more detail in the Company’s Form 10-K for the year ended December 31, 2017 and Form 10-Q for the quarter ended March 31, 2018. All forward looking statements included in this presentation are based upon information presently available and the Company assumes no obligation to update any forward looking statements.
In addition, this presentation contains non-GAAP financial measures. The reconciliations between the non-GAAP and GAAP measures are provided in this presentation.
1
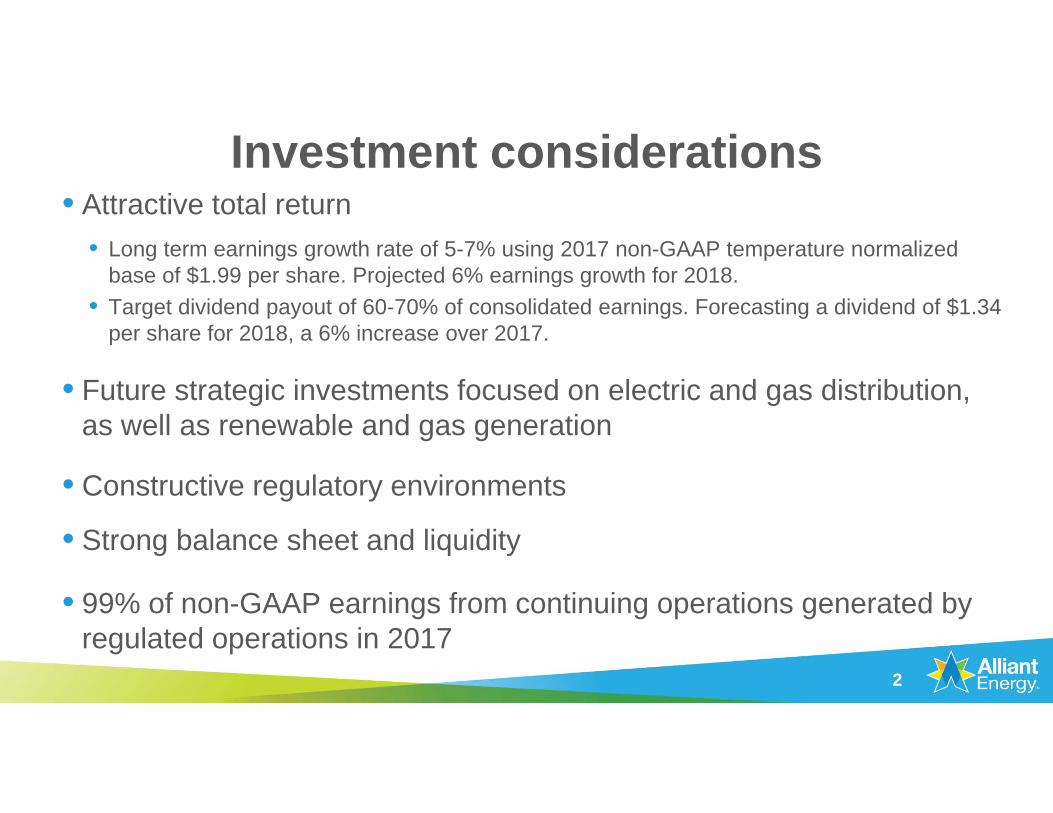
Investment considerations• Attractive total return
• Long term earnings growth rate of 5-7% using 2017 non-GAAP temperature normalized base of $1.99 per share. Projected 6% earnings growth for 2018.
• Target dividend payout of 60-70% of consolidated earnings. Forecasting a dividend of $1.34 per share for 2018, a 6% increase over 2017.
• Future strategic investments focused on electric and gas distribution, as well as renewable and gas generation
• Constructive regulatory environments
• Strong balance sheet and liquidity
• 99% of non-GAAP earnings from continuing operations generated by regulated operations in 2017
2
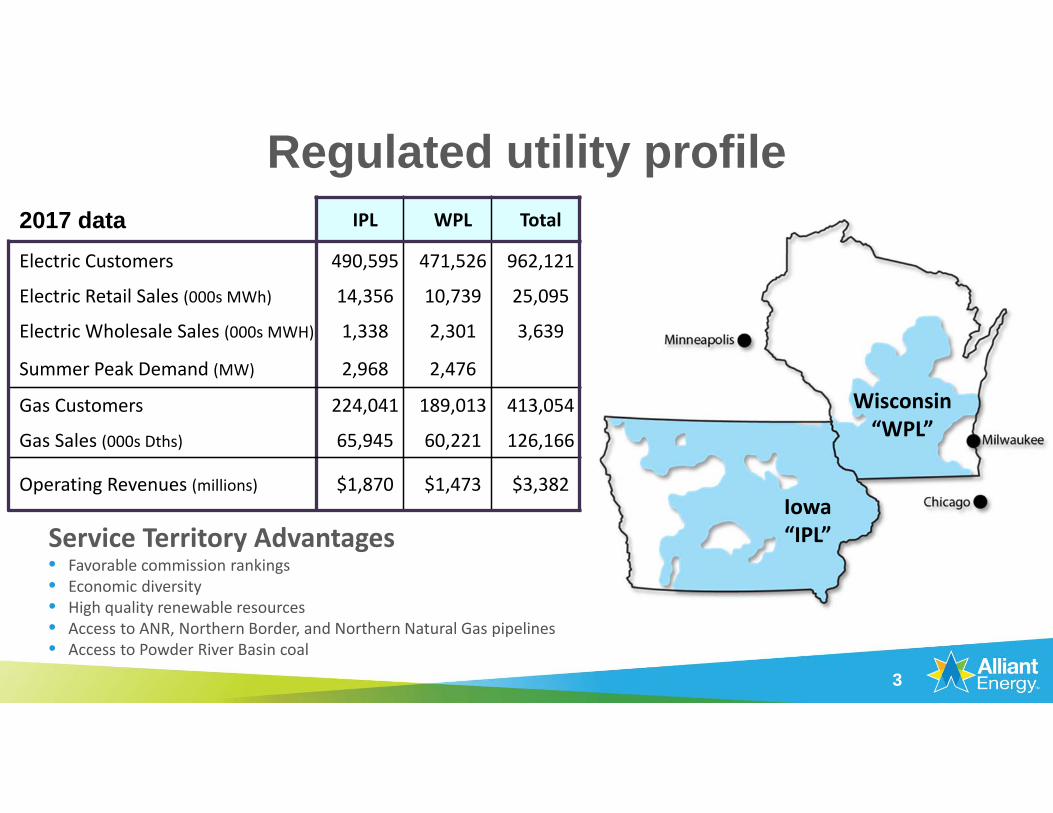
Regulated utility profile2017 data IPL WPL Total
Electric Customers 490,595 471,526 962,121
Electric Retail Sales (000s MWh) 14,356 10,739 25,095
Electric Wholesale Sales (000s MWH) 1,338 2,301 3,639
Summer Peak Demand (MW) 2,968 2,476
Gas Customers 224,041 189,013 413,054
Gas Sales (000s Dths) 65,945 60,221 126,166
Operating Revenues (millions) $1,870 $1,473 $3,382
Service Territory Advantages• Favorable commission rankings• Economic diversity• High quality renewable resources• Access to ANR, Northern Border, and Northern Natural Gas pipelines• Access to Powder River Basin coal
Iowa“IPL”
Wisconsin“WPL”
3
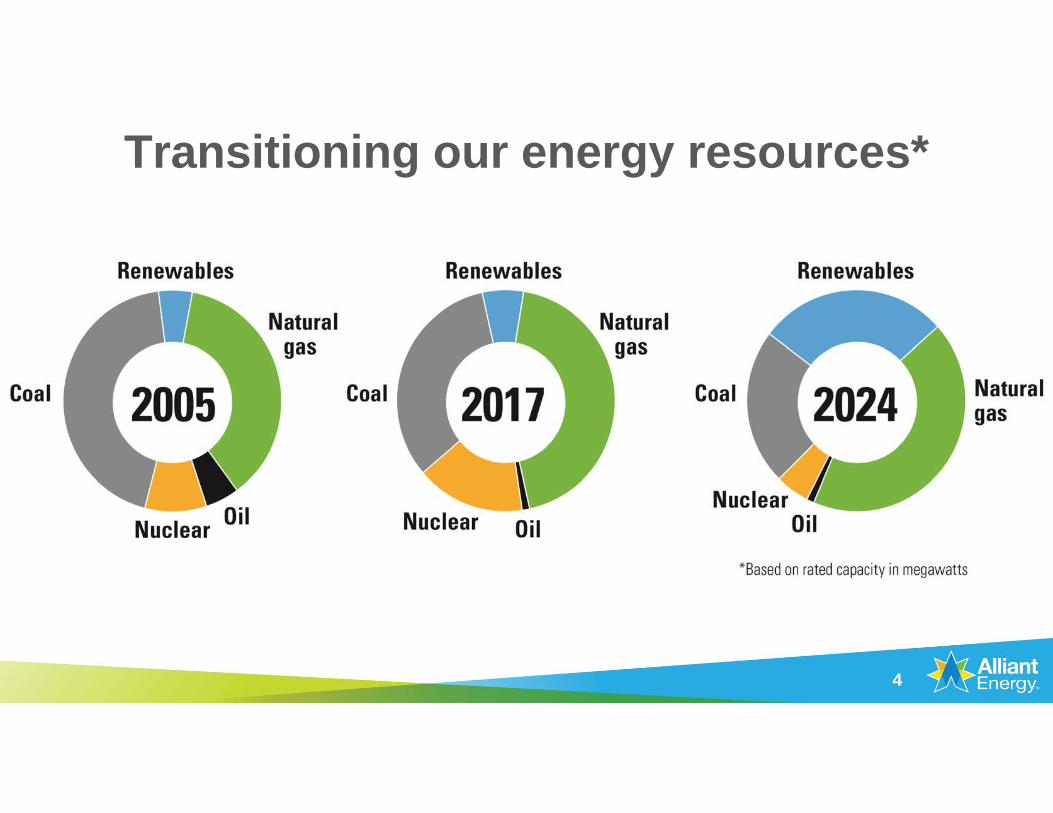
Transitioning our energy resources*
4

Benefits of wind energyHelps keeps rates low• Turbine cost has dropped ~40% in the last 10 years• Improvements in turbine technology maximize energy output• Generation production tax credits for 10 years• No associated fuel expense, helping provide cost stability• Reduced fuel, along with tax credits, offset capital recovery
Strengthens our communities• Provides tax revenues to support local services• Creates jobs and helps grow local economies• Lease payments for land owners• Helps spur improvements to strengthen the power grid• Attracts companies focused on sustainability
5
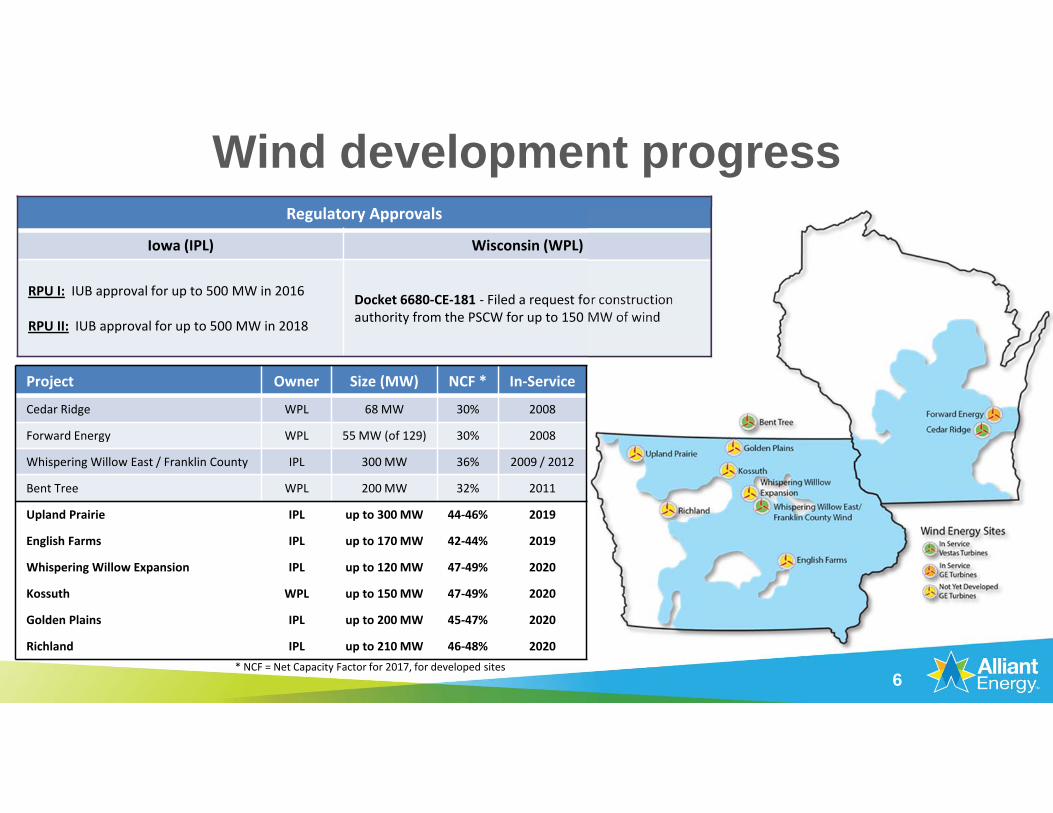
Wind development progressRegulatory Approvals
Iowa (IPL) Wisconsin (WPL)
RPU I: IUB approval for up to 500 MW in 2016
RPU II: IUB approval for up to 500 MW in 2018
Docket 6680‐CE‐181 ‐ Filed a request for construction authority from the PSCW for up to 150 MW of wind
* NCF = Net Capacity Factor for 2017, for developed sites
Project Owner Size (MW) NCF * In‐Service
Cedar Ridge WPL 68 MW 30% 2008
Forward Energy WPL 55 MW (of 129) 30% 2008
Whispering Willow East / Franklin County IPL 300 MW 36% 2009 / 2012
Bent Tree WPL 200 MW 32% 2011
Upland Prairie IPL up to 300 MW 44‐46% 2019
English Farms IPL up to 170 MW 42‐44% 2019
Whispering Willow Expansion IPL up to 120 MW 47‐49% 2020
Kossuth WPL up to 150 MW 47‐49% 2020
Golden Plains IPL up to 200 MW 45‐47% 2020
Richland IPL up to 210 MW 46‐48% 2020
6
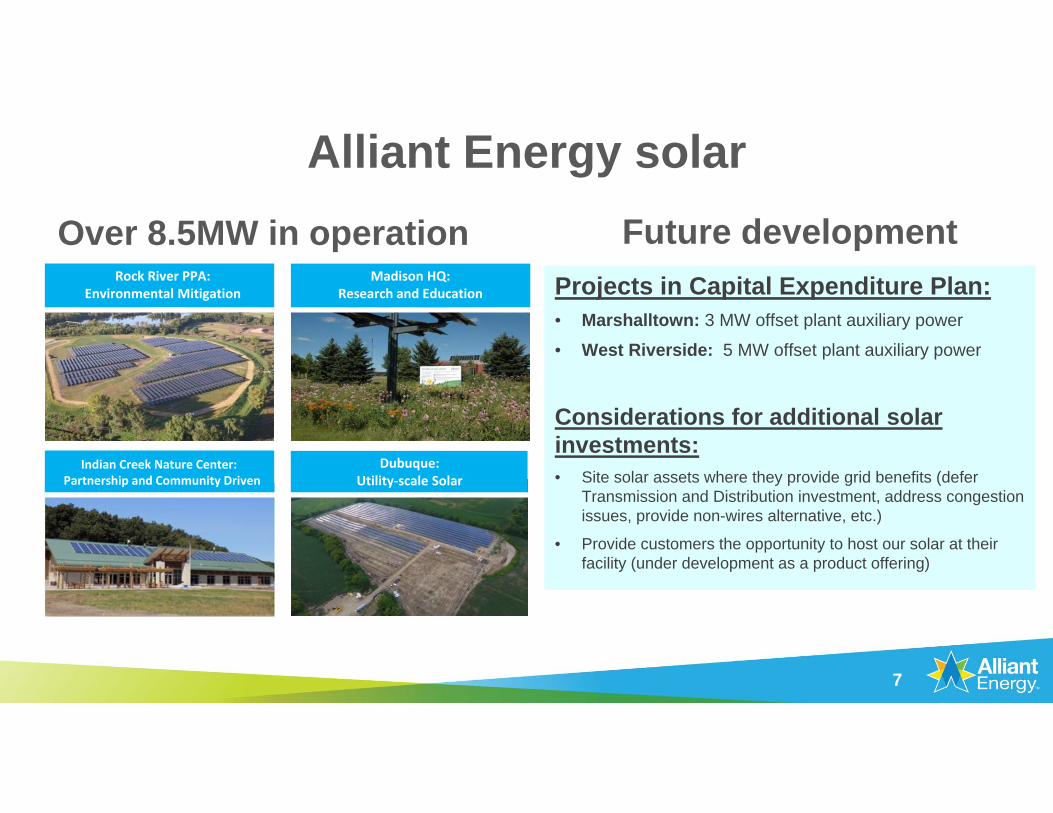
Alliant Energy solarOver 8.5MW in operation Future development
Projects in Capital Expenditure Plan:• Marshalltown: 3 MW offset plant auxiliary power
• West Riverside: 5 MW offset plant auxiliary power
Considerations for additional solar investments:• Site solar assets where they provide grid benefits (defer
Transmission and Distribution investment, address congestion issues, provide non-wires alternative, etc.)
• Provide customers the opportunity to host our solar at their facility (under development as a product offering)
Indian Creek Nature Center:Partnership and Community Driven
Rock River PPA: Environmental Mitigation
Madison HQ: Research and Education
Dubuque:Utility‐scale Solar
7
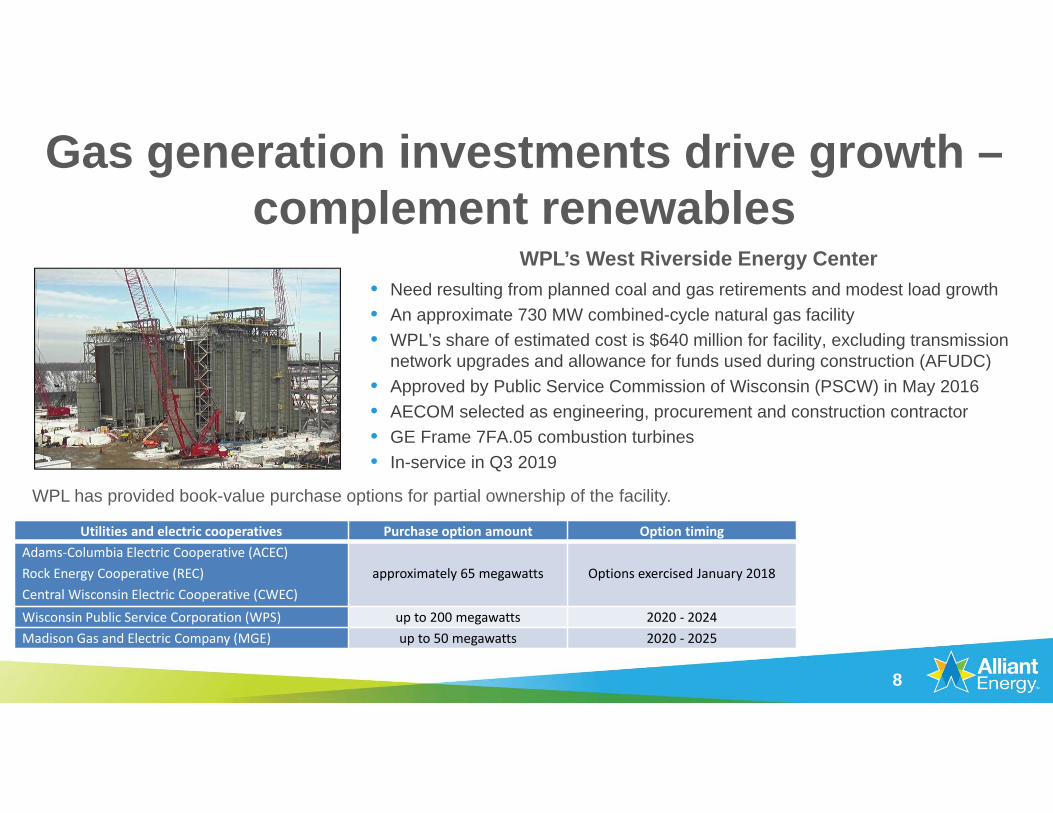
Gas generation investments drive growth –complement renewables
WPL’s West Riverside Energy Center• Need resulting from planned coal and gas retirements and modest load growth• An approximate 730 MW combined-cycle natural gas facility• WPL’s share of estimated cost is $640 million for facility, excluding transmission
network upgrades and allowance for funds used during construction (AFUDC)• Approved by Public Service Commission of Wisconsin (PSCW) in May 2016• AECOM selected as engineering, procurement and construction contractor• GE Frame 7FA.05 combustion turbines• In-service in Q3 2019
WPL has provided book-value purchase options for partial ownership of the facility.
Utilities and electric cooperatives Purchase option amount Option timingAdams‐Columbia Electric Cooperative (ACEC)Rock Energy Cooperative (REC)Central Wisconsin Electric Cooperative (CWEC)
approximately 65 megawatts Options exercised January 2018
Wisconsin Public Service Corporation (WPS) up to 200 megawatts 2020 ‐ 2024Madison Gas and Electric Company (MGE) up to 50 megawatts 2020 ‐ 2025
8
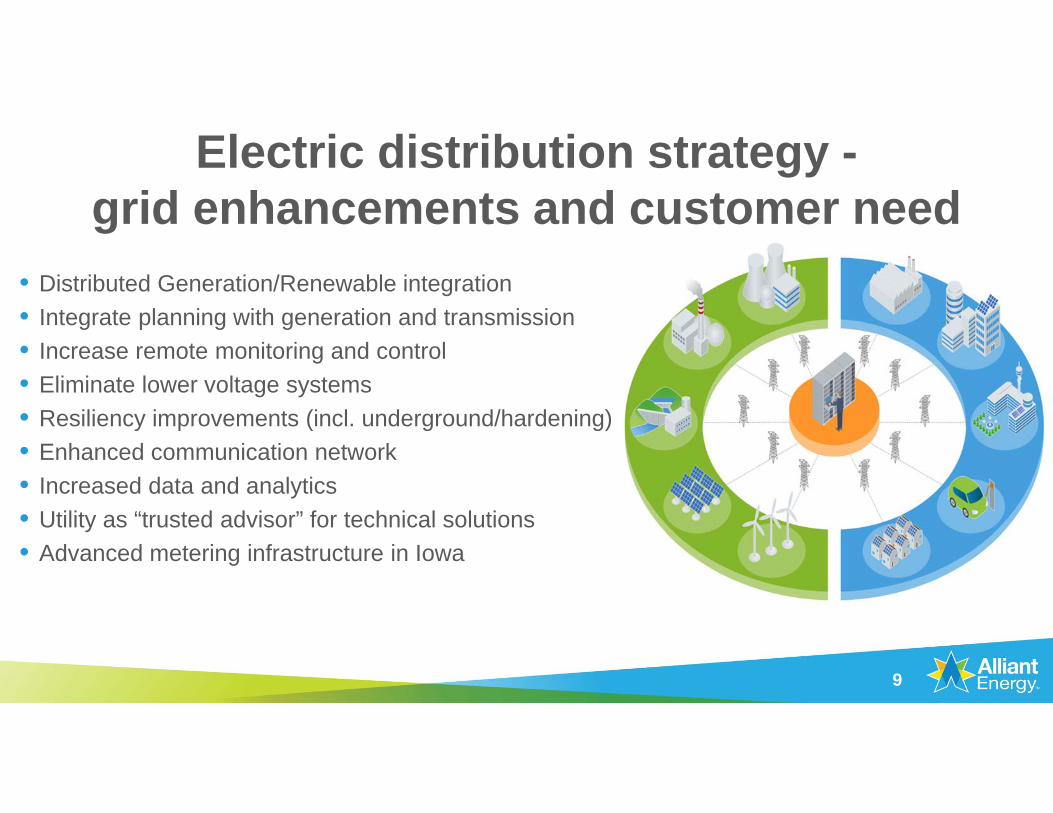
Electric distribution strategy -grid enhancements and customer need
• Distributed Generation/Renewable integration• Integrate planning with generation and transmission• Increase remote monitoring and control• Eliminate lower voltage systems• Resiliency improvements (incl. underground/hardening)• Enhanced communication network• Increased data and analytics• Utility as “trusted advisor” for technical solutions• Advanced metering infrastructure in Iowa
9
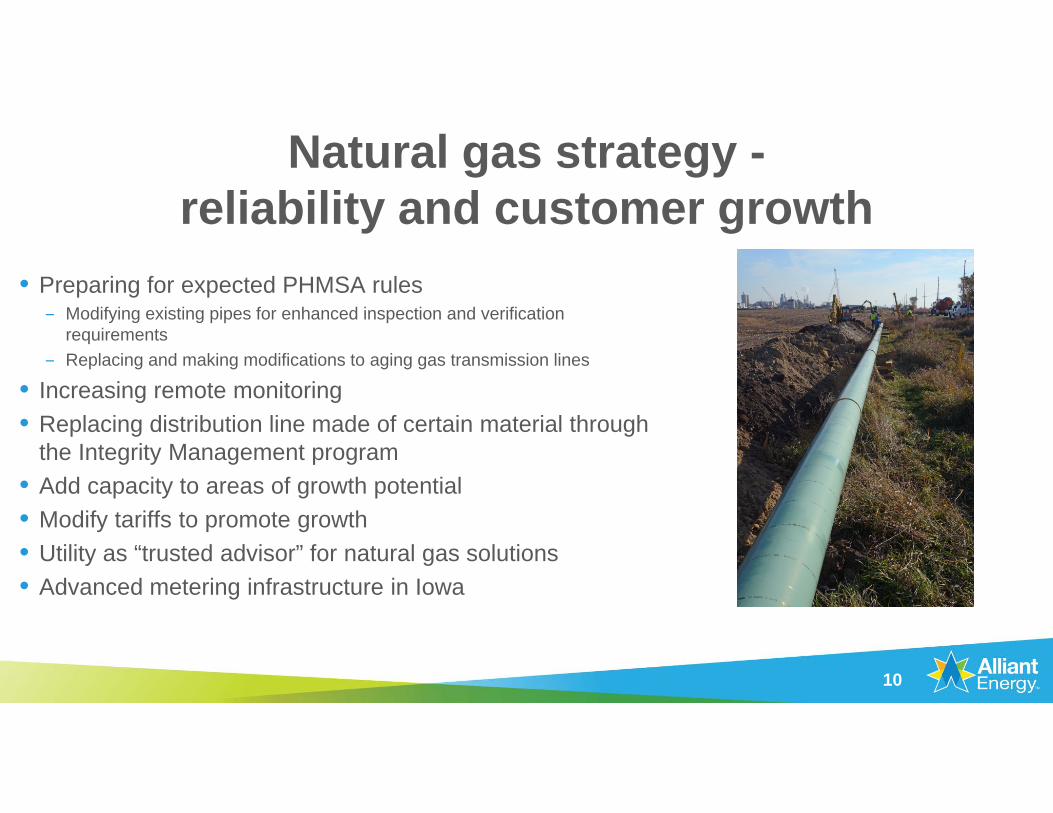
Natural gas strategy -reliability and customer growth
• Preparing for expected PHMSA rules‒ Modifying existing pipes for enhanced inspection and verification
requirements‒ Replacing and making modifications to aging gas transmission lines
• Increasing remote monitoring • Replacing distribution line made of certain material through
the Integrity Management program• Add capacity to areas of growth potential• Modify tariffs to promote growth • Utility as “trusted advisor” for natural gas solutions• Advanced metering infrastructure in Iowa
10
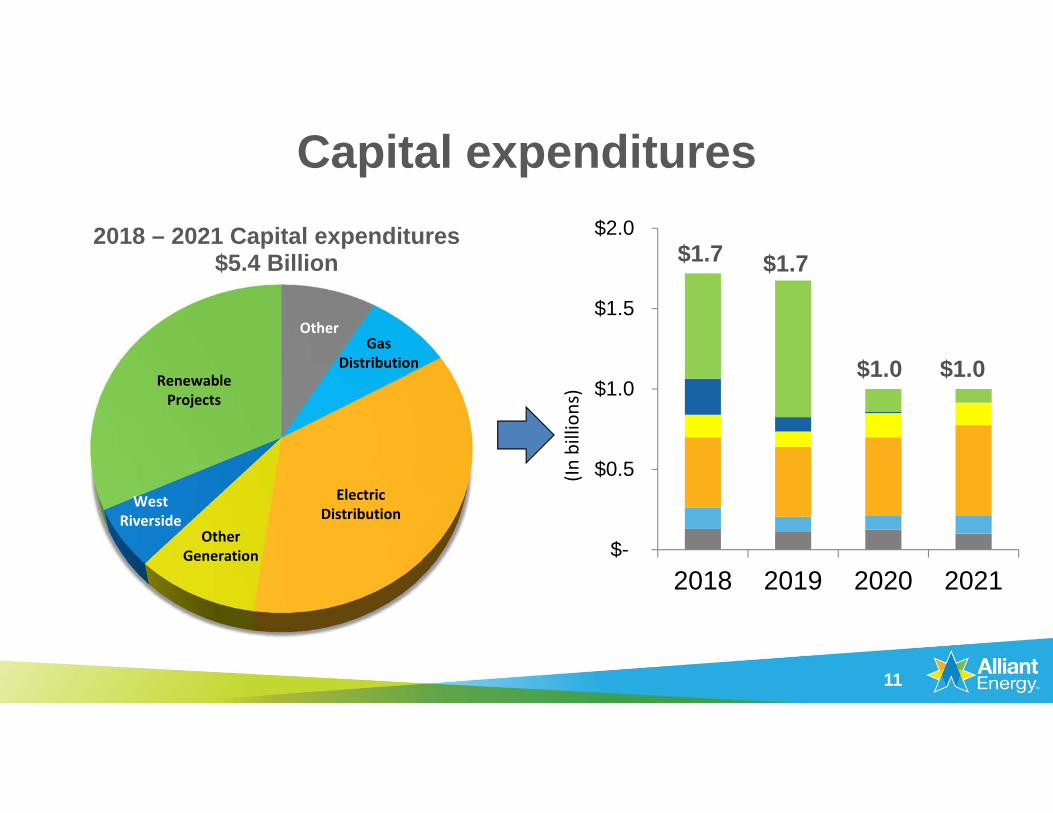
Capital expenditures2018 – 2021 Capital expenditures
$5.4 Billion
OtherGas
Distribution
ElectricDistribution
OtherGeneration
WestRiverside
RenewableProjects
$-
$0.5
$1.0
$1.5
$2.0
2018 2019 2020 2021
$1.7 $1.7
$1.0 $1.0
(In billions)
11
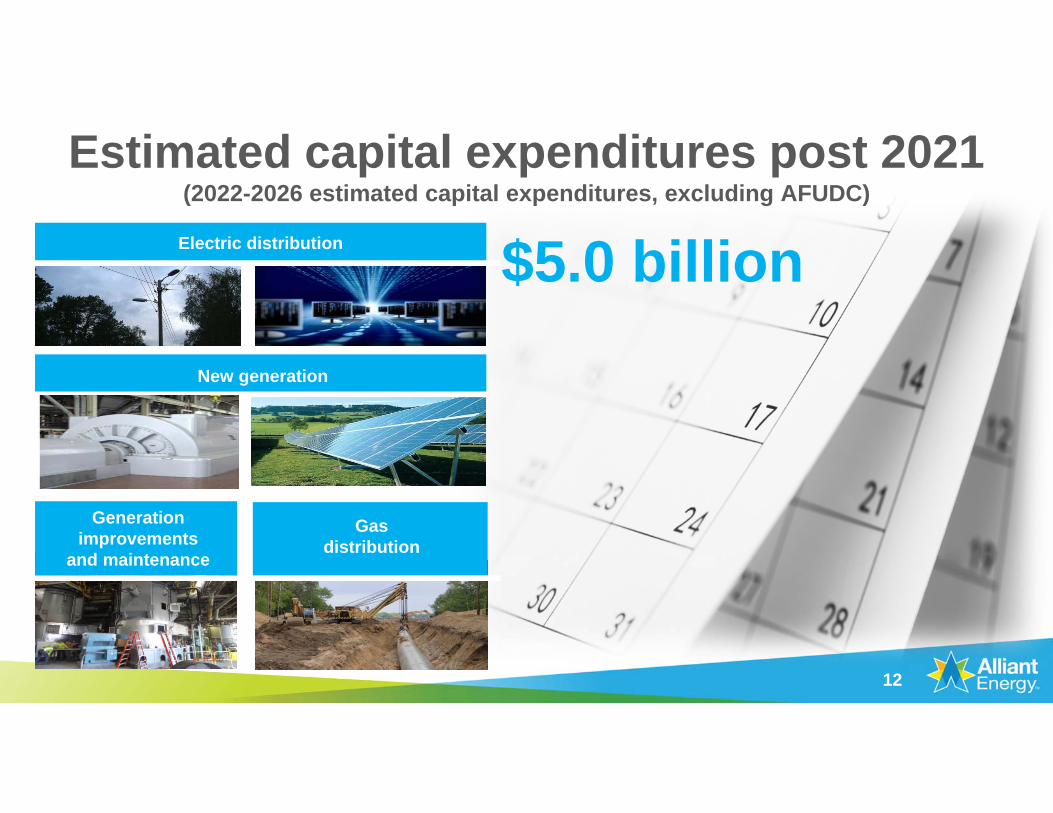
Estimated capital expenditures post 2021(2022-2026 estimated capital expenditures, excluding AFUDC)
$5.0 billionElectric distribution
New generation
Generation improvements
and maintenance
Gasdistribution
12
$0
$2,000
$4,000
$6,000
$8,000
$10,000
$12,000
2017 2018 2019 2020
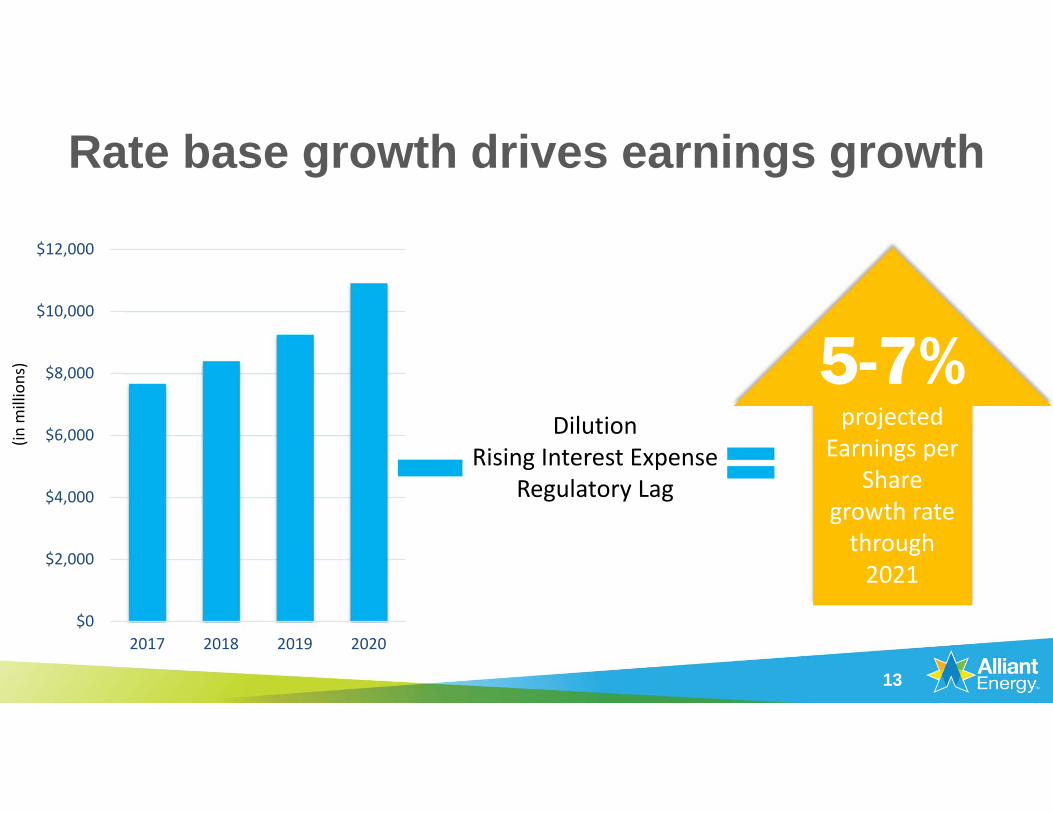
Rate base growth drives earnings growth
DilutionRising Interest Expense
Regulatory Lag
5-7% projected
Earnings per Share
growth rate through 2021
13
(in m
illions)
14
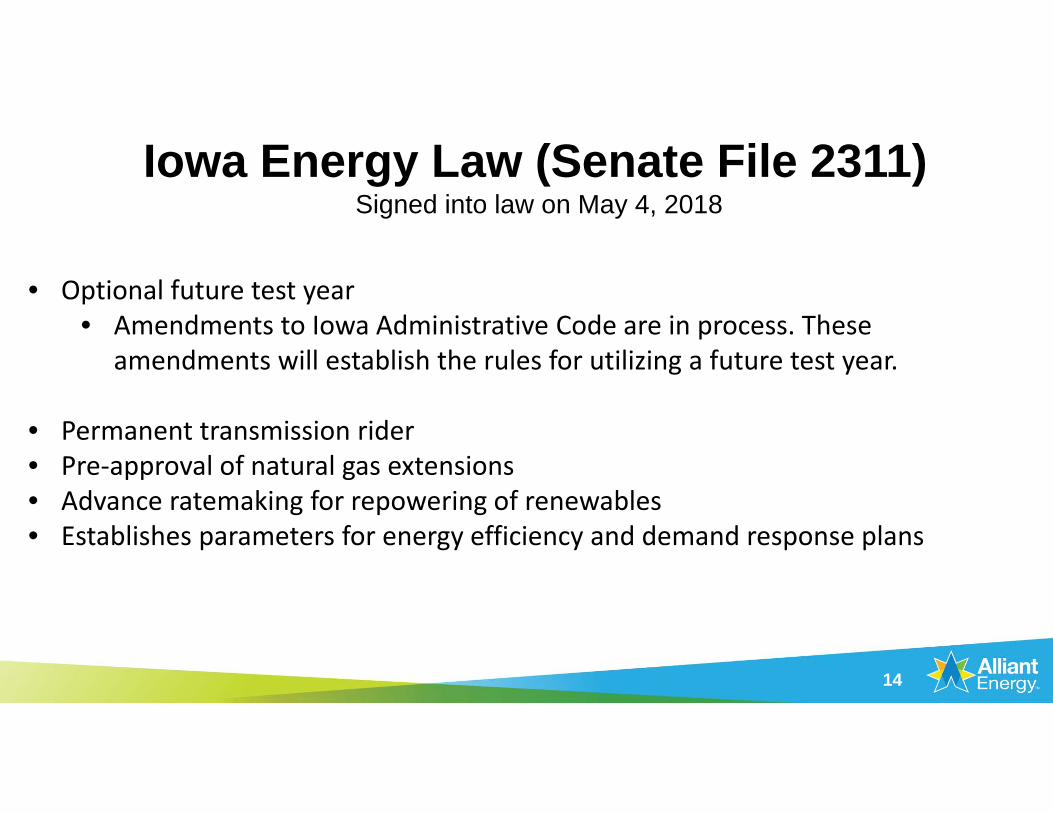
Iowa Energy Law (Senate File 2311)Signed into law on May 4, 2018
• Optional future test year• Amendments to Iowa Administrative Code are in process. These
amendments will establish the rules for utilizing a future test year.
• Permanent transmission rider• Pre‐approval of natural gas extensions• Advance ratemaking for repowering of renewables• Establishes parameters for energy efficiency and demand response plans
15
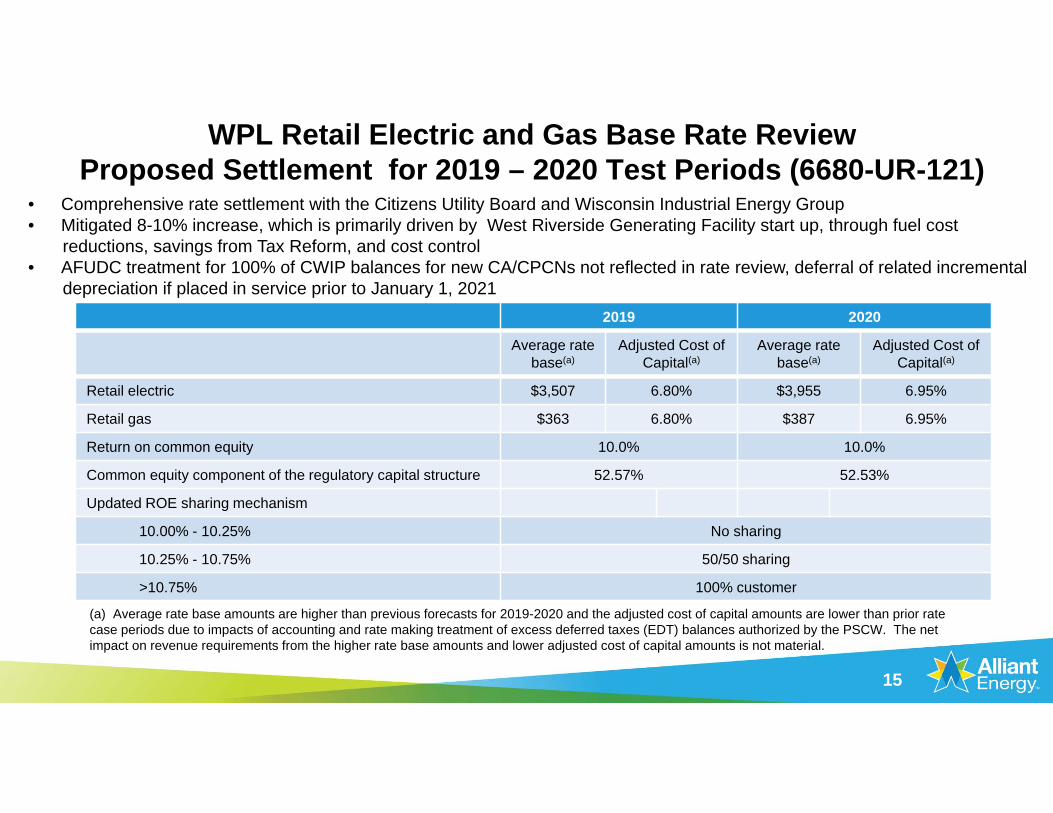
WPL Retail Electric and Gas Base Rate Review Proposed Settlement for 2019 – 2020 Test Periods (6680-UR-121)
• Comprehensive rate settlement with the Citizens Utility Board and Wisconsin Industrial Energy Group• Mitigated 8-10% increase, which is primarily driven by West Riverside Generating Facility start up, through fuel cost
reductions, savings from Tax Reform, and cost control• AFUDC treatment for 100% of CWIP balances for new CA/CPCNs not reflected in rate review, deferral of related incremental
depreciation if placed in service prior to January 1, 20212019 2020
Average rate base(a)
Adjusted Cost of Capital(a)
Average rate base(a)
Adjusted Cost of Capital(a)
Retail electric $3,507 6.80% $3,955 6.95%
Retail gas $363 6.80% $387 6.95%
Return on common equity 10.0% 10.0%
Common equity component of the regulatory capital structure 52.57% 52.53%
Updated ROE sharing mechanism
10.00% - 10.25% No sharing
10.25% - 10.75% 50/50 sharing
>10.75% 100% customer
(a) Average rate base amounts are higher than previous forecasts for 2019-2020 and the adjusted cost of capital amounts are lower than prior rate case periods due to impacts of accounting and rate making treatment of excess deferred taxes (EDT) balances authorized by the PSCW. The net impact on revenue requirements from the higher rate base amounts and lower adjusted cost of capital amounts is not material.
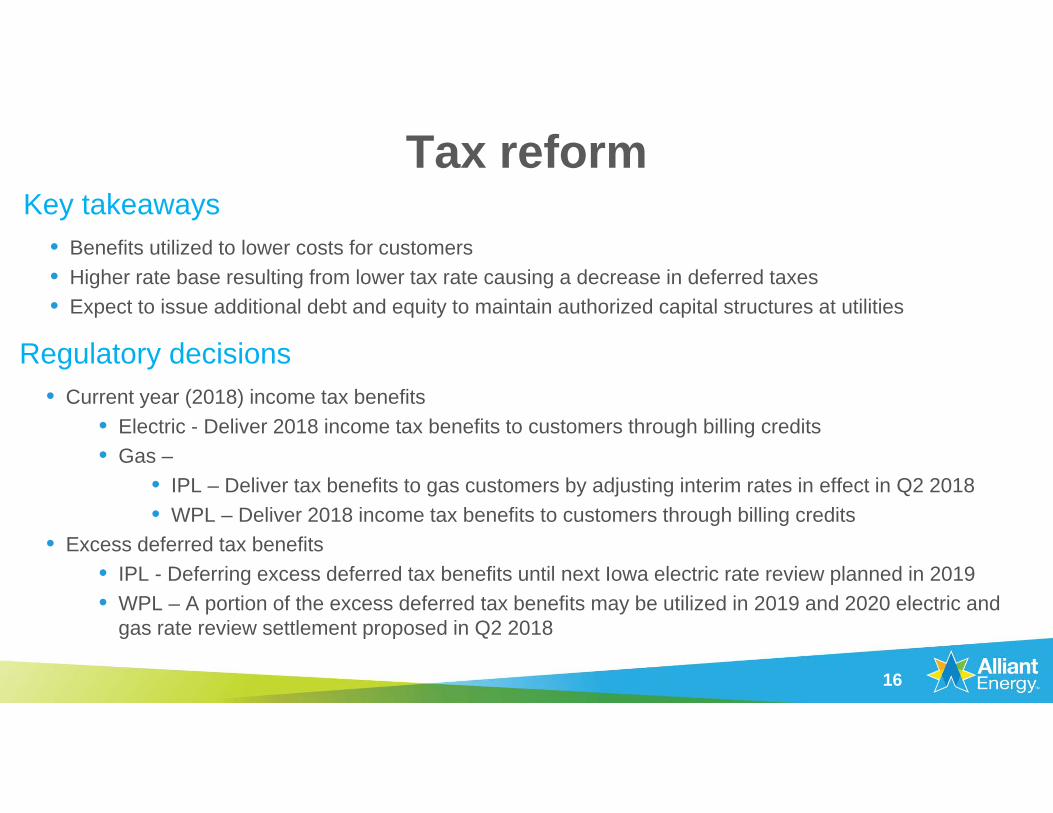
Tax reformKey takeaways
• Benefits utilized to lower costs for customers• Higher rate base resulting from lower tax rate causing a decrease in deferred taxes• Expect to issue additional debt and equity to maintain authorized capital structures at utilities
16
Regulatory decisions • Current year (2018) income tax benefits
• Electric - Deliver 2018 income tax benefits to customers through billing credits • Gas –
• IPL – Deliver tax benefits to gas customers by adjusting interim rates in effect in Q2 2018• WPL – Deliver 2018 income tax benefits to customers through billing credits
• Excess deferred tax benefits• IPL - Deferring excess deferred tax benefits until next Iowa electric rate review planned in 2019• WPL – A portion of the excess deferred tax benefits may be utilized in 2019 and 2020 electric and
gas rate review settlement proposed in Q2 2018
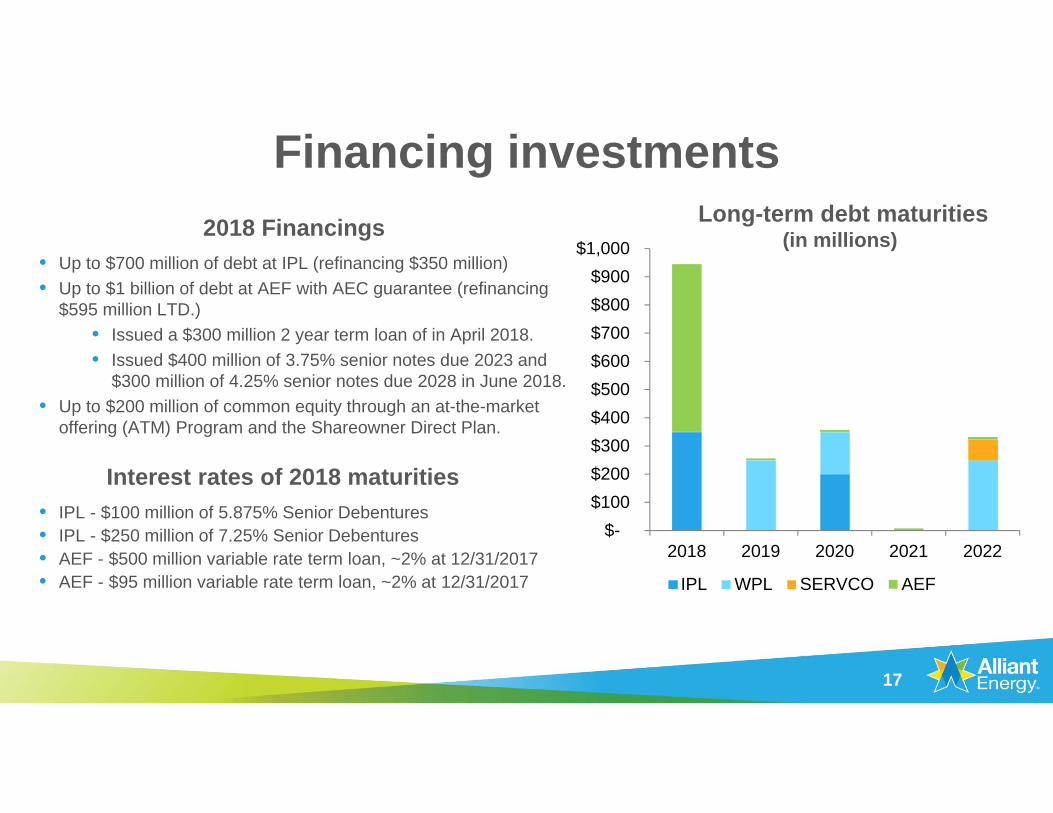
Financing investments
• Up to $700 million of debt at IPL (refinancing $350 million)• Up to $1 billion of debt at AEF with AEC guarantee (refinancing
$595 million LTD.) • Issued a $300 million 2 year term loan of in April 2018.• Issued $400 million of 3.75% senior notes due 2023 and
$300 million of 4.25% senior notes due 2028 in June 2018.• Up to $200 million of common equity through an at-the-market
offering (ATM) Program and the Shareowner Direct Plan.
• IPL - $100 million of 5.875% Senior Debentures• IPL - $250 million of 7.25% Senior Debentures• AEF - $500 million variable rate term loan, ~2% at 12/31/2017• AEF - $95 million variable rate term loan, ~2% at 12/31/2017
2018 Financings Long-term debt maturities(in millions)
$- $100 $200 $300 $400 $500 $600 $700 $800 $900
$1,000
2018 2019 2020 2021 2022
IPL WPL SERVCO AEF
Interest rates of 2018 maturities
17
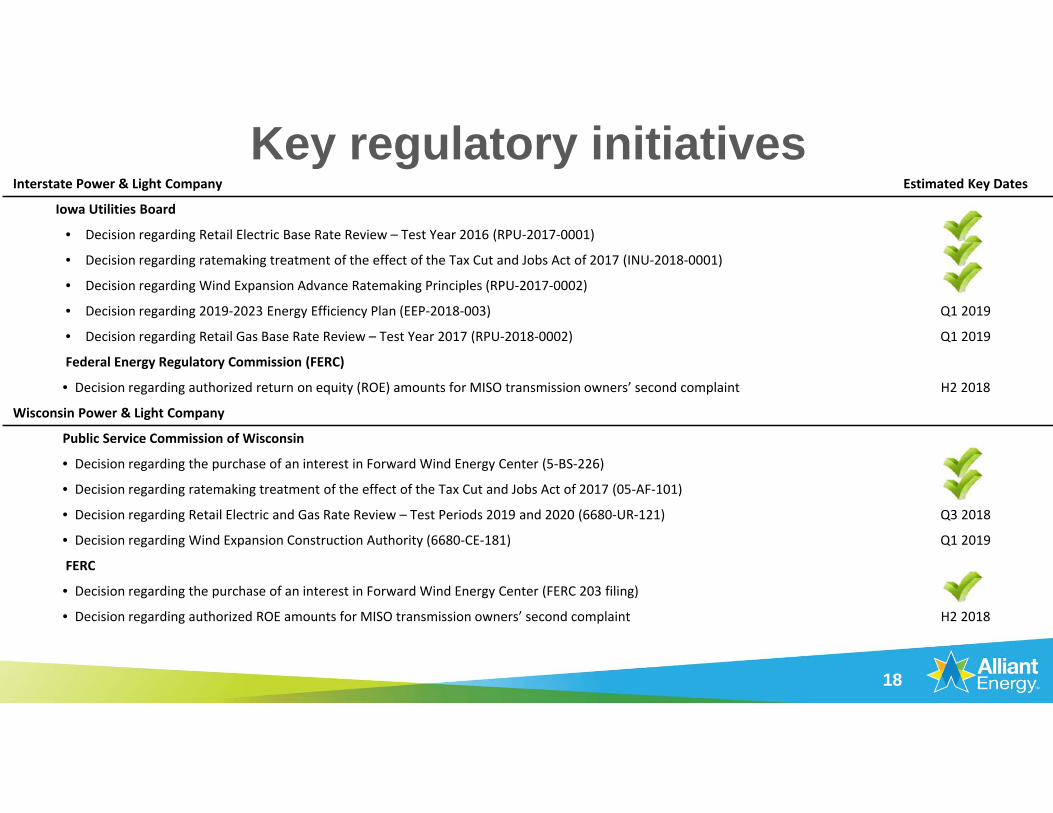
Key regulatory initiativesInterstate Power & Light Company Estimated Key Dates
Iowa Utilities Board
• Decision regarding Retail Electric Base Rate Review – Test Year 2016 (RPU‐2017‐0001)
• Decision regarding ratemaking treatment of the effect of the Tax Cut and Jobs Act of 2017 (INU‐2018‐0001)
• Decision regarding Wind Expansion Advance Ratemaking Principles (RPU‐2017‐0002)
• Decision regarding 2019‐2023 Energy Efficiency Plan (EEP‐2018‐003) Q1 2019
• Decision regarding Retail Gas Base Rate Review – Test Year 2017 (RPU‐2018‐0002) Q1 2019
Federal Energy Regulatory Commission (FERC)
• Decision regarding authorized return on equity (ROE) amounts for MISO transmission owners’ second complaint H2 2018
Wisconsin Power & Light Company
Public Service Commission of Wisconsin
• Decision regarding the purchase of an interest in Forward Wind Energy Center (5‐BS‐226)
• Decision regarding ratemaking treatment of the effect of the Tax Cut and Jobs Act of 2017 (05‐AF‐101)
• Decision regarding Retail Electric and Gas Rate Review – Test Periods 2019 and 2020 (6680‐UR‐121) Q3 2018
• Decision regarding Wind Expansion Construction Authority (6680‐CE‐181) Q1 2019
FERC
• Decision regarding the purchase of an interest in Forward Wind Energy Center (FERC 203 filing)
• Decision regarding authorized ROE amounts for MISO transmission owners’ second complaint H2 2018
18
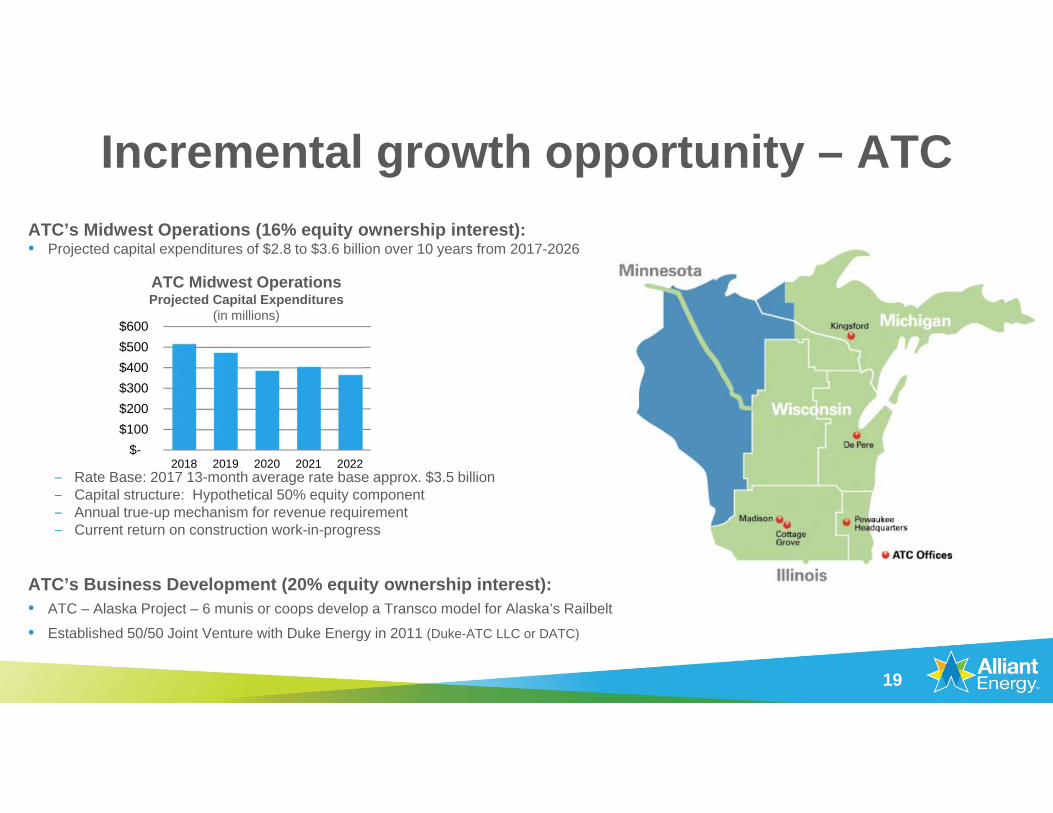
Incremental growth opportunity – ATCATC’s Midwest Operations (16% equity ownership interest):• Projected capital expenditures of $2.8 to $3.6 billion over 10 years from 2017-2026
‒ Rate Base: 2017 13-month average rate base approx. $3.5 billion‒ Capital structure: Hypothetical 50% equity component‒ Annual true-up mechanism for revenue requirement‒ Current return on construction work-in-progress
ATC’s Business Development (20% equity ownership interest):• ATC – Alaska Project – 6 munis or coops develop a Transco model for Alaska’s Railbelt
• Established 50/50 Joint Venture with Duke Energy in 2011 (Duke-ATC LLC or DATC)
$- $100 $200 $300 $400 $500 $600
2018 2019 2020 2021 2022
ATC Midwest OperationsProjected Capital Expenditures
(in millions)
19

Attractive growth inearnings, dividends and total returns
Adjusted (non-GAAP temperature normalized)
Earnings per Sharefrom continuing operations
Dividends per Common Share
(a) Annual common stock dividend target. Payment of the quarterly dividends is subject to the actual dividend declaration by the Board of Directors.
$1.70 $1.79 $1.88 $1.99
$2.11
2014 2015 2016 2017 2018E
$1.02 $1.10
$1.18 $1.26
$1.34
2014 2015 2016 2017 2018E
$100
$150
$200
$250
2012 2013 2014 2015 2016 2017Alliant Energy Corporation (LNT)S&P 500 IndexEEI Utilities
Total Shareholder Return
Comparison of cumulative five-year total return when investing $100 on December 31, 2012
(a)
20
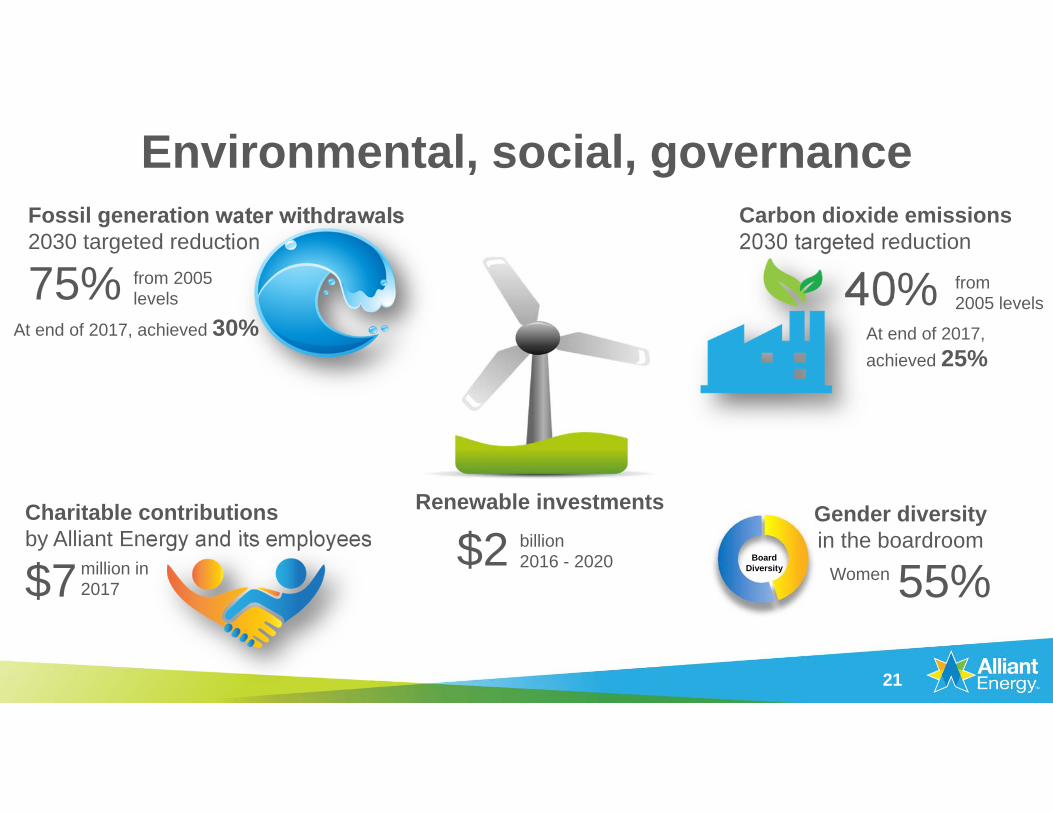
Charitable contributionsby Alliant Energy and its employees
$7
Environmental, social, governance
million in 2017
Carbon dioxide emissions 2030 targeted reduction
40% from 2005 levels
Fossil generation water withdrawals2030 targeted reduction
75% from 2005 levels
Gender diversity in the boardroom
Women 55%Board
Diversity
Renewable investments
$2 billion 2016 - 2020
At end of 2017, achieved 30% At end of 2017, achieved 25%
21
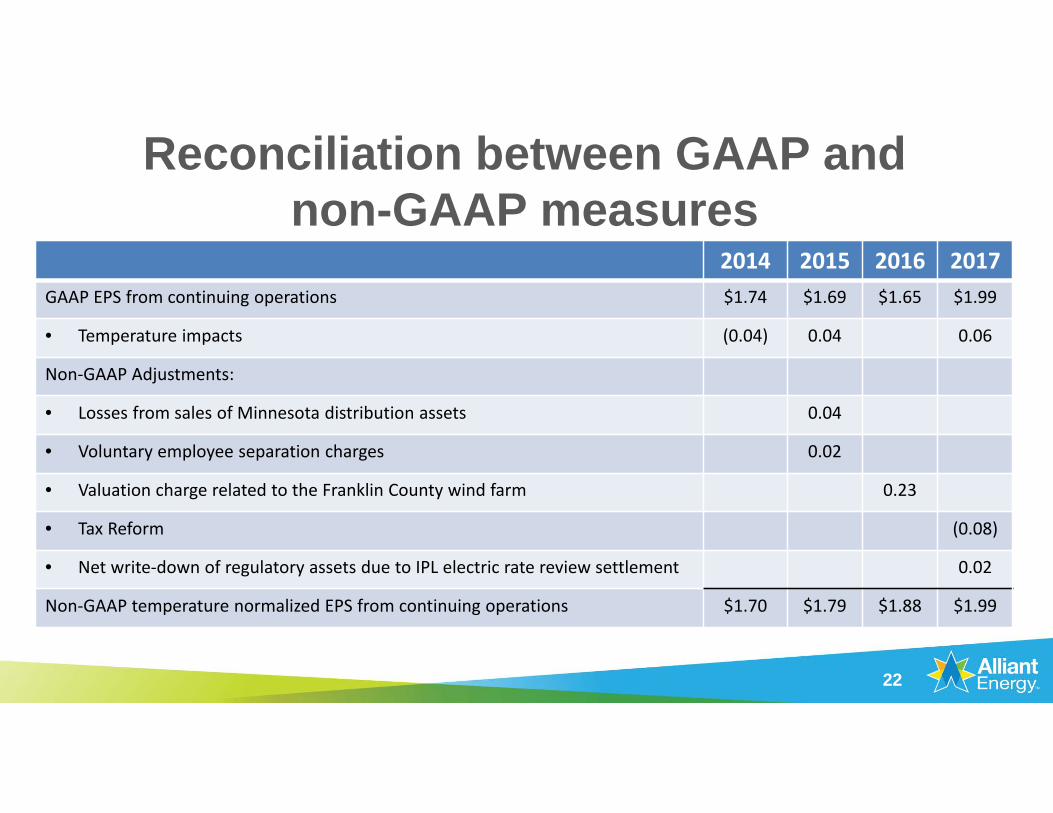
Reconciliation between GAAP and non-GAAP measures
2014 2015 2016 2017GAAP EPS from continuing operations $1.74 $1.69 $1.65 $1.99
• Temperature impacts (0.04) 0.04 0.06
Non‐GAAP Adjustments:
• Losses from sales of Minnesota distribution assets 0.04
• Voluntary employee separation charges 0.02
• Valuation charge related to the Franklin County wind farm 0.23
• Tax Reform (0.08)
• Net write‐down of regulatory assets due to IPL electric rate review settlement 0.02
Non‐GAAP temperature normalized EPS from continuing operations $1.70 $1.79 $1.88 $1.99
22