Embed Size (px)
Citation preview

Investor Presentation
June 2017
TSX: CGwww.centerragold.com
Caution Regarding Forward-Looking InformationInformation contained in this presentation which are not statements of historical facts, and the documents incorporated by reference herein, may be “forward-looking information” for the purposes of Canadiansecurities laws. Such forward-looking information involves risks, uncertainties and other factors that could cause actual results, performance, prospects and opportunities to differ materially from those expressed orimplied by such forward looking information. The words “believe”, “expect”, “anticipate”, “contemplate”, “plan”, “intends”, “continue”, “budget”, “estimate”, “may”, “will”, “schedule”, “understand” and similarexpressions identify forward-looking information. These forward-looking statements relate to, among other things: opportunities for financial and operational benefits from business proceed improvement at all sites;the Company’s discussions with the Government of the Kyrgyz Republic; statements relating to the Company’s cash on hand, working capital, future cash flows and existing credit facilities being sufficient to fundanticipated operating cash requirements; the Company’s expectations regarding the timing of distributions from Mount Milligan; the continuation of negotiations with the Mongolian Government on definitiveagreements related to the Gatsuurt Project; timing for development of, and gold production, from the Öksüt Project; expected time frames for an arbitral decision on the Company’s application for partial award or inthe alternative, interim relief; and statements found under the heading, “2017 Outlook”, including forecast 2017 production, cost and capital estimates, care and maintenance and reclamation activities at the Boroomine, and the Company’s plans in 2017 for exploration expenditures, capital expenditures, corporate administrative and community expenditures, and DD&A expenses for 2017.
Forward-looking information is necessarily based upon a number of estimates and assumptions that, while considered reasonable by Centerra, are inherently subject to significant political, business, economic andcompetitive uncertainties and contingencies. Known and unknown factors could cause actual results to differ materially from those projected in the forward looking information. Factors that could cause actual resultsor events to differ materially from current expectations include, among other things: (A) strategic, legal, planning and other risks, including: political risks associated with the Company’s operations in the KyrgyzRepublic, Mongolia and Turkey; resource nationalism including the management of external stakeholder expectations; liquidity risks created by Centerra’s inability to access funds held at KGC the impact of changes in,or to the more aggressive enforcement of, laws, regulations and government practices, including with respect to the environment, in the jurisdictions in which the Company operates including any delays or refusals togrant required permits and licenses, unjustified civil or criminal action against the Company, its affiliates or its current or former employees; risks that community activism may result in increased contributory demandsor business interruptions; the impact of any actions taken by the Kyrgyz Republic Government and Parliament relating to the Kumtor Project Agreements which are inconsistent with the rights of Centerra and KGCunder the Kumtor Project Agreements; any impact on the purported cancellation of Kumtor’s land use rights at the Kumtor Project pursuant to a court claim commenced by the Kyrgyz Republic GPO; the risks related toother outstanding litigation affecting the Company’s operations in the Kyrgyz Republic and elsewhere; the impact of the delay by relevant government agencies to provide required approvals, expertises andpermits;;potential impact on the Kumtor Project of investigations by Kyrgyz Republic instrumentalities and movement restrictions on KGC employees and managers; the terms pursuant to which the MongolianGovernment will participate in, or to take a special royalty rate in, the Gatsuurt Project; the impact of constitutional changes in Turkey; the impact of any sanctions imposed by Canada, the United States or otherjurisdictions against various Russian individuals and entities; the ability of the Company to negotiate a successful development agreement for the Gatsuurt Project; potential defects of title in the Company’s propertiesthat are not known as of the date hereof; the inability of the Company and its subsidiaries to enforce their legal rights in certain circumstances; the presence of a significant shareholder that is a state-owned companyof the Kyrgyz Republic; risks related to anti-corruption legislation; risks related to the concentration of assets in Central Asia; Centerra’s future exploration and development activities not being successful; Centerra notbeing able to replace mineral reserves; Aboriginal claims and consultative issues relating to the Company’s properties which are in proximity to Aboriginal communities; and potential risks related to kidnapping or acts ofterrorism; (B) risks relating to financial matters, including: sensitivity of the Company’s business to the volatility of gold, copper and other mineral prices, the use of provisionally-priced sales contracts for production atMount Milligan, reliance on a few key customers for the gold-copper concentrate at Mount Milligan, use of commodity derivatives, the imprecision of the Company’s mineral reserves and resources estimates and theassumptions they rely on, the accuracy of the Company’s production and cost estimates, the impact of restrictive covenants in the Company’s credit facilities which may, among other things, restrict the Company frompursuing certain business activities or making distributions from its subsidiaries, the Company’s ability to obtain future financing, the impact of global financial conditions, the impact of currency fluctuations, the effectof market conditions on the Company’s short-term investments, the Company’s ability to make payments including any payments of principal and interest on the Company’s debt facilities depends on the cash flow of itssubsidiaries; and (C) risks related to operational matters and geotechnical issues and the Company’s continued ability to successfully manage such matters, including the movement of the Davidov Glacier, waste and icemovement and continued performance of the buttress at the Kumtor Project; the occurrence of further ground movements at the Kumtor Project and mechanical availability; the ability of the Company to successfullyramp-up to design criteria of the secondary crusher at Mount Milligan; the success of the Company’s future exploration and development activities, including the financial and political risks inherent in carrying outexploration activities; inherent risks associated with the use of sodium cyanide in the mining operations; the adequacy of the Company’s insurance to mitigate operational risks; mechanical breakdowns; the Company’sability to replace its mineral reserves; the occurrence of any labour unrest or disturbance and the ability of the Company to successfully re-negotiate collective agreements when required; the risk that Centerra’sworkforce may be exposed to widespread epidemic; seismic activity in the vicinity of the Company’s properties; long lead times required for equipment and supplies given the remote location of some of the Company’soperating properties; reliance on a limited number of suppliers for certain consumables, equipment and components; illegal mining on the Company’s Mongolian properties; the Company’s ability to accurately predictdecommissioning and reclamation costs; the Company’s ability to attract and retain qualified personnel; competition for mineral acquisition opportunities; and risks associated with the conduct of jointventures/partnerships; the Company’s ability to manage its projects effectively and to mitigate the potential lack of availability of contractors, budget and timing overruns and project resources. See section titled “Risksthat can affect our business” in the 2016 Annual Information Form available on SEDAR at www.sedar.com.
Furthermore, market price fluctuations in gold and copper, as well as increased capital or production costs or reduced recovery rates may render ore reserves containing lower grades of mineralization uneconomic andmay ultimately result in a restatement of reserves. The extent to which resources may ultimately be reclassified as proven or probable reserves is dependent upon the demonstration of their profitable recovery.Economic and technological factors which may change over time always influence the evaluation of reserves or resources. Centerra has not adjusted mineral resource figures in consideration of these risks and,therefore, Centerra can give no assurances that any mineral resource estimate will ultimately be reclassified as proven and probable reserves. There can be no assurances that forward-looking information andstatements will prove to be accurate, as many factors and future events, both known and unknown could cause actual results, performance or achievements to vary or differ materially, from the results, performance orachievements that are or may be expressed or implied by such forward-looking statements contained herein or incorporated by reference. Accordingly, all such factors should be considered carefully when makingdecisions with respect to Centerra, and prospective investors should not place undue reliance on forward looking information. Forward-looking information is as of June 1, 2017. Centerra assumes no obligation toupdate or revise forward looking information to reflect changes in assumptions, changes in circumstances or any other events affecting such forward-looking information, except as required by applicable law. Except asotherwise noted herein, Gordon Reid, Professional Engineer and Centerra’s Vice President and Chief Operating Officer, has reviewed and approved the scientific and technical information contained in this presentation.Mr. Reid is a Qualified Person within the meaning of NI 43-101. For more information, please refer to the properties technical reports, which are available on SEDAR. All figures are in United States dollars unlessotherwise stated.
2June 2017
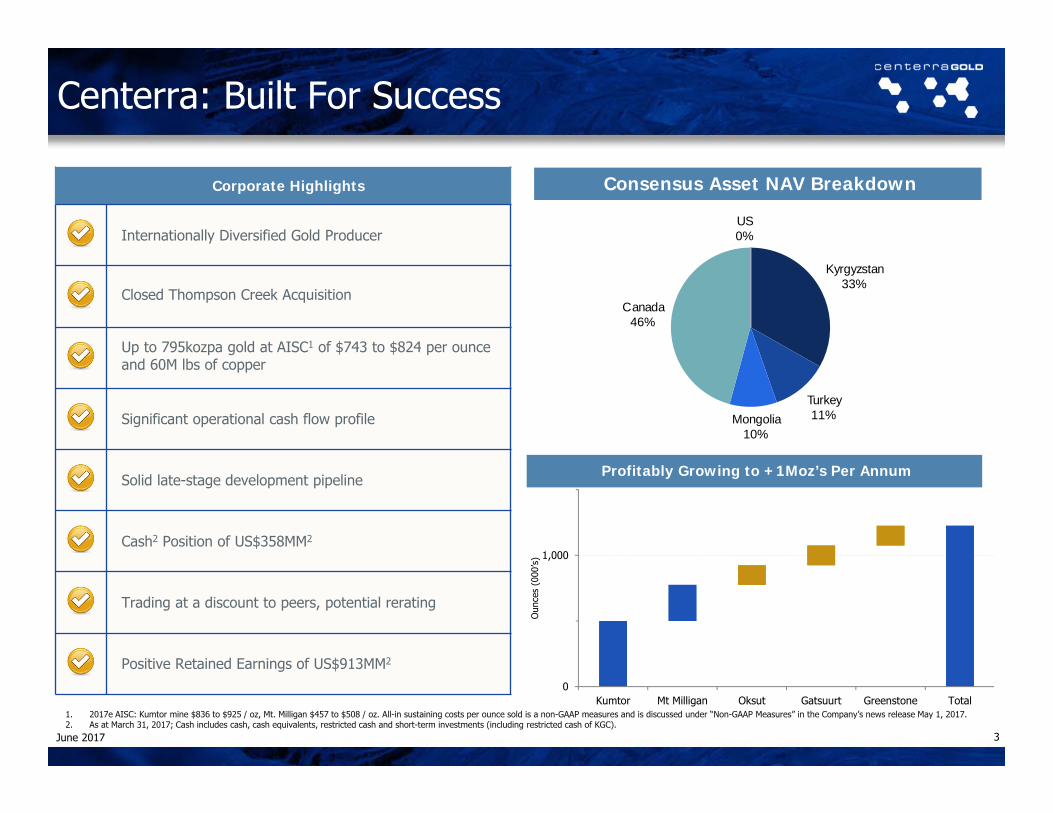
1. 2017e AISC: Kumtor mine $836 to $925 / oz, Mt. Milligan $457 to $508 / oz. All-in sustaining costs per ounce sold is a non-GAAP measures and is discussed under “Non-GAAP Measures” in the Company’s news release May 1, 2017.2. As at March 31, 2017; Cash includes cash, cash equivalents, restricted cash and short-term investments (including restricted cash of KGC).
Corporate Highlights
Internationally Diversified Gold Producer
Closed Thompson Creek Acquisition
Up to 795kozpa gold at AISC1 of $743 to $824 per ounce and 60M lbs of copper
Significant operational cash flow profile
Solid late-stage development pipeline
Cash2 Position of US$358MM2
Trading at a discount to peers, potential rerating
Positive Retained Earnings of US$913MM2
June 2017 3
Profitably Growing to +1Moz’s Per Annum
0
1,000
Kumtor Mt Milligan Oksut Gatsuurt Greenstone Total
Oun
ces
(000
’s)
Consensus Asset NAV Breakdown
Centerra: Built For Success
Kyrgyzstan33%
Turkey11%Mongolia
10%
Canada46%
US0%

June 2017
4
Cash$542MM
Balance Sheet (US$)
Debt$438MM
(as of March 31, 2017)
Share Count
2016: Internally Funded Business (US$)
Retained Earnings Profile (US$)
0
400
800
1,200
1,600
2,000
0
200
400
600
800
1,000
1,200
2004 2005 2006 2007 2008 2009 2010 2011 2012 2013 2014 2015 2016 Q12017
Gol
d Pr
ice
(US$
/oz)
US$
Mill
ions
Retained Earnings Cumulative Dividends Gold Price
Unrestricted Cash
$81MM
1 Includes cash and cash equivalents, short-term investments and restricted cash of $248MM at KGC at December 31, 2016.2 TCM acquisition is shown net of cash received on completion of acquisition ($98MM), net proceeds from equity offering ($141MM), net proceeds from debt ($324MM).
Centerra: Corporate Update
1
Restricted Cash$277MM
216.2 216.3 216.3 226.7 235.5 236.1 236.4 236.4 236.4 237.9
291.3 291.3
0
50
100
150
200
250
300
2006 2007 2008 2009 2010 2011 2012 2013 2014 2015 2016 Q12017
millions
542
237 8
74 318
111
23 409
200
300
400
500
600
700
800
900
2015 Cash KumtorCashflow
Mt MilliganCashflow
EBRD debtproceeds
TCMAcquisition
Other(Projects,G&A, etc)
ShareholderDividends
2016 Cash
US$
Mill
ions
2
June 2017

Operating Cash Flows
$371MM
Cash Flows Invested $223MM
Operating Cash Flows $334 MM
Cash Flows Invested $244 MM
170U/G miners
240U/G miners
240U/G miners
YE target of 4,000tpd
2015 Free Cash Flow Profile (US$)
2016 Free Cash Flow Profile (US$)
5
Cash Reserves1 Profile (US$)
0
400
800
1,200
1,600
2,000
0
200
400
600
800
1,000
2004 2005 2006 2007 2008 2009 2010 2011 2012 2013 2014 2015 2016 Q12017
Gol
d Pr
ice
(US$
/oz)
US$
Mill
ions
Cumulative Dividends Cash Balance Gold Price1
Retained Earnings Profile (US$)
June 2017 1. Cash reserves and cash balance includes cash, cash equivalents, restricted cash and short-term investments, includes restricted cash at KGC.
0
400
800
1,200
1,600
2,000
0
200
400
600
800
1,000
1,200
2004 2005 2006 2007 2008 2009 2010 2011 2012 2013 2014 2015 2016 Q12017
Gol
d Pr
ice
(US$
/oz)
US$
Mill
ions
Retained Earnings Cumulative Dividends Gold Price
Centerra: Robust Financial Margins in all Cycles

Kyrgyz Republic
33%
Turkey6%
Mongolia13%
Canada48%
Kyrgyzstan33%
Turkey11%Mongolia
10%
Canada46%
US0%
Producing70%
Development21%
Exploration9%
6
Kyrgyz Republic
32%
Turkey7%
Mongolia10%
Canada52%
Au reserves & resourcesAsset NAV breakdown
Consensus Asset NAV by geography
Consensus Asset NAV by stage
Source: Company filings and analyst estimates.(1) Resources are shown inclusive of reserves. Mineral resources that are not mineral reserves do not have demonstrated economic viability.
P+P reserves by geography
M+I resources (inclusive) by geography(1)
June 2017
Diversified Portfolio with Balanced Geopolitical Profile

Centerra: Re-Rating Potential Continues
7
Source: Scotiabank GBM Equity Research(1) Price / Net Asset Value (“NAV”) is calculated using spot rates and prices as at May 29, 2017.
Price / NAV(1)
June 2017
1.44x
1.19x 1.13x
1.03x 0.97x
0.88x 0.85x 0.81x 0.74x 0.74x
0.66x
Kinr
oss
Gol
d
B2G
old
Silv
erSt
anda
rd
New
Gol
d
Det
our G
old
IAM
GO
LD
Alam
os G
old
Yam
ana
Gol
d
Acac
iaM
inin
g
SEM
AFO
Cen
terra
Centerra vs Intermediate Gold Peers P/NAV (5%) at Spot
Median P/NAV (5%) at Spot
Median:0.95x

860
692
640
500
600
700
800
900
Original Revised Actual
Reduced All-In Sustaining Cost Per Ounce Guidance (US$/oz) - Mid Point
515,000
540,000 550,960
250,000
300,000
350,000
400,000
450,000
500,000
550,000
600,000
Original Revised Actual
Increased Gold Production Guidance - Mid-Point, Actual
June 2017 8
2016 GUIDANCE vs ACTUAL: GROWING PRODUCTION AND DECLINING COSTS
Production increase: up to 7%; Costs decline: up to 26%;
2016 Gold Production exceeds mid-point of revised guidance, AISC lower than mid-point of
revised guidance
2016 Kumtor Guidance Highlights
Centerra: Operational Excellence
(1) Non-GAAP measure and is discussed under “Non-GAAP Measures” in the Company’s MDA and news release of February 23, 2017.

$0
$250
$500
$750
$1,000
$1,250
$1,500
$1,750
$2,000
$2,250
$2,500
730 9,100 16,008 23,666 30,082 36,417 39,898 42,962
AIS
C, n
et (
US$
/oz
Au)
Cumulative Gold Production (koz Au)
Öksüt(US$490/oz)(1)
75%
Centerra: Lower Cost Asset Base
9
AISC Industry Curve (By-Product Basis)
100%50%25%0%
Kumtor(US$836-925/oz)
Centerra Gold(US$743-824/oz Au)
• Based on industry-wide all-in sustaining costs, Centerra ranks in the bottom quartile of global gold producers
Source: SNL Metals.Note: Centerra AISC figures based on 2017 cost guidance, unless noted1. Öksüt AISC based on LOM plan as per the NI 43-101 technical report dated September 3, 2015
Mount Milligan(US$457-508/oz)
May 2017
Kumtor – Q1(US$762/oz)

10
2016 2017E Guidance
Gold Production (koz) 205 260-290
Copper Production (MMlbs) 59 55-65
All-In Sustaining Costs (US$/oz)(1) $509 $457-$508
Sustaining Capital ($MM)(1) NA $26
Remaining reserve life (years) +20
Gold Copper
P&P Reserves(2) 5.8Moz 2,049Mlbs
Grade 0.4g/t 0.187%
Royal Gold Stream 35% @ US$435/oz
18.75% @ 15% of spot Cu price
+20 years of production from existing P&P reserves(2)
5.8M gold reserve ounces(2)
Low cost, long life production
Stable, mining-friendly jurisdiction
Restructured stream provides additional gold upside
Tax loss pools, no cash taxes until 2022/2023
June 2017
Mount Milligan: Long Life, Low Cost Gold Copper Mine
Significant Open Pit Gold and Copper ProductionSignificant Open Pit Gold and Copper Production
218
275
59
71
60205
0
10
20
30
40
50
60
70
80
0
50
100
150
200
250
300
2015 2016 2017E 2015 2016 2017ECOPPER
Copp
er M
lbs
Gold ou
nces
GOLD(1) Non-GAAP measure and is discussed under “Non-GAAP Measures” in the Company’s MDA and news release May 1, 2017. 2016 AISC is for the period Oct.20 to Dec.31.(2) Refer to February 23, 2017 mineral reserves and resources news release.

170U/G miners
207U/G miners
240U/G miners
240U/G miners
2015 2016 2017E
Gold Production (koz) 521 551 455-505
Adjusted Operating Costs ($/oz) (1) $326 $342 $359-$397
All-In Sustaining Costs ($/oz) (1) $758 $640 $836-$925
Sustaining Capital ($MM)(1) $51 $61 $68
Growth Capital ($MM)(1) $14 $15 $28
Projected Asset Life (years) +9
Reserves (Moz) 5.1
Au Grade (g/t) 2.5
Resources M&I (Moz) 2.6
Au Grade (g/t) 2.8
World Class Cornerstone Asset Significant Open Pit Gold Production to 2026
YE target of 4,000tpd
20 years of uninterrupted profitable production
Over 11M ounces produced since 1997
More than 5M ounces remaining in open pit reserves
Low cost, long life production
High-grade underground opportunity
Strong stable platform to grow Centerra
11June 2017
Kumtor: World Class Open Pit Gold Mine
(1) Non-GAAP measure and is discussed under “Non-GAAP Measures” in the Company’s MDA and news release May 1, 2017.
1.00
1.50
2.00
2.50
3.00
3.50
4.00
4.50
200,000
350,000
500,000
650,000
2014 2015 2016 2017 2018 2019 2020 2021 2022
grade g/t
Oun
ces

12
Mine Type Open Pit, Heap Leach
Avg. LOM Annual Production 110koz Au
Avg. LOM AISC(1) (US$/oz) $490
Reserve Mine Life 8 years
Development Capex (US$MM) $221
P&P Reserves(2)(Moz) 1.2
Au grade (g/t) 1.40
Life of Mine Recovery 77%
Life of Mine Strip Ratio (w:o) 2:1
First Gold Pour Late-2018
IRR (after tax) 43%
NPV(8%) - after tax (US$MM) >$240
2015 Feasibility Highlights
EIA approval received in November 2015
Forestry Permit & GSM License received July 2016
Major construction expected in 2017
Powerline construction underway
Bought back Stratex and Teck royalties
US$150MM low-cost +5-year financing in-place
Significant exploration potential
Projected Near-Term Gold Production (2015 Study)
0.00
0.50
1.00
1.50
2.00
2.50
0
50
100
150
200
250
2016 2017 2018 2019 2020 2021 2022 2023 2024
Proc
ess
Gra
de (
g/to
nne)
Oun
ces
(000
's)
Catalyst Schedule
Öksüt Gold Project
(1) Non-GAAP measure see “Non-GAAP Measures in the MDA and news release of May 1, 2017.(2) Company filings. Technical Report on the Öksüt Gold Project dated September 3, 2015.
0 +1 +2 +3 +4 +5 +6 +7 +8Years:
June 2017
Öksüt: Funded High Margin Gold Production

13June 2017
Öksüt: Powerline Construction

14
Highlights
Boroo mill on care & maintenance awaiting Gatsuurt approval
Gatsuurt declared strategic January 2015
3% royalty (versus 34% ownership) approved by government
Investment development agreement negotiations underway
Potential production 12-18 months after approval
P&P Reserves(1) of 1.6M contained ounces of gold @ 2.9 g/tonne
Strip ratio of 6:1 and process recoveries in excess of 76%
Significant exploration upside
In-Place 5ktpd Processing Facility (Boroo)Boroo’s Historical Cumulative Net Cash Generation (US$MM)
(100)
0
100
200
300
400
500
600
2004 2005 2006 2007 2008 2009 2010 2011 2012 2013 2014
US$
Mill
ions
(1) See mineral reserves news release February 23, 2017.
The Gatsuurt Project is ~90 km north of Ulaanbaatar
June 2017
Gatsuurt: Gold Development Project

15
Cornerstone Canadian Development Project
50:50 development partnership with Premier Gold
Open pit reserves(1) (100%) 4.7Moz Au @ 1.02 g/t
Historic gold production of 4.12M oz (~1934-1970)
Large land package covers 337km2, good infrastructure
Significant exploration and underground resource potential
Ontario: Top Tier Mining Jurisdiction
Greenstone GoldProperty Greenstone Development Project
Location: Ontario, Canada
June 2017
2016 Feasibility Highlights (100%)
Mine Type Open Pit, CIP Mill
Mill Throughput design 27,000 tpd
Avg. LOM Annual Production 288koz Au
Avg. LOM AISC(2) (US$/oz) $600
Reserve Mine Life 14.5 years
Development Capex (US$MM) $962
Sustaining Capital(2) (US$MM) $101
P&P Reserves(1)(Moz) 4.7
Au grade (g/t) 1.02
Life of Mine Recovery 90%
Life of Mine Strip Ratio (w:o) 3.87:1
IRR (after tax) 14.4%
NPV(5%) - after tax (US$MM) $545
Projected Gold Production (100%)
Greenstone: One of Canada’s Largest Undeveloped Open Pit Gold Mines
(1) Technical Report on the Hardrock Project dated December 21, 2016. (2) Non-GAAP measure, see “Non-GAAP measures” in MDA and news release May 1, 2017.

Potential Upside Optionality: Molybdenum
16
Molybdenum business
Well-established molybdenum business
Consists of the Langeloth Metallurgical Facility and two mines: Thompson Creek Mine and Endako Mine
Langeloth can produce a suite of premium molybdenum products that raise the average realized price
Significant defined resources and infrastructure in place
Ability to be one of the first movers upon moly market recovery
Lower cost to restart production compared to greenfield project
Molybdenum business well positioned to recover once market conditions and pricing improve
Thompson Creek Mine
Endako Mine
● Located in Idaho, is the world’s fourth largest open-pit primary
molybdenum mine
● Operations began in 1983, using conventional open-pit mining and a on-
site 25,500 tpd mill
● In December, 2014 placed on care and maintenance
● Endako Mine is a fully integrated molybdenum facility located in BC
● TCM is the operator and 75% owner; Sojitz owns 25%
● Endako consists of three adjoined pits and a fully integrated operation
with on-site mill and multiple hearth roasting facility
● New 55,000 tpd processing facility was completed in 2012 for~US$500MM
● In July 2015 placed on care and maintenance
Langeloth Metallurgical Facility
● Located 40 km west of Pittsburgh, Pennsylvania
● Operates both as a toll processor and as a purchaser of molybdenum
concentrates from third parties
● Cash flows from the Langeloth operations are expected to cover care and
maintenance expenses associated with the molybdenum mines for 2017
Historical Molybdenum Segment EBITDA(1)
$444
$126
$269 $265
$18
$126 $124
($21)
2008 2009 2010 2011 2012 2013 2014 2015
(US$MM)
(1) Prior to intersegment eliminations. Historical EBITDA not reported, therefore calculated based on historical segment disclosure.
June 2017

17
Source: Company filings, FactSet, Available street research.(1) Guidance based on the midpoint of the guidance range.(2) Silver Standard gold guidance is from Marigold and Seabee.(3) Silver Standard AISC based on broker estimates as guidance estimates not provided.(4) Latest available as at February 23, 2017.
P+P Gold Reserves (Moz)(4)
2017 Gold production guidance (Koz)(1) 2017 All-in sustaining costs (US$/oz)(1)
(2)
June 2017
31
21
17 16 1615
8 8 76
43 3
Kinross Gold Eldorado Gold Yamana Gold Centerra Detour Gold New Gold IAMGOLD Acacia Mining B2Gold Alamos Gold Tahoe Resources SEMAFO Silver Standard
(3)
Centerra: Strong Low-cost Operating Platform
785 815 845 860 900 910 940 955 965 975
1,040 1,075
1,200
Centerra SEMAFONew GoldEldoradoGold
AcaciaMining
YamanaGold
AlamosGold
B2Gold SilverStandard
KinrossGold
IAMGOLD DetourGold
TahoeResources
2,600
1,140
875 865
755
575 570
415 405 400 383 287
225
KinrossGold
YamanaGold
AcaciaMining
IAMGOLD Centerra DetourGold
B2Gold AlamosGold
New Gold TahoeResources
EldoradoGold
SilverStandard
SEMAFO

Kumtor: World Class Open Pit Gold Mine
Öksüt: High Margin Open Pit Heap Leach Gold Mine
Gatsuurt: Open Pit Gold Mine with established infrastructure
Cornerstone asset underpinning the Company’s growing production portfolio
Long life, low cost asset generating significant positive cash flow
Funded, late-stage gold development project
Near-term high margin gold production
Investment agreement negotiations underway; anticipated production ~12-18 months after approval
Surface processing infrastructure in-place
18
Mount Milligan: Long Life, Low Cost Open Pit Gold-Copper Mine in British Columbia
Large scale, low cost mine that recently ramped-up; expected to generate significant free cash flow
Amended gold stream positions Mount Milligan as a premier gold asset
Greenstone: Large Scale Open Pit Gold project
One of Canada’s largest undeveloped open pit gold deposits
Bankable feasibility study completed and mine permitting work underway
Pro
duci
ngD
evel
opm
ent
June 2017
Centerra: Built For Success

TSX: CGwww.centerragold.com
Appendices

Centerra Q1 2017 Corporate Update
20
Safety – Continue to roll out “Work Safe : Home Safe” Program Across the Company
Achieved Q1 2017 Net Earnings of $57 Million or $0.20 Cents Per Share, (basic)
Strong Gold Production of 172,644 Ounces and Copper Production of 12.6 million pounds
Centerra’s Q1 2017 All-In Sustaining Cost1 on a by-product basis $756 Per Ounce
Mount Milligan achieved All-In Sustaining Cost1 on a by-product basis of $530 Per Ounce for Q1
Kumtor Generated $102 Million & Mt. Milligan Generated $32 Million Cash Before Working Capital1
Cash Provided by Operations of $72.5 Million ($0.25 per share)
March 31, 2017 Cash2 Position of $358 Million2
On Track to Achieve 2017 Production and Cost Guidance
1. Non-GAAP measure and is discussed under “Non-GAAP Measures” in the Company’s MD&A and News Release dated May 1, 2017.2. Includes cash, cash equivalents, restricted cash and short-term investments, including restricted cash at March 31, 2017.
June 2017

June 2017
21
Cash$542MM
Balance Sheet (US$)
Debt$438MM
(as of March 31, 2017)
Share Count
Q1 - 2017: Internally Funded Business (US$)
Retained Earnings Profile (US$)
0
400
800
1,200
1,600
2,000
0
200
400
600
800
1,000
1,200
2004 2005 2006 2007 2008 2009 2010 2011 2012 2013 2014 2015 2016 Q12017
Gol
d Pr
ice
(US$
/oz)
US$
Mill
ions
Retained Earnings Cumulative Dividends Gold Price
Unrestricted Cash
$81MM
1 Includes cash and cash equivalents, short-term investments and restricted cash, at March 31, 2017 includes $274MM at KGC .2 Cash generated from operations before changes in working capital.
409
102 32 46
69
25 13
32
358
200
250
300
350
400
450
500
550
2016 Cash KumtorCashflow
Mt MilliganCashflow
Workingcapital
changes (MtMand KGC)
Capitalexpenditures
EBRD debtrepayment
Term debtrepayment
Other(Projects,G&A, etc)
Q1 2017 Cash
US$
Mill
ions
12 2
Centerra Q1 - 2017 Corporate Update
1
Restricted Cash$277MM
216.2 216.3 216.3 226.7 235.5 236.1 236.4 236.4 236.4 237.9
291.3 291.3
0
50
100
150
200
250
300
2006 2007 2008 2009 2010 2011 2012 2013 2014 2015 2016 Q12017
millions
June 2017

Centerra: Q1 2017 - Operating Highlights
22
Q1 2017 Q1 20161
Gold ounces produced(1) 172,644 86,444
Copper produced (000’s payable lbs)(1) 12,595 -
Kumtor All-in Sustaining Costs per ounce sold(2) $762 $916
Mt. Milligan All-in Sustaining Costs on a by-product basis per ounce sold(1),(2) $530 -
Consolidated All-in Sustaining Costs on a by-product basis per ounce sold(1),(2) $756 $1,015
1. Mount Milligan numbers 100% basis, 2016 numbers for gold ounces produced excludes any ounces from the Boroo mine and results exclude Mt. Milligan, since the Company closed the Thompson Creek acquisition in October 2016, therefore no comparative numbers.
2. Non-GAAP measure and is discussed under “Non-GAAP Measures” in the Company’s MD&A and News Release dated May 1, 2017.
Q1 2017 gold production - Kumtor 127,400 ounces, Mount Milligan 45,244 ounces1
Q1 2017 copper production - Mount Milligan 12,595,000 pounds1
Kumtor received the necessary permits to raise its tailings dam and the MAD approval for discharging treated effluent in 2017
Mount Milligan achieved 1 million man-hours without a lost time injury on April 24, 2017
May 2017

Centerra: Q1 2017 - Financial Highlights1
23
(in thousands, except ounces, per share amounts, and average realized price4)
Quarter EndedMarch 31, 2017
Quarter EndedMarch 31, 20162
Revenue(3) $220,267 $73,221
Total gold ounces sold(3) 187,914 61,744
Total copper pounds sold (000’s) 13,612 -
Operating cash flow before changes in working capital(4) $118,105 $27,212
Operating cash flow before working capital per share, basic(4) $0.41 $0.11
Cash provided by operations $72,463 $9,427
Cash provided by operations per share, basic $0.25 $0.04
Net earnings $56,954 $18,058
Earnings per share, basic $0.20 $0.08
Average realized gold price per ounce(3)(4) $1,172 $1,1861. U.S. dollars2. No comparative results from Thompson Creek operations presented.3. Gold ounces sold exclude any sales from the Boroo mine.4. Non-GAAP measure and is discussed under “Non-GAAP Measures” in the Company’s MD&A and News Release dated May 1, 2017.
June 2017

Centerra: Other Financial Highlights Q1 2017
24
Debt repayments of US$37.5 Million, outstanding debt US$437.5 Million at March 31, 2017
Implemented a balanced copper hedging program
Executed 19,000 gold ounces zero cost collar hedges for Mount Milligan gold production
On Track to Achieve 2017 Production and Cost Guidance
Cash balance reduction in Q1, 2017 planned with balances from Kumtor and Mount Milligan forecast to grow throughout the remainder of 2017
1 Non-GAAP measure and is discussed under “Non-GAAP Measures” in the Company’s MD&A and News Release dated May 1, 2017.2 Includes restricted cashMay 2017
1,015
756
104
5989
500
600
700
800
900
1,000
1,100
$ /O
z so
ld
Consolidated All-in Sustaining Costs (per ounce sold)
409
102 32 46
69
25 13
32
358
200
250
300
350
400
450
500
550
2016 Cash Kumtor OpsCashflow
Mt MilliganOps Cashflow
Workingcapital
changes (MtMand KGC)
Capitalexpenditures
EBRD debtrepayment
BNS debtrepayment
Other(Projects,G&A, etc)
Q1 2017 Cash
US$
Mill
ions
21 1
2

Centerra: Mineral Reserves - Proven & Probable1
Proven and Probable Gold Mineral Reserves Increase to 16 million ounces
Proven and Probable Copper Mineral Reserves are 2,049 million pounds
Copper Mineral Reserves
Proven Probable Total Proven and Probable
Property Tonnes Grade Contained Tonnes Grade Contained Tonnes Grade Contained(kt) (%) Copper (Mlbs) (kt) (%) Copper (Mlbs) (kt) (%) Copper (Mlbs)
Mt Milligan 256,847 0.187 1,059 239,362 0.188 991 496,209 0.187 2,049
June 2017 251) As at December 31, 2016, see Mineral Reserves and Resources News Release February 23, 2017.

Centerra: 2017 Guidance
26
2017 Gold Production 2017 Copper Production2017 All-in Sustaining Costs on a By-product
basis1
(ounces) (millions pounds) (per ounce sold)
Kumtor Mine 455,000 – 505,000 - $836 – $925
Mount Milligan 260,000 – 290,000 55 – 65 $457 – $508
Centerra 715,000 – 795,000 55 – 65 $743-$824
1 Non-GAAP measure discussed under “Non-GAAP Measures” in the Company’s news release dated May 1, 2017.2 Greenstone growth capital includes capitalized amounts for Premier’s 50% share of the Greenstone costs funded in full by Centerra.
Projects 2017 Sustaining Capital1 2017 Growth Capital1
(millions) (millions)
Kumtor Mine $68 $28
Mount Milligan Mine $26 -
Öksüt Project - $11
Mongolia/Gatsuurt Project - $5
Greenstone Property2 - $8
Corporate and other $2 -
Consolidated Total $96 $52
June 2017
2017
(millions)
Exploration $9
Corporate Administration $35
Community Investment $5

1 Appreciation of currency against the U.S. dollar will result in higher costs and lower cash flow and earnings, depreciation of currency against the U.S. dollar results in decreased costs and increased cash flow and earnings.2 All-in sustaining costs per ounce sold (“AISC”) on a by-product basis is a non-GAAP measure discussed under “Non-GAAP Measures” in the Company’s news release May 1, 2017.3 The Company has recalculated the sensitivities for its revenues, earnings and cash flows for the remaining nine months of 2017 to movements in copper price changes following the commencement in the first quarter of 2017 of a program to mitigate copper price risk by purchasing fixed price forward sales contracts and zero-cost collar.
Centerra 2017 Guidance: Sensitivities
27
Material Assumptions and RisksMaterial assumptions or factors used to forecast production and costs for 2017 include the following:• a gold price of $1,200 per ounce,• a copper price of $2.60 per pound,• a molybdenum price of $7.50 per pound,• exchange rates:
• $1USD:$1.34 CAD,• $1USD:70.0 Kyrgyz som,• $1USD:0.95 Euro,
• diesel fuel price assumption: • $0.50/litre at Kumtor,• $0.65/litre at Mount Milligan.June 2017
Change
Impact on Impact on($ millions) ($ per ounce sold)
Costs Revenues Cash flows Net Earnings (after tax)
AISC(2) on by-product basis
Gold Price $50/oz 2.6 - 3.0 24.2 – 27.7 24.2 – 27.7 21.6 – 24.5 0.3 Copper Price(3) 10% 0.1 3.9 – 5.4 3.7 – 5.2 3.7 – 5.2 3.7 – 5.2 Diesel Fuel 10% 2.6 - 6.2 2.6 9.8 – 11.2
Kyrgyz som(1) 1 som 0.7 - 1.4 0.7 2.2 – 2.6
Canadian dollar(1) 10 cents 15.1 - 16.7 15.1 26.3 – 30.1

Greenstone: One of Canada’s Largest Undeveloped Open Pit Gold Mines
28
Cornerstone Canadian Development Project
50:50 development partnership with Premier Gold
Open pit reserves(1) (100%) 4.7Moz Au @ 1.02 g/t
Historic gold production of 4.12M oz (~1934-1970)
Large land package covers 337km2, good infrastructure
Significant exploration and underground resource potential
Bankable feasibility study completed in November 2016
Ontario: Top Tier Mining Jurisdiction
Greenstone GoldProperty Greenstone Development Project
Location: Ontario, Canada
Geraldton
Beardmore
JellicoeBrookbank
HardrockViper
11
Beardmore – Geraldton Greenstone Belt +110 km
Brookbank Deposit
Hardrock Deposit
June 2017 (1) Technical Report on the Hardrock Project dated December 21, 2016.

Industry Experience Background
20 years• Appointed Chief Executive Officer in November, 2015
• Former Chief Executive Officer at AuRico Gold
25 years • Appointed President in November, 2015
• Joined Centerra in 2004
30 years• Appointed Chief Operating Officer in January, 2013
• Joined Centerra in 2004
18 years• Appointed Chief Financial Officer in April, 2016
• Joined Centerra in 2013
SCOTT PERRYChief Executive Officer
FRANK HERBERTPresident
GORDON REIDChief Operating Officer
Centerra: Senior Management
DARREN MILLMANChief Financial Officer
29June 2017
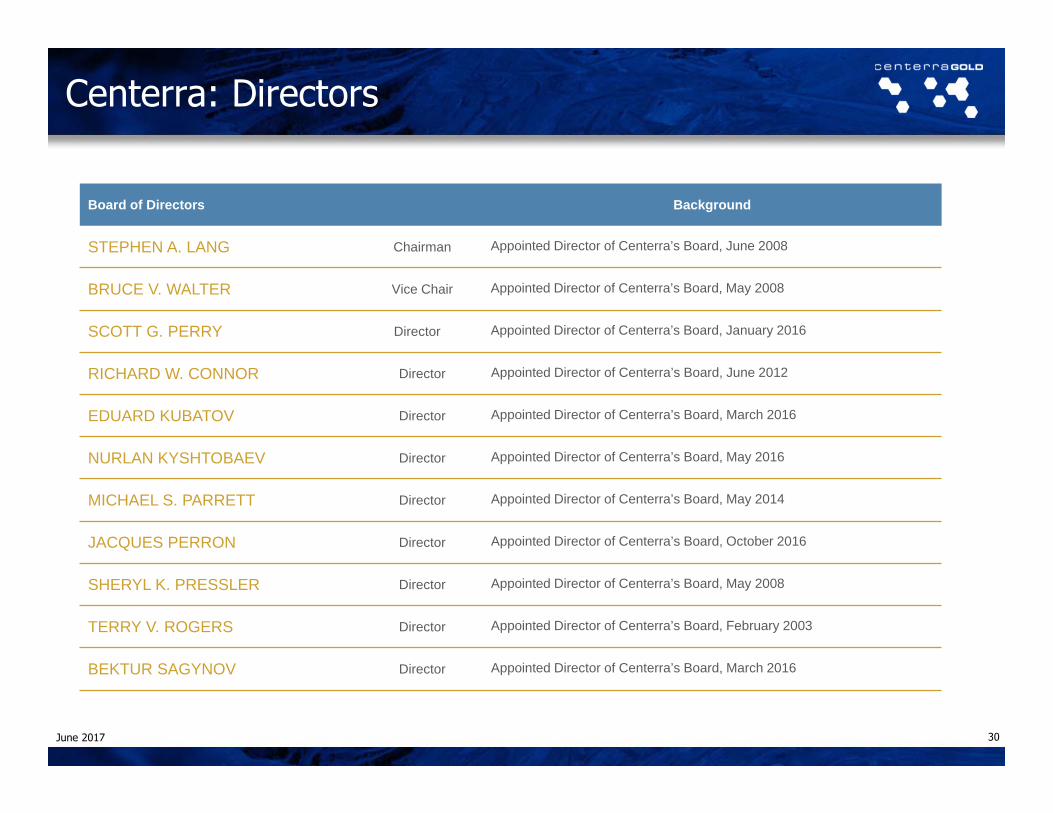
Board of Directors Background
STEPHEN A. LANG Chairman Appointed Director of Centerra’s Board, June 2008
BRUCE V. WALTER Vice Chair Appointed Director of Centerra’s Board, May 2008
SCOTT G. PERRY Director Appointed Director of Centerra’s Board, January 2016
RICHARD W. CONNOR Director Appointed Director of Centerra’s Board, June 2012
EDUARD KUBATOV Director Appointed Director of Centerra’s Board, March 2016
NURLAN KYSHTOBAEV Director Appointed Director of Centerra’s Board, May 2016
MICHAEL S. PARRETT Director Appointed Director of Centerra’s Board, May 2014
JACQUES PERRON Director Appointed Director of Centerra’s Board, October 2016
SHERYL K. PRESSLER Director Appointed Director of Centerra’s Board, May 2008
TERRY V. ROGERS Director Appointed Director of Centerra’s Board, February 2003
BEKTUR SAGYNOV Director Appointed Director of Centerra’s Board, March 2016
Centerra: Directors
30June 2017

TSX: CGwww.centerragold.com