Embed Size (px)
Citation preview

I N V E S T O R P R E S E N T A T I O N0 6 . 1 5
1

DISCLAIMER AND OTHER MATTERS SAFE HARBOR: Some statements contained in this presentation are forward-looking statements within the meaning of the Private Securities Litigation Reform Act of1995 and applicable Canadian securities laws. Investors are cautioned that forward-looking statements are inherently uncertain and involve risks and uncertainties thatcould cause actual results to differ materially. Such statements include comments regarding: timing and cash operating costs over the life of mine; the Company beingfully financed for development at a reduced cost of capital; the rise in total costs, and improved efficiencies that reduce unit and per ounce costs; Wassa grade forecastsover the remainder 2015; Bogoso refractory costs reducing over the next three quarters; the easing of load shedding and the reduction in Wassa diesel power costs; theimpact of a decreased strip ratio and maintenance on Bogoso costs for the remainder of 2015; the improvement in the Company’s cost profile once the undergroundmines are in production; the benefits of the stream and loan transaction; Golden Star transforming to a non-refractory miner with a declining cash cost profile; thetiming for the development of and production from the underground mines and the payback period; and plans for deeper drilling at Wassa. Factors that could causeactual results to differ materially include timing of and unexpected events at the Bogoso oxide and sulfide processing plants and/or at the Wassa processing plant;variations in ore grade, tonnes mined, crushed or milled; variations in relative amounts of refractory, non-refractory and transition ores; delay or failure to receive boardor government approvals and permits; construction delays; the availability and cost of electrical power; timing and availability of external financing on acceptable terms;technical, permitting, mining or processing issues, including difficulties in establishing the infrastructure for Wassa Underground; changes in U.S. and Canadian securitiesmarkets; and fluctuations in gold price and input costs and general economic conditions. There can be no assurance that future developments affecting the Company willbe those anticipated by management. Please refer to the discussion of these and other factors in our Annual Information Form for the year ended December 31, 2013.Additional factors, if applicable, will be included in our Annual Information Form for the year ended December 31, 2014, which will be filed on SEDAR at www.sedar.com.The forecasts contained in this presentation constitute management's current estimates, as of the date of this presentation, with respect to the matters covered thereby.We expect that these estimates will change as new information is received and that actual results will vary from these estimates, possibly by material amounts. While wemay elect to update these estimates at any time, we do not undertake to update any estimate at any particular time or in response to any particular event. Investors andothers should not assume that any forecasts in this presentation represent management's estimate as of any date other than the date of this presentation.
NON-GAAP FINANCIAL MEASURES: In this presentation, we use the terms "cash operating cost per ounce" or “CoC per ounce” and "all-in sustaining cost per ounce“or “AISC per ounce”. These terms should be considered as Non-GAAP Financial Measures as defined in applicable Canadian and United States securities laws and shouldnot be considered in isolation or as a substitute for measures of performance prepared in accordance with GAAP. "Cash operating cost per ounce" for a period is equal tothe cost of sales excluding depreciation and amortization for the period less royalties and production taxes, minus the cash component of metals inventory net realizablevalue adjustments and severance charges divided by the number of ounces of gold sold during the period. "All-in sustaining costs per ounce" commences with cashoperating costs and then adds sustaining capital expenditures, corporate general and administrative costs, mine site exploratory drilling and greenfield evaluation costsand environmental rehabilitation costs. This measure seeks to represent the total costs of producing gold from operations. These measures are not representative of allcash expenditures as they do not include income tax payments or interest costs. These measures are not necessarily indicative of operating profit or cash flow fromoperations as would be determined under International Financial Reporting Standards. Changes in numerous factors including, but not limited to, mining rates, millingrates, gold grade, gold recovery, and the costs of labor, consumables and mine site general and administrative activities can cause these measures to increase ordecrease. We believe that these measures are the same or similar to the measures of other gold mining companies, but may not be comparable to similarly titledmeasures in every instance. In order to indicate to stakeholders the company's earnings excluding the non-cash (gain)/loss on the fair value of debentures, non-cashimpairment charges and severance charges, the Company calculates adjusted net loss attributable to Golden Star shareholders" and "adjusted net loss per shareattributable to Golden Star shareholders" to supplement the condensed interim consolidated financial statements.
INFORMATION: The information contained in this presentation has been obtained by Golden Star from its own records and from other sources deemed reliable,however no representation or warranty is made as to its accuracy or completeness. The technical information relating to Golden Star's material properties disclosedherein is based upon technical reports prepared and filed pursuant to National Instrument 43-101 Standards for Disclosure of Mineral Properties ("NI 43-101") and otherpublicly available information regarding the Company, including the following: (i) “NI 43-101 Technical Report on a Preliminary Economic Assessment of the Wassa OpenPit Mine and Underground Project in Ghana” effective October 30, 2014 prepared by SRK Consulting (UK) Limited; (ii) “NI 43-101 Technical Report on Resources andReserves, Golden Star Resources Ltd., Bogoso Prestea Gold Mine, Ghana” effective December 31, 2013 prepared by SRK Consulting (UK) Limited, and (iii) “NI 43-101Technical Report on Preliminary Economic Assessment of Shrinkage Mining of the West Reef Resource, Prestea Underground Mine, Ghana”. Additional information isincluded in Golden Star's Annual Information Form for the year ended December 31, 2013 which is filed on SEDAR. Mineral Reserves were prepared under thesupervision of Dr. Martin Raffield, Senior Vice President Technical Services for the Company. Dr. Raffield is a "Qualified Person" as defined by Canada's NationalInstrument 43-101. The Qualified Person reviewing and validating the estimation of the Mineral Resources is S. Mitchel Wasel, Golden Star Resources Vice President ofExploration.
CURRENCY: All monetary amounts refer to United States dollars unless otherwise indicated.
2 Investor Presentation June 2015

MANAGEMENT AND BOARD
Sam Coetzer, President and CEOAppointed CEO in 2013 after joining in 2011 as COO. Sam is a mining engineer and member of the World Gold Council. He has 27 years of international experience with Kinross, Xstrata, Xstrata Coal and Placer Dome.
André van Niekerk, EVP and CFOAndré joined in 2006 and spent 5 years in Ghana as head of finance and business operations, whereafter he was appointed Group Controller. He was appointed CFO in 2014. Prior to joining Golden Star, André spent 6 years with KPMG
Daniel Owiredu, EVP and COODaniel was appointed COO in 2013, after joining Golden Star in 2006 as VP, Ghana Operations. He has 20 years of experience in West African mining. Most recently, he was Deputy COO for AngloGold where he managed construction and operation of the Bibiani, Siguiri and Obuasi mines.
Tim Baker, ChairmanAppointed Chairman in January 2013. Tim recently served as the COO of Kinross. He is a geologist with over 30 years of global project development and operational experience in Chile, Tanzania, US, Venezuela, Kenya and Liberia.
Tony Jensen, DirectorTony has 25 years of mining experience and is CEO of Royal Gold. Prior to joining Royal Gold, he was the Mine GM of Cortez and spent 18 years with Placer Dome. Tony has extensive experience in the US and Chile where he held several senior management positions.
Anu Dhir, DirectorAnu is the MD of Miniqs, a private group that develops resource projects. She is a Director of Atlatsa Resources, Frontier Rare Earths and Energulf Resources. Prior to founding Miniqs, Anu was VP Corporate Development and Company Secretary at Katanga.
Craig Nelson, DirectorCraig is a geologist with 30 years of mining experience. He was Founder, CEO of Avanti Mining. Formerly, Craig was EVP Exploration of Gold Fields; Founder, CEO and Chairman of the Metallica Resources and held numerous strategic positions at Lac Minerals.
Rob Doyle, DirectorRob has 30 years of mining experience. Recently, he was Founder and CEO of Medoro Resources. Prior to this, he served as CFO of Pacific Stratus Energy, Coalcorp Mining and Bolivar Gold Corp. Currently, Rob serves as a Director of Mandalay Resources and Detour Gold
Bill Yeates, DirectorBill is one of the founding partners of Hein & Assoc where he served on the ExCo and was their National Director of Auditing and Accounting. Bill has 40 years of auditing experience with public companies in extractive industries.

GOLDEN STAR OPERATIONS IN GHANA
4 Investor Presentation June 2015

INVESTING IN PROFITABLE GROWTH
— Established producing gold miner with wealth of in-country experience
— Extensive infrastructure provides significant operational leverage
— Brownfield low-risk development projects set to transform group production profile
— On track to deliver ounces at cash operating cost of $750 per ounce over LOM
— Expected to be fully financed for development at reduced cost of capital
5 Investor Presentation June 2015

DELIVERING ON STRATEGY
STRATEGY ACTION
Favour operating margin over total ounces produced
150,000 oz of Bogoso production to be replaced with 75,000 high margin Prestea oz’s
2014 Mineral Reserves reduced to 1.9M oz with removal of the high cost refractory ounces
2014 High grade non-refractory Inferred Mineral Resources increased by 1.2M oz
Leverage off existing infrastructure
IRR on development projects in excess of 70% achieved through operational leverage
Capex per ounce for both projects in lowest quartile for West Africa
Reduce costs at operations through behavioural change and productivity enhancements
Lower level of mine operating expenses maintained for three quarters
Disciplined focus on return on capital
Investment in development drilling extended Wassa’s LOM and increased grade
Decision taken not to continue refractory operations
Two year process secured financing at lowest cost of capital
6 Investor Presentation June 2015

Q1 2015 OPERATIONAL PERFORMANCE
MINING DEVELOPMENT OPTIMISATION
Focus on STARTER PIT at Wassa
PRE-CONSTRUCTIONwork at Wassa progressed
New high pressure
pump INCREASEStailings
THROUGHPUT
BOGOSO NORTH Pit mined out
Prestea underground
REHABILITATIONcontinues
Bogoso
HEAD COUNT REDUCED by 15%
over last 12 months
LIMITEDINTERRUPTIONSfrom load shedding andpower issues
Prestea surface operations
PERMITTING PROGRESSED
7 Investor Presentation June 2015

Q1 2015 FINANCIAL PERFORMANCE
REVENUE LOWER
Revenue was $77M, with 63,245 ounces at an average realised gold price of $1,210 per ounce
COSTS FLAT
Total mine operating expenses were reduced quarter over quarter to $69M
Cash operating costs (COC) per ounce1 were $1,061
NEGATIVE EARNINGS
Adjusted net loss to shareholders of $9M
1. See note on slide 2 regarding Non-GAAP Financial Measures
8 Investor Presentation June 2015

2015 YTD WASSA PROJECT UPDATE
— Mineral Reserve and Resource estimates updated
— Mineral Reserves declined as low grade ore excluded, grade increased to 2.04 g/t
— M&I Mineral Resources increased to 3.5M oz at higher grade of 2.21 g/t Au
— Dramatic increase in Inferred Mineral Resources to 1.4M oz at 3.79 g/t Au
— Q1 2015 Feasibility Study results announced
— IRR of 83%, NPV5% $176M
— Pre-production capex of $39M confirmed
— First production expected mid 2016, commercial production mid 2016, LOM extends to 2024
— LOM cash operating costs of $780 per oz, AiSC of $938 per oz
— Senior management team hired and on site
— Equipment, including underground mining fleet, either in transit or on site
— Platform for exploration decline complete
— Construction to start July 2015, open pit mining not impacted
— $7.3M of $28M budget for 2015 spent to date
9 Investor Presentation June 2015
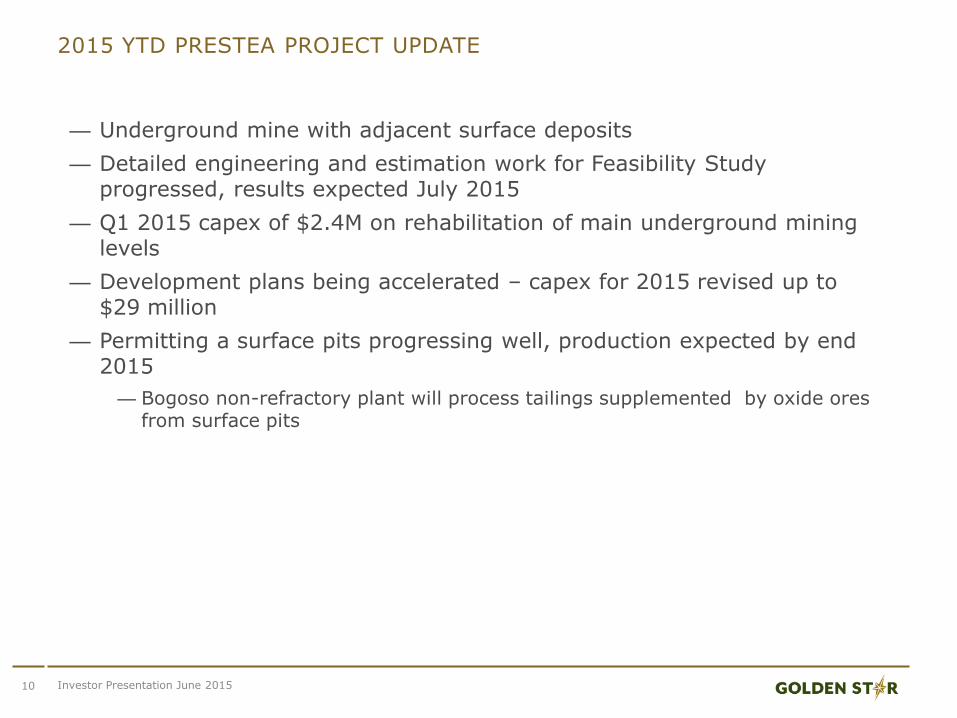
2015 YTD PRESTEA PROJECT UPDATE
— Underground mine with adjacent surface deposits
— Detailed engineering and estimation work for Feasibility Study progressed, results expected July 2015
— Q1 2015 capex of $2.4M on rehabilitation of main underground mining levels
— Development plans being accelerated – capex for 2015 revised up to $29 million
— Permitting a surface pits progressing well, production expected by end 2015
— Bogoso non-refractory plant will process tailings supplemented by oxide ores from surface pits
10 Investor Presentation June 2015

Commercial production achieved underground
Construction of exploration decline commences
First stopes reached
TIMELINE TO DELIVERY
* Development of projects dependent on positive study results
WASSA
PRESTEA*
Preparation of surface pits commences
Q3’15
Q3’15
First production from Wassa underground stopes
Underground Shaft rehabilitation commences
Q3’15
Feasibility study completed
July 2015
First production from surface pits
Q4’15
First production from underground stopes
Q4’16
July 2015 Q2’16 Q3’16
11 Investor Presentation June 2015

TRANSFORMATIONAL GOLD STREAM AND LOAN AGREEMENT
— Aggregate proceeds from Royal Gold and subsidiary of $150M
— Gold stream of $130M:
—207,500 ounces delivered at cash price of 20% of spot
—3% of production at 30% of spot in tail stream, with option to repurchase 50% of this
— Four year $20M secured term loan note, interest rate linked to gold price
—At Au $1,200 rate is 7.5%
—Rate shall not exceed 11.5%
—No early prepayment penalty
— Existing $38M Ecobank I loan retired immediately
— Royal Gold to take security against mining assets
12 Investor Presentation June 2015

STRONG RATIONALE FOR TRANSACTION
— Secures financing for development of Wassa and Prestea on reasonable terms
— Significant improvement in cost profile expected once underground mines in production
— Transition to non-refractory producer, in-line with Company’s stated strategy
— Low capital intensity projects, short timeline to production and good free cash flow
— Brownfield projects benefit from existing infrastructure and lower execution risk
— Unlocks further exploration upside at both assets
— Establishes a strong partnership with Royal Gold, validates Wassa and Prestea’s potential
13 Investor Presentation June 2015

FINANCING STRUCTURE FIT FOR PURPOSE
• $55M of $130M stream proceeds available in up-front capital
• $20M loan and portion of stream proceeds used to repay $38M Ecobank I loan
• Five additional payments of $15M provided every 3 mo, beginning September 2015
• Financing expected to fully fund development of Wassa and Prestea Underground projects
• Incremental stream proceeds of $33M for working capital and general corporate purposes
RGLD
Stream
$130M
RGI Loan
$20M
Wassa
$39M
Ecobank
Debt
$38M
Sources of Funds Uses of Funds
Prestea$40M
Working Cap and General Purposes
$33M
14 Investor Presentation June 2015

MINE PRODUCTION PROFILES
114,000 120,000
169,000
200,000
218,000
175,000 176,000 171,000
114,000
11,000
-
50,000
100,000
150,000
200,000
250,000
2015 2016 2017 2018 2019 2020 2021 2022 2023 2024
4,000
60,000
91,000
75,000
73,000
19,000
0
25,000
50,000
75,000
100,000
2016 2017 2018 2019 2020 2021
WASSA
PRESTEA*
15 Investor Presentation June 2015
* Development of projects dependent on positive study results

NEW MINES DELIVER IMPROVED COST PROFILE
Note: See note on slide 2 regarding Non-GAAP Financial Measures,. Cash operating costs exclude royalties, AISC includes cash operating costs rehabilitation and sustaining capital and royalties on the assumption of $1,200 Au
— Golden Star is transforming to a non-refractory miner with a declining cash cost profile
— Largest land package on Ashanti Goldbelt provides potential for new ore sources to add near and long term production and further reduce costs
16 Investor Presentation June 2015
$500
$700
$900
$1,100
$1,300
2014 2015E 2016E 2017E 2018E 2019E 2020E 2021E 2022E
CoC per Oz. AiSC per Oz.

ATTRACTIVE COST POSITION, LOW INITIAL CAPITAL
Wassa UGPrestea UG
Karma
Bombore
Obotan (Phase 1)
BanforaYaramoko
Yaoure
Fekola
Natougou
BoulyKalana
EnchiSissingue
Prestea UG + Wassa UG
--
$100
$200
$300
$400
$500
$400 $500 $600 $700 $800 $900
Rem
ain
ing D
evelo
pm
ent
Capex (
US$ m
m)
LOM Average Annual Cash Costs (US$/oz Au)
Bubble size represents
LOM avg. annual Au production
(100 koz shown)
— In production at both operations by end of 2016
— Payback on both operations of less than 3.5 years
1. For ease of comparison, all Golden Star average annual cash costs are reflected above inclusive of royalties
17 Investor Presentation June 2015

FUNDING ALLOWS FOR FURTHER EXPLORATION AT WASSA
— Geophysical and geochemical anomalies indicated that mineralized trend continues 6 km south of the last step out fence
— Deeper drilling will be conducted south of the known high grade mineralization
18 Investor Presentation June 2015

Investment Case
Established gold mining company with
15 years of production history in Ghana
Successfully reduced overall operating
costs over last two years
Fully funded projects to deliver low cost
ounces through 2026
Largest land package on the Ashanti
Gold belt
Low political risk in a stable African
mining jurisdiction
Significant exploration & development
upside
Offers investors leveraged, un-hedged
exposure to the gold price