Embed Size (px)
Citation preview
SIMPLE & LEAN PRODUCER

DISCLAIMER AND OTHER MATTERS
June 2016 NYSE MKT: GSS TSX:GSC
2
SAFE HARBOR: Some statements contained in this presentation are forward-looking statements or forward-looking information (collectively, “forward-lookingstatements”) within the meaning of the United States Private Securities Litigation Reform Act of 1995 and applicable Canadian securities laws. Investors are cautioned thatforward-looking statements are inherently uncertain and involve risks and uncertainties that could cause actual results to differ materially. Such statements includecomments regarding: additional payments from RGLD Gold AG under the streaming agreement; the completion and timing of the bought deal financing; the timing andduration of the shutdown at Wassa; the effect of the Wassa shutdown and seasonality on Wassa production; the improvement of grades at Wassa due to WassaUnderground production; the timing for first ore and commercial production, and average annual production, from Wassa Underground; any production extension from thePrestea open pits; the opportunity for cost savings at the Prestea open pit and underground operations; production and cash operating costs for 2016; the results of thePrestea Underground mine feasibility study, including production, life of mine cash operating costs per ounce and all-in sustaining costs per ounce, and the impact of thechange to mechanized shrinkage mining at Prestea Underground thereon; future work to be completed at Prestea Underground Mine, including the timing for mechanicaland electrical rehabilitation work, as well as pre-development and development work and stoping; the timing of and amount of production from each of WassaUnderground mine and Prestea Underground Mine; and the ability to continue growth and extend mine life of the Prestea open pits; capital expenditures for thedevelopment of Wassa Underground and Prestea Underground mine. Factors that could cause actual results to differ materially include timing of and unexpected events atthe Bogoso/Prestea and/or the Wassa processing plants; variations in ore grade, tonnes mined, crushed or milled; delay or failure to receive board or governmentapprovals and permits; construction delays; the availability and cost of electrical power; timing and availability of external financing on acceptable terms or at all;technical, permitting, mining or processing issues, including difficulties in establishing the infrastructure for Wassa Underground, inconsistent power supplies, plant and/orequipment failures and an inability to obtain supplies and materials on reasonable terms (including pricing) or at all; changes in U.S. and Canadian securities markets; andfluctuations in gold price and input costs and general economic conditions. There can be no assurance that future developments affecting the Company will be thoseanticipated by management. Please refer to the discussion of these and other factors in our Annual Information Form for the year ended December 31, 2015 filed onSEDAR at www.sedar.com. The forecasts contained in this presentation constitute management's current estimates, as of the date of this presentation, with respect to thematters covered thereby. We expect that these estimates will change as new information is received and that actual results will vary from these estimates, possibly bymaterial amounts. While we may elect to update these estimates at any time, we do not undertake to update any estimate at any particular time or in response to anyparticular event. Investors and others should not assume that any forecasts in this presentation represent management's estimate as of any date other than the date ofthis presentation.
NON-GAAP FINANCIAL MEASURES: In this presentation, we use the terms "cash operating cost per ounce" and "all-in sustaining cost per ounce“ or “AISC per ounce”.These terms should be considered as Non-GAAP Financial Measures as defined in applicable Canadian and United States securities laws and should not be considered inisolation or as a substitute for measures of performance prepared in accordance with International Financial Reporting Standards. "Cash operating cost per ounce" for aperiod is equal to the cost of sales excluding depreciation and amortization for the period less royalties, the cash component of metals inventory net realizable valueadjustments and severance charges divided by the number of ounces of gold sold during the period. "All-in sustaining costs per ounce" commences with cash operatingcosts and then adds sustaining capital expenditures, corporate general and administrative costs, mine site exploratory drilling and greenfield evaluation costs andenvironmental rehabilitation costs, divided by the number of ounces of gold sold during the period. This measure seeks to represent the total costs of producing gold fromoperations. These measures are not representative of all cash expenditures as they do not include income tax payments or interest costs. These measures are notnecessarily indicative of operating profit or cash flow from operations as would be determined under International Financial Reporting Standards. Changes in numerousfactors including, but not limited to, mining rates, milling rates, gold grade, gold recovery, and the costs of labor, consumables and mine site general and administrativeactivities can cause these measures to increase or decrease. We believe that these measures are the same or similar to the measures of other gold mining companies, butmay not be comparable to similarly titled measures in every instance. In order to indicate to stakeholders the Company's earnings excluding the non-cash (gain)/loss onthe fair value of debentures, non-cash impairment charges and severance charges, the Company calculates adjusted net earnings / (loss) attributable to Golden Starshareholders" and "adjusted net earnings/ (loss) per share attributable to Golden Star shareholders" to supplement the condensed interim consolidated financialstatements.
INFORMATION: The information contained in this presentation has been obtained by Golden Star from its own records and from other sources deemed reliable, howeverno representation or warranty is made as to its accuracy or completeness. The technical information relating to Golden Star's material properties disclosed herein is basedupon technical reports prepared and filed pursuant to National Instrument 43-101 - Standards of Disclosure for Mineral Projects ("NI 43-101") and other publicly availableinformation regarding the Company, including the following: (i) “NI 43-101 Technical Report on a Feasibility Study of the Wassa Open Pit Mine and Underground Project inGhana” effective December 31, 2014; (ii) “NI 43-101 Technical Report on Resources and Reserves, Golden Star Resources Ltd., Bogoso Prestea Gold Mine, Ghana”effective December 31, 2013, and (iii) “NI 43-101 Technical Report on a Feasibility Study of the Prestea Underground gold project in Ghana” effective November 5, 2015.Additional information is included in Golden Star's Annual Information Form for the year ended December 31, 2015 which is filed on SEDAR. Mineral Reserves wereprepared under the supervision of Dr. Martin Raffield, Senior Vice President Technical Services for the Company. Dr. Raffield is a "Qualified Person" as defined by NI 43-101. The Qualified Person reviewing and validating the estimation of the Mineral Resources is S. Mitchel Wasel, Golden Star Resources Vice President of Exploration.
CURRENCY: All monetary amounts refer to United States dollars unless otherwise indicated.
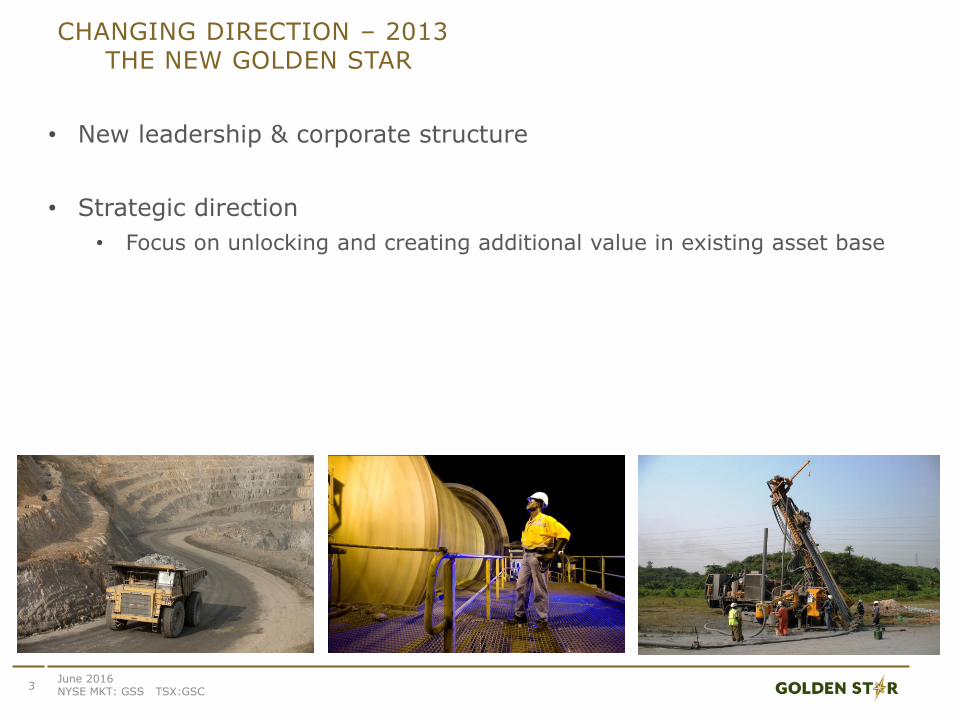
CHANGING DIRECTION – 2013THE NEW GOLDEN STAR
3June 2016 NYSE MKT: GSS TSX:GSC
• New leadership & corporate structure
• Strategic direction
• Focus on unlocking and creating additional value in existing asset base
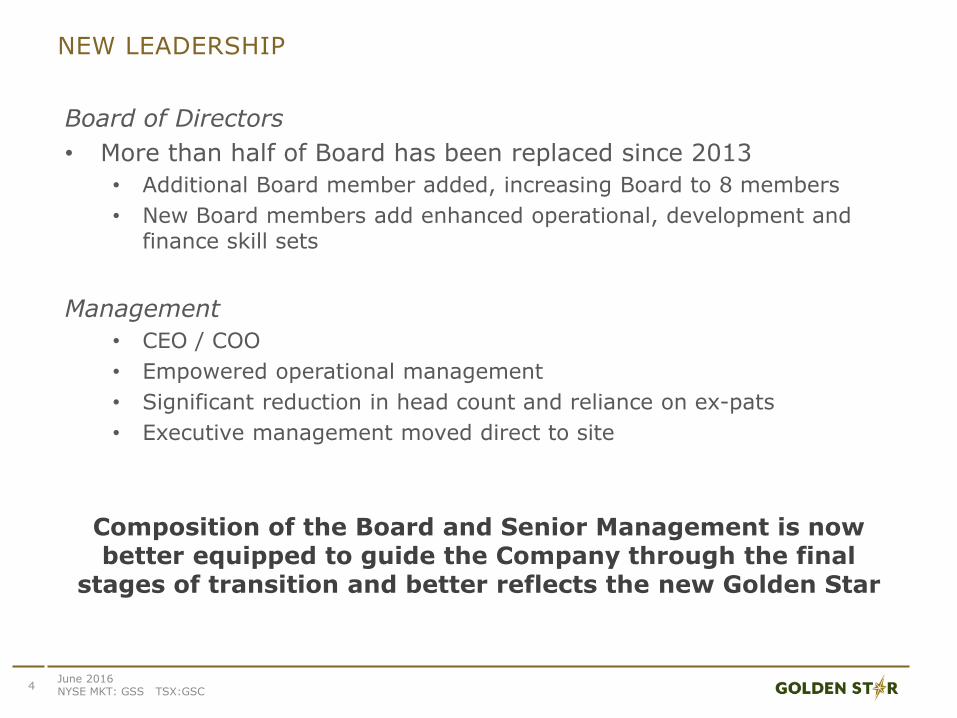
NEW LEADERSHIP
Board of Directors
• More than half of Board has been replaced since 2013
• Additional Board member added, increasing Board to 8 members
• New Board members add enhanced operational, development and finance skill sets
Management
• CEO / COO
• Empowered operational management
• Significant reduction in head count and reliance on ex-pats
• Executive management moved direct to site
Composition of the Board and Senior Management is now better equipped to guide the Company through the final
stages of transition and better reflects the new Golden Star
4June 2016 NYSE MKT: GSS TSX:GSC
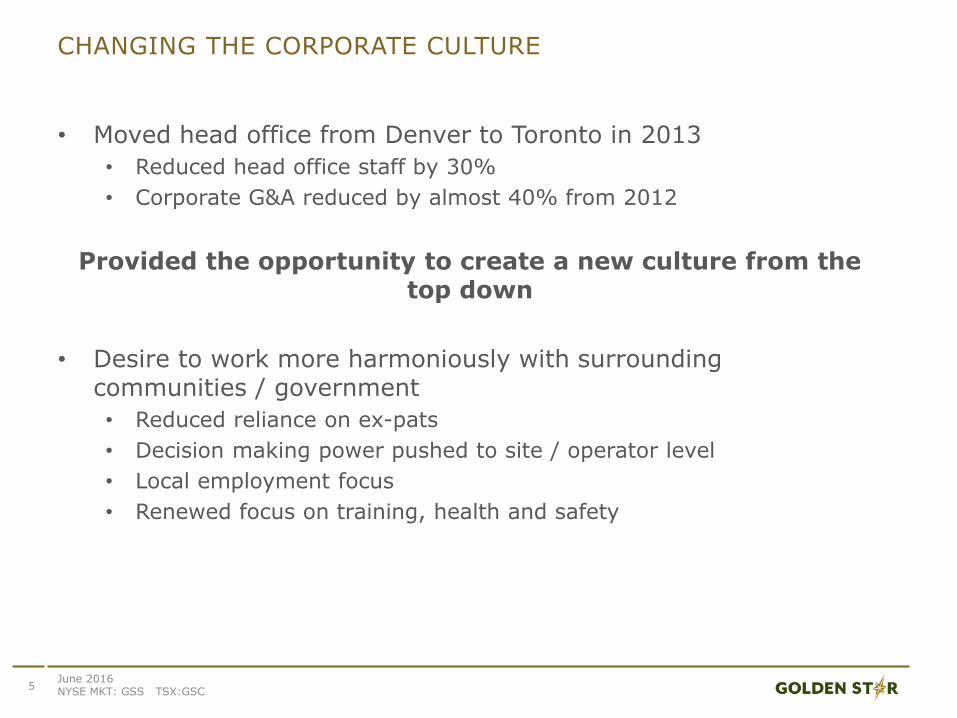
CHANGING THE CORPORATE CULTURE
• Moved head office from Denver to Toronto in 2013
• Reduced head office staff by 30%
• Corporate G&A reduced by almost 40% from 2012
Provided the opportunity to create a new culture from the top down
• Desire to work more harmoniously with surrounding communities / government
• Reduced reliance on ex-pats
• Decision making power pushed to site / operator level
• Local employment focus
• Renewed focus on training, health and safety
5June 2016 NYSE MKT: GSS TSX:GSC
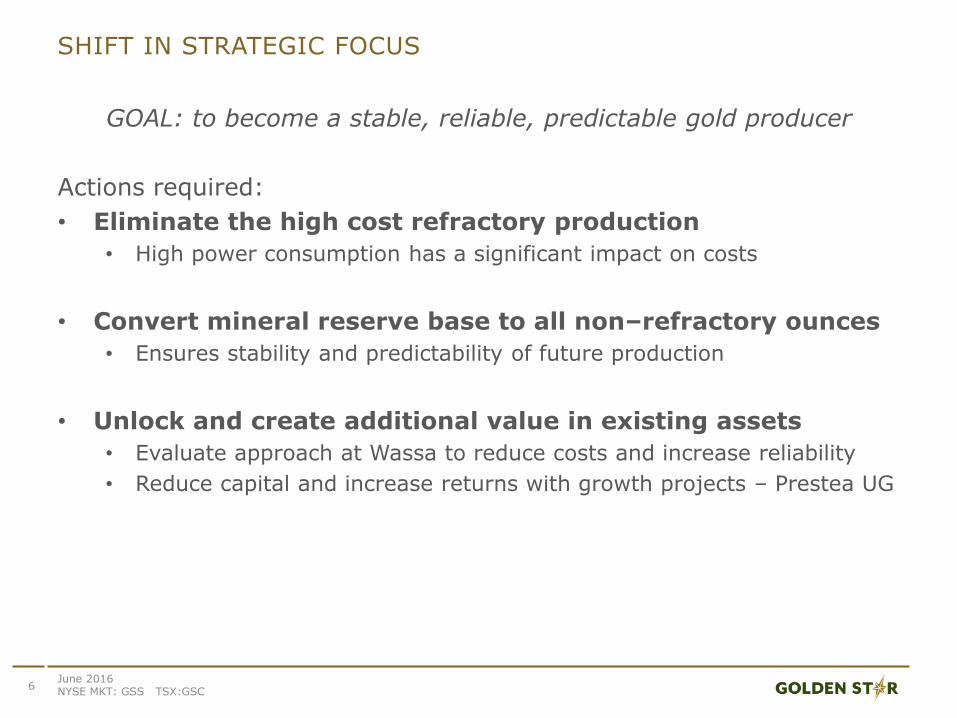
SHIFT IN STRATEGIC FOCUS
GOAL: to become a stable, reliable, predictable gold producer
Actions required:
• Eliminate the high cost refractory production
• High power consumption has a significant impact on costs
• Convert mineral reserve base to all non–refractory ounces
• Ensures stability and predictability of future production
• Unlock and create additional value in existing assets
• Evaluate approach at Wassa to reduce costs and increase reliability
• Reduce capital and increase returns with growth projects – Prestea UG
6June 2016 NYSE MKT: GSS TSX:GSC
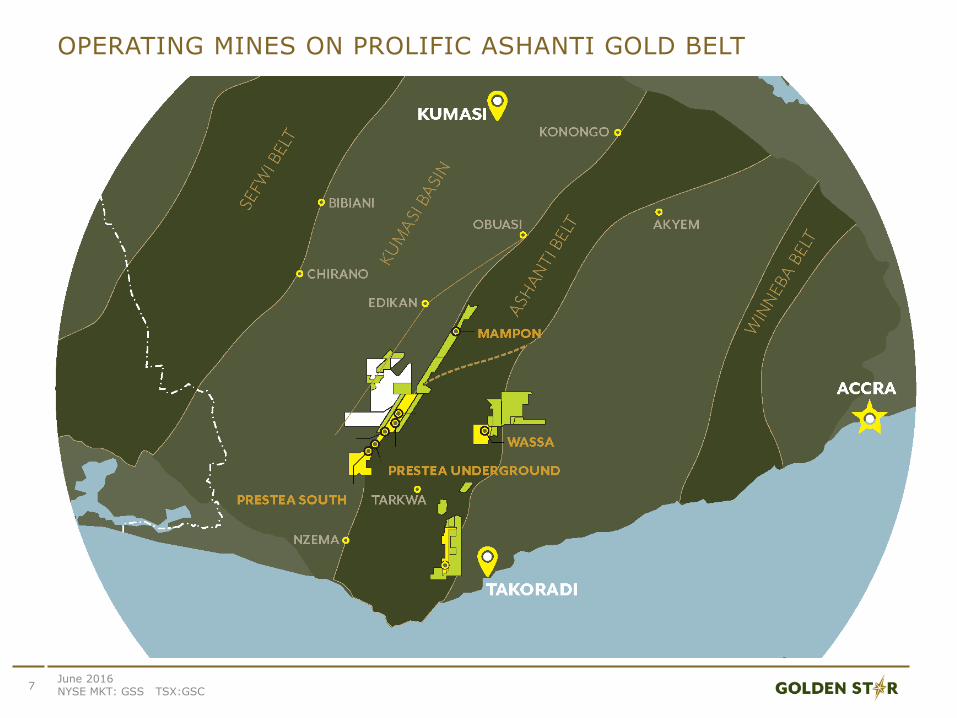
OPERATING MINES ON PROLIFIC ASHANTI GOLD BELT
7June 2016 NYSE MKT: GSS TSX:GSC

WASSA – CHANGING THE APPROACH TO UNLOCK VALUE
8June 2016 NYSE MKT: GSS TSX:GSC
• Acquired in 2001
• Production began in 2005 with the mining of numerous shallow open pits of varying grades
• Production and costs variable
• Haulage costs increased over time as distance to processing plant increased

WASSA – THE NEW APPROACHACCESSING FROM THE OPEN PIT & UNDERGROUND
• Strategic focus:
• One main large ore body
• Main pit in production since 2013
• Increase productivity
• Larger equipment
• Reduce reliance on contract mining
• 500 metres from mill
• Mill efficiency
• Throughput and recoveries
9June 2016 NYSE MKT: GSS TSX:GSC
New focus resulted in significant cost reductions Mining costs reduced by 37% from 2013 to 2015
Site G&A reduced by over 40% over the same period
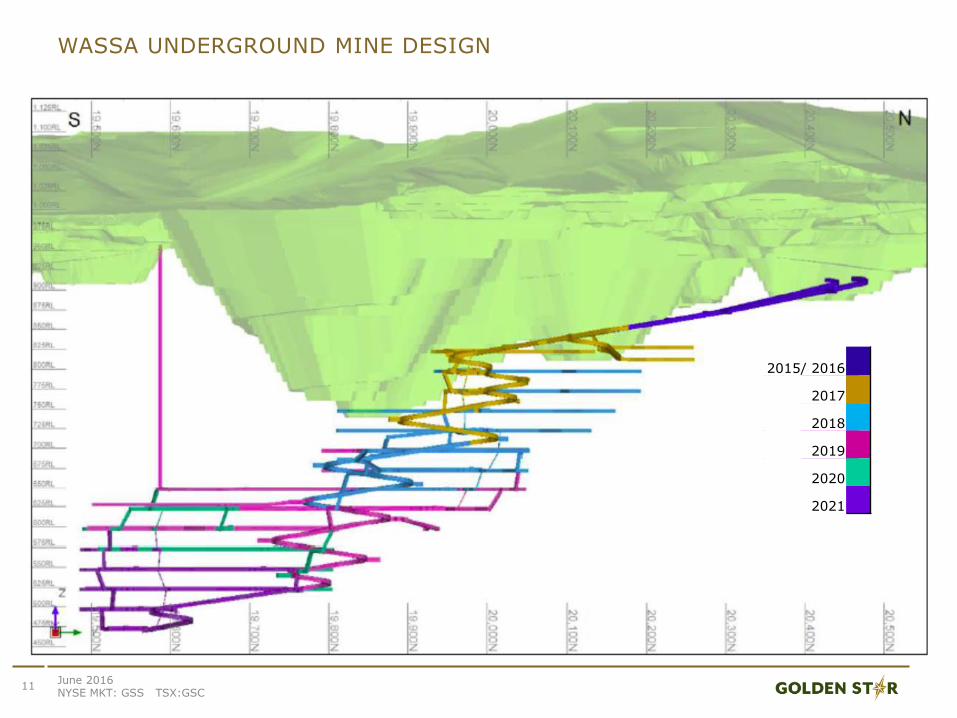
• To accelerate cash flow generation – higher grade portion of the ore body to be accessed from the underground
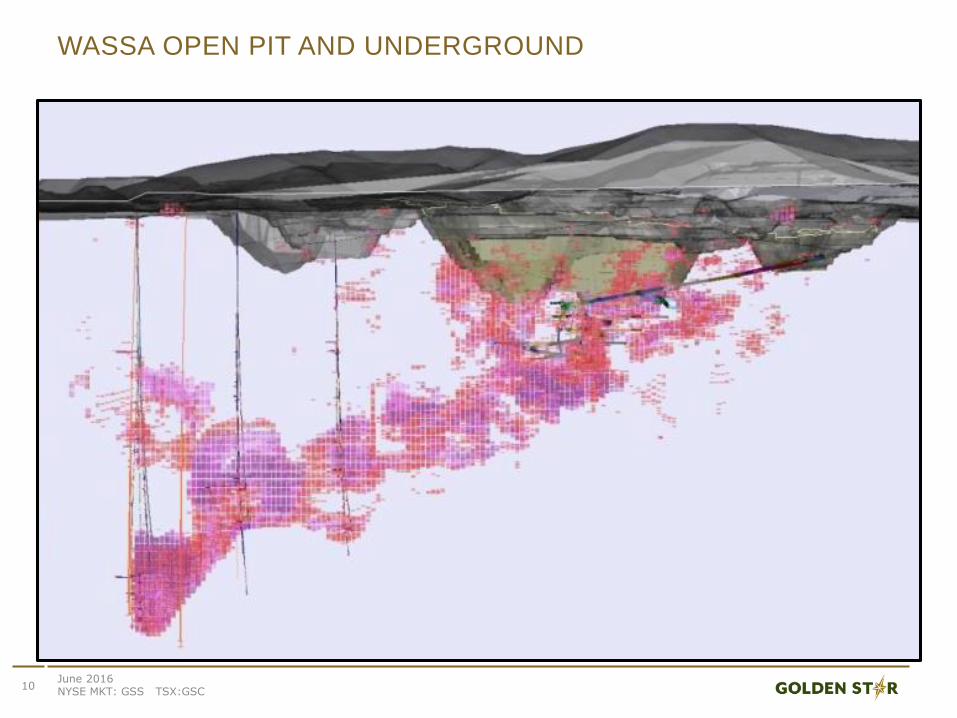
WASSA OPEN PIT AND UNDERGROUND
10June 2016 NYSE MKT: GSS TSX:GSC
June 2016 NYSE MKT: GSS TSX:GSC
2015/ 2016
2017
2018
2019
2020
2021
WASSA UNDERGROUND MINE DESIGN
11
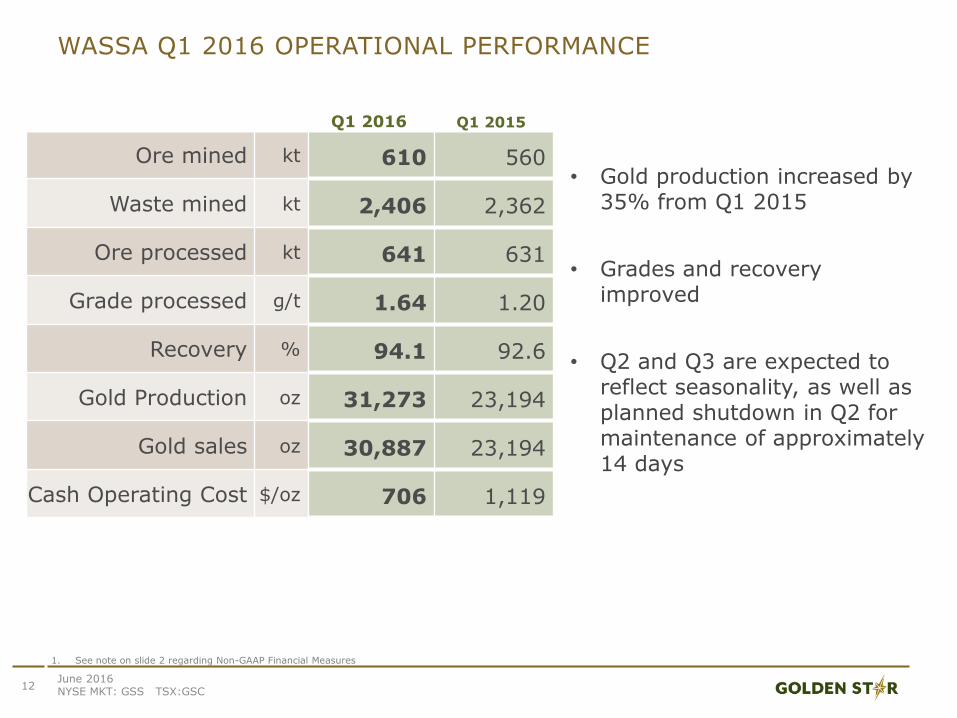
WASSA Q1 2016 OPERATIONAL PERFORMANCE
12June 2016 NYSE MKT: GSS TSX:GSC
Q1 2016 Q1 2015
Ore mined kt 610 560
Waste mined kt 2,406 2,362
Ore processed kt 641 631
Grade processed g/t 1.64 1.20
Recovery % 94.1 92.6
Gold Production oz 31,273 23,194
Gold sales oz 30,887 23,194
Cash Operating Cost $/oz 706 1,119
• Gold production increased by 35% from Q1 2015
• Grades and recovery improved
• Q2 and Q3 are expected to reflect seasonality, as well as planned shutdown in Q2 for maintenance of approximately 14 days
1. See note on slide 2 regarding Non-GAAP Financial Measures
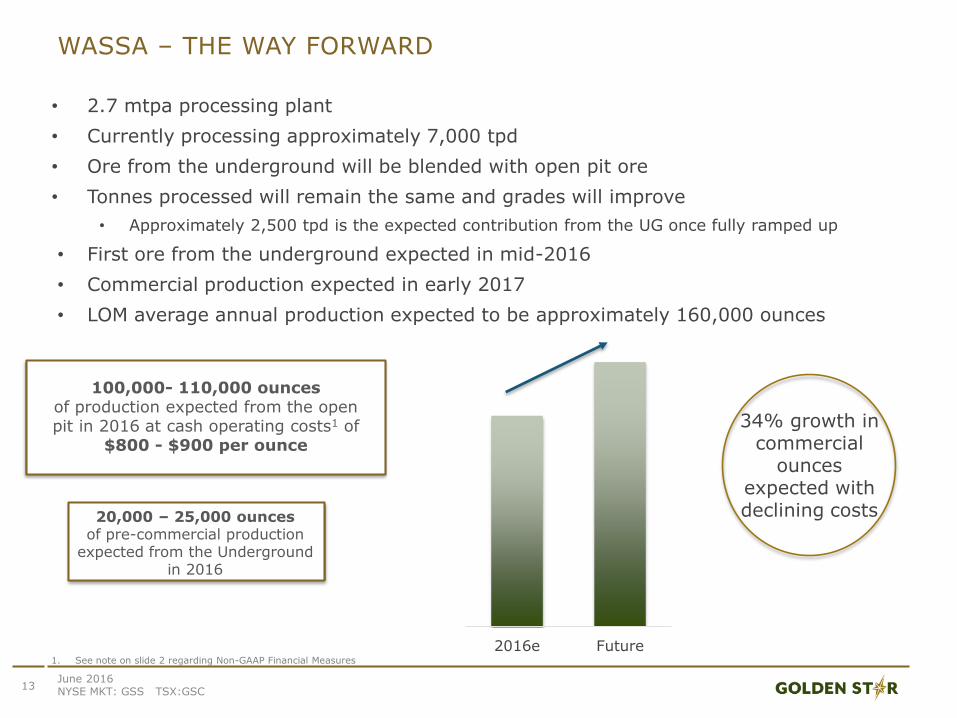
WASSA – THE WAY FORWARD
• 2.7 mtpa processing plant
• Currently processing approximately 7,000 tpd
• Ore from the underground will be blended with open pit ore
• Tonnes processed will remain the same and grades will improve
• Approximately 2,500 tpd is the expected contribution from the UG once fully ramped up
• First ore from the underground expected in mid-2016
• Commercial production expected in early 2017
• LOM average annual production expected to be approximately 160,000 ounces
13June 2016 NYSE MKT: GSS TSX:GSC
100,000- 110,000 ounces of production expected from the open pit in 2016 at cash operating costs1 of
$800 - $900 per ounce
20,000 – 25,000 ouncesof pre-commercial production
expected from the Underground in 2016
1. See note on slide 2 regarding Non-GAAP Financial Measures
2016e Future
34% growth in commercial
ounces expected with declining costs
June 2016 NYSE MKT: GSS TSX:GSC
14
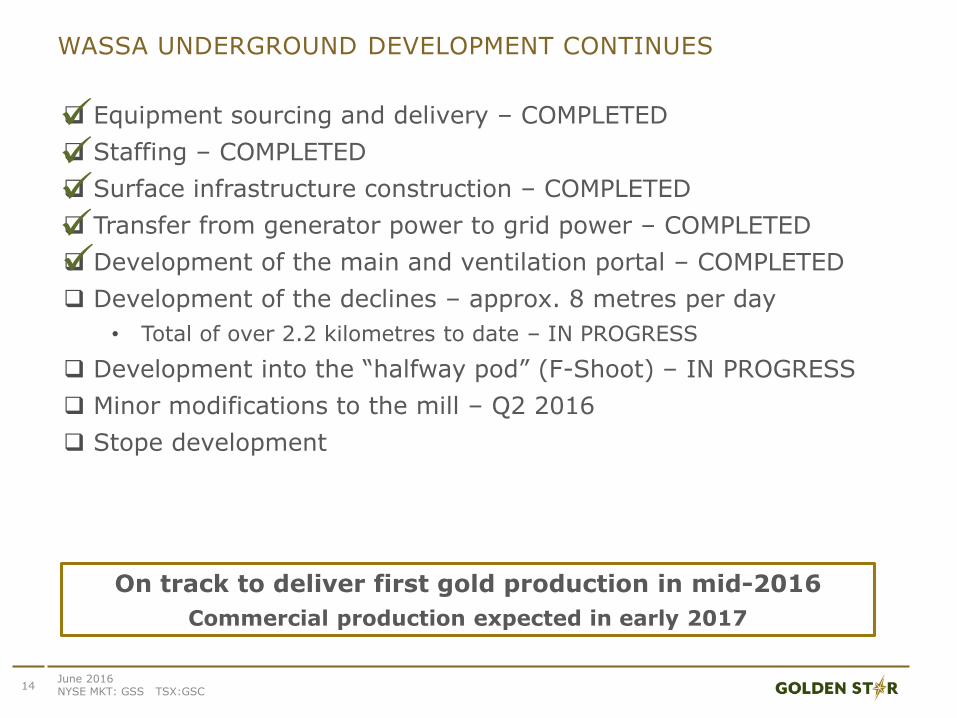
Equipment sourcing and delivery – COMPLETED
Staffing – COMPLETED
Surface infrastructure construction – COMPLETED
Transfer from generator power to grid power – COMPLETED
Development of the main and ventilation portal – COMPLETED
Development of the declines – approx. 8 metres per day
• Total of over 2.2 kilometres to date – IN PROGRESS
Development into the “halfway pod” (F-Shoot) – IN PROGRESS
Minor modifications to the mill – Q2 2016
Stope development
WASSA UNDERGROUND DEVELOPMENT CONTINUES
On track to deliver first gold production in mid-2016
Commercial production expected in early 2017
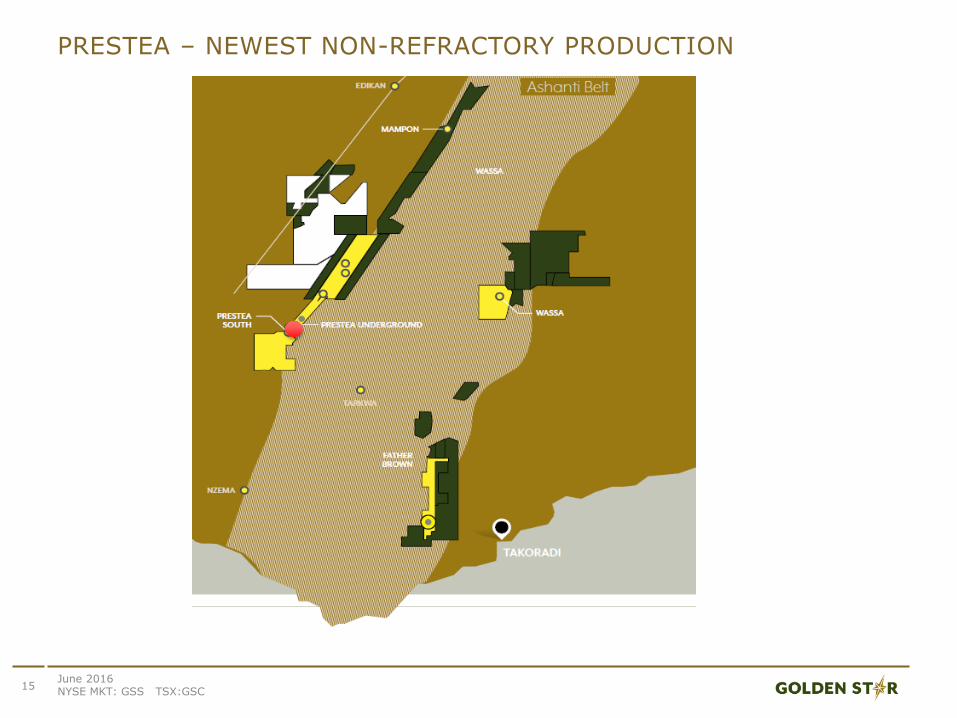
PRESTEA – NEWEST NON-REFRACTORY PRODUCTION
15June 2016 NYSE MKT: GSS TSX:GSC
• Production from Prestea replaced high cost refractory ounces
• Open pit bridging the production gap until underground production established
• Prestea open pits have been contributing to production since July 2015
• Growth in Prestea Mineral Reserves indicates potential production extension from the open pits
• Rehabilitation of the underground underway
• Underground mine established in late 1800’s, 9M oz of historic production
• Two surface and two internal shafts operational
16
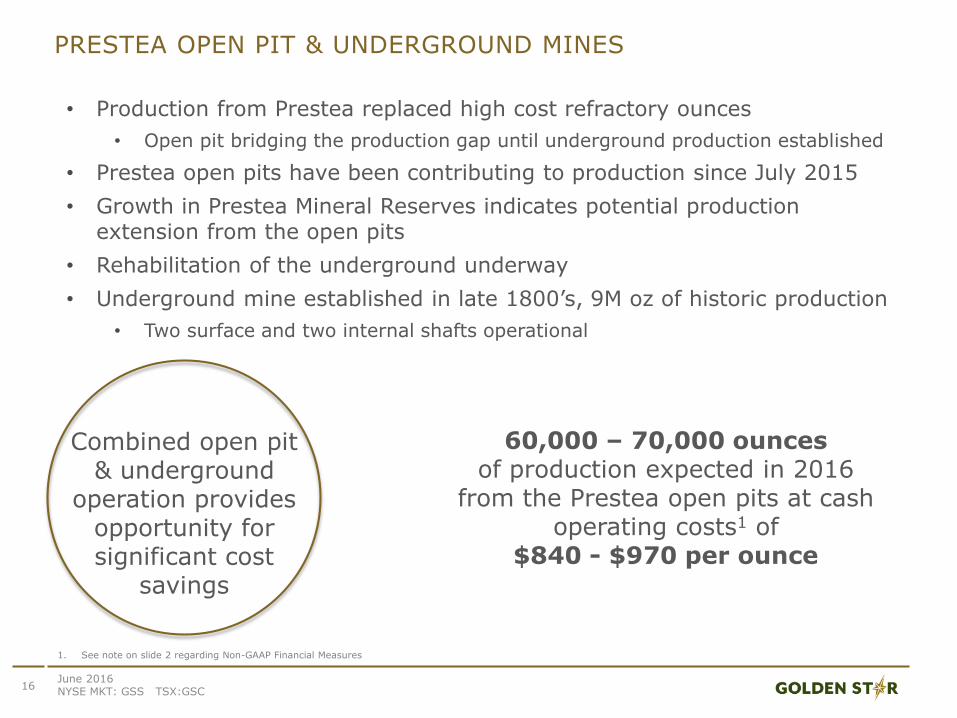
PRESTEA OPEN PIT & UNDERGROUND MINES
June 2016 NYSE MKT: GSS TSX:GSC
Combined open pit & underground
operation provides opportunity for significant cost
savings
60,000 – 70,000 ounces of production expected in 2016
from the Prestea open pits at cash operating costs1 of
$840 - $970 per ounce
1. See note on slide 2 regarding Non-GAAP Financial Measures
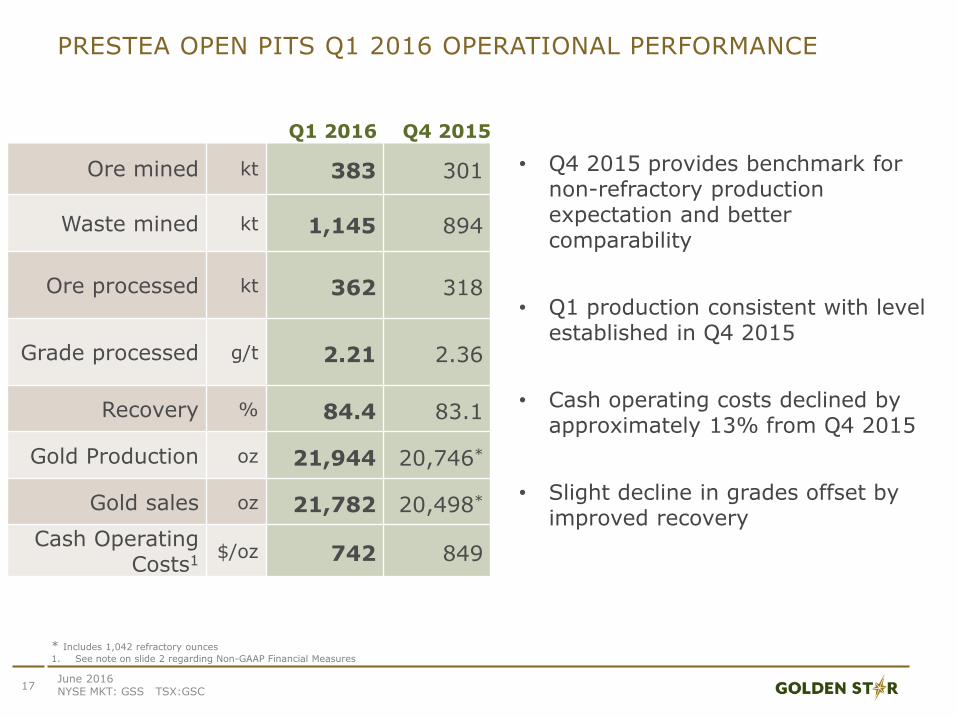
PRESTEA OPEN PITS Q1 2016 OPERATIONAL PERFORMANCE
Q1 2016 Q4 2015
Ore mined kt 383 301
Waste mined kt 1,145 894
Ore processed kt 362 318
Grade processed g/t 2.21 2.36
Recovery % 84.4 83.1
Gold Production oz 21,944 20,746*
Gold sales oz 21,782 20,498*
Cash Operating Costs1
$/oz 742 849
17June 2016 NYSE MKT: GSS TSX:GSC
• Q4 2015 provides benchmark for non-refractory production expectation and better comparability
• Q1 production consistent with level established in Q4 2015
• Cash operating costs declined by approximately 13% from Q4 2015
• Slight decline in grades offset by improved recovery
* Includes 1,042 refractory ounces
1. See note on slide 2 regarding Non-GAAP Financial Measures
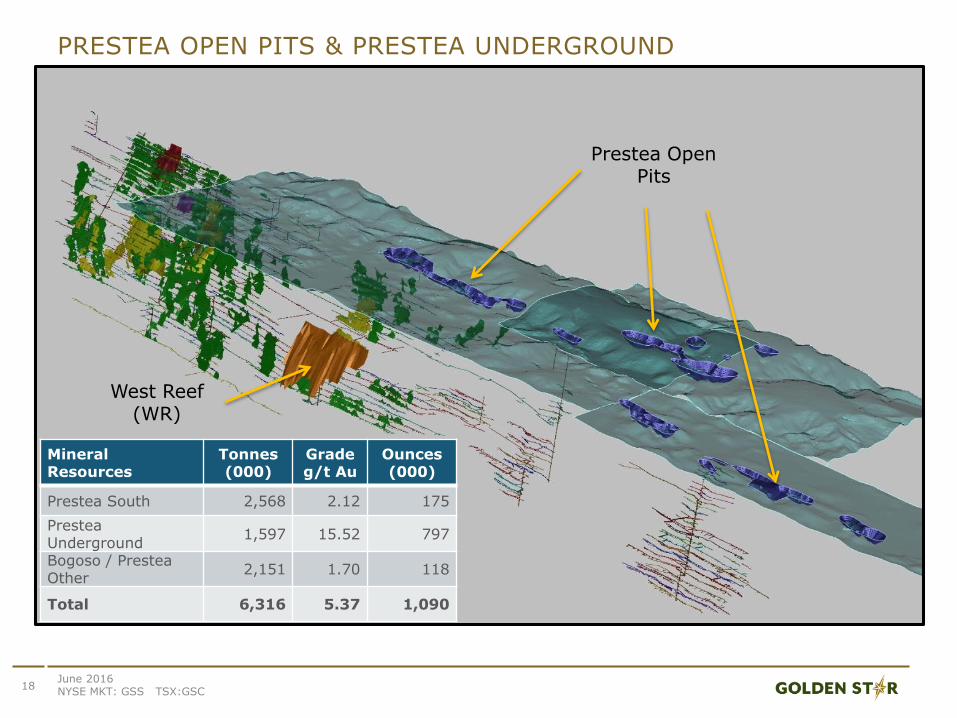
PRESTEA OPEN PITS & PRESTEA UNDERGROUND
June 2016 NYSE MKT: GSS TSX:GSC
18
West Reef(WR)
Prestea Open Pits
Mineral Resources
Tonnes(000)
Gradeg/t Au
Ounces(000)
Prestea South 2,568 2.12 175
Prestea Underground
1,597 15.52 797
Bogoso / Prestea Other
2,151 1.70 118
Total 6,316 5.37 1,090
NEW PROJECT REVIEW AND STATUS – PRESTEA UNDERGROUND
19
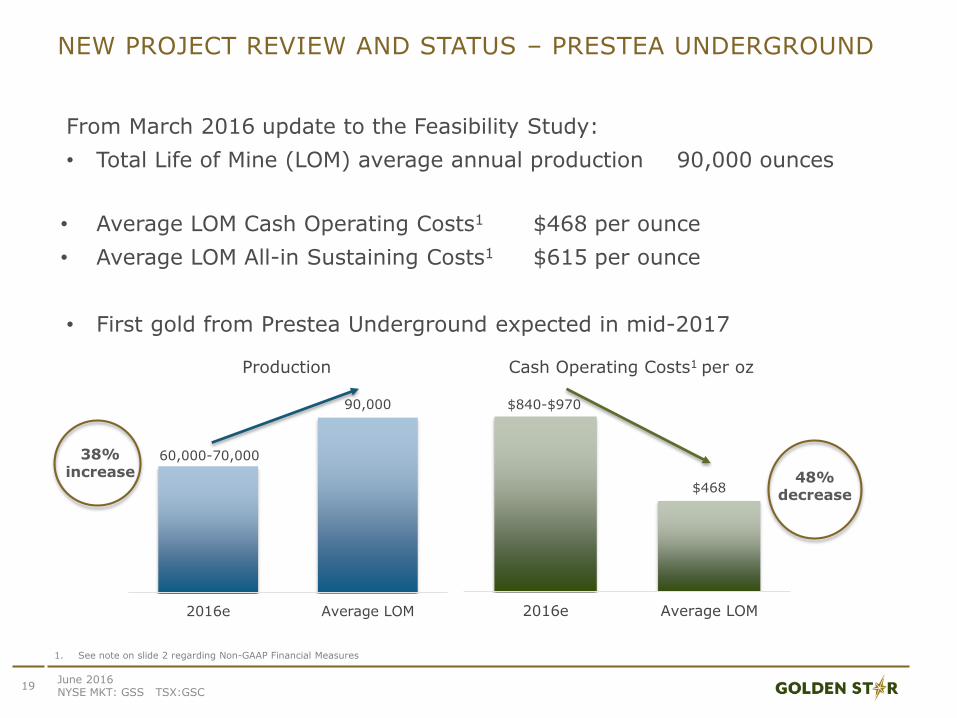
From March 2016 update to the Feasibility Study:
• Total Life of Mine (LOM) average annual production 90,000 ounces
• Average LOM Cash Operating Costs1 $468 per ounce
• Average LOM All-in Sustaining Costs1 $615 per ounce
• First gold from Prestea Underground expected in mid-2017
June 2016 NYSE MKT: GSS TSX:GSC
1. See note on slide 2 regarding Non-GAAP Financial Measures
60,000-70,000
90,000
2016e Average LOM
Production
$840-$970
$468
2016e Average LOM
Cash Operating Costs1 per oz
38% increase 48%
decrease
June 2016 NYSE MKT: GSS TSX:GSC
20
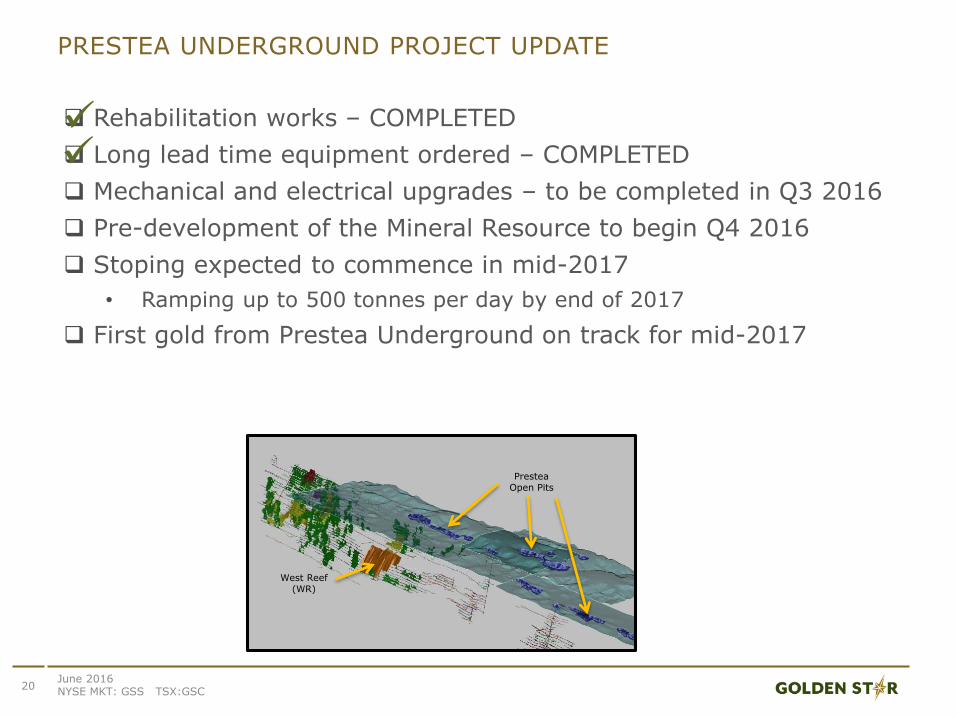
Rehabilitation works – COMPLETED
Long lead time equipment ordered – COMPLETED
Mechanical and electrical upgrades – to be completed in Q3 2016
Pre-development of the Mineral Resource to begin Q4 2016
Stoping expected to commence in mid-2017
• Ramping up to 500 tonnes per day by end of 2017
First gold from Prestea Underground on track for mid-2017
PRESTEA UNDERGROUND PROJECT UPDATE
West Reef(WR)
Prestea Open Pits
FOCUSED ON LOW COST OUNCESREFRACTORY OPERATION SUSPENDED IN Q3 2015
-
10,000
20,000
30,000
40,000
50,000
60,000
Q1 2015 Q2 2015 Q3 2015 Q4 2015 Q1 2016
Wassa Prestea / Non-Refractory Refractory
21June 2016 NYSE MKT: GSS TSX:GSC
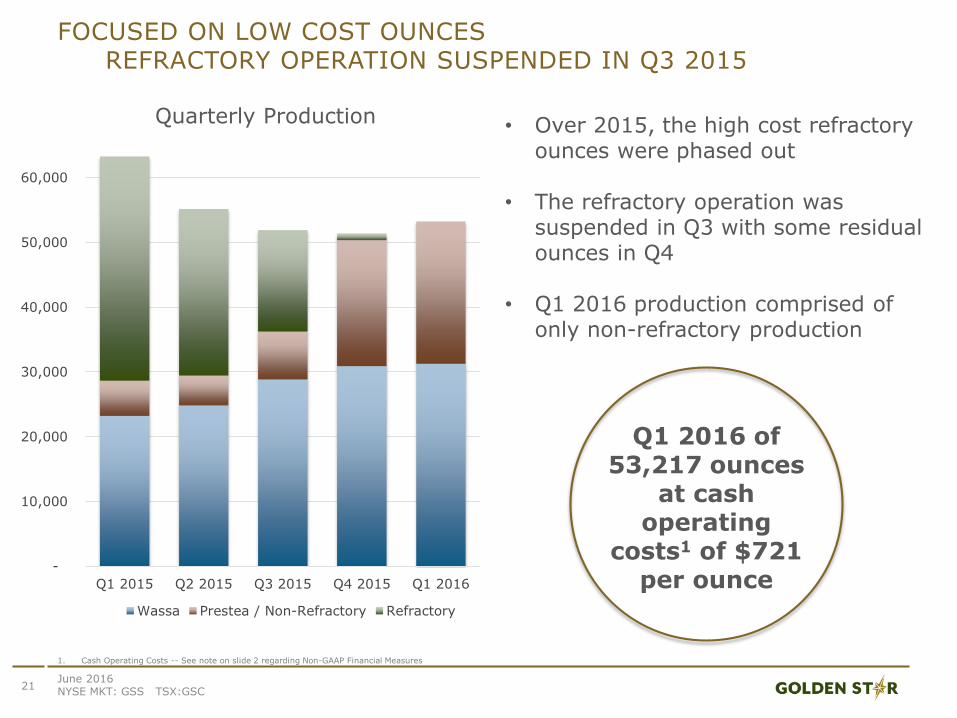
• Over 2015, the high cost refractory ounces were phased out
• The refractory operation was suspended in Q3 with some residual ounces in Q4
• Q1 2016 production comprised of only non-refractory production
1. Cash Operating Costs -- See note on slide 2 regarding Non-GAAP Financial Measures
Q1 2016 of 53,217 ounces
at cash operating
costs1 of $721 per ounce
Quarterly Production
Q1 2016 FINANCIAL PERFORMANCE
22
1. See note on slide 2 regarding Non-GAAP Financial Measures2. Equal to Cash provided by operations before changes in working capital, a Non-GAAP financial measure, see slide 2
June 2016 NYSE MKT: GSS TSX:GSC
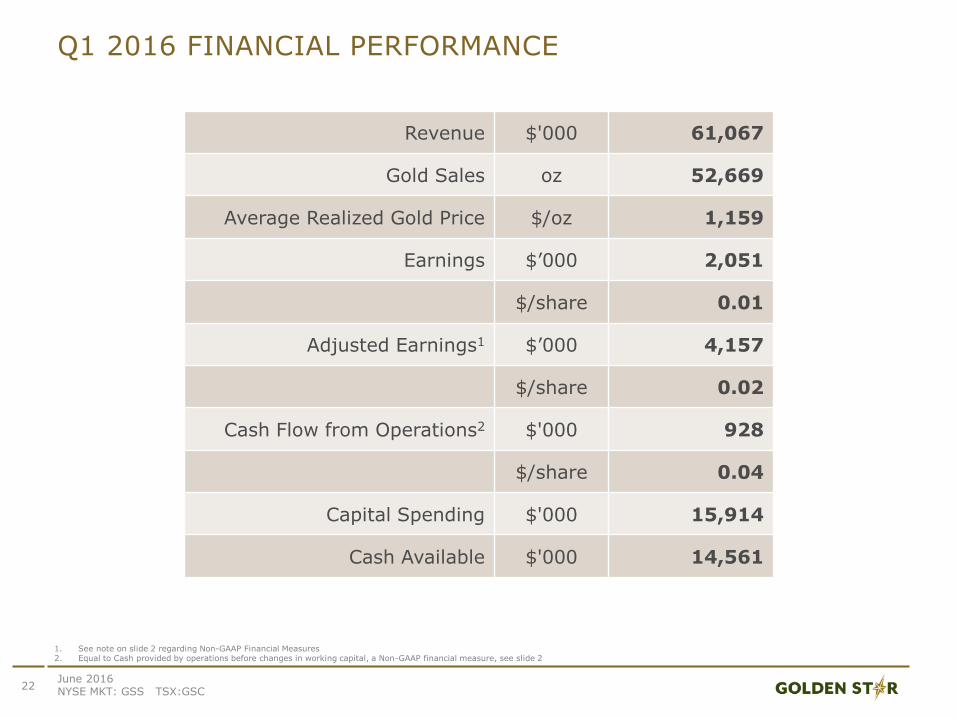
Revenue $'000 61,067
Gold Sales oz 52,669
Average Realized Gold Price $/oz 1,159
Earnings $’000 2,051
$/share 0.01
Adjusted Earnings1 $’000 4,157
$/share 0.02
Cash Flow from Operations2 $'000 928
$/share 0.04
Capital Spending $'000 15,914
Cash Available $'000 14,561
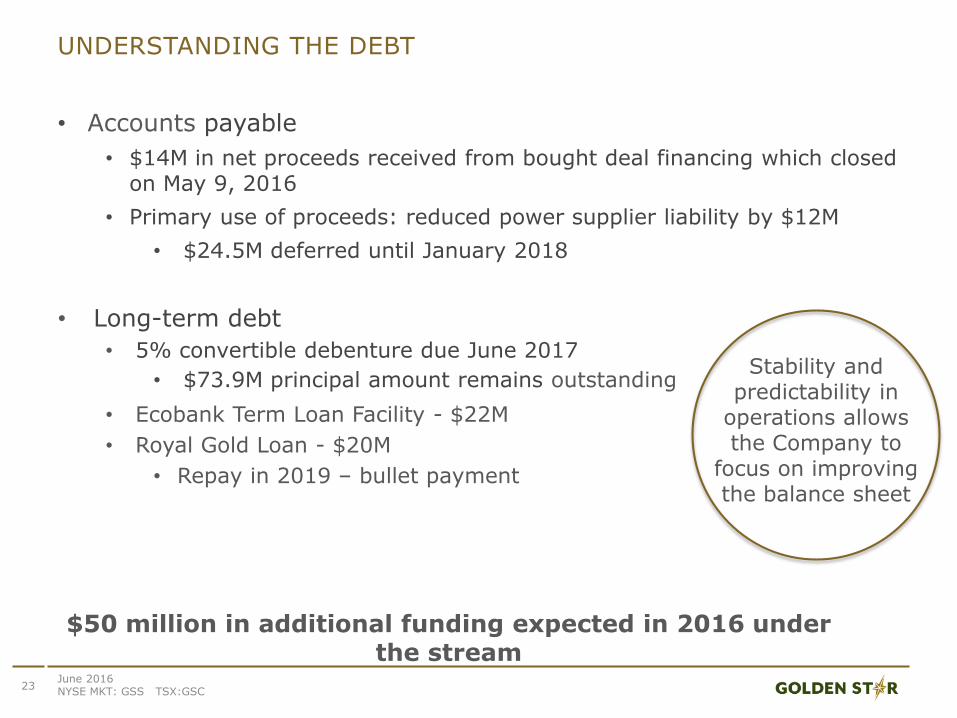
UNDERSTANDING THE DEBT
• Accounts payable
• $14M in net proceeds received from bought deal financing which closed on May 9, 2016
• Primary use of proceeds: reduced power supplier liability by $12M
• $24.5M deferred until January 2018
• Long-term debt
• 5% convertible debenture due June 2017
• $73.9M principal amount remains outstanding
• Ecobank Term Loan Facility - $22M
• Royal Gold Loan - $20M
• Repay in 2019 – bullet payment
23June 2016 NYSE MKT: GSS TSX:GSC
Stability and predictability in
operations allows the Company to
focus on improving the balance sheet
$50 million in additional funding expected in 2016 under the stream
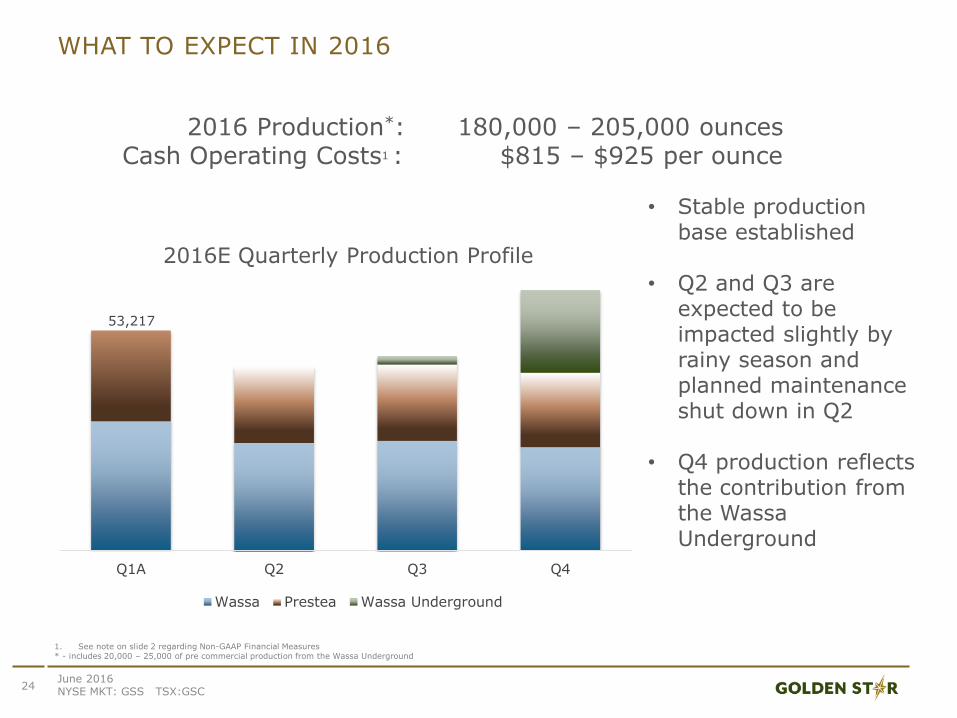
WHAT TO EXPECT IN 2016
24June 2016 NYSE MKT: GSS TSX:GSC
1. See note on slide 2 regarding Non-GAAP Financial Measures* - includes 20,000 – 25,000 of pre commercial production from the Wassa Underground
Q1A Q2 Q3 Q4
2016E Quarterly Production Profile
Wassa Prestea Wassa Underground
53,217
2016 Production*: 180,000 – 205,000 ouncesCash Operating Costs1 : $815 – $925 per ounce
• Stable production base established
• Q2 and Q3 are expected to be impacted slightly by rainy season and planned maintenance shut down in Q2
• Q4 production reflects the contribution from the Wassa Underground
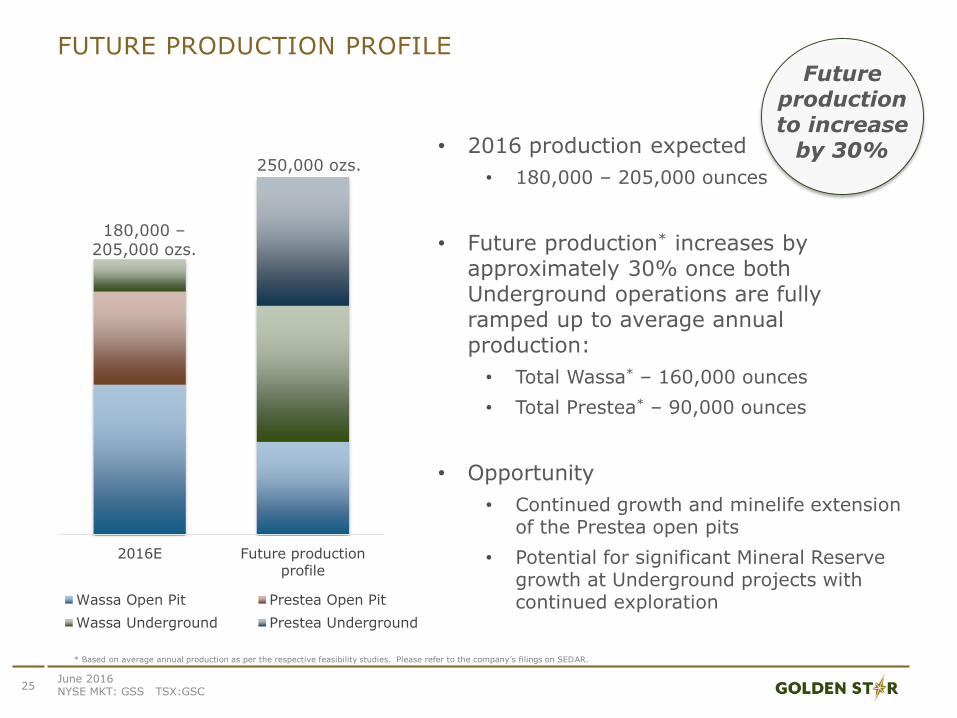
FUTURE PRODUCTION PROFILE
2016E Future productionprofile
Wassa Open Pit Prestea Open Pit
Wassa Underground Prestea Underground
25
• 2016 production expected
• 180,000 – 205,000 ounces
• Future production* increases by approximately 30% once both Underground operations are fully ramped up to average annual production:
• Total Wassa* – 160,000 ounces
• Total Prestea* – 90,000 ounces
• Opportunity
• Continued growth and minelife extension of the Prestea open pits
• Potential for significant Mineral Reserve growth at Underground projects with continued exploration
180,000 –205,000 ozs.
250,000 ozs.
Future production to increase
by 30%
June 2016 NYSE MKT: GSS TSX:GSC
* Based on average annual production as per the respective feasibility studies. Please refer to the company’s filings on SEDAR.
• Bring Wassa Underground into production as planned
• Advance Prestea Underground
• Improve Balance Sheet
• Disciplined approach to all aspects of the business
2016 STRATEGIC FOCUS
+1 416 538 3800 NYSE MKT: [email protected] TSX: GSC