Embed Size (px)
Citation preview

June 2009
Investor Presentation
Aston SwiftVP Investor Relations
For further information contact:
[email protected]+44 (0)20 7396 3400
Intertek Head Office25 Savile RowLondon W1S 2ES

www.intertek.com 30/06/2009
Cautionary statement regarding forward-looking statements
This presentation contains certain forward-looking statements with respect to the financial condition, results, operations and business of Intertek Group plc. These statements and forecasts involve risk and uncertainty because they relate to events and depend upon circumstances that will occur in the future. There are a number of factors that could cause actual results or developments to differ materially from those expressed or implied by these forward-looking statements and forecasts. Nothing in this presentation should be construed as a profit forecast.
June 2009
2

www.intertek.com 30/06/2009
Profile
• Origins of company go back to 1885
• Floated May 2002 on London Stock Exchange
• Entered FTSE 100 in March 2009
• Network of laboratories and offices in 110 countries
• Over 23,000 people
• ITRK.L; ITRK.LN
3

www.intertek.com 30/06/2009
What we do and what we provide our customers
4
• A leading international provider of quality and safety solutions
• Strengthen customers’ competitive position through:• Improved products• Reduced costs
• Across a balanced portfolio of industries
DivisionalRevenue
RegionalRevenue
Asia Pacific 36%Americas 34%EMEA 30%
Oil, Chemical & Agri 31%Consumer Goods 25%Commercial & Electrical 20%Analytical Services 12%Government Services 5%Minerals 4%Industrial Services 3%
Source 2008 Revenue figures

www.intertek.com 30/06/2009
Our industries
5
Supporting our customers in their global tradeOur organisation The industries we operate in What we doOur organisation What we doThe industries we operate in
Our organisation Industries we operate in What we doOur organisation Industries we operate in What we do
Testing
Inspection
Certification
Auditing
Outsourcing
Advisory
Quality Assurance
Consumer Goods
Industrial
Analytical
Commercial & Electrical
Oil, Chemical Agri
Minerals
Aerospace & AutomotiveBuilding ProductsChemicalConsumer Goods & RetailersElectrical & ElectronicEnergyFood & AgricultureGovernment & InstitutionsIT & TelecomIndustrialMedical & PharmaceuticalPetroleumToys, Games & HardlinesTextile, Apparel & Footwear

www.intertek.com 30/06/2009
0.0
0.5
1.0
1.5
2.0
2.5
SGS BVDek
ra
TUV Sud
Intertek
DNV
TUV Rheinlan
d
TUV Nord
Lloyd's
regist
er
Apave UL
Eurofin
s
ApplusGL
Core Lab
s NV
£bn
The TIC industry by revenue

www.intertek.com 30/06/2009
Intertek’s Target Market
In Trade Local Infrastructure
TIC industry

www.intertek.com 30/06/2009
0.0
0.5
1.0
1.5
2.0
2.5
SGS Intertek BV TUV Sud Dekra
£bn
Intertek target market
www.intertek.com 30/06/2009
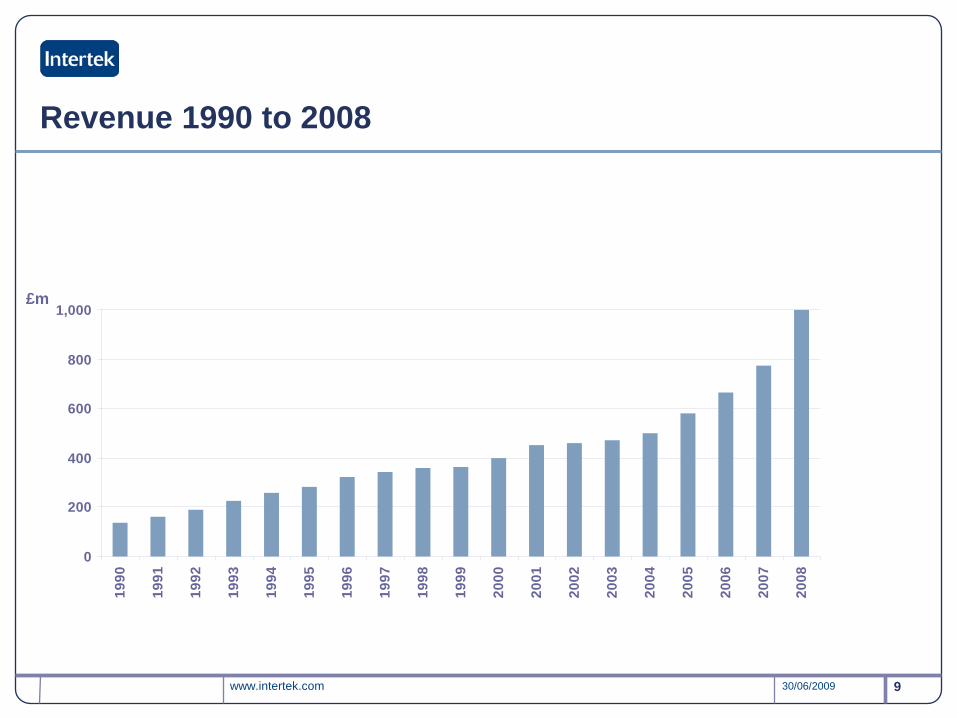
Revenue 1990 to 2008
9
0
200
400
600
800
1,000
1990
1991
1992
1993
1994
1995
1996
1997
1998
1999
2000
2001
2002
2003
2004
2005
2006
2007
2008
£m

www.intertek.com 30/06/2009
Financial highlights
For the twelve months to 31 December 2008
1. Operating profit before amortisation of acquisition intangibles, goodwill impairment and non-recurring costs
Operating profit margin
Revenue
Operating profit 1 £164.7m
£1,003.5m
16.4%
+35.4% at actual
+21.2% at constant +14.8% at constant organic
+29.4% at actual
+18.7% at constant+12.3% at constant organic
+70 bps at actual
+30 bps at constant +40 bps at constant organic
10

www.intertek.com 30/06/2009
Highlights continued
Diluted adjusted EPS 2
Operating cash flow 1
Profit before tax £138.6m
£194.0m
Up 31.0%
Up 30.1%
67.1p Up 37.5%
11
1. Operating cash flow is before capital expenditure
2. Diluted adjusted earnings per share based on operating profit before amortisation of acquisition intangibles, goodwill impairment and non-recurring costs

www.intertek.com 30/06/2009
Interim management statement: 15 May 2009
Total revenue growth 42%
• 7% organic at constant exchange rates
• 5% from acquisitions
• 30% from currency
12
Expect to maintain a stable margin at prior year levels and to grow well for remainder of 2009
Drivers remain robust and are expected to continue to produce good organic revenue growth throughout the year

www.intertek.com 30/06/2009
Confident of continuing growth overall
www.intertek.com 30/06/2009
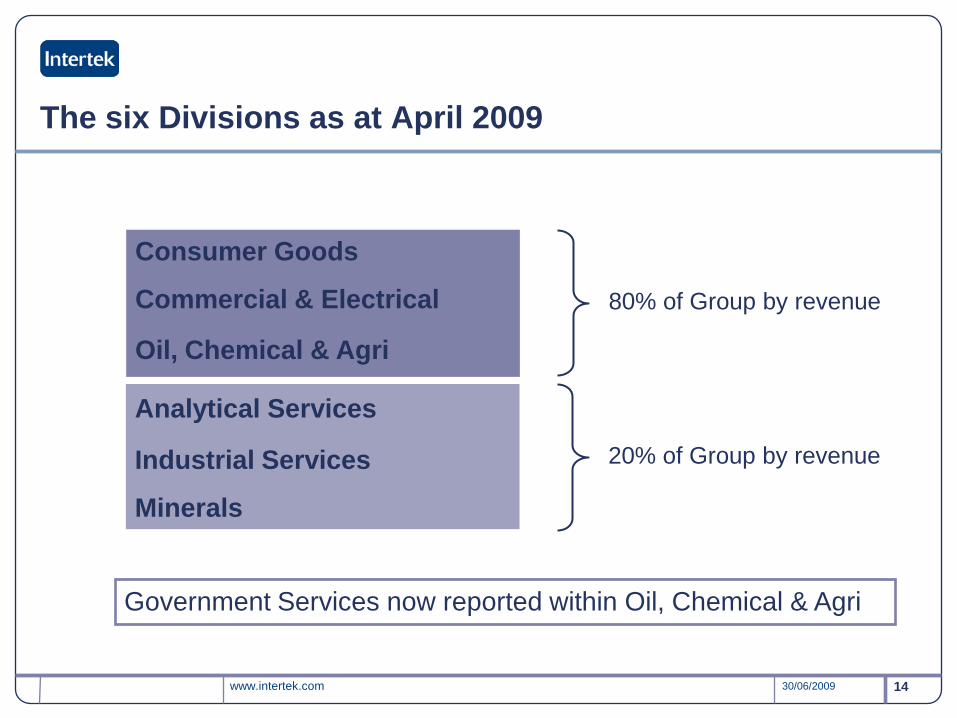
The six Divisions as at April 2009
14
Consumer Goods
Commercial & Electrical
Oil, Chemical & Agri
Analytical Services
Industrial Services
Minerals
Government Services now reported within Oil, Chemical & Agri
80% of Group by revenue
20% of Group by revenue

www.intertek.com 30/06/2009
Consumer Goods
25.0%of Group Revenue
46.0%of Group
Profit
15
Industries:
Textiles, Toys, Footwear, Hardlines, Food and Retail
Paul YaoSource 2008 Revenue & Adjusted Operating Profit

www.intertek.com 30/06/2009
£m @ constant exchange rates £m Change Organic
change
Revenue 250.4 24.1% 20.3%
Operating profit 75.7 27.9% 25.3%
Margin 30.2% +90 bps +120 bps
Results Consumer Goods
Four months to 30 April 2009:
Excellent organic revenue growth of 18%
Twelve months to 31 December 2008:

www.intertek.com 30/06/2009
Commercial & Electrical
17
20.2%of Group Revenue
17.7%of Group
Profit
Industries: Home Appliances, Lighting, Medical, Building, Industrial, IT & Telecom, HVAC/R (Heating, Ventilation, Air Conditioning & Refrigeration) and Automotive
Source 2008 Revenue & Adjusted Operating ProfitGregg Tiemann
www.intertek.com 30/06/2009
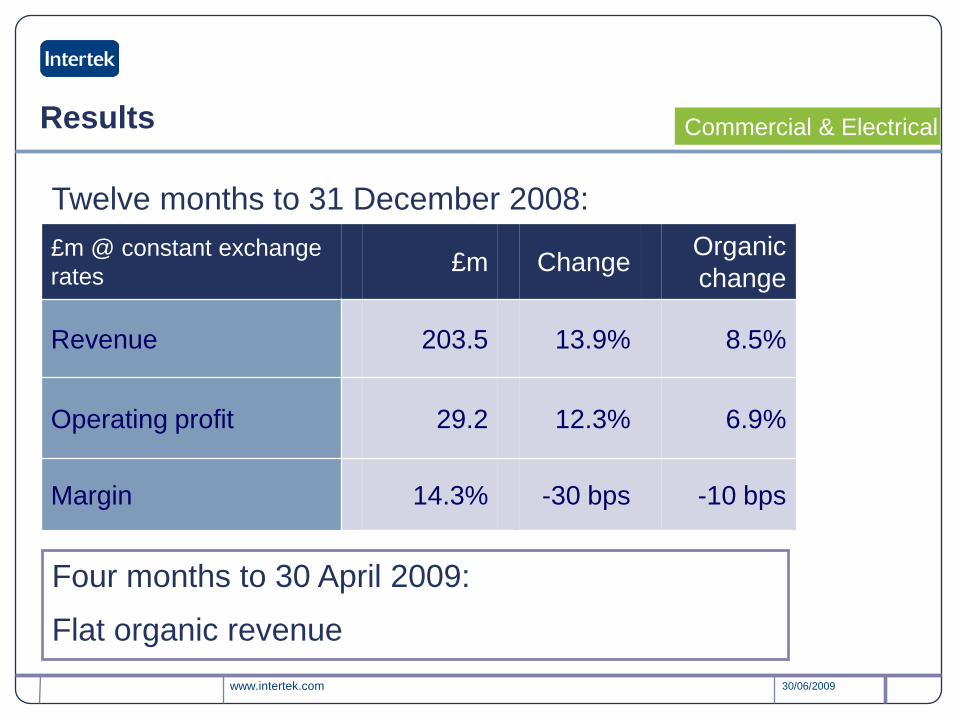
Results
£m @ constant exchange rates £m Change Organic
change
Revenue 203.5 13.9% 8.5%
Operating profit 29.2 12.3% 6.9%
Margin 14.3% -30 bps -10 bps
Commercial & Electrical
Twelve months to 31 December 2008:
Four months to 30 April 2009:
Flat organic revenue

www.intertek.com 30/06/2009
Oil, Chemical & Agri
30.7%of Group Revenue
20.3%of Group
Profit
19
Industries:
Energy, Petroleum, Chemical and Agricultural
Jay GutierrezSource 2008 Revenue & Adjusted Operating Profit

www.intertek.com 30/06/2009
Results
£m @ constant exchange rates £m Change Organic
change
Revenue 308.1 14.5% 13.3%
Operating profit 33.5 25.5% 23.0%
Margin 10.9% +100 bps +80 bps
Oil, Chemical & Agri
Twelve months to 31 December 2008:
Four months to 30 April 2009:
Started year well with 5% organic revenue growth

www.intertek.com 30/06/2009
Trading update 15 May 2009 New Divisions
• Analytical Services: 5% organic revenue growth
• Industrial Services: 15% organic revenue growth
• Minerals: 12% organic revenue growth
These division account for 20% of Group revenues

Appendix
Investor Presentation: June 2009

www.intertek.com 30/06/2009
Organic revenue growth in 2008
23
constant exchange rates 1H 2H Full Year
Consumer Goods 23.1% 18.3% 20.3%
Commercial & Electrical 9.3% 7.8% 8.5%
Oil, Chemical & Agri 15.2% 11.7% 13.3%
Government Services (6.9)% (0.4)% (3.5)%
Analytical Services (0.2)% 4.8% 2.4%
Industrial Services 6.0% 23.2% 14.9%
Minerals 58.3% 57.4% 57.8%
Sub-total New Divisions 4.5% 12.3% 8.6%
Total 12.6% 12.0% 12.3%

www.intertek.com 30/06/2009
CPSIA – 14 August 2008
Extensive new US legislation• Increase safety children’s products• Increase budget for enforcement• Increase fines and penalties• Increase whistleblower protections
Main provisions for Intertek• Mandatory third party testing before import• Lead in paint; lead in substrate• Phthalates in plastics (e.g. toys, pacifiers)
ASTM F-963 voluntary toy standard into law (choking, sharp edges, magnets, heavy metals, electrical)
Also new requirements for cribs, tracking labels, package labelling
Consumer Goods

www.intertek.com 30/06/2009
Growth through complementary expansion
2005/2006: average of £41m p.a.2007: £100m on 16 acquisitions2008: £80m on 14 acquisitions
• Food: Applica £3m, Eko Lab £3m, RQA £2m• Consumer: 4-Front £9m, Porst & Partner £2m• Upstream: CML Biotech £10m, EMIS £1m• Minerals: Philippines £3m, Ghana £2m• Ballistics: HP White £22m• Industrial: Hi-Cad £16m• Pharma: Bioclin £3m• Explosives: Epsilon £2m• Water: £2m
2009: £22m on two more Industrial acquisitions
In 2008 pro forma revenue is £1,020m
25