Embed Size (px)
Citation preview
Investigation ofWater Leakage Through Direct
Tension Cracks in Reinforced Concrete Panels
By
Seyyednezameddin Bozorgzadeh
B.Sc., Azad University of Iran, Tehran Central Branch, 2009
A Thesis
Presented to Ryerson University
in Partial Fulfillment of the
Requirements for the Degree of
Master of Applied Sciencein the Program of
Civil Engineering
Toronto, Ontario, Canada, 2012
c©Seyyednezameddin Bozorgzadeh 2012


AUTHOR’S DECLARATION FOR ELECTRONIC SUBMISSION OF A THESIS
I hereby declare that I am the sole author of this thesis. This is a true copy of the thesis,including any required final revisions, as accepted by my examiners. I authorize RyersonUniversity to lend this thesis to other institutions or individuals for the purpose of scholarlyresearch
Seyyednezameddin Bozorgzadeh
I further authorize Ryerson University to reproduce this thesis by photocopying or by othermeans, in total or in part, at the request of other institutions or individuals for the purpose ofscholarly research. I understand that my thesis may be made electronically available to thepublic.
Seyyednezameddin Bozorgzadeh
iii

Investigation of Water Leakage Through Direct Tension Cracks in Reinforced Concrete Panels
Master of Applied Science 2012
Seyyednezameddin Bozorgzadeh
Civil Engineering
Ryerson University
Abstract
In this study the leakage of pressurized water through direct tension cracks in reinforced con-
crete (RC) panels is investigated experimentally. The results of the experiment can contribute
to the field from different aspects since not many experimental studies of this kind have been
reported in the literature. In this experimental program, three RC panels are subjected to direct
tension force in order to form a major crack. The leakage test is then performed on the cracked
specimens and the leakage of water through the crack is measured for different crack widths.
The collected data consists of reinforcement strains, crack widths and the leakage rate through
the cracks. Related theoretical models are compared against the experiment results. These
results indicate that the leakage of water through a crack depend on the pressure of the water,
cube of the crack width and crack width gradient.
v

Acknowledgements
The author wishes to express his gratitude to his supervisor Dr. Reza Kianoush whom with-out his continuous guidance, suggestions and support this study could not be accomplished.The experimental studies would not have been possible without the support of laboratory leadtechnical officer Nidal Jalouk and technical officer Domenic Valle. The author would alsoacknowledge valuable discussions with Dr. Armin Ziari on the subject.
vii

Contents
Declaration . . . . . . . . . . . . . . . . . . . . . . . . . . . . . . . . . . . . . . . iii
Abstract . . . . . . . . . . . . . . . . . . . . . . . . . . . . . . . . . . . . . . . . . v
Acknowledgements . . . . . . . . . . . . . . . . . . . . . . . . . . . . . . . . . . . vii
List of Tables . . . . . . . . . . . . . . . . . . . . . . . . . . . . . . . . . . . . . . xi
List of Figures . . . . . . . . . . . . . . . . . . . . . . . . . . . . . . . . . . . . . . xiii
List of Symbols . . . . . . . . . . . . . . . . . . . . . . . . . . . . . . . . . . . . . xvii
1 Introduction 1
1.1 General . . . . . . . . . . . . . . . . . . . . . . . . . . . . . . . . . . . . . . 1
1.2 Objectives and Scope . . . . . . . . . . . . . . . . . . . . . . . . . . . . . . . 2
1.3 Thesis Layout . . . . . . . . . . . . . . . . . . . . . . . . . . . . . . . . . . . 3
2 Background 5
2.1 General . . . . . . . . . . . . . . . . . . . . . . . . . . . . . . . . . . . . . . 5
2.2 Direct Tension Cracking . . . . . . . . . . . . . . . . . . . . . . . . . . . . . 7
2.3 Permeability of Cracks in Concrete . . . . . . . . . . . . . . . . . . . . . . . . 9
2.3.1 Cracks and Water Tightness . . . . . . . . . . . . . . . . . . . . . . . 9
2.3.2 Basic Flow Equations . . . . . . . . . . . . . . . . . . . . . . . . . . 10
2.3.3 Permeability Coefficient . . . . . . . . . . . . . . . . . . . . . . . . . 12
2.3.4 Roughness Factor . . . . . . . . . . . . . . . . . . . . . . . . . . . . . 13
2.3.5 Effective Crack Width . . . . . . . . . . . . . . . . . . . . . . . . . . 16
2.4 Self-healing of Cracks . . . . . . . . . . . . . . . . . . . . . . . . . . . . . . 19
2.5 Summary . . . . . . . . . . . . . . . . . . . . . . . . . . . . . . . . . . . . . 21
ix
3 Experimental Study 233.1 Introduction . . . . . . . . . . . . . . . . . . . . . . . . . . . . . . . . . . . . 233.2 Experimental Study . . . . . . . . . . . . . . . . . . . . . . . . . . . . . . . . 24
3.2.1 Test Specimens . . . . . . . . . . . . . . . . . . . . . . . . . . . . . . 243.2.2 Casting and Curing . . . . . . . . . . . . . . . . . . . . . . . . . . . . 253.2.3 Material Properties . . . . . . . . . . . . . . . . . . . . . . . . . . . . 263.2.4 Test setup . . . . . . . . . . . . . . . . . . . . . . . . . . . . . . . . . 303.2.5 Test Procedure and Instrumentation . . . . . . . . . . . . . . . . . . . 37
4 Test Results and Discussion 434.1 General . . . . . . . . . . . . . . . . . . . . . . . . . . . . . . . . . . . . . . 434.2 Phase I . . . . . . . . . . . . . . . . . . . . . . . . . . . . . . . . . . . . . . . 43
4.2.1 Specimen S150 . . . . . . . . . . . . . . . . . . . . . . . . . . . . . . 444.2.2 Specimen S250 . . . . . . . . . . . . . . . . . . . . . . . . . . . . . . 454.2.3 Specimen S200 . . . . . . . . . . . . . . . . . . . . . . . . . . . . . . 48
4.3 Phase II . . . . . . . . . . . . . . . . . . . . . . . . . . . . . . . . . . . . . . 534.3.1 Specimen S250 . . . . . . . . . . . . . . . . . . . . . . . . . . . . . . 544.3.2 Specimen S200 . . . . . . . . . . . . . . . . . . . . . . . . . . . . . . 56
4.4 Phase III . . . . . . . . . . . . . . . . . . . . . . . . . . . . . . . . . . . . . . 584.4.1 Specimen S250 . . . . . . . . . . . . . . . . . . . . . . . . . . . . . . 584.4.2 Specimen S200 . . . . . . . . . . . . . . . . . . . . . . . . . . . . . . 63
4.5 Leakage Test Results Analysis . . . . . . . . . . . . . . . . . . . . . . . . . . 654.5.1 Specimen S250 . . . . . . . . . . . . . . . . . . . . . . . . . . . . . . 664.5.2 Specimen S200 . . . . . . . . . . . . . . . . . . . . . . . . . . . . . . 69
5 Conclusions 755.1 Summary . . . . . . . . . . . . . . . . . . . . . . . . . . . . . . . . . . . . . 755.2 Conclusions . . . . . . . . . . . . . . . . . . . . . . . . . . . . . . . . . . . . 765.3 Recommendations for Future Research . . . . . . . . . . . . . . . . . . . . . . 77
References 79
x
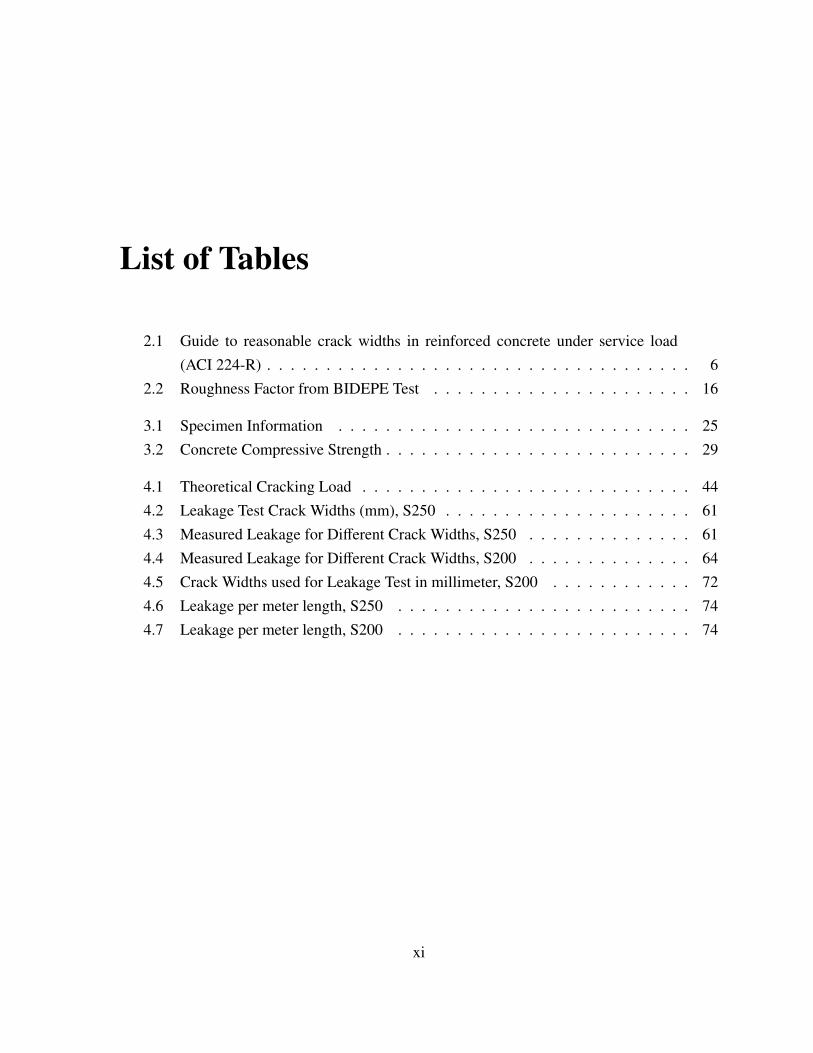
List of Tables
2.1 Guide to reasonable crack widths in reinforced concrete under service load(ACI 224-R) . . . . . . . . . . . . . . . . . . . . . . . . . . . . . . . . . . . . 6
2.2 Roughness Factor from BIDEPE Test . . . . . . . . . . . . . . . . . . . . . . 16
3.1 Specimen Information . . . . . . . . . . . . . . . . . . . . . . . . . . . . . . 253.2 Concrete Compressive Strength . . . . . . . . . . . . . . . . . . . . . . . . . . 29
4.1 Theoretical Cracking Load . . . . . . . . . . . . . . . . . . . . . . . . . . . . 444.2 Leakage Test Crack Widths (mm), S250 . . . . . . . . . . . . . . . . . . . . . 614.3 Measured Leakage for Different Crack Widths, S250 . . . . . . . . . . . . . . 614.4 Measured Leakage for Different Crack Widths, S200 . . . . . . . . . . . . . . 644.5 Crack Widths used for Leakage Test in millimeter, S200 . . . . . . . . . . . . 724.6 Leakage per meter length, S250 . . . . . . . . . . . . . . . . . . . . . . . . . 744.7 Leakage per meter length, S200 . . . . . . . . . . . . . . . . . . . . . . . . . 74
xi

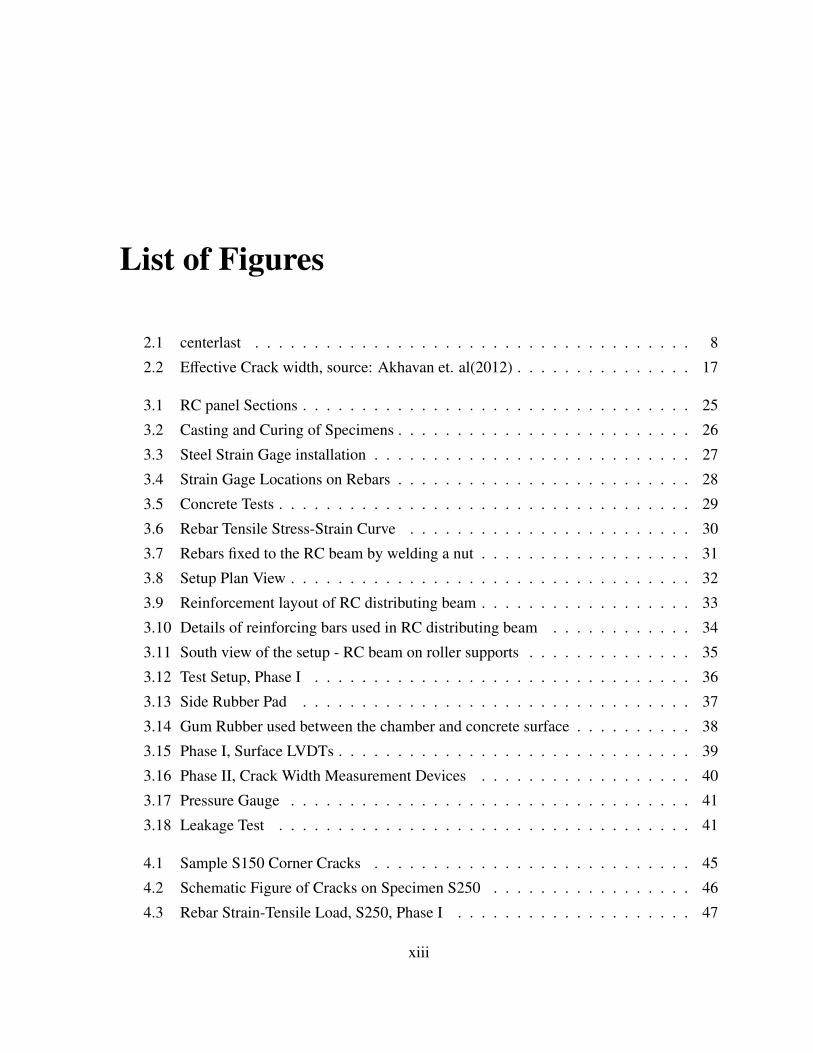
List of Figures
2.1 centerlast . . . . . . . . . . . . . . . . . . . . . . . . . . . . . . . . . . . . . 8
2.2 Effective Crack width, source: Akhavan et. al(2012) . . . . . . . . . . . . . . . 17
3.1 RC panel Sections . . . . . . . . . . . . . . . . . . . . . . . . . . . . . . . . . 25
3.2 Casting and Curing of Specimens . . . . . . . . . . . . . . . . . . . . . . . . . 26
3.3 Steel Strain Gage installation . . . . . . . . . . . . . . . . . . . . . . . . . . . 27
3.4 Strain Gage Locations on Rebars . . . . . . . . . . . . . . . . . . . . . . . . . 28
3.5 Concrete Tests . . . . . . . . . . . . . . . . . . . . . . . . . . . . . . . . . . . 29
3.6 Rebar Tensile Stress-Strain Curve . . . . . . . . . . . . . . . . . . . . . . . . 30
3.7 Rebars fixed to the RC beam by welding a nut . . . . . . . . . . . . . . . . . . 31
3.8 Setup Plan View . . . . . . . . . . . . . . . . . . . . . . . . . . . . . . . . . . 32
3.9 Reinforcement layout of RC distributing beam . . . . . . . . . . . . . . . . . . 33
3.10 Details of reinforcing bars used in RC distributing beam . . . . . . . . . . . . 34
3.11 South view of the setup - RC beam on roller supports . . . . . . . . . . . . . . 35
3.12 Test Setup, Phase I . . . . . . . . . . . . . . . . . . . . . . . . . . . . . . . . 36
3.13 Side Rubber Pad . . . . . . . . . . . . . . . . . . . . . . . . . . . . . . . . . 37
3.14 Gum Rubber used between the chamber and concrete surface . . . . . . . . . . 38
3.15 Phase I, Surface LVDTs . . . . . . . . . . . . . . . . . . . . . . . . . . . . . . 39
3.16 Phase II, Crack Width Measurement Devices . . . . . . . . . . . . . . . . . . 40
3.17 Pressure Gauge . . . . . . . . . . . . . . . . . . . . . . . . . . . . . . . . . . 41
3.18 Leakage Test . . . . . . . . . . . . . . . . . . . . . . . . . . . . . . . . . . . 41
4.1 Sample S150 Corner Cracks . . . . . . . . . . . . . . . . . . . . . . . . . . . 45
4.2 Schematic Figure of Cracks on Specimen S250 . . . . . . . . . . . . . . . . . 46
4.3 Rebar Strain-Tensile Load, S250, Phase I . . . . . . . . . . . . . . . . . . . . 47
xiii
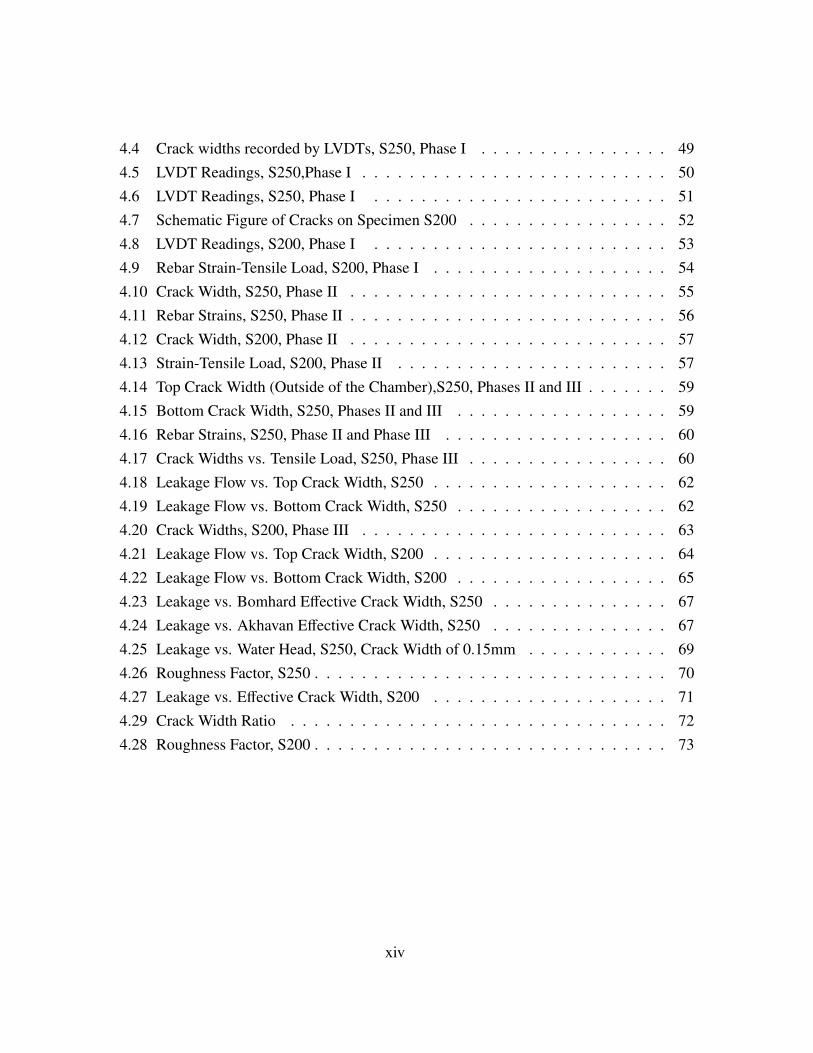
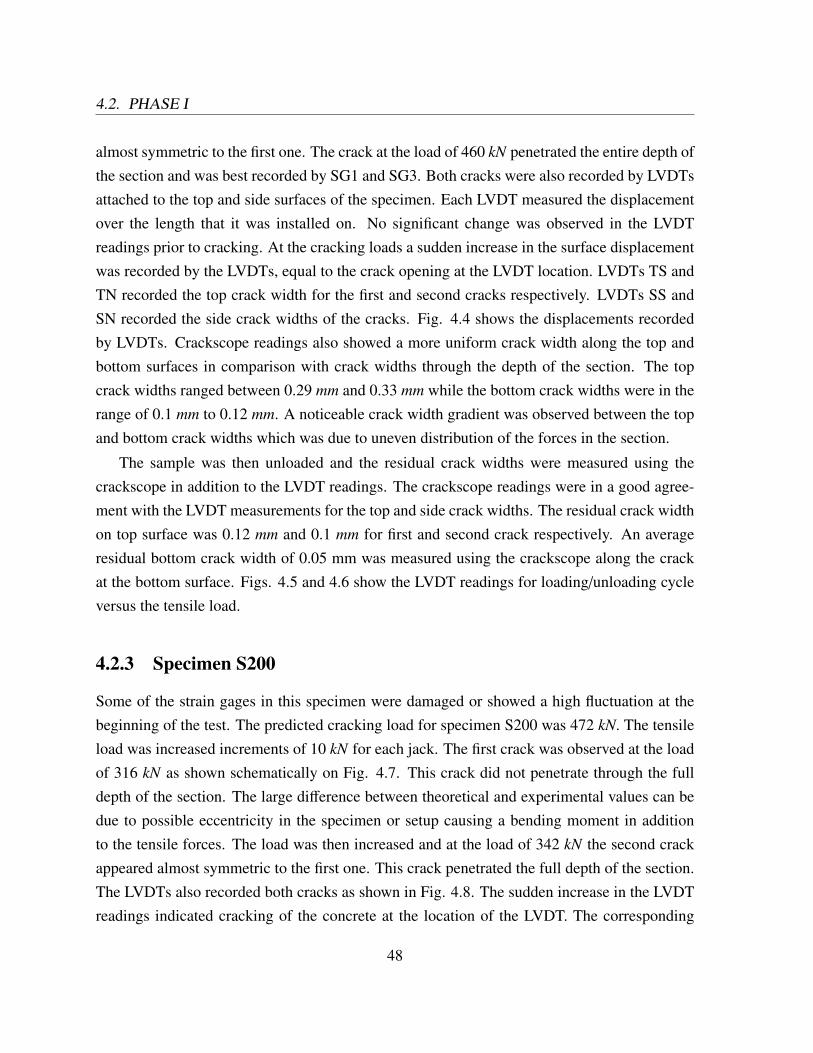
4.4 Crack widths recorded by LVDTs, S250, Phase I . . . . . . . . . . . . . . . . 494.5 LVDT Readings, S250,Phase I . . . . . . . . . . . . . . . . . . . . . . . . . . 504.6 LVDT Readings, S250, Phase I . . . . . . . . . . . . . . . . . . . . . . . . . 514.7 Schematic Figure of Cracks on Specimen S200 . . . . . . . . . . . . . . . . . 524.8 LVDT Readings, S200, Phase I . . . . . . . . . . . . . . . . . . . . . . . . . 534.9 Rebar Strain-Tensile Load, S200, Phase I . . . . . . . . . . . . . . . . . . . . 544.10 Crack Width, S250, Phase II . . . . . . . . . . . . . . . . . . . . . . . . . . . 554.11 Rebar Strains, S250, Phase II . . . . . . . . . . . . . . . . . . . . . . . . . . . 564.12 Crack Width, S200, Phase II . . . . . . . . . . . . . . . . . . . . . . . . . . . 574.13 Strain-Tensile Load, S200, Phase II . . . . . . . . . . . . . . . . . . . . . . . 574.14 Top Crack Width (Outside of the Chamber),S250, Phases II and III . . . . . . . 594.15 Bottom Crack Width, S250, Phases II and III . . . . . . . . . . . . . . . . . . 594.16 Rebar Strains, S250, Phase II and Phase III . . . . . . . . . . . . . . . . . . . 604.17 Crack Widths vs. Tensile Load, S250, Phase III . . . . . . . . . . . . . . . . . 604.18 Leakage Flow vs. Top Crack Width, S250 . . . . . . . . . . . . . . . . . . . . 624.19 Leakage Flow vs. Bottom Crack Width, S250 . . . . . . . . . . . . . . . . . . 624.20 Crack Widths, S200, Phase III . . . . . . . . . . . . . . . . . . . . . . . . . . 634.21 Leakage Flow vs. Top Crack Width, S200 . . . . . . . . . . . . . . . . . . . . 644.22 Leakage Flow vs. Bottom Crack Width, S200 . . . . . . . . . . . . . . . . . . 654.23 Leakage vs. Bomhard Effective Crack Width, S250 . . . . . . . . . . . . . . . 674.24 Leakage vs. Akhavan Effective Crack Width, S250 . . . . . . . . . . . . . . . 674.25 Leakage vs. Water Head, S250, Crack Width of 0.15mm . . . . . . . . . . . . 694.26 Roughness Factor, S250 . . . . . . . . . . . . . . . . . . . . . . . . . . . . . . 704.27 Leakage vs. Effective Crack Width, S200 . . . . . . . . . . . . . . . . . . . . 714.29 Crack Width Ratio . . . . . . . . . . . . . . . . . . . . . . . . . . . . . . . . 724.28 Roughness Factor, S200 . . . . . . . . . . . . . . . . . . . . . . . . . . . . . . 73
xiv

List of Symbols
k non-dimensional permeability coefficient
∆h change in water head
∆P total pressure loss
µ fluid viscosity
ν kinematic viscosity
ρ fluid density
ρs percentage of longitudinal steel reinforcement
σ splitting tensile strength of concrete
σct tensile stress of concrete
εs2 steel strain at the crack
εsE1 steel strain at the point of zero slip at pre-stabilized cracking
εsE2 steel strain at crack at the cracking load level
εsE steel strain at the point of zero slip
ξ roughness factor
Ae transformed cross sectional area
As longitudinal reinforcement area
xv

Ec concrete modulus of elasticity
Es steel modulus of elastisity
ez unit vector in the upward vertical direction
F body force per unit mass
f ′c compressive strength of concrete
fy yield stress of steel
fct tensile strength of concrete
g gravitational acceleration, (9.81 m/s2)
h wall thickness
i hydraulic gradient
J volumetric flow
k coefficient of permeability
l crack length
lt transmission length
ls,max length over which slip occurs between steel and concrete in the vicinity of a crack (twotimes transmission length)
m number of columns in a crack
Nr cracking load
p pressure
Pcr cracking load
Q leakage flow
Qr flow in a rough-wall crack
xvi

Qs flow in a smooth-wall crack
Q1,T flow for the first row of elements
Qp1 leakage flow due to pressure p1
S max maximum crack spacing
U velocity vector
w crack width
wavg. average crack width
wBottom bottom crack width
we f f effective crack width
wtop top crack width
xvii

Chapter 1
Introduction
1.1 General
Concrete cracking is inevitable due to its inherent low tensile strength. Cracking occurs whenthe concrete tensile stress in a member reaches the tensile strength of the concrete. Appropriateprovisions must be undertaken to prevent or control the cracks according to type of crack andthe structure. The following are some of the main causes of cracking in hardened concrete:
• Structural Loading including design loads, overloads and fatigue.
• Volume Instability can be caused by drying shrinkage, thermal changes or creep.
• Physio-Chemical effects like AAR/ASR/DEF, steel corrosion and freeze-thaw cycles.
Reinforced concrete (RC) is suited for environmental structures that are involved in storageor transmission of liquids such as reservoirs, sewage tanks, etc. Since these Liquid ContainingStructures (LCS) are more vulnerable to adverse effects of crack formation, crack control isessential in these types of structures. Cracking will affect both durability and functionality ofthe structure by facilitating corrosion of the reinforcement and also may result in flow of theliquid in or out of the structure. To ensure serviceability and durability, the crack widths mustbe controlled and limited to specific values.
Due to their functionality, the design of LCS is governed by serviceability limit states.Among those, the leakage limit states mostly govern over other serviceability limit states likedeflection. In prestressed concrete containers, leakage is totally prevented since the structure
1
1.2. OBJECTIVES AND SCOPE
is designed to remain uncracked under service loads. On the other hand, the cracks must belimited to specific widths to control the leakage in RC containers.
Among different types of cracks, the ones induced in direct tension are more vulnerableto allow for the leakage of liquid in/out of the structure. These cracks penetrate through thewall of the container and create a thru path for the liquid. For instance, a vertical section of acircular tank has to carry the tensile ring force produced by the internal hydrostatic pressure ofthe liquid. Structural members such as floor and roof slabs, walls and tunnel linings also maybe subjected to direct tensile stresses as a result of restraint volume change. Current codes ofpractice do not differentiate between direct tension cracks and other types of cracks. In case ofleakage limit states, these cracks must be treated with more caution in comparison with othertypes of the cracks.
In order to determine appropriate crack width limitations, knowledge of water flow throughthe cracks is essential. A model from rock mechanics has been employed in the previous stud-ies to predict the flow through the crack. This model, known as the Poiseuille flow, assumeslaminar flow through a smooth parallel-sided slot. Concrete cracks have a rough inner surfaceand thus, the flow through them has a much lower rate compared to smooth gaps. A correctionfactor (known as roughness or tortuosity factor) is used to account for the crack morphology.A high deviation of the roughness factor is reported from previous studies. The reported val-ues are either empirical or from experiments mostly performed on small-scale plain concretespecimens. As a result, the field still lacks an inclusive model capable of predicting the flowthrough cracked concrete.
1.2 Objectives and Scope
The main objective of this study is to provide some insight into the problem of water leakagethrough direct tension cracks. With this intention, an experimental study is carried out toinvestigate the subject. Three full-scale RC panels specimens are cracked in direct tension.The cracks are then subjected to pressurized fluid to measure the rate of leakage through them.A load-controlled setup is used to apply the tensile force on the the specimens in order toinitiate a major crack and also to change the crack widths afterwards. The research is focusedon the leakage of water through the cracks. The main expected outcomes of this research arethe rates of water leakage through the cracks and the roughness factors for the cracks. The
2
1.3. THESIS LAYOUT
validity of analytical models are also evaluated and compared against the experimental results.
1.3 Thesis Layout
The current chapter is a brief introduction to the subject. A literature review on direct tensioncracking and permeability of concrete cracks is presented in Chapter 2. Cracking behavior ofreinforced concrete in direct tension is briefly covered since it was required to crack the testspecimens in order to conduct the leakage test. Previous research on permeability of crackedconcrete are summarized. Governing flow equations, roughness factors and effective crackwidths are then discussed.
Chapter 3 introduces the designed experimental study. Following the test specimens andmaterial properties, the test setup is explained. The test procedure is then described in details.This investigation consists of three related phases which are described individually.
Chapter 4 reports the results of the experimental study and the discussions on these results.The results of each phase are reported for all specimens. The results of the leakage test arediscussed in more details. Comparisons with previous studies and new findings are included inthis chapter as well. Chapter 5 begins with a short summary of the research. It is followed bythe conclusions and finally recommendations for the future work.
3

Chapter 2
Background
2.1 General
Reinforced concrete (RC) is widely used in the construction industry. Because of the low ten-sile strength of the concrete, formation of cracks under very low tensile forces is inevitable.Aesthetic problems, reduced durability and serviceability are among undesirable effects ofcracking on RC structures. The effects of cracking are more severe on reinforced concreteenvironmental structures. Some of these structures like reservoirs, sewage tanks and nuclearpower plants are engaged in transmission or storage of liquids and thus, liquid tightness is con-sidered to be their main functionality. Uncracked concrete can be assumed as tight for most ofthe cases. But concrete usually cracks at very low tensile stresses and permeability of crackedconcrete is exponentially larger than that of uncracked concrete. High permeability will resultin leakage of water in or out of the structure, reduced serviceability and even endangers safetyin some conditions.
In order to protect reinforced concrete structures from the above mentioned adverse effectsof cracking, crack widths must not exceed certain limitations. The maximum crack widththat may be considered not to ruin the appearance of a structure depends on various factorsincluding position, length, and surface texture of the crack as well as the illumination in thesurrounding area. According to Park and Paulay (1975), crack widths in the range 0.25 mm to0.38 mm may be acceptable for aesthetic reasons.
The crack width that will not endanger the corrosion of the reinforcement strongly dependson the environment of the structure. Due to the harsh environmental conditions of Liquid Con-
5
2.1. GENERAL
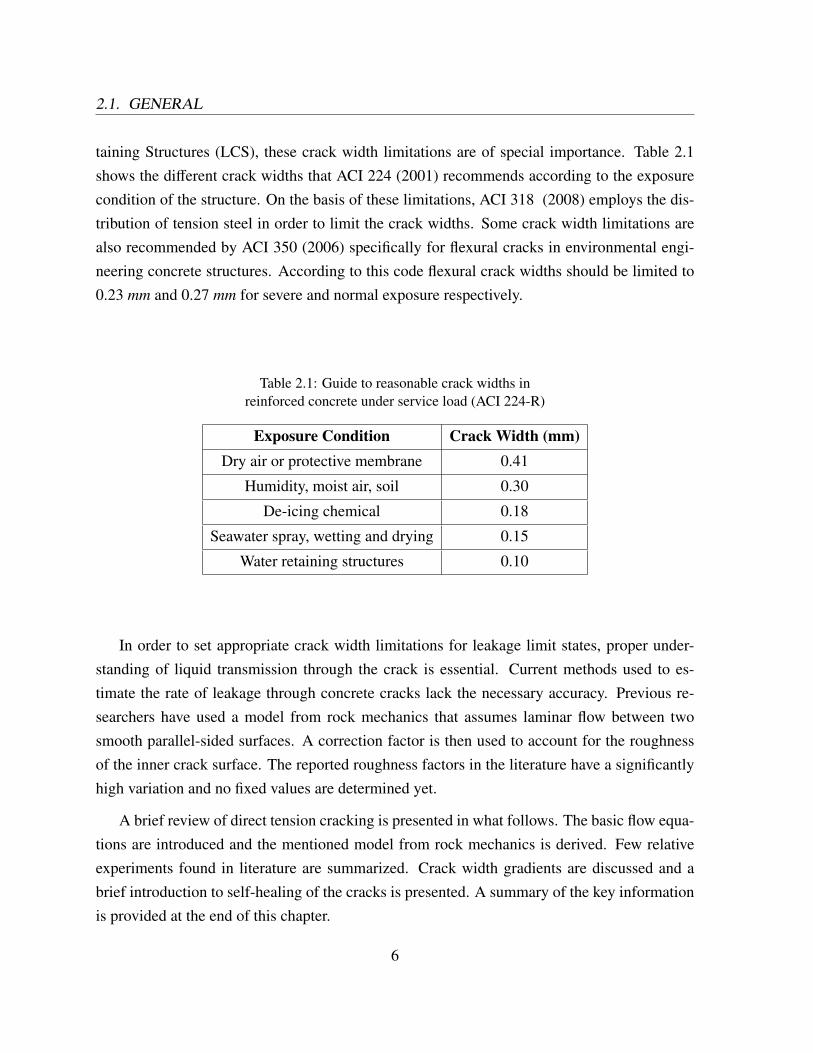
taining Structures (LCS), these crack width limitations are of special importance. Table 2.1shows the different crack widths that ACI 224 (2001) recommends according to the exposurecondition of the structure. On the basis of these limitations, ACI 318 (2008) employs the dis-tribution of tension steel in order to limit the crack widths. Some crack width limitations arealso recommended by ACI 350 (2006) specifically for flexural cracks in environmental engi-neering concrete structures. According to this code flexural crack widths should be limited to0.23 mm and 0.27 mm for severe and normal exposure respectively.
Table 2.1: Guide to reasonable crack widths inreinforced concrete under service load (ACI 224-R)
Exposure Condition Crack Width (mm)Dry air or protective membrane 0.41
Humidity, moist air, soil 0.30
De-icing chemical 0.18
Seawater spray, wetting and drying 0.15
Water retaining structures 0.10
In order to set appropriate crack width limitations for leakage limit states, proper under-standing of liquid transmission through the crack is essential. Current methods used to es-timate the rate of leakage through concrete cracks lack the necessary accuracy. Previous re-searchers have used a model from rock mechanics that assumes laminar flow between twosmooth parallel-sided surfaces. A correction factor is then used to account for the roughnessof the inner crack surface. The reported roughness factors in the literature have a significantlyhigh variation and no fixed values are determined yet.
A brief review of direct tension cracking is presented in what follows. The basic flow equa-tions are introduced and the mentioned model from rock mechanics is derived. Few relativeexperiments found in literature are summarized. Crack width gradients are discussed and abrief introduction to self-healing of the cracks is presented. A summary of the key informationis provided at the end of this chapter.
6
2.2. DIRECT TENSION CRACKING
2.2 Direct Tension Cracking
A basic model is used with reference to ?? (CEB) in order to gain a general understanding ofcracking behavior of reinforced concrete. Concrete cracks when the tensile stress in a memberreaches the tensile strength of the concrete. The simplest structural element that can be used toinvestigate the direct tension cracking in reinforced concrete is a single embedded rebar. Thiselement can be subjected to concentric direct tension force by pulling the extruded rebar fromboth ends.
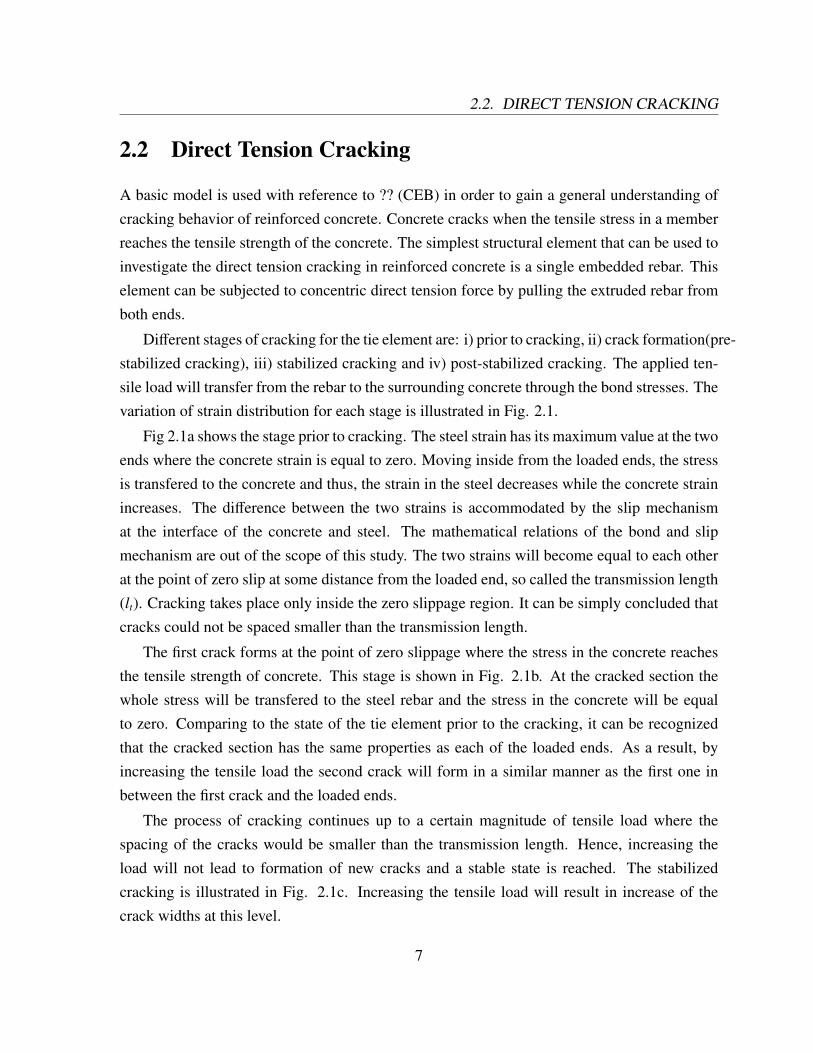
Different stages of cracking for the tie element are: i) prior to cracking, ii) crack formation(pre-stabilized cracking), iii) stabilized cracking and iv) post-stabilized cracking. The applied ten-sile load will transfer from the rebar to the surrounding concrete through the bond stresses. Thevariation of strain distribution for each stage is illustrated in Fig. 2.1.
Fig 2.1a shows the stage prior to cracking. The steel strain has its maximum value at the twoends where the concrete strain is equal to zero. Moving inside from the loaded ends, the stressis transfered to the concrete and thus, the strain in the steel decreases while the concrete strainincreases. The difference between the two strains is accommodated by the slip mechanismat the interface of the concrete and steel. The mathematical relations of the bond and slipmechanism are out of the scope of this study. The two strains will become equal to each otherat the point of zero slip at some distance from the loaded end, so called the transmission length(lt). Cracking takes place only inside the zero slippage region. It can be simply concluded thatcracks could not be spaced smaller than the transmission length.
The first crack forms at the point of zero slippage where the stress in the concrete reachesthe tensile strength of concrete. This stage is shown in Fig. 2.1b. At the cracked section thewhole stress will be transfered to the steel rebar and the stress in the concrete will be equalto zero. Comparing to the state of the tie element prior to the cracking, it can be recognizedthat the cracked section has the same properties as each of the loaded ends. As a result, byincreasing the tensile load the second crack will form in a similar manner as the first one inbetween the first crack and the loaded ends.
The process of cracking continues up to a certain magnitude of tensile load where thespacing of the cracks would be smaller than the transmission length. Hence, increasing theload will not lead to formation of new cracks and a stable state is reached. The stabilizedcracking is illustrated in Fig. 2.1c. Increasing the tensile load will result in increase of thecrack widths at this level.
7

2.2. DIRECT TENSION CRACKING
Figure 2.1: Strain distribution in a RC tie element, a) prior to cracking, b) crack formation c) stabilizedcracking, d) post-stabilized cracking
8

2.3. PERMEABILITY OF CRACKS IN CONCRETE
2.3 Permeability of Cracks in Concrete
2.3.1 Cracks and Water Tightness
Tightness of concrete is of major importance in the field of engineering practice due to dura-bility concerns in general and serviceability for LCS in particular. Durability of the structurestrongly depends on the possibility for the aggressive agent to travel through the concrete.Corrosion of steel reinforcement, freeze and thaw cycles and alkali-aggregate reactions are ex-amples of this case. In case of LCS, liquid tightness is the main functionality of the structureand if violated, the serviceability will be reduced and even the safety of the structure might becompromised. That is the case for water or sewage containments, nuclear power plants, etc.
Research has shown that presence of cracks, both at micro and macro scales, affects thetransfer properties of concrete. Kermani (1991) reported a very high variation in permeabilityof concrete samples loaded in compression. Prior to formation of a major crack, sample’sinitial permeability of 4x10⁻¹⁴ [m/s] was increased about 1000 times, due to development ofmicro cracks. Wang and Karr (1997) tested concrete disks, fractured using a splitting tensiletest. They correlated the crack opening displacement (COD) with the permeability coefficientof a crack. Their results showed little effect of CODs smaller than 50 microns on permeabilityof the sample while for CODs between 50 to 200 microns the permeability increased rapidly.
Extensive research on the water permeability of crack-free concrete has shown that in gen-eral, the saturated water permeability of concrete is a function of its porosity, pore connectivity,and the square of a threshold pore diameter. In presence of macro cracks almost all of the flowhappens through them and the flow through the matrix can be neglected. In such situations thecrack geometry (length/width/roughness) plays an important role in permeability of the mate-rial. Limited research has been done on the flow of fluids through cracked concrete and thefield still lacks a reliable prediction model. The most popular model used to quantify the liquidflow through a concrete crack is one originally developed in Rock Mechanics. This model,known as Poiseuille flow, assumes laminar flow through a smooth parallel-sided slot and uses areduction factor to account for roughness of the crack wall. The validity of this model has beenidentified by different researchers, but a wide range of roughness factors has been reported.The Poiseulle flow model, roughness factor and relevant studies will be discussed in detail inthis section.
9
2.3. PERMEABILITY OF CRACKS IN CONCRETE
2.3.2 Basic Flow Equations
Generally, motion of a fluid is described by Navier-Stokes equations. The flow of an incom-pressible Newtonian viscous fluid can be written as:
∂p∂t
+ (u.∇)u = F −1ρ∇p +
µ
ρ∇2 p (2.1)
Where U = (ux, uy, uz) is the velocity vector, F is the body force per unit mass, ρ is the fluiddensity, µ is the fluid viscosity and p is the pressure. The Navier-Stokes equations embodythe principle of conservation of linear momentum, along with a linear constitutive relation thatrelates the viscous stresses to the element strain rates and the coefficient of viscosity. The Term∂p∂t represents the acceleration of a fluid particle: the velocity may change with time. The (u.∇)uterm is called the ”advective acceleration” and represents the acceleration that a particle mayhave, even in a steady-state flow field, by virtue of moving to a location at which there is adifferent velocity. F, 1
ρ∇p and µ
ρ∇2 p on the right side of Eq. 2.1 represent applied body force,
the pressure gradient, and the viscous forces respectively.
Usually the force due to gravity is the only considerable applied body force; F = g.ez whereg is the gravitational acceleration and ez is the unit vector in the upward vertical direction. Foruniform density, gravity can be eliminated from the equations by defining a reduced pressurep = p + ρgz (Phillips (1991))
F −1ρ∇p = −gez −
1ρ∇p = −
1ρ
(∇p + ρgez) = −1ρ∇ p (2.2)
Finally the Navier-Stokes equations can be written for the steady-state of flow. The term ∂u∂t
drops out:
µ∇2 − ρ(u.∇)u = ∇p (2.3)
Note that for simplicity of notation term p is used instead of the reduced pressure P.
Eq. 2.3 consists of three equations and four unknowns, namely pressure and three ve-locity components. Incompressible continuity relation provides the forth equation required toclose the system. The compressibility of water is roughly 5x10⁻¹⁰/Pa (Batchelor (1967)), soa pressure change of 10 MPa would alter the density by only 0.5 percent; the assumption ofincompressibility is therefore reasonable. For an incompressible fluid, conservation of volume
10
2.3. PERMEABILITY OF CRACKS IN CONCRETE
provides the continuity equation:
∇.u =∂ux
∂x+∂uy
∂y+∂uz
∂z= 0 (2.4)
The set of four coupled partial differential equations must be augmented by the no-slip
boundary conditions, which state that at the interface between a solid and a fluid, the velocityof the fluid must be equal to that of the solid. This implies that at the surface of the fracture ,all components of the fluid velocity must be zero.
The simplest model that represents a crack for hydrological purposes is that of two smooth,parallel walls separated by a uniform aperture, w. For this specific geometry, the Navier-Stokesequations can be solved exactly to yield a parabolic velocity profile between the two wallsof the crack. Presence of the advective component of acceleration causes the Navier-Stokesequations to be non-linear and difficult to solve. For the case of steady flow between parallelplates the advective component of acceleration vanishes identically. Aligning the x-axis withthe pressure gradient, the y-axis perpendicular to the pressure gradient within the plane of thefracture, and the z-axis normal to the fracture plane, with the fracture walls located at z = ±w
2 .The solution to Eq. 2.3 and 2.4 is a Poiseuille parabola (Jaeger and Zimmerman (2007)):
ux = −1
2µ∂p∂x
[(w2
)2 − z2], uy = 0, uz = 0 (2.5)
The three dimensional (volumetric) flow can be calculated by integrating the velocity:
Qx = l∫ + h
2
− h2
uxdz = −l
2µ∂p∂x
∫ + h2
− h2
[(w2
)2 − z2]dz = −lw3
12µ∂p∂x
(2.6)
Where l [m] is the length of the crack in y direction, w is the crack width [m], µ [Ns/m2] isthe viscosity of the fluid and ∂p
∂x [N/m3] is the pressure change between inlet and outlet of thecrack. The term lw3/12 is known as the crack transmissivity and is sometimes stated as w3/12for unit length of the crack. This result is also known as the ”cubic law” since the transmissivityis proportional to the cube of aperture.
For a single crack, if we state the pressure in terms of water head, the term ∂p∂x in Eq. 2.6
will represent the hydraulic gradient of the crack. Also for consistency of units the viscosityterm should change to kinematic viscosity and the flow through the crack can be written as:
11
2.3. PERMEABILITY OF CRACKS IN CONCRETE
Q = −gl
12ν∆hh
w3 (2.7)
Where g [m/s2] is the gravitational acceleration, ∆h [m] is the change in water head, h [m]is the thickness of the wall, and ν [m2/s] is the kinematic viscosity of the fluid and the term ∆h
h
represents the hydraulic gradient.
Eq. 2.7 is only exact for smooth-parallel wall openings which is not the case for most ofthe fracture surfaces. The surface of crack walls in concrete is rough . This will result in amuch lower flow than that calculated by Eq. 2.7. Experiments have shown that it is possibleto modify the Poiseuille flow by multiplying a reduction factor (ξ) accounting for the crackmorphology. This factor, named as turtuosity or roughness factor by different authors, will bediscussed in section 2.3.4. Eq. 2.7 can be completes as:
Q = −ξgl
12ν∆hh
w3 (2.8)
The other assumption in Eq. 2.7 is that the two walls of the crack are parallel and thus thecrack width is constant. In contrast, actual cracks have a highly variable profile both at thesurface and through the crack. So an equivalent crack width must replace the constant value ofw in Eq. 2.7 in a way that results in the same flow as in the actual crack width. The effectivecrack widths will be discussed later in this chapter.
2.3.3 Permeability Coefficient
Darcy’s law describes the flow of a fluid through a porous medium. In its most basic form, andfor the case of laminar flow, it relates the water flow rate to the pressure gradient:
J =Qwl
= −kν
∂p∂x
(2.9)
Where J [m/s] is the volumetric flow and k [m2] is the permeability coefficient . ThePoiseuille flow can be re-written in analogy with Darcy’s law and alternatively representedin terms of permeability coefficient of the crack.
Q = −ξgl
12ν∆hh
w3 = −kν
∂p∂x
wl (2.10)
12
2.3. PERMEABILITY OF CRACKS IN CONCRETE
k = ξw2
12(2.11)
2.3.4 Roughness Factor
As mentioned before, Eq. 2.7 is only valid for parallel openings with a smooth surface. Exper-iments show much lower flow rates than that calculated by Eq. 2.7. This is due to turtuosity ofthe inner crack surfaces. A roughness (tortuosity) factor, accounting for crack morphology, isused to reduce the calculated flow.
Qr = ξQs = ξgl
12ν∆hh
w3 (2.12)
Where Qr is the flow of the natural-rough crack, Qs is the flow of the smooth wall crack andξ is the roughness factor. Several experimental configurations have been used by researchersto measure the flow of fluids through cracked concrete. Different loading conditions (com-pression, tension or bending) have been used on natural or artificial cracks (joint). However,research on permeability of cracked concrete has been limited and the results from previousstudies suggest different values with a high variation for the roughness factor. Some of theseexperiments will be discussed below.
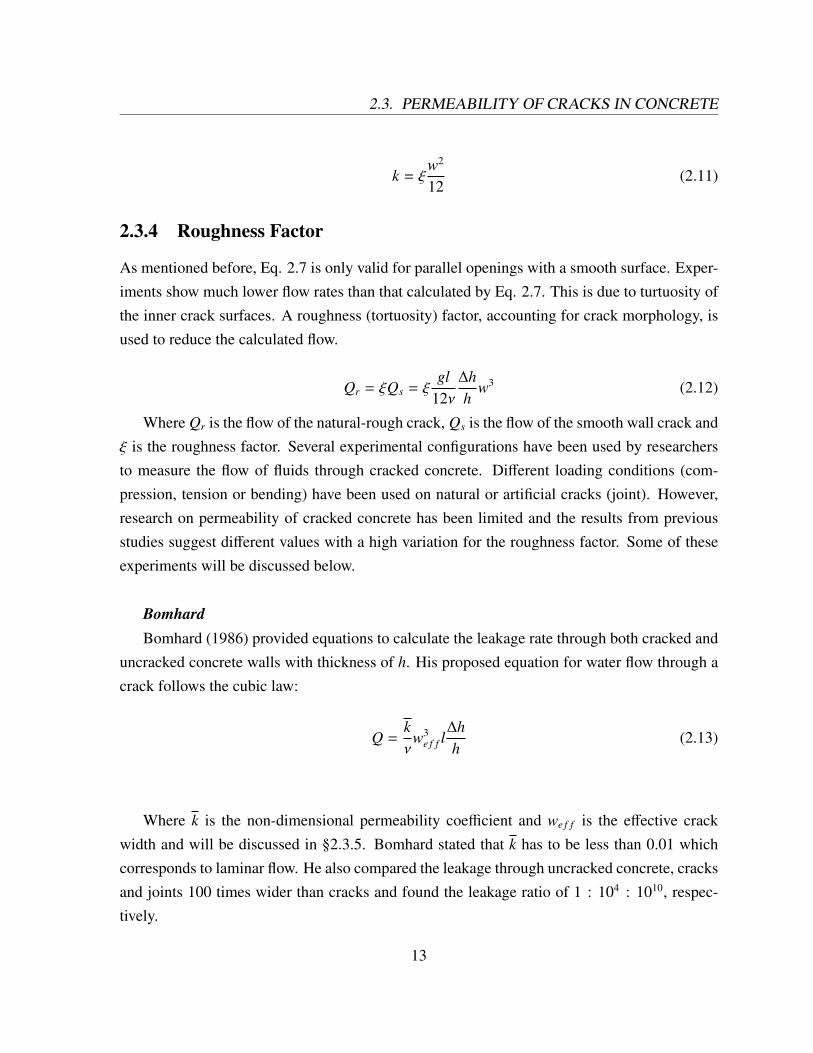
BomhardBomhard (1986) provided equations to calculate the leakage rate through both cracked and
uncracked concrete walls with thickness of h. His proposed equation for water flow through acrack follows the cubic law:
Q =kν
w3e f f l
∆hh
(2.13)
Where k is the non-dimensional permeability coefficient and we f f is the effective crackwidth and will be discussed in §2.3.5. Bomhard stated that k has to be less than 0.01 whichcorresponds to laminar flow. He also compared the leakage through uncracked concrete, cracksand joints 100 times wider than cracks and found the leakage ratio of 1 : 104 : 1010, respec-tively.
13
2.3. PERMEABILITY OF CRACKS IN CONCRETE
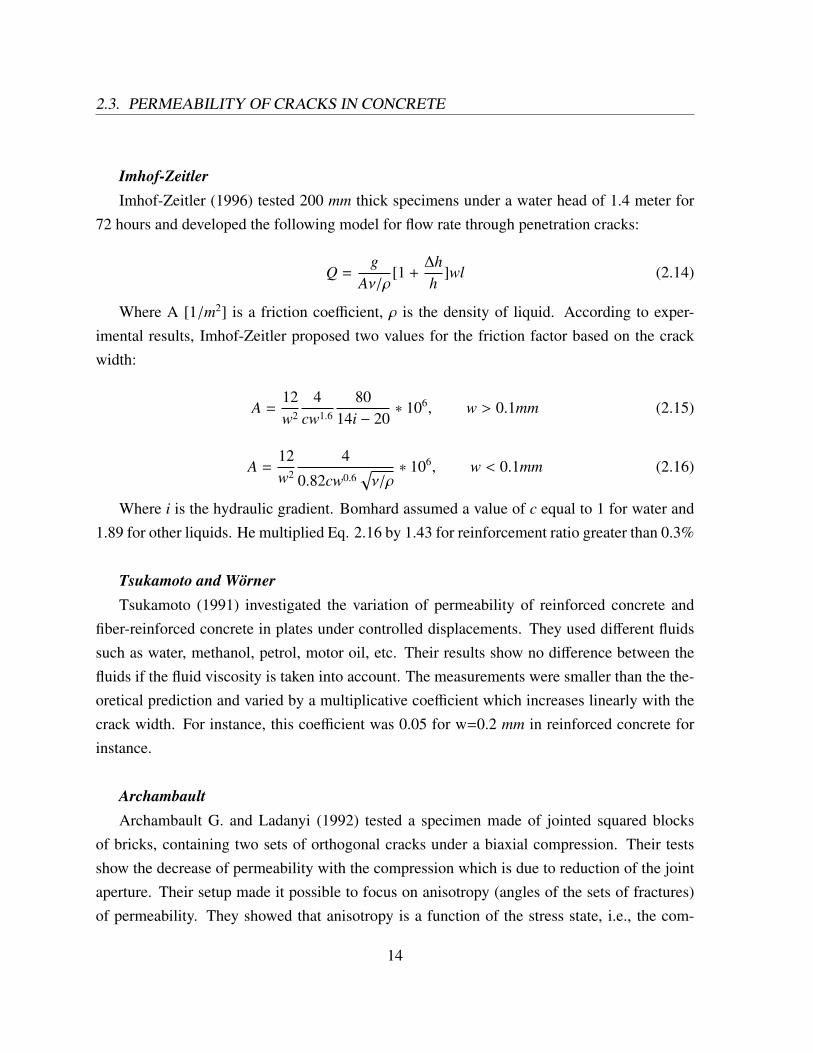
Imhof-ZeitlerImhof-Zeitler (1996) tested 200 mm thick specimens under a water head of 1.4 meter for
72 hours and developed the following model for flow rate through penetration cracks:
Q =g
Aν/ρ[1 +
∆hh
]wl (2.14)
Where A [1/m2] is a friction coefficient, ρ is the density of liquid. According to exper-imental results, Imhof-Zeitler proposed two values for the friction factor based on the crackwidth:
A =12w2
4cw1.6
8014i − 20
∗ 106, w > 0.1mm (2.15)
A =12w2
4
0.82cw0.6√ν/ρ∗ 106, w < 0.1mm (2.16)
Where i is the hydraulic gradient. Bomhard assumed a value of c equal to 1 for water and1.89 for other liquids. He multiplied Eq. 2.16 by 1.43 for reinforcement ratio greater than 0.3%
Tsukamoto and WornerTsukamoto (1991) investigated the variation of permeability of reinforced concrete and
fiber-reinforced concrete in plates under controlled displacements. They used different fluidssuch as water, methanol, petrol, motor oil, etc. Their results show no difference between thefluids if the fluid viscosity is taken into account. The measurements were smaller than the the-oretical prediction and varied by a multiplicative coefficient which increases linearly with thecrack width. For instance, this coefficient was 0.05 for w=0.2 mm in reinforced concrete forinstance.
ArchambaultArchambault G. and Ladanyi (1992) tested a specimen made of jointed squared blocks
of bricks, containing two sets of orthogonal cracks under a biaxial compression. Their testsshow the decrease of permeability with the compression which is due to reduction of the jointaperture. Their setup made it possible to focus on anisotropy (angles of the sets of fractures)of permeability. They showed that anisotropy is a function of the stress state, i.e., the com-
14
2.3. PERMEABILITY OF CRACKS IN CONCRETE
pressive stress closes the cracks differently according to their orientation. Their results areexclusive since their material did not represent the behavior of the actual material.
Marchal and BeaudouxMarchal and M. (1992) used a different model for predicting the flow (Carman-Kozeny
model). They measured the flow passing through a crack created by splitting and compared itto a theoretical prediction . They found that the effect of tortuosity is to divide the theoreticalflow (plane crack) by a tortuosity factor of 75 which is comparable to that exhibited on rocks.Results form Breysse and Lasne (1994) confirm these conclusions qualitatively.
EdvardsenEdvardsen (1996) conducted water permeability tests on small concrete specimens having
a single crack induced in tension. The following were the varying parameters in his test:
• Crack width (0.1,0.2,0.4 mm)
• Crack Length (200,300 and 400 mm)
• Water pressure head (ranging from 2.5 to 20 m)
• Hydraulic gradient (ranging from 6.25 to 50)
• Water Hardness
• Cement (Portland cement,slag cement and sulphate resistant cement)
• Aggregate (granite,limestone and basalt) and Filler (limestone dust and fly-ash)
Edvardsen reported a large distribution of measured flow due to the large variability ofmeasured crack widths. Despite the variability of the results the validity of cubic law was con-firmed. He suggested a mean value of ξ = 0.25 by regression analysis of test results.
Breysse and GerardBreysse D. (1997), using an iterative procedure and with the aid of non-linear finite-element
computations, designed an original specimen to measure the flow under tensile loading of a
15
2.3. PERMEABILITY OF CRACKS IN CONCRETE
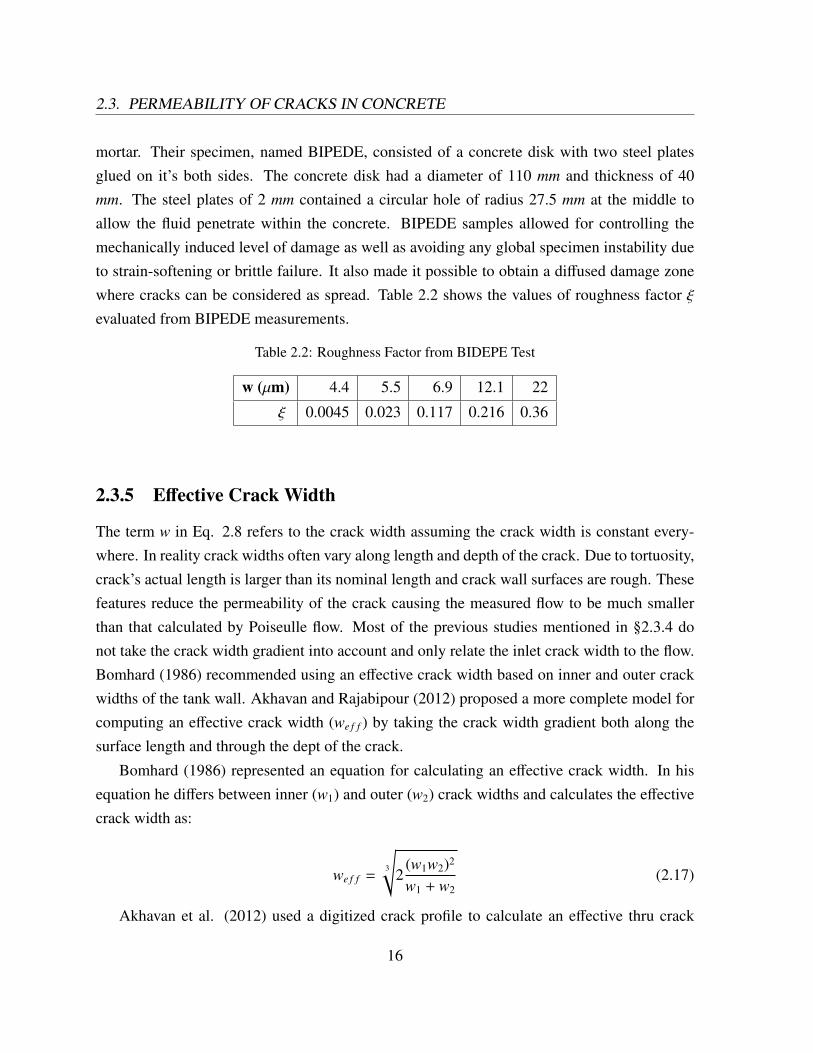
mortar. Their specimen, named BIPEDE, consisted of a concrete disk with two steel platesglued on it’s both sides. The concrete disk had a diameter of 110 mm and thickness of 40mm. The steel plates of 2 mm contained a circular hole of radius 27.5 mm at the middle toallow the fluid penetrate within the concrete. BIPEDE samples allowed for controlling themechanically induced level of damage as well as avoiding any global specimen instability dueto strain-softening or brittle failure. It also made it possible to obtain a diffused damage zonewhere cracks can be considered as spread. Table 2.2 shows the values of roughness factor ξevaluated from BIPEDE measurements.
Table 2.2: Roughness Factor from BIDEPE Test
w (µm) 4.4 5.5 6.9 12.1 22
ξ 0.0045 0.023 0.117 0.216 0.36
2.3.5 Effective Crack Width
The term w in Eq. 2.8 refers to the crack width assuming the crack width is constant every-where. In reality crack widths often vary along length and depth of the crack. Due to tortuosity,crack’s actual length is larger than its nominal length and crack wall surfaces are rough. Thesefeatures reduce the permeability of the crack causing the measured flow to be much smallerthan that calculated by Poiseulle flow. Most of the previous studies mentioned in §2.3.4 donot take the crack width gradient into account and only relate the inlet crack width to the flow.Bomhard (1986) recommended using an effective crack width based on inner and outer crackwidths of the tank wall. Akhavan and Rajabipour (2012) proposed a more complete model forcomputing an effective crack width (we f f ) by taking the crack width gradient both along thesurface length and through the dept of the crack.
Bomhard (1986) represented an equation for calculating an effective crack width. In hisequation he differs between inner (w1) and outer (w2) crack widths and calculates the effectivecrack width as:
we f f =3
√2
(w1w2)2
w1 + w2(2.17)
Akhavan et al. (2012) used a digitized crack profile to calculate an effective thru crack
16
2.3. PERMEABILITY OF CRACKS IN CONCRETE
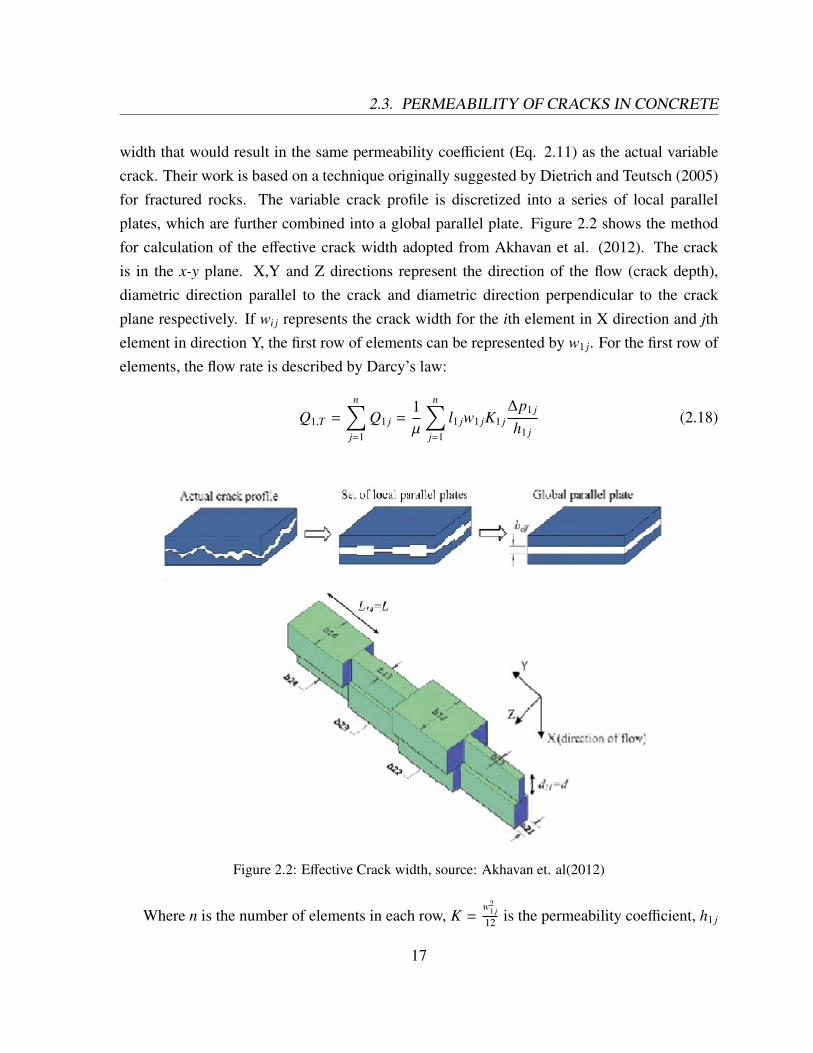
width that would result in the same permeability coefficient (Eq. 2.11) as the actual variablecrack. Their work is based on a technique originally suggested by Dietrich and Teutsch (2005)for fractured rocks. The variable crack profile is discretized into a series of local parallelplates, which are further combined into a global parallel plate. Figure 2.2 shows the methodfor calculation of the effective crack width adopted from Akhavan et al. (2012). The crackis in the x-y plane. X,Y and Z directions represent the direction of the flow (crack depth),diametric direction parallel to the crack and diametric direction perpendicular to the crackplane respectively. If wi j represents the crack width for the ith element in X direction and jthelement in direction Y, the first row of elements can be represented by w1 j. For the first row ofelements, the flow rate is described by Darcy’s law:
Q1,T =
n∑j=1
Q1 j =1µ
n∑j=1
l1 jw1 jK1 j∆p1 j
h1 j(2.18)
Figure 2.2: Effective Crack width, source: Akhavan et. al(2012)
Where n is the number of elements in each row, K =w2
1 j
12 is the permeability coefficient, h1 j
17
2.3. PERMEABILITY OF CRACKS IN CONCRETE
is the element thickness and ∆p1 j is the pressure loss for each element. By choosing constantvalues for elements’ length and thickness (l and h) and assuming one-dimensional flow (∆p11 =
∆p12 = ∆p1), the flow will be:
Q1,T =1
12µ∆p1
hl
n∑j=1
w31 j (2.19)
In the above equation the term∑n
j=1 w31 j can be replaced by a single crack width which
would result in the same flow:
b1,e f f = 3
√√1n
n∑j=1
w1 j (2.20)
Q1,T =1
12µ∆p1
hlw3
1,e f f (2.21)
By using a similar procedure, an effective crack width can be calculated in X direction,through the depth of the crack. For a column of m crack elements with length, width, andthickness of l, wi,e f f and h:
Q1,T = Q2,T = ... = Qi,T = QT (2.22)
112µ
∆p1
hnlm
w31,e f f =
112µ
∆p2
hnlm
w32,e f f = ... =
112µ
∆pi
hnlw3
i,e f f =1
12µ∆pi
hnlm
w3e f f (2.23)
Where QT is the total flow rate, ∆P = ∆P1 + ∆P2 + ...+ ∆Pm is the total pressure loss acrossthe specimen, and m is the number of rows. Eq. 2.23 can be simplified as the following:
∆Pi = ∆P1(w1,e f f
wi,e f f)3 (2.24)
∆P =
m∑i=1
∆pi = m∆P1w31,e f f (
1we f f
)3 (2.25)
Akhavan et al. then calculate the effective thru crack width as:
18
2.4. SELF-HEALING OF CRACKS
3
√m∑m
i=1( 1w1,e f f
)3(2.26)
2.4 Self-healing of Cracks
A noticeable number of environmental engineering structures are fabricated using reinforcedconcrete. Besides its numerous advantages, concrete cracks at very low tensile stresses. Thesestresses can have various sources some of which are structural loading, shrinkage, thermaleffects, creep, etc. Uncracked concrete can be assumed as tight for LCS but after crackingconcrete becomes permeable up to a certain degree. The permeability of the concrete dependson the type and geometry (width, tortuosityi, length, etc.) of the crack. Direct tension crackshave shown to be more critical than any other types of cracks since they provide a thru path forthe liquid in or out of the structure.
Experimental studies have shown that cracks have the ability to seal themselves. Self heal-ing of cracks, also known as autogenous healing, is one phenomenon acting to reduce durabilityproblems caused by the cracks. Self-healing process can take place only in presence of water.This process consists of chemical reactions of compounds exposed at the cracked surfaces. Thecrystals produced from these reactions form a layer on each inner wall of the crack. Accretionof the crystallization on both surfaces of a crack can re-establish the continuity of the materialeventually. In extreme cases complete sealing may be achieved.
There are two hypothesis on the autogenous healing of the cracks. First, the hydration ofun-hydrated clinker available in the micro-structure of hardened concrete can fill the crack toa certain order. The second one implies that the precipitation of calcium carbonate crystals(CaCO3) can contribute to the formation of the sediment material. The first hypothesis isvitally dependent of presence of water. The latter requires presence of dissolved CO2 in theleaking water. Mechanical blocking, obstruction of narrow crack areas with ultra-fine material,swelling, silting up of cracks and deposition of debris can also contribute to healing.
Current codes of practice take the self-healing of the cracks into account in their designguidelines for a serviceable reinforced concrete water containment. According to ACI 224(2001) the healing phenomenon will not occur for active cracks which are subjected to move-ment. It also states that in order to achieve a self-healed crack the flow of water has to beextremely slow so that it would not dissolve and wash away the lime deposit. ACI 224 (2001)
19

2.4. SELF-HEALING OF CRACKS
requires complete evaporation at the exposed face. However previous studies including theone by Ziari and Kianoush (2009a,b) have shown that the concrete self healing process mighttake place even when positive flow of water exists through cracks. Saturation of the crack andthe adjacent concrete with water in addition to the age of the crack are considered effectiveon the autogenous healing of the crack. Even a single cycle of drying and re-immersion willreduce the healing strength. Delayed healing also results in less restoration of strength thandoes immediate correction.
The following is a highlight of the studies carried out with the subject of self-healing ofconcrete cracks.
HearnHearn and C.T. (1997) conducted permeability tests on mortars with 78 % of hydrated
clinker to investigate the role of un-hydrated cement in self-healing of the cracks. He inves-tigated the chemical effects, like continuing hydration, dissolution and deposition of solublespecies. The inflow and outflow both were subjected to chemical analysis. The findings ofthis study pointed out a significant increase in Ca2+ ions concentration in the outflow, whichindicates dissolution-deposition of calcium carbonate CaCo3.
EdvardsenEdvardsen (1999) conducted permeability tests on small-scale concrete specimens each
with a single tensile crack. His results indicate a quick reduction in the leakage. Edvardsenexplained the phenomenon by the crystallization of calcium carbonate CaCo3. He also showedthat cracks with initial effective widths of 200 microns after sufficiently long water exposurecan completely seal after five to seven weeks.
Reinhardt and JoosReinhardt and Joos (2003) investigated the effects of crack width and temperature on the
decrease of the flow rate. Narrow cracks showed a faster healing than wider ones and a highertemperature resulted in quicker self-healing process. Furthermore, cracks of the width less than0.10 mm in high performance concrete (HPC) samples can be closed by self-healing processesunder certain condition.
The above mentioned studies mostly investigate the transfer properties of the concrete.Some other tests are performed to investigate the role of autogenous healing on mechanical
20
2.5. SUMMARY
properties of concrete. Jacobsen et al. (1996) performed experiments on concrete cubes dam-aged by rapid freeze and thaw cycles. Test specimens were then placed in water. Deteriora-tion and healing were measured through the evolutions of the compressive strength and theresonance frequencies giving the dynamic modulus of elasticity. Resonance frequencies andcompressive strengths were both decreased during freeze/thaw cycles and self-healing gave asubstantial recovery of the frequency but only a small recovery of the compressive strength.He explained this small recovery by the fact that cracks were not fully filled with the newlyformed crystals.
2.5 Summary
Cracking is inevitable in RC structures. In LCS cracking will result in leakage of the liquidin/out of the structure and the serviceability of the structure will be reduced. The rate of leakagedepends on the crack geometric properties such as its length, width, morphology, etc. Codes ofpractice recommend limiting the crack widths to control the amount of leakage. A model basedon laminar flow between two parallel smooth-sided plates is widely used to predict the leakagethrough the crack. A multiplicative roughness factor is then used to reduce the calculated flow.This factor has a high variation in the literature.
• As a linear function of crack width (Tsukamoto (1991))
• 0.04 ≤ ξ ≤ 0.53 (Meichner, 1992)
• constant mean value of 0.25 (Edvardsen, 1996)
• constant mean value of 0.1 by (Gerard,1996)
• Range of 0.0045 ≤ ξ ≤ 0.36 depending on the crack width (Breysse and Gerard, 1997)
In presence of water, cracks have shown an ability to heal themselves. The duration, crackwidths and water pressures at which this phenomenon happens vary in the literature. It isimportant to mention that the content of liquid containing structures is not always water andalso in some cases, the required time period to achieve the self healing can not be tolerated.
21

Chapter 3
Experimental Study
3.1 Introduction
Bomhard (1986) states that water tightness can be achieved by one or more of three methods:limiting concrete tensile stress, specifying a minimum depth of compression zone or limitingcrack width. He considers the first method as an unsuitable measure due to variability ofconcrete tensile strength. A sufficient depth of compression zone will result in closure of thecrack on the compression side and a reliable watertightness will be reached. Distribution oftension steel is used in practice to limit the crack width in RC members.
There are some occasions in which reinforced concrete sections must carry purely tensileforces. For instance, a vertical section of a cylindrical shape tank is subjected to the tensilering force produced by internal pressure. In comparison with flexural cracks, the direct tensioninduced cracks are more critical since there is no compression zone and the opening penetratesthe whole depth of the section. Hence, the crack width must be limited to control the leak-age. ACI Committee 224R (2001) recommends a maximum crack width of 0.1 mm for waterretaining structures. However it does not exclude direct tension cracks from other types. 0.23mm and 0.27 mm limitations are also recommended by ACI 350 (2006) specifically for flex-ural cracks in environmental engineering concrete structures for severe and normal exposurerespectively.
For setting appropriate crack width limitations, knowledge of cracks permeability is essen-tial. Limited research has been done on permeability of concrete sections with major cracksand the field still lacks a reliable model to predict the flow. A model from rock mechanics is
23
3.2. EXPERIMENTAL STUDY
the most popular flow prediction model used for concrete cracks. The model assumes laminarflow through a smooth parallel-sided slot. A reduction factor is then used to account for thecrack tortuosity and roughness. Different values of the roughness factor with high variabilityare reported in the literature. Most of these purely empirical values are based on small scaleplain concrete samples.
This experimental study aims to examine the permeability of a major crack in a full-scaleRC panel representing a wall segment of a circular tank. This chapter presents a description ofthe test specimens and set-up in addition to a detailed test procedure. The test consists of threedifferent phases: crack initiation, reloading and leakage test.
• Phase I: Test specimens are subjected to direct tension force until a major crack isformed and then unloaded.
• Phase II: Samples are reloaded to find the relation between the external load and thecrack width.
• Phase III: The crack is subjected to pressurized water and the rate of leakage throughthe crack is measured for different water pressures at different crack widths.
3.2 Experimental Study
3.2.1 Test Specimens
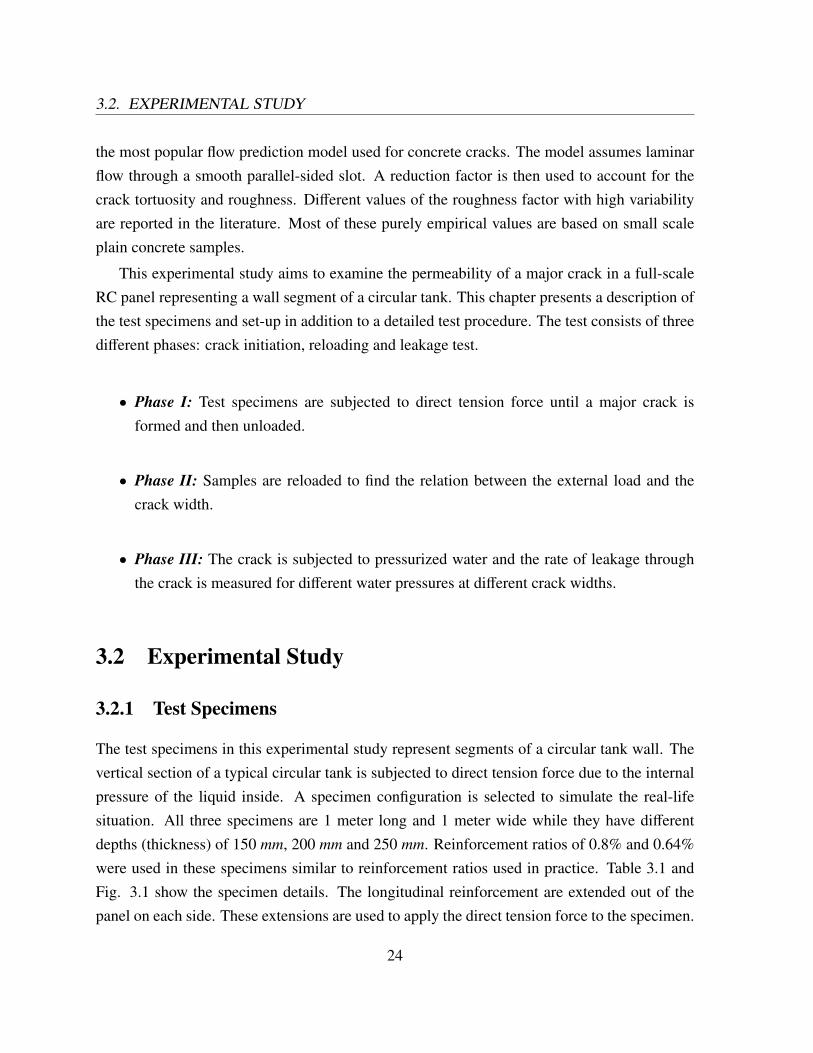
The test specimens in this experimental study represent segments of a circular tank wall. Thevertical section of a typical circular tank is subjected to direct tension force due to the internalpressure of the liquid inside. A specimen configuration is selected to simulate the real-lifesituation. All three specimens are 1 meter long and 1 meter wide while they have differentdepths (thickness) of 150 mm, 200 mm and 250 mm. Reinforcement ratios of 0.8% and 0.64%were used in these specimens similar to reinforcement ratios used in practice. Table 3.1 andFig. 3.1 show the specimen details. The longitudinal reinforcement are extended out of thepanel on each side. These extensions are used to apply the direct tension force to the specimen.
24
3.2. EXPERIMENTAL STUDY
Table 3.1: Specimen Information
No. Specimen Name Thickness (mm) Rebar Size ρs (%)1 S150 150 20M 0.8
2 S200 200 15M 0.8
3 S250 250 15M 0.64
Figure 3.1: RC panel Sections
3.2.2 Casting and Curing
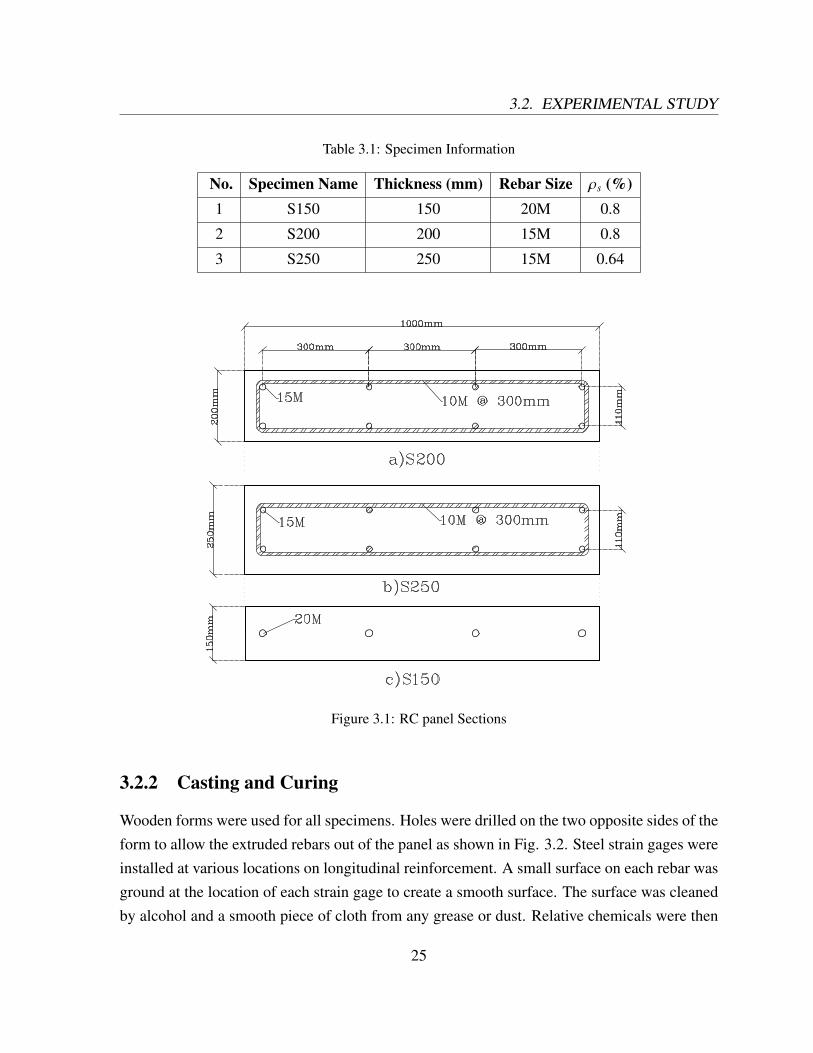
Wooden forms were used for all specimens. Holes were drilled on the two opposite sides of theform to allow the extruded rebars out of the panel as shown in Fig. 3.2. Steel strain gages wereinstalled at various locations on longitudinal reinforcement. A small surface on each rebar wasground at the location of each strain gage to create a smooth surface. The surface was cleanedby alcohol and a smooth piece of cloth from any grease or dust. Relative chemicals were then
25
3.2. EXPERIMENTAL STUDY
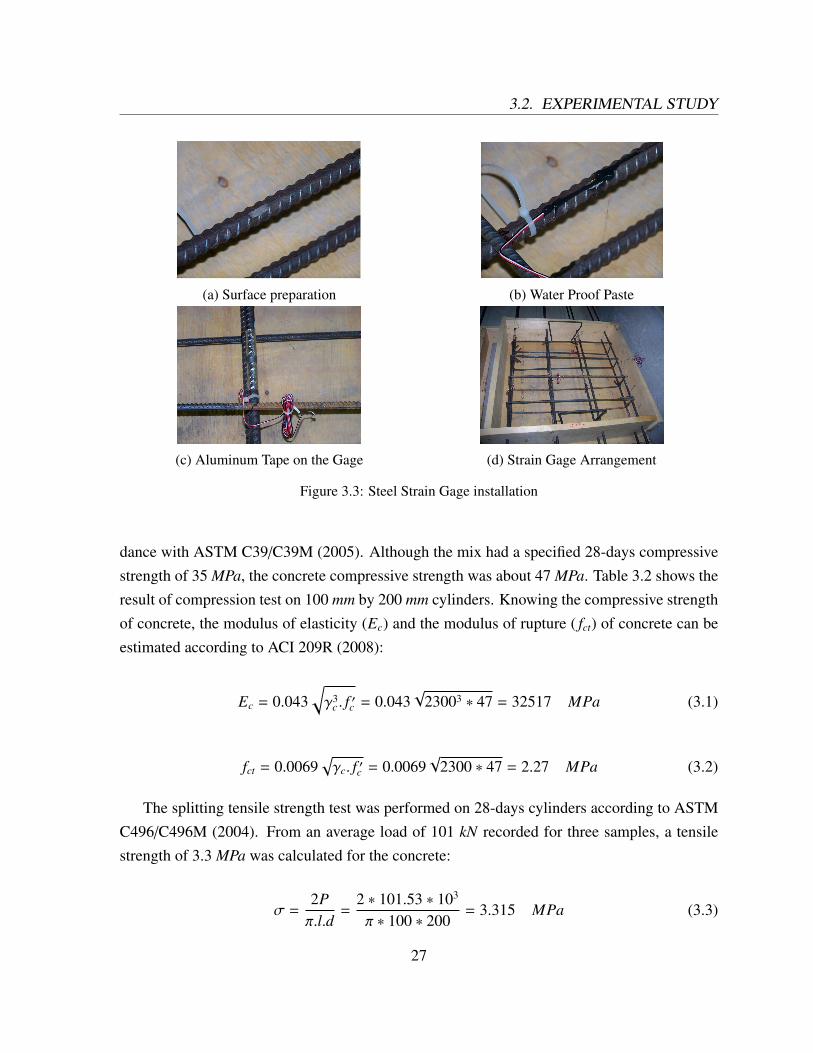
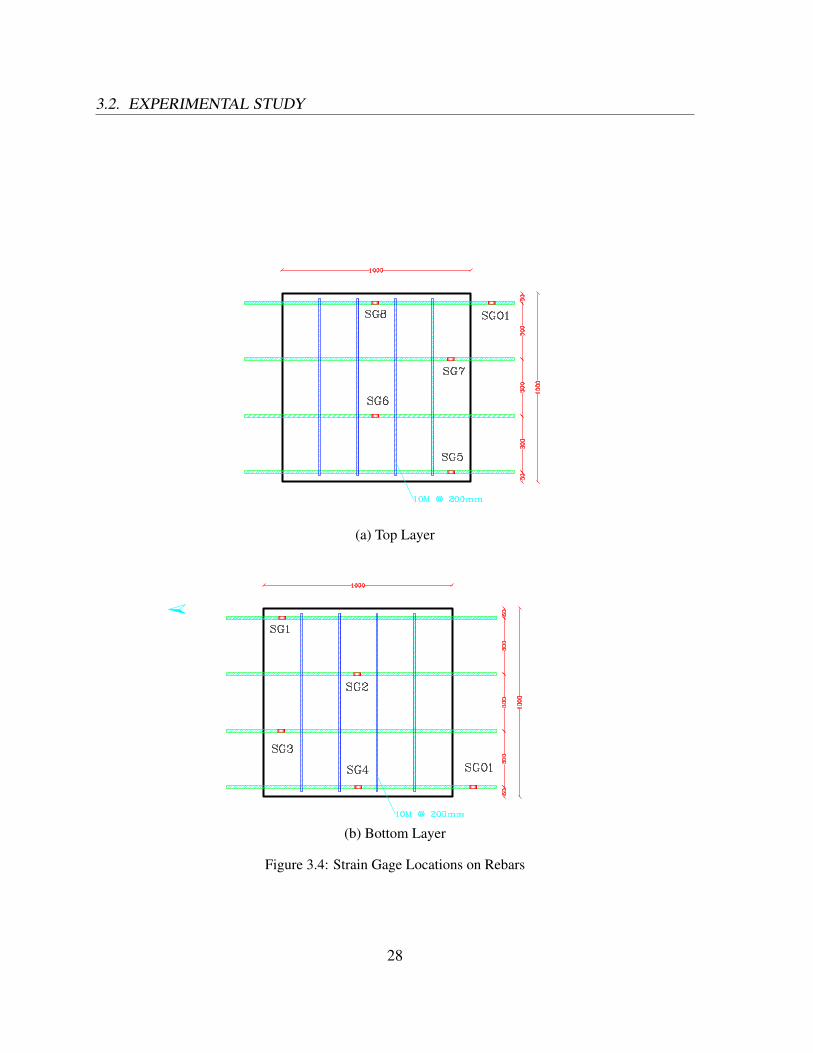
applied to the surface and the strain gages were glued at their locations. Water proof pastewas applied around each strain gage and then covered by aluminum tape to ensure a water anddamage proof condition. Fig. 3.3. and Fig. 3.4 show the details of strain gage installation andthe location of strain gages on the rebars respectively. Form oil was applied on the whole innersurface of the forms. After all the preparations specimens were cast flat on the floor. Concretecylinders were also cast and placed next to the panels.
(a) Form Work Prior to Casting (b) Specimen Curing
(c) Specimen Curing (d) Cylinder Curing
Figure 3.2: Casting and Curing of Specimens
After casting some time was given to the specimens for the partial set and then the exposedsurfaces were troweled. The specimens and cylinders were all covered with wet burlap andplastic sheets after a few hours. The specimens were kept wet for a week. The sides of theforms were then removed and specimens were again covered with wet burlap and plastic sheets.Concrete cylinders were also stripped and kept wet. Wet curing continued for three more weeksuntil the concrete was 28 days old.
3.2.3 Material Properties
Normal density concrete provided by a local supplier was used. All three specimens were castin place from the same batch of concrete. Compressive strength test was conducted in accor-
26
3.2. EXPERIMENTAL STUDY
(a) Surface preparation (b) Water Proof Paste
(c) Aluminum Tape on the Gage (d) Strain Gage Arrangement
Figure 3.3: Steel Strain Gage installation
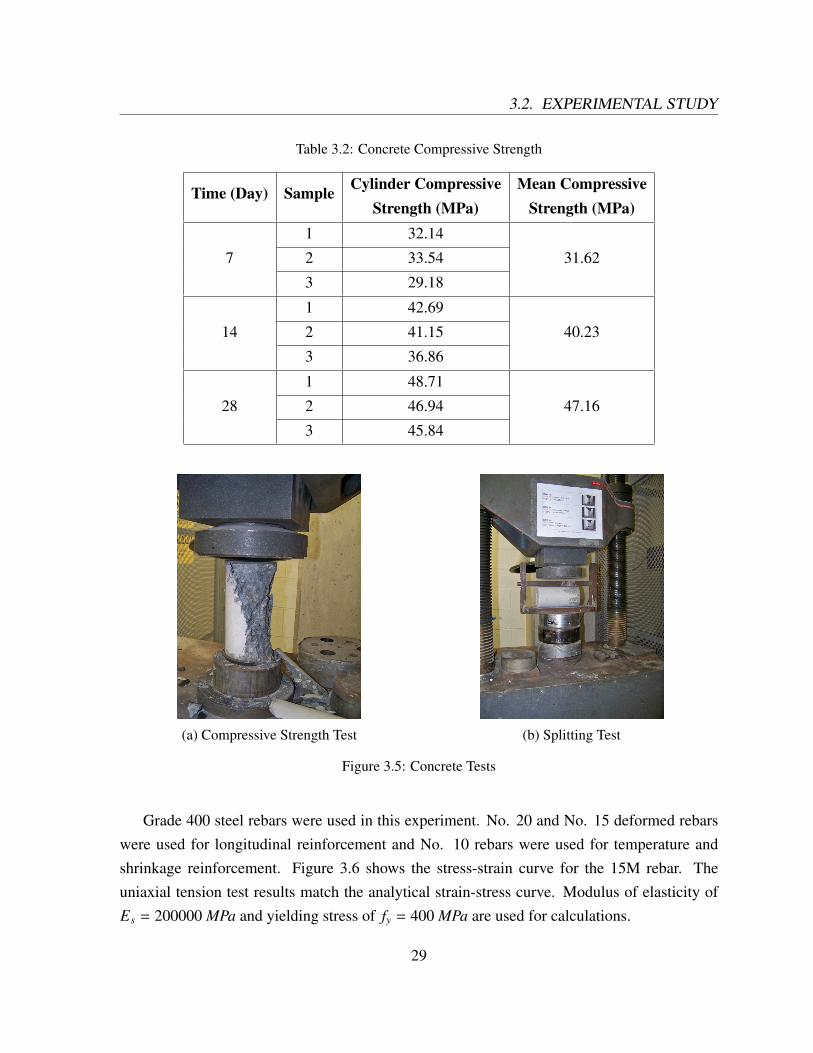
dance with ASTM C39/C39M (2005). Although the mix had a specified 28-days compressivestrength of 35 MPa, the concrete compressive strength was about 47 MPa. Table 3.2 shows theresult of compression test on 100 mm by 200 mm cylinders. Knowing the compressive strengthof concrete, the modulus of elasticity (Ec) and the modulus of rupture ( fct) of concrete can beestimated according to ACI 209R (2008):
Ec = 0.043√γ3
c . f ′c = 0.043√
23003 ∗ 47 = 32517 MPa (3.1)
fct = 0.0069√γc. f ′c = 0.0069
√2300 ∗ 47 = 2.27 MPa (3.2)
The splitting tensile strength test was performed on 28-days cylinders according to ASTMC496/C496M (2004). From an average load of 101 kN recorded for three samples, a tensilestrength of 3.3 MPa was calculated for the concrete:
σ =2Pπ.l.d
=2 ∗ 101.53 ∗ 103
π ∗ 100 ∗ 200= 3.315 MPa (3.3)
27
3.2. EXPERIMENTAL STUDY
(a) Top Layer
(b) Bottom Layer
Figure 3.4: Strain Gage Locations on Rebars
28
3.2. EXPERIMENTAL STUDY
Table 3.2: Concrete Compressive Strength
Time (Day) Sample Cylinder Compressive Mean CompressiveStrength (MPa) Strength (MPa)
7
1 32.14
31.622 33.54
3 29.18
14
1 42.69
40.232 41.15
3 36.86
28
1 48.71
47.162 46.94
3 45.84
(a) Compressive Strength Test (b) Splitting Test
Figure 3.5: Concrete Tests
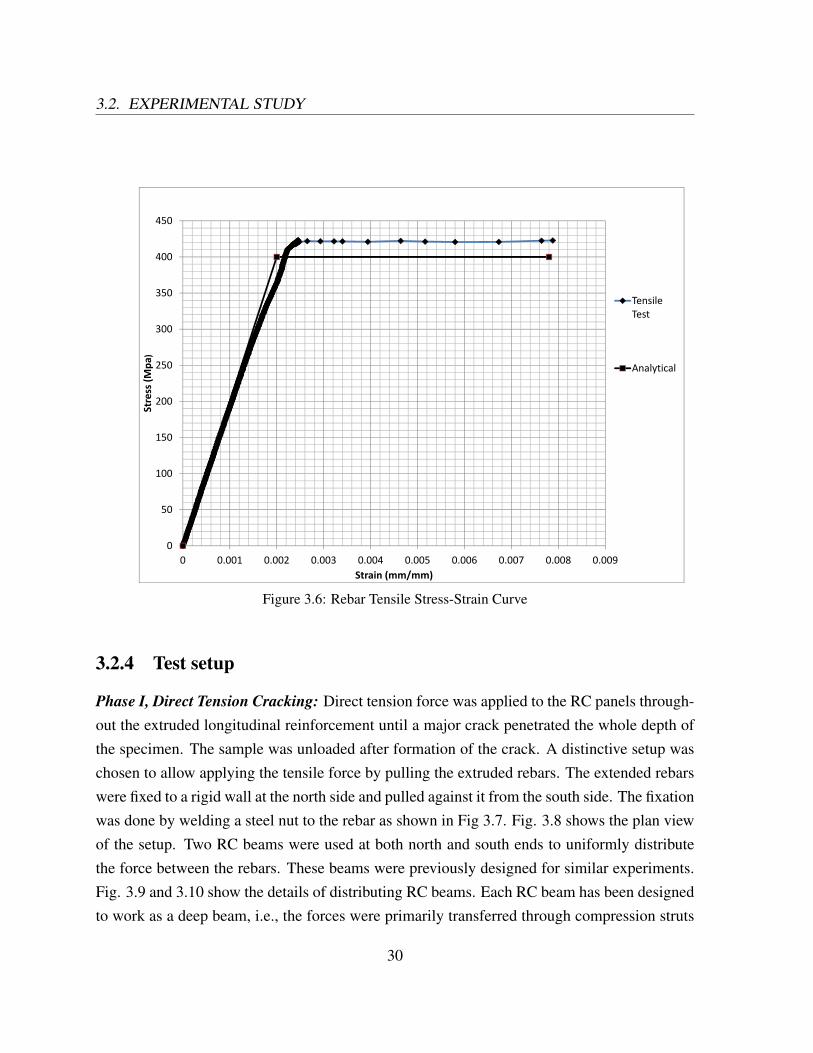
Grade 400 steel rebars were used in this experiment. No. 20 and No. 15 deformed rebarswere used for longitudinal reinforcement and No. 10 rebars were used for temperature andshrinkage reinforcement. Figure 3.6 shows the stress-strain curve for the 15M rebar. Theuniaxial tension test results match the analytical strain-stress curve. Modulus of elasticity ofEs = 200000 MPa and yielding stress of fy = 400 MPa are used for calculations.
29
3.2. EXPERIMENTAL STUDY
450
350
400
T il
300
)
Tensile Test
200
250
Stress (M
pa)
Analytical
150
50
100
00 0.001 0.002 0.003 0.004 0.005 0.006 0.007 0.008 0.009
Strain (mm/mm)
Figure 3.6: Rebar Tensile Stress-Strain Curve
3.2.4 Test setup
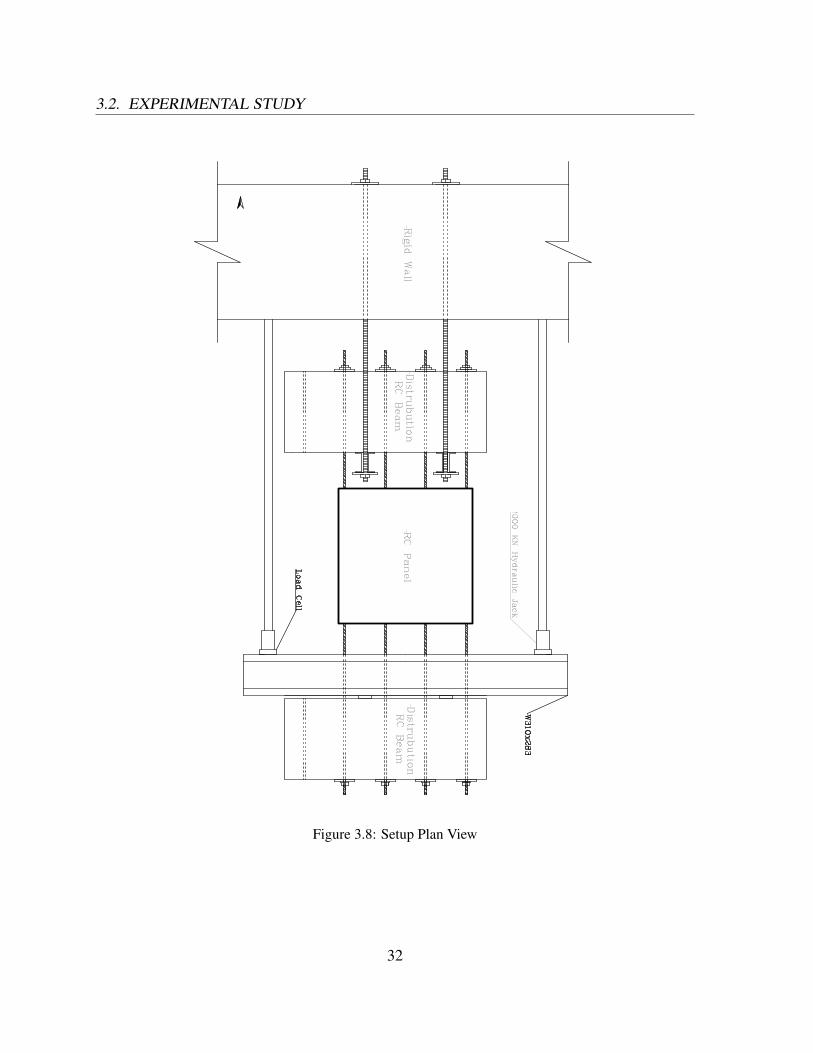
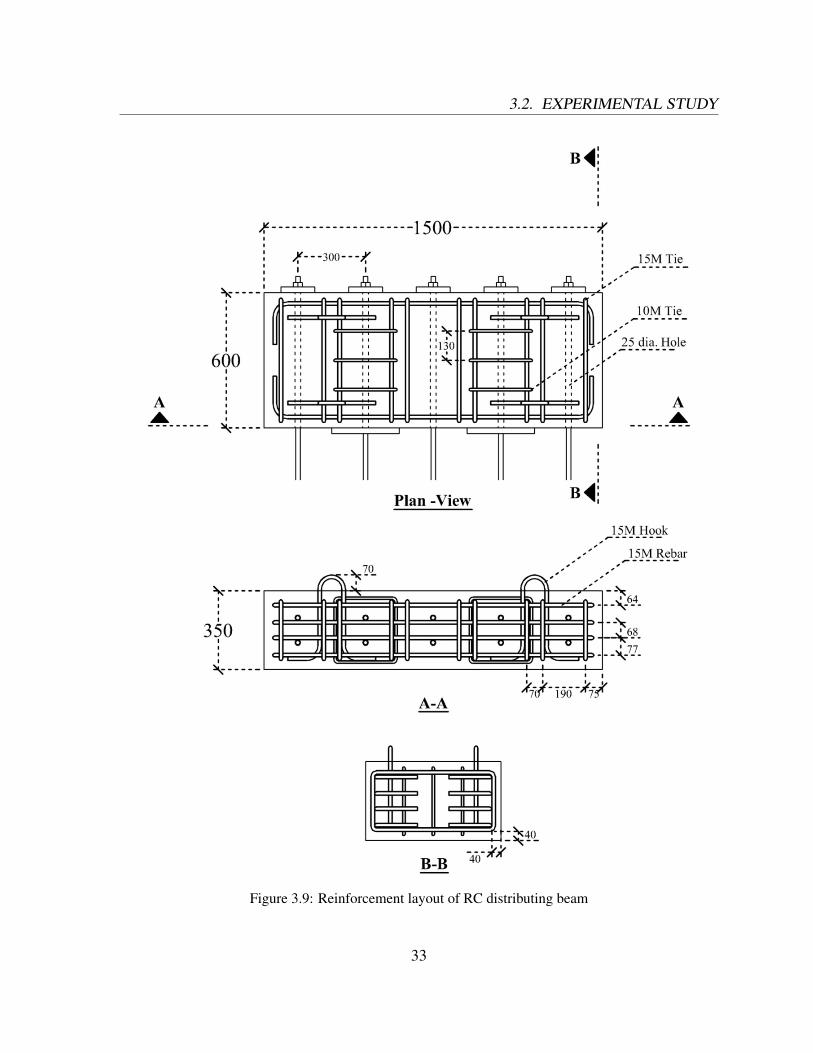
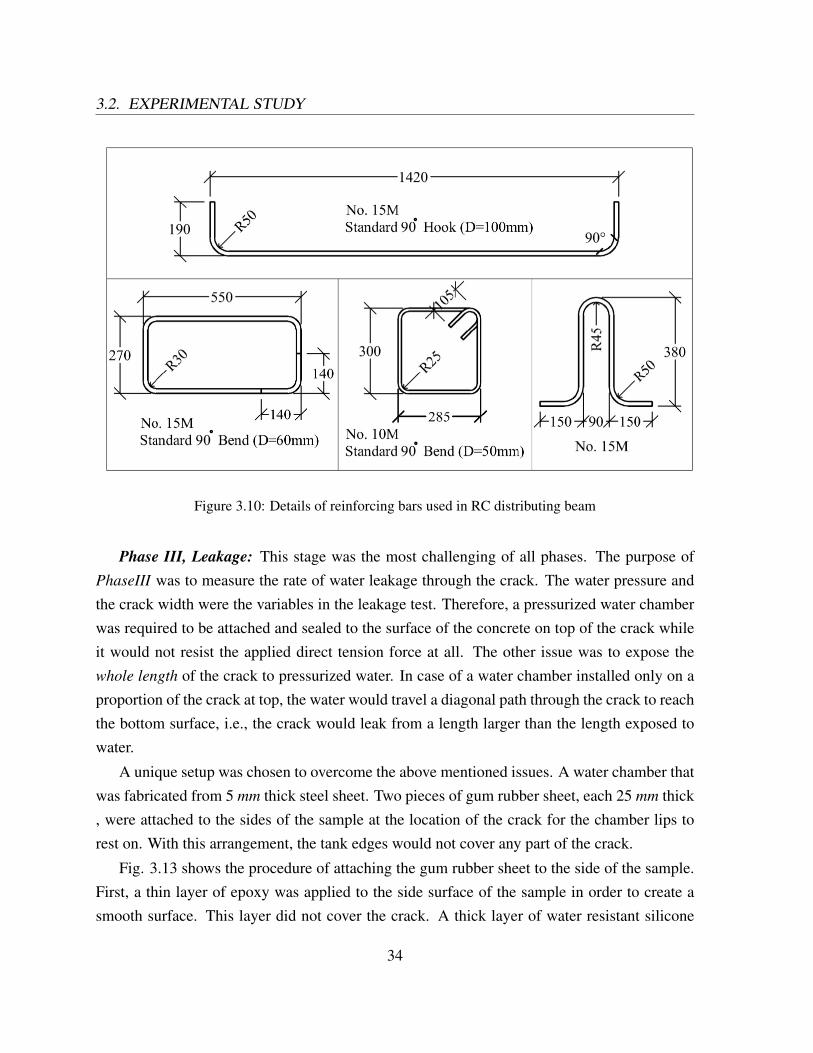
Phase I, Direct Tension Cracking: Direct tension force was applied to the RC panels through-out the extruded longitudinal reinforcement until a major crack penetrated the whole depth ofthe specimen. The sample was unloaded after formation of the crack. A distinctive setup waschosen to allow applying the tensile force by pulling the extruded rebars. The extended rebarswere fixed to a rigid wall at the north side and pulled against it from the south side. The fixationwas done by welding a steel nut to the rebar as shown in Fig 3.7. Fig. 3.8 shows the plan viewof the setup. Two RC beams were used at both north and south ends to uniformly distributethe force between the rebars. These beams were previously designed for similar experiments.Fig. 3.9 and 3.10 show the details of distributing RC beams. Each RC beam has been designedto work as a deep beam, i.e., the forces were primarily transferred through compression struts
30
3.2. EXPERIMENTAL STUDY
and tesion ties.
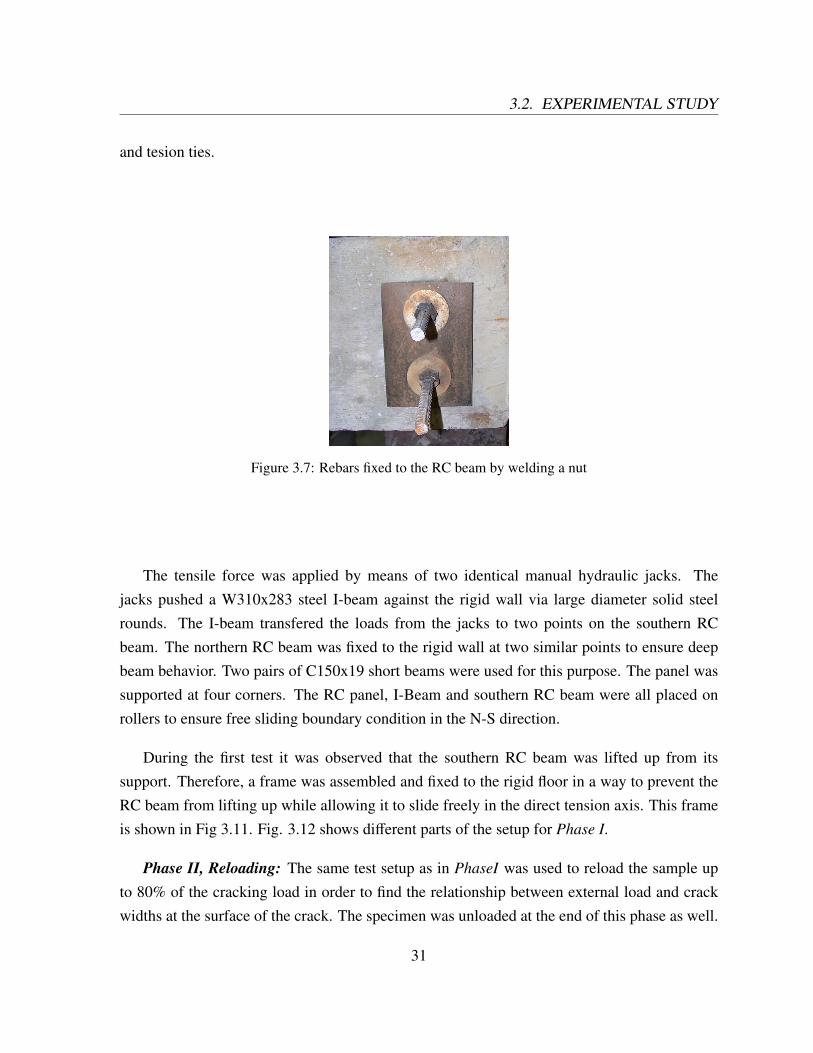
Figure 3.7: Rebars fixed to the RC beam by welding a nut
The tensile force was applied by means of two identical manual hydraulic jacks. Thejacks pushed a W310x283 steel I-beam against the rigid wall via large diameter solid steelrounds. The I-beam transfered the loads from the jacks to two points on the southern RCbeam. The northern RC beam was fixed to the rigid wall at two similar points to ensure deepbeam behavior. Two pairs of C150x19 short beams were used for this purpose. The panel wassupported at four corners. The RC panel, I-Beam and southern RC beam were all placed onrollers to ensure free sliding boundary condition in the N-S direction.
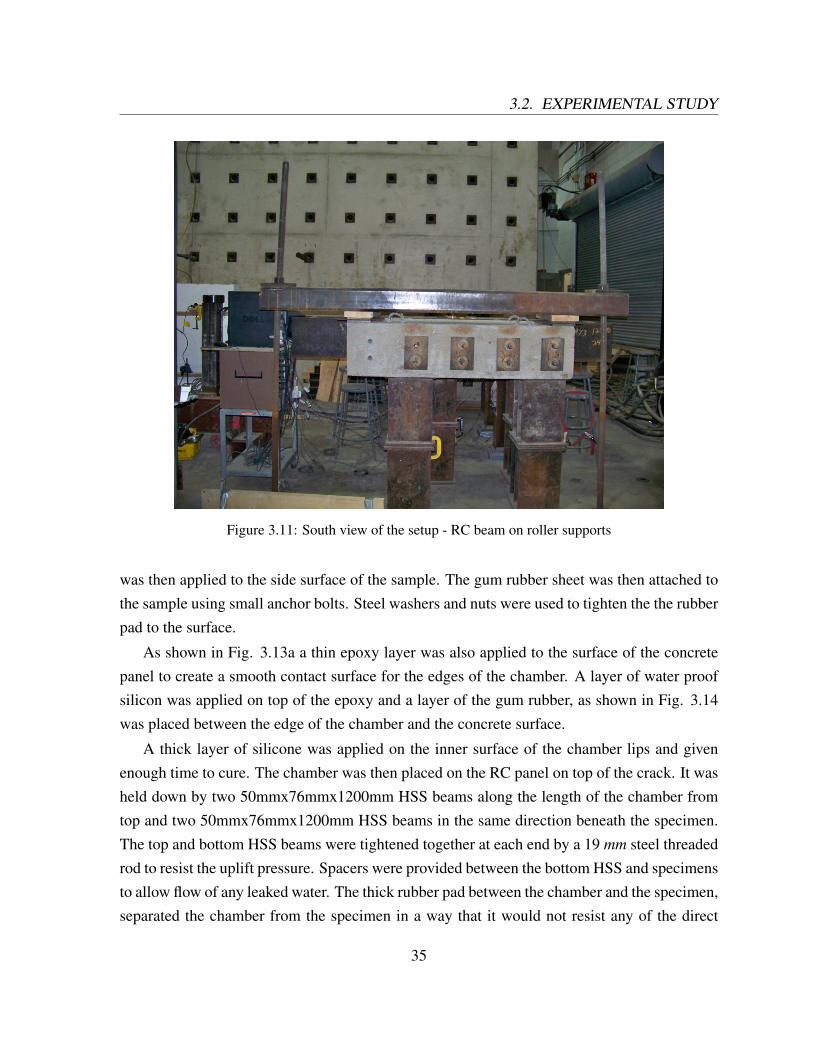
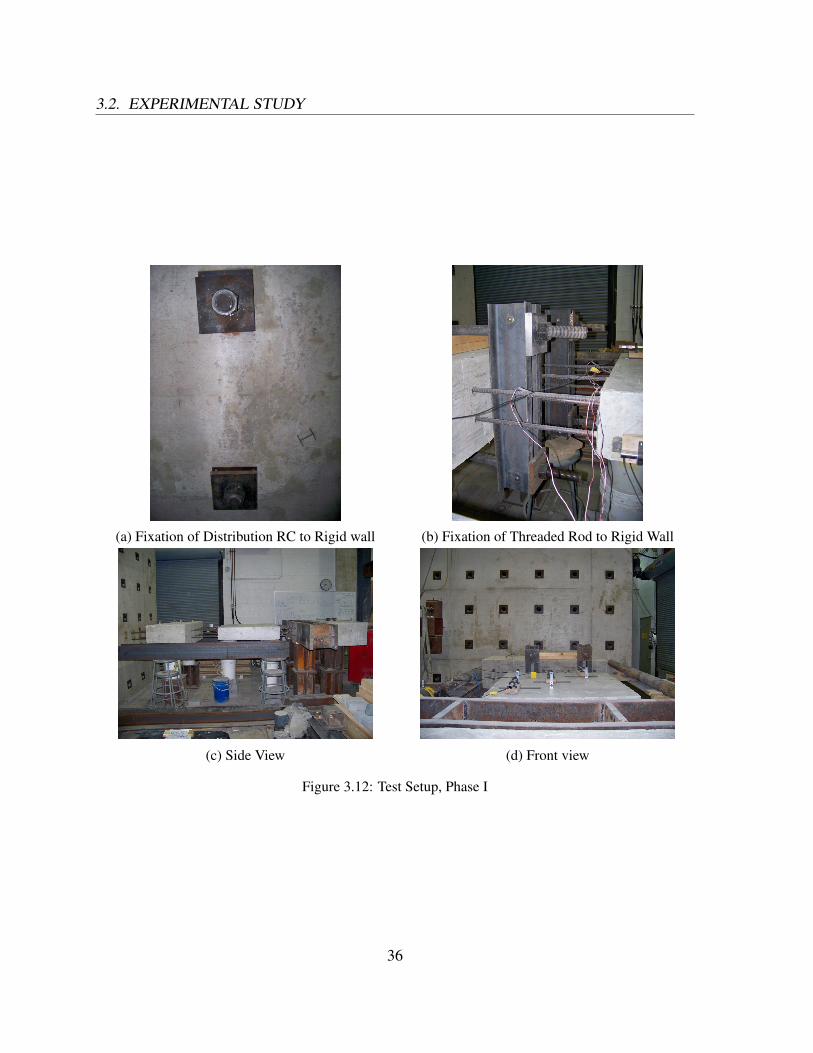
During the first test it was observed that the southern RC beam was lifted up from itssupport. Therefore, a frame was assembled and fixed to the rigid floor in a way to prevent theRC beam from lifting up while allowing it to slide freely in the direct tension axis. This frameis shown in Fig 3.11. Fig. 3.12 shows different parts of the setup for Phase I.
Phase II, Reloading: The same test setup as in PhaseI was used to reload the sample upto 80% of the cracking load in order to find the relationship between external load and crackwidths at the surface of the crack. The specimen was unloaded at the end of this phase as well.
31
3.2. EXPERIMENTAL STUDY
Figure 3.8: Setup Plan View
32
3.2. EXPERIMENTAL STUDY
Figure 3.9: Reinforcement layout of RC distributing beam
33
3.2. EXPERIMENTAL STUDY
Figure 3.10: Details of reinforcing bars used in RC distributing beam
Phase III, Leakage: This stage was the most challenging of all phases. The purpose ofPhaseIII was to measure the rate of water leakage through the crack. The water pressure andthe crack width were the variables in the leakage test. Therefore, a pressurized water chamberwas required to be attached and sealed to the surface of the concrete on top of the crack whileit would not resist the applied direct tension force at all. The other issue was to expose thewhole length of the crack to pressurized water. In case of a water chamber installed only on aproportion of the crack at top, the water would travel a diagonal path through the crack to reachthe bottom surface, i.e., the crack would leak from a length larger than the length exposed towater.
A unique setup was chosen to overcome the above mentioned issues. A water chamber thatwas fabricated from 5 mm thick steel sheet. Two pieces of gum rubber sheet, each 25 mm thick, were attached to the sides of the sample at the location of the crack for the chamber lips torest on. With this arrangement, the tank edges would not cover any part of the crack.
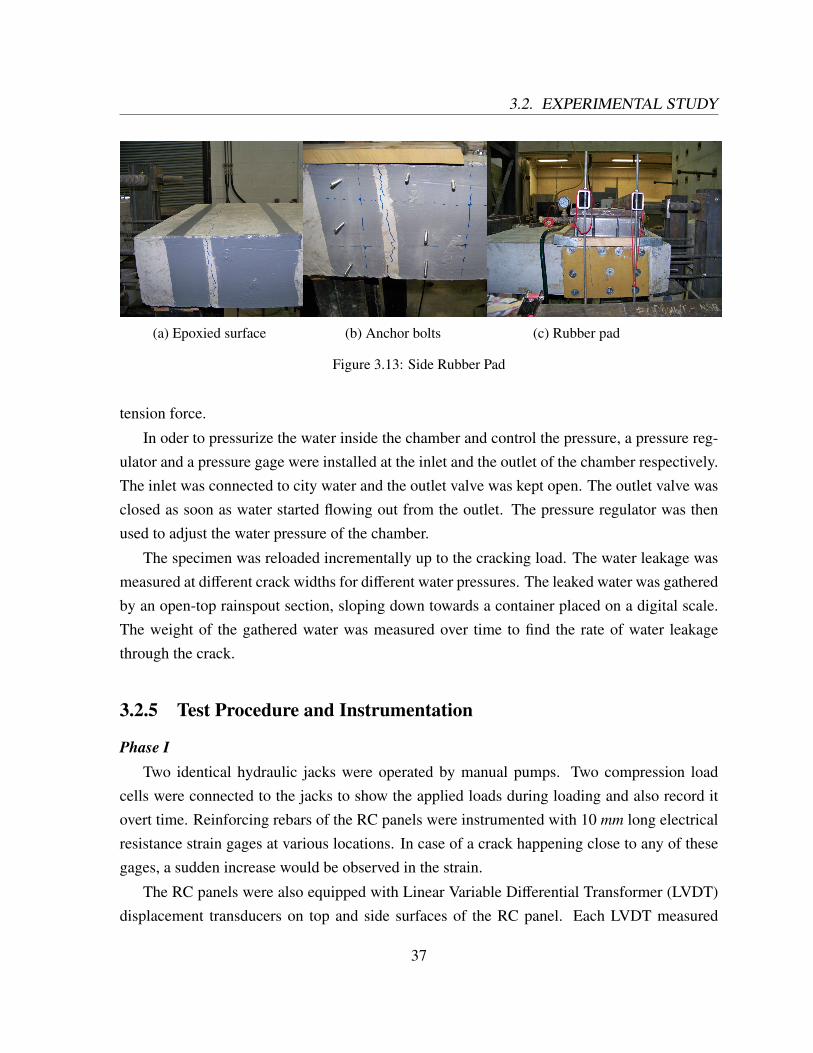
Fig. 3.13 shows the procedure of attaching the gum rubber sheet to the side of the sample.First, a thin layer of epoxy was applied to the side surface of the sample in order to create asmooth surface. This layer did not cover the crack. A thick layer of water resistant silicone
34
3.2. EXPERIMENTAL STUDY
Figure 3.11: South view of the setup - RC beam on roller supports
was then applied to the side surface of the sample. The gum rubber sheet was then attached tothe sample using small anchor bolts. Steel washers and nuts were used to tighten the the rubberpad to the surface.
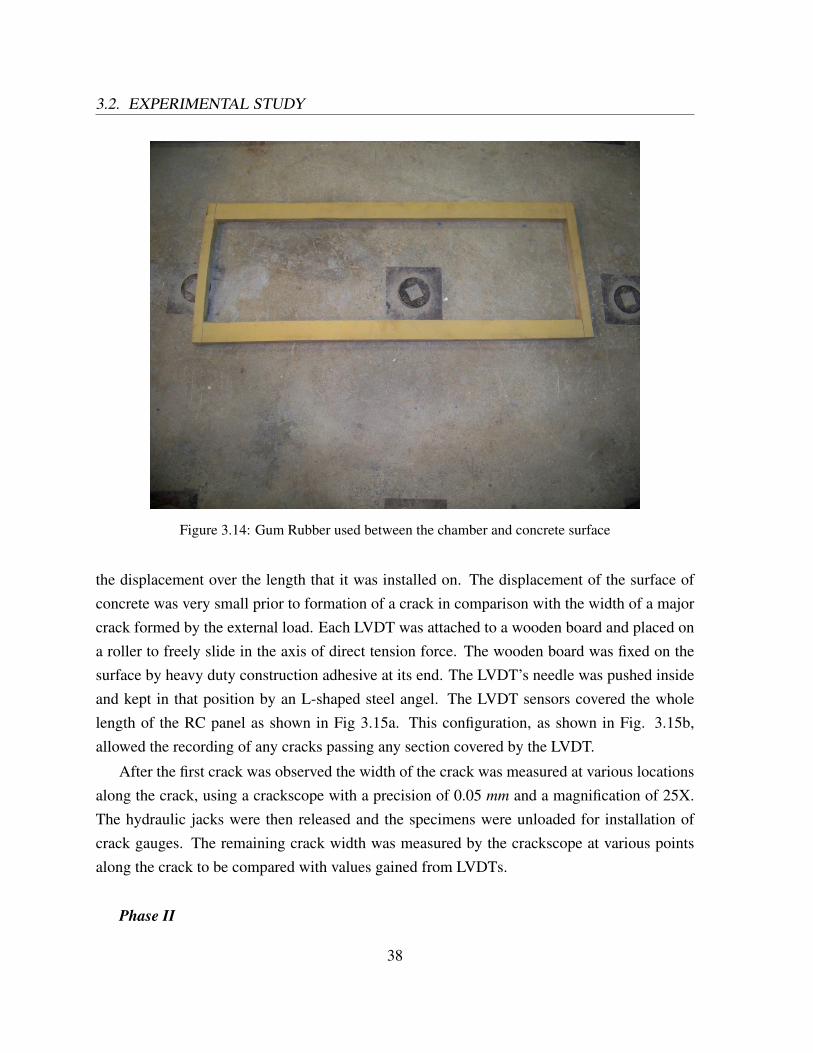
As shown in Fig. 3.13a a thin epoxy layer was also applied to the surface of the concretepanel to create a smooth contact surface for the edges of the chamber. A layer of water proofsilicon was applied on top of the epoxy and a layer of the gum rubber, as shown in Fig. 3.14was placed between the edge of the chamber and the concrete surface.
A thick layer of silicone was applied on the inner surface of the chamber lips and givenenough time to cure. The chamber was then placed on the RC panel on top of the crack. It washeld down by two 50mmx76mmx1200mm HSS beams along the length of the chamber fromtop and two 50mmx76mmx1200mm HSS beams in the same direction beneath the specimen.The top and bottom HSS beams were tightened together at each end by a 19 mm steel threadedrod to resist the uplift pressure. Spacers were provided between the bottom HSS and specimensto allow flow of any leaked water. The thick rubber pad between the chamber and the specimen,separated the chamber from the specimen in a way that it would not resist any of the direct
35
3.2. EXPERIMENTAL STUDY
(a) Fixation of Distribution RC to Rigid wall (b) Fixation of Threaded Rod to Rigid Wall
(c) Side View (d) Front view
Figure 3.12: Test Setup, Phase I
36
3.2. EXPERIMENTAL STUDY
(a) Epoxied surface (b) Anchor bolts (c) Rubber pad
Figure 3.13: Side Rubber Pad
tension force.
In oder to pressurize the water inside the chamber and control the pressure, a pressure reg-ulator and a pressure gage were installed at the inlet and the outlet of the chamber respectively.The inlet was connected to city water and the outlet valve was kept open. The outlet valve wasclosed as soon as water started flowing out from the outlet. The pressure regulator was thenused to adjust the water pressure of the chamber.
The specimen was reloaded incrementally up to the cracking load. The water leakage wasmeasured at different crack widths for different water pressures. The leaked water was gatheredby an open-top rainspout section, sloping down towards a container placed on a digital scale.The weight of the gathered water was measured over time to find the rate of water leakagethrough the crack.
3.2.5 Test Procedure and Instrumentation
Phase ITwo identical hydraulic jacks were operated by manual pumps. Two compression load
cells were connected to the jacks to show the applied loads during loading and also record itovert time. Reinforcing rebars of the RC panels were instrumented with 10 mm long electricalresistance strain gages at various locations. In case of a crack happening close to any of thesegages, a sudden increase would be observed in the strain.
The RC panels were also equipped with Linear Variable Differential Transformer (LVDT)displacement transducers on top and side surfaces of the RC panel. Each LVDT measured
37
3.2. EXPERIMENTAL STUDY
Figure 3.14: Gum Rubber used between the chamber and concrete surface
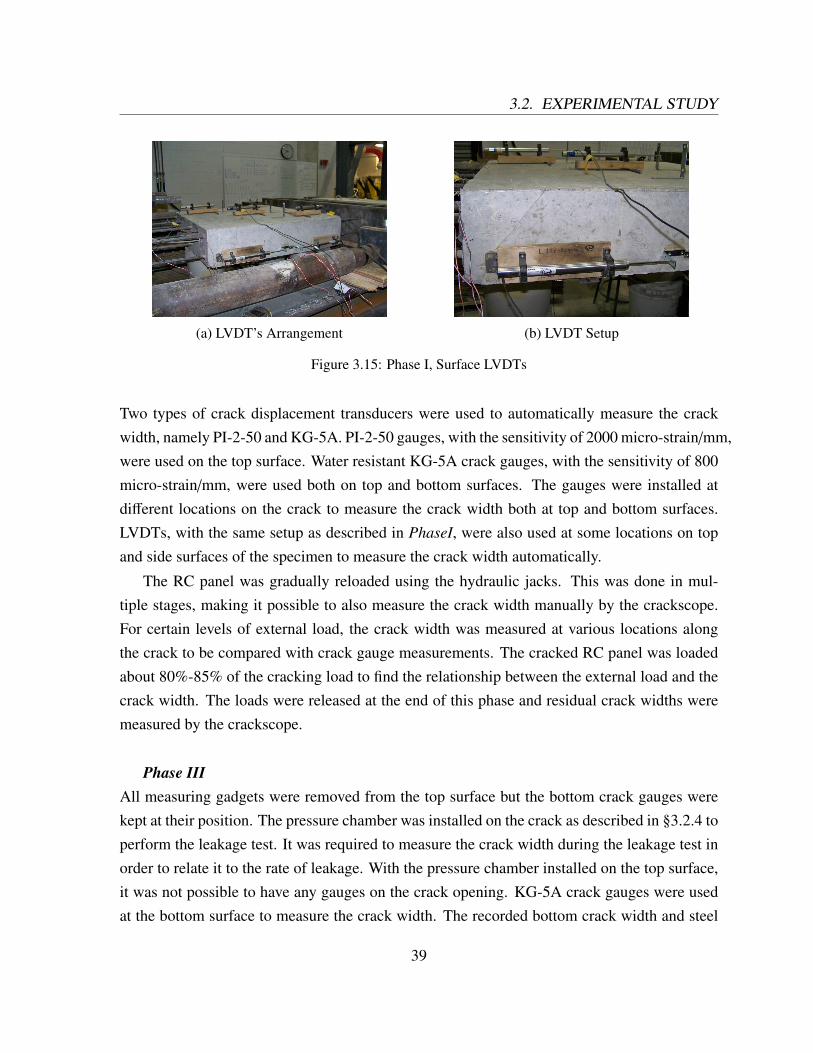
the displacement over the length that it was installed on. The displacement of the surface ofconcrete was very small prior to formation of a crack in comparison with the width of a majorcrack formed by the external load. Each LVDT was attached to a wooden board and placed ona roller to freely slide in the axis of direct tension force. The wooden board was fixed on thesurface by heavy duty construction adhesive at its end. The LVDT’s needle was pushed insideand kept in that position by an L-shaped steel angel. The LVDT sensors covered the wholelength of the RC panel as shown in Fig 3.15a. This configuration, as shown in Fig. 3.15b,allowed the recording of any cracks passing any section covered by the LVDT.
After the first crack was observed the width of the crack was measured at various locationsalong the crack, using a crackscope with a precision of 0.05 mm and a magnification of 25X.The hydraulic jacks were then released and the specimens were unloaded for installation ofcrack gauges. The remaining crack width was measured by the crackscope at various pointsalong the crack to be compared with values gained from LVDTs.
Phase II
38
3.2. EXPERIMENTAL STUDY
(a) LVDT’s Arrangement (b) LVDT Setup
Figure 3.15: Phase I, Surface LVDTs
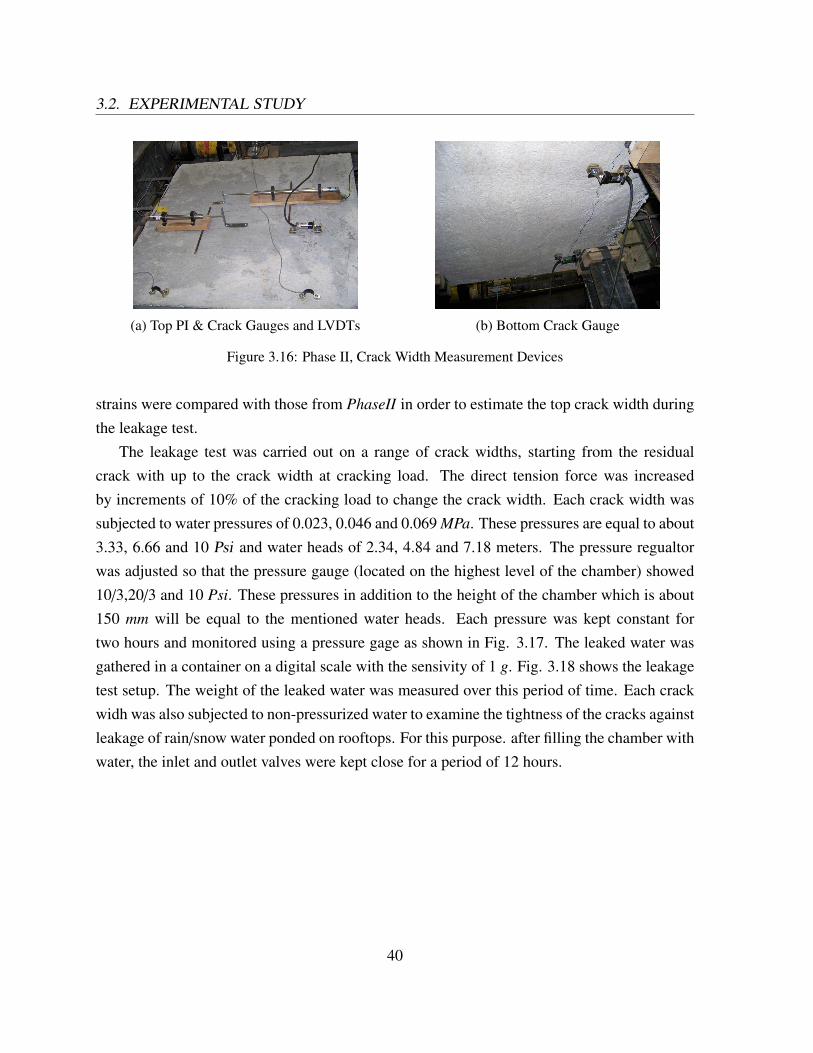
Two types of crack displacement transducers were used to automatically measure the crackwidth, namely PI-2-50 and KG-5A. PI-2-50 gauges, with the sensitivity of 2000 micro-strain/mm,were used on the top surface. Water resistant KG-5A crack gauges, with the sensitivity of 800micro-strain/mm, were used both on top and bottom surfaces. The gauges were installed atdifferent locations on the crack to measure the crack width both at top and bottom surfaces.LVDTs, with the same setup as described in PhaseI, were also used at some locations on topand side surfaces of the specimen to measure the crack width automatically.
The RC panel was gradually reloaded using the hydraulic jacks. This was done in mul-tiple stages, making it possible to also measure the crack width manually by the crackscope.For certain levels of external load, the crack width was measured at various locations alongthe crack to be compared with crack gauge measurements. The cracked RC panel was loadedabout 80%-85% of the cracking load to find the relationship between the external load and thecrack width. The loads were released at the end of this phase and residual crack widths weremeasured by the crackscope.
Phase IIIAll measuring gadgets were removed from the top surface but the bottom crack gauges werekept at their position. The pressure chamber was installed on the crack as described in §3.2.4 toperform the leakage test. It was required to measure the crack width during the leakage test inorder to relate it to the rate of leakage. With the pressure chamber installed on the top surface,it was not possible to have any gauges on the crack opening. KG-5A crack gauges were usedat the bottom surface to measure the crack width. The recorded bottom crack width and steel
39
3.2. EXPERIMENTAL STUDY
(a) Top PI & Crack Gauges and LVDTs (b) Bottom Crack Gauge
Figure 3.16: Phase II, Crack Width Measurement Devices
strains were compared with those from PhaseII in order to estimate the top crack width duringthe leakage test.
The leakage test was carried out on a range of crack widths, starting from the residualcrack with up to the crack width at cracking load. The direct tension force was increasedby increments of 10% of the cracking load to change the crack width. Each crack width wassubjected to water pressures of 0.023, 0.046 and 0.069 MPa. These pressures are equal to about3.33, 6.66 and 10 Psi and water heads of 2.34, 4.84 and 7.18 meters. The pressure regualtorwas adjusted so that the pressure gauge (located on the highest level of the chamber) showed10/3,20/3 and 10 Psi. These pressures in addition to the height of the chamber which is about150 mm will be equal to the mentioned water heads. Each pressure was kept constant fortwo hours and monitored using a pressure gage as shown in Fig. 3.17. The leaked water wasgathered in a container on a digital scale with the sensivity of 1 g. Fig. 3.18 shows the leakagetest setup. The weight of the leaked water was measured over this period of time. Each crackwidh was also subjected to non-pressurized water to examine the tightness of the cracks againstleakage of rain/snow water ponded on rooftops. For this purpose. after filling the chamber withwater, the inlet and outlet valves were kept close for a period of 12 hours.
40
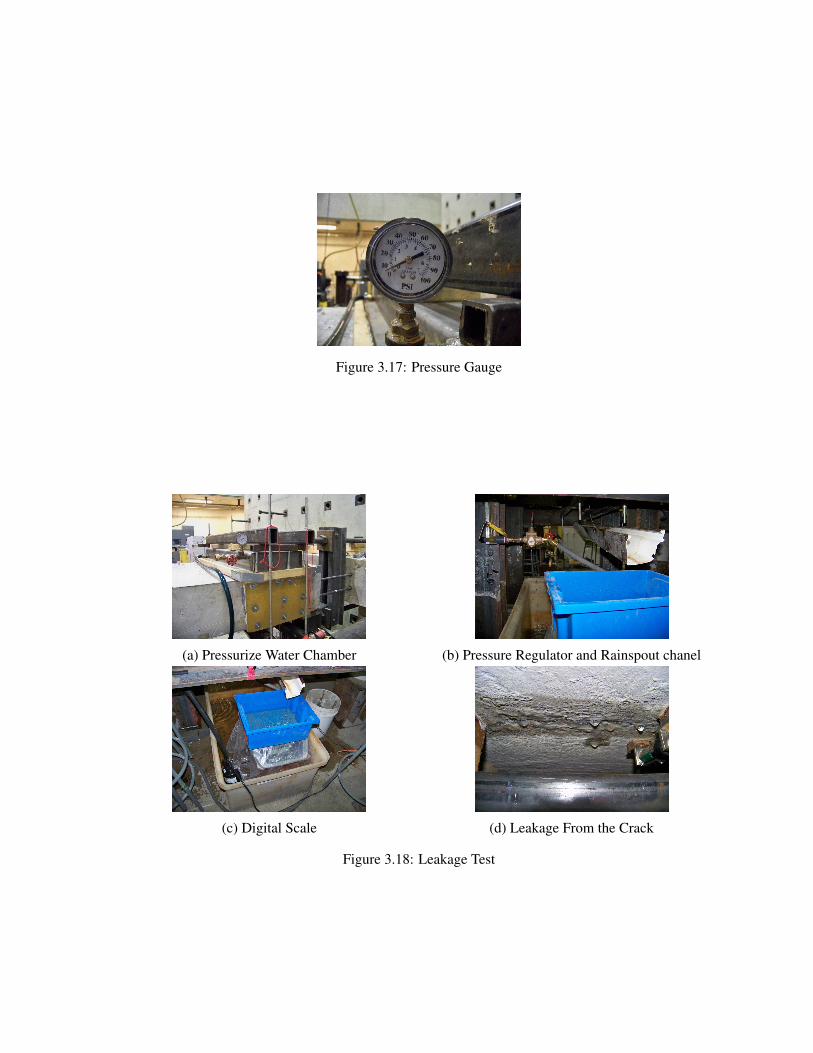
Figure 3.17: Pressure Gauge
(a) Pressurize Water Chamber (b) Pressure Regulator and Rainspout chanel
(c) Digital Scale (d) Leakage From the Crack
Figure 3.18: Leakage Test

Chapter 4
Test Results and Discussion
4.1 General
The collected data from the experiments are presented in this chapter with more focus on theleakage tests. Steel reinforcement strains, cracking loads, crack widths and the rate of leakagethrough cracks are reported. The data is analyzed and compared with theoretical models. Newfindings are discussed in this chapter as well. The data obtained from different phases of theexperiment are introduced for the three test specimens followed by analysis and interpretationof the data from Phase III.
4.2 Phase I
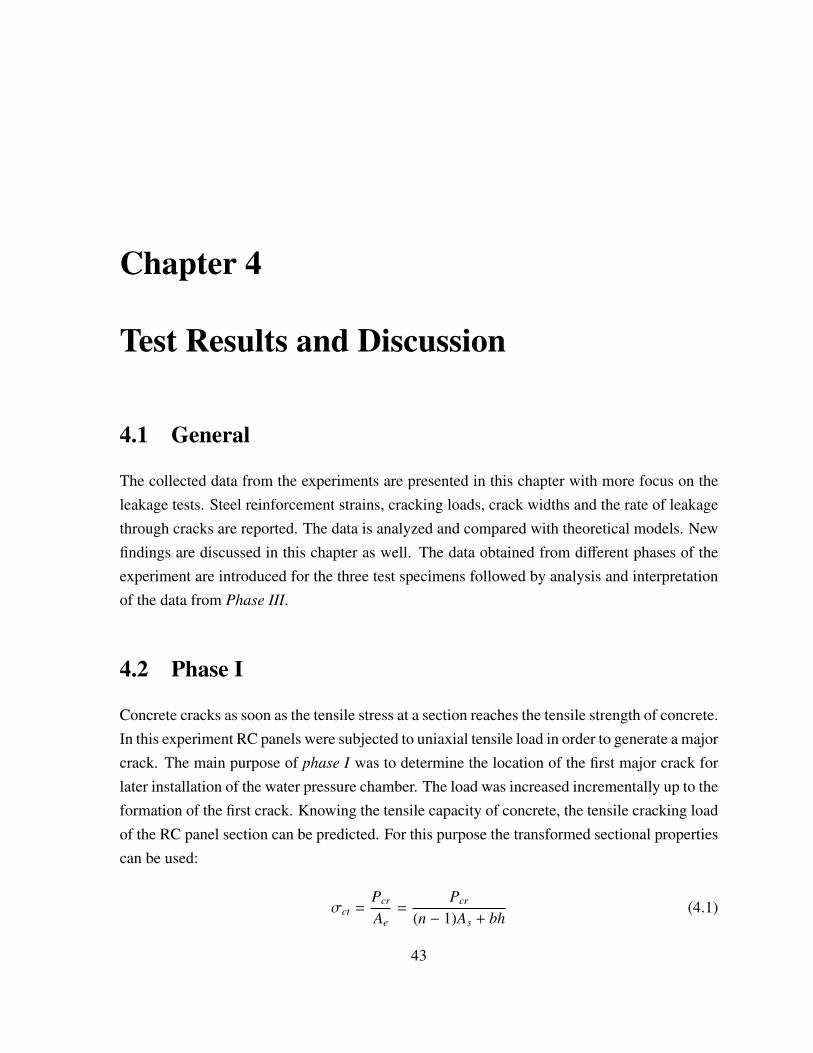
Concrete cracks as soon as the tensile stress at a section reaches the tensile strength of concrete.In this experiment RC panels were subjected to uniaxial tensile load in order to generate a majorcrack. The main purpose of phase I was to determine the location of the first major crack forlater installation of the water pressure chamber. The load was increased incrementally up to theformation of the first crack. Knowing the tensile capacity of concrete, the tensile cracking loadof the RC panel section can be predicted. For this purpose the transformed sectional propertiescan be used:
σct =Pcr
Ae=
Pcr
(n − 1)As + bh(4.1)
43
4.2. PHASE I
Where Pcr is the tensile load in which the specimen cracks, n = EsEc
is the modular ratio, As
is the area of the steel reinforcement and b and h are depth and width of the section respectively.Modulus of elasticity of concrete and steel are taken as calculated in §3.2.3: Ec = 30850.5MPa,Es = 200000MPa. The tensile strength of the concrete is taken as σct = 3.315MPa from thesplitting test. The cracking load is calculated for specimen S150 in detail. Table 4.1 summa-rizes the theoretical values calculated for the cracking load of each specimen.
Pcr = σct ∗ [(n − 1)As + bh] = 2.27 ∗ [( 20000032517 − 1) ∗ 4 ∗ 300 + 150 ∗ 1000] = 354 kN
Table 4.1: Theoretical Cracking Load
RC panel S150 S200 S250
h (mm) 150 200 250
ρ (%) 0.8 0.8 0.64
Pcr (kN) 354 472 586
Pyield (kN) 480 640 640
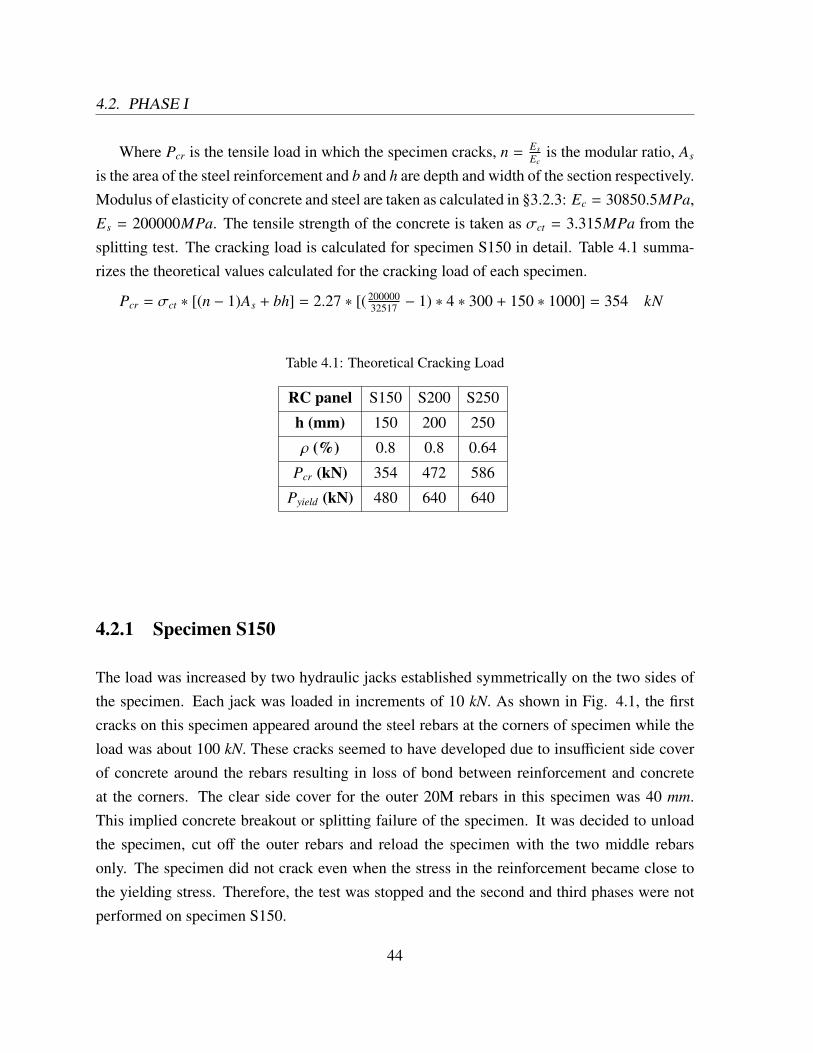
4.2.1 Specimen S150
The load was increased by two hydraulic jacks established symmetrically on the two sides ofthe specimen. Each jack was loaded in increments of 10 kN. As shown in Fig. 4.1, the firstcracks on this specimen appeared around the steel rebars at the corners of specimen while theload was about 100 kN. These cracks seemed to have developed due to insufficient side coverof concrete around the rebars resulting in loss of bond between reinforcement and concreteat the corners. The clear side cover for the outer 20M rebars in this specimen was 40 mm.This implied concrete breakout or splitting failure of the specimen. It was decided to unloadthe specimen, cut off the outer rebars and reload the specimen with the two middle rebarsonly. The specimen did not crack even when the stress in the reinforcement became close tothe yielding stress. Therefore, the test was stopped and the second and third phases were notperformed on specimen S150.
44
4.2. PHASE I
(a) (b)
Figure 4.1: Sample S150 Corner Cracks
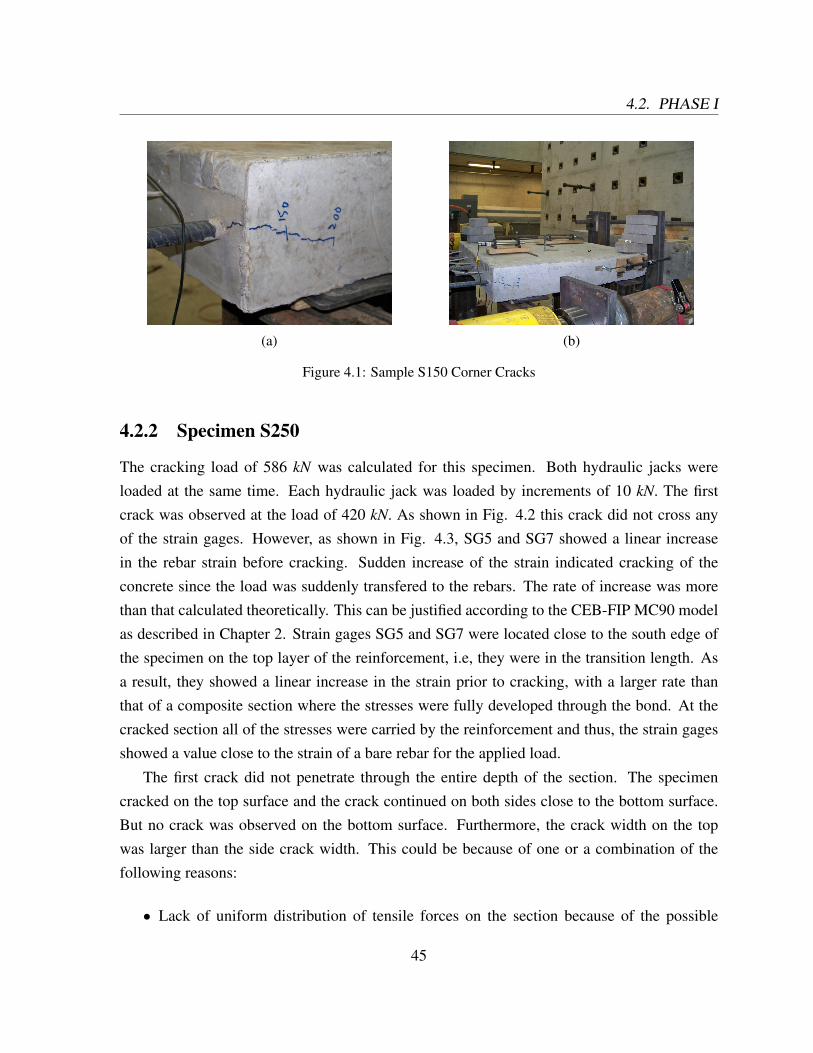
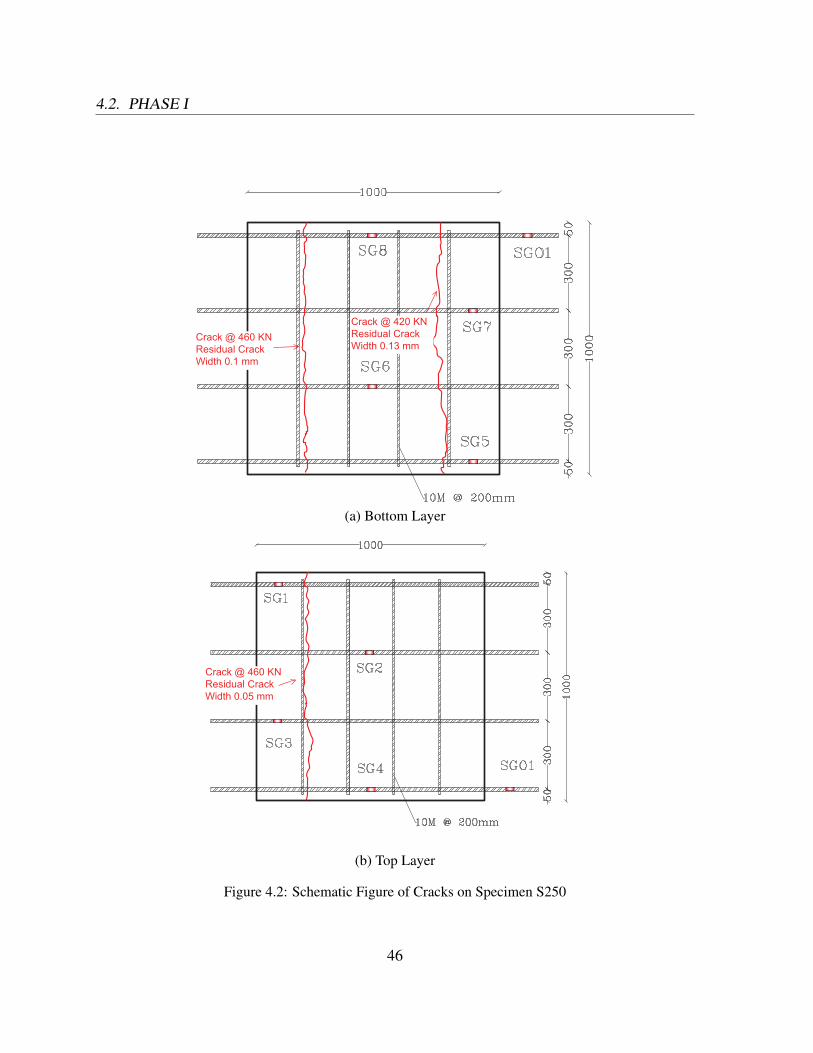
4.2.2 Specimen S250
The cracking load of 586 kN was calculated for this specimen. Both hydraulic jacks wereloaded at the same time. Each hydraulic jack was loaded by increments of 10 kN. The firstcrack was observed at the load of 420 kN. As shown in Fig. 4.2 this crack did not cross anyof the strain gages. However, as shown in Fig. 4.3, SG5 and SG7 showed a linear increasein the rebar strain before cracking. Sudden increase of the strain indicated cracking of theconcrete since the load was suddenly transfered to the rebars. The rate of increase was morethan that calculated theoretically. This can be justified according to the CEB-FIP MC90 modelas described in Chapter 2. Strain gages SG5 and SG7 were located close to the south edge ofthe specimen on the top layer of the reinforcement, i.e, they were in the transition length. Asa result, they showed a linear increase in the strain prior to cracking, with a larger rate thanthat of a composite section where the stresses were fully developed through the bond. At thecracked section all of the stresses were carried by the reinforcement and thus, the strain gagesshowed a value close to the strain of a bare rebar for the applied load.
The first crack did not penetrate through the entire depth of the section. The specimencracked on the top surface and the crack continued on both sides close to the bottom surface.But no crack was observed on the bottom surface. Furthermore, the crack width on the topwas larger than the side crack width. This could be because of one or a combination of thefollowing reasons:
• Lack of uniform distribution of tensile forces on the section because of the possible
45
4.2. PHASE I
Crack @ 460 KN Residual Crack Width 0.1 mm
Crack @ 420 KN Residual Crack Width 0.13 mm
(a) Bottom Layer
Crack @ 460 KNResidual Crack Width 0.05 mm
(b) Top Layer
Figure 4.2: Schematic Figure of Cracks on Specimen S250
46
4.2. PHASE I
2500
2000 SGO1
1500με)
SGO2
SG1
SG3
ebar Strain (μ
SG5
SG6
1000Re SG7
SG8
500
00 100 200 300 400 500 600
Tensile Load (KN)
Figure 4.3: Rebar Strain-Tensile Load, S250, Phase I
eccentricity of the longitudinal reinforcement.
• Due to uneven distribution of the forces because of the eccentricity of the hydraulic jacksfrom the center line between the two layers of reinforcement.
• Friction at the roller supports located at the four corners of the specimen causing thelower levels of the specimen to have lower tensile stresses.
• Deformation of the two end surfaces of the distribution RC beams as a result of previoustests since they were not perfectly level. This might have caused uneven distribution ofthe tensile force in rebars.
The load was then increased in order to allow the crack penetrate the entire depth of thesection. At the load of 460 kN the second crack appeared on the north side of the specimen,
47
4.2. PHASE I
almost symmetric to the first one. The crack at the load of 460 kN penetrated the entire depth ofthe section and was best recorded by SG1 and SG3. Both cracks were also recorded by LVDTsattached to the top and side surfaces of the specimen. Each LVDT measured the displacementover the length that it was installed on. No significant change was observed in the LVDTreadings prior to cracking. At the cracking loads a sudden increase in the surface displacementwas recorded by the LVDTs, equal to the crack opening at the LVDT location. LVDTs TS andTN recorded the top crack width for the first and second cracks respectively. LVDTs SS andSN recorded the side crack widths of the cracks. Fig. 4.4 shows the displacements recordedby LVDTs. Crackscope readings also showed a more uniform crack width along the top andbottom surfaces in comparison with crack widths through the depth of the section. The topcrack widths ranged between 0.29 mm and 0.33 mm while the bottom crack widths were in therange of 0.1 mm to 0.12 mm. A noticeable crack width gradient was observed between the topand bottom crack widths which was due to uneven distribution of the forces in the section.
The sample was then unloaded and the residual crack widths were measured using thecrackscope in addition to the LVDT readings. The crackscope readings were in a good agree-ment with the LVDT measurements for the top and side crack widths. The residual crack widthon top surface was 0.12 mm and 0.1 mm for first and second crack respectively. An averageresidual bottom crack width of 0.05 mm was measured using the crackscope along the crackat the bottom surface. Figs. 4.5 and 4.6 show the LVDT readings for loading/unloading cycleversus the tensile load.
4.2.3 Specimen S200
Some of the strain gages in this specimen were damaged or showed a high fluctuation at thebeginning of the test. The predicted cracking load for specimen S200 was 472 kN. The tensileload was increased increments of 10 kN for each jack. The first crack was observed at the loadof 316 kN as shown schematically on Fig. 4.7. This crack did not penetrate through the fulldepth of the section. The large difference between theoretical and experimental values can bedue to possible eccentricity in the specimen or setup causing a bending moment in additionto the tensile forces. The load was then increased and at the load of 342 kN the second crackappeared almost symmetric to the first one. This crack penetrated the full depth of the section.The LVDTs also recorded both cracks as shown in Fig. 4.8. The sudden increase in the LVDTreadings indicated cracking of the concrete at the location of the LVDT. The corresponding
48
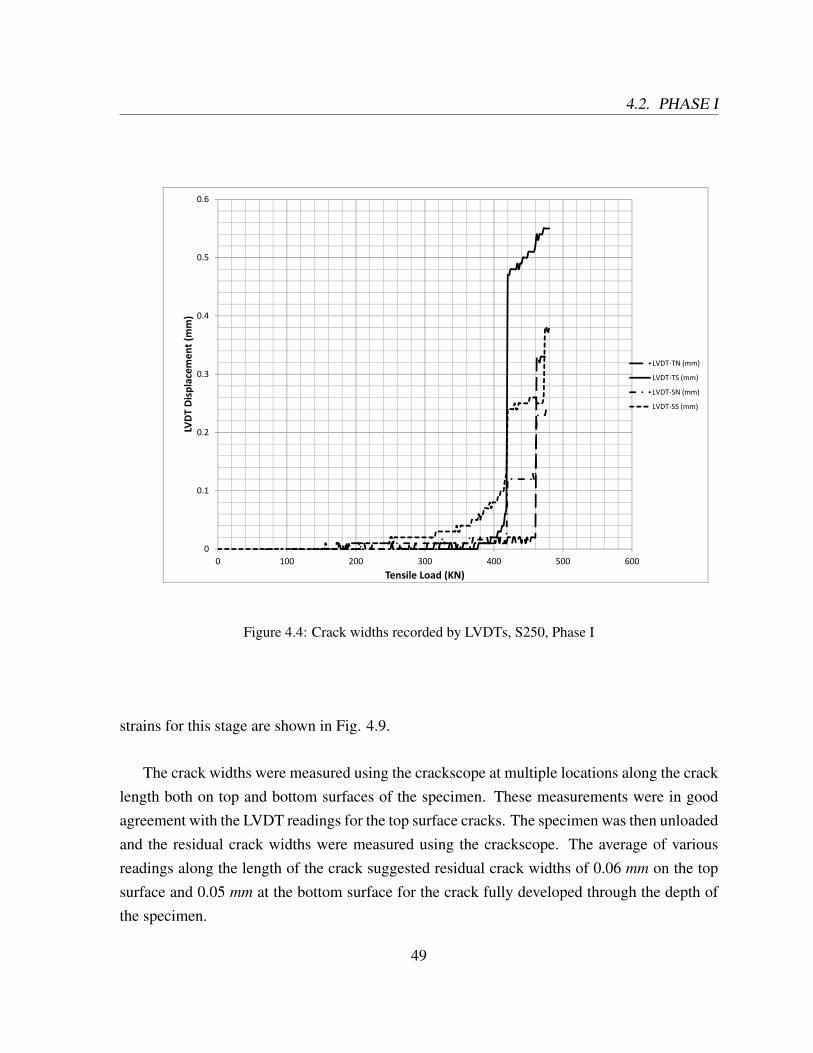
4.2. PHASE I
0.6
0.5
0.4
ent (mm)
0.3
T Displacem
e
LVDT‐TN (mm)
LVDT‐TS (mm)
LVDT‐SN (mm)
LVDT‐SS (mm)
0.2LVDT
0.1
00 100 200 300 400 500 600
Tensile Load (KN)
Figure 4.4: Crack widths recorded by LVDTs, S250, Phase I
strains for this stage are shown in Fig. 4.9.
The crack widths were measured using the crackscope at multiple locations along the cracklength both on top and bottom surfaces of the specimen. These measurements were in goodagreement with the LVDT readings for the top surface cracks. The specimen was then unloadedand the residual crack widths were measured using the crackscope. The average of variousreadings along the length of the crack suggested residual crack widths of 0.06 mm on the topsurface and 0.05 mm at the bottom surface for the crack fully developed through the depth ofthe specimen.
49
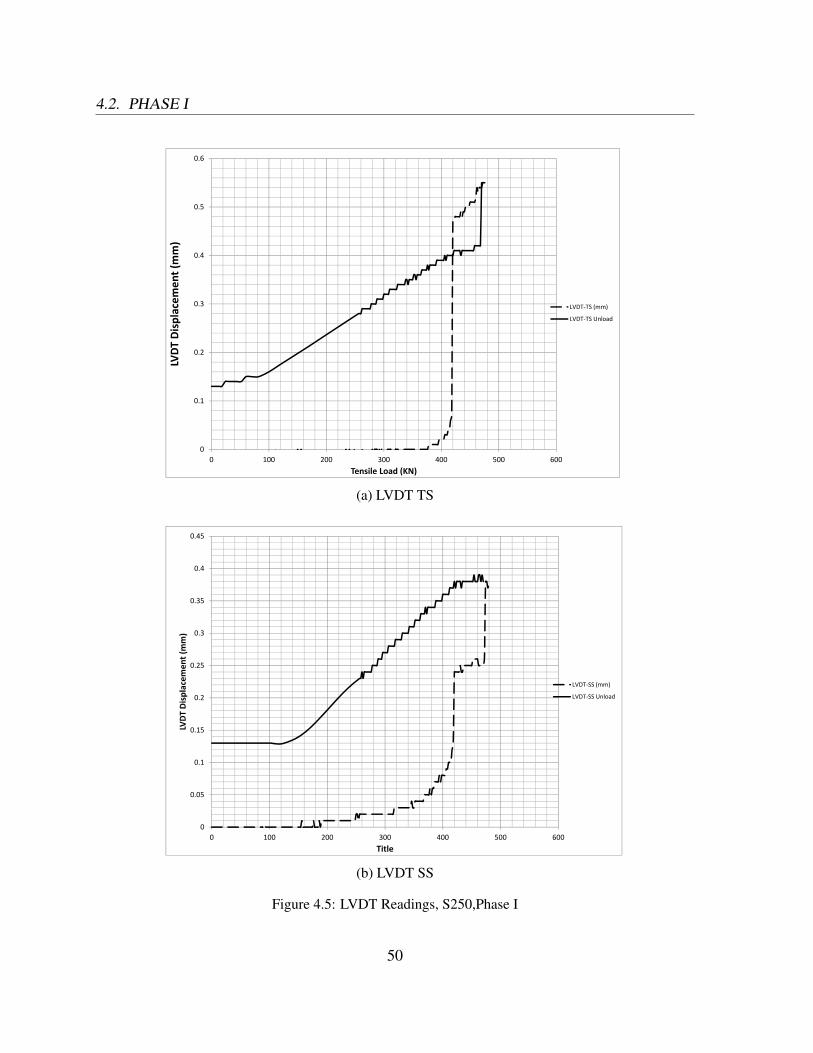
4.2. PHASE I
0.6
0.5
0.4
ent (mm)
0.3
Displacem
LVDT‐TS (mm)
LVDT‐TS Unload
0.2
LVDT
D
0.1
00 100 200 300 400 500 600
Tensile Load (KN)
(a) LVDT TS
0.4
0.45
0.35
0 25
0.3
ent (mm)
0.2
0.25
T Displacem
e
LVDT‐SS (mm)
LVDT‐SS Unload
0 1
0.15LVDT
0.05
0.1
00 100 200 300 400 500 600
Title
(b) LVDT SS
Figure 4.5: LVDT Readings, S250,Phase I
50
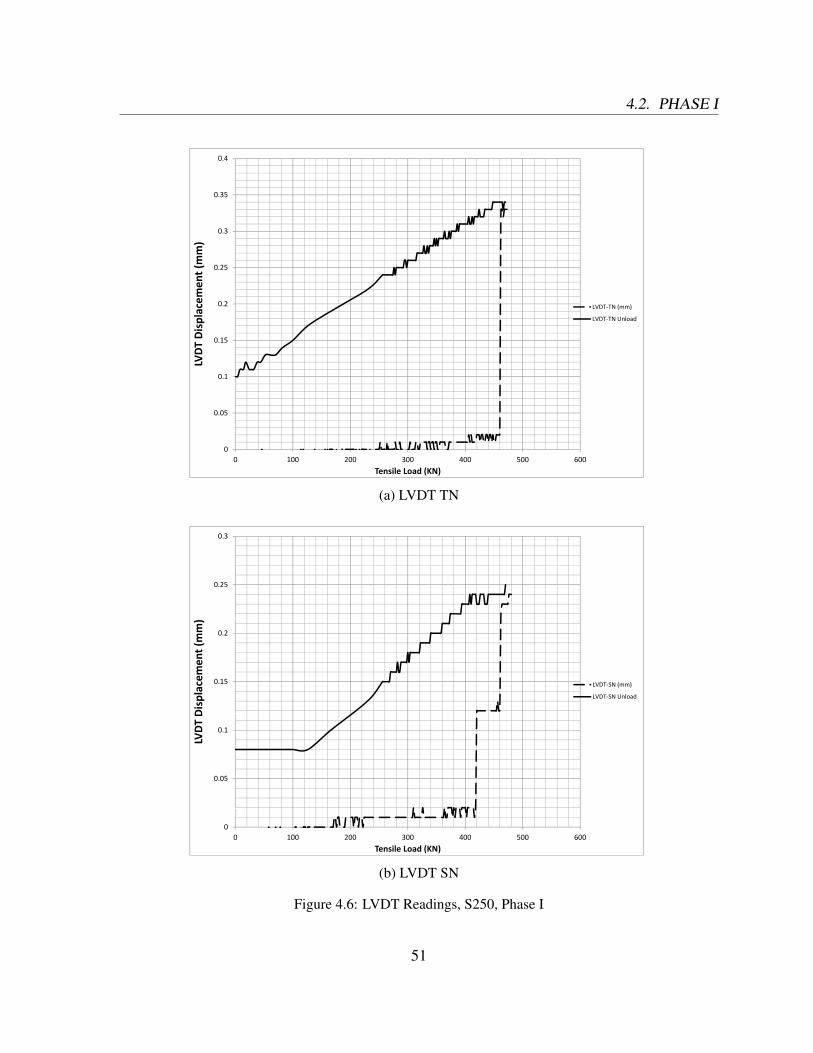
4.2. PHASE I
0 35
0.4
0.3
0.35
0.25
ent (mm)
0.2
Displacem
LVDT‐TN (mm)
LVDT‐TN Unload
0.1
0.15
LVDT
D
0.05
00 100 200 300 400 500 600
Tensile Load (KN)
(a) LVDT TN
0.3
0.25
0.2
ent (mm)
0.15
Displacem
LVDT‐SN (mm)
LVDT‐SN Unload
0.1
LVDT
D
0.05
00 100 200 300 400 500 600
Tensile Load (KN)
(b) LVDT SN
Figure 4.6: LVDT Readings, S250, Phase I
51
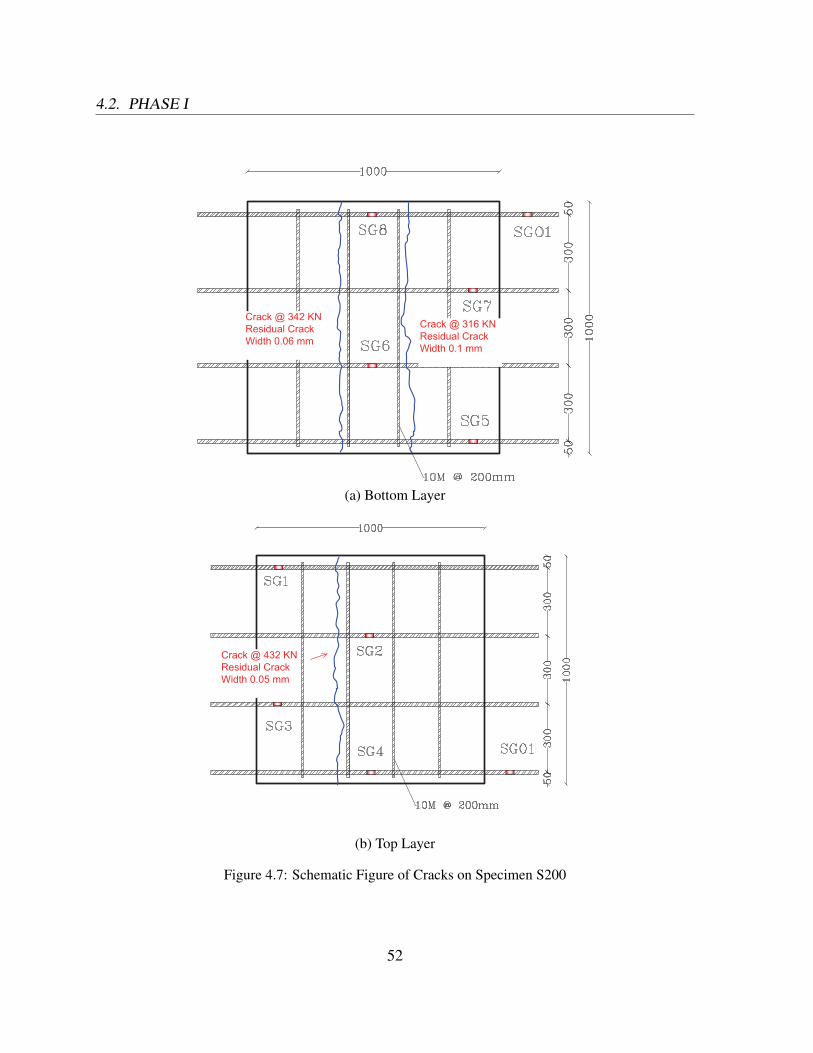
4.2. PHASE I
Crack @ 342 KN Residual Crack Width 0.06 mm
Crack @ 316 KN Residual Crack Width 0.1 mm
(a) Bottom Layer
Crack @ 432 KN Residual Crack Width 0.05 mm
(b) Top Layer
Figure 4.7: Schematic Figure of Cracks on Specimen S200
52
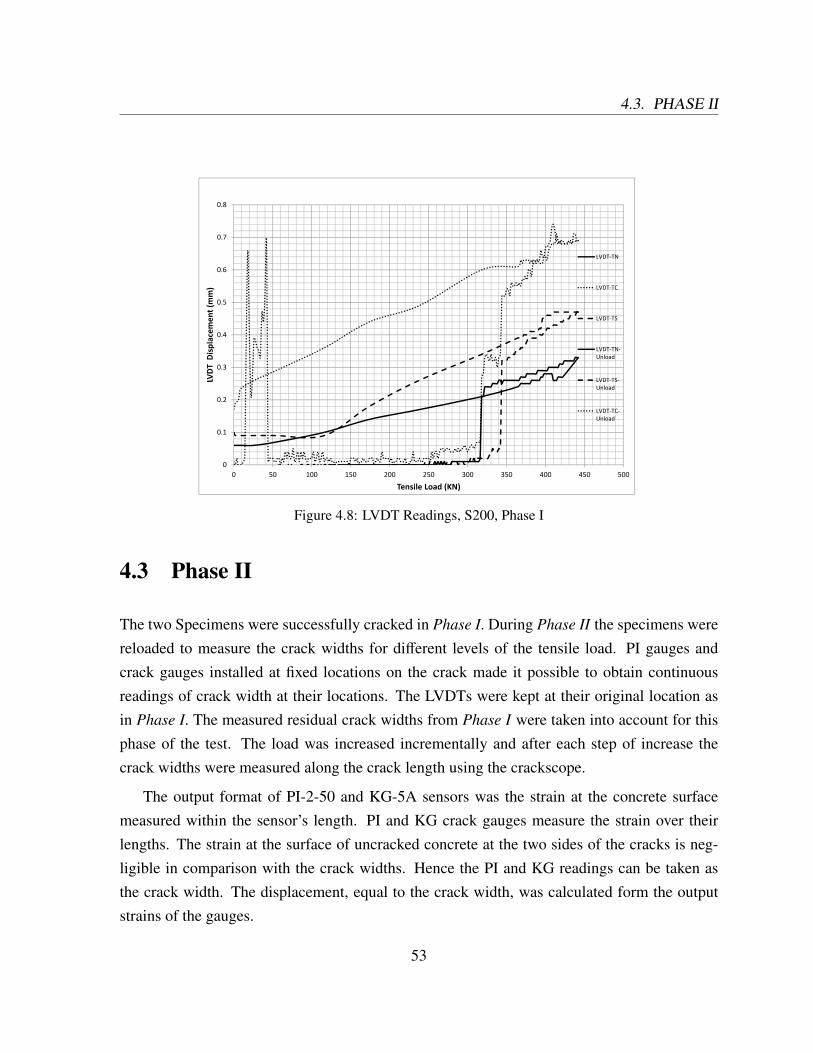
4.3. PHASE II
0.8
0.7
LVDT‐TN
0.5
0.6
t (mm) LVDT‐TC
0.4
Displacem
ent
LVDT‐TS
LVDT‐TN‐Unload
0.2
0.3
LVDT
D Unload
LVDT‐TS‐Unload
0.1
LVDT‐TC‐Unload
00 50 100 150 200 250 300 350 400 450 500
Tensile Load (KN)
Figure 4.8: LVDT Readings, S200, Phase I
4.3 Phase II
The two Specimens were successfully cracked in Phase I. During Phase II the specimens werereloaded to measure the crack widths for different levels of the tensile load. PI gauges andcrack gauges installed at fixed locations on the crack made it possible to obtain continuousreadings of crack width at their locations. The LVDTs were kept at their original location asin Phase I. The measured residual crack widths from Phase I were taken into account for thisphase of the test. The load was increased incrementally and after each step of increase thecrack widths were measured along the crack length using the crackscope.
The output format of PI-2-50 and KG-5A sensors was the strain at the concrete surfacemeasured within the sensor’s length. PI and KG crack gauges measure the strain over theirlengths. The strain at the surface of uncracked concrete at the two sides of the cracks is neg-ligible in comparison with the crack widths. Hence the PI and KG readings can be taken asthe crack width. The displacement, equal to the crack width, was calculated form the outputstrains of the gauges.
53
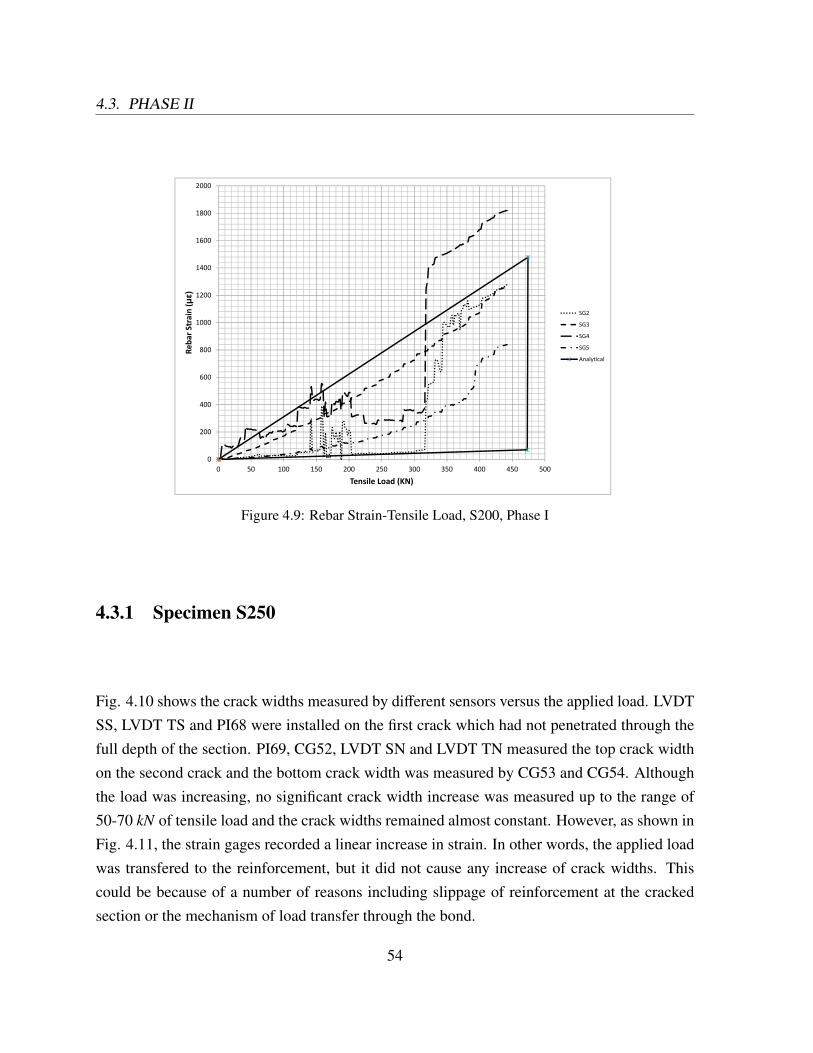
4.3. PHASE II
1800
2000
1400
1600
1200
1400
n (με)
SG2
800
1000
Reba
r Strain SG2
SG3
SG4
SG5
A l ti l
400
600
Analytical
200
400
00 50 100 150 200 250 300 350 400 450 500
Tensile Load (KN)
Figure 4.9: Rebar Strain-Tensile Load, S200, Phase I
4.3.1 Specimen S250
Fig. 4.10 shows the crack widths measured by different sensors versus the applied load. LVDTSS, LVDT TS and PI68 were installed on the first crack which had not penetrated through thefull depth of the section. PI69, CG52, LVDT SN and LVDT TN measured the top crack widthon the second crack and the bottom crack width was measured by CG53 and CG54. Althoughthe load was increasing, no significant crack width increase was measured up to the range of50-70 kN of tensile load and the crack widths remained almost constant. However, as shown inFig. 4.11, the strain gages recorded a linear increase in strain. In other words, the applied loadwas transfered to the reinforcement, but it did not cause any increase of crack widths. Thiscould be because of a number of reasons including slippage of reinforcement at the crackedsection or the mechanism of load transfer through the bond.
54
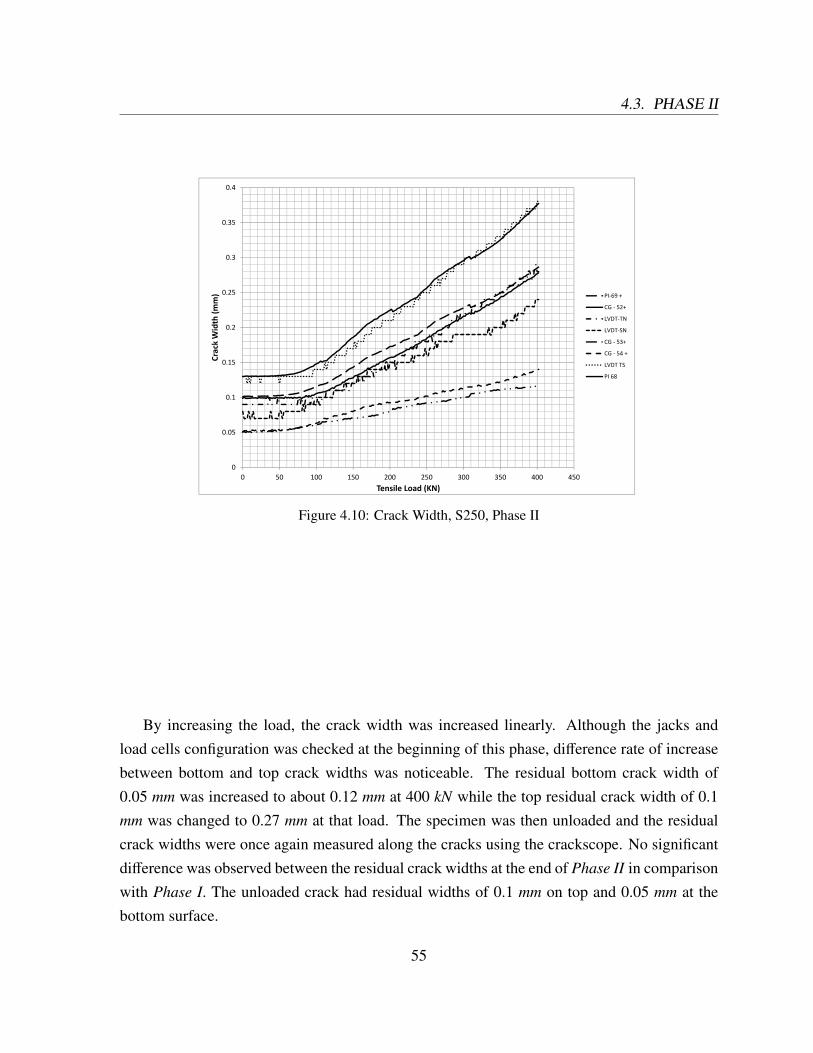
4.3. PHASE II
0 35
0.4
0.3
0.35
0.25
(mm) PI‐69 +
CG ‐ 52+
0.2
Crack Width (
LVDT‐TN
LVDT‐SN
CG ‐ 53+
CG ‐ 54 +
0.1
0.15C
LVDT TS
PI 68
0.05
00 50 100 150 200 250 300 350 400 450
Tensile Load (KN)
Figure 4.10: Crack Width, S250, Phase II
By increasing the load, the crack width was increased linearly. Although the jacks andload cells configuration was checked at the beginning of this phase, difference rate of increasebetween bottom and top crack widths was noticeable. The residual bottom crack width of0.05 mm was increased to about 0.12 mm at 400 kN while the top residual crack width of 0.1mm was changed to 0.27 mm at that load. The specimen was then unloaded and the residualcrack widths were once again measured along the cracks using the crackscope. No significantdifference was observed between the residual crack widths at the end of Phase II in comparisonwith Phase I. The unloaded crack had residual widths of 0.1 mm on top and 0.05 mm at thebottom surface.
55
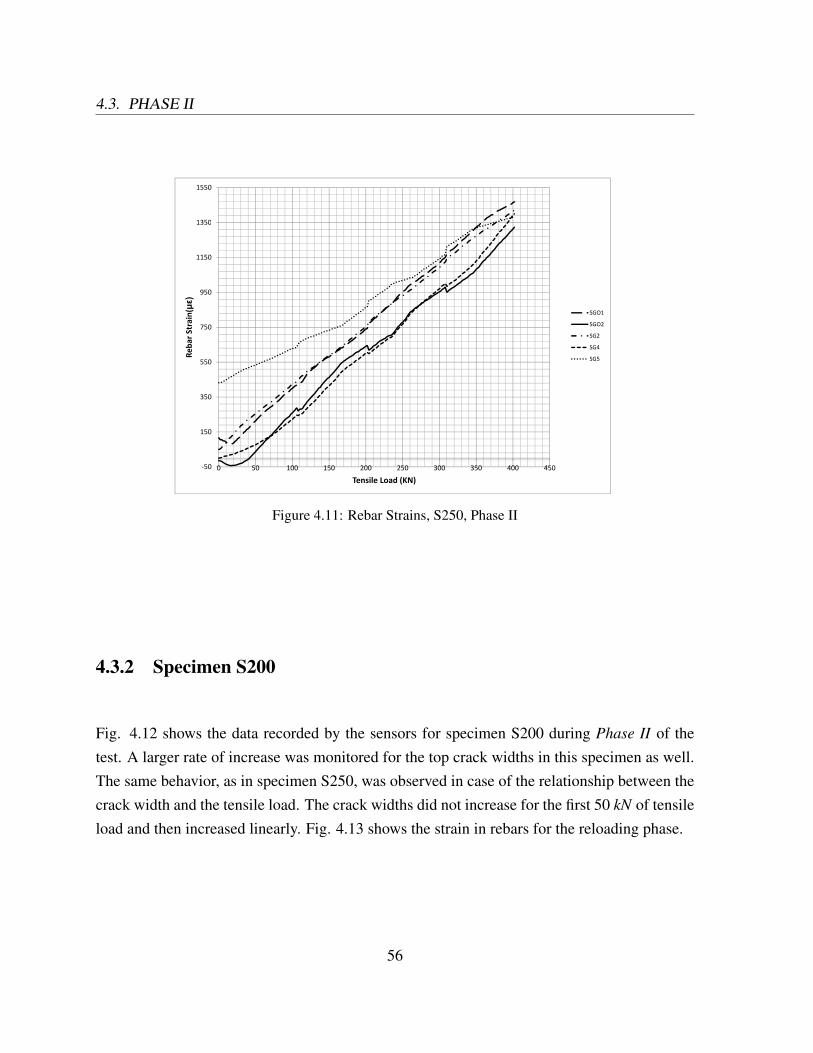
4.3. PHASE II
1350
1550
1150
1350
950
(με)
SGO1
750
Reba
r Strain SGO1
SGO2
SG2
SG4
SG5
350
550 SG5
150
‐50 0 50 100 150 200 250 300 350 400 450
Tensile Load (KN)
Figure 4.11: Rebar Strains, S250, Phase II
4.3.2 Specimen S200
Fig. 4.12 shows the data recorded by the sensors for specimen S200 during Phase II of thetest. A larger rate of increase was monitored for the top crack widths in this specimen as well.The same behavior, as in specimen S250, was observed in case of the relationship between thecrack width and the tensile load. The crack widths did not increase for the first 50 kN of tensileload and then increased linearly. Fig. 4.13 shows the strain in rebars for the reloading phase.
56
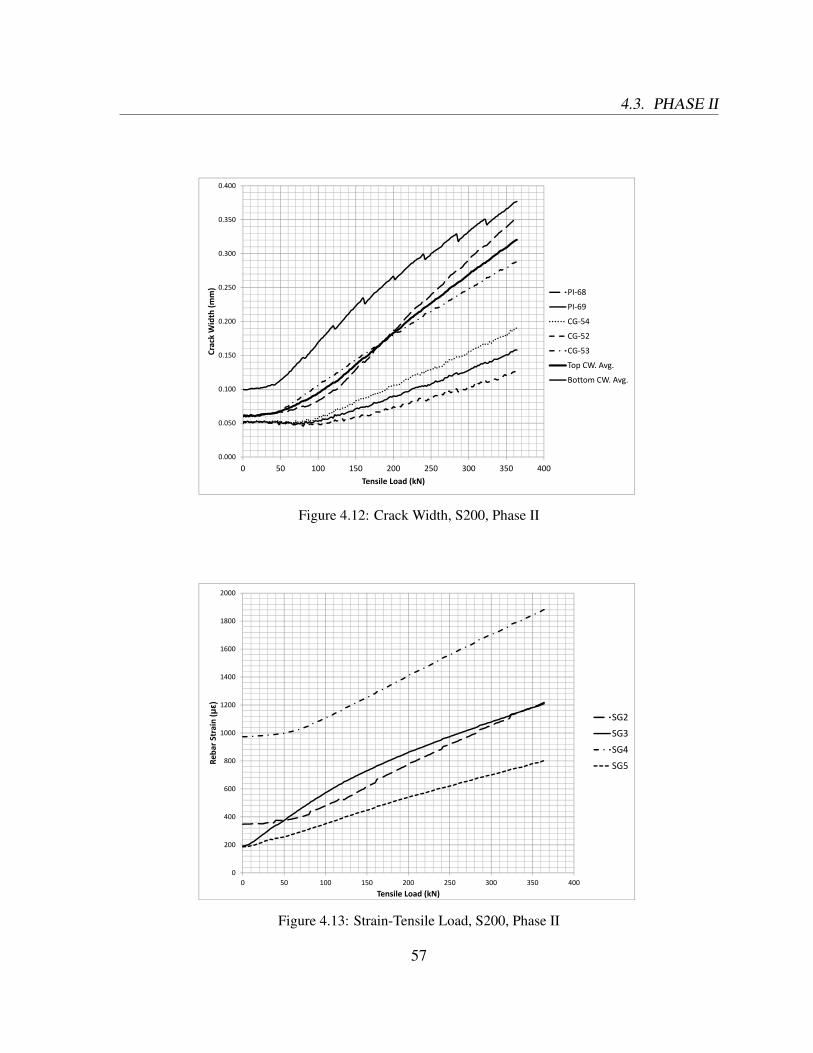
4.3. PHASE II
0 350
0.400
0.300
0.350
0.250
h (m
m) PI‐68
PI‐69
0.150
0.200
Crack Width
CG‐54
CG‐52
CG‐53
0.100
Top CW. Avg.
Bottom CW. Avg.
0.050
0.000
0 50 100 150 200 250 300 350 400Tensile Load (kN)
Figure 4.12: Crack Width, S200, Phase II
1800
2000
1600
1200
1400
(με)
SG2
800
1000
Reba
r Strain SG2
SG3
SG4
SG5
600
R SG5
200
400
00 50 100 150 200 250 300 350 400
Tensile Load (kN)
Figure 4.13: Strain-Tensile Load, S200, Phase II
57
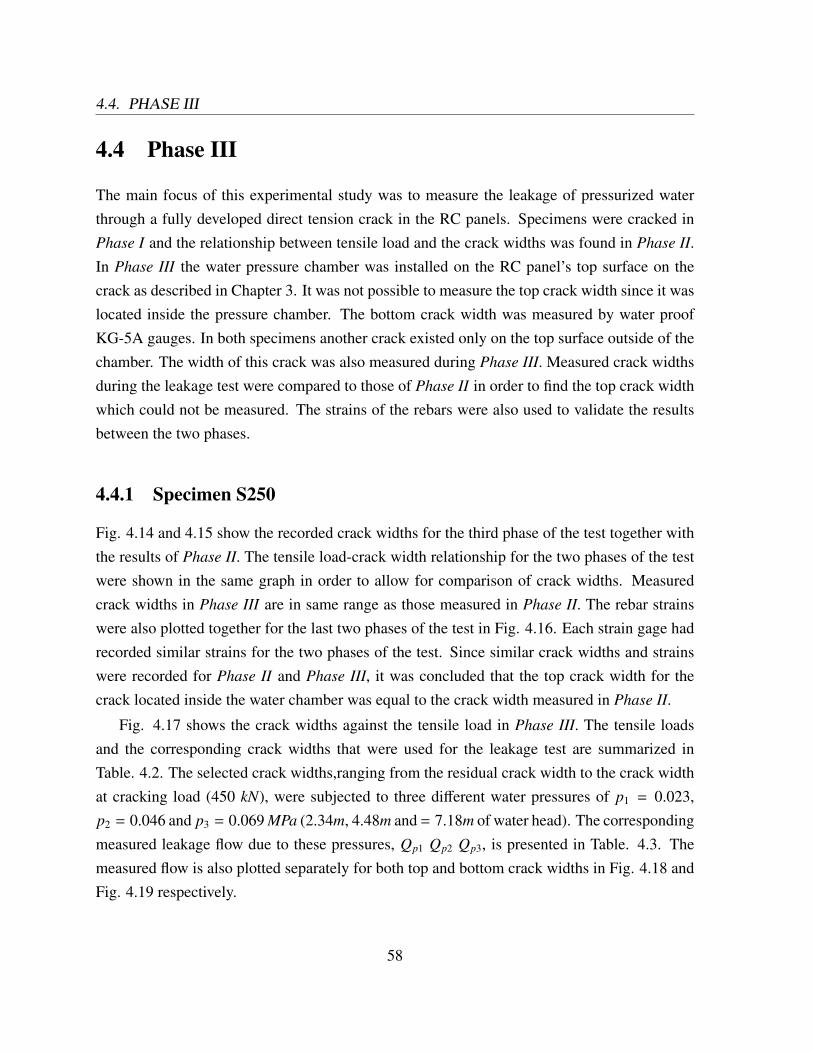
4.4. PHASE III
4.4 Phase III
The main focus of this experimental study was to measure the leakage of pressurized waterthrough a fully developed direct tension crack in the RC panels. Specimens were cracked inPhase I and the relationship between tensile load and the crack widths was found in Phase II.In Phase III the water pressure chamber was installed on the RC panel’s top surface on thecrack as described in Chapter 3. It was not possible to measure the top crack width since it waslocated inside the pressure chamber. The bottom crack width was measured by water proofKG-5A gauges. In both specimens another crack existed only on the top surface outside of thechamber. The width of this crack was also measured during Phase III. Measured crack widthsduring the leakage test were compared to those of Phase II in order to find the top crack widthwhich could not be measured. The strains of the rebars were also used to validate the resultsbetween the two phases.
4.4.1 Specimen S250
Fig. 4.14 and 4.15 show the recorded crack widths for the third phase of the test together withthe results of Phase II. The tensile load-crack width relationship for the two phases of the testwere shown in the same graph in order to allow for comparison of crack widths. Measuredcrack widths in Phase III are in same range as those measured in Phase II. The rebar strainswere also plotted together for the last two phases of the test in Fig. 4.16. Each strain gage hadrecorded similar strains for the two phases of the test. Since similar crack widths and strainswere recorded for Phase II and Phase III, it was concluded that the top crack width for thecrack located inside the water chamber was equal to the crack width measured in Phase II.
Fig. 4.17 shows the crack widths against the tensile load in Phase III. The tensile loadsand the corresponding crack widths that were used for the leakage test are summarized inTable. 4.2. The selected crack widths,ranging from the residual crack width to the crack widthat cracking load (450 kN), were subjected to three different water pressures of p1 = 0.023,p2 = 0.046 and p3 = 0.069 MPa (2.34m, 4.48m and = 7.18m of water head). The correspondingmeasured leakage flow due to these pressures, Qp1 Qp2 Qp3, is presented in Table. 4.3. Themeasured flow is also plotted separately for both top and bottom crack widths in Fig. 4.18 andFig. 4.19 respectively.
58
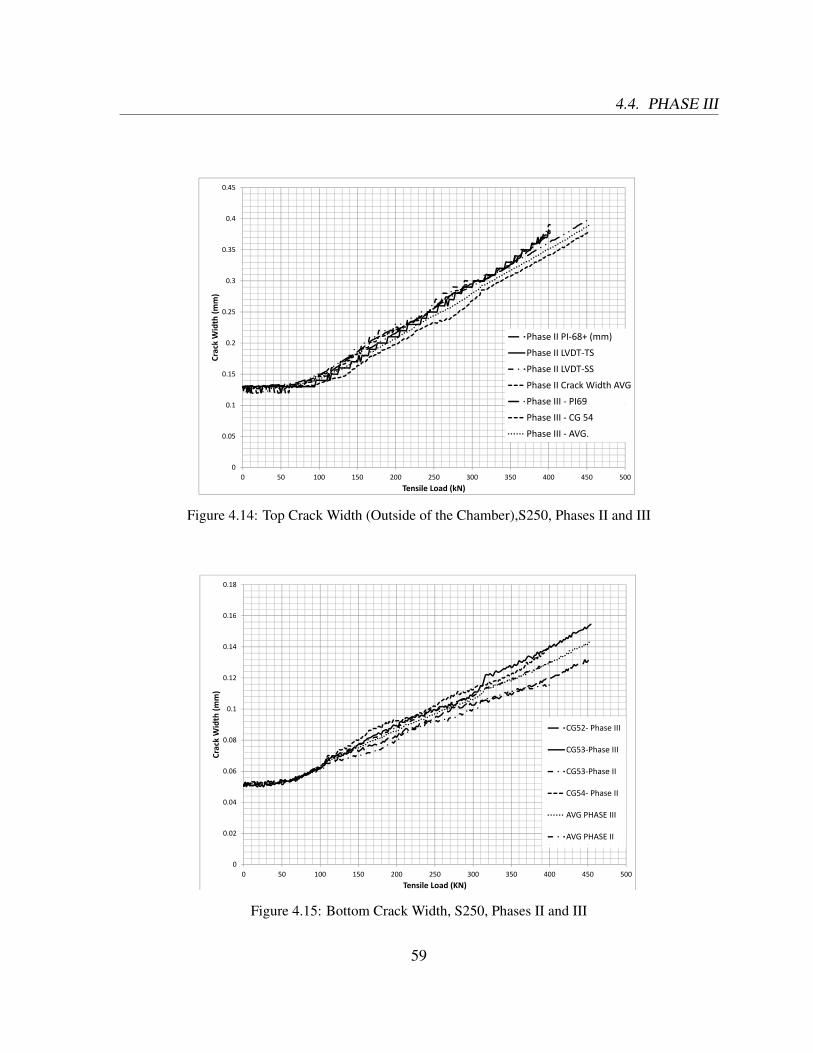
4.4. PHASE III
0.4
0.45
0.35
0 25
0.3
(mm)
0.2
0.25
Crack Width (
Phase II PI‐68+ (mm)
Phase II LVDT‐TS
0 1
0.15
C
Phase II LVDT‐SS
Phase II Crack Width AVG
Phase III ‐ PI69
0.05
0.1 Phase III PI69
Phase III ‐ CG 54
Phase III ‐ AVG.
00 50 100 150 200 250 300 350 400 450 500
Tensile Load (kN)
Figure 4.14: Top Crack Width (Outside of the Chamber),S250, Phases II and III
0 16
0.18
0.14
0.16
0 1
0.12
mm)
0.08
0.1
rack W
idth (
CG52‐ Phase III
CG53‐Phase III
0.06
C
CG53‐Phase II
CG54‐ Phase II
0.02
0.04
AVG PHASE III
AVG PHASE II
00 50 100 150 200 250 300 350 400 450 500
Tensile Load (KN)
Figure 4.15: Bottom Crack Width, S250, Phases II and III
59
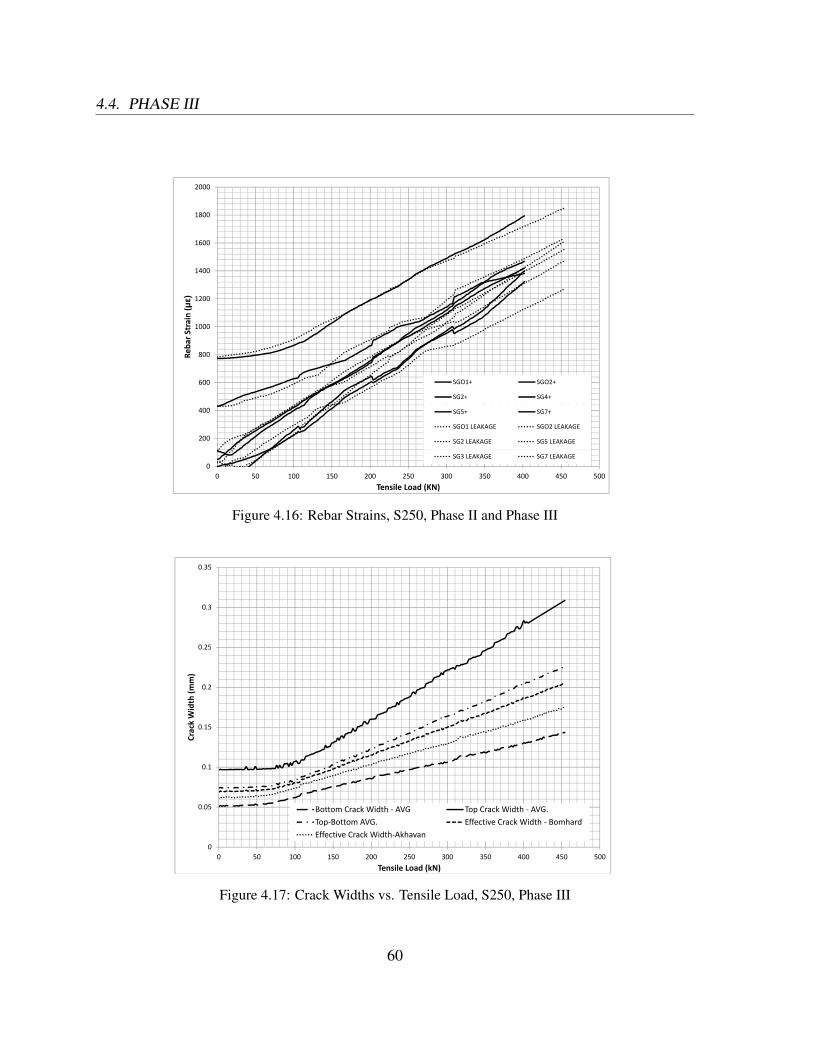
4.4. PHASE III
1800
2000
1600
1200
1400
(με)
800
1000
Reba
r Strain
600 SGO1+ SGO2+
SG2+ SG4+
200
400 SG5+ SG7+
SGO1 LEAKAGE SGO2 LEAKAGE
SG2 LEAKAGE SG5 LEAKAGE
00 50 100 150 200 250 300 350 400 450 500
Tensile Load (KN)
SG3 LEAKAGE SG7 LEAKAGE
Figure 4.16: Rebar Strains, S250, Phase II and Phase III
0.35
0 25
0.3
0.2
0.25
(mm)
0.15
Crack Width (
0.1
C
0.05 Bottom Crack Width ‐ AVG Top Crack Width ‐ AVG.Top‐Bottom AVG. Effective Crack Width ‐ Bomhard
00 50 100 150 200 250 300 350 400 450 500
Tensile Load (kN)
Effective Crack Width‐Akhavan
Figure 4.17: Crack Widths vs. Tensile Load, S250, Phase III
60
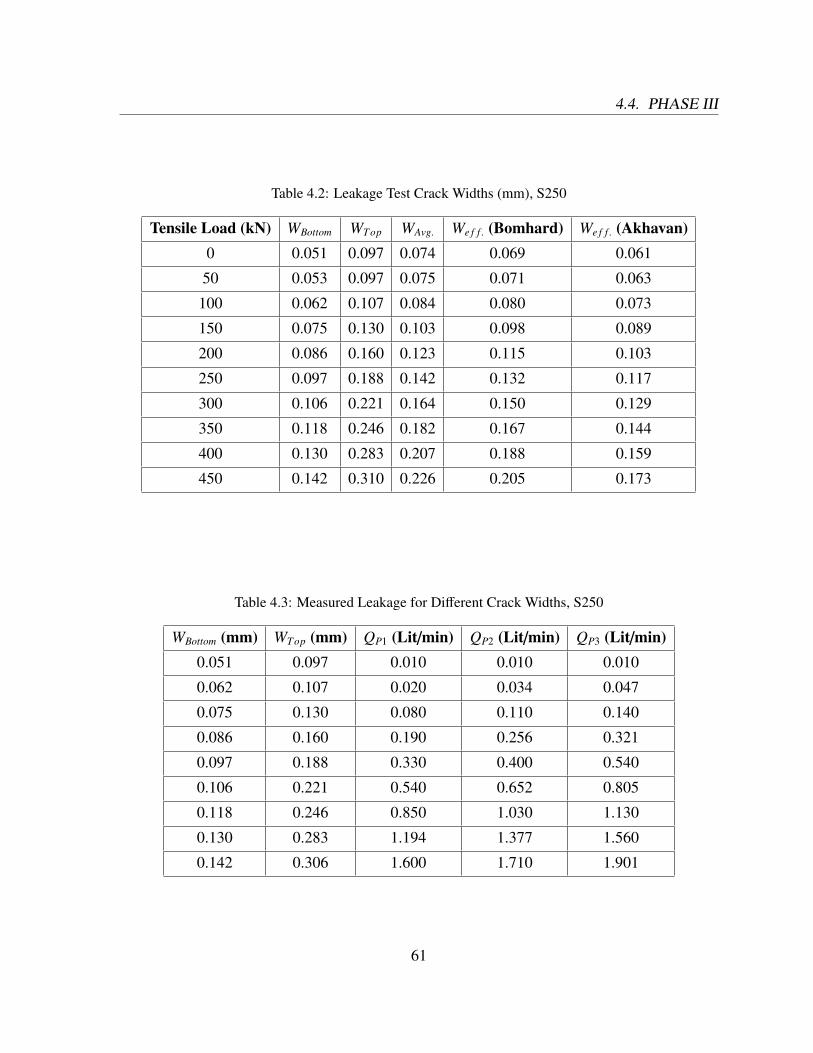
4.4. PHASE III
Table 4.2: Leakage Test Crack Widths (mm), S250
Tensile Load (kN) WBottom WTop WAvg. We f f . (Bomhard) We f f . (Akhavan)0 0.051 0.097 0.074 0.069 0.061
50 0.053 0.097 0.075 0.071 0.063
100 0.062 0.107 0.084 0.080 0.073
150 0.075 0.130 0.103 0.098 0.089
200 0.086 0.160 0.123 0.115 0.103
250 0.097 0.188 0.142 0.132 0.117
300 0.106 0.221 0.164 0.150 0.129
350 0.118 0.246 0.182 0.167 0.144
400 0.130 0.283 0.207 0.188 0.159
450 0.142 0.310 0.226 0.205 0.173
Table 4.3: Measured Leakage for Different Crack Widths, S250
WBottom (mm) WTop (mm) QP1 (Lit/min) QP2 (Lit/min) QP3 (Lit/min)0.051 0.097 0.010 0.010 0.010
0.062 0.107 0.020 0.034 0.047
0.075 0.130 0.080 0.110 0.140
0.086 0.160 0.190 0.256 0.321
0.097 0.188 0.330 0.400 0.540
0.106 0.221 0.540 0.652 0.805
0.118 0.246 0.850 1.030 1.130
0.130 0.283 1.194 1.377 1.560
0.142 0.306 1.600 1.710 1.901
61
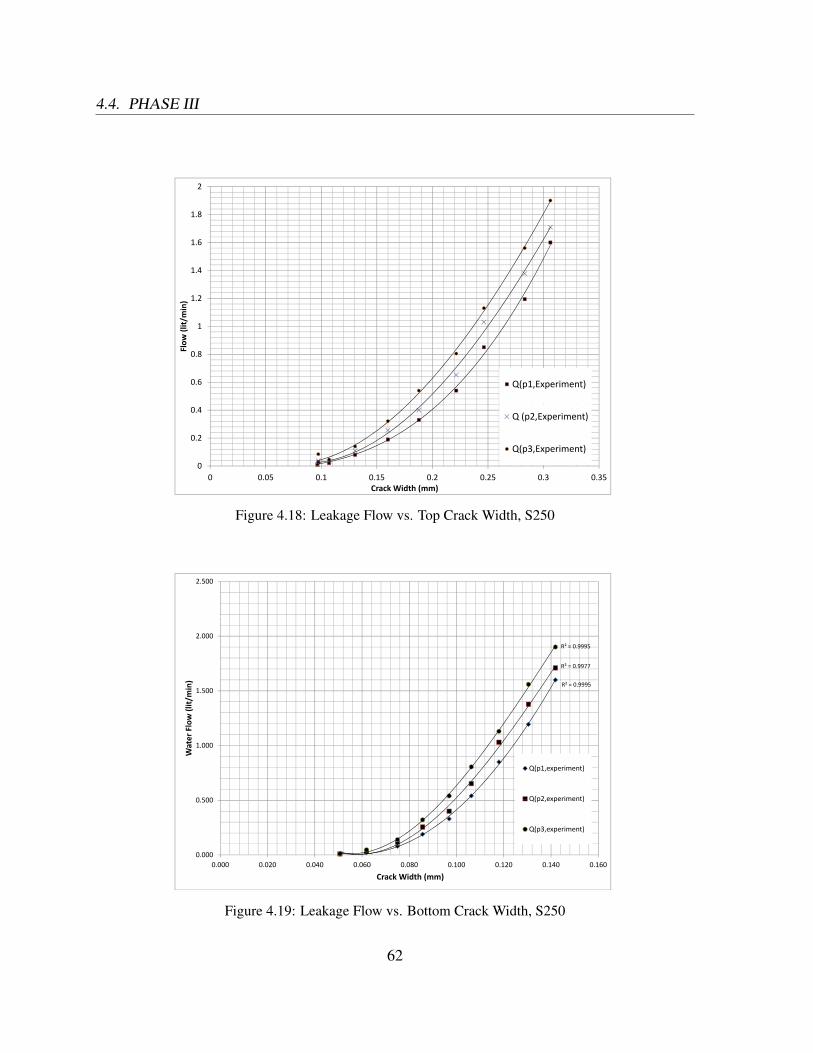
4.4. PHASE III
1.8
2
1.6
1.2
1.4
min)
0.8
1
Flow
(lit/
m
0.6 Q(p1,Experiment)
0.2
0.4Q (p2,Experiment)
Q(p3 Experiment)
00 0.05 0.1 0.15 0.2 0.25 0.3 0.35
Crack Width (mm)
Q(p3,Experiment)
Figure 4.18: Leakage Flow vs. Top Crack Width, S250
2.500
R² = 0.99952.000
R² = 0.9995
R² = 0.9977
1.500
lit/m
in)
1.000
Water Flow (l
0 500
W
Q(p1,experiment)
Q(p2 experiment)0.500 Q(p2,experiment)
Q(p3,experiment)
0.0000.000 0.020 0.040 0.060 0.080 0.100 0.120 0.140 0.160
Crack Width (mm)
Figure 4.19: Leakage Flow vs. Bottom Crack Width, S250
62
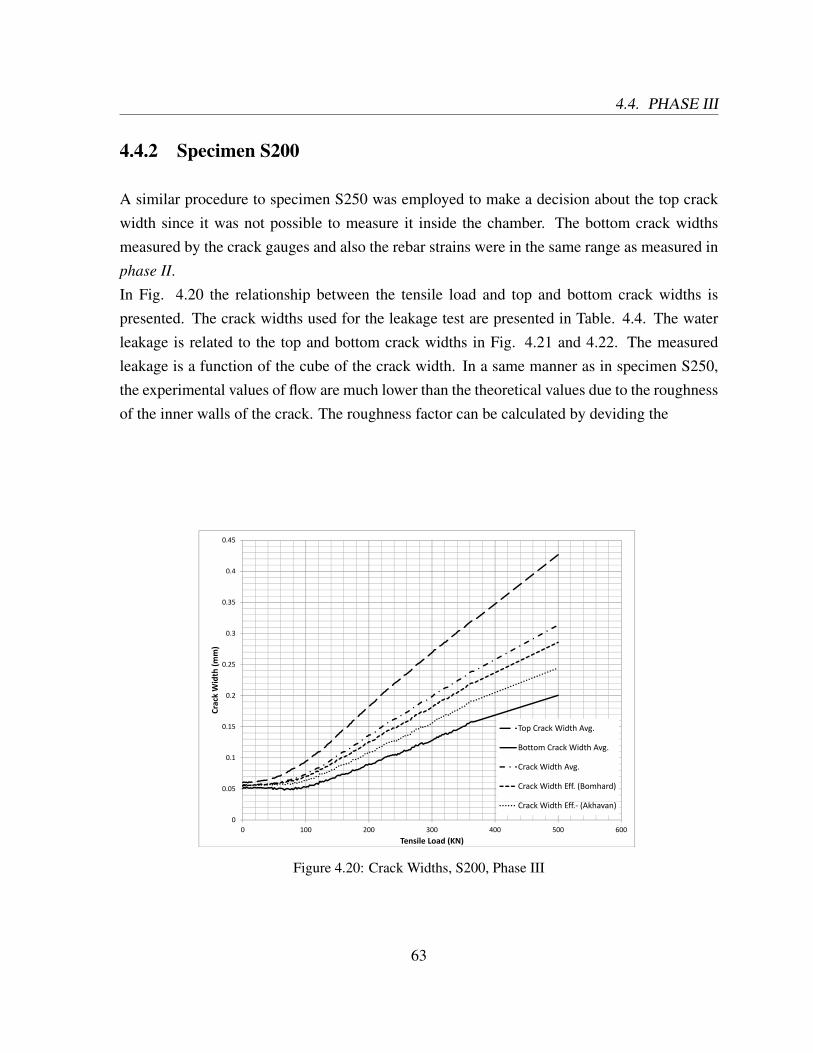
4.4. PHASE III
4.4.2 Specimen S200
A similar procedure to specimen S250 was employed to make a decision about the top crackwidth since it was not possible to measure it inside the chamber. The bottom crack widthsmeasured by the crack gauges and also the rebar strains were in the same range as measured inphase II.In Fig. 4.20 the relationship between the tensile load and top and bottom crack widths ispresented. The crack widths used for the leakage test are presented in Table. 4.4. The waterleakage is related to the top and bottom crack widths in Fig. 4.21 and 4.22. The measuredleakage is a function of the cube of the crack width. In a same manner as in specimen S250,the experimental values of flow are much lower than the theoretical values due to the roughnessof the inner walls of the crack. The roughness factor can be calculated by deviding the
0.4
0.45
0.35
0 25
0.3
(mm)
0.2
0.25
Crack Width (
0 1
0.15
C
Top Crack Width Avg.
Bottom Crack Width Avg.
0.05
0.1Crack Width Avg.
Crack Width Eff. (Bomhard)
00 100 200 300 400 500 600
Tensile Load (KN)
Crack Width Eff.‐ (Akhavan)
Figure 4.20: Crack Widths, S200, Phase III
63
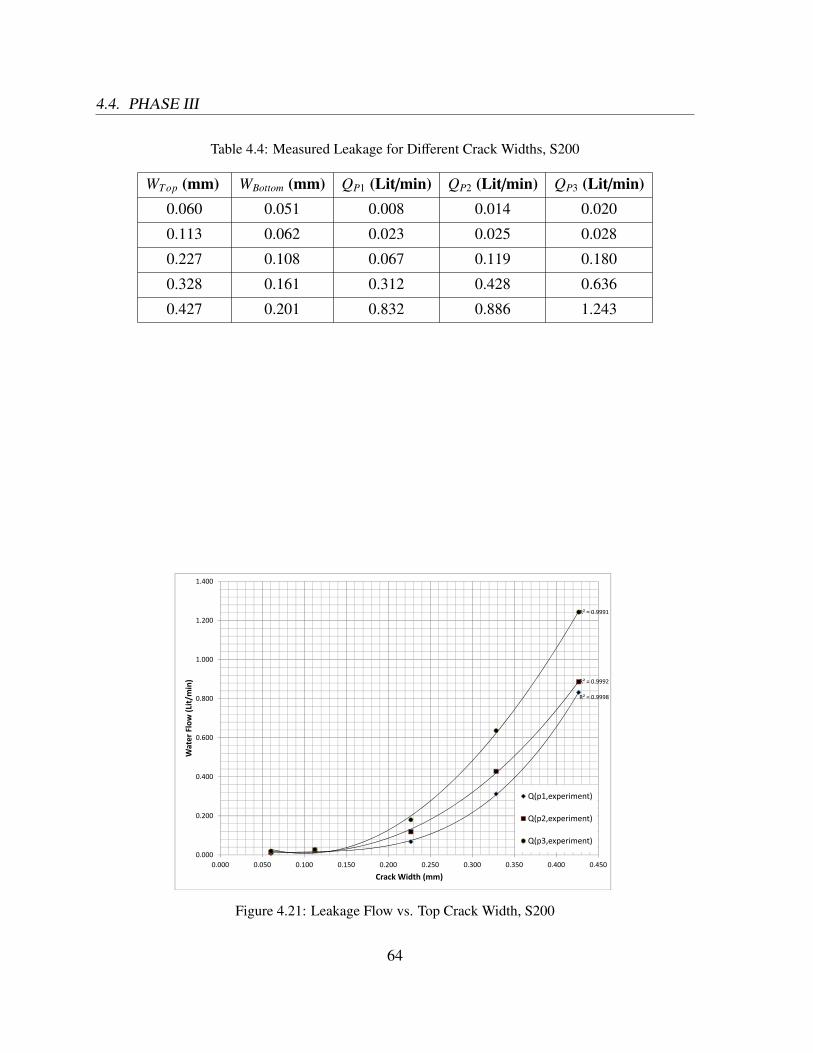
4.4. PHASE III
Table 4.4: Measured Leakage for Different Crack Widths, S200
WTop (mm) WBottom (mm) QP1 (Lit/min) QP2 (Lit/min) QP3 (Lit/min)0.060 0.051 0.008 0.014 0.020
0.113 0.062 0.023 0.025 0.028
0.227 0.108 0.067 0.119 0.180
0.328 0.161 0.312 0.428 0.636
0.427 0.201 0.832 0.886 1.243
R² = 0.9991
1.400
1.000
1.200
R² = 0.9998
R² = 0.9992
0.800
Lit/min)
0.600
Water Flow (L
0.400
W
Q(p1,experiment)
0.200
Q(p , p )
Q(p2,experiment)
Q(p3,experiment)0.000
0.000 0.050 0.100 0.150 0.200 0.250 0.300 0.350 0.400 0.450
Crack Width (mm)
(p , p )
Figure 4.21: Leakage Flow vs. Top Crack Width, S200
64
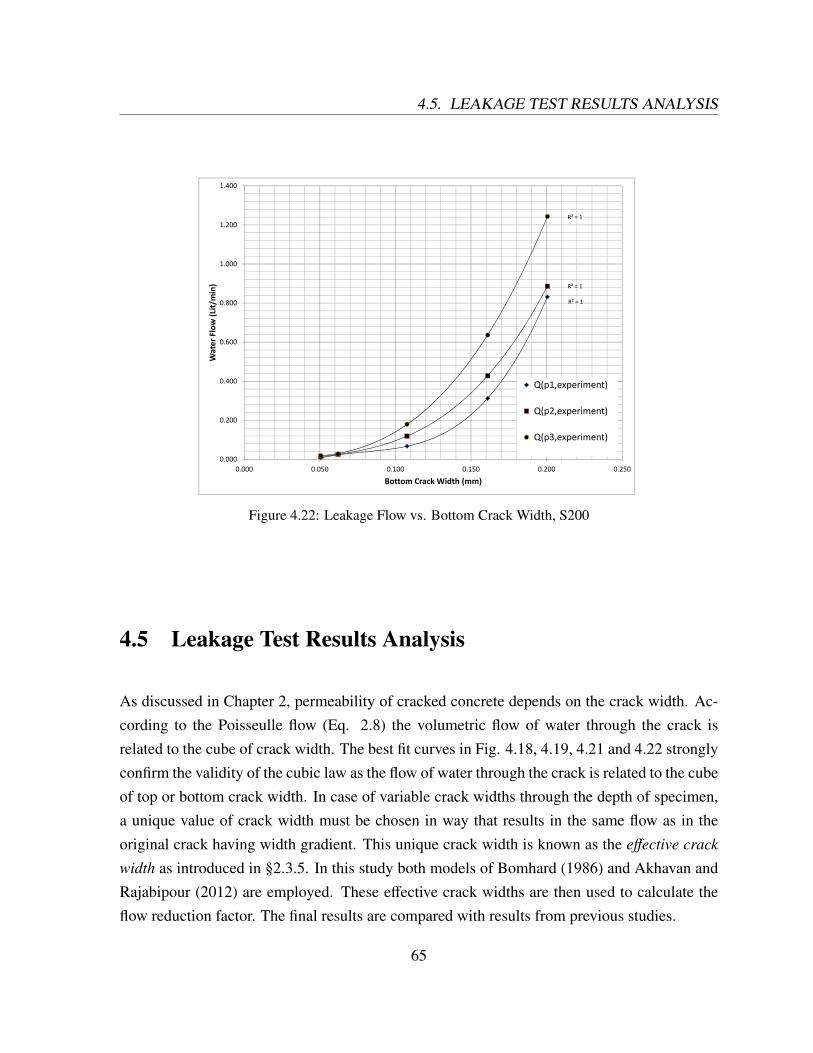
4.5. LEAKAGE TEST RESULTS ANALYSIS
R² = 1
1.400
1.000
1.200
R² = 1
R² = 1
0.800
Lit/min)
0.600
Water Flow (L
0.400
W
Q(p1,experiment)
0.200Q(p2,experiment)
Q(p3,experiment)
0.0000.000 0.050 0.100 0.150 0.200 0.250
Bottom Crack Width (mm)
Figure 4.22: Leakage Flow vs. Bottom Crack Width, S200
4.5 Leakage Test Results Analysis
As discussed in Chapter 2, permeability of cracked concrete depends on the crack width. Ac-cording to the Poisseulle flow (Eq. 2.8) the volumetric flow of water through the crack isrelated to the cube of crack width. The best fit curves in Fig. 4.18, 4.19, 4.21 and 4.22 stronglyconfirm the validity of the cubic law as the flow of water through the crack is related to the cubeof top or bottom crack width. In case of variable crack widths through the depth of specimen,a unique value of crack width must be chosen in way that results in the same flow as in theoriginal crack having width gradient. This unique crack width is known as the effective crack
width as introduced in §2.3.5. In this study both models of Bomhard (1986) and Akhavan andRajabipour (2012) are employed. These effective crack widths are then used to calculate theflow reduction factor. The final results are compared with results from previous studies.
65
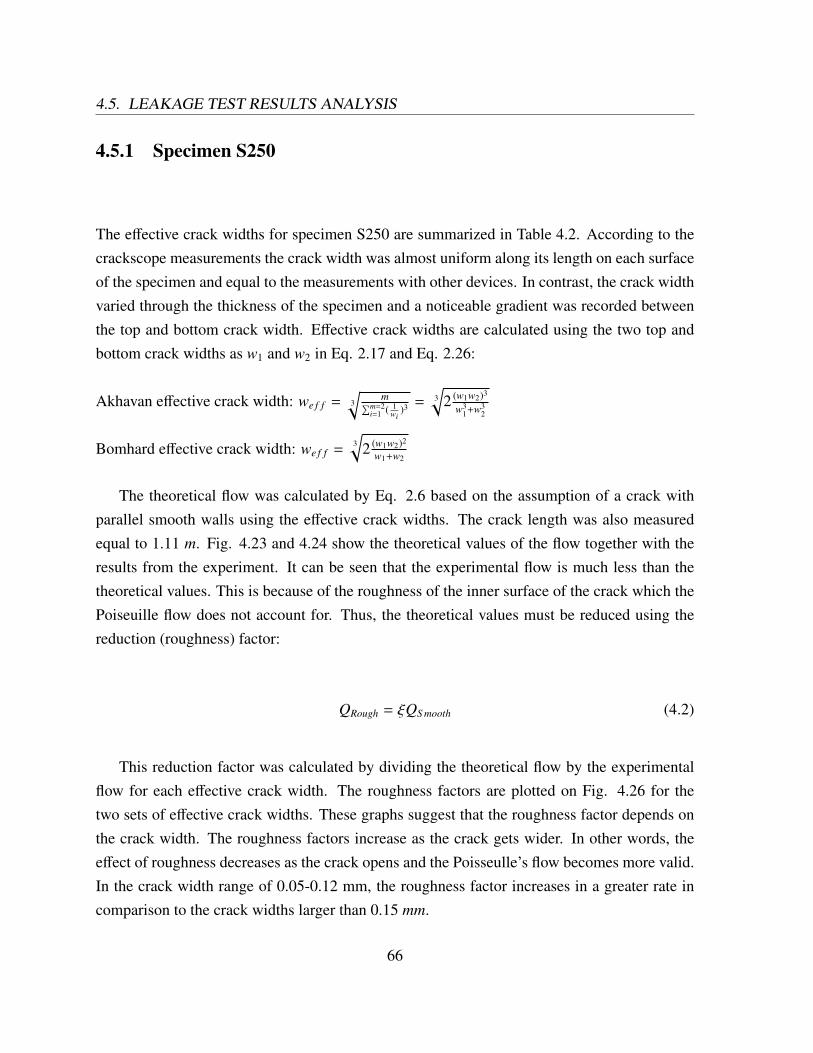
4.5. LEAKAGE TEST RESULTS ANALYSIS
4.5.1 Specimen S250
The effective crack widths for specimen S250 are summarized in Table 4.2. According to thecrackscope measurements the crack width was almost uniform along its length on each surfaceof the specimen and equal to the measurements with other devices. In contrast, the crack widthvaried through the thickness of the specimen and a noticeable gradient was recorded betweenthe top and bottom crack width. Effective crack widths are calculated using the two top andbottom crack widths as w1 and w2 in Eq. 2.17 and Eq. 2.26:
Akhavan effective crack width: we f f = 3
√m∑m=2
i=1 ( 1wi
)3 = 3√
2 (w1w2)3
w31+w3
2
Bomhard effective crack width: we f f =3√
2 (w1w2)2
w1+w2
The theoretical flow was calculated by Eq. 2.6 based on the assumption of a crack withparallel smooth walls using the effective crack widths. The crack length was also measuredequal to 1.11 m. Fig. 4.23 and 4.24 show the theoretical values of the flow together with theresults from the experiment. It can be seen that the experimental flow is much less than thetheoretical values. This is because of the roughness of the inner surface of the crack which thePoiseuille flow does not account for. Thus, the theoretical values must be reduced using thereduction (roughness) factor:
QRough = ξQS mooth (4.2)
This reduction factor was calculated by dividing the theoretical flow by the experimentalflow for each effective crack width. The roughness factors are plotted on Fig. 4.26 for thetwo sets of effective crack widths. These graphs suggest that the roughness factor depends onthe crack width. The roughness factors increase as the crack gets wider. In other words, theeffect of roughness decreases as the crack opens and the Poisseulle’s flow becomes more valid.In the crack width range of 0.05-0.12 mm, the roughness factor increases in a greater rate incomparison to the crack widths larger than 0.15 mm.
66
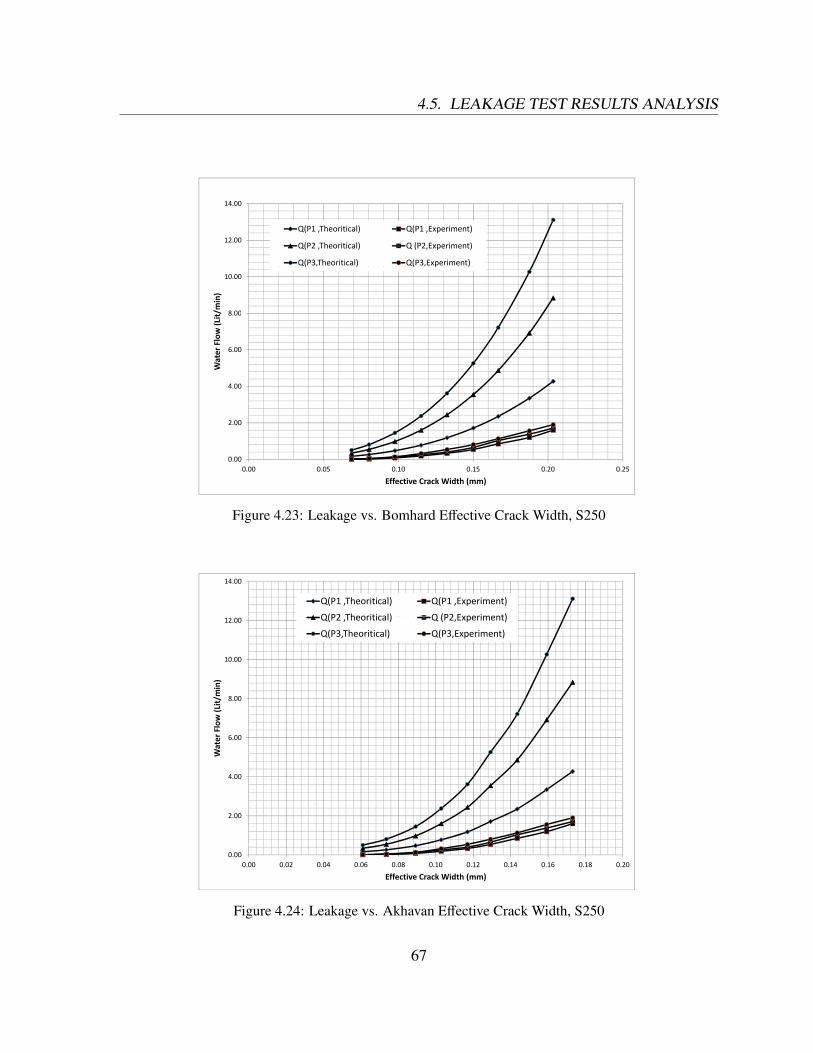
4.5. LEAKAGE TEST RESULTS ANALYSIS
14.00
12.00Q(P1 ,Theoritical) Q(P1 ,Experiment)
Q(P2 ,Theoritical) Q (P2,Experiment)
Q(P3,Theoritical) Q(P3,Experiment)
8 00
10.00
/min)
( ) ( p )
6.00
8.00
ter F
low (Lit/
4.00
Wat
2.00
0.000.00 0.05 0.10 0.15 0.20 0.25
Effective Crack Width (mm)
Figure 4.23: Leakage vs. Bomhard Effective Crack Width, S250
14.00
Q(P1 ,Theoritical) Q(P1 ,Experiment)
Q(P2 Theoritical) Q (P2 Experiment)
10.00
12.00 Q(P2 ,Theoritical) Q (P2,Experiment)
Q(P3,Theoritical) Q(P3,Experiment)
8.00
Lit/min)
6.00
Water Flow (L
4.00
W
2.00
0.000.00 0.02 0.04 0.06 0.08 0.10 0.12 0.14 0.16 0.18 0.20
Effective Crack Width (mm)
Figure 4.24: Leakage vs. Akhavan Effective Crack Width, S250
67
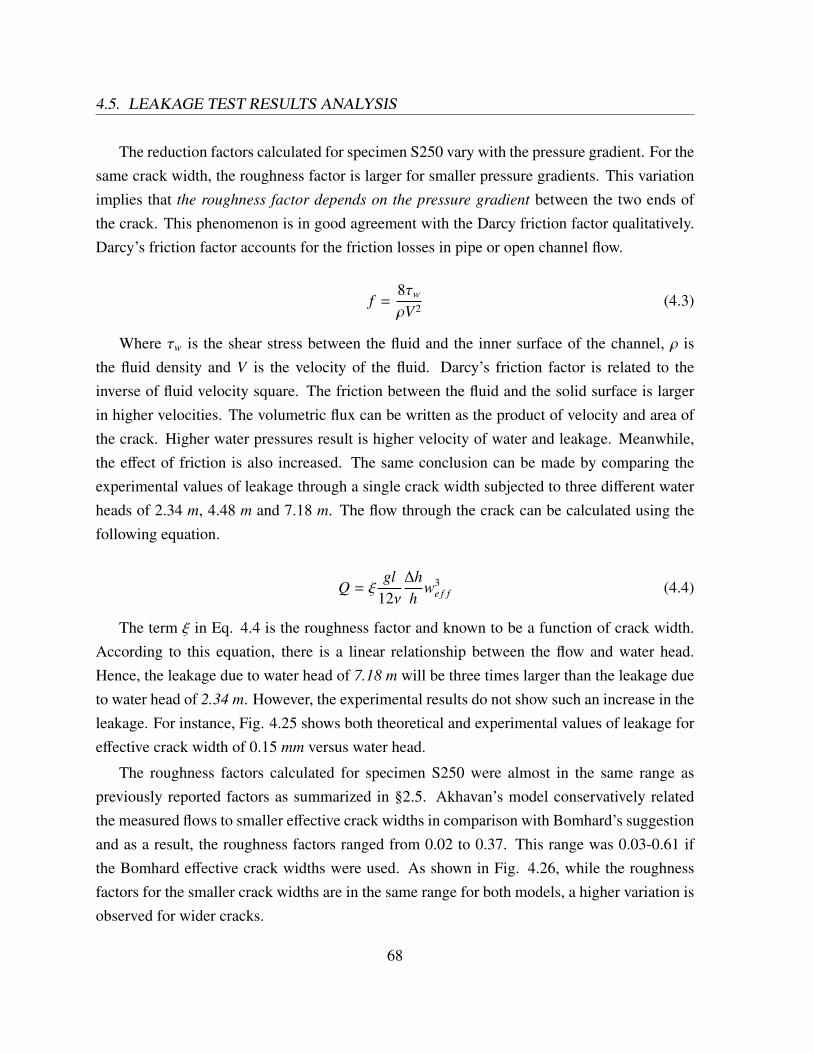
4.5. LEAKAGE TEST RESULTS ANALYSIS
The reduction factors calculated for specimen S250 vary with the pressure gradient. For thesame crack width, the roughness factor is larger for smaller pressure gradients. This variationimplies that the roughness factor depends on the pressure gradient between the two ends ofthe crack. This phenomenon is in good agreement with the Darcy friction factor qualitatively.Darcy’s friction factor accounts for the friction losses in pipe or open channel flow.
f =8τw
ρV2 (4.3)
Where τw is the shear stress between the fluid and the inner surface of the channel, ρ isthe fluid density and V is the velocity of the fluid. Darcy’s friction factor is related to theinverse of fluid velocity square. The friction between the fluid and the solid surface is largerin higher velocities. The volumetric flux can be written as the product of velocity and area ofthe crack. Higher water pressures result is higher velocity of water and leakage. Meanwhile,the effect of friction is also increased. The same conclusion can be made by comparing theexperimental values of leakage through a single crack width subjected to three different waterheads of 2.34 m, 4.48 m and 7.18 m. The flow through the crack can be calculated using thefollowing equation.
Q = ξgl
12ν∆hh
w3e f f (4.4)
The term ξ in Eq. 4.4 is the roughness factor and known to be a function of crack width.According to this equation, there is a linear relationship between the flow and water head.Hence, the leakage due to water head of 7.18 m will be three times larger than the leakage dueto water head of 2.34 m. However, the experimental results do not show such an increase in theleakage. For instance, Fig. 4.25 shows both theoretical and experimental values of leakage foreffective crack width of 0.15 mm versus water head.
The roughness factors calculated for specimen S250 were almost in the same range aspreviously reported factors as summarized in §2.5. Akhavan’s model conservatively relatedthe measured flows to smaller effective crack widths in comparison with Bomhard’s suggestionand as a result, the roughness factors ranged from 0.02 to 0.37. This range was 0.03-0.61 ifthe Bomhard effective crack widths were used. As shown in Fig. 4.26, while the roughnessfactors for the smaller crack widths are in the same range for both models, a higher variation isobserved for wider cracks.
68
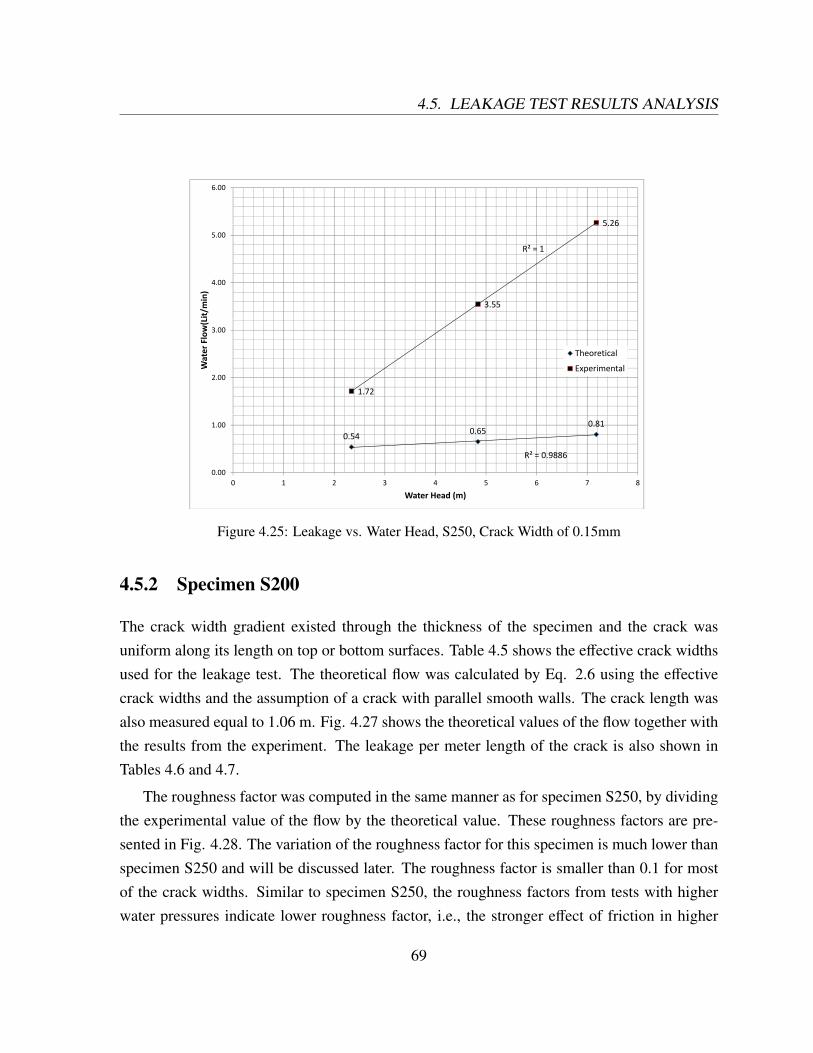
4.5. LEAKAGE TEST RESULTS ANALYSIS
5 26
6.00
5.26
R² = 15.00
3.55
4.00
Lit/min)
3.00
Water Flow(L
Theoretical
Experimental
1.722.00
W Experimental
0.54 0.650.81
R² = 0.9886
1.00
0.000 1 2 3 4 5 6 7 8
Water Head (m)
Figure 4.25: Leakage vs. Water Head, S250, Crack Width of 0.15mm
4.5.2 Specimen S200
The crack width gradient existed through the thickness of the specimen and the crack wasuniform along its length on top or bottom surfaces. Table 4.5 shows the effective crack widthsused for the leakage test. The theoretical flow was calculated by Eq. 2.6 using the effectivecrack widths and the assumption of a crack with parallel smooth walls. The crack length wasalso measured equal to 1.06 m. Fig. 4.27 shows the theoretical values of the flow together withthe results from the experiment. The leakage per meter length of the crack is also shown inTables 4.6 and 4.7.
The roughness factor was computed in the same manner as for specimen S250, by dividingthe experimental value of the flow by the theoretical value. These roughness factors are pre-sented in Fig. 4.28. The variation of the roughness factor for this specimen is much lower thanspecimen S250 and will be discussed later. The roughness factor is smaller than 0.1 for mostof the crack widths. Similar to specimen S250, the roughness factors from tests with higherwater pressures indicate lower roughness factor, i.e., the stronger effect of friction in higher
69
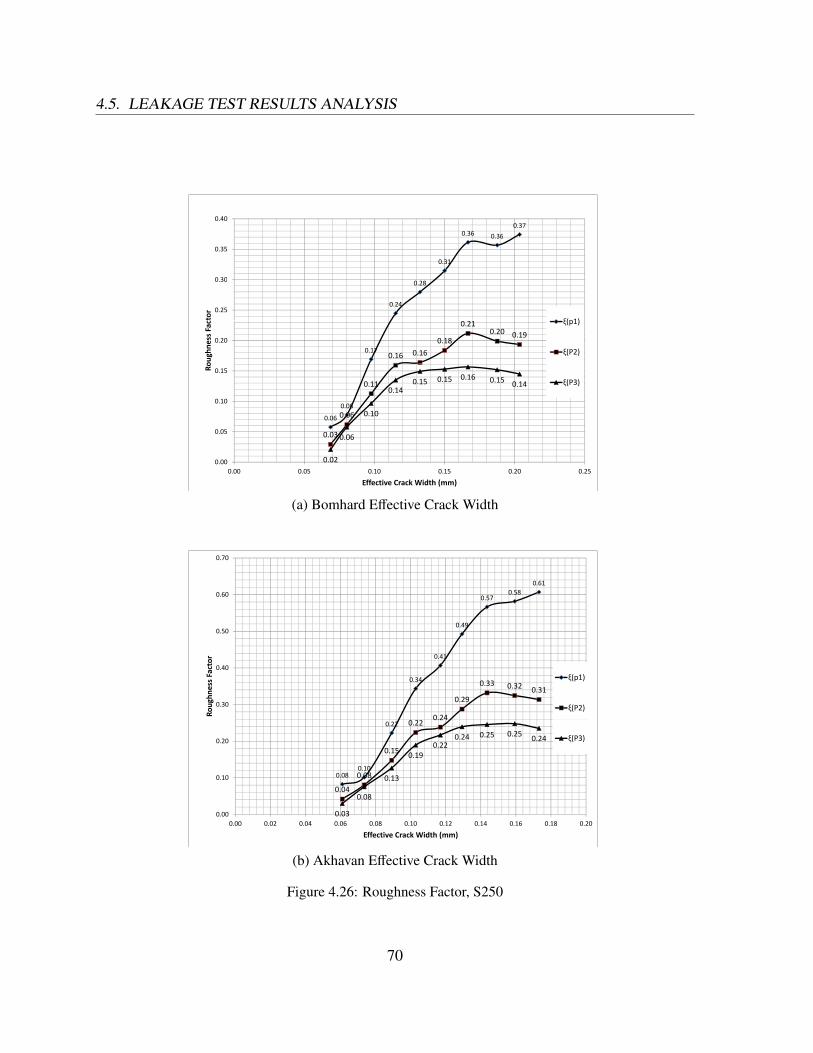
4.5. LEAKAGE TEST RESULTS ANALYSIS
0.36 0 360.37
0.40
0.31
0.36 0.36
0 30
0.35
0.24
0.28
0.25
0.30
ctor
ξ(p1)
0.170.16 0.16
0.18
0.210.20 0.19
0.20
oughne
ss Fac ξ(p1)
ξ(P2)
0 08
0.110.14
0.15 0.15 0.16 0.15 0.14
0.10
0.15Ro
ξ(P3)
0.06
0.08
0.03
0.06
0.06
0.10
0.05
0.020.000.00 0.05 0.10 0.15 0.20 0.25
Effective Crack Width (mm)
(a) Bomhard Effective Crack Width
0 580.61
0.70
0.49
0.570.58
0.50
0.60
0.410.40
Factor
ξ(p1)0.34
0.24
0.29
0.33 0.32 0.31
0.30
Roughn
ess F ξ(p1)
ξ(P2)
0.22
0.15
0.220.24
0.190.22
0.24 0.25 0.25 0.240.20 ξ(P3)
0.080.10
0.04
0.08
0.08
0.130.10
0.030.000.00 0.02 0.04 0.06 0.08 0.10 0.12 0.14 0.16 0.18 0.20
Effective Crack Width (mm)
(b) Akhavan Effective Crack Width
Figure 4.26: Roughness Factor, S250
70
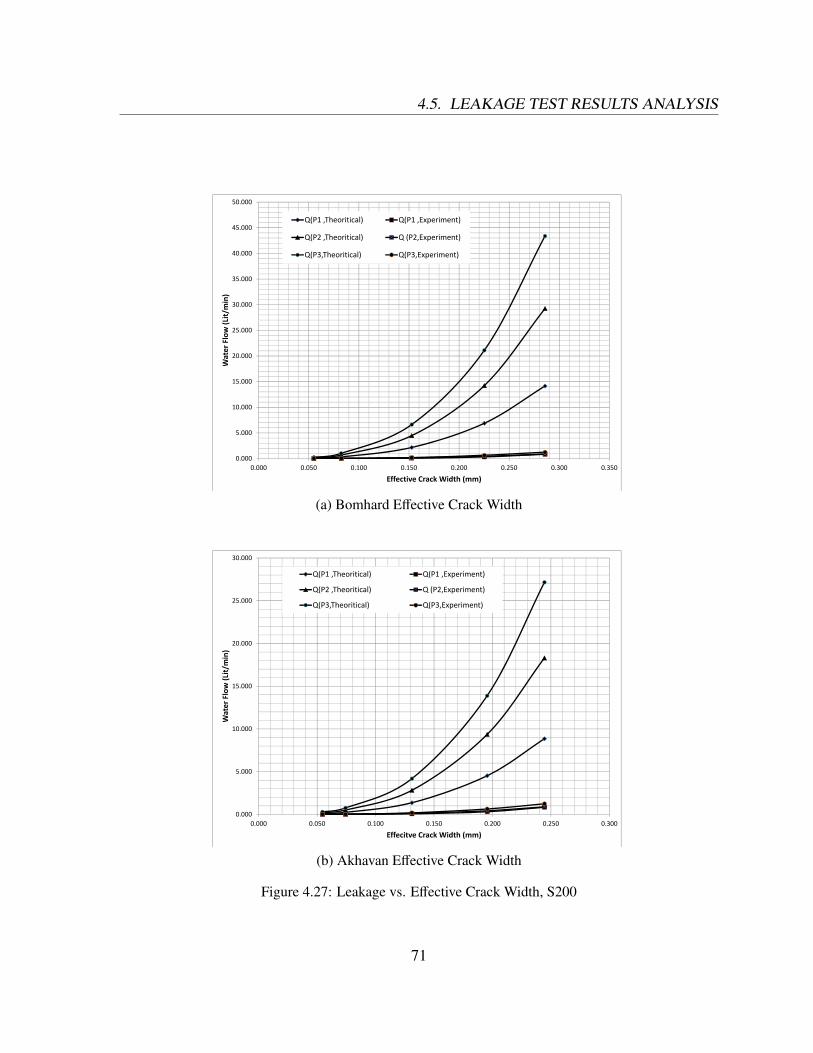
4.5. LEAKAGE TEST RESULTS ANALYSIS
45.000
50.000
Q(P1 ,Theoritical) Q(P1 ,Experiment)
Q(P2 Th iti l) Q (P2 E i t)
35 000
40.000
Q(P2 ,Theoritical) Q (P2,Experiment)
Q(P3,Theoritical) Q(P3,Experiment)
30.000
35.000
Lit/min)
20.000
25.000
Water Flow (L
10 000
15.000
W
5.000
10.000
0.0000.000 0.050 0.100 0.150 0.200 0.250 0.300 0.350
Effective Crack Width (mm)
(a) Bomhard Effective Crack Width
30.000
Q(P1 ,Theoritical) Q(P1 ,Experiment)
Q(P2 Theoritical) Q (P2 Experiment)25.000
Q(P2 ,Theoritical) Q (P2,Experiment)
Q(P3,Theoritical) Q(P3,Experiment)
20.000
Lit/min)
15.000
Water Flow (L
10.000
W
5.000
0.0000.000 0.050 0.100 0.150 0.200 0.250 0.300
Effecitve Crack Width (mm)
(b) Akhavan Effective Crack Width
Figure 4.27: Leakage vs. Effective Crack Width, S200
71
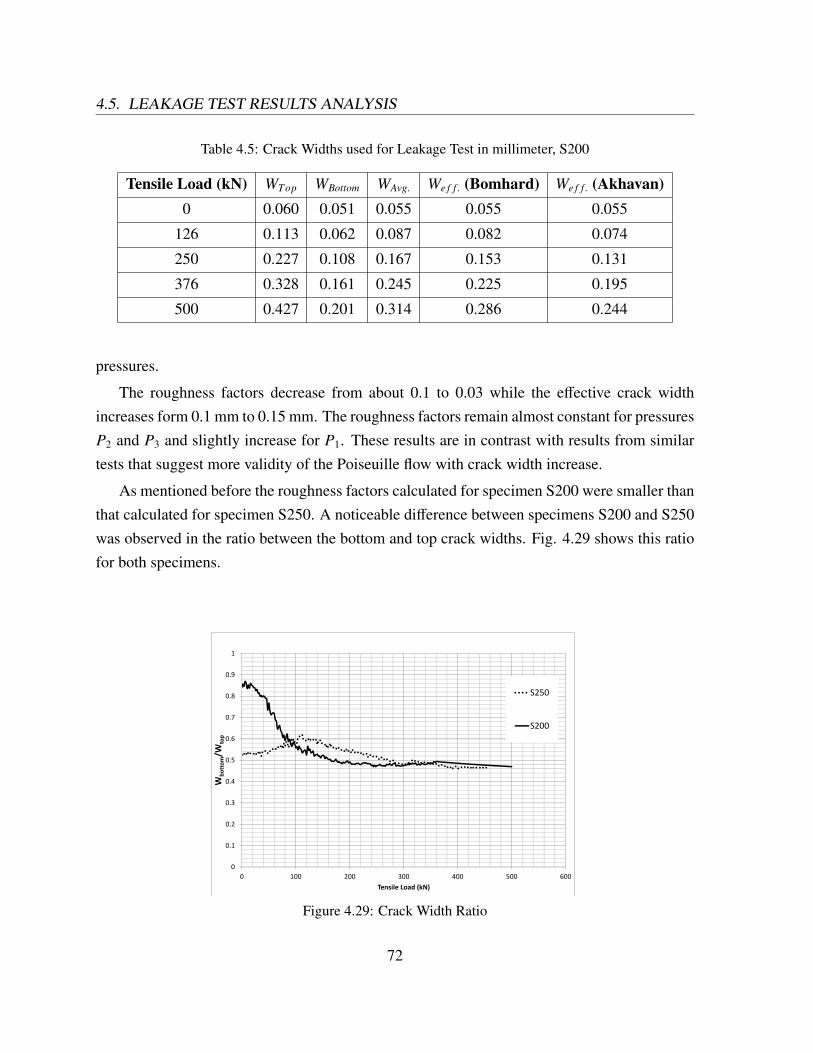
4.5. LEAKAGE TEST RESULTS ANALYSIS
Table 4.5: Crack Widths used for Leakage Test in millimeter, S200
Tensile Load (kN) WTop WBottom WAvg. We f f . (Bomhard) We f f . (Akhavan)0 0.060 0.051 0.055 0.055 0.055
126 0.113 0.062 0.087 0.082 0.074
250 0.227 0.108 0.167 0.153 0.131
376 0.328 0.161 0.245 0.225 0.195
500 0.427 0.201 0.314 0.286 0.244
pressures.
The roughness factors decrease from about 0.1 to 0.03 while the effective crack widthincreases form 0.1 mm to 0.15 mm. The roughness factors remain almost constant for pressuresP2 and P3 and slightly increase for P1. These results are in contrast with results from similartests that suggest more validity of the Poiseuille flow with crack width increase.
As mentioned before the roughness factors calculated for specimen S200 were smaller thanthat calculated for specimen S250. A noticeable difference between specimens S200 and S250was observed in the ratio between the bottom and top crack widths. Fig. 4.29 shows this ratiofor both specimens.
1
0.8
0.9
S250
0.6
0.7
Wtop
S200
0 4
0.5
Wbo
ttom/W
0.3
0.4W
0.1
0.2
00 100 200 300 400 500 600
Tensile Load (kN)
Figure 4.29: Crack Width Ratio
72
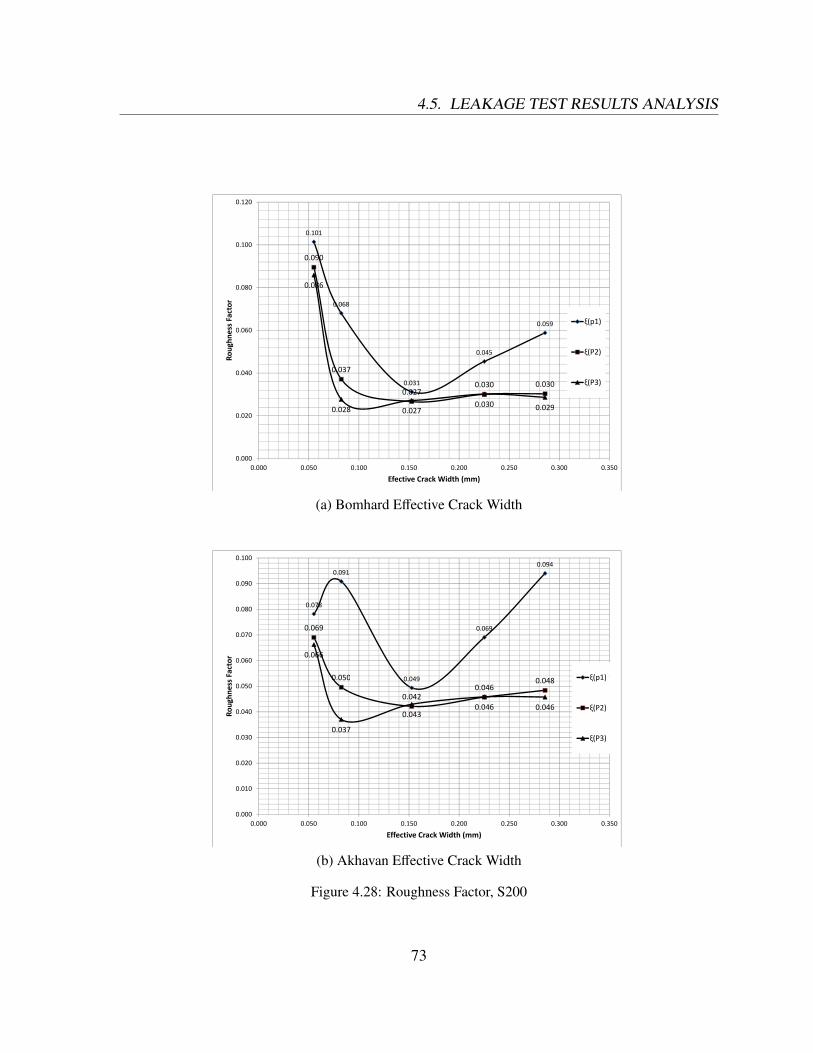
4.5. LEAKAGE TEST RESULTS ANALYSIS
0.101
0.120
0.101
0.090
0.100
0.068
0.0860.080
Factor
ξ(p1)
0.045
0.0590.060
Roughn
ess F ξ(p1)
ξ(P2)
0.031
0.037
0.0270.030 0.030
0.030 0 029
0.040ξ(P3)
0.028 0.0270.030 0.029
0.020
0.0000.000 0.050 0.100 0.150 0.200 0.250 0.300 0.350
Efective Crack Width (mm)
(a) Bomhard Effective Crack Width
0.0910.094
0.090
0.100
0.078
0.0690.0690 070
0.080
0 050
0.0660.060
0.070
Factor
ξ(p1)0.0490.050
0.0420.046
0.048
0.0430.046 0.0460.040
0.050
Roughn
ess F ξ(p1)
ξ(P2)
0.037
0 020
0.030 ξ(P3)
0.010
0.020
0.0000.000 0.050 0.100 0.150 0.200 0.250 0.300 0.350
Effective Crack Width (mm)
(b) Akhavan Effective Crack Width
Figure 4.28: Roughness Factor, S200
73
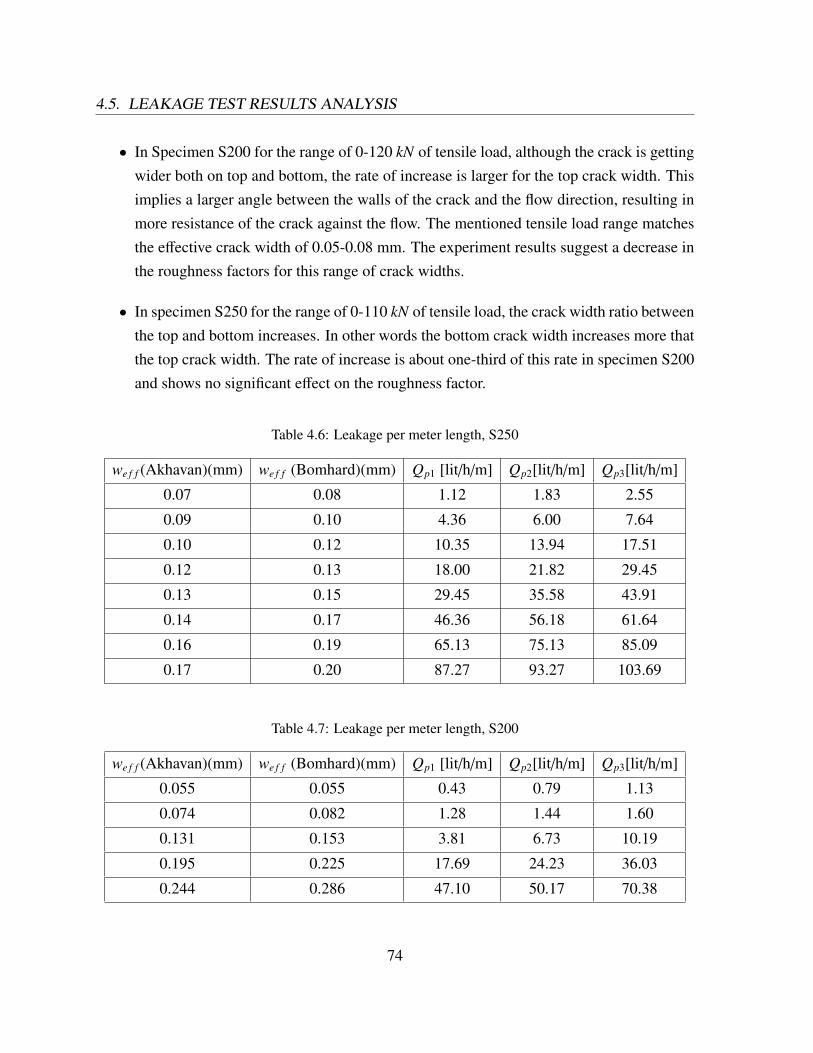
4.5. LEAKAGE TEST RESULTS ANALYSIS
• In Specimen S200 for the range of 0-120 kN of tensile load, although the crack is gettingwider both on top and bottom, the rate of increase is larger for the top crack width. Thisimplies a larger angle between the walls of the crack and the flow direction, resulting inmore resistance of the crack against the flow. The mentioned tensile load range matchesthe effective crack width of 0.05-0.08 mm. The experiment results suggest a decrease inthe roughness factors for this range of crack widths.
• In specimen S250 for the range of 0-110 kN of tensile load, the crack width ratio betweenthe top and bottom increases. In other words the bottom crack width increases more thatthe top crack width. The rate of increase is about one-third of this rate in specimen S200and shows no significant effect on the roughness factor.
Table 4.6: Leakage per meter length, S250
we f f (Akhavan)(mm) we f f (Bomhard)(mm) Qp1 [lit/h/m] Qp2[lit/h/m] Qp3[lit/h/m]
0.07 0.08 1.12 1.83 2.55
0.09 0.10 4.36 6.00 7.64
0.10 0.12 10.35 13.94 17.51
0.12 0.13 18.00 21.82 29.45
0.13 0.15 29.45 35.58 43.91
0.14 0.17 46.36 56.18 61.64
0.16 0.19 65.13 75.13 85.09
0.17 0.20 87.27 93.27 103.69
Table 4.7: Leakage per meter length, S200
we f f (Akhavan)(mm) we f f (Bomhard)(mm) Qp1 [lit/h/m] Qp2[lit/h/m] Qp3[lit/h/m]
0.055 0.055 0.43 0.79 1.13
0.074 0.082 1.28 1.44 1.60
0.131 0.153 3.81 6.73 10.19
0.195 0.225 17.69 24.23 36.03
0.244 0.286 47.10 50.17 70.38
74
Chapter 5
Conclusions
5.1 Summary
An experimental study on the leakage of pressurized water through direct tension cracks wascarried out. The main purpose of this research was to measure the flow of water through a fullydeveloped crack in an RC panel of real-life scale. The results of this study can assist to setappropriate values of crack width for LCS since tests of this kind are rare and have not beenreported in the literature. In case of a tank with a circular basis, the tank wall will go undertensile stresses due to the hydrostatic pressure of the liquid inside the container. The cracksinduced under such loading conditions are more vulnerable to leakage of liquid in comparisonwith flexural cracks. This study was dedicated to examination of water leakage through thesecracks.
With this intension an experimental program was designed and examined under three phases.In phaseI, direct tensile forces were applied to RC panels, each representing a segment of a re-inforced concrete tank wall, in order to create a major crack. The specimens were unloadedafter formation of a crack which was fully developed through specimen’s thickness. DuringPhaseII, the cracked specimens were reloaded and the crack widths were measured for differ-ent magnitudes of tensile load. The specimens were unloaded again at the end of this phase.In phaseIII, a pressure vessel, particularly designed for this test, was installed on the inducedcrack. The specimens were reloaded incrementally. The leakage test was performed at threedifferent water heads of 2.34 m, 4.84 m and 7.18 m for crack widths at certain loads. The waterflow through the crack was measured over time.
75
5.2. CONCLUSIONS
ACI 350 (2001) recommends crack widths of 0.23 mm and 0.27 mm for flexural cracks insevere and normal conditions respectively. But no suggestions are available for cracks inducedin pure tension. Crack widths must be limited to 0.1 mm in LCS according to ACI 224R-01.The results of this experiment indicate a leakage of 0.14 lit/min for a crack in the specimen withthickness of 250 mm subjected to more than 7 meters of water head. The relative crack widthsfor the mentioned leakage rate was 0.13 mm on top and 0.07 mm at the bottom, resulting in aneffective crack width of 0.1 mm.
5.2 Conclusions
Several conclusions reached in the leakage test can be summarized as follows:
• The measured flow strongly depends on the cube of the crack width which is in goodagreement with the Poiseuille flow model.
• The roughness factors (ξ) calculated in this study are in the similar range of those previ-ously reported in the literature. The results of this experiment suggest a scattered rangeof 0.03-0.61 for this factor.
• The results confirm that the roughness factor is a function of the crack width. For con-stant top to bottom crack width ratio, the roughness factor increases as the crack widthbecomes larger. In other words, the effect of roughness decreases as the crack opens andthe Poiseuille flow becomes more valid.
• Results from both test specimens suggest that for a single effective crack width, theroughness factor varies with pressure gradient. Higher pressures result in smaller valuesof the roughness factor. The effect of pressure gradient on roughness is reduced as thewater pressure increases.
• Test results suggest that in case of crack width gradients, the ratio between the top andbottom crack widths may have an effect on the amount of leakage. Such conditionsrequires further study.
• No water leakage was observed during this test for cracks subjected to unpressurizedwater (15 cm of water head). This simulated the behavior of cracks on roof tops where
76
5.3. RECOMMENDATIONS FOR FUTURE RESEARCH
there might be a possibility of ponding water due to rain and snow. The maximumeffective crack width reached in this study was 0.29 mm.
• For the maximum crack width of 0.1 mm (ACI 224R recommendation), subjected to 7.2m of water head, a leakage flow of 2.55 lit/h/m was measured. This rate was 17.5 lit/h/m
for effective crack width of 0.1 mm (0.16mm on top, 0.09mm at the bottom).
5.3 Recommendations for Future Research
This experimental study aimed to investigate the leakage of water through cracked RC sections.Some new findings during this study require further investigation. The following are somesuggestions for future study based on the outcomes of this research:
• The process of applying a uniform tensile load to the one meter strip specimen and alsosealing the chamber on the specimen were extremely time consuming. It was not possibleto reach water heads higher than about 7 m with the proposed setup because of the longcontact length between the specimen and the chamber which had to be sealed. Instead ofthe one meter strip sample, a single rebar with the effective concrete area around it canbe used for similar tests.
• Leakage test can be conducted with pressure range of 10 m to 15 m of water head. Inaddition to the leakage data at this pressure range, this will allow for better understandingof the relationship between the roughness factor and pressure gradient.
• Different concrete mixes can be used for similar experiments.
• An experimental study can be dedicated to examination of the effect of crack widthgradients and the ratio of crack widths at the two sides of the crack.
• Self healing of the cracks can be examined for water heads greater than 10 m. Meanwhile,the effect of leakage on corrosion of the steel reinforcement can be of interest.
77

References
ACI 209R (2008). Prediction of Creep, Shrinkage and Temperature Effects in Concrete
Structures, (ACI 209R-92). American Concrete Institute: Farmington Hills, Mich.
ACI 224 (2001). Control of Cracking in Concrete Structures. American Concrete Institute:Farmington Hills, Mich.
ACI 318 (2008). Building Code Requirements for Structural Concrete ((ACI 318-08)) and
commentary (ACI 318R-9). American Concrete Institute: Farmington Hills, Mich.
ACI 350 (2006). Code Requirements for Environmental Engineering Concrete Structures
and Commentary. American Concrete Institute: Farmington Hills, Mich.
Akhavan, A., S. S. and F. Rajabipour (2012). Quantifying the effects of crack width, tor-tuosity, and roughness on water permeability of cracked mortars. Cement and Concrete
Research 42, 313–320.
Archambault G., Rouleau, A. and B. Ladanyi (1992). Comportement anisotrope de ladformabilit-dilatance permabilit des massifs rocheux fractures. In Gomatriaux Coll. Ren
Houpert, Str. Comp. Mca.
ASTM C39/C39M (2005). Standard Test Method for Compressive Strength of Cylindrical
Concrete Specimens. Annual Book of ASTM Standards: Philadelphia.
ASTM C496/C496M (2004). Standard Test Method for Splitting Tensile Strength of Cylin-
drical Concrete Specimens. Annual Book of ASTM Standards: Philadelphia.
Batchelor, G. . K. (1967). An Introduction to Fluid Dynamics. Cambridge and New York:Cambridge University Press.
79
REFERENCES
Bomhard, H. (1986). Concrete Tanks for Water Storage- A Conceptional Approach. In Pro-
ceedings of the Tenth International Congress of the FIP, pp. 55–77.
Breysse, D., G. B. and M. Lasne (1994). An Experimental Device to Study Cracking andDeterioration of Concrete. In 3rd CANMET/ACI Int. Conf. on Durability of Concrete.
Breysse D., Grard B., L. M. (1997). Cracking Of Concrete Relevance and effects, Tightness
of Concrete with Respect to Fluids. RILEM TC-146 TCF State-of-the-Art Report.
Dietrich, P., H. R. S. M. H. H. K. J. and G. Teutsch (2005). Flow and Transport in Fractured
Porous Media. Berlin, Germany: Springer.
Edvardsen, C. (1996). Chloride Penetration into Cracked Concrete. RILEM International
Workshop on chloride penetration into concrete, St. Remy-lesChevreuses.
Edvardsen, C. (1999). Water Permeability and Autogenous Healing of Cracks in Concrete.ACI Materials Journal 96(4), 448–454.
Hearn, N. and M. C.T. (1997). Self-Sealing Property of Concrete Experimental Evidence.Materials and Structures 30.
Imhof-Zeitler, C. (1996). Fliessverhalten von Flussigkeiten in durchgehend gerissenen Be-
tonkonstruktionen. Berlin: Deutscher Ausschuss Fur Stahlbeton Heft 460.
Jaeger, J. C. Cook, N. and R. W. Zimmerman (2007). Fundamentals of Rock Mechanics,4th
Edition. Blackwell Publishing Ltd.
Kermani, A. (1991). Permeability of stressed concrete. Building Research and Informa-
tion 19(16), 360–366.
Marchal, J. and B. M. (1992). Transfert diphasique experimental sur une paroi paisse debton soumise a une elevation rapide de pression et de temperature. Ann. ITBTP 506.
Park, R. and T. Paulay (1975). Reinforced Concrete Structures. New York: John Wiley &Sons, Inc.
Phillips, O. . M. (1991). Flow and Reactions in Permeable Rocks. Cambridge and New York:Cambridge University Press.
Reinhardt, H. and M. Joos (2003). Permeability and Self-healing of Cracked Concrete as aFunction of Temperature and Crack Width. Cement and Concrete Research 33(7), 981–985.
80
REFERENCES
Tsukamoto, M.and Wormer, J. (1991). Permeability of Cracked Fiber-reinforced Concrete.Darmstad Concrete, Ann. J. Concr. and Concr. Str. 6.
Wang, K., J. D. S. S. and A. Karr (1997). Permeability Study of Cracked Concrete. Cement
and Concrete Research 27(3), 381–393.
Ziari, A. and M. R. Kianoush (2009a). Investigation of Direct Tension Cracking and Leakagein RC Elements. Engineering Structures 31(2), 466–474.
Ziari, A. and M. R. Kianoush (2009b). Investigation of Flexural Cracking and Leakage inRC Liquid Containing Structures. Engineering Structures 31(5), 1056–1067.
81


REFERENCES
83