Embed Size (px)
Citation preview
Leakage through cracks: the applicability of available prediction methods
L. Friedel *, F. Westphal **
Models for the calculation of leakage rates through cracks in walls of pressure vessels and pipes are analysed with regard to their basic assumptions. For evaluation of the predictive quality the models have been applied to all the accessible (water) leakage rate data for real and simulated cracks. The statistical comparison of the differences between the predicted and the experimental results reveals that none of the models can be considered as universally valid to better than 100 %, even for experiments with water when data from different experimentalists are compared.
leak rate, crack, model, predictive accuracy, statistical analysis, extrapolatability
PROBLEM AND OBJECTIVE
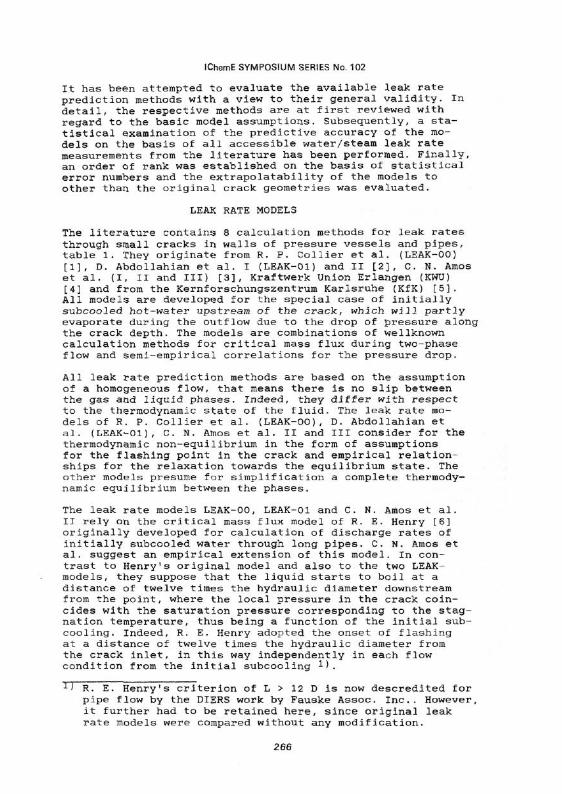
In the case of a failure in walls of pressurised vessels and pipes the assumption of a leak-before-break behaviour is generally justified, especially due to the highly developed state of design technology and material science. Fracture mechanics theories reveal that in this case a realistic approximation of the possible leak size is a small slit-shaped crack with a very small hydraulic diameter. For calculation of discharge rates through these cracks, such as is necessary for risk analysis, methods developed from the nuclear power industry are available. These so called leak rate models are generally based oh semi-empirical pressure drop and mass flux correlations. The empirical factors in these models have been developed using only a small number of experiments with initially subcooled water through, in most cases, simulated artificial cracks within limited test parameter ranges. Furthermore, none of these models is able to account for changes in properties, like viscosity of liquid phase and interfacial or surface tension. According to experience, an extrapolation to other crack configurations or an application to other fluid systems will result in unreliable predictions.
* Technische Prufung, Hoechst AG, D-6230 Frankfurt/M 80 ** Arbeitsgruppe Sicherheitstechnik, Universitat Dortmund,
D-4600 Dortmund 50
265
IChemE SYMPOSIUM SERIES No. 102
It has been attempted to evaluate the available leak rate prediction methods with a view to their general validity. In detail, the respective methods are at first reviewed with regard to the basic model assumptions. Subsequently, a statistical examination of the predictive accuracy of the models on the basis of all accessible water/steam leak rate measurements from the literature has been performed. Finally, an order of rank was established on the basis of statistical error numbers and the extrapolatability of the models to other than the original crack geometries was evaluated.
LEAK RATE MODELS
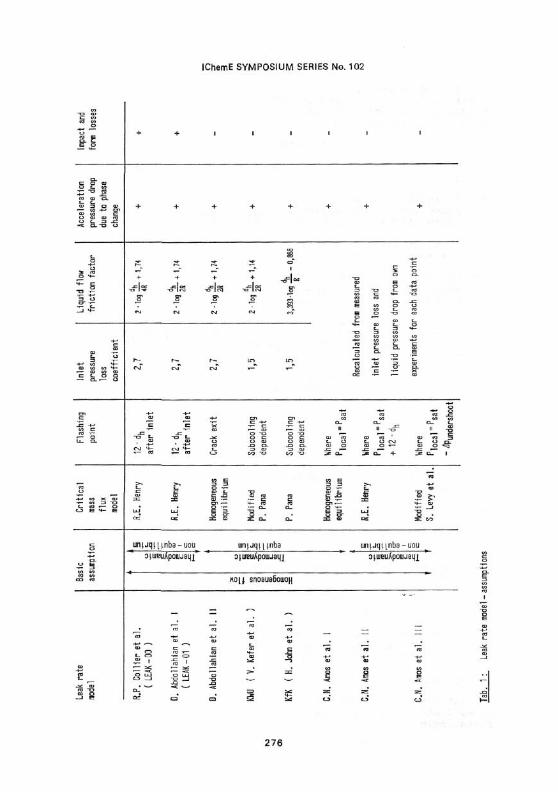
The literature contains 8 calculation methods for leak rates through small cracks in walls of pressure vessels and pipes, table 1. They originate from R. P. Collier et al. (LEAK-00) [1], D. Abdollahian et al. I (LEAK-01) and II [2], C. N. Amos et al. (I, II and III) [3], Kraftwerk Union Erlangen (KWU) [4] and from the Kernforschungszentrum Karlsruhe (KfK) [5]. All models are developed for the special case of initially subcooled hot-water upstream of the crack, which will partly evaporate during the outflow due to the drop of pressure along the crack depth. The models are combinations of wellknown calculation methods for critical mass flux during two-phase flow and semi-empirical correlations for the pressure drop.
All leak rate prediction methods are based on the assumption of a homogeneous flow, that means there is no slip between the gas and liquid phases. Indeed, they differ with respect to the thermodynamic state of the fluid. The leak rate models of R. P. Collier et al. (LEAK-00), D. Abdollahian et al. (LEAK-01), C. N. Amos et al. II and III consider for the thermodynamic non-equilibrium in the form of assumptions for the flashing point in the crack and empirical relationships for the relaxation towards the equilibrium state. The other models presume for simplification a complete thermodynamic equilibrium between the phases.
The leak rate models LEAK-00, LEAK-01 and C. N. Amos et al. II rely on the critical mass flux model of R. E. Henry [6] originally developed for calculation of discharge rates of initially subcooled water through long pipes. C. N. Amos et al. suggest an empirical extension of this model. In contrast to Henry's original model and also to the two LEAK-models, they suppose that the liquid starts to boil at a distance of twelve times the hydraulic diameter downstream from the point, where the local pressure in the crack coincides with the saturation pressure corresponding to the stagnation temperature, thus being a function of the initial sub-cooling. Indeed, R. E. Henry adopted the onset of flashing at a distance of twelve times the hydraulic diameter from the crack inlet, in this way independently in each flow condition from the initial subcooling 1).
"*~5 R~! E~! Henry's criterion of L > 12 D is now descredited for pipe flow by the DIERS work by Fauske Assoc. Inc.. However, it further had to be retained here, since original leak rate models were compared without any modification.
266
IChemE SYMPOSIUM SERIES No. 102
The leak rate correlation of C. N. Amos et al. Ill is based on the critical mass flux model of S. Levy et al. [7]. The thermodynamic non-equilibrium is considered in the form of a time-dependent saturation pressure undershoot, respectively a boiling delay of the (subcooled) liquid, calculated according to an empirical relationship of Md. Alamgir et al. [8]. The pressure undershoot correlation is merely modified by adapting an empirical correction factor to discharge experiments with smooth cracks.
The model of D. Abdollahian et al. II includes a simplified (explicit) homogeneous equilibrium model for the calculation of the critical mass flux. Essentially, it is an extended and modified Bernoulli equation. Herewith, it is assumed that the fluid temperature is only slightly changed during the discharge through the crack, and that the flashing of the liquid will start just within the crack exit and thus the critical pressure in the exit being equal to the saturation pressure corresponding to the stagnation temperature.
The model of C. N. Amos et al. I is also based on a homogeneous equilibrium critical mass flux model. However, in contrast to the model of D. Abdollahian et al. II it is supposed that the boiling starts as soon as the local pressure in the crack has dropped to the saturation pressure corresponding to the fluid stagnation temperature.
The leak rate models from KfK and KWU are both founded on the critical mass flux model of P. Pana [9], which considers discharge modes depending on possible stagnation states of the water upstream of the leak. For the case of subcooled liquid before the leak, P. Pana provides two calculation schemes depending on the magnitude of the initial subcool-ing. The first scheme is a modified Bernoulli-equation, which differs from the original for subcritical single phase flow only by inclusion of the saturation pressure corresponding to the stagnation temperature instead of the atmospheric pressure as downstream pressure. This follows from the assumptions that the evaporation will always start in the exit area of the crack and is independent of the crack depth. Within the other method it is presumed, that the flashing point will be located in the crack and that it will move upstream towards the inlet when a lower stagnation subcooling is adjusted. The calculation of the actual mass flux results here from linear interpolation between the possible extreme cases of a single phase liquid flow through the crack and a two phase flow already at the crack inlet. In this latter case the critical mass flux calculation is based on the slip model developed by F. J. Moody or alternatively a homogeneous equilibrium model. The KWU- and KfK models are based in this way on the homogeneous model, since it is considered to be more adequate for the description of the turbulent flow along the crack depth and the relatively low fluid qualities and it is quite easier to handle. The KWU-model additionally includes an empirical correction factor for the critical mass flux to account for all parameters, which are not considered by the Pana-model, e. g. crack geometry, flow patterns in the crack or the ever present thermodynamic non-equilibrium.
267
IChemE SYMPOSIUM SERIES No. 102
Any calculation of the critical mass flux generally occurring in the crack exit area due to the great crack depths will be substantially influenced by the local pressure in this critical area. A leak rate model thus has also to include an adequate relationship for the prediction of the pressure drop and therefore of the exit pressure.
The total pressure drop across a small slit-shaped crack in a wall of a pressure vessel or pipe can be considered to consist of (the sum of) several single pressure drops. With regard to the crack geometries typically for the case of leak-before-break-behaviour of the vessel- or pipewall, the total pressure drop is made up "by inlet pressure losses resulting from the sharp-edged crack inlet planes, friction pressure drops due to wall friction and momentum exchange, impact and form losses owing to area changes in the cracks and an acceleration pressure drop due to momentum change between inlet and outlet. The exit pressure loss is not included in any model, because it does not enter in the calculation as long as critical conditions in the exit plane are supposed.
In the following, the relationships for the calculation of the total pressure drop used in the leak rate models are reviewed in detail.
The leak rate models include different entrance pressure loss coefficients for the description of the inlet impact losses. R. P. Collier et al. and D. Abdollahian et al. introduce a value of 2.7, while in the KfK- and KWU-models this coefficient amounts to 1.5. C. N. Amos et al. use a variable value for each data set, which is recalculated from measured pressure profiles and ranges between 1 and 5. On the whole, the contribution of the entrance loss to the total pressure drop is very small, especially when a two-phase flow occurs in the crack.
The friction pressure drop across the crack depths contributes heavily to the total pressure drop due to the large wall roughness. In the experiments considered the relative roughness amounts up to (unusual) values of 1.7. With the exception of the models of C. N. Amos et al. all friction pressure drop prediction methods used in the leak rate models are based on the same mathematical structure, which originates from the Nikuradse - von Karman - equation for friction pressure drop during single phase flow through sand grain roughened pipes. In some cases this equation has been modified by adjusting the empirical factors to the experiments of a particular author respectively in order to meet the case of relative roughnesses in excess of unity. C. N. Amos et al., however, attribute single values for the one-phase pressure drop coefficient to each of their cracks.
The impact losses due to sudden flow area changes in the crack and form losses due to turns in the crack path are only considered by the models of R. P. Collier et al. and D. Abdollahian et al. I. For this reason these models then require detailed information about the flow path in the
268
IChemE SYMPOSIUM SERIES No. 102
crack. As a rule, the number of turns along the crack depths or of area changes cannot be predicted from fracture mechanics, and to develop it from real cracks would be to expansive in most cases and nevertheless not be generally valid. Any introduction of form and impact losses in the methods is therefore coupled with great uncertainties for the present time. Indeed, in the KWU- and KfK-models form and impact losses, which may have occurred in the experiments, are included in a so called effective pressure drop coefficient.
In all leak rate models the prediction of the pressure drops occurring in the crack section with two-phase flow is founded on the single-phase liquid flow pressure drop corrected by introduction of a mixture density according to a homogeneous model.
For calculating the pressure drop accross the crack depths information about the average mixture velocity or the critical mass flux respectively is indispensable. On the other hand, the generation of this value requires the critical pressure in the exit plane. Therefore, leak rate models are iterative calculation methods, in which the point of intersection of the pressure drop and the mass flux characteristics will be found by numerical mathematics. An exception to this procedure is made by the model of D. Abdollahian et al. II, which includes an explicit calculation method for the leak rates on the basis of averaged values for the mass flow quality,the pressure in the crack and for the fluid properties.
The analysis of the variables actually included in the leak rate models reveals that none of the models is capable of considering the influence of a change of the viscosity or wettability of the liquid phase and only the model of C. N. Amos et al. Ill includes the surface tension as an equation parameter. The influence of all these properties on the leakage rates has not yet been possible to establish, because the literature contains only measurements with water/steam, whereby these properties could not be varied independently from each other. Further on, the importance of the thermodynamic non-equilibrium encountered during vaporization is not yet understood. In a first assumption, in view of the large wall roughness and small crack width there might be only a small influence of the boiling (and condensation) delay on the leakage rates, since there would be a large number of nucleation sites on the crack wall available. This is supported by studies on the discharge through long pipes from which resulted that the assumption of a thermodynamic equilibrium leads to acceptable predictions for the critical mass flow rate on the basis of a homogeneous flow model [11]. On the other hand, there is only a short residence time of the fluid in the crack because of the high fluid velocities and the relatively small crack depths or wall thicknesses respectively, so that a marked boiling (and condensation) delay could be encountered, clearly influencing the value of the leakage rate [12]. The assumption of a homogeneous flow included in all models, however, should be admissable, because the generated two-phase mixture is characterised by relatively low mass flow qualities.
269
IChemE SYMPOSIUM SERIES No. 102
The analysis of the leak rate models with respect to the considered assumptions and parameters alone does not allow for a final conclusion about the validity or the predictive accuracy of a particular model. In the following, additionally a statistical analysis with all accessible water/steam leak rate measurements has therefore been carried out in order to evaluate the predictive accuracy of the models when applied to data in a wide range of real and simulated cracks. The assessment of the models accuracy is based on characteristic error numbers, the magnitude of which is weighted namely in relation to each other, since up to now there exists no criterium for an absolute and/or objective evaluation of the predictive accuracy of semiempirical correlations /10/.
An engineering design method for leak rates in case of critical mass fluxes should only require the stagnation state properties and the crack configurations as independent input variables. For that reason the three models of C. N. Amos et al. are not included in this comparison, since they demand for entrance pressure losses and resistance coefficients, which can only be extracted from the experiments afterwards. In this respect, these models are only suitable for post calculation of experimental results with given pressure drops and are not prepared for the prediction of leakage rates from only stagnation conditions and crack geometries.
STATISTICAL EXAMINATION OF THE PREDICTIVE ACCURACY
The statistical investigation bases on about 900 now accessible leak rate data from R. P. Collier et al., C. N. Amos et al. and H. John et al. The parameter range limits of the experimental data and the geometric sizes of the leaks are listed in table 2. The measurements are restricted to the case of subcooled hot water upstream of the crack, which will evaporate partly during the outflow thus generating a two-phase flow already in or at the outlet of the crack. The experiments were carried out on artificially produced slit-shaped cracks, so called real cracks, and on rectangular slits as simulated cracks. R. P. Collier et al. arrived at their real cracks after intergranular stress corrosion in stainless steel pipes, while H. John et al. produced them by cyclic bending of a probe on a material test machine.
The specified crack widths are related to the crack inlet or to the inner side of the vessel- or pipe-wall respectively. The crack depths correspond by definition to the wall-thickness of the apparatus or pipe. As a rule, the crack lengths in the inlet and exit planes are equal, nevertheless R. P. Collier et al. and H. John et al. have also used cracks with different inlet and exit areas, which were obtained by incidental widening during the experiments due to the applied high pressure difference on the specimen.
Generally, the determination of the effective flow area of all cracks during the experiments and in particular the measurements of the effective wall roughness of real cracks is
270
IChemE SYMPOSIUM SERIES No. 102
subject to relatively large uncertainties. This is highly unsatisfactory, because the roughness of the crack wall is an decisive parameter for precalculation of critical mass fluxes in the exit plane. R. P. Collier et al. claimed to have used model cracks with sand blasted wall roughnesses from 0.3 up to 10 urn. In the same manner H. John et al. produced values of wall roughness, which are declared to be in some cases greater than the adjusted crack widths, so that the relative wall roughness can amount to values greater than unity. C. N. Amos et al. provide no information about the wall roughness in their "smooth" slits.
In real cracks the statements of the authors about the values for the wall roughnesses are restricted to the material used and to the way the crack has been produced. Another difficulty for the re-evaluation of the wall roughness influence on the leak rates is the non-standard definition used by the experimenters and especially the question, whether the peak or the mean or any other value are parameters for the self-adjusting critical mass flux or the pressure drop respectively.
The total single-phase pressure drop coefficient of the leak is only given for the experiments of C. N. Amos et al. and H. John et al. by their measurements of the pressure drop during highly subcooled water flow through the crack. For the comparison the lacking declarations for the wall roughness prevailing in the experiments of C. N. Amos et al. have been obtained here afterwards by recalculating them from the measured flow resistance coefficients by application of the pressure drop relationships used in the respective leak rate models.
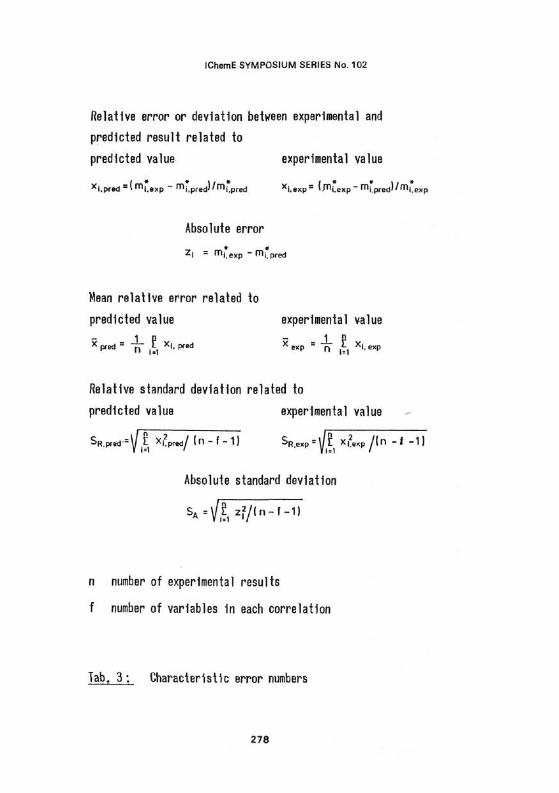
The relative and absolute standard deviation, i. e. the scatter of the relative and absolute deviations between experimental and theoretical values, have proved useful characteristic error numbers for the statistical evaluation of the accuracy of reproduction and prediction of the relationships [10]. The relative error, the mean relative error and the scatter of relative errors can thereby be defined as related to the experimental or to the predicted value, table 3. These classical error numbers allow for characterisation of reproduction accuracy of the data (only) if Gaussian distributions of the relative (and absolute) errors would be present. However, the values of the relative error related to the predicted value in the most extreme and admittedly seldom cases range from -100 % up t o * and the other related to the experimental value from -«• up to 100 %. Because of these unsymmetric limits in general an unsymmetric distribution is also obtained making it nearly impossible to arrive at an objective evaluation by only considering - in conjunction with the absolute standard deviation- one of these relative error numbers. The simultaneous interpretation of both relative standard deviations, indeed, allows then a better evaluation of the integral accuracy of reproduction of the models in relation to each other. Therefore, in the following the error numbers obtained from the comparison between the measured and the calculated critical mass fluxes are discussed
271

IChemE SYMPOSIUM SERIES No. 102
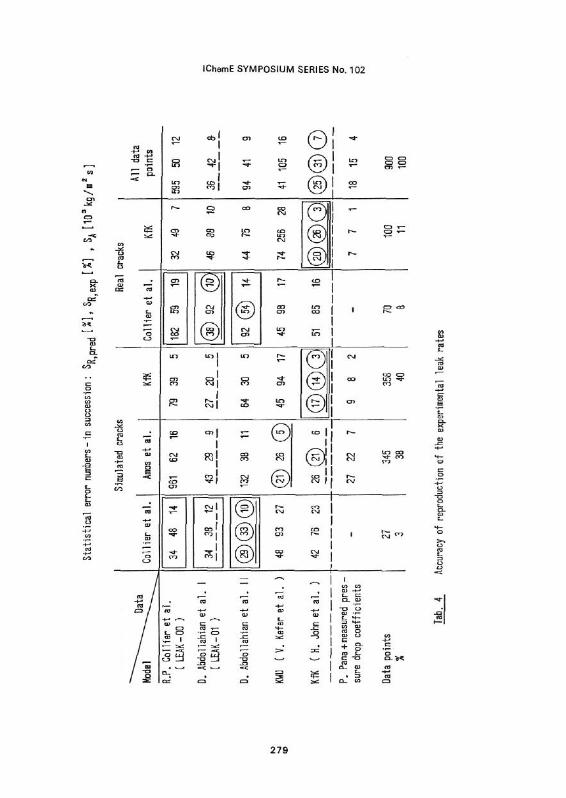
together, table 4. Here the best values are circled and the most acceptable combinations of relative and absolute deviations are underlined. The rectangular boxes refer to those experiments to which the respective model was originally adapted. In total, unexpectedly the lowest error numbers do not always appear by these experiments. With respect to the assessment and ranking relative standard deviations lower than 30 % and absolute standard deviations lower than 6000 kg/m2s will here be assumed acceptable in view of average measuring accuracy and since till now no absolute measure of quality is available for the evaluation of the accuracy of semitheoretical correlations.
Relatively, the best results for the reproduction of the experiments of R. P. Collier et al. in simulated and real cracks yield not the method of R. P. Collier et al. but the two models of D. Abdollahian et al., which on the other hand are also based on both these sets of data. However, the standard deviations of the relative and absolute errors are surprisingly large with values of approximately 40 % and 15000 kg/m2s. The unsatisfactory reproductive accuracy of the KWU-and the KfK-model result essentially from the inaccurate reproduction of the actual pressure drop, possibly because their relationships for the flow resistance coefficient fail here. This could originate from the rough specification of the wall roughnesses in the cracks given by R. P. Collier et al., so that both models use a priori incorrect input values.
Considering the reproduction of the experimental data of C. N. Amos et al. only the KWU-model and the KfK-model produce acceptable results. The model of R. P. Collier et al. fares badly when applied to this data, while the D. Abdollahian et al. I - model shows considerably better results than when reproducing the data of R. P. Collier et al., on which it was originally adapted.
As expected, the KfK-model reproduces the own experimental results from H. John et al. best. The other models produce very high error numbers, likely because the underlying respective pressure drop relationships cannot correctly include the wall roughnesses from the experiments of H. John et al.. This is valid especially for the KWU-model, which was adjusted using experiments with cracks of substantially lower roughnesses and which therefore always predicts too great mass fluxes.
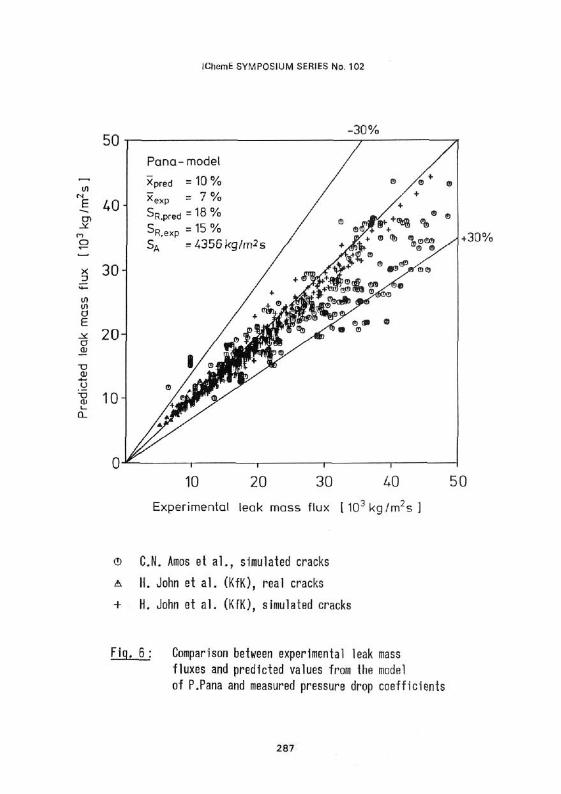
In order to clarify further the partly unsatisfactory performance of the KWU- and KfK-methods the critical mass flux model of P. Pana, on which both models are based, is separately checked for its validity in conjunction with measured flow resistance coefficients developed from the experiments of C. N. Amos et al. and H. John et al.. In this way truly the measured and predicted critical mass fluxes are compared. From table 4 it is obvious that the Pana model now reproduces the experiments of C. N. Amos et al. very satisfactorily and extraordinarily good results are also obtained when reproducing the experiments of H. John et al.. From
272
IChemE SYMPOSIUM SERIES No. 102
this check follows that this model seems to be a suitable calculation method for the critical mass flux in cracks with a large relative wall roughness, if the actual flow resistance coefficients of the cracks are known as input parameters or if they could be predicted correctly. The low error numbers with the Pana model and the KfK-model when reproducing the experiments of C. N. Amos et al. shows that the calculation method proposed by H. John et al. for the flow resistance coefficient of the cracks can be extrapolated with equally good accuracy to the cracks used here. This is valid also for the KWU-model, which produces even slightly better results due to the empirical correction of the calculated mass flux after the Pana model. The comparison of the calculated results by the Pana model with those by the KWU- and KfK-models when applied to the experiments of H. John et al. evidences that here the pressure drop relationship proposed by KWU is responsible for the error numbers greater than those obtained with the pressure drop correlation proposed by KfK.
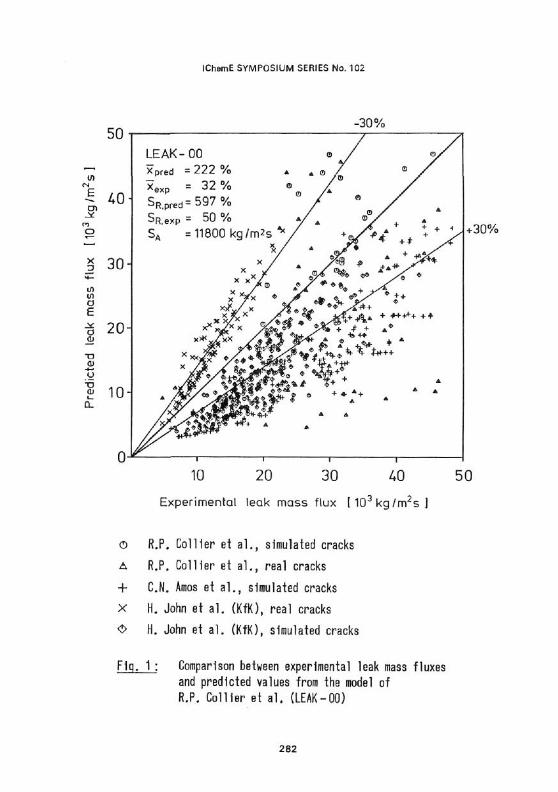
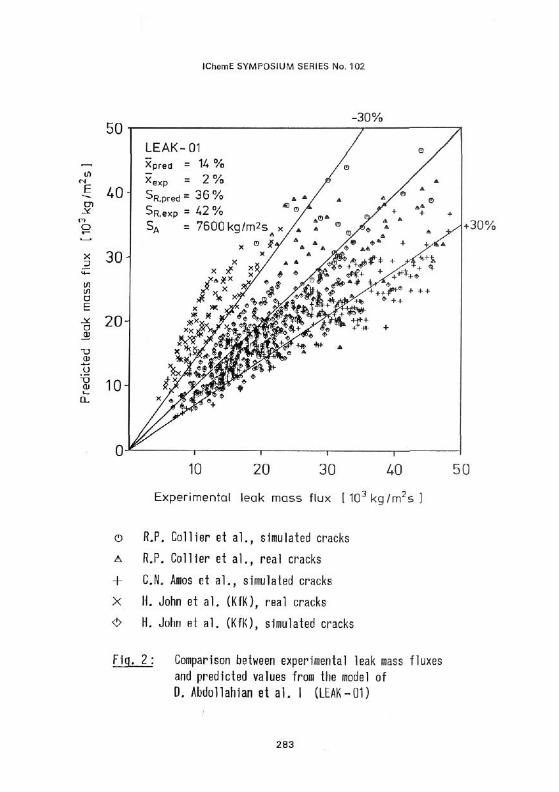
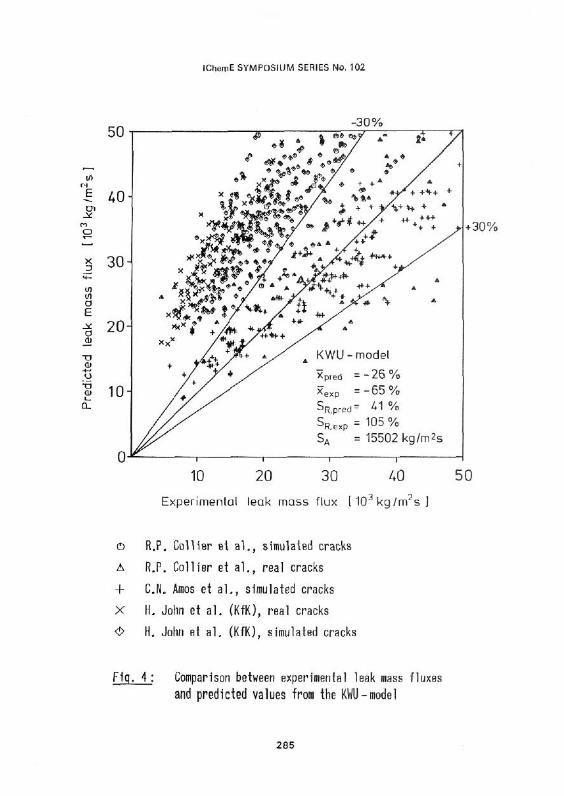
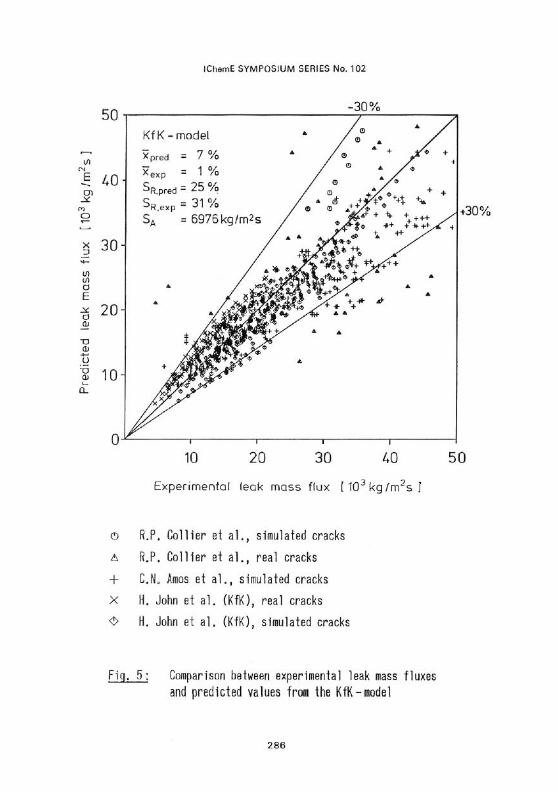
For illustration and explanation of the generalizing statistical results related to the data material as a whole the calculated specific leak rates are plotted against the experimentally deduced values, figures 1 to 6. In these plots the points should, over the whole range, be arranged as systematically as possible along the diagonal, which would represent the ideal of a zero deviation between measured and computed values. Indeed, for all relationships these points are scattered on the two sides of the diagonal. In some cases, however, single data sets are systematically calculated too low by some models. The reason for this can be that a part of the data taken in cracks is erroneous or the relationships fail in particular experimental ranges.
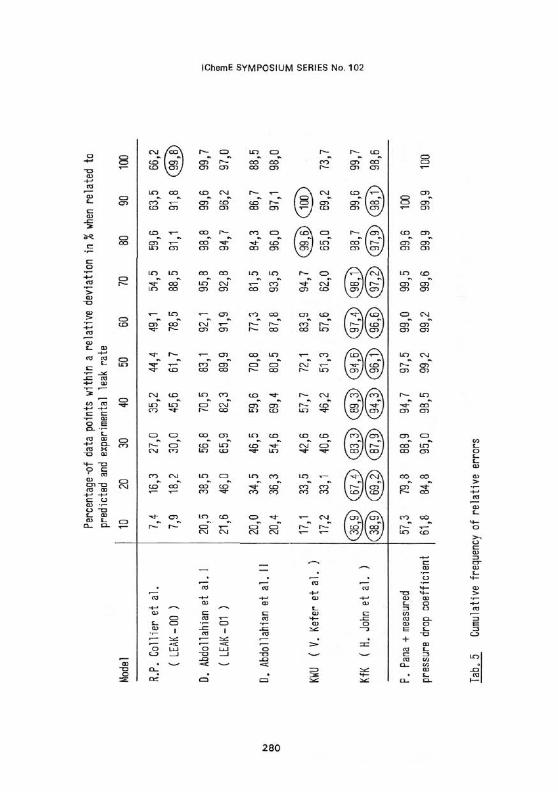
Additionally, in table 5 the frequency distributions of the relative errors related to the predicted and measured values have been presented for allowing a control of the order of magnitude of the relative errors by the reproduction of all 900 data points. The comparison of these results again shows, that none of both relative error distributions alone allows a satisfactory declaration of the average accuracy of reproduction of one model. For example, the model of R. P. Collier et al. does indeed reproduce 99,8 % of data within a relative error related to the experimental value of 100 %• the same model reproduces on the other hand only 66.2 % of data within a relative error related to the predicted value of 100 %. Thus, it can be deduced that this model predicts the mass fluxes much to small on average. The KWU-model shows results similar to that of the model of R. P. Collier et al.. Indeed, the high accuracy of reproduction by considering the relative deviation related to the predicted value (100 % within 90 %) and the very low accuracy of reproduction by considering the relative errors related to the experimental value (73.7 % within 100 %) is remarkable. So this model produces on average much too large critical mass fluxes. Even here the model of the KfK shows relatively the best results. With the exception of about 5 % "out-liners", all da-
273
IChemE SYMPOSIUM SERIES No. 102
ta points are reproduced satisfactorely within a relative error of 50 %.
Table 6 shows the percentage of data points within specified absolute deviations between measured and calculated specific leakage rates. It follows that the KfK-model over wide ranges exhibits a good accuracy while the method of D. Ab-dollahian et al. I produces altogether the relatively lowest absolute deviations in comparison to the results of the other models.
In total and in view of the conceived error limits, the analysis of the obtained relative and absolute deviations indicates that for the models of R. P. Collier et al. and D. Abdollahian et al. I and II the deviations are altogether too great to emphasise them as reliable prediction methods for leak rates. However, for leak rates with (large) sub-coolings more than approximately 20 K, the model of D. Abdollahian et al. II can be accepted as a good, quick and easily applicable approximation method. Indeed, the large error numbers resulted only from calculating the mass flux far too low for the case of low subcoolings.
The results with the critical mass flux model of P. Pana when original measured total flow resistance coefficients of the cracks are given indicate that the assumption of a homogeneous thermodynamic equilibrium flow seems to be adequate at least for the flow regimes in the experiments of H. John et al. with the "rough" cracks. This is surprising since the Pana-model has been developed entirely for other flow geometries. The leak rate models from KfK and KWU, which are based on this critical mass flux model, correspondingly show only deficiences in the prediction of the real pressure drop across the crack. Altogether, the method from KfK allows for the best accuracy of reproduction, nonwithstanding that it has been empirically adjusted with 51 % of the data used here .
CONCLUSIONS
At present, the studies allow only a preliminary statement about the restricted applicability of the leak rate models, since all accessible leak rate data origin from experiments with water/steam. Thereby, it is surprising that even for this particular fluid system none of the model is able to reproduce all data points better than 100 %. Thus, no universal prediction method presently exists valid for all crack configurations investigated. An adequate good reproduction of the results with an acceptable prediction accuracy is obviously only possible with the recalculation of the own experimental values, since here (already) admissable scatters of relative errors of 30 % are obtainable.
As a consequence, it can be deduced from the results that for a sound design it is predominantly necessary to improve the pressure drop relationship in such a way that it can be used for more (or all) crack configurations and crack wall rough-
274
IChemE SYMPOSIUM SERIES No. 102
nesses, and to make provisions amongst others for inclusion of viscosity, surface- and interfacial tension as equation variables to the methods, in order to arrive at a more generally valid leakage rate prediction method.
LITERATURE
/l/ R. P. Collier et al.: Two-phase flow through inter-granular stress corrosion cracks. EPRI-NP-3540-LD, 1984.
/2/ D. Abdollahian et al.: Analytical prediction of single-phase and two-phase flow through cracks in pipes and tubes. AICHE Symposium Series 80 (1984) 236, 19/23.
/3/ C. N. Amos et al.: Critical discharge of initially sub-cooled water through slits. NUREG/CR-3475, 1983.
/4/ KWU-Modell: V. Kefer et al.: Leckraten bei unterkriti-schen Rohrleitungsrissen. Jahrestagung Kerntechnik, Aachen, 1986 and personal communication, V. Kefer.
/5/ KfK-Modell: H. John et al.: Critical two-phase flow through rough slits. European Two-phase Flow Group Meeting, Munchen, 1986 and personal communication, H. John.
/6/ R. E. Henry: The two-phase critical discharge of initially saturated or subcooled liquid. Nucl. Sci. Engng. 41 (1970), 336/342.
/I/ S. Levy et al.: Homogeneous non-equilibrium critical flow model. Int. J. Heat Mass Transfer 25 (1982) 16, 759/770.
/8/ Md. Alamgir et al.: Correlation of pressure undershoot during hot-water depressurization. Heat Transfer 103 (1981) 1, 52/55.
/9/ P. Pana: Berechnung der stationaren Massenstromdichte von Wasserdampfgemischen und der auftretenden RuckstoBkrafte. Wiss. Bericht IRS-W-24, 1976.
/10/ L. Friedel: Kriterien fur die Beurteilung der Vorher-sagegenauigkeit von halbempirischen Berechnungsmethoden Chem.-Ing.-Tech. 53 (1981) 1, 59.
/ll/ H. K. Fauske: A quick approach to reactor vent sizing. Plant/Operations Progress 3 (1984) 3, 145/146.
/12/ J. Reimann: Vergleich von kritischen Massenstrom-Modellen im Hinblick auf die Stromung durch Leeks. KfK-Primarbericht PNS-Nr. 742/83, 1983.
Acknowledgement
The authors acknowledge the financial furtherance of these investigations by the Bundesminister fuer Forschung und Technologie.
275
IChemE SYMPOSIUM SERIES No. 102
276

IChemE SYMPOSIUM SERIES No. 102
277
IChemE SYMPOSIUM SERIES No. 102
Relative error or deviation between experimental and
predicted result related to
predicted value experimental value
xl.pred=Jmi.exp _ mr.pred)/m*pred xi,exp= f/^Lexp ~ mrpred)/mi#exp
Absolute error
z l = mi.exp " n\pred
Mean relative error related to
predicted value experimental value
x pred = ~ff £ x l . pred x e x p
s n E x | , exp
Relative standard deviation related to
predicted value experimental value
SR.pred=y^ x|2pred/(n-f-1) S R e x p = \/£ X.^xp /( n - f -1 )
Absolute standard deviation
S A = ^ , zjyin-f-U
n number of experimental results
f number of variables In each correlation
Tab. 3 : Characteristic error numbers
IChemE SYMPOSIUM SERIES No. 102
279
IChemE SYMPOSIUM SERIES No. 102
280

IChemE SYMPOSIUM SERIES No. 102
281
IChemE SYMPOSIUM SERIES No. 102
Experimental leak mass flux [ 1 0 3 k g / m 2 s ]
© R.P. Collier et al., simulated cracks
A R.P. Collier et al., real cracks
+ C.N. Amos et al., simulated cracks
X H. John et al. (KfK), real cracks
<> H. John et al. (KfK), simulated cracks
Fig. 1 : Comparison between experimental leak mass fluxes and predicted values from the model of R.P. Collier et al. (LEAK-00)
282
IChemE SYMPOSIUM SERIES No. 102
Experimental leak mass flux [ 1 0 3 k g / m 2 s ]
o R.P. Collier et al., simulated cracks
A R.P. Collier et al., real cracks
4- C.N„ Amos et al., simulated cracks
X H. John et al. (KfK), real cracks
O H. John et al. (KfK), simulated cracks
Fig. 2 : Comparison between experimental leak mass fluxes and predicted values from the model of D. Abdollahian et al. I (LEAK-01)
283

IChemE SYMPOSIUM SERIES No. 102
Experimental leak mass flux [ 1 0 3 k g / m 2 s ]
© R.P. Collier et al., simulated cracks
A R.P. Collier et al., real cracks
-f C.N. Amos et al., simulated cracks
X H. John et al. (KfK), real cracks
O H. John et al. (KfK), simulated cracks
Fig. 3 : Comparison between experimental leak mass fluxes and predicted values from the model of D. Abdollahian et al. II
284
IChemE SYMPOSIUM SERIES No. 102
Experimental leak mass flux [ 1 0 3 k g / m 2 s ]
© R.P. Collier et al., simulated cracks
A R.P. Collier et al., real cracks
+ C.N. Amos et al., simulated cracks
X H. John et al. (KfK), real cracks
O H. John et al. (KfK), simulated cracks
Fig. 4 : Comparison between experimental leak mass fluxes and predicted values from the KWU - model
285
IChemE SYMPOSIUM SERIES No. 102
Experimental leak mass flux [ 1 0 3 k g / m 2 s l
© R.P. Collier et al., simulated cracks
A R.P. Collier et al., real cracks
+ C.N, Amos et al., simulated cracks
X H. John et al. (KfK), real cracks
<!> H. John et al. (KfK), simulated cracks
Fig. 5 : Comparison between experimental leak mass fluxes and predicted values from the KfK -model
286
IChemE SYMPOSIUM SERIES No. 102
50
E 40-en
x 30
-30%
a E
a 0)
01
a.
20
10-
Pana-
Xpred
*exp
SR.pred
^R.exp
SA
O /
AM
model
= 10 % = 7 % = 18 % = 15 % = 4356
1 / roflj
• *WF^
- 1
kg/m2s /
/ +
rfiS* Hft + ft)
i
/ O / © (D
/ /+
/ * •rf*/'* *" * ' ti£ ffl * \v
#5: J*r ® • 0
5 <% / ^ 0 o
1 • 1
-30%
10 20 30 40 50
Experimental leak mass flux [10 3 kg /m 2 sJ
© C.N. Amos et al., simulated cracks
A H. John et al. (KfK), real cracks
+ H. John et al. (KfK), simulated cracks
Fig. 6_: Comparison between experimental leak mass fluxes and predicted values from the model of P.Pana and measured pressure drop coefficients
287