Embed Size (px)
Citation preview

KINETCIS AND NITRIFYING POPULATIONS IN NITROGEN REMOVAL PROCESSES AT A FULL-SCALE INTEGRATED FIXED-FILM ACTIVATED SLUDGE
(IFAS) PLANT
Annalisa Onnis-Hayden*, Daniel Dair**, Chandler Johnson**, Andreas Schramm*** and April Z. Gu*
*Northeastern University 400 Snell Engineering Center, 360 Huntington Ave
Boston, MA 02115, USA **AnoxKaldnes Inc.
***Department of Biological Sciences, Microbiology, University of Aarhus,
ABSTRACT This study evaluated the nitrification rates and kinetics in an Integrated Fixed-Film Activated Sludge (IFAS) plant with two-stage nitrification process at Broomfield, CO. Batch tests were conducted at site with both fixed-film media and suspended mixed liquor from the two nitrification stages. The nitrification rates for mixed liquor only was 2.64 for stage 1 and 2.0 for stage 2 in unit of mgN/gTS/h. The rate for media was 5.89 mgN/gTS-hr for stage 1 and 2.36 mgN/gTS-hr for stage 2. Overall nitrification rate tests with both suspended mixed liquor and media at 40% fill yielded rates of 4.77 mgN/gTS-hr for stage 1 and 2.3 mgN/gTS-hr for stage 2, which agree with the values calculated based the rates obtained with mixed liquor or media alone. The results showed that the nitrification mainly occurs on the media-biofilm and incorporation of the media in the hybrid system increased the nitrification capacity by about 155% for Stage #1 and by 25% for Stage #2. The overall nitrification rate for the stage #1 was 1.12 gNOX-N/m2/d at 20 °C, which agrees with values previously reported. The nitrification rate in stage 2 was 0.28 gNOX-N/m2/d at 20 °C and the very low residual ammonia concentration in stage 2 seems to limit the nitrification rates and yield lower nitrifying biomass. This indicates that the benefits of maintaining higher nitrification activity on the fixed-film starts to diminish with increasing stages of reactor. The observed denitrification rates for raw wastewater ranged from 3.4-5.46 mgNOX-N/gVSS*h at COD of 10 to 50mg/l. When fed acetate, value up to 9.3 mgNOX-N/gVSS*h were found at COD of 90 mg/L. The in situ denitrification rate calculated based on full-scale plant data was 7.28 mgNOX-N/gVSS*h and this value is higher in comparison to similar study conducted with mixed liquor from conventional AS plant as a result of the much shorter SRT (4 days on average) in the suspended mixed liquor in the IFAS system where most of the denitrifiers likely reside. Identification and quantification the nitrifying populations and their distribution on the fixed-film and in the suspended activated sludge were also assessed using quantitative fluorescence in situ hybridization (FISH). The results showed that most AOB nitrifiers are attached to the media and they belong to the Nitrosomonas europaea/eutropha/halophila and the Nitrosomonas oligotropha lineages. NOB were rather abundant in the nitrifying part of the biofilm (10-20% of the total population), and identified as belonging to the Nitrospira sp. NOB of the genus Nitrobacter could not be detected . Only few of both AOB and NOB were detected in the mixed liquor, mostly as very small aggregates, indicating, as the results of the batch test suggested, that nitrification mainly occurs on the media and that the nitrifiers in the mixed liquor are originated from the biofilm by detachment.
3099
WEFTEC®.07
Copyright 2007 Water Environment Federation. All Rights Reserved©
KEYWORDS Integrated Fixed-Film Activated Sludge (IFAS), Nitrification, denitrification, AOB, NOB, FISH. INTRODUCTION AND OBJECTIVES Integrated Fixed-Film Activated Sludge (IFAS) process is a hybrid of both fixed film process and suspended activated sludge system, which has gained popularity and been used for many different applications. There are presently more than 300 treatment plants based on this process in operation or under construction in 47 different countries all over the world (Ødegaard, 2006). This process has been used for municipal, as well as for various types of industrial wastewater treatment (e.g. dairy wastewater Andreottola et al., 2002; chemical wastewater, Wessman et al., 2004). IFAS plants have shown to be successful for nitrogen (N) and phosphorus (P) removal (Christensson and Welander, 2004, Ødegaard, 2006), and have been proved particularly suited for retrofit solution in region where winter temperature usually will limit nitrification (Andreottola et al., 2000, Ødegaard, 2006). Several types of media, fixed media and moving media, each have their own dynamic, can be utilized in IFAS system. Ringlace®, a rope type media, has been used to maintain nitrification throughout the year in Germany (Lessel, 1991) and in the city of Annapolis in the US (Randall and Sen, 1996). Sponge media has also been used to enhance nitrification in winter at the Cox Creek Wastewater treatment in Maryland (Sen et al., 1994). The mostly used biofilm carrier (K1), especially in Europe (Rusten et al., 2003, Ødegaard, 2006), is made of high density polyethylene and is commercialized by Anox-Kaldnes. The main advantages of a IFAS system include: 1) higher capacity with smaller foot-print due to higher biomass inventory and de-coupling of “SRT” and growth rates of slow growers such as nitrifiers that accumulate on fixed-film, 2) inherently more stable performance and resistant to loading changes, 3) increased capacity without increasing solids loading to the secondary clarifiers, and 4) higher operation DO that eliminates the DO-limiting condition for nitrification and aerobic P uptake (especially for plug-flow type reactor). The AnoxKaldnes system, which use medium bubble aeration system are also easy to operate and require less maintenance. However, since the application of IFAS process for biological nutrient removal is relatively new in US, there is still a lack of knowledge and understanding of the performance and microbial population structure and their distribution in the fixed-film and in the suspended activated sludge. Broomfield Wastewater Treatment located in Denver, Colorado is one of the few full-scale municipal wastewater treatment plants that were designed as an IFAS-BNR process in the U.S. The plant has been operating since November 2002 in the IFAS mode and has shown successful N and P removal (Rutt et al., 2006), but a complete analysis of the kinetics and of the microbial communities present at the plant was up to now missing.
3100
WEFTEC®.07
Copyright 2007 Water Environment Federation. All Rights Reserved©

Therefore, the objectives of this study were: 1) Evaluate the nitrification rates and kinetics that occur in both the fixed-film media and the suspended activated sludge in the two-stage nitrification process at the plant; 2) Identify and quantify the nitrifying populations and their distribution on the fixed-film (media) and in the suspended activated sludge; 3) Assess the denitrification rates and kinetics at the plant and compare with conventional BNR plants; 4) Investigate the potential occurrence of simultaneous nitrification and denitrification in the system via nitrogen balance. METHODOLOGY Batch tests for nitrification rates evaluation To determine the nitrification rates and kinetics, batch tests were conducted on site at the Broomfield WWTP. Figure 1 shows the plant layout; the nitrification is performed in two parallel lines, each including two staged IFAS aeration basins in series (# 1 and #2 in Figure 1) and the nitrification rates were determined for both stages separately. The biofilm carrier type is the Anox-Kaldnes K1, which is made of high density polyethylene (density 0.95 g/cm3); the effective surface area for biofilm growth is 500 m2 per m3 bulk volume of carriers and the water volume displaced by the carriers is about 6.4% with a volumetric filling of 30%. Figure 1. Process schematic of Broomfield BNR/IFAS facilities.
Primary effluent
FEQ return
#1 #2
#1 #2
To secondary clarifiers
Mixed liquor recycle
Mixed liquor recycleRAS from clarifiers
IFAS Aerobic basins (media and ML)
Anaerobic and Anoxic basins (ML only)
Primary effluent
FEQ return
#1 #2
#1 #2
To secondary clarifiers
Mixed liquor recycle
Mixed liquor recycleRAS from clarifiers
IFAS Aerobic basins (media and ML)
Anaerobic and Anoxic basins (ML only)
Primary effluent
FEQ return
#1 #2#1 #2
#1 #2#1 #2
To secondary clarifiers
Mixed liquor recycle
Mixed liquor recycleRAS from clarifiers
IFAS Aerobic basins (media and ML)
Anaerobic and Anoxic basins (ML only)
In order to assess the nitrification enhancement due to the media, nitrification tests were carried out for each stage in a 2-L beaker using: 1). mixed liquor (ML) alone, 2). mixed liquor with the media (about 40% of the total volume) and 3). media alone (40% fill in secondary effluent). For the test with media only, the carriers were previously rinsed twice in clarified effluent to remove any suspended biomass (MLSS). After collection of sample from the aeration basin and transfer in the 2-L beaker, aeration was applied using an aquarium pump, and the air flow regulated so that the DO level was similar to the one observed in the plant (around 4 mg/l). Sodium bicarbonate and ammonium chloride were
3101
WEFTEC®.07
Copyright 2007 Water Environment Federation. All Rights Reserved©

added to the reactor in order to obtain an equivalent of 200 mg/L as CaCO3 and 20 mg/L as NH4-N, respectively. Samples were collected at 15 minute intervals for about 3 hours; the samples were pre-filter through 100 µm filter paper, re-filtered through 0.45 µm membrane filter and then analyzed for NH4-N, NO2-N and NO3-N. Dissolved oxygen (DO), pH, Temperature and ORP were continuously recorded; pH was adjusted at 7.5 throughout the test by adding 1 M NaOH or 1M HCl, and temperature was maintained at 20 ± 0.3°C. At the end of the test a 100 ml sample was removed from the reactor for MLTSS and MLVSS analysis. Determination of the solids attached to the media was also performed, following the procedure suggested by AnoxKaldnes (2006). Batch tests for denitrification rates evaluation The denitrification kinetics were conducted in 2-L batch reactor which were continuously mixed and kept at a controlled temperature of 20 °C; nitrogen gas was also purged during the test in order to maintain anoxic condition. Raw wastewater and acetate were used as carbon source separately. For each test 2 L of mixed liquor was drawn from the recycle line of the plant, settled and an amount of supernatant equal to that of raw wastewater to be added was discharge. At the beginning of the test the NO3-N concentration was increased to 20-30 mg/L by adding KNO3. A prefixed amount of raw wastewater or acetate was added to the reactor in order to obtain an initial sCOD concentration between 40 and 120 mg/l. The kinetic was followed by collecting samples from the reactor at 10 minute intervals. The samples were paper filtered, re-filtered through 0.45 µm membrane filter and stored at 4 °C until analysis which was done within the first 24 hours. The pH was regulated at 7.5 with 1M NaOH or 1M HCl. The substrate to biomass ratio (F/M) and the COD/N ratio ranged from 0.025 to 0.07 gO2/gO2 and from 2.0 to 7.0 gO2/gN, respectively. Nitrogen species profiles across the plant and nitrogen mass balance The ammonia, nitrite and nitrate concentrations in the influent, in anaerobic zone, anoxic zone and in aerobic zones were measured in three consecutive days to obtain their profiles across the treatment processes, and a nitrogen mass balance. Samples were taken at the same time each day considering the diurnal flow variations. Temperature, DO, pH and COD were also measured for the same sampling locations. Identification and quantification of nitrifying populations Sampling The samples of biofilm on Kaldnes elements or mixed liquor, both drawn from stage 1, were fixed for one hour with paraformaldehyde (PFA, 4%); after fixation the PFA was removed by centrifugation and the samples was washed with phosphate-buffered saline (PBS).
3102
WEFTEC®.07
Copyright 2007 Water Environment Federation. All Rights Reserved©
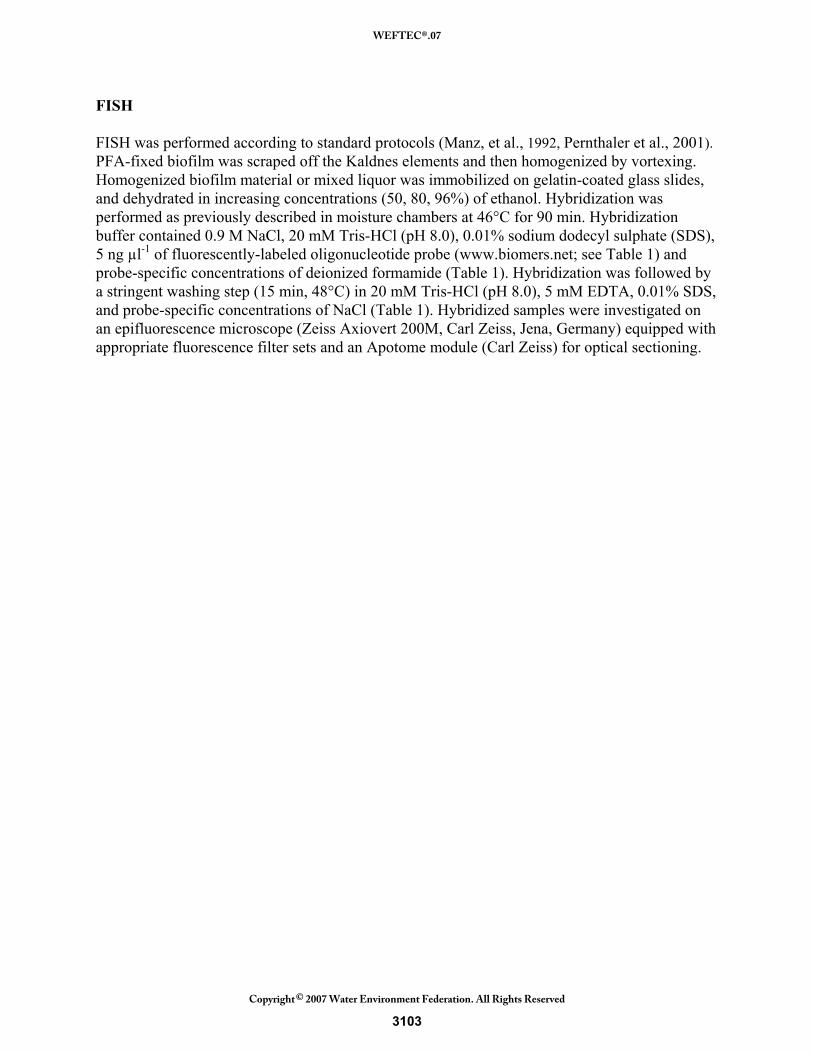
FISH FISH was performed according to standard protocols (Manz, et al., 1992, Pernthaler et al., 2001). PFA-fixed biofilm was scraped off the Kaldnes elements and then homogenized by vortexing. Homogenized biofilm material or mixed liquor was immobilized on gelatin-coated glass slides, and dehydrated in increasing concentrations (50, 80, 96%) of ethanol. Hybridization was performed as previously described in moisture chambers at 46°C for 90 min. Hybridization buffer contained 0.9 M NaCl, 20 mM Tris-HCl (pH 8.0), 0.01% sodium dodecyl sulphate (SDS), 5 ng µl-1 of fluorescently-labeled oligonucleotide probe (www.biomers.net; see Table 1) and probe-specific concentrations of deionized formamide (Table 1). Hybridization was followed by a stringent washing step (15 min, 48°C) in 20 mM Tris-HCl (pH 8.0), 5 mM EDTA, 0.01% SDS, and probe-specific concentrations of NaCl (Table 1). Hybridized samples were investigated on an epifluorescence microscope (Zeiss Axiovert 200M, Carl Zeiss, Jena, Germany) equipped with appropriate fluorescence filter sets and an Apotome module (Carl Zeiss) for optical sectioning.
3103
WEFTEC®.07
Copyright 2007 Water Environment Federation. All Rights Reserved©

Table 1. Oligonucleotide primer and probes used in this study and their respective target groups.
Probe Target Group Sequence (3’-5’) FA/NaCl1 Reference
BET42a2 Betaproteobacteria GCCTTCCCACTTCGTTT 35/80 (Neef et al., 1998)
NSO1225 betaproteobacterial AOB CGCCATTGTATTACGTGTGA 35/80 (Mobarry et al., 1996)
NSV443 most Nitrosospira spp. CCGTGACCGTTTCGTTCCG 30/112 (Mobarry et al., 1996)
NEU23a2 N.europaea/eutropha/halophila CCCCTCTGCTGCACTCTA 40/56 (Wagner et al., 1995)
NSE1472 N.europaea/eutropha ACCCCAGTCATGACCCCC 50/28 (Juretschko et al., 1998)
NmV Nitrosococcus mobilis TCCTCAGAGACTACGCGG 35/80 (Pommerening-Röser et al. 1996)
NmIV Nitrosomonas cryotolerans –lineage TCTCACCTCTCAGCGAGCT 35/80 (Pommerening-Röser et al. 1996)
NmII Nitrosomonas communis-lineage TTAAGACACGTTCCGATGTA 25/159 (Pommerening-Röser et al. 1996)
Nmo218 N.oligotropha/urea-lineage CGGCCGCTCCAAAAGCAT 35/80 (Gieseke et al., 2001)
NIT32 genus Nitrobacter CCTGTGCTCCATGCTCCG 40/56 (Wagner et al., 1996)
Ntspa7122 phylum Nitrospira CGCCTTCGCCACCGGCCTTCC 50/28 (Daims et al., 2001)
Ntspa6622 genus Nitrospira GGAATTCCGCGCTCCTCT 35/80 (Daims et al., 2001)
Pla46/Pla46F phylum Planctomycetes GAC TTG CAT GCC TAA TCC 30/112 (Neef et al., 1998)
AMX368 all anammox bacteria CCT TTC GGG CAT TGC GAA 15/338 (Schmid et al 2003)
AMX368F all anammox bacteria TTC GCA ATG CCC GAA AGG NA3 (Schmid et al 2003)
AMX820/AMX820R anammox genera Brocadia, Kuenenia AAA ACC CCT CTA CTT AGT GCC C 40/56 (Schmid et al 2000)
BS820 anammox genus Scalindua TAA TTC CCT CTA CTT AGT GCC C 20/225 (Kuypers et al., 2003) 1 % formamide in the hybridization buffer and mM NaCl in the washing buffer, respectively 2 Used together with an equimolar amount of unlabeled competitor oligonucleotides as indicated in the reference 3 NA, not applicable (only used as primer in PCR)
3104
WEFT
EC®.07
Copyright 2007 W
ater Environment Federation. A
ll Rights R
eserved©

RESULTS AND DISCUSSION Nitrifcation Rates The results of the nitrification testing are shown in Figure 2 and 3 for stage #1 and stage #2, respectively; Figure 4 compared the specific nitrification rates, calculated by dividing the NOX-N production rates by the solid concentration in each of the test (including both suspended and attached solids). A summary of the results of the nitrification batch tests is presented in Table2. Figure 2. Batch test results showing NOX-N profiles in tests with media plus mixed liquor, media only and mixed liquor drawn from stage #1.
y = 0.191x + 10.78
y = 0.150x + 12.00
y = 0.056x + 11.32
0
5
10
15
20
25
30
35
40
45
0 20 40 60 80 100 120 140 160 180
Time (min)
Con
cent
ratio
n N
Ox-
N (m
gN/L
)
Stage #1 Media & MLStage #1 Media OnlyStage #1 ML Only
3105
WEFTEC®.07
Copyright 2007 Water Environment Federation. All Rights Reserved©

Figure 3. Batch test results showing NOX-N profiles in tests with media plus mixed liquor, media only and mixed liquor drawn from stage #2.
y = 0.051x + 11.77y = 0.040x + 12.63
y = 0.088x + 12.43
0
5
10
15
20
25
30
0 20 40 60 80 100 120 140 160 180
Time (min)
Con
cent
ratio
n N
Ox-
N (m
gN/L
)
Stage #2 Media & MLStage #2 Media Only Stage #2 ML Only
Figure 4. Comparison of specific nitrification rates in stage #1 and stage #2.
2.02
5.87
5.16
1.912.39 2.38
0
1
2
3
4
5
6
7
ML only Media only ML+ Media
Nitr
ifica
tion
rate
(mgN
/gTS
*h)
Stage #1Stage #2
The specific nitrification rates in the tests conducted with only mixed liquor from stage # 1 and # 2 were very similar as expected since it is the same ML; the slightly higher value obtained in stage # 1 ML can be probably attributed to the larger amount of nitrifiers in the sloughing off from the thicker biofilm (more nitrifiers) in stage #1. That the biofilm thickness was
3106
WEFTEC®.07
Copyright 2007 Water Environment Federation. All Rights Reserved©

substantially different in the two reactors was initially recognized by visual inspection (thinner and darker biofilm in media from stage #2) and further confirmed by the higher value of biomass attached on unit media surface area in stage 1 than that of stage 2 (7.93 versus 4.97 g/m2). The specific nitrification rates obtained in the test with media only from stage # 1 was 145% higher that the one from stage # 2. This is a result of higher nitrifying biomass on stage #1 media than stage #2. Nitrification rate on the fixed film is affected by dissolved oxygen (DO), organic loading and ammonium concentration. Bulk ammonium concentration is important only at concentration lower than 1-3 mgNH4-N/l (Ødegaard, 2006) or when the oxygen to ammonium concentration ratio is higher than 2-5 (Hem et al., 1994). In the case of Broomfield the DO level and organic loading are similar for both stages, therefore the different nitrifying population levels, which affect the nitrification rates is likely attributed to the difference in NH4-N level in the two stages. The average NH4-N concentrations were found to be indeed 3.6 mg/L and 0.6 mg/L in stage 1 and 2, respectively, resulting in limiting condition for stage #2. Table 2. Summary of results of the nitrification batch testing.
Stage #1 tests Stage #2 tests
ML only Media
only ML+
Media1 Σ(ML+ Media)2
ML only Media only
ML+ Media1
Σ(ML+ Media)2
Dissolved Oxygen (mg/L) 3.68 4.2 4.2 - 3.58 3.98 3.27 -
Temperature (°C ) 20.1 19.9 20.0 - 20.3 20.0 20.2 -
MLSS (mgTSS/l) 1538 - 698 - 1546 - 1425 -
Attached biomass (g/m2) - 7.93 7.74 - - 4.97 4.46 -
Total biomass (mgTS/l) 1538 1488 2225 2225 1546 1010 2239 2239
Rate gNOx-N/m2/d - 1.12 - - - 0.28 - -
Rate mgNH4-N/gTS/h 2.64 5.89 4.77 4.87 2.0 2.36 2.3 2.13
Rate mgNOx-N/gTS/h 2.02 5.87 5.16 4.66 1.91 2.39 2.38 2.08
Rate mgNH4-N/l/h 4.06 8.76 10.63 12.4 3.10 2.39 5.16 5.55
Rate mgNOx-N/l/h 3.10 8.73 11.47 12.34 2.96 2.41 5.34 5.36
1 Measured value with both media and ML in the reactor 2 Calculated value using test results with Media alone and ML alone separately The nitrification rate per media surface area for the stage #1 was 1.12 gNOX-N/m2/d, which correlated well to values also obtained with Kaldnes carrier K1 used in a hybrid pilot plant (Rusten et al., 2003).
3107
WEFTEC®.07
Copyright 2007 Water Environment Federation. All Rights Reserved©

The specific rates obtained in the test with media and ML combined in stage 1 is higher by 117% than stage 2. The overall specific nitrification rates with both media and ML were also calculated based on the rates determined for media and ML separately and compared with the specific rates obtained in the test with media and ML combined. The results in Table 1 show that these values are almost equivalent. Another thing to notice is the presence of nitrite (up to 2.5 mg/l) in all the tests performed with the sole ML (see Figure 5), whereas in the tests containing only media, the concentration of nitrite remained very low (below 0.2 mg/l); this fact can be seen as a sign of more stable and coupled AOB and NOB population on media than in ML. This observation is consistent with the population analysis results, that showed that majority of AOB and NOBs reside on the media and only a very limited number of AOB and NOB are in the mixed liquor sample. Figure 5. Comparison of nitrite accumulation in batch tests with activated sludge and that in media in stage #1 and stage #2.
0
0.5
1
1.5
2
2.5
3
0 20 40 60 80 100 120 140 160 180
Time (min)
NO
2-N
(mgN
/L)
Stage #1 Activated Sludge OnlyStage #1 Media OnlyStage #2 Activated Sludge OnlyStage #2 Media Only
Based on the measured results, the increased capacity of a hybrid system can be found by comparing the rate of ML+Media with the rate of ML only. The hybrid system increased the nitrification capacity by about 155% for Stage #1 and by 25% for Stage #2. This indicates that the benefits of maintaining higher nitrification activity on the fixed-film starts to diminish as the residual ammonia concentration becomes really low and is limiting the reaction rates. The full scale data shows that the aerobic SRT associated to the suspended biomass is between 3 and 4 days (Rutt et al., 2006), this range is considered in general not sufficient to establish an active and stable nitrifying population at average plant temperature of 17 °C; this fact suggests that it is the media that provides the surface area for growing of the nitrifiers and retains them in the system rather than being washed out, and that nitrification in the suspended portion is mainly due to sloughing of nitrifiers off from the biofilm, which are also conclusions from the population analysis results.
3108
WEFTEC®.07
Copyright 2007 Water Environment Federation. All Rights Reserved©

The nitrification rates measured with either NH4-N or NOX-N are very similar. In fact, the nitrogen balance during the test showed that the amount of NH4-N depleted was comparable to the NOX-N recovered; the lack of consistent nitrogen loss suggested that simultaneous nitrification-denitrification was unlikely occurring during the tests. Simultaneous nitrification-denitrification (SND) has been reported in hybrid system operating with sponge media (Sen et al., 1994), with LinPor cuboids (Warakomski, 2006) and with Ringlace media (Randall and Sen, 1996); in this latest study the SND was increased when a Step Feed configuration was used. Rutt et al., (2006) also suggested that SND was occurring at the plant subject of this investigation; however this fact was not confirmed by the batch test performed. It is possible that the conditions in batch tests deviate from that of the full-scale and SND activity is not supported. Further investigation is needed to assess the potential SND occurring in free floating plastic media IFAS systems. Denitrification Rates Denitrification rates with either the plant influent raw wastewater as carbon source or with sodium acetate as external carbon source were evaluated and Table 3 presents the test conditions and results obtained. Table 3. Condition and results of denitrification rates tests.
Test ID Carbon source Temperature (°C)
F/M (mgCOD/gVSS) COD/N* kD
(mgN/gVSS*h)
1 raw ww 19.8 ± 0.3 0.045 2.95 4.18
2 raw ww 19.9 ± 0.1 0.036 2.18 4.78
3 raw ww 19.7 ± 0.05 0.040 3.40 3.40
4 raw ww 20.0 ± 0.05 0.085 7.23 5.46
5 NaAc 19.8 ± 0.3 0.052 3.42 7.6
6 NaAc 19.8 ± 0.3 0.091 6.02 9.26 * COD/N at the beginning of the test. The maximum specific dentrification rate was determined by a series of batch tests with different initial organic substrate concentrations, with nitrate concentration in excess. Figure 6 shows the specific denitrification rates as function of the initial biodegradable organic concentration (sCOD). Denitrification rate can be expressed, based on the IAWQ model as following:
OIO
IO
NONO
NO
SS
SDD SK
KSK
SSK
Skk
+⋅
+⋅
+⋅= max
3109
WEFTEC®.07
Copyright 2007 Water Environment Federation. All Rights Reserved©

Where: kDmax = maximum specific denitrification rate (mgNOX-N/gVSS*h); SS = sCOD concentration; KS = half-saturation constant for the organic substrate (mg/l). SNO = nitrate concentration; KNO = half-saturation constant for the nitrate (mg/l). SO = Dissolved oxygen concentration; KIO = inhibition coefficient for oxygen (mg/l). The conditions of the tests are so that a simplified model can be used (i.e. excess nitrate and dissolved oxygen concentration equal to 0 mg/l), where only the sCOD concentration is considered to limit the rate:
SS
SDD SK
Skk
+⋅= max
In Figure 6 a curve fit of the results, using the above relationship is also included. The observed denitrification rates for raw wastewater ranged from 3.4-5.46 mgNOX-N/gVSS*h. The results of the tests were compared to the in situ denitrification rates calculated from the plant data of the month in which the tests were carried out, which were found to be higher with value of 7.28 ± 1.52 mgNOX-N/gVSS*h. Higher SDNR were measured using acetate as carbon source, and they ranged between 7.9 to 9.3 mgNOX-N/gVSS*h. This was expected since acetate is a single simple compound that is easily utilized by denitrifiers, whereas municipal wastewater is more complex, and the initial sCOD might also include a non-biodegradable fraction.
3110
WEFTEC®.07
Copyright 2007 Water Environment Federation. All Rights Reserved©

Figure 6. Denitrification rates as function of the initial sCOD concentration.
0
1
2
3
4
5
6
7
8
9
10
0 50 100 150
SDN
R (m
gN/g
VSS/
h)
Initial sCOD (mg/l)
kDmax = 9.14± 1.56 mgN/gVSS*hKS = 13.4 ± 7.5 mg/l
The values obtained in this study were compared in Table 4 to values reported by other investigations. For most municipal WWTPs that perform nitrification and denitrification , the denitrification rate ranges from 2 to 5.6 mgN/gMLVSS*h. The SDNR is affected by SRT, F/M ratio, readily biodegradable COD and nitrate concentration. Comparing to the data shown in Figure 6, the denitrifcation rate observed at WWTPs are limited by readily biodegradable COD (rbCOD) and nitrate concentration in the anoxic denitrification basin. With given COD and NO3-N, SDNR is reversely correlated to SRT; therefore since the IFAS process allows for lower suspended ML SRT (3-5 d in this plant), these type of plants are expected to have higher SDNR than other BNR plants with longer SRTs. Compared to rates observed from other municipal plants obtained in other studies, the SDNR obtained in this study are slightly higher for the raw wastewater and significantly higher for the test conducted with acetate as carbon source. The residual nitrate detected in the anoxic zone effluent indicated that the denitrification was carbon-limiting at the plant.
3111
WEFTEC®.07
Copyright 2007 Water Environment Federation. All Rights Reserved©

Table 4. Denitrification rates in mgN/gMLVSS*h attained with acetate and municipal wastewater (MWW).
Acetate Municipal Wastewater Reference
2-10 0.6-3.0 Henze and Harremoës, 1990
- 3-5 Onnis et al., 2006
3-6 3-5 Naidoo et al., 1998
3-4 2-4 Kujawa and Klapwijk, 1999
7.9-9.3 3.4-5.6 This study Nitrogen species profiles across the plant Figure 7 shows the results of the analysis of the nitrogen species across the different zones in the plant. The mass balance for nitrogen thorough the biological units revealed a complete nitrification, whereas a denitrification efficiency of about 42% was observed. The denitrification efficiency was calculated using the following equation:
( )[ ]( ) 100
))()(()()())()(()((%) ⋅
⋅−+−⋅−+=
ααηEFFNHINFNHINFNO
EFFNOEFFNHINFNHINFNOD SSS
SSSS
Where: (SNO)INF: Concentration of nitrate in influent (mg/l); (SNO)EFF: Concentration of nitrate in the effluent (mg/l); (SNH)INF: Influent concentration of ammonium nitrogen, (mg/l); (SNH)EFF: Effluent concentration of ammonium nitrogen (mg/l). α : correction factor to consider the amount of ammonium nitrogen used for synthesis.
The plant operates with a 1.8 nitrate recycle, and the only carbon source available is the one of the wastewater, since no external carbon source is up to now being used at the plant. Moreover, the nitrate loading due to the influent is quite significant (23-28 kgNO3-N/d, for the days of the test, 40 kgNO3-N/d, on average in the plant). The residual nitrate concentration in the anoxic basin effluent suggested carbon source deficiency in the denitrification zone. However, the high denitrification rates obtained with both raw wastewater and acetate suggest that the sludge from the Broomfield plant is capable of denitrifying at faster rate if readily biodegradable COD is available. Using these data the denitrification rates were between 6.8 – 8.1 mgN/gMLVSS*h, which are higher than value usually found at conventional BNR facilities operating with predenification.
3112
WEFTEC®.07
Copyright 2007 Water Environment Federation. All Rights Reserved©
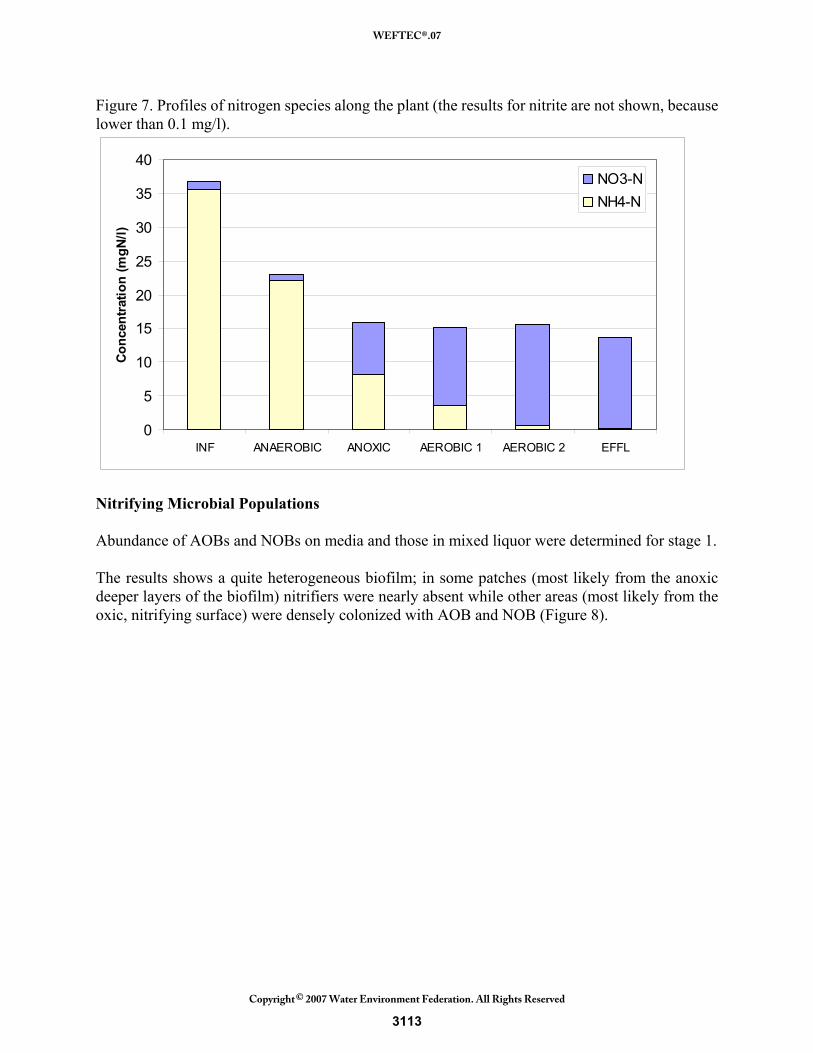
Figure 7. Profiles of nitrogen species along the plant (the results for nitrite are not shown, because lower than 0.1 mg/l).
0
5
10
15
20
25
30
35
40
INF ANAEROBIC ANOXIC AEROBIC 1 AEROBIC 2 EFFL
Conc
entr
atio
n (m
gN/l)
NO3-NNH4-N
Nitrifying Microbial Populations Abundance of AOBs and NOBs on media and those in mixed liquor were determined for stage 1. The results shows a quite heterogeneous biofilm; in some patches (most likely from the anoxic deeper layers of the biofilm) nitrifiers were nearly absent while other areas (most likely from the oxic, nitrifying surface) were densely colonized with AOB and NOB (Figure 8).
3113
WEFTEC®.07
Copyright 2007 Water Environment Federation. All Rights Reserved©
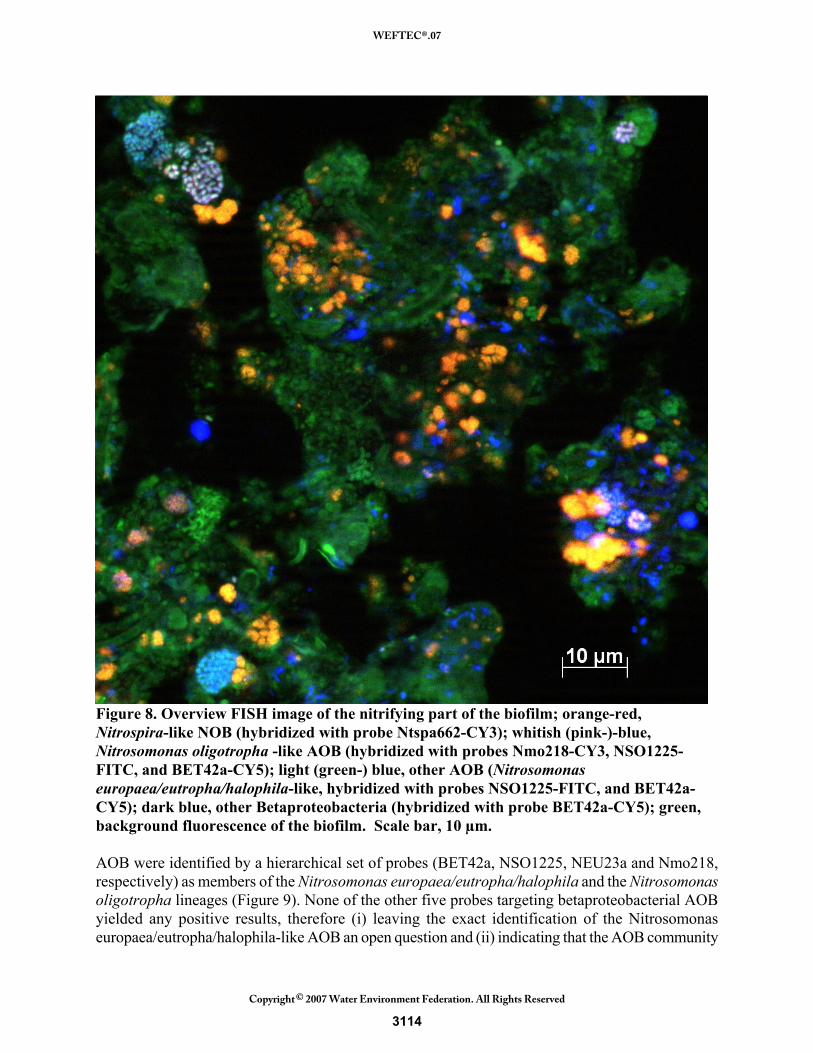
Figure 8. Overview FISH image of the nitrifying part of the biofilm; orange-red, Nitrospira-like NOB (hybridized with probe Ntspa662-CY3); whitish (pink-)-blue, Nitrosomonas oligotropha -like AOB (hybridized with probes Nmo218-CY3, NSO1225-FITC, and BET42a-CY5); light (green-) blue, other AOB (Nitrosomonas europaea/eutropha/halophila-like, hybridized with probes NSO1225-FITC, and BET42a-CY5); dark blue, other Betaproteobacteria (hybridized with probe BET42a-CY5); green, background fluorescence of the biofilm. Scale bar, 10 µm.
AOB were identified by a hierarchical set of probes (BET42a, NSO1225, NEU23a and Nmo218, respectively) as members of the Nitrosomonas europaea/eutropha/halophila and the Nitrosomonas oligotropha lineages (Figure 9). None of the other five probes targeting betaproteobacterial AOB yielded any positive results, therefore (i) leaving the exact identification of the Nitrosomonas europaea/eutropha/halophila-like AOB an open question and (ii) indicating that the AOB community
3114
WEFTEC®.07
Copyright 2007 Water Environment Federation. All Rights Reserved©

of the biofilm consists entirely of these two populations. Both AOB lineages have been previously found in sequencing batch biofilm reactors (e.g. Gieseke et al., 2001) and other systems with high ammonium/high salt environments (Juretschko et al., 1998, Koops et al., 2003) and highly fluctuating conditions (especially oxic/anoxic cycles). In the presumably oxic, nitrifying part of the biofilm, both AOB together accounted for less than 10% of the total population. In the mixed liquor only very few single cells or small aggregates of AOB were detected, most likely originating from the biofilm by detachment.
Figure 9. FISH images of AOB. A: Nitrosomonas europaea/eutropha/halophila-like AOB (red), hybridized with probe NEU23a (blue: all cells, stained with DAPI); B: Nitrosomonas oligotropha -like AOB (yellow), hybridized with probes Nmo218 and NSO1225. Scale bars, 5 µm.
NOB were rather abundant in the presumably oxic, nitrifying part of the biofilm (10-20% of the total population), forming typical cell clusters with extremely small cells (< 1 µm) of Nitrospira sp., as identified by probes Ntspa712 and Ntspa662 (Figure 8). Nitrobacter sp. was not detected. Such high abundance of Nitrospira sp. has been previously reported from sequencing batch biofilm reactors (Gieseke et al., 2001, and Schramm, 2003). Like for AOB, only few NOB were detected in the mixed liquor, mostly as very small aggregates, again indicating that they originated from the biofilm by detachment. From microscopic observation and FISH it is obvious that the biofilm attached to the media in this system is thick enough to be clearly stratified into an upper, oxic layer full of nitrifiers and a lower, anoxic layer that more or less lacks nitrifiers and that does not participate in nitrification in the system. Any meaningful quantification of the nitrifying populations in the system should therefore be done with the spatial stratification of the biofilm in mind, i.e. on thin sections of the biofilm. This was, however, beyond the scope of this project.
3115
WEFTEC®.07
Copyright 2007 Water Environment Federation. All Rights Reserved©

CONCLUSIONS The results of the nitrification tests, coupled with the population analysis provide fundamental understanding of the nitrification performance and dynamics in the IFAS systems. The majority of the nitrification occurs in biofilm on the media, which allows for retaining of the slow growing nitrifiers and nitrification performance in the system therefore no longer depends on the SRT of the suspended mixed liquor. Incorporation of media in the suspended mixed liquor increase the nitrification capacity by 155% in stage 1 and by 25% in stage 2. The nitrification rates in mgN/gTSS-hr for mixed liquor alone were similar for stage 1 and 2 and, for media only, they were 5.89 mgN/gTS-hr for stage 1 and 2.36 mgN/gTS-hr for stage 2. The overall nitrification rate including both mixed liquor and media at 40 % fill was 4.77 mgN/gTS-hr and 2.3 mgN/gTS-hr, for stage 1 and 2, respectively. Although two-stage nitrification process provide more stable performance and lower effluent N, the nitrification rates with media only in the second stage were145% lower than the first stage as the residual ammonia concentration becomes really low and it limits the reaction rates and leads to lower production of nitrifying biomass. This indicates that the benefits of maintaining higher nitrification activity on the fixed-film starts to diminish with increasing stages of reactor. Nitrosomonas europaea/eutropha/halophila and the Nitrosomonas oligotropha lineages were found to be the dominant AOBs and Nitrospira sp. was the dominant NOBs in the IFAS system. The close co-residence of AOBs and NOBs in the biofilm also seems to lead to more stable and complete nitrification compared to that in suspended biomass as indicated by the extent of nitrite accumulation during the nitrification rates testing. Xx for stage 1 and xx for stage 2. The observed denitrification rates for raw wastewater ranged from 3.4-5.46 mgNOX-N/gVSS*h at COD of 10 mg/l to 50 mg/l. When fed acetate, the maximum specific dentrification rate was determined as 9.3 mgNOX-N/gVSS*h at COD of 90 mg/l and the half satuaration constant was 13.4 mg/L/. These results and the nitrogen species profile across the reaction zones indicated carbon deficiency in the denitrifcation znoxic zone. The in situ denitrification rate at the Broomfield plant determined based on full-scale date was on average 7.28 mgNOX-N/gVSS*h. This is relatively higher in comparison to similar study conducted with mixed liquor from conventional AS plant.. SNDR in the anoxic zone is reversely proportional to the SRT and the much shorter suspended mixed liquor SRT (3-5 days versus 10-15 days) led to higher SDNR in an IFAS like Broomfield. In order to achieve both very low effluent nitrogen and phosphorus, the selection of the SRT is crucial and somehow contradictory; longer SRT (>8-20 days) is often required to accomplish complete nitrification, however, shorter SRT (<3-5 days) is desired for facultative denitrifiers to have high denitrification rate and, short SRT is also desired by PAOs for more stable phosphorus removal. The IFAS system consent to operate at low SRT, increasing denitrification rate, and at the same time the presence of the media generates the condition for the development of a stable and efficient nitrifying population.
3116
WEFTEC®.07
Copyright 2007 Water Environment Federation. All Rights Reserved©

ACKNOWLEDGMENTS The authors gratefully acknowledge the personnel at the Broomfield WWTP for all their help during the testing period and Britta Poulsen from the Department of Biological Sciences, Microbiology, University of Aarhus for help with the molecular analyses. REFERENCES Andreottola G., Foladori P.and Ragazzi M. (2000). Upgrading of a small wastewater treatment
plant in a cold climate region using a moving bed biofilm reactor (MBBR) system. Water Science and Technology, 41 (1) pp 177–185.
Andreottola G., Foladori P., Ragazzi M. and Villa R.(2000). Dairy wastewater treatment in a moving bed biofilm reactor. Water Science and Technology, 45(12) pp 321-328.
Anox-Kaldnes (2006). Personal communication. Christensson M. and Welander T. (2004). Treatment of municipal wastewater in a hybrid process
using a new suspended carrier with large surface area. Water Science and Technology, 49(11-12), 207-214.
Daims, H., J. L. Nielsen, P. H. Nielsen, K. H. Schleifer, and M. Wagner. (2001). In situ characterization of Nitrospira-like nitrite oxidizing bacteria active in wastewater treatment plants. Applied and Environmental Microbiology 67:5273-5284.
Gieseke, A., U. Purkhold, M. Wagner, R. Amann, and A. Schramm. (2001). Community structure and activity dynamics of nitrifying bacteria in a phosphate-removing biofilm. Applied and Environmental Microbiology 67:1351-1362.
Hem, L., Rusten, B. and Ødegaard, H. (1994). Nitrification in a moving bed biofilm reactor. Water Research, 28(6), 1425–1433.
Henze M., Harremoës P., La Cour Jansen J. e Arvin E. (1997) Wastewater Treatment – Biological and Chemical Processes, Springer Verlag, Berlin.
Juretschko, S., G. Timmermann, M. Schmidt, K.-H. Schleifer, A. Pommerening-Röser, H.-P. Koops, and M. Wagner. (1998). Combined molecular and conventional analysis of nitrifying bacterial diversity in activated sludge: Nitrosococcus mobilis and Nitrospira-like bacteria as dominant populations. Applied and Environmental Microbiology 64:3042-3051.
Koops, H.-P., U. Purkhold, A. Pommerening-Röser, G. Timmermann, and M. Wagner. (2003). The lithoautotrophic ammonia-oxidizing bacteria, p. http://link.springer-ny.com/link/service/books/10125/. In M. Dworkin and others (ed.), The Prokaryotes: An Evolving Electronic Resource for the Microbiological Community, third edition, release 3.13 ed. Springer-Verlag, New York.
Kujawa K. e Klapwijk B. (1999). A method to estimate denitrification potential for predenitrification system using NUR batch test”. Water Research, 33(10), 2291-2300.
Kuypers, M. M. M., A. O. Sliekers, G. Lavik, M. Schmid, B. B. Jorgensen, J. G. Kuenen, J. S. S. Damste, M. Strous, and M. S. M. Jetten. (2003). Anaerobic ammonium oxidation by anammox bacteria in the Black Sea. Nature 422:608-611.
Lessel, T.H. (1991). First practical experience with submerged rope type (Ringlace) biofilm Reactors for upgrading and nitrification”. Water Science and Technology, 23, 825-834.
Manz, W., R. Amann, W. Ludwig, M. Wagner, and K.-H. Schleifer. (1992). Phylogenetic oligodeoxynucleotide probes for the major subclasses of proteobacteria: problems and solutions. Systematic and Applied Microbiology 15:593-600.
3117
WEFTEC®.07
Copyright 2007 Water Environment Federation. All Rights Reserved©

Metcalf & Eddy Inc. (2003). Wastewater Engineering: Treatment and Reuse, 4th Edition revised by Tchobanoglous G., Burton F.L., and Stensel H. D. McGraw-Hill Science Engineering.
Mobarry, B. K., M. Wagner, V. Urbain, B. E. Rittmann, and D. A. Stahl. (1996). Phylogenetic probes for analyzing abundance and spatial organization of nitrifying bacteria. Applied and Environmental Microbiology 62:2156-2162.
Naidoo V., Urbain V. and Buckley C. A. (1998). Characterization of wastewater and activated sludge from European municipal wastewater treatment plants using the NUR test. Water Science and Technology., 38(1), 303–310.
Neef, A., R. Amann, H. Schlesner, and K.-H. Schleifer. (1998). Monitoring a widespread bacterial group: in situ detection of planctomycetes with 16S rRNA-targeted probes. Microbiology 144:3257-3266.
Ødegaard H. (2006). Innovations in wastewater treatment: the moving bed biofilm process. Water Science and Technology, 53(9), 17–33.
Onnis A., Carucci A. and Cappai. G. (2006). Titration biosensor for estimating the biochemical nitrate demand of municipal and industrial wastes. Journal of Industrial Microbiology and Biotechnology, 33, 243-246.
Pernthaler, J., F. O. Glöckner, W. Schönhuber, and R. Amann. (2001). Fluorescence in situ hybridization (FISH) with rRNA-targeted oligonucleotide probes, p. 207-226. In J. Paul (ed.), Methods in Microbiology, vol. 30. Academic Press Inc., San Diego.
Pommerening-Röser, A., G. Rath, and H.-P. Koops. (1996). Phylogenetic diversity within the genus Nitrosomonas. Systematic and Applied Microbiology 19:344-351.
Randall, C.W., and Sen, D. (1996). “Full-scale evaluation of an integrated fixed-film activated sludge (IFAS) process for enhanced nitrogen removal.” Water Science and Technology
33(12), 155-162. Rusten, B., Merete Nielsen, I., Welander, T. and Rasmussen, V. (2003). Increasing the capacity
of activated sludge plants by using AS/MBBR™ hybrid process with Kaldnes biofilm carriers. Preprint, 5th IWA conference on biofilms systems, 14–17 September, Cape Town, South Africa.
Rutt K., Seda J. and Chandler H. J. (2006). Two year case study of integrated fixed film activated sludge at Broomfield, CO WWTP. Proceedings WEFTEC 06, Dallas, TX.
Schmid, M., U. Twachtmann, M. Klein, M. Strous, S. Juretschko, M. Jetten, J. W. Metzger, K. H. Schleifer, and M. Wagner. (2000). Molecular evidence for genus level diversity of bacteria capable of catalyzing anaerobic ammonium oxidation. Systematic and Applied Microbiology 23:93-106.
Schmid, M., K. Walsh, R. Webb, W. I. C. Rijpstra, K. van de Pas-Schoonen, M. J. Verbruggen, T. Hill, B. Moffett, J. Fuerst, S. Schouten, J. S. S. Damste, J. Harris, P. Shaw, M. Jetten, and M. Strous. (2003). Candidatus "Scalindua brodae", sp nov., Candidatus "Scalindua wagneri", sp nov., two new species of anaerobic ammonium oxidizing bacteria. Systematic and Applied Microbiology 26:529-538.
Sen D., Mitta P., and Randall, C.W. (1994). Performance of fixed film media integrated in the activated sludge reactors to enhance nitrogen removal. Water Science and Technology 30(11), pp 13-24.
Schramm, A. (2003). In situ analysis of structure and activity of the nitrifying community in biofilms, aggregates, and sediments. Geomicrobiology Journal 20:313-333.
Wagner, M., G. Rath, R. Amann, H.-P. Koops, and K.-H. Schleifer. (1995). In situ identification of ammonia-oxidizing bacteria. Systematic and Applied Microbiology 18:251-264.
3118
WEFTEC®.07
Copyright 2007 Water Environment Federation. All Rights Reserved©

Wagner, M., G. Rath, H.-P. Koops, J. Flood, and R. Amann. (1996). In situ analysis of nitrifying bacteria in sewage treatment plants. Water Science and Technology 34:237-244.
Warakomski Alphonse, 2006. Modeling IFAS and MBBR Systems Using LinPor™ Presented at the Joint Use Conference in Albuquerque, New Mexico.
Wessman F.G., Yan Yuegen E., Zheng Q., He G., Welander T. and Rusten B. (2004). Increasing the capacity for treatment of chemical plant wastewater by replacing existing suspended carrier media with Kaldnes Moving Bed™ media at a plant in Singapore. Water Science and Technology 49(11-12), pp 199-205.
3119
WEFTEC®.07
Copyright 2007 Water Environment Federation. All Rights Reserved©