Embed Size (px)
Citation preview

ORIGINAL PAPER
Simultaneous nitrification–denitrification of wastewater: effectof zeolite as a support in sequential batch reactor with step-feedstrategy
L. Guerrero1 • S. Montalvo2 • C. Huilinir2 • A. Barahona1 • R. Borja3 •
A. Cortes1
Received: 22 February 2016 / Revised: 8 June 2016 / Accepted: 28 June 2016 / Published online: 12 July 2016
� Islamic Azad University (IAU) 2016
Abstract One of the technologies used for wastewater
nitrogen removal consists in simultaneous nitrification–
denitrification. The low microbial growth rate and the low
availability of organic material for the denitrification stage
make it necessary to study new operational conditions and
the use of microbial supports. The aim of this study was to
evaluate the operational behavior of a simultaneous nitri-
fication–denitrification process in a sequential batch reactor
utilizing zeolite as a biomass support and step-feed strat-
egy. Two reactors of 2 L were used, one with zeolite and
another without zeolite, both operated at constant temper-
ature (31 �C), varying nitrogen loading rate (NLR) from
0.041 to 0.113 kg total Kjeldahl nitrogen (TKN/m3/day).
After 209 days, removals higher than 86 and 96 % in
nitrogen compounds and organic matter were obtained,
respectively. There was not accumulation of nitrate and
nitrite in any case; this means that there was a simultaneous
nitrification–denitrification in the reactors. The incorpora-
tion of zeolite in the system held higher concentration of
biomass in the reactor; this led to reduce start-up to 21 days
and to improve 11.31 % removal kinetic. The use of a step-
feed strategy prevents events of inhibition by substrate,
even duplicating tolerance to higher NLR for the same
operation time.
Keywords Sequential batch reactor � Simultaneous
nitrification–denitrification � Step-feed � Zeolite
Abbreviations
AOB Ammonia-oxidizing bacteria
BNR Biological nitrogen removal
C/N Carbon/nitrogen ratio
CEC Cation-exchange capacity
COD Chemical oxygen demand
CODs Chemical oxygen demand soluble
DO Dissolved oxygen
FH Free-hydroxylamine
NOB Nitrite oxidizing bacteria
NLR Nitrogen loading rate
ORP Oxidation-reduction potential
PHB PolyHydroxyButyrate
R2 Reactor with chilean natural zeolite
R1 Reactor without chilean natural zeolite
SBR Sequential batch reactor
SND Simultaneous nitrification-denitrification
TKN Total Kjeldahl nitrogen
TSS Total suspended solids
VSS Volatile suspended solids
vvm Volumes per reactor volume per minute
Introduction
The reduction of nitrogen levels from several wastewater
plant effluents containing high concentrations of nitrogen
compounds is necessary because these compounds can be
toxic to aquatic life, causing oxygen depletion and
& L. Guerrero
1 Departamento de Ingenierıa Quımica y Ambiental,
Universidad Tecnica Federico Santa Marıa, Casilla 110-V,
Valparaıso, Chile
2 Departamento de Ingenierıa Quımica, Universidad de
Santiago de Chile, Ave. Lib. Bernardo O’Higgins 3363,
Santiago de Chile, Chile
3 Instituto de la Grasa (CSIC), Campus Universidad Pablo de
Olavide, Edificio 46, Carretera de Utrera km 1, 41013
Seville, Spain
123
Int. J. Environ. Sci. Technol. (2016) 13:2325–2338
DOI 10.1007/s13762-016-1065-5

eutrophication in receiving water and affecting chlorine
disinfection efficiency (Haiming et al. 2011; Song et al.
2011; Wang et al. 2004). Nitrogen compounds can be
removed from wastewaters by a variety of physicochemical
and biological processes (Gao et al. 2015; Montalvo et al.
2011; Ozturk and Bal 2015; Sun et al. 2015). Recently,
several novel and cost-effective biological nitrogen
removal (BNR) processes have been developed, including
partial nitritation, nitrifier denitrification, anaerobic
ammonium oxidation (anammox), and its combined sys-
tems (completely autotrophic nitrogen removal over nitrite,
Canon), among others (Ahn 2006; Chen et al. 2009; Kumar
and Lin 2010; Lan et al. 2011; Zhang et al. 2012). How-
ever, nitrification–denitrification process is still the BNR
process most used at industrial scale (Kim et al. 2013).
Simultaneous nitrification–denitrification (SND) is a
type of technology currently used in ammonium and nitrate
removal. This process has become a versatile and recom-
mended tool in the treatment of wastewater with a high
C/N ratio (Bernet et al. 2000; Guo et al. 2013; Moya et al.
2012). Nitrification is the sequential oxidative transfor-
mation process of ammonium resulting in nitrite (reduced
by ammonia-oxidizing bacteria or AOB) followed by the
oxidation of the nitrite to nitrate due to the action of two
forced chemolithoautotrophic microbial groups (Peng and
Zhu 2006; Shijian et al. 2014). Meanwhile, heterotrophic
microorganisms take the nitrate and reduces it to N2
(denitrification), utilizing organic matter as the electron
donor (Pepper et al. 2006). Taking into account this
sequential characteristic of the SND process, the sequential
batch reactor (SBR) is an attractive choice to carry out it.
The SND process represents a significant advantage over
the conventional separated nitrification and denitrification
process. First, SND process eliminates the serial operation
of two separated tanks and, therefore, requires simpler
operational procedures. In addition, the SND uses 20–40 %
less carbon sources and reduces sludge yield by 30 % when
compared to conventional BNR systems (Guo et al. 2013).
Even though SND has been studied by diverse authors,
especially in the latest years (Guo et al. 2013; Scaglione
et al. 2013; Zheng et al. 2013), the application of this pro-
cess has shortcomings that hinder achieving an adequate
operational robustness: low growth rate of the microorgan-
isms involved in the process, high sensitivity to moderate
concentrations of sulfurs, nitrates and nitrites (Bernet et al.
2001), high energy costs (Cecen 1996) and availability of
organic matter (Guo et al. 2009; Martins et al. 2003). That is
the reason why the search for improvements of the existing
processes has led to the proposal of using zeolite as a
microbial support and ammonium ion exchanger (Hedstrom
2001; Ho and Ho 2012; Mace and Mata-Alvarez 2002; Wei
et al. 2010; Wilderer et al. 2000, 2001).
Zeolite is a mineral of hydrated aluminum silicates
(AlO4/SiO4) (Alejandro et al. 2014; Montalvo et al. 2012)
with a tetrahedral structure, with a high cation exchange
capacity (CEC) and high cation selectivity (Wang and Peng
2010). Specifically, zeolite is a porous material character-
ized by its ability to (1) lose and gain water reversibly; (2)
adsorb molecules of appropriate cross-sectional diameter
(adsorption property or acting as molecule sieves); and (3)
exchange its constituent cations without a major change in
its structure (ion exchange property) (Montalvo et al.
2012). Even though its use has been proposed for nitrifi-
cation and denitrification separately, little has been studied
on its use in SND processes, being the latter one of the
objectives of this work.
The temporary distribution of the pulse feeds, known as
step-feed, results in an adequate strategy to control
parameters in the batch operation such as sediment ability,
availability of carbon and resistance against loading shocks
(Andreottola et al. 2001; Artan and Orhon 2005; Guihua
et al. 2013; Martins et al. 2003). This feeding strategy has
been used in the biological elimination process of nitrogen
(for example nitrification/denitrification) to avoid partial
denitrification and the use of external carbon sources (for
example methanol or acetate) and the associated costs
(Guihua et al. 2013).
Therefore, the main objective of the present study was to
evaluate the operational behavior of BNR to optimize the
removal of nitrogen compounds through the use of a
simultaneous nitrification–denitrification reactor with a
strategy of step-feed, utilizing zeolite as a microbial sup-
port and/or to improve the ammonium removal process.
Materials and methods
Equipment and inoculum
Two reactors of 2 L volume were designed for this study.
A detailed scheme of the reactor is shown in Fig. 1. One
reactor operated with zeolite (with a concentration of
5 g/L, which was added to the reactor at the beginning of
the experiments) and the other without zeolite. From now
on, the reactor with zeolite will be referred to as R2 and the
reactor without zeolite will be referred to as R1. Both
reactors were inoculated with a mixture 70/30 of aerobic/
anaerobic sludge, being the total volume of the inoculum
400 mL, to obtain a final concentration of 3.5 g VSS/L
inside the system. The characteristics of the inoculum
were: 10.07 g TSS/L and 7.08 g VSS/L for aerobic sludge;
28.01 g TSS/L and 22.4 g VSS/L for anaerobic sludge.
Both reactors were installed and assembled as presented in
Fig. 2.
2326 Int. J. Environ. Sci. Technol. (2016) 13:2325–2338
123

The aerobic sludge was obtained from an activated
sludge plant located in a poultry industry, and the anaer-
obic sludge was collected from an anaerobic digester
treating wastewaters from a tobacco industry in the Val-
paraıso Region, Chile.
Characteristics and pretreatment of Chilean zeolite
The major mineral contents of the Chilean natural zeolite
used were: clinoptilolite (35 %), montmorillonite (30 %),
mordenite (15 %) and other minerals (20 %). Its chemical
composition was: SiO2 (66.62 %), Al2O3 (12.17 %), CaO
(3.19 %), Fe2O3 (2.08 %) and other chemicals (Wang and
Peng 2010; Montalvo et al. 2012). Previous to be used, the
Chilean zeolite utilized was sieved through a GeyerPrufsieb
(DIN 1170) mesh to obtain particles of 0.08–0.12 cm
diameter applying ASTM C136-01 Method. Afterward,
zeolite was washed with distilled water and dried in an oven
at 110 �C for 1 day.
Operation in batch cycle
The operation was done in cycles of 51 h distributed in 3
ramps (step-feed), each one with a 3 h of anoxic feed, 5.5 h
of agitated anoxic operation and 8.5 h of agitated aerobic
operation.
Both nitrifying and denitrifying substrates were incor-
porated in both reactors in the anoxic phase of each step-
feed by pulses with a flow of 19 mL/min (9.5 volumes per
reactor volume per minute, vvm).
The aeration, 3.4 L/m (1.7 vvm), was carried out in an
intermittent form (pulses). At the end of the third ramp, a
sedimentation stage was incorporated (3.5 h), and finally
with the unloading, the cycle (1.5 h) was finished.
Increasing NLR from 0.031 to 0.112 kg TKN/(m3 day)
was used; the carbon/nitrogen ratio was kept constant
during the experiment (C/N = 5), and the reactors operated
in darkness at 31 �C of temperature.
Synthetic wastewater
Table 1 shows the synthetic substrates (nitrifying and
denitrifying) composition used as feed in the experiments.
Operation strategy
Table 2 shows the duration of each stage as well as the
NLR and aeration flows used in the different steps of the
experiments carried out.
Fig. 1 SBR-SND reactor scheme
Fig. 2 SND-SBR reactors
assembly scheme
Int. J. Environ. Sci. Technol. (2016) 13:2325–2338 2327
123

Chemical analysis
Chemical oxygen demand (COD) and solids analyses were
carried out according to the 5220D and 2540B methods,
respectively, of the Standard Methods for the Examination
of Waters and Wastewaters (APHA 2012). Nitrate, nitrite
and ammonium nitrogen were determined by spectropho-
tometry using the 4500-NO3-, 4500-NO2
- and 4500-am-
monium standard methods, respectively. pH and oxidation–
reduction potential (ORP) were determined by selective
electrodes. All determinations were made in triplicate.
Statistic analysis
For the statistic processing and analysis of the data, the
software Minitab 8 was utilized. The tests obtained by
Minitab 8 were related to descriptive statistics, Anderson–
Darling normality tests and ANOVA analysis; all of them
were applied in all cases, and a comparison of confidence
intervals for mean values was made with a confidence level
of 95 %.
Results and discussion
Microbial growth
Figure 3 shows the VSS concentration in the reactors over
operation time. During the start-up, there was a decrease in
the biomass present in both reactors, reaching values close
to 2000 mg VSS/L. This behavior can be attributed to the
biomass washed that does not sediment properly (days
0–14). However, close to day 17, the biomass present in the
reactor with zeolite (R2) was 7.85 % higher than the
amount found in the reactor without zeolite (R1). Specifi-
cally, during days 35 and 56, there were two peaks of the
biomass increase in R2. On day 39, the biomass growth
rates were 12 and 9 mg VSS generated/(L day), and on day
56, the rates were 39 and 23 mg VSS generated/(L day) for
R2 and R1, respectively. From the previous observation, it
is possible to highlight that the biomass in R2 needed less
time for the start-up when compared to R1 (35 and 56 days
respectively); this may be due to the use of zeolite. Fer-
nandez et al. (2007) using scanning electronic microscopy
observed, in a fluidised bed anaerobic reactor with natural
zeolite as microbial support, a large accumulation of
microorganisms in the interior of the ruggedness and on the
superficial zones, which were more protected from friction.
Therefore, it was demonstrated that natural zeolite pos-
sesses excellent physical characteristics as a microorgan-
ism support medium. Most recently, Montalvo et al.
(2014a) and Guerrero et al. (2014), when operating with
fluidized anaerobic reactors and UASB, respectively,
observed the acceleration of the start-up stage upon uti-
lizing natural zeolites in both types of reactors. The use of
zeolites also accelerated the start-up of the nitrogen
removal processes (Montalvo et al. 2014b).
After day 28, the NLR increased from 0.041 to 0.069 kg
TKN/(m3 day). A variation in the biomass (VSS) concen-
tration in both reactors could be observed, which is again
Table 1 Nitrifying and
denitrifying substrate
components
Nitrifying substrate Denitrifying substrate
Compound Concentration (g/L) Compound Concentration (g/L)
(NH4)2SO4 33.533 NaCH3COO 5.000
MgSO4 9 7H2O 0.0365 Peptone 0.480
K2HPO4 0.247 Yeast extract 0.200
KH2PO4 0.193 NaCO3 1.000
K2HPO4 7.000
KH2PO4 5.400
Table 2 Temporary
distribution of the increase of
NLR during the study period
including aeration flows used
Stage NLR
(kg TKN/(m3 day)
Aeration flow
(l/min/vvm)
Operation time
(day)
Start-up 0.031 1.54 (0.77) 0–28
Operation 0.041 1.54 (0.77) 28–65
0.041 3.42 (1.71) 65–100
0.053 3.42 (1.71) 100–117
0.069 3.42 (1.71) 117–154
0.089 3.42 (1.71) 154–178
0.113 3.42 (1.71) 178–209
2328 Int. J. Environ. Sci. Technol. (2016) 13:2325–2338
123

being observed at a higher growth rate in R2 compared to
R1 at a NLR of 0.069 kg TKN/(m3 day) (59 and 55 mg
VSS generated/(L day), respectively).
By increasing the NLR to 0.089 kg TKN/(m3 day) (day
150), it was observed that the biomass concentration in R2
was 4000 mg VSS/L, value quite stabilized, while in R1, it
drastically decreased to 42 % of its initial value although it
slightly increased after day 150. This suggests that under
these conditions, the biomass adhered to the zeolite was
able to maintain itself in the system.
Since the measured mean biomass concentration values
were relatively similar to each other, an ANOVA was done
so as to observe whether there were significant statistical
differences between the VSS values in both reactors. The
results showed that the mean values of VSS-R1 and VSS-
R2 were different with a 95 % confidence level. This
demonstrates the effect of zeolite avoiding the loss of
biomass in a system for the removal of nitrogen.
It was concluded from these results that in both reactors,
there existed fluctuations in the biomass, but the use of
zeolite decreased the VSS amounts leaving the reactor, and
the mentioned differences in both reactors were statistically
significant.
Ammonium removal
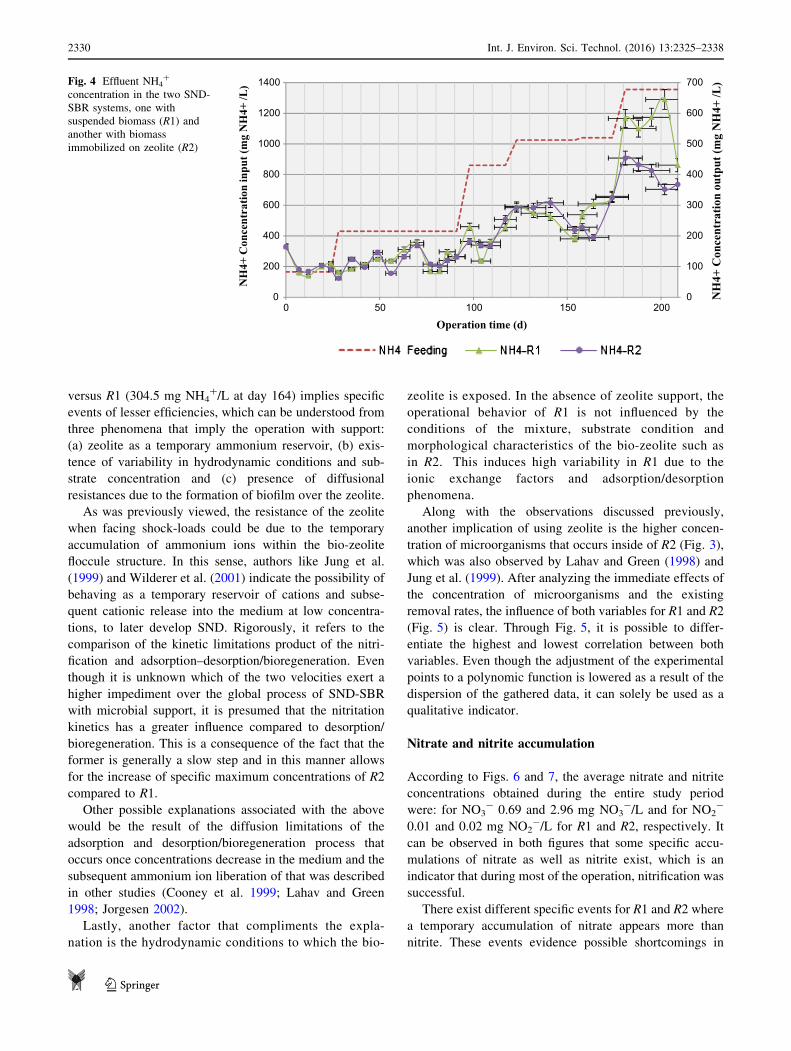
The average NH4? removals obtained during the entire
study period were of the same order of magnitude,
86.1 ± 6.6 and 86.9 ± 6.1 % for R1 and R2, respectively.
Meanwhile, the NH4? concentrations from the effluent
discharges were 161 ± 72 and 142 ± 79 mg NH4?/L for
R1 and R2, respectively (Fig. 4). The largest difference
between the values of NH4?-N occurred at higher NLR
values (day 202), where the reactor with zeolite (R2) had a
higher removal efficiency, maintaining effluent concentra-
tions lower than 400 mg/L. The above is consistent with
the highest biomass concentration achieved in this system
with biomass immobilized on zeolite (Fig. 3).
The higher variance of R2 with respect to R1 can be
explained through a comparison of the maximum and
minimum value of each reactor and the implications of the
microbial support facing the SND process. Maximum
NH4? removals of 94.9 % (day 12) and 93.5 % (day 28)
were achieved for R1 and R2, respectively, while the
minimum corresponded to 61.8 (day 164) and 61.9 % (day
141) for R1 and R2, respectively, observing a slight dif-
ference between R1 and R2.
The best behavior of SND of R2, based on the highest
growth of microorganisms and slightly higher ammonium
removal efficiencies, can be a consequence of various
causes: (a) formation of anoxic/aerobic microenvironments
due to biofilm thickness; (b) boosting of SND metabolism
between the microbial populations due to the formation of
specific microbial communities within the biofilm;
(c) higher concentration of microorganisms by sedimenta-
tion and cellular retention; and (d) ionic exchange of NH4?
between the zeolite and its liquid environment.
The physics phenomenon behind the incorporation of
zeolite will allow for the creation of anoxic/aerobic zones
due to the increase in the size of the bio-zeolite floccules in
R2 when compared to floccules in R1 (Montalvo et al. 2005;
Wilderer et al. 2000). That is to say, the conditions for the
establishment of the SND are favored in R2. At the same
time, the zeolite will allow for in R2, on a microenviron-
mental scale, the adequate microbial ecological morphology
for the concurrent coexistence of nitrifying and denitrifying
microorganisms within the same floccules, allowing for the
boosting of SND metabolism in comparison with R1 (Chiu
et al. 2007; Zhang et al. 2009; Jia et al. 2011; Verma et al.
2013). The implications of the symbiont coexistence prob-
ably lie in that both microbial groups would establish a more
expedited link for the metabolic pathways of the oxidation
of ammonium and reduction of nitrate/nitrite, favoring the
biological process of SND.
On the other hand, the existence of the maximum con-
centration values in R2 (308 mg NH4?/L at day 141)
1000
2000
3000
4000
5000
0 50 100 150 200
VSS(m
g/L)
Opera�on �me (d)
VSS R1 VSS R2
Fig. 3 Microbial growth
behavior in the two SND-SBR
systems, one with suspended
biomass (R1) and another with
biomass immobilized on zeolite
(R2)
Int. J. Environ. Sci. Technol. (2016) 13:2325–2338 2329
123
versus R1 (304.5 mg NH4?/L at day 164) implies specific
events of lesser efficiencies, which can be understood from
three phenomena that imply the operation with support:
(a) zeolite as a temporary ammonium reservoir, (b) exis-
tence of variability in hydrodynamic conditions and sub-
strate concentration and (c) presence of diffusional
resistances due to the formation of biofilm over the zeolite.
As was previously viewed, the resistance of the zeolite
when facing shock-loads could be due to the temporary
accumulation of ammonium ions within the bio-zeolite
floccule structure. In this sense, authors like Jung et al.
(1999) and Wilderer et al. (2001) indicate the possibility of
behaving as a temporary reservoir of cations and subse-
quent cationic release into the medium at low concentra-
tions, to later develop SND. Rigorously, it refers to the
comparison of the kinetic limitations product of the nitri-
fication and adsorption–desorption/bioregeneration. Even
though it is unknown which of the two velocities exert a
higher impediment over the global process of SND-SBR
with microbial support, it is presumed that the nitritation
kinetics has a greater influence compared to desorption/
bioregeneration. This is a consequence of the fact that the
former is generally a slow step and in this manner allows
for the increase of specific maximum concentrations of R2
compared to R1.
Other possible explanations associated with the above
would be the result of the diffusion limitations of the
adsorption and desorption/bioregeneration process that
occurs once concentrations decrease in the medium and the
subsequent ammonium ion liberation of that was described
in other studies (Cooney et al. 1999; Lahav and Green
1998; Jorgesen 2002).
Lastly, another factor that compliments the expla-
nation is the hydrodynamic conditions to which the bio-
zeolite is exposed. In the absence of zeolite support, the
operational behavior of R1 is not influenced by the
conditions of the mixture, substrate condition and
morphological characteristics of the bio-zeolite such as
in R2. This induces high variability in R1 due to the
ionic exchange factors and adsorption/desorption
phenomena.
Along with the observations discussed previously,
another implication of using zeolite is the higher concen-
tration of microorganisms that occurs inside of R2 (Fig. 3),
which was also observed by Lahav and Green (1998) and
Jung et al. (1999). After analyzing the immediate effects of
the concentration of microorganisms and the existing
removal rates, the influence of both variables for R1 and R2
(Fig. 5) is clear. Through Fig. 5, it is possible to differ-
entiate the highest and lowest correlation between both
variables. Even though the adjustment of the experimental
points to a polynomic function is lowered as a result of the
dispersion of the gathered data, it can solely be used as a
qualitative indicator.
Nitrate and nitrite accumulation
According to Figs. 6 and 7, the average nitrate and nitrite
concentrations obtained during the entire study period
were: for NO3- 0.69 and 2.96 mg NO3
-/L and for NO2-
0.01 and 0.02 mg NO2-/L for R1 and R2, respectively. It
can be observed in both figures that some specific accu-
mulations of nitrate as well as nitrite exist, which is an
indicator that during most of the operation, nitrification was
successful.
There exist different specific events for R1 and R2 where
a temporary accumulation of nitrate appears more than
nitrite. These events evidence possible shortcomings in
0
100
200
300
400
500
600
700
0
200
400
600
800
1000
1200
1400
0 50 100 150 200
NH
4+ C
once
ntra
tion
outp
ut (m
g N
H4+
/L)
NH
4+ C
once
ntra
tion
inpu
t (m
g N
H4+
/L)
Operation time (d)
Fig. 4 Effluent NH4?
concentration in the two SND-
SBR systems, one with
suspended biomass (R1) and
another with biomass
immobilized on zeolite (R2)
2330 Int. J. Environ. Sci. Technol. (2016) 13:2325–2338
123

denitrification or an imbalance between the velocities of
nitrification–denitrification, a behavior similar to that
described by Li et al. (2007).
In the case of nitrate, it is possible to explain these
events due to the lack of organic material product of the
highest growth rates observed in Fig. 3 (periods 0–35,
70–71 and 109–117 days) that would evidence the uti-
lization of carbon sources for cellular synthesis before
being used for substrate oxidation. Another reason for
which temporary accumulation would exist is the high
probability of the production of free hydroxylamine (FH)
(Walters et al. 2009; Wang et al. 2008).
On the other hand, it is presumed that the nitrite accu-
mulations in the initial phases are mainly due to the effects
of insufficient dissolved oxygen (DO) (0.70 and 0.75 mg
O2/L in R1 and R2) for nitrite-oxidizing bacteria (NOB)
(Chiu et al. 2007; Verma et al. 2013) in the process of
adapting to the SBR operational conditions (days 0–70).
From these values and in accordance with studies done by
other authors (Walters et al. 2009; Wang et al. 2008),
aeration was increased (to 1.45 and 1.28 mg O2/L for R1
and R2 respectively), leading to the posterior reduction in
the existing accumulation of nitrite (from days 73–209).
The previous observations are coherent with those descri-
bed by authors such as Munch et al. (1996) and Breisha
(2010), who indicate the existence of the same conditions
of ‘‘NOB washout’’ at a DO\1.0 mg O2/L through pulsed
aeration.
Another observation that may be relevant is the existing
differences between R1 and R2 in the accumulation of both
nitrate and nitrite. In most cases, the accumulations or the
elevated nitrate values appeared in instances such as a
disturbance or increase in nitrogen load. Therefore, it is
possible that the nitrate-forming bacteria generated nitrate;
y = 2E-16x6 - 2E-12x5 + 5E-09x4 - 3E-06x3 - 0.0082x2 + 11.438x - 1929R² = 0.4234
y = 2E-13x5 - 3E-09x4 + 1E-05x3 - 0.0204x2 + 15.662x - 2176.3R² = 0.6138
0
200
400
600
800
1000
1200
1400
1500 2000 2500 3000 3500 4000
Met
abol
ized
NH
4+co
ncen
trat
ion
(mg
NH
4+ /L
)
VSS (mg SSV/L)
R1:
R2:
Fig. 5 Correlation between the metabolized ammonium and biomass concentration in the two SND-SBR systems, one with suspended biomass
(R1) and another with biomass immobilized on zeolite (R2)
0
5
10
15
20
25
30
35
0 50 100 150 200
NO
3-co
ncen
trat
ion
(mg
NO
3-/L
)
Operation time [d]
NO3-R1 NO3-R2
Fig. 6 Nitrate concentration in
the two SND-SBR systems, one
with suspended biomass (R1)
and another with biomass
immobilized on zeolite (R2)
Int. J. Environ. Sci. Technol. (2016) 13:2325–2338 2331
123

however, the nitrite-forming bacteria that utilize nitrate as
substrate were not capable of taking and converting all the
generated nitrate at the same speed as it is produced. In the
same manner, the nitrite accumulation is due to a relatively
low conversion of nitrite to nitrogen. These accumulations
were observed predominantly in the reactor with zeolite,
considering that the conversion to nitrate may be faster in
this case.
Removal of total and soluble organic matter
The average concentrations of total COD exiting the
reactors (Fig. 8) were 938.0 and 932.7 mg COD total/L,
reaching removal percentages of 96.3 ± 2.5 and
95.4 ± 4.2 % for R1 and R2, respectively. On the other
hand, the soluble COD removal efficiencies were
97.5 ± 1.9 and 97.1 ± 3.9 % for R1 and R2, respectively,
with the highest variance resulting in R2 over R1 (15.7 and
3.7, respectively).
The small differences in the variances of the removal
efficiencies for R1 and R2 can be attributed to the higher
diffusional limitations of both the total and soluble organic
matter when it passes to the interior of the bio-zeolite. In the
case of R1, it does not present the diffusional limitation
pertaining to the biofilm–zeolite interphase within the floc-
cule. However, in the case of R2, the presence of this lim-
itation would make it difficult for the organic matter to enter
the interior of bio-zeolite, reducing removal percentages.
It is interesting to highlight that the points pertaining to
the maximum efficiencies of total and soluble COD cor-
respond to the same points described previously (Fig. 3)
where each system presents a higher microbial growth rate.
0 50 100 150 200
NO
2-co
ncen
trat
ion
(mg
NO
2-/L
)
Operation time [d]
NO2-R1 NO2-R2
0
0.01
0.02
0.03
0.04
0.05
0.06Fig. 7 Concentration of nitrite
in the two SND-SBR systems,
one with suspended biomass
(R1) and another with biomass
immobilized on zeolite (R2)
0
1000
2000
3000
4000
5000
6000
7000
8000
0
2000
4000
6000
8000
10000
12000
14000
16000
18000
0 50 100 150 200
CO
D-T
con
cent
ratio
n ou
tput
(mg
CO
D-T
/L)
CO
D-T
conc
entr
atio
n in
put
(mg
CO
D-T
/L)
Operation time [d]
Fig. 8 Total COD
concentration entering (C) and
exiting in the two SND-SBR
systems, one with suspended
biomass (R1) and another with
biomass immobilized on zeolite
(R2)
2332 Int. J. Environ. Sci. Technol. (2016) 13:2325–2338
123

Due to the very similar values obtained for total and
soluble COD, an ANOVA test was carried out so as to view
statistical differences. The results showed that in the case
of total COD the differences were not significant, in spite
of overlapping confidence intervals of both series of data.
The opposite occurs with soluble COD, where there existed
differences, with a 95 % confidence level; therefore, in this
case, the data revealed different behavior and performance
of the two reactors.
Behavior profiles of pH/ORP
It is observed in Fig. 9 that the pH profiles for each NLR
studied present behavior tendencies similar to previous
studies done in SND systems and reported in the literature
(Ga and Ra 2009; Guo et al. 2009; Li et al. 2007; Wang
et al. 2008). With respect to the ORP behavior, increments
of this parameter were observed during the anoxic stage,
eventually identifying the points where there only existed
carbon oxidation (RCMP), and subsequently, the ORP
profile drops slowly during the aerobic stage after the
elimination of accumulated nitrates. This can be explained
by the manner in which the substrates were introduced into
the system and because the anoxic phase preceded the
aerobic phase during the cycle.
Another phenomenon exhibited through the pH/ORP
profiles is the coexistence of the characteristic points of the
nitrifying and denitrifying activity in the anoxic stage as
well as in the aerobic stage. In most of the previous figures,
it is possible to observe the presence of the nitrate apex
(NA) and RCMP points in the anoxic stage. That is to say,
in accordance with Chang and Hao (1996) and Li et al.
(2007), that the denitrification of the existing nitrate occurs
simultaneously (in the sludge of the previous or current
cycle), and at the same time, the nitrification of ammonium
is completed. On the other hand, the combination of
ammonia valley (AV) along with nitrate break (NK) in the
aerobic stage is more frequent. The simultaneous occur-
rence of these two points indicates that when nitrification
occurs, the inflexions in the pH profile are formed, while at
the same time, the generated nitrates are eliminated during
this stage, increasing the sulfate reductase activity. These
observations agree with other studies reported in the liter-
ature (Guo et al. 2009; Li et al. 2007).
Finally, the simultaneous occurrence of NA ? RCMP
and AV ? NK combinations indicates that in the anoxic
and aerobic stages, the joint metabolic activity of nitrifi-
cants and denitrificants existed.
It was also observed that there are differences between
the behaviors of R1 and R2 when analyzing the variances in
the pH profiles. As can be appreciated in Table 3, in all the
scenarios of NLR variation, the lowest variance was found
to be in R2 rather than R1. Comparatively, the
characteristics of the ionic exchanger and buffer control
when facing changes in the environment, resulting from the
use of zeolite, would explain the differences between both
reactors, which globally incorporate characteristic
improvements for the SND system.
SND-SBR kinetics
The kinetic study was carried out jointly with the pH/ORP
profile shown in Fig. 9f for a NLR of 0.113 kg NTK/
(m3 day) at 3-h intervals between readings.
The ammonium concentration peaks are those per-
taining to each stage of feeding of the step-feed process.
During the first 3 h, there exists a rapid decrease in
ammonium concentration, although it is necessary to
highlight the existence of higher kinetics in R2 as
opposed to R1 specially after the third cycle (average
values of this step: 253.5 and 282.1 mg NH4?/(L h) for
R1 and R2, respectively). The kinetic analysis showed that
the incorporation of zeolite to a SND-SBR reactor
improves the reaction rates by 11.31 % when compared to
the reactor without zeolite. This can be explained through
the differences that the support gives in the formation of
the bio-zeolite complex, that is to say, in addition to the
ammonium removal capacity by microbial metabolism,
there is an added adsorption capacity of the zeolite
through diffusion within the floc (Fernandez et al. 2007;
Montalvo et al. 2014a).
In the anoxic stage, there is a minimum concentration of
ammonium that according to Al-Ghusain and Hao (1995)
represents the complete consumption of nitrate and
beginning of anaerobiosis. In light of the fact that there is
no evidence of the accumulation of nitrate in the system, it
is possible to infer that the nitrification and denitrification
rates are found to be in equilibrium in this stage of each
reactor. The previous affirmation is valid during the feed-
ing and anoxic stages of each reactor in the 3 step-feed
process, but is not in the aerobic stage in the case of the
step-feed 1 and 3, for which there are differences in the
rates of denitrification and nitrification, in both reactors,
which cause a temporary accumulation of nitrate and nitrite
in a soft manner in both cases (Fig. 10).
During the aerobic stage, the behavior of both reactors
was similar, and an increase in ammonium concentrations
in both SND systems was observed due to that the
NH4?/NH3 equilibrium tends to go toward the formation
of ammonium.
From a kinetics point of view, with respect to the
organic matter, there exists a rapid soluble COD (CODs)
consumption during the feeding stage for each step-feed
(3769 and 3742 mg CODs/(L h) for R1 and R2, respec-
tively). This can be explained by the rapid penetration of
CODs in the microbial flocs and/or by its storage in the
Int. J. Environ. Sci. Technol. (2016) 13:2325–2338 2333
123

form of slow biodegradability matter such as in the internal
structure of polyhydroxybutyrate (PHB) (Chiu et al. 2007;
Zhang et al. 2009; Jia et al. 2011; Verma et al. 2013).
According to Fig. 11, an increase in organic material
was observed during the aerobic stage. This is coherent
with the observations made by other authors (Zhang et al.
Fig. 9 pH/ORP profiles at different NLR in the two SND-SBR systems, one with suspended biomass (R1) and another with biomass
immobilized on zeolite (R2)
2334 Int. J. Environ. Sci. Technol. (2016) 13:2325–2338
123

0
10
20
30
40
50
60
70
0
200
400
600
800
1000
1200
1400
0:00:00 12:00:00 24:00:00 36:00:00 48:00:00
NO
3-or
NO
2-co
ncen
trat
ion
(mg/
L)
NH
4+co
ncen
trat
ion
(mg/
L)
Cycle time [hh:mm:ss]
NH4+ R1 NH4+ R2 NO3- R1 NO2- R1 NO3- R2 NO2- R2
Fig. 10 Kinetic study of the
ammonium, nitrate and nitrite
removal for both SND-SBR
reactors
Table 3 Variation of pH in
different scenarios of increasing
NLR in the SND-SBR system
with suspended biomass (R1)
and in the reactor with biomass
immobilized on zeolite (R2)
Day NLR (kg TKN/(m3 day) pH Var-pH
R1 R2 R1 R2
35 0.031 7.535 ± 0.111 7.296 ± 0.055 0.012 0.003
70 0.042 7.625 ± 0.097 7.535 ± 0.071 0.009 0.005
91 0.042 ? air 7.847 ± 0.210 7.623 ± 0.084 0.044 0.007
117 0.053 7.849 ± 0.200 7.660 ± 0.142 0.040 0.020
154 0.069 7.948 ± 0.203 7.885 ± 0.178 0.041 0.032
178 0.089 8.064 ± 0.253 8.170 ± 0.149 0.064 0.022
209 0.113 7.456 ± 0.123 7.438 ± 0.142 0.015 0.020
0
2000
4000
6000
8000
10000
12000
14000
16000
18000
0
500
1000
1500
2000
2500
3000
3500
4000
0:00:00 12:00:00 24:00:00 36:00:00 48:00:00
CODSconcen
tra�
on(m
gCO
DS/L)
NH4
+concen
tra�
on(m
g/L)
Cicle �me [hh:mm:ss]
NH4+ R1 NH4+ R2 COD.S R1 COD.S R2
Fig. 11 Kinetic study of the
simultaneous removal of
nitrogen compounds and
organic matter in both SND-
SBR reactors
Int. J. Environ. Sci. Technol. (2016) 13:2325–2338 2335
123

2009), which stated that during the aerobic stages, the
storage sources of organic matter such as PHB are utilized
as a carbon source for SND.
The remnants of ammonium existing in both reactors
indicate that there exists a deficiency of available organic
matter for SND at high NLR values. It is important to
indicate that even though in this study a C/N ratio of 5 was
used, it would be advisable to have used higher values.
Conclusion
The removal of nitrogen compounds and organic matter via
simultaneous nitrification and denitrification was achieved
in sequential batch reactors using zeolite as microorganism
support as well as with suspended biomass. It was evi-
denced, from the simultaneous coexistence of characteristic
points in pH/ORP profiles of each aerobic and anoxic stage,
that the major part of the operation consisted in simulta-
neous nitrification and total denitrification, without the
accumulation of NO3- and NO2
-. The incorporation of
zeolite in a SND-SBR system allowed for achieving higher
biomass growth rates in the reactor with immobilized
biomass compared to the results found in the reactor with
suspended biomass, in addition, reducing the process start-
up time. The kinetic analysis showed that the incorporation
of zeolite to a SND-SBR reactor improves the reaction
rates by 11.31 % when compared to the reactor without
zeolite. The temporary distribution of the feeding through
step-feed decreases the substrate inhibition events in an
immobilized SND-SBR reactor as well as in a conventional
reactor, even duplicating the tolerance for high NLR for the
same operation time.
Acknowledgments The present study thanks the Conicyt-Fondecyt
for the financial support given to the following projects: Nos.
1090414/2009 and 1130108/2013.
Abbreviations
AOB Ammonia-oxidizing bacteria
BNR Biological nitrogen removal
C/N Carbon/nitrogen ratio
CEC Cation exchange capacity
COD Chemical oxygen demand
CODs Chemical oxygen demand soluble
DO Dissolved oxygen
FH Free hydroxylamine
NOB Nitrite-oxidizing bacteria
NLR Nitrogen loading rate
ORP Oxidation–reduction potential
PHB Polyhydroxybutyrate
R2 Reactor with Chilean natural zeolite
R1 Reactor without Chilean natural zeolite
SBR Sequential batch reactor
SND Simultaneous nitrification–denitrification
TKN Total Kjeldahl nitrogen
TSS Total suspended solids
VSS Volatile suspended solids
vvm Volumes per reactor volume per minute
References
Ahn YH (2006) Sustainable nitrogen elimination biotechnologies: a
review. Process Biochem 41:1709–1721
Alejandro S, Valdes H, Manero MH, Zaror C (2014) Oxidative
regeneration of toluene-saturated natural zeolite by gaseous
ozone: the influence of zeolite chemical surface characteristics.
J Hazard Mater 274:212–220
Al-Ghusain I, Hao OJ (1995) Use of pH as control parameter for
aerobic/anoxic sludge digestion. J Environ Eng 121:225–235
Andreottola G, Foladori P, Ragazzi M (2001) On-line control of a
SBR system for nitrogen removal from industrial wastewater.
Water Sci Technol 43(3):93–100
APHA—American Public Health Association/American (2012)
Water works association/water environment federation, Standard
methods for the Examination of Water and Wastewater, 22nd
ed., Washington
Artan N, Orhon D (2005) Mechanism and design of sequencing batch
reactors for nutrient removal. IWA Publishing, London
Bernet N, Delgenes N, Akunna JC, Delgenes JP, Molettta R (2000)
Combined anaerobic–aerobic SBR for the treatment of piggery
wastewater. Water Res 34:611–619
Bernet N, Dangcong P, Delgenes JP, Moletta R (2001) Nitrification at
low oxygen concentration in biofilm reactor. J Environ Eng
ASCE 127:266–271
Breisha G (2010) Bio-removal of nitrogen from wastewaters—A
review. Nat Sci 8(12):210–228
Cecen F (1996) Investigation of partial and full nitrification charac-
teristics of fertilizer wastewaters in a submerged biofilm reactor.
Water Sci Technol 34(11):77–85
Chang CH, Hao OJ (1996) Sequencing batch reactor system for
nutrient removal: ORP and pH profile. J Chem Technol
Biotechnol 67:27–38
Chen HH, Liu ST, Yang FL, Xue Y, Wang T (2009) The development
of simultaneous partial nitrification, ANAMMOX and denitrifi-
cation (SNAD) process in a single reactor for nitrogen removal.
Bioresour Technol 100:1548–1554
Chiu YC, Lee LL, Chang ChN, Chao A (2007) Control of carbon and
ammonium ratio for simultaneous nitrification and denitrification in a
sequencing batch bioreactor. Int Biodeterior Biodegradation 59:1–7
Cooney E, Booker N, Shallcross D, Stevens G (1999) Ammonia
removal from wastewaters using natural australian zeolite. Pilot-
scale study using continuous packed column process. Sep Sci
Technol 34:2741–2760
Fernandez N, Montalvo S, Fernandez-Polanco F, Guerrero L, Cortes
I, Borja R, Sanchez E, Travieso L (2007) Real evidences about
zeolite as microorganisms immobilizer in anaerobic fluidized
bed. Process Biochem 42:721–728
Ga CH, Ra CS (2009) Real-time control of oxic phase using pH
(mV)-time profile in swine wastewater treatment. J Hazard
Mater 172:61–67
Gao JL, Oloibri V, Chys M, De Wandel S, Decostere B, Audenaert
W, He YL, Van Hulle SWH (2015) Integration of autotrophic
nitrogen removal ozonation and activated carbon filtration for
treatment of landfill leachate. Chem Eng J 275:281–287
2336 Int. J. Environ. Sci. Technol. (2016) 13:2325–2338
123

Guerrero L, Vasquez M, Barahona A, Montalvo S, Borja R (2014)
Denitrification via nitrite in a UASB reactor using Chilean
zeolite as microbial support. Int J Environ Res 7:17–26
Guihua C, Shuying W, Yongzhen P, Zhijia M (2013) Biological
nutrient removal by applying modified four step-feed technology
to treat weak wastewater. Bioresour Technol 128:604–611
Guo J, Peng Y, Wang S, Zheng Y, Huang H, Wang Z (2009) Long-
term effect of dissolved oxygen on partial nitrification perfor-
mance and microbial community structure. Bioresour Technol
100:2786–2802
Guo J, Zhang L, Chen W, Ma F, Liu H, Tian Y (2013) The regulation
and control strategies of a sequencing batch reactor for
simultaneous nitrification and denitrification at different temper-
atures. Bioresour Technol 133:59–67
Haiming H, Chunlian X, Wei Z (2011) Removal of nutrients from
piggery wastewater using struvite precipitation and pyrogenation
technology. Bioresour Technol 102:2523–2528
Hedstrom A (2001) Ion exchange of ammonium in zeolites: a
literature review. J Environ Eng 127:673–681
Ho L, Ho G (2012) Mitigating ammonia inhibition of thermophilic
anaerobic treatment of digested piggery wastewater: use of pH
reduction, zeolite, biomass and humic acid. Water Res
46:4339–4350
Jia W, Zhang J, Xie H, Yan Y, Wang J, Zhao Y, Xu X (2011) Effect
of PHB and oxygen uptake rate on nitrous oxide emission during
simultaneous nitrification denitrification process. Bioresour
Technol 113:232–238
Jorgesen T (2002) Removal of ammonia from wastewater by ion
exchange in the presence of organic compounds. University of
Canterbury, Christchurch
Jung JY, Pak D, Shin HS, Chung YCh, Lee SM (1999) Ammonium
exchange and bioregeneration of bioflocculated zeolite in a
sequencing batch reactor. Biotechnol Lett 21:289–292
Kim YM, Park H, Cho KH, Park JM (2013) Long term assessment of
factors affecting nitrifying bacteria communities and N-removal
in a full-scale biological process treating high strength hazardous
wastewater. Bioresour Technol 134:180–189
Kumar M, Lin JG (2010) Co-existence of anammox and denitrifica-
tion for simultaneous nitrogen and carbon removal-strategies and
issues. J Hazard Mater 178:1–9
Lahav O, Green H (1998) Ammonium removal using ion exchange
and biological regeneration. Water Res 32:2019–2028
Lan CJ, Kumar M, Wang CC, Lin JG (2011) Development of
simultaneous partial nitrification, anammox and denitrification
(SNAD) process in a sequential batch reactor. Bioresour Technol
102:5514–5519
Li B, Irvin S, Baker K (2007) The variation of nitrifying bacterial
population sizes in a sequencing batch reactor (SBR) treating
low/mid/high concentrated wastewater. J Environ Eng Sci
6(6):651–663
Mace S, Mata-Alvarez J (2002) Utilization of SBR technology for
wastewater treatment: an overview. Ind Eng Chem Res
41:5539–5553
Martins A, Heijnen J, van Loosdrecht M (2003) Effect of feeding
pattern and storage on the sludge settleability. Water Res
37:2555–2570
Montalvo S, Diaz F, Guerrero L, Sanchez E, Borja R (2005) Effect of
particle size and doses of zeolite addition on anaerobic digestion
processes of synthetic and piggery wastes. Process Biochem
40:1475–1481
Montalvo S, Olivares P, Guerrero L, Borja R (2011) Nitrogen and
phosphorus removal using a novel integrated system of natural
zeolite and lime. J Environ Sci Health A 47:1385–1391
Montalvo S, Guerrero L, Borja R, Sanchez E, Milan Z, Cortes I, de la
Rubia MA (2012) Application of natural zeolites in anaerobic
digestion processes: a review. Appl Clay Sci 58:125–133
Montalvo S, Guerrero L, Robles M, Mery C, Huilinir C, Borja R
(2014a) Start-up and performance of UASB reactors using
zeolite for improvement of nitrate removal process. Ecol Eng
70:437–445
Montalvo S, Guerrero L, Borja R (2014b) Improvement in nitrifica-
tion through the use of natural zeolite: influence of the biomass
concentration and inoculum source. Int J Environ Sci Technol
11:43–52
Moya J, Huilinir C, Peredo K, Aspe E, Roeckel M (2012) Modeling of
simultaneous denitrification–Anaerobic digestion—organic mat-
ter aerobic oxidation and nitrification in an anoxic–anaerobic–
aerobic compact filter. J Biotechnol 160:176–188
Munch E, Lant P, Keller J (1996) Simultaneous nitrification and
denitrification in bench-scale sequencing batch reactors. Water
Res 30:277–284
Ozturk E, Bal N (2015) Evaluation of ammonia-nitrogen removal
efficiency from aqueous solutions by ultrasonic irradiation in
short sonication periods. Ultrason Sonochem 26:422–427
Peng Y, Zhu G (2006) Biological nitrogen removal with nitrification.
Appl Microbiol Biotechnol 73:15–26
Pepper IL, Gerba CP, Brusseau ML (2006) Environmental and
pollution science, vol 2. Academic Press, Boston
Scaglione D, Tornotti G, Teli A, Lorenzoni L, Ficara E, Canziani R,
Malpei F (2013) Nitrification denitrification via nitrite in a pilot-
scale SBR treating the liquid fraction of co-digested piggery/
poultry manure and agro-wastes. Chem Eng J 228:935–943
Shijian G, Yongzhen P, Shuang Q, Ao Z, Nanqi R (2014) Complete
nitrogen removal from municipal wastewater via partial
nitrification by appropriately alternating anoxic/aerobic condi-
tions in a continuous plug-flow step feed process. Water Res
55:95–105
Song YH, Qiu GL, Yuan P, Cui XY, Peng JF, Zeng P, Duan L,
Xiang LCh, Qian F (2011) Nutrient removal and recovery from
anaerobically digested swine wastewater by struvite crystal-
lization without chemical additions. J Hazard Mater
190:140–149
Sun H, Zhaoi H, Bai B, Chen Y, Yang Q, Peng Y (2015) Advanced
removal of organic and nitrogen from ammonium—rich landfillleachate using an anaerobic–aerobic system. Chin J Chem Eng
23:1047–1051
Verma A, Wei X, Kusiak A (2013) Predicting the total suspended
solids in wastewater: a data-mining approach. Eng Appl Artif
Intell 26(4):1366–1372
Walters E, Hille A, He M, Ochmann C, Horn H (2009) Simultaneous
nitrification/denitrification in a biofilm airlift suspension (BAS)
reactor with biodegradable carrier material. Water Res
43:4461–4468
Wang S, Peng Y (2010) Natural zeolite as effective adsorbents in
water and wastewater treatment. Chem Eng J 156:11–24
Wang H, Magesan G, Bolan N (2004) An overview of the
environmental effects of land application of farm effluents
(New Zealand). N Z J Agric Res 47:389–403
Wang J, Peng Y, Wang S, Gao Y (2008) Nitrogen removal by
simultaneous nitrification and denitrification via nitrite in a
sequence hybrid biological reactor. Chin J Chem Eng
16:778–784
Wei YX, Li YF, Ye ZF (2010) Enhancement of removal efficiency of
ammonia nitrogen in sequencing batch reactor using natural
zeolite. Environ Earth Sci 60:1407–1413
Wilderer PA, Arnz P, Arnold E (2000) Application of biofilms and
biofilm support materials as temporary sink and source. Water
Air Soil Pollut 123:147–158
Wilderer PA, Irvine R, Goronszy C (2001) Sequencing batch reactor
technology, 1st edn. IWA Publishing, London
Zhang L, Wei Ch, Zhang K, Zhang Ch, Fang Q, Li S (2009) Effects of
temperature on simultaneous nitrification and denitrification via
Int. J. Environ. Sci. Technol. (2016) 13:2325–2338 2337
123

nitrite in a sequencing batch biofilm reactor. Bioprocess Biosyst
Eng 32:175–182
Zhang Zh, Li Y, Chen Sh, Wang Sh, Bao X (2012) Simultaneous
nitrogen and carbon removal from swine digester liquor by the
Canon process and denitrification. Bioresour Technol 114:84–89
Zheng M, Liu YCh, Xu KN, Wang ChW, He H, Zhu W, Dong Q
(2013) Use of low frequency and density ultrasound to stimulate
partial nitrification and simultaneous nitrification and denitrifi-
cation. Bioresour Technol 146:537–542
2338 Int. J. Environ. Sci. Technol. (2016) 13:2325–2338
123