Embed Size (px)
Citation preview

1
Concentration in the media industry:
drivers and quantitative analysis
The case of the French media industry
The case of the French Television
The case of the French Telecommunications
Paper, International Seminar on the Media,
Columbia University, New-York, March 2010
P.-Y. Badillo et J.B. Lesourd
IRSIC, Université de la Méditerranée, Marseille, France
�� Version non définitive, ne doit pas être Version non définitive, ne doit pas être citée. / citée. / Draft version, should not be quoted.Draft version, should not be quoted.
INTRODUCTION
2
Bibliography
• Forthcoming:
• P.Y. Badillo and J.B. Lesourd (Editors), The
Media Industries and their Markets.
Quantitaive Studies. Palgrave-MacMIllan,
London, forthcoming 2010.
INTRODUCTION
• Globalisation
• New technologies
• New regulation

3
A new environment
• No frontiers
• A meltdown industry
Technology and media concentration in France
• New entrant (which controls ICT): Lagardère/
Hachette; Dassault/ Socpresse
• Media concentration: press freedom and free
markets?

4
Organisation of the presentation
*MARKET POWER, DIVERSITY AND THEIR
MEASUREMENTS
*THE CASE OF THE FRENCH PRESS
*THE CASE OF THE FRENCH TV
CONCENTRATION IN THE MEDIA:
MARKET POWER, DIVERSITY AND
THEIR MEASUREMENTS
5
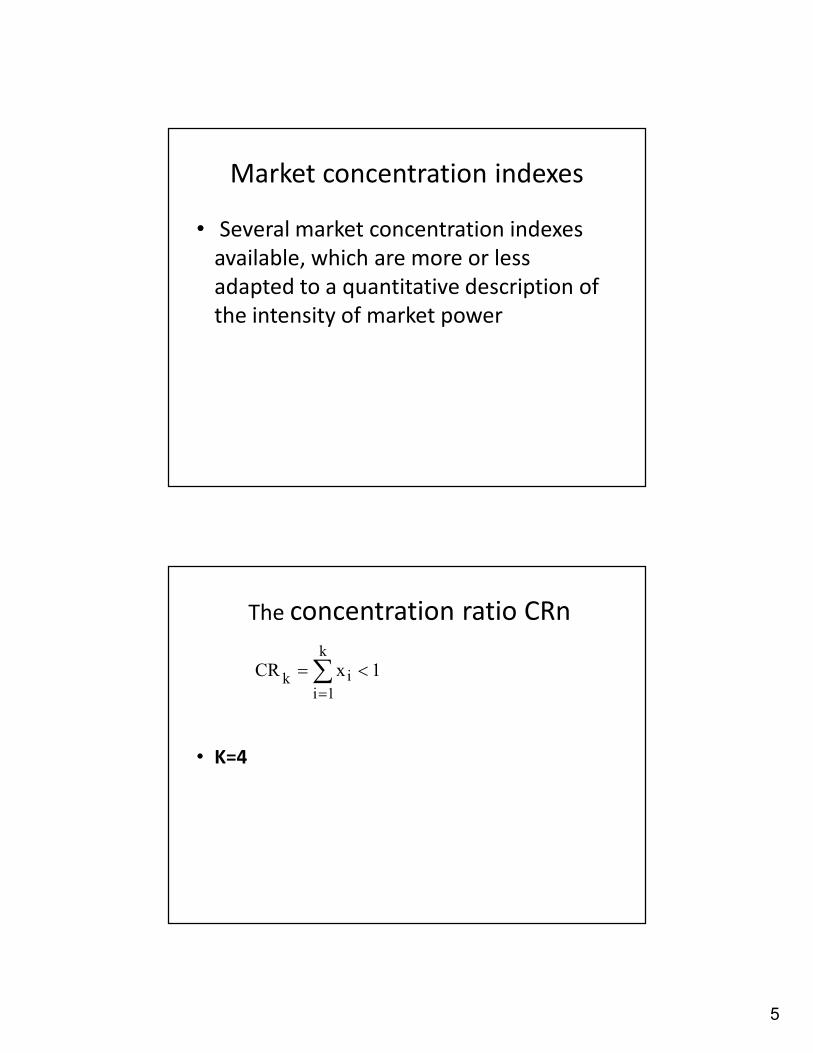
Market concentration indexes
• Several market concentration indexes
available, which are more or less
adapted to a quantitative description of
the intensity of market power
The concentration ratio CRn
• K=4
1xCRk
1i
ik<=∑
=

6
THE HERFINDAHL-HIRSCHMANN
CONCENTRATION INDEX
• Herfindahl-Hirschman concentration index (HHI),defined as follows:
• 1 monopoly;
• HHI = 0 perfect competition
1)x(H H In
1i
2i ≤= ∑
=
DI Index
� The US Federal Trade Commission also introduced a so-
called diversity index (DI)
� This DI index enables one to distinguish between the
diversity of titles, and of radio and TV stations under the
control of given owners
1)y(DIm
1i
2i ≤=∑
=

7
THE NOAM INDEX
• Noam proposes a media-secific diversity index, the
Noam index (NI). Let m be the total number of
independent media outlets. Some of these outlets
with too small audiences (below a given threshold,
for example 1%) are not taken into account. Under
these conditions, the Noam index NI is defined as
the ratio of HHI to the square root of m :
m
)x(
m
H H IN I
n
1i
2
i∑=
==
THE CASE OF THE
FRENCH PRESS

8
Historically…
• …the 19th century, and the beginning of the
20th century can be considered as a golden
age for the French press, which, since the end
of the first world war, has entered into a
period of relative decline. In 1914, there used
to be 322 dailies France, 179 in 1945, but only
66 in 2000. The number of national daily
newspapers, which used to be 26 in 1945,
was only about 10 in 2000.
Magazines
• Magazines, and the specialised general
public press, has grown from 754 titles in
1985 to 1595 titles in 2001.
• The professional specialised technical press is
another strongly growing segment of the
market, from 1109 titles to 1504 titles during
the same period.
• Important evolution in the French press and
media industry (example Dassault/Socpresse)

9
French press compared with other international
media groups
• Sales :
• Le Monde 700 million €;
• Pearson 7 billion €
• Bertelsmann 20 billion €
• Lagardère 14 billion €.
FRENCH PRESS CARTOGRAPHY
• Lagardère media segment (Lagardère Active,
Lagardère Publishing, Lagardère
Services)Lagardère Group (Aerospatial
industry)
• La Provence, Nice-Matin, Paris-Match, Elle
• 1848 (sales)
• G
• 17.80%

10
Larger international groups
• Larger media groups, whether national,international, or global (G) are today veryimportant and even dominant in the Frenchpress and media as they represent almosthalf of the sales (62.1%).
• However, independent groups, some ofwhich are comparatively large, and smallerfamily-owned firms (FI) still account for asizable share of the sales (31.3%).
• Groups in a situation of financial recoveryaccount for 6.6% of our sales.
GLOBAL INDICATORS
• Finally, we calculated several concentration
indexes on the firms, including the market
shares of the largest four, and of the largest
ten groups, and the Herfindahl-Hirschman
Index for all of them.
• CR4 = 45%
• Herfindahl-Hirschman Index (HHI) : 791.4;

11
Various indicators
The largest 4 press firms account for 45% of sales;
the HHI of 791.4 leads to the conclusion that the concentrationin the French press industry is still low, knowing that, a highconcentration starts at a HHI index of 1800.
This estimate can be compared to the HHI estimated Noam(2003) for all American media enterprises, which was of 750for 2002, which is a little smaller than in the French caseaccording to our calculations.
Excluding regional papers and thus taking into account onlythe national press, one can calculate a HHI index of 1206.3,which corresponds to moderate concentration.
• We have therefore restricted ourselves
to the French daily national press, with
11 titles (excluding the Herald Tribune).
French daily national pressFrench daily national press
12
•
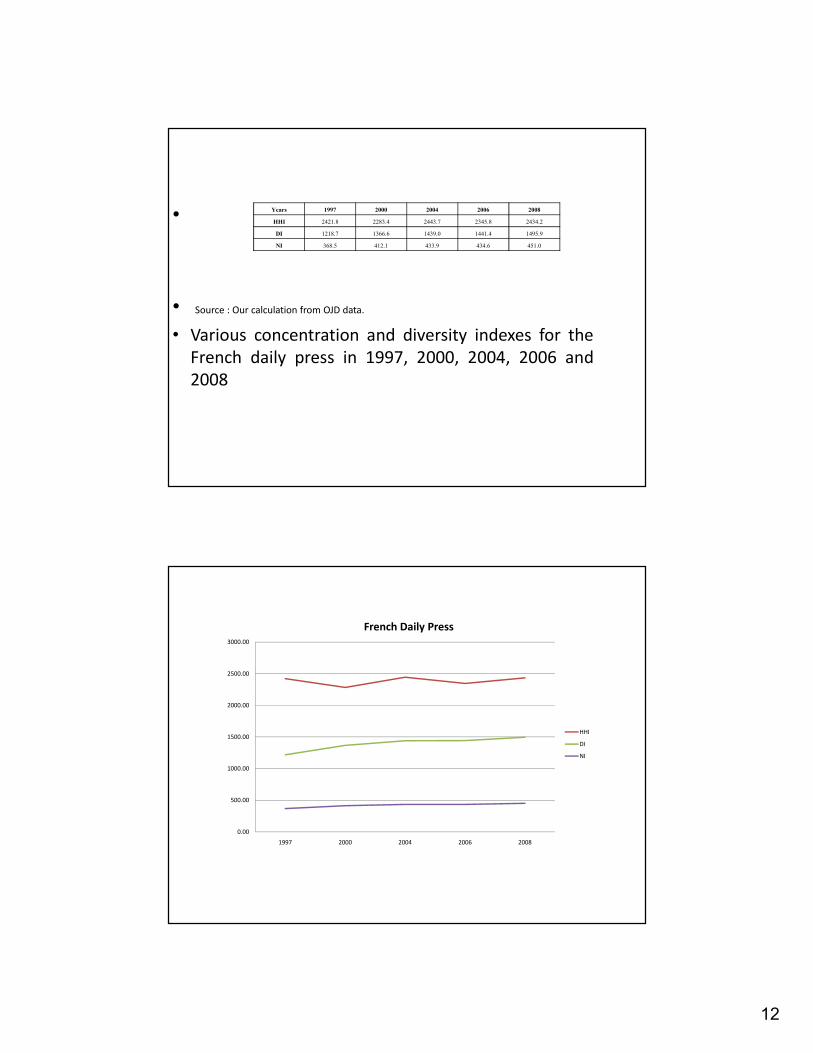
• Source : Our calculation from OJD data.
• Various concentration and diversity indexes for the
French daily press in 1997, 2000, 2004, 2006 and
2008
Years 1997 2000 2004 2006 2008
HHI 2421.8 2283.4 2443.7 2345.8 2434.2
DI 1218.7 1366.6 1439.0 1441.4 1495.9
NI 368.5 412.1 433.9 434.6 451.0
0.00
500.00
1000.00
1500.00
2000.00
2500.00
3000.00
1997 2000 2004 2006 2008
French Daily Press
HHI
DI
NI

13
French daily national press,
• The Herfindahl-Hirschman index was found
to be equal to 2434.2 (2008), a quite high
figure, reflecting a strong concentration of
French press groups on the segment of
national dailies. However, with 11 titles, the
Noam diversity index is at a much lower
value of 451.
The regional press: a very high concentration
• If we discuss the case of the regional press, in most
regions, there is just one daily newspaper. These
monopoly situations are expected, since there are
important economies of scale in the production of
information.
•

14
The regional press (2)
• One can, however, calculate HHI and NI in two regions where
there is more than one daily : Alsace, with two competing
titles (L’Alsace-Le Pays and Les Dernières Nouvelles d’Alsace),
et la Lorraine with three competing titles (L’Est Républicain, Le
Républicain Lorrain, and Est Eclair).
The regional press (3)
• This calculation leads to HHI estimates of 5343.5 and 4415.9
in 2008 for, respectively, Alsace and Lorraine, which
correspond as expected to very high concentrations and
duopoly situations (two competitors). A similar conclusion can
be drawn from the evaluations of the NI indexes, which are of
3778.4 and 2549.5 for, respectively, Alsace and Lorraine.
These figures can be compared with the HHI of 7621 (Noam,
2004) in the case of the American local press, with the same
phenomenon of a quasi-monopoly situation in most states
and cities.

15
CONCLUSIONS
CONCLUSIONS
• For the whole press industry, HHI shows a concentration process, but competition is still important (HHI< 1000)
• New entrants and higher competition:
– Prisma-Bertelsmann, EMAP, PRISA.
• Some French groups (Lagardère) are very present at the world level.
• HHI very high for the French national press (2434.2), varying little since 2000.
• French regional press= monopolies in most regions.

16
The case of the French Television
The case of the French Television
• An interesting methodological questions:
– Metamorphosis of the sector wtih new technology
and new entrants
• Hertzian television (traditional television)
• New entrant like Canal Plus in Hertzian television
(1984)
• New technology like Cable launched in 1982
• Satellite in the 1980’s
• And TNT (Digital Terrestrial Television) which will be
substituted to Hertzian Television by the end of 2011

17
Technological evolution and Technological evolution and
concentration in the TV industryconcentration in the TV industry
• So we have not solve the methodological
question i.e. how to evaluate concentration when
such quick changes are changing the context
technological frontiers and new markets?
• We propose an analysis (and evaluation of the
concentration when data were collected ) of
the different sectors of the television
(Hertzian, Cable, Satellite, Terrestrial TV)
The case of the French Television
Hertzian Television only
Market share (audience) 1989-2009

18
New entrants
• LA 5 (Berlusconi) until 1991 (10,9% of the
market)
• ARTE since 1993 (1,7% in 2007)
• La 5ème France 5 since 1995 (3% in 2007)

19
• Evolution of the HHI
• More concentration when Berlusconi stopped
• And then a constant level
0
5
10
15
20
25
30
35
40
45
50
Share of Public TV
part des chaînes publiques
Part des chaînes publiques (hors nouvelles
chaînes)

20
2009 1 2
France 2 16,7 0,23226704France 3 11,8 0,16411683
France 5 3,1 0,04311544
Arte 1,7 0,02364395
Public 33,3 0,46314325 0,46314325 0,21450167
TF1 26,1 0,36300417 0,36300417 0,13177203
M6 10,8 0,15020862 0,15020862 0,02256263Canal + 1,7 0,02364395 0,02364395 0,00055904
71,9 HHI 0,36939537
HHI for Hertzian TV only
HHI
2800
2900
3000
3100
3200
3300
3400
3500
3600
3700
3800
1989 1990 1991 1992 1993 1994 1995 1996 1997 1998 1999 2000 2001 2002 2003 2004 2005 2006 2007 2008 2009

21
Importance of other TVs
New HHI (including other TV)
2 0 09 1 2
F ra nc e 2 16 ,7 0 ,1 6 7F ra nc e 3 11 ,8 0 ,1 1 8
F ra nc e 5 3 ,1 0 ,0 3 1
A r te 1 ,7 0 ,0 1 7P ub l ic 33 ,3 0 ,3 3 3 0 ,3 3 3 0 ,11 0 8 89
T F 1 26 ,1 0 ,2 6 1 0 ,2 6 1 0 ,06 8 1 21
M 6 10 ,8 0 ,1 0 8 0 ,1 0 8 0 ,01 1 6 64C an a l + 1 ,7 0 ,0 1 7 0 ,0 1 7 0 ,00 0 2 89
1 00 28 ,1 0 ,2 8 1 0 ,2 8 1 0 ,07 8 9 61
71 ,9 N H H I 0 ,26 9 9 24

22
HHI, NHHI and NI (Noam Index)
2.2/ Cable industry from competition to monopoly
2000: HHI= 2124
Noos 26% 0 ,0676F rance
T é lé com
C âble 25% 0 ,0625N um ériC âble 23% 0 ,0529UPC 13% 0 ,0169N TL 2% 0 ,0004D ive rs 11% 0 ,0121
100% 2124

23
Cable industry : in 2009 Numericable
owns the whole cable sector
HHI~10000
2.3/ Different market segments

24
Methodological stakes: a mix of technologies and uses
(television, telecommunications and Internet internet
IssuesIssues
• It will be necessary to aggregate various
segments :
• Methodological stakes: a mix of technologies
and uses (television, telecommunications and
Internet ).
25
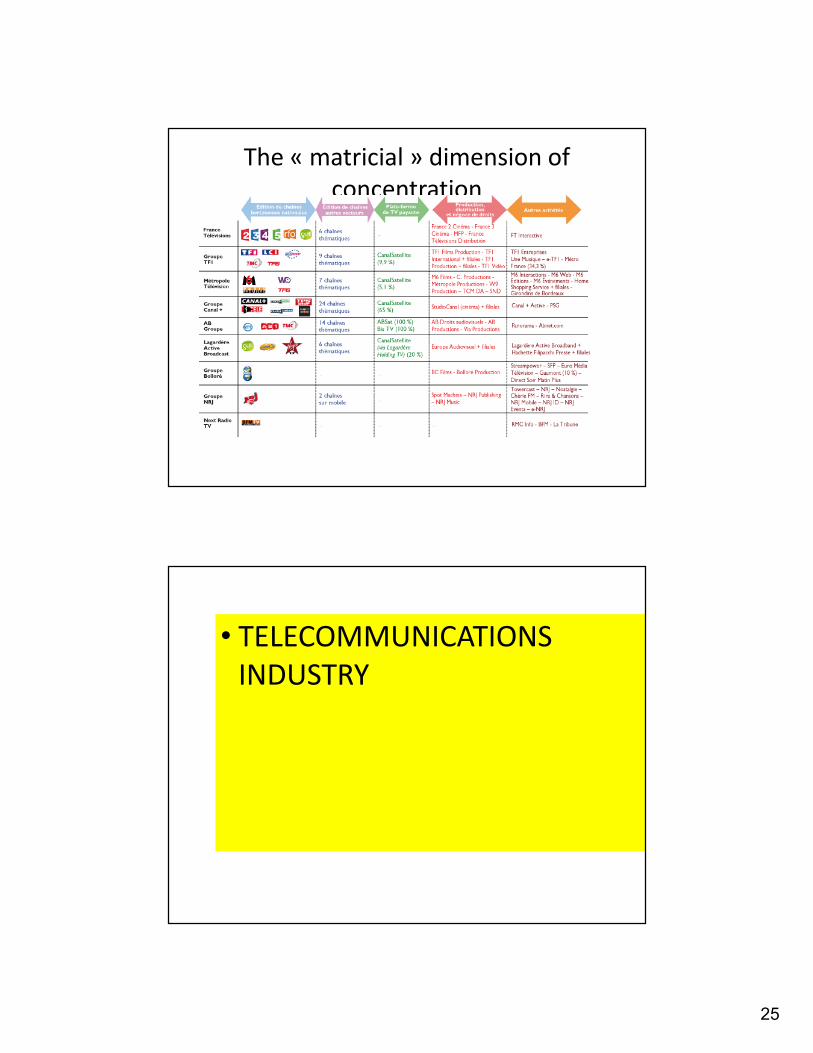
The « matricial » dimension of
concentration
• TELECOMMUNICATIONS
INDUSTRY
26
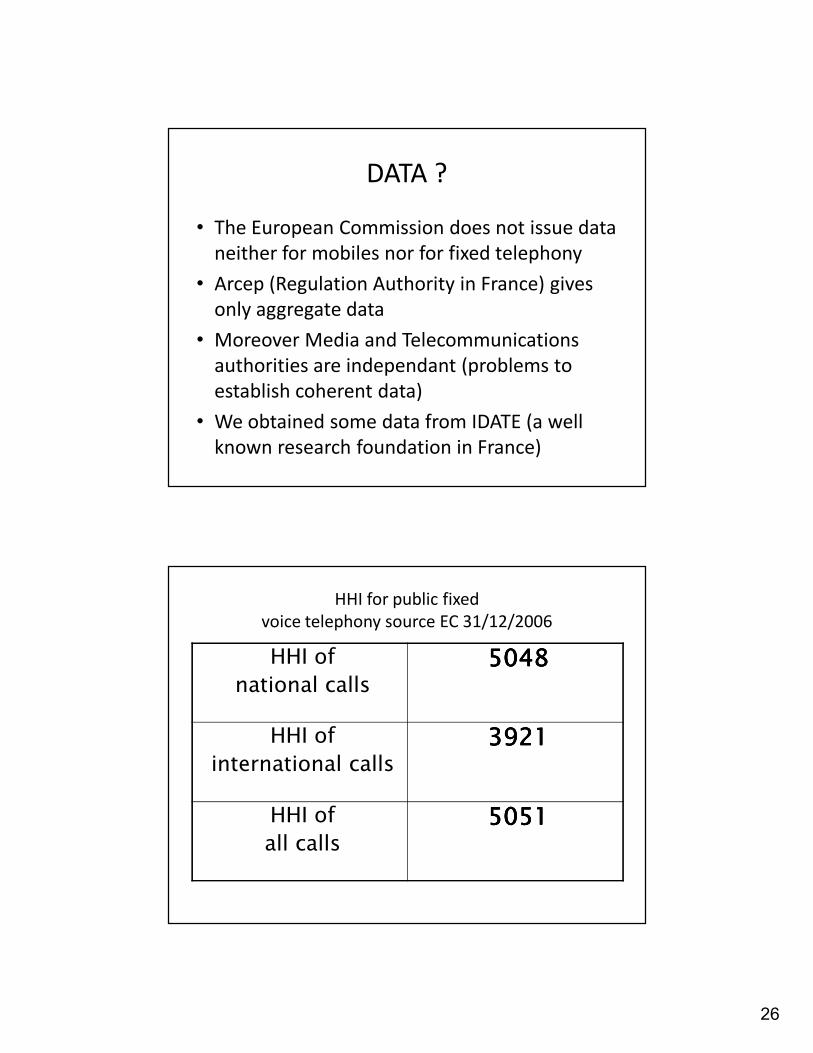
DATA ?
• The European Commission does not issue data
neither for mobiles nor for fixed telephony
• Arcep (Regulation Authority in France) gives
only aggregate data
• Moreover Media and Telecommunications
authorities are independant (problems to
establish coherent data)
• We obtained some data from IDATE (a well
known research foundation in France)
HHI for public fixed
voice telephony source EC 31/12/2006
HHI of
national calls
5048504850485048
HHI of
international calls
3921392139213921
HHI of
all calls
5051505150515051

27
Data from ARCEP (aggregate)Data from ARCEP (aggregate)
DATA FROM IDATE
• Data related to fixed telephony are
aggregated with only three groups
–Historical operator= France Telecom First
group of alternative operators= SFR+
Bouygues
– Second group of alternative operators =
Tele2, Cegetel, Neuf Telecom

28
0
1000
2000
3000
4000
5000
6000
7000
2002 2003 2004 2005 2006 2007 2008
Trafic téléphonie fixe
HHI
Noam
Fixed telephone HHI and NI
Mobile
• From monopoly to triopoly
– Orange
– SFR
– Bouygues
– And MVNO (~5%)
– Emergence of new entrants: MVNO
– Data from IDATE distinguished these four groups

29

30
HHI and NI for the mobile HHI and NI for the mobile
phone industryphone industry
0
1000
2000
3000
4000
5000
6000
7000
8000
1990 1991 1992 1993 1994 1995 1996 1997 1999 2000 2001 2002 2003 2004 2005 2006 2007 2008 2009
Parc clients mobiles
HHI
Noam
Internet/TelecomDATA FROM IDATE
FT/Wanadoo/Orange
Noos
NC Numericable
UPC France
cegetel/SFR
Neuf
Free
club internet
AOL
tiscali
Alice (TI France)
Tele2

31
HHI for internet access HHI for internet access
0
1000
2000
3000
4000
5000
6000
2001 2002 2003 2004 2005 2006 2007 2008 2009
Parc abonnés haut débit
HHI