Embed Size (px)
Citation preview

Dynamic Relationships Management Journal, Vol. 7, No. 2, November 2018 51
INTANGIBLE CAPITAL INVESTMENT AND CORPORATE PRESENCE IN GLOBALVALUE CHAINS IN SLOVENIA
Tjaša RedekUniversity of Ljubljana, Faculty of Economics, Ljubljana, Slovenia,
[email protected]lj.si
Črt KostevcUniversity of Ljubljana, Faculty of Economics, Ljubljana, Slovenia,
[email protected]lj.si
Sonja ŠlanderUniversity of Ljubljana, Faculty of Economics, Ljubljana, Slovenia,
[email protected]lj.si
AbstractFirm inclusion into global value chains is apart from the immediate effect on the demand important also in the longrun due to other effects, such as opening up of new markets, technology and knowledge transfer etc. Innovations atlarge (product and process innovations, organizational, market and marketing innovations), knowledge accumulation,as well as strengthening of corporate capabilities and competencies, represent a major part of investment into intangible or knowledgebased capital. The latter can enhance productivity growth by as much as a third. This paper studiesthe position of Slovenian companies, based on the Business Environment and Enterprise Performance Survey databaseby the EBRD (panels IV and V) to assess the differences in the accumulation of intangible capital between the companies that are active in global markets and those that are not. The results show that the observed differences are mostpronounced in computerized information component of intangible capital, while differences in innovative propertyand investment into strengthening economic competencies are not as large. These results partially reflect the recenteconomic crisis as well as the impact of the service sectors.
Keywords: intangible capital, knowledgebased capital, exportled growth, global value chains
1. INTRODUCTION
Economic growth and development has largelyrelied on the exportled paradigm at least since thesecond World War. A number of successful catchupeconomies, such as Japan, Korea, Singapore, HongKong, as well as more recent European examples(Czech R., Slovakia, Estonia and other) speak infavour of the supremacy of the exportled over importsubstitution paradigm. For example, Palley(2011) mentions that there are three groups of ar
guments that support the exportled paradigm. Thefirst relies on HOS theorem, comparative advantages stream in the literature. The second, the politicaleconomy argument, speaks in favour ofdomestic competition development, and controllingfor domesticrent seeking. The last segment concerns the most discussed benefits, which refer topromotion of production, technology and knowledge transfer, diffusion, productivity, employmentand income growth. Stiglitz and Greenwald (2014),
Vol. 7, No. 2, 5170doi:10.17708/DRMJ.2018.v07n02a05

Dynamic Relationships Management Journal, Vol. 7, No. 2, November 2018
Tjaša Redek, Črt Kostevc, Sonja Šlander: Intangible Capital Investment and Corporate Presence in Global Value Chains in Slovenia
52
in their analysis of industrial policy and successfulexamples of national development plans similarlyspeak in favour of export promotion policies andsupport the thesis that exposure to foreign marketsstimulates technological development, knowledgetransfer and has beneficial trickledown effects.
Participation in exports or trade often impliesthat companies are taking part in global valuechains. Global value chains (GVCs) represent thecontemporary structure of world production, wherefirms source parts, components and services globally and also sell their products worldwide so thattoday, most goods are “made in the world” insteadof a particular country (WB, 2017). Today’s production processes are most often coordinated bytransnational corporations (TNCs) with broad networks of affiliates, different business partners andsuppliers (UNCTAD, 2013). According to the UNCTAD2013 World Investment report, the benefits of corporate participation in global value chains contributes to increasing domestic value added,participation of domestic firms in global economy,helps create more and better jobs, contributes to income growth, stimulates industrial restructuring,technological and knowledge transfer and technological development and has other positive impactson economic development.
From the perspective of emerging economies,GVCs are primarily interesting due to their possibleimpact on technology and knowledge transfer.Today, innovation represents one of the pillars ofgrowth in developed as well as developing countries. Similarly, this is true also for human capital,knowledge, in particular specific skills, as well as thebenefits arising from the ability to process and interpret different information and use them to corporate benefit. In the literature, these elements aremerged under the term “intangible capital” (IC),which was defined first by Corrado et al. (2005, laterpublished in 2009). Later, the OECD terminology labelled the intangible capital as knowledgebasedcapital (KBC) (e.g. OECD, 2013). IC or KBC comprises(1) computerized information (computer software,computerized databases), (2) innovative property(science and engineering R&D, mineral exploration,copyrights and licenses, other product development, design, etc.), (3) economic competencies(brand equity, firmspecific human capital, organi
zational structure). In a recent paper prepared forthe European Commission, ThumThysen et al. estimate that in the period 1995 2013, in eight out of14 EU countries in the sample, intangible assets contribute already more to productivity growth thantangible capital (ThumThysen et al., 2017, p 17).Moreover, findings by Chen et al. (2017) underscorethe importance of intangible assets in generatingvalue in global value chain production: the incomeshare for all products1 (manufactured and soldworldwide from 2000 to 2014) accruing to intangibles averaged more than 30 percent throughout thisperiod, almost double the share for tangibles.
Empirical research confirmed that intangiblecapital positively impacts productivity and growthat macro and micro level (Corrado et al., 2005, 2009,2012, VanArk et al., 2009, Miyagawa et al., 2010,Prašnikar, ed., 2010, Prašnikar et al., 2012, Prašnikarand Knežević Cvelbar, 2012, Prašnikar et al., 2016for Balkan, ThumThysen et al., 2017 for EU15).
As the evidence suggests, intangible capital isimportant for both the developed as well as developing countries. According to OECD (2013) andUNCTAD (2013) the participation in GVCs can stimulate firms upgrading, productivity, technologicaldevelopment, skills strengthening and has otherbenefits. But the literature admits that the benefitsare not automatic but are also related to existing capabilities (related also to intangible capital) in firms.An improved position in GVCs, which implies morebenefits for the domestic economy, is linked to theability of the firm for product and process upgrading, the two being directly linked to innovative capital as part of intangibles. The next option isfunctional upgrading, which is primarily linked tofirms’ capabilities, R&D, as well as marketing, etc.,allowing them to become a more important/notable part of the GVCs. Finally, chain upgrading,which is linked to participating in other, or shiftinglocus to other activities, is again related primarily tointangible capital in firms. In sum, intangible capital
1 Chen et al. (2017) assembled macroeconomic data onvalueadded shares in 19 manufacturing productgroups spanning 43 economies plus one restoftheworld region, which together captured around onequarter of global output.

Dynamic Relationships Management Journal, Vol. 7, No. 2, November 2018 53
represents a strategic resource and a source of potential superior capabilities relative to rival firms(OECD, 2013, p. 229). On the other hand, the existing knowledgebased capital also represents the absorption ability of the firm, implying that firms,which are higher in value chains, also have astronger potential for further improvement.
The purpose of this paper is to investigate thecharacteristics of intangible capital in Slovenia, conditional of firms’ position in global value chains. Todo so, we rely on the EBRD and World Bank jointproject Business Environment and Enterprise Performance Survey data set. The survey data allowsus to investigate the following: (1) what are the general characteristics of investment in intangible capital in Slovenian companies, (2) do the exportingcompanies invest more intensely into different components of intangible capital, and (3) is there a systematic relationship between intangible capital andintensity of the inclusion into global trade flows.
This paper makes several original contributionsto the literature: (1) it is the first paper that investigates the link between global value chains and intangible capital in accordance with the prevailingCorrado et al. (2005) and OECD (2012) definitionand shows that the difference are in many aspectsnot pronounced, which is a result that indicates thatthe domesticbased sectors are catching up, (2) it isthe first paper that investigates the link betweenglobal value chains and intangible capital in Slovenia, (4) it shows that not all components of intangible capital are equally linked to GVCs position, (5) itshows that in Slovenia significant differences existamong firms, including in intangible capital. As suchthe paper contributes to the debates that link theproductivity studies, trade, innovation and open innovation and management literature (primarily resourcebased view of the firm). It stresses theimportance of the intangible capital for firm performance. Consequently, it stresses that the inclusionof firms into global value chains can stimulate learning, innovation, technological restructuring and inthe end run – firm performance, but that the link isnot automatic.
The paper comprises 5 chapters. Following thisintroduction, first, the theoretical background provides the linkages between exporting and presence
in GVC and intangible capital accumulation withspecial focus also on the specific impact of GVC andexporting on IC’s components. Hypotheses are developed. This is followed by presentation ofmethodology and data. The results are presented inthe fourth section. Last, discussion and conclusionwith challenges for future work are provided.
2. LITERATURE REVIEW
Continuous economic progress in developedeconomies, such as the US, Japan and EU15, as wellas efficient catchup process in uppermiddleincome countries, such as Slovenia, largely dependson knowledgebased growth. According to OECD(2013) for example, especially the innovation hasbecome central, not just for developed, but also forthe catchup economies, where it is particularly important that companies realize that innovation isnot just hightech, but that it is important also toimplement other types of innovation in order to develop and sustain learning capabilities. The innovation largely depends on learning and absorptioncapacities of firms, where human capital, competencies and capabilities matter most. These are alsopart of firms’ knowledge capital.
2.1 Intangible and Knowledgebased capital
Intangible capital (IC) or knowledge based capital (KBC) is built by investments that are neithersolid nor “physical”, such as machinery, buildings(Baldwin et al., 2012). OECD (2013) defined knowledgebased capital as (1) computerized information(software and databases), (2) innovative property(design, patents, copyrights, design, trademarks)and (3) economic competencies (including brandequity, firm specific human capital, networks of people and institutions, and organizational knowhow)which overall increase firm performance. The OECD(2013) definition of knowledgebased capital is completely aligned with the Corrado et al. (2005) definition of intangible capital.
Despite the intangible nature of knowledgebased capital, the investments into the differentcomponents of intangible capital represent a significant share of total investment and in some countries

Dynamic Relationships Management Journal, Vol. 7, No. 2, November 2018
Tjaša Redek, Črt Kostevc, Sonja Šlander: Intangible Capital Investment and Corporate Presence in Global Value Chains in Slovenia
54
are comparable in size to the tangible investments.For example, Baldwin et al. (2009) reports that inCanada the intangible investment reached 66% ofthe value invested into tangible investment. According to Corrado et al. (2012) and VanArk et al. (2009)intangible investments in the US and Europe rangebetween 5 and 13% GDP, with the highest in UK, USand Japan. The structure of intangible investmentsdiffers between countries, but in general, informational capital investments are lowest, while often innovative capital investments prevail, but especiallyin the UK, they are comparable to investments intoeconomic competencies. But importantly, as theOECD (2013) notices, in the past decade or sincemid1990s on, primarily the investments into other,noninnovationrelated categories. According toINTANInvest (2017), the shares of investments intoeconomic competencies (as % GDP) in most sampleEU countries significantly surpass those into innovative property (the figures are 3.2% vs 2.6% GDP forEU14 and 3.1% vs 2.2% for the four new memberstates included in the sample), while computer software plays a minor role (1.3% in EU14 and 11% inthe four new member states). The notable exceptions are the Scandinavian countries, Germany andIreland, where innovative property is the main intangible component (as a result of the high propensityfor investing in R&D). In contrast, in the US, the rolesof innovative property and economic competenciesas the main drivers of intangible capital accumulation are very similar (3.5% and 3.7%, respectively).
2.2 Intangible investment and performance
Intangible investments are important becausethey significantly contribute to productivity growth.Corrado et al. (2009) results suggest that intangiblecapital contributes from 25% to 30% to overall productivity growth, similarly is found also by Baldwinet al. (2012) who show that in the period between1976 and 2000 intangible capital contributed between 0.2 and 0.3 percentage points to overall productivity growth. In 2012 study of the growthcharacteristics across Europe and the US, Corradoet al. (2012) find that intangible capital in the 14 investigated countries (selection of the EU and US)on average contributed 19.9% to overall productivity growth, significantly less than multifactor pro
ductivity growth (42%) or tangibles growth (27%).But on the other hand in the US in the period between 1996 and 2007 intangibles contributed33.7% to total productivity growth. And there arealso significant differences between the analysedEU countries.
In the less developed EU countries (Czech,Slovenia) (Table 1) the share of the labour productivity growth “caused” by intangible capital deepening is lowest, in Slovenia even below 10%. Thecontribution was highest in Denmark, Italy, Spain,where it reached over 30%. Partially, this resultsfrom the structure of the economy (services vs.manufacturing) as well as the restructuring of thewhole economies towards a more knowledgebasedeconomy.
2.3 Exporting, global value chains and intangiblecapital
IC comprises three main components informational capital, innovative property and economiccompetencies. The literature shows that all threecan benefit from exposure to foreign influences, increased competition and knowledge transfer. Regarding informational capital, at the moment thereis no direct theoretical linkage between softwareand databases and export, but the literature doesshow that export is related to internal firm factors,informational aspects among others (for exampleRadojevic et al., 2014, Katsikeas and Morgan, 1994).Firms, which are more involved in internationalflows, usually have better access to information,which are often perceived as an important obstacleto exporting, which is particularly important forSMEs as well as companies at large, especially whenconsidering penetrating foreign markets for the firsttime (OECD, 2009, UNIDO, 2006). Research in open,exportled economies of Slovenia, BiH and Albaniaalso confirmed that it is important to have the “relational capital”, which is an extension to the standard definition of intangible capital and involvesinformation and knowledge as well as networkingand established relations (it would be placed somewhere between information capital and economiccompetencies) (Prašnikar, ed., 2010, Prašnikar et al.,eds., 2012, Prašnikar and Knežević Cvelbar, 2012).Bridgman (2013) links information about and size of

Dynamic Relationships Management Journal, Vol. 7, No. 2, November 2018 55
markets to the choice of export mode and thereforeconfirms the linkage existence. And primarily, thebasic exporting literature stresses the importanceof information and success in exports, where ofcourse backward loop is also present (US Department of Commerce, 2009).
Innovative property components and exportsare closely related, which has been well documented by the literature. First of all, export exposescompanies to wider markets and more competition(Stevens et al., 2015, Melitz and Ottawiano, 2007,European Commission, 2016). Steinwender (2015)links technical change to trade, clearly relating productivity growth and competition, where tradestimulates innovation, R&D, patenting as well aseases access to technologies and their transfer. Similarly is argued also by Dahlman (2007), whostresses the access to knowledge, its transfer, adaptation and growth and own development based onthe transfer. This argument is also in line with theopen innovation strand of literature (Chesbrough,
2003, Chesbrough et al., 2013, Chesbrough andBrunswicker, 2006), which focuses on inward andoutward flows that stimulate innovation. Exportstimulated and competitionstimulated activitiesare primarily positive, since they are an inward flowof knowledge, which can positively impact firm levelinnovation. These arguments are also in line withthe Stiglitz and Greenwald (2014) perspective of industrial policy and the role of exportpromotionpolicies as well as a number of documented examples. In general, a number of positive linkages between (open) innovation and exporting have beenidentified. LopezBazo and Motellon (2013) confirmthe linkage for Spain, but also show that despite thelinkage, also other factors, such as regionally specificfactor matter in determining the strength of thelinkage. Seker (2011) stresses that any involvementin trade, not just exports, is important as it stimulates learning and innovation and firm performancewhile Damijan and Kostevc (2015) find a positive linkbetween exporting and innovation in Slovenian
Labourproductivity
growth
Total capitaldeepening Tangible Intangible Labour MFP Share of
intangible in %
Austria 2.4 0.8 0.3 0.5 0.2 1.4 20.83
Belgium 1.8 0.7 0.2 0.5 0.1 0.9 27.78
Czech 4.2 2.4 1.9 0.5 0.3 1.5 11.90
Denmark 1.4 1.2 0.7 0.5 0.2 0.1 35.71
Finland 3.8 0.9 0.2 0.7 0.2 2.6 18.42
France 1.9 1 0.4 0.6 0.4 0.4 31.58
Germany 1.7 1 0.7 0.3 0 0.7 17.65
Ireland 3.8 1.4 0.8 0.6 0.1 2.2 15.79
Italy 0.6 0.7 0.5 0.2 0.2 0.4 33.33
Netherlands 2.3 0.9 0.4 0.5 0.4 1 21.74
Slovenia 5.3 1.7 1.2 0.5 0.7 2.8 9.43
Spain 0.8 1 0.7 0.3 0.5 0.6 37.50
Sweden 3.7 1.9 1.1 0.8 0.3 1.4 21.62
UK 2.9 1.5 0.8 0.7 0.4 1.1 24.14
US 2.7 1.7 0.8 0.9 0.2 0.8 33.33
Table 1. Contributions to the growth of output per hour, 1995 to 2007, in %
Source: Corrado et al., 2012, p. 35.

Dynamic Relationships Management Journal, Vol. 7, No. 2, November 2018
Tjaša Redek, Črt Kostevc, Sonja Šlander: Intangible Capital Investment and Corporate Presence in Global Value Chains in Slovenia
56
firms while recently, Aghion et al. (2018) show in amodel of innovation with heterogeneous firms thata positive export shock should raise innovationmore for more productive firms.
Economic competencies comprise brand equity, firm specific human capital and organizational characteristics. Export has been positivelylinked to all three, either directly, indirectly,causality running from exports to economic competencies, vice versa or the link is endogenous.Following the resourcebased view, branding represents an important advantage in exports (Anholt, 2005, Spyropoulou et al., 2011) andtherefore represents an important considerationfor firms and even countries (WTO, 2000, IES,2013). Human capital represents an importantchannel of absorption as well as means of exporting. First of all, the lack of suitable human capitalis perceived as an important obstacle to trade (EC,2015, OECD, 2009), but it is on the other hand animportant channel of transferring benefits (Forbesand Wield, 2000, Prašnikar et al., 2017, Ito andTanaka, 2013, Minin et al., 2016). According to theresourcebased view, learning, which is stimulatedthrough exposure to foreign knowledge, technologies, organizational solutions will be transferredmore easily, adapted and used to strengthen owncompetencies and capabilities.
3. METHODOLOGY
3.1 Sample and data analysis
The sample comprised 451 firms. On average,these firms had quite a long tradition, those in theBEEPS IV round were established on average in1985, while those from BEEPS V in 1992. In total,small firms (520 employees) represented 50% ofthe sample, medium around 29%, while large firms(with 100 or more employees) represented around20%. The majority of the large firms were in privatedomestic ownership (88% in 2009 and 93% in 2012),while foreign ownership represented in 2009 7%, in2012 4% of ownership structure on average.
The companies in both years were predominantly from the manufacturing sector (in total athird of companies), primarily plastic and rubber,metal, machinery and equipment, nonmetallic min
eral, automotive and electronics. Retail in total represented 29%, transport 4.5%, and construction13% of the sampled firms. In general, the companiesare largely dependent on their key product, whichrepresented in both years above 70% of sales, between 72 and 74%. In manufacturing the numberof competitors the companies face with regards totheir main product was 8.5, while in trade on average a company faced 11.5 competitors and in services 9.9. The competition was strongest inconstruction, where the firms reported on averagefacing 16 competitors.
In BEEPS IV round the companies on average,directly or indirectly exported around 24 % of products, while in round V the importance of the domestic sales in the grew, the export share in totalsales was 16%. The exporters have on average along experience in exporting, around 1216 yearson average.
From the perspective of this research it is important also to understand the basic differences between services and manufacturing. The sample wasdivided into several industrial groups: manufacturing, services, construction, retail and wholesaletrade, tourism, transport and IT. Manufacturing isthe most export oriented, in the 2009 round (IV), amanufacturing firm exported around 45% of product on average (directly just below 40%). By 2012(round V) the share declined to about a third, but isstill significantly larger. Besides manufacturing,transport is also very export oriented, exporting directly or indirectly similarly as manufacturing. Interestingly, during the crisis transport became moreexport oriented, the share of export increased froma third to 45%. Other industries are significantly lessexport oriented, the share being below 10%.
3.2 Operationalization and measure validation
Following the theoretical discussions and thefindings of other authors, there is indication that thepresence of companies in global value chains and intrade would be stimulative to their innovation andlearning. Of course, the relationship is also sectorspecific, as well as dependent on specific time period and sample. Our research will be guided by thefollowing research questions:
Dynamic Relationships Management Journal, Vol. 7, No. 2, November 2018 57
BEEPS round
Industry Variable BEEPS IV BEEPS V
Manufacturing
% of sales related to most important product 67.35 77.02
National sales (% of total) 55.78 66.02
Indirect exports (% of total sales) 5.52 4.32
Direct exports (% of total sales) 38.70 29.66
Construction
% of sales related to most important product 85.57 69.76
National sales (% of total) 93.05 90.38
Indirect exports (% of total sales) 0.05 0.94
Direct exports (% of total sales) 6.90 8.69
Other services
% of sales related to most important product 76.88 94.75
National sales (% of total) 97.88 94.13
Indirect exports (% of total sales) 1.38 0.00
Direct exports (% of total sales) 0.75 5.88
Trade
% of sales related to most important product 73.63 64.06
National sales (% of total) 90.41 94.41
Indirect exports (% of total sales) 2.31 0.04
Direct exports (% of total sales) 7.28 5.56
Tourism
% of sales related to most important product 82.08 75.55
National sales (% of total) 79.69 100.00
Indirect exports (% of total sales) 11.62 0.00
Direct exports (% of total sales) 8.69 0.00
Transport
% of sales related to most important product 85.12 85.31
National sales (% of total) 71.94 54.23
Indirect exports (% of total sales) 3.12 0.77
Direct exports (% of total sales) 24.94 45.00
IT
% of sales related to most important product 71.67 100.00
National sales (% of total) 90.00 70.00
Indirect exports (% of total sales)
Direct exports (% of total sales) 10.00 30.00
Table 2. Descriptive statistics
Data: BEEPS IV, V.

Dynamic Relationships Management Journal, Vol. 7, No. 2, November 2018
Tjaša Redek, Črt Kostevc, Sonja Šlander: Intangible Capital Investment and Corporate Presence in Global Value Chains in Slovenia
58
1. What are the characteristics of firms that trade?a. What is the structure of the Slovenian economy
with regards to the intensity of trade?b. What is the sectoral structure of trade and
what are the target markets? c. Do companies that are B2B or B2C prevail in
trade?2. What is the relationship between the involve
ment in trade and the intangible capital?a. Informational capitalb. Innovative capitalc. Economic competencies
Our study relies on the Business environmentand enterprise performance survey (BEEPS) , whichhas been conducted by the EBRD and the WorldBank since 2002 (repeated in 2005, 2008, 2012 and2015). The aim of the study was to analyse the impact of business environment on firm performance. BEEPS is a firmlevel survey, in which themanagers are asked to evaluate different aspectsof business environment (access to finance, labourmarket, regulation, infrastructure, corruption,crime and other) and answer questions from different aspects of firm performance (human capital,trade, innovation, etc.).
In 2008, the survey methodology changed. Thesamples from different countries comprise primarily manufacturing (excluding extraction), retail andanother group, which covers different services(wholesale, hotels, restaurants, transport, storage,communications, IT). Firms in the survey must haveat least 5 employees.
This paper will rely on the panel dataset thatoriginally covers firms in 2008 and 2012, which intotal incorporates over 25 thousand companiesfrom transition countries. The focus of our research is Slovenia where the dataset comprises451 firms, 271 from round IV and 175 from roundV of the survey.
According to the Corrado et al. (2009) definitionof intangibles, intangibles comprise the following:(1) computerized information, (2) innovative capitaland (3) economic competencies. In detail, the definition of each of the intangibles components comprises the following (Corrado et al., 2006):
1. Computerized information Computer software Computerized databases
2. Innovative property Science and engineering R&D (costs of new
products and new production processes, usually leading to a patent or license)
Mineral exploration (spending for the acquisition of new reserves)
Copyright and license costs (spending for thedevelopment of entertainment and artistic originals, usually leading to a copyright or license)
Other product development, design, and research expenses (not necessarily leading to apatent or copyright)
3. Economic competencies Brand equity (advertising expenditures and
market research for the development ofbrands and trademarks)
Firmspecific human capital (costs of developing workforce skills, i.e., onthejob training andtuition payments for jobrelated education)
Organizational structure (costs of organizationalchange and development; company formationexpenses)
4. RESULTS
Tables 35 and 6 summarize the construction ofvariables based on the EBRD BEEPS data that followsthe definition of intangibles.
Computerized information. The data on the useof informational capital in the data was assessedbased on the use of the computers and the availability and mode of use of internet (Table 3).
In the BEEPS countries, 76% of firms reportedto have high speed internet, in Slovenia over 95%.In BEEPS countries, 88% of companies use email tocommunicate with clients, in Slovenia over 98%, onaverage 69% use internet to purchase (interestinglyin Slovenia 65%), 63% delivered services (in Slovenia70%) and 65% used internet to develop ideas anddo research (in Slovenia only 56%). But in Slovenia,61% of workers were reported to use computer regularly, which was the highest in the sample.

Dynamic Relationships Management Journal, Vol. 7, No. 2, November 2018 59
In Slovenia, there are some difference in the useor intensity of use of internet and computers between exporters and nonexporters. But the internetis used primarily in communication and less in delivering services. In these two aspects, the exportersslightly dominate. But if firms are grouped into 3groups, then the direct exporters use IT less than theother two groups. This might be explained by the
fact that in exports, manufacturing firms dominatemore, while in nonexporting services are stronger.
Innovation activity. Slovenian companies are ingeneral innovation intense. Based on the BEEPSdata, several aspects were investigated (Table 4). Ingeneral, transition countries report that they introduced 7.2 significantly improved or new products or
Nonexporter Exporter Nonexporter
Indirectexporter
Directexporter
2009
Does the firm have a highspeed, broadbandinternet connection on its premises? 96.77 100 98.04 90.91 100
Do you currently communicate with yourclients or suppliers via email 98.37 100 98.06 100 100
Do you use internet to make purchases for thisestablishment 63.79 65.71 60.42 80 65.71
Do you use internet to deliver services 69.49 71.43 65.31 90 71.43
Do you use internet to do research and developideas 59.65 55.88 56.25 77.78 55.88
What % of employees uses computers 61 50.35 62.75 54 50.35
2012
Does the firm have a highspeed, broadbandinternet connection on its premises? 93.75 94.5 93.55 100 94.94
Do you currently communicate with yourclients or suppliers via email 95.83 100 95.7 100 100
What % of employees uses computers 66.88 68.68 68.4 36.5 68.68
Table 3. Computerized information
Data: BEEPS IV, V.
Table 4. Innovation intensity of exporters and nonexporters
Data: BEEPS IV, V.
Nonexporter Exporter Nonexporter Indirectexporter
Directexporter
2009
Number of new or significantly improvedproducts 4.56 12.10 3.46 9.33 12.10
New/improved product new to internationalmarkets (% of “yes” answers) 24.50 20.50 23.08 40 50.47
% of annual sales contributed bynew/improved product 20.07 16.62 19.82 21 16.62
2012
Number of new or significantly improvedproducts 11.50 10.50 11.58 10 10.5
New/improved product new to internationalmarkets (% of “yes” answers) 20.93 53.24 18.7 37.76 53.24
% of annual sales contributed bynew/improved product 23.83 22.28 25.06 3 22.28

Dynamic Relationships Management Journal, Vol. 7, No. 2, November 2018
Tjaša Redek, Črt Kostevc, Sonja Šlander: Intangible Capital Investment and Corporate Presence in Global Value Chains in Slovenia
60
services. Slovenian firms on average (over bothpanel rounds) reported 10.2. In 2009, the firms reported on average 9.5 significantly improved or newproducts, which accounted for 17.7% of total sales,while in 2012 the number increased to 10.9 and contributed 23% to total sales. The increased innovationactivity is consistent with the plans to overcome thecrisis as expressed in the study by Prašnikar et al.(2009), when companies intended primarily to eitherfind new markets or focus on new products to improve competitive position in existing markets.
If companies are divided further by their exportactivity to exporters (those reporting direct exports)and nonexporters (all other), it is evident that exporters were in the crisis period (2009 panel) significantly more innovation driven, although newproducts contributed less to their sales than in nonexporters. Interestingly, the nonexporters reportthat their novelties are in fact global novelties morecommonly than exporters during the crisis. By 2012the situation significantly changed. The innovationactivity of nonexporters has significantly increased,while for exporters it remained strong. Primarily thisis evident in the “quality” of innovation as morethan half of firms report that their products werenew also to global markets.
The role of external competitive pressure becomes even more evident if the companies are divided to nonexporters, indirect exporters (no directexports, but indirectly present) and direct exporters.In the 2009, the nonexporters on average offeredjust below 3.5 new products in the past 3 years,while the indirect exporters offered 10 and the direct exporters 12. The innovation activity of nonexporters did in fact intensify by 2012, when theysurpassed the rest. But the “quality” of innovationis significantly weaker as in both periods a muchlarger share of innovations were also new to international markets. It is also evident that the competitive pressure along the value chain must be strongalso for the indirect exporters, which is consistentwith the anecdotal evidence and case studies ofcompanies that cooperate strongly with their domestic suppliers. Only total quality managementalong the value chain will ensure competitivenessin the long run (e.g. the tradition in Japanese manufacturing, which has been studied intensely by others, e.g. Corwin and Puckett, 2009).
Economic competencies. According to Corradoet al. (2005, 2009) definition of intangible capital,economic competencies comprise 3 segments: (1)brand equity, firm specific human capital and organizational structure. The economic competenciesanalysis will be based on the variable structure fromBEEPS, which is primarily based on human resourcesand organizational characteristics and less on branding (no suitable variables). The firms in 2009 employed 119 fulltime permanent workers onaverage, while in 2012 the number dropped to 106.Besides the fulltime employees, the firms employed also roughly 3.6% of fulltime temporaryworkers, while in 2009 the fulltime temporaryworkers represented 6.5% of employees. The crisiscaused the firms to decrease the number of workers. Since the temporary workers are less protectedby legislation, these were also the first to be laid off.
Generally, firms were quite satisfied with thequality of their employees. Overall, in both studiedperiods, 10.64 % of firms reported that inadequately educated labour force is a major or very severe obstacle, 14% believed it is a moderateobstacle, while 54.1% reported this not to be an obstacle. There are significant differences among industries. In manufacturing, tourism and transport,problems are more pronounced. For example, intransport 15% of companies reported lack of educated labour to be a major obstacle, while in manufacturing, 11% of employers reported lack ofsuitably educated workforce to be a very severe ormajor obstacle and in tourism 9%. In 2009, the situation was different. At that time, the lack of workers was most pronounced in construction andmanufacturing. Given that the survey was conducted over a longer period of time, the construction decline was not yet fully revealed. These resultsare consistent with the data reported by the Employment service of Slovenia (2015), which clearlyindicates that lack of workers in some fields was aproblem. These were primarily specialized professions in manufacturing (metal workers), drivers,workers in tourism (cooks), etc.
On average in 2009 companies had 9.6 % ofemployees with a university degree, while in 2012,the percentage dropped to 7.9 %. In 2009 59.4 % ofcompanies had formal training programmes fortheir employees, while in 2012, the percentage

Dynamic Relationships Management Journal, Vol. 7, No. 2, November 2018 61
dropped to 44%. In both years companies reportroughly 44% of production workers to receive training and roughly 39% of nonproduction workers(data available just for 2012).
On average, exporters were larger, employing160 employees compared to nonexporters with 70employees. If indirect exporters are observed as aseparate category, it is evident that firms that areinvolved in exporting are larger. This pattern isclearly evident primarily in manufacturing, wheresmall, domestic oriented firms on average have 26employees, while indirect and direct exporters areon average 5 times larger. The difference is morepronounced only in transport, where exportingfirms were 10 times larger than nonexporters(there were no indirect exporters in the sample). Intrade, for example, domesticmarket oriented firmswere larger by some 40%, but this again can be understood due to the differences within the sector.The importexport firms and representative officesare often small, while the retail trade in domesticmarket is on the other hand conducted by largestorechains.
On average, the exporters had a more educatedlabour force, the share of those with a university de
gree was clearly higher (Table 5). The difference issignificant – the nonexporters had about half of thepercentage of universitytrained of that, reportedby exporters. In exporters the focus in internal training is on enhancing the skills of production workers,while the nonexporters dominate in terms of investment into nonproduction workers. This patternis again expected, since the nonexporters are moreserviceoriented and have a focus, which is not production per se. In the manufacturing sector the educated and trained workers are a source ofcompetitive advantage, which was supported alsoby Prašnikar et al. (2012 and 2016).
Intangible capital. To relate the intangible capital to exporters, a variable “intangible capital” wasprepared. The variable was structured so that all 3components of intangible capital were accountedfor. Table 6 summarizes the composition of the variable. To avoid problems of scaling, the variableswith 0 (No) and (1) value were taken as base. Theseprevail in the questionnaire in any case. To obtain asummary measure, the values of components wereadded together.
To obtain the “Labour market” variable, whichaims at describing the general quality of HRM, two
2 groups 3 groups
Nonexporter Exporter Nonexporter Indirectexporter* Direct exporter
2009
Number of fulltime employees 69.3 159.3 67.5 78.8 159.3
% of workers with university degree 7.01 11.7 6.55 9.3 11.7
% of fulltime permanent productionemployees that received training 42.5 44.45 42.5 42.6 44.45
% of fulltime permanent nonproductionemployees that received training 47.1 37.9 61.2 28.3 37.8
2012
Number of fulltime employees 129.9 77.8 132.8 42 77.8
% of workers with university degree 5.6 10.8 5.7 2.7 10.8
% of fulltime permanent productionemployees that received training 43 54.7 51.25 10 54.7
% of fulltime permanent nonproductionemployees that received training 58 37.1 50 90* 37.1
Table 5. Characteristics of human resources in BEEPS surveys
*Sample only 3 firms in 2012, 20 firms in 2009.Data: BEEPS IV, V.

Dynamic Relationships Management Journal, Vol. 7, No. 2, November 2018
Tjaša Redek, Črt Kostevc, Sonja Šlander: Intangible Capital Investment and Corporate Presence in Global Value Chains in Slovenia
62
questions were used, one dealing with regulationand one with education. The answers to both questions were averaged and then, to change the scaleto 0 being worst and 4 being best, the value wassubtracted from 4.
Firms’ performance was evaluated based onstandard indicators: sales, value added, costs. Thevariables from the BEEPS dataset were adjusted todescribe also the changes. The average surveyedfirm in Slovenia that was included in the 2009 sample, was established in 1985, had at startup 61 employees and the manager on average had 18 yearsof experience in the sector. The firms, surveyed in2012 round were on average established in 1992,had at start 22 employees, while the current manager today on average has 21 years of experience inthe sector. In 2009 41.3% of interviewed firms had
an international quality certification, while in the2012 round 58% of firms had international qualitycertificate.
Overall, the firms between 2009 and 2012 significantly changed their capacity utilization. Due tothe crisis, the capacity utilization fell from 80.9% to71.6% on average. In nonexporters in 2009, capacity utilization was 78%, just below the 81.6% thatthe exporters reported. By 2012, in both groups, capacity utilization declined by about 9 percentagepoints.
The companies reported on average selling 341thousand euros per employee in 2009 and 407 in2012, while three years earlier, in 2006 and 2009companies reported selling 32.9 and 23.7 % less, respectively.
IC component Question
Computerized information (02)
At the present time does this establishment have its own website? (Yes (1)/No (0))
At the present time does this establishment use email to communicate with clients orsuppliers? (Yes (1)/No (0))
Innovative property (04)
Product innovation During the last 3 years has this establishment introduced new or significantly improvedproducts or services (Yes (1)/No (0))
Process innovation During the last 3 years has this establishment introduced new or significantly improvedmethods for the production or supply of products or services (Yes/No)
Organizationalinnovation
During the last 3 years has this establishment introduced new or significantly improvedorganizational or management practices or structures? (Yes/No)
Marketing innovation During the last 3 years has this establishment introduced new or significantly improvedmarketing methods? (Yes/No)
Economic competencies Poor quality (0) toVery good (5)
Over the last fiscal year did this establishment have formal training programs for itspermanent fulltime employees? (Yes (1) /No (0))
Labour_market* 4 (best) – 0(worst)
Are labour regulations an obstacle to the current operations of this establishment? (No (0), Very severeobstacle (4))
To what degree is an inadequately educated labour force an obstacle to the currentoperations of this establishment?
(No (0), Very severeobstacle (4))
Table 6. Construction of variables describing the “intangibles”
Data: BEEPS IV, V.

Dynamic Relationships Management Journal, Vol. 7, No. 2, November 2018 63
4.1 The relationship between the accumulationof intangible capital and exportorientation
The descriptive statistics of the components ofintangible capital in firms in some cases show a verysystematic advantage of exporters, while in othercases (e.g. training) the differences are small orbarely noticeable. In what follows, the following research question will be answered: What is the relationship between the involvement in trade and theintangible capital?
a. Informational capitalb. Innovative capitalc. Economic competencies
To answer these research question, severalmethodologies will be employed, starting with ttests between the groups.
The results in Table 7 show that generally,when observing components of intangible capital,exporters are performing better and the differences are also in many cases significant. First, regarding the computerized information, on average(CI variable) the exporters are performing better.Although both groups largely use email as well ashave own web pages, the exporters are more active in both and differences are in both cases alsosignificant.
Nonexporter Exporter ttest sig
Computerized information
Web page 0.817 0.905 0.0034
Email 0.973 0.994 0.0055
CI 0.895 0.953 0.0006
Innovative property
Product 0.557 0.663 0.0100
Product (novelty in markets)** 0.931 0.848 0.0025
Process 0.420 0.513 0.0242
Organizational 0.484 0.569 0.0356
Marketing 0.529 0.577 0.1537
Innovation 1.991 2.323 0.0216
Economic competencies
Regulation* 1.246 1.226 0.4230
Education* 0.798 0.861 0.2709
Labour market combined 1.046 1.036 0.4051
Training 0.456 0.525 0.1318
HRM 3.653 3.475 0.9290
Table 7. Components of intangible capital and the significance of differences between the groups
Data: EBRD BEEPS IV and V data.* Scale 04, 0 implies no obstacle, 4 major obstacle. In this case value for ttest shows the results that exporter generallyobserve that either regulation or education is more of an obstacle. Otherwise, onesided test is used, exporter >importer.** ttest value for importer>exporter. Variable was not included into calculation of intangible capital, since it is not acore group of innovation, but provides additional information.

Dynamic Relationships Management Journal, Vol. 7, No. 2, November 2018
Tjaša Redek, Črt Kostevc, Sonja Šlander: Intangible Capital Investment and Corporate Presence in Global Value Chains in Slovenia
64
Regarding innovative property, the differencesare also significant between exporters and nonexporters, if all types of innovation are observed combined (innovation variable). Exporters also performsignificantly better with regards to product, processand organizational innovation, while in marketinginnovation the differences are not significant, although on average the performance of exporters isbetter. Interestingly, from the perspective of innovation, firms that do not export outperformed exporting firms from the perspective of being activein introducing market novelties. Regarding economic competencies, the differences are not significant in any of the analysed aspects. In terms oftraining, the exporters do invest more, but the differences are not significant.
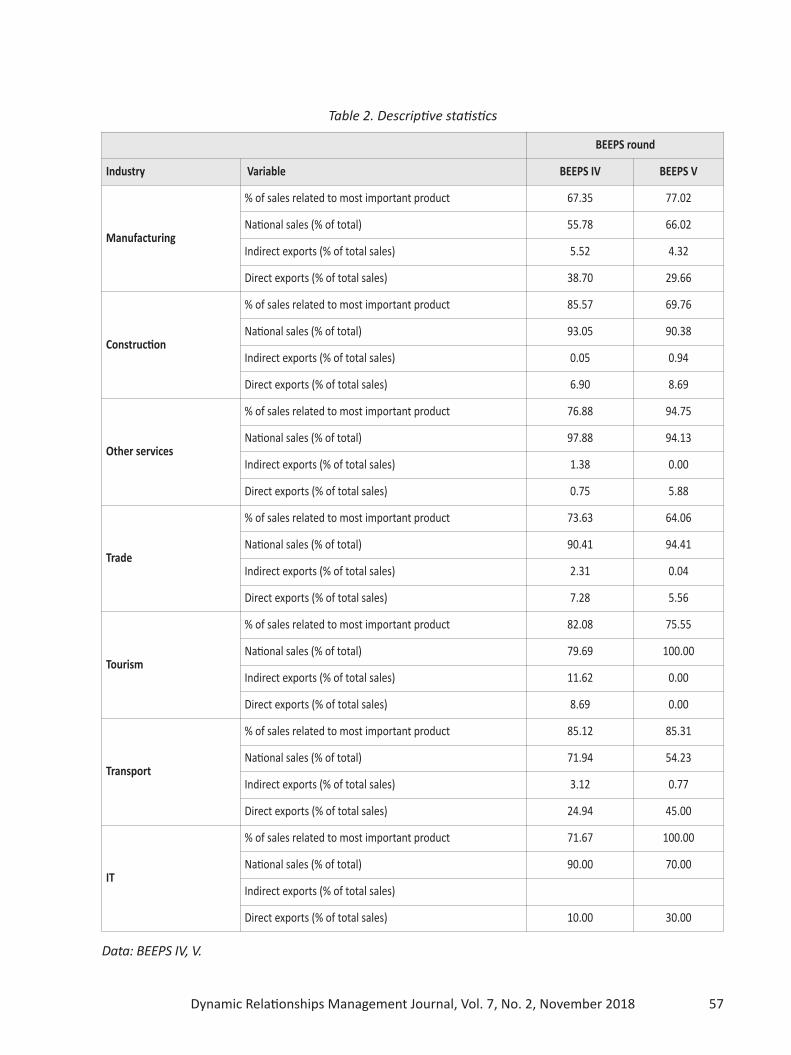
To see whether exporters are indeed more active in accumulating intangible capital and its components, matching was performed. Matching wasinitially performed on the intangibles variable atlarge and subsequently also at the level of intangibles components.
Matching was conducted using the propensityscore matching method. The propensity scorematching relies on the definition of the propensityscore, which is defined according to the literature(Rosenbaum and Rubin, 1983) the probability “oftreatment assignment conditional on observedbaseline covariates: ei = Pr(Zi = 1|Xi). For propensityscore matching, pairs of data are usually formed,one being treated and the other one not, but bothof them sharing a similar propensity score. Thepropensity score itself is estimated using a sort oflogistic regression, followed by an estimate basedon the regression model. Other methods are alsoused to estimate the propensity score, such as partitioning, bagging etc.. Based on the propensityscore, treated and nontreated groups are compared. In this paper, the nearest neighbour matching is used, which identifies two subjects that areclosest (have minimum distance). Based on comparison average treatment effect is calculated for thetreated (ATT) or average treatment effect at thepopulation level (ATE).
To identify whether the exporters invest moreinto intangible capital at large and its components,a two step approach was used. Initially, propensity
score was estimated. The dependent variable wasexports (company being an exporter (value 1) or not(value 0). The propensity to export was estimated,based on company performance (sales per employee today and three years ago), industry categories, company size2 (micro, small, medium andlarge), ownership (private domestic ownership wasincluded), the possession of international qualitycertificates and survey dummy (BEEPS IV and V).
The choice of variables was guided by two factors. First, theoretical considerations about the variables that impact export propensity. Second, theavailability or choice of variables in the BEEPS data.Sera et al. (2012) show for Portugal and UK thatcompany size, industry as well as firm competenciesmatter, which is also confirmed by Parish and Freeman (2011). Bodin et al. (2015) stress ownershipand the importance of foreign ownership in developing countries, which is understandable due tofirm’s motivation to exploit factor and cost advantages. Mittelsteadt et al. (2006) stress the importance of location, firm size and industry. Besidesthese, we also included the survey dummy to differentiate between external (crisis) elements thatmore more or less pronounced in 2009 and 2012.To capture the effects of productivity (as stressed byDamijan and Kostevc, 2015) and size, we added alsothe sales per employee (data on value added couldbe calculated from answers to different questions,but result had many outliers and missing variables).
In the second stage the treatment effects werecalculated to find whether the intangibles also havean impact on exporters. The results are mixed. Overall, the intangibles variable impact is not significant.The components of intangible capital were studiedconsequently separately. Table 8 presents the results.
Generally, matching results do not confirm thatthere is a significant difference between exportersand nonexporters in the accumulation of intangiblecapital. Although it might be expected that stronger
2 Regarding size, question a6a from BEEPS data wasused. The questionnaire divides companies into following categories: micro companies (<5 employees), small(5<employees<=19), medium (20<employees<=99)and large (>=100).
Dynamic Relationships Management Journal, Vol. 7, No. 2, November 2018 65
intangible capital is a driver of productivity, andcompetitiveness would also contribute to a firmbeing more likely to export, the results for Sloveniado not confirm this. The matching process could notidentify matching firms for the innovation variableat large, but we were able to conduct matching forthe components of intangible capital as well as variable on training.
Three components are highly significant. First,the computerized information. Generally, those thathave more informational capital in general (variableinformational capital) are more likely to be exporters, the treatment effect is positive and highlysignificant. The exporters are also more likely thosewho use emails to communicate with clients andsuppliers. These results are quite expected. Regarding web pages, nowadays the majority of firms havewebpages (statistical data is unavailable, but anecdotal evidence confirms that web is extremely important), therefore the results are expected. On theother hand, the exporters are much more active inusing email to communicate, which again was ex
pected. First, due to the fact that this lowers transaction costs, represents a new distribution channeland improves quality of service (Visser, 2007,Thompson and Yu, 2005, Prašnikar, ed., 2010 forSlovenia and informational capital). Second, the literature also showed that etrade also stimulates exports or represents a new exporting mode, that alsoallows small business to enter foreign markets atmanageable costs (Yong et al., 2011, ITC, 2016).Therefore, considering ecommunication and havinga webpage in combination (in our case that implieshigher informational capital) might stimulate companies to use also ecommerce as penetrationmethod, and increasing exports or testing unknownmarkets (Deloitte, 2014).
Regarding innovative property, the differencesof the intangible capital components are not explaining the differences in the propensity to export or not.Generally it might be expected that firms that aremore innovative and invest more into R&D are alsomore productive (Hanley and MonrealPerez, 2011,Ganotakis and Love, 2009, Brati and Felice, 2010).
N treated N control ATT std. err. T value
Informational capital
IT 386 3 0.476*** 0.025 18.673
Web page 389 56 0.038 0.112 0.335
Email 445 6 0.537*** 0.024 22.679
Innovation
Product innovation 276 121 0.025 0.086 0.291
Process innovation 211 130 0.024 0.086 0.276
Organizational innovation 238 125 0.035 0.085 0.414
Product innovation also novelty in market 400 48 0.214*** 0.096 2.245
Marketing innovation 250 123 0.001 0.085 0.015
Economic competencies
Labour regulation 112 91 0.127** 0.082 1.536
Labour education 92 116 0.069 0.093 0.741
Labour obstacle 88 40 0.014 0.109 0.131
Training 137 86 0.109 0.119 0.921
Table 8. Matching results (exporter=1)
Data: EBRD BEEPS IV and V data.

Dynamic Relationships Management Journal, Vol. 7, No. 2, November 2018
Tjaša Redek, Črt Kostevc, Sonja Šlander: Intangible Capital Investment and Corporate Presence in Global Value Chains in Slovenia
66
But it is on the other hand true that the impact ofinnovative property on exports or exports on innovation depends largely on firm motivation. It mighthold that companies with a stable position withinglobal value chains and producing lowvalue products for exports have less motivation to be innovative, since their position is more secure than theposition of companies not incorporated in globalvalue chains. On the other hand, being part of GVCoffers more learning and technology, knowledgetransfer opportunities, opportunities to expand tonew markets (market/marketing innovation) (e.g.European Commission, 2013). In Slovenia, accordingto the results, the differences are not significant andwe cannot confirm that firms with more innovativecapital have a higher exporting propensity. Interestingly, companies that introduced novelties (productinnovation) which were new to the market, are morelikely to be nonexporters. This could be understoodin relation to the fact that many service companieswere very active in establishing their market positionin the analysed period and that innovation wasstressed also as a crisis exit strategy (besides searchfor new markets, Prašnikar and Cirman, 2008).
The economic competencies were also not ableto explain the propensity to export. Training wasmore pronounced (but insignificant), while the perception of labour regulation (being a more pronounced obstacle) had some explanatory power. Ingeneral both exporting and nonexporting firms perceived labour market situation as an obstacle.
The question we have initially posed tried to relate involvement into GVC (trade) with the firm’s intangible capital. Initial results, testing just for theaccumulated differences in IC between exportersand nonexporters, show that differences exist. Butonce the exports is initially controlled for other standard variables that explain exports, the treatmenteffect of the intangible capital is minor in the analyzed sample.
5. DISCUSSION AND CONCLUSION
Intangible capital or knowledgebased capital isconsidered in the literature to be one of the majorpromoters of productivity, growth and development. The intangible capital itself comprises several
components and they are all positively linked in theory (either at large or separately) to trade and exporting. IC improves productivity, eases access toglobal markets (more innovative, quality products),enhances learning and knowledge transfer due tobetter absorption abilities, stimulates new marketentry and easies it as well (accumulated brand capital, knowledge, competencies and capabilities, organizational structure etc.).
The analysis presented in this paper aimed atinvestigating the impact of accumulated IC onfirms’ export propensity. Although the ttestsshowed some significant differences between exporters and nonexporters, once these are controlled for other factors, only a poor relationshipbetween the variables of interest can be found. Primarily, the results show that it is important to invest in ITC. Generally, other results are not so highlysignificant, but can be explained both by the crisis(which primarily hit the exporters) as well as sample structure (quite a large share of service companies, which are intensifying their efforts to establishtheir market position).
Interestingly, innovative property does not explain the differences in the propensity to exports,although this is expected in the literature and alsothe comparison between the groups shows that theexporters are significantly more innovative. The inability to confirm the propensity to exports with innovation could be explained by the comparativeimportance of other factors, actual inclination of asubsample of exporters to be primarily “doingbusiness as usually”, the nature of the sample orother (e.g. sectoral) characteristics of the exportingfirms’ sample. Besides the aforementioned aspects,further points can be made. The result contradictsthe experience of other studies for Slovenia, whereinnovation is related to exports (e.g. in Prašnikar,2012). Another consideration is the methodologyused – here the propensity to exports was explained by innovation (or not), while the oppositecould also be true and is also supported in the literature. Similarly, also the relationship with theeconomic competencies is not systematic such asexpected by the literature. Consequently, furtherstudy of exports in relation to intangible innovativecapital is needed.
Dynamic Relationships Management Journal, Vol. 7, No. 2, November 2018 67
The results nonetheless do reveal some important facts, which also provide several implications for firms’ management in order to succeedeither in the domestic or international markets.First, the literature shows that it is important to invest in intangible capital. Investing into innovativecapital, brands, firmspecific human capital, etc.,increases the competitiveness of the firm, whichcan compete more on a quality basis with a betterand more established (branded) product. This ensures higher value added per employee due tohigher profit margins and allows also higher employee compensation, supporting their motivation,loyalty and productivity, which spurs a positiveloops in the firms.
Although the sample did not confirm that thepropensity to exports is explained by innovation andeconomic competencies, that does not necessarilymean that the link does not exists. A number ofstudies (as mentioned) have confirmed the importance of innovation for exporting and vice versa aswell. First, our result reflects the sample as the crisisperiod, when exporters were highly pressured withlow demand, which hampered their general investment abilities (more computerised informationcould also be a result of the attempted cuts incosts). But in order to be competitive, firms need tobe innovative and most successful Slovenian exporters are also developmental suppliers to majorEuropean firms. Although the results do not showthat innovation explains the propensity to exports,they do show that there is a significant difference inthe intensity of innovation in favour of exporters.Therefore, the results do provide implications formanagement – innovation is important, but causality could go also both ways.
The research was limited in several ways. Oneis the aforementioned sample structure with a focuson manufacturing as shown in results from otheranalyses (e.g. (Prašnikar, 2010) (Prašnikar, Redek, &Koman, 2017), (Redek, Čater, Čater, Černe, andKoman, 2018)), it is primarily Slovenian manufacturing that is investing a lot into new technologies andis highly innovative to be able to compete in theglobal markets. At the moment, these companies,many from the automotive, metal, electrical, chemical and pharmaceutical sectors are also at the forefront of digitalization and implementation of other
technologies from Industry 4.0. It is primarily alsothese technologies, including digitalization, whichcould (as potential for future research) also conceptually extend the existing definition of intangiblecapital, partially as part of computerized information, partially due to their impact on (process andproduct) innovation. Namely, these technologiessignificantly contribute to enhanced efficiency, butat least some are intangible in nature (e.g. big dataanalysis, ecommerce models, etc.).
Second limitation also stems from the data. Theavailable variables were in some cases not bestsuited for this analysis. For informational capital,there was no data about software or databases andthe variables we could use are just an approximation. Second, the economic competencies analysiswas also very limited and instead of having branding, investment into firmspecific human capital andfirm competencies, information was limited andthus the analysis focused on training and generallabour market. Last, the sample size was relativelysmall, primarily due to having missing data, whichlimited the opportunities to perform matching offirms in some cases. Therefore, we know that theanalysis could provide richer conclusions if done ona different dataset.
But the analysis is nonetheless important fromthe perspective of the future analysis. Besides thelink of intangible capital to new technologies, understanding the importance of intangible capital ishighly important from policy and firm perspective.To stimulate the accumulation of intangible capital,it would be important to understand the awareness of the problem among Slovenian firms, primarily among decisionmakers as well as anyobstacles in deciding for such investments. Therefore such an analysis could be complemented by afirmlevel survey. Second, a comparative, crosscountry study would also be relevant, both fromthe level of intangible capital, contribution to productivity, importance of involvement in globalvalue chains but primarily also from the managerial perspective. From policy perspective, an extensive microlevel analysis on firmlevel data wouldrepresent a reliable tool for preparing suitablemeasures as well as addressing management withsuitable incentives.
Dynamic Relationships Management Journal, Vol. 7, No. 2, November 2018
Tjaša Redek, Črt Kostevc, Sonja Šlander: Intangible Capital Investment and Corporate Presence in Global Value Chains in Slovenia
68
6. REFERENCESAghion, P., Bergeaud, A., Lequien, M., Melitz, M., 2018.
The Impact of Exports on Innovation: Theory and Evidence. NBER Working Paper No. 24600.
Anholt, S., 2005. Brand New Justice. How branding placesand products can help the developing world. Oxford:Elsevier ButterworthHeinemann.
Austin, P.C., 2011. An Introduction to Propensity ScoreMethods for Reducing the Effects of Confounding inObservational Studies. Multivariate Behavioural Research 46(3. 399–424.
Baldwin J., Gu W. and R. Macdonald, 2012. IntangibleCapital and Productivity Growth in Canada. The Canadian Productivity Review, Statistics Canada, 2012
Boddin, D., Raff, H. and Trofimenko, N., 2015. Foreign Ownership and the Export and Import Propensities of DevelopingCountry Firms. Kiel Institute for the WorldEconomy, Kiel Working Paper No. 1995. Available at:https://www.ifwmembers.ifwkiel.de/publications/foreignownershipandtheexportandimportpropensitiesofdevelopingcountryfirms/kwp_1995.pdf
Brati, M. and Felice, G., 2010. Are exporters more likelyto introduce product innovations? European Firms inGlobal Economy. EFIGE working paper 25. Availableat: http://bruegel.org/wpcontent/uploads/2015/ 09/EFIGEWP25.pdf.
Bridgman, B., 2013. Export Mode and Market Entry Costs. Bureau of Economic Analysis. Working Paper. Available at:https://www.bea.gov/papers/pdf/movies1209BEA.pdf
Chen, W., R. Gouma, B. Los and M. Timmer (2017). Measuring the Income to Intangibles in Goods Production:A Global Value Chain Approach. WIPO Economic Research Working Paper No. 36. Geneva: WIPO
Chesbrough, H., 2003. Open Innovation: The New Imperative for Creating and Profiting from Technology.Boston: Harvard Business School Press.
Chesbrough, H., and Brunswicker, S., 2013. ManagingOpen Innovation in Large Firms. Fraunhofer Verlag.Available at: http://openinnovation.berkeley.edu/managingopeninnovationsurveyreport.pdf.
Chesbrough, H., Vanhaverbeke, W., and West, J., 2006.Open Innovation – Researching a New Paradigm. Oxford: Oxford University Press.
Cirman, A., Koman, M., Prašnikar, J., Valentinčič, A., andVoje, D., 2009. Slovenian exporters in an economic crisis. In: Prašnikar, J. (ed.). How are different capitalistsystems coping with the current crisis?. 1st printing.Ljubljana: Časnik Finance, 2009, 273290.
Corrado, C. A., Hulten, C. R. and Sichel, D. E., 2005. Intangible capital and economic growth, NBER Working PaperNo. 11948, National Bureau of Economic Research.
Corrado, C. A., Hulten, C. R. and Sichel, D. E., 2009. Intangible capital and US economic growth. The Review ofIncome and Wealth, 55: 661685.
Corrado, C., J. Haskel, C. J. Lassinion, M. Iommi, and O’Mahony, M., 2014. Public and private sector intangible investments in the European Economies. Preliminaryresults from the SPINTANProject. Paper prepared forIARIW 33rd General conference, Rotterdam, Netherlands, 2430th August, 2014. Available at:http://www.iariw.org/papers/2014/OMahony2Paper.pdf
Corrado, C.; Haskel, J., JonaLasinio, C. and Iommi, M.,2012. Intangible Capital and Growth in AdvancedEconomies: Measurement Methods and ComparativeResults. INTAN Working Paper. Available at:http://www.intaninvest.net.
EXTENDED SUMMARY / IZVLEČEK
Vključitev podjetja v globalne vrednostne verige je pomembno ne le zaradi takojšnjega učinkana povpraševanje, pač pa tudi zaradi drugih dolgoročnih učinkov, kot so odpiranje novih trgov, prenosa tehnologije in znanja, itd. Inovacije (inovacije proizvodov in procesov, organizacijske, tržne inmarketinške inovacije), kopičenje znanja ter krepitev zmogljivosti in sposobnosti podjetja, predstavljajo velik del naložb v neopredmeten ali na znanju temelječ kapital. Slednji lahko poveča rast produktivnosti za kar tretjino. Članek raziskuje položaj slovenskih podjetij s ciljem ugotavljanja razlik vkopičenju neopredmetenega kapitala med podjetji, ki so dejavna na globalnih trgih, in tistimi, ki niso.Analiza temelji na bazi podatkov EBRD (panela IV in V), raziskav o poslovnem okolju in uspešnostipodjetji. Rezultati kažejo, da so ugotovljene razlike najbolj izrazite v računalniško informacijski komponenti neopredmetenega kapitala, medtem ko razlike v inovativni lastnini in naložb za krepitev gospodarskih kompetenc niso tako velike. Ti rezultati delno odražajo tako nedavno gospodarsko krizo,kot tudi vpliv storitvenih panog.

Dynamic Relationships Management Journal, Vol. 7, No. 2, November 2018 69
Corwin J., and Puckett R. (2009). Japan’s ManufacturingCompetitiveness Strategy: Challenges for Japan, Opportunities for the United States. US Department ofCommerce, International Trade Administration.
Dahlman, K., 2007. Technology, globalization, and international competitiveness: Challenges for developingcountries. In Industrial Development for the 21st Century: Sustainable Development Perspectives. UnitedNations, 2007. Available at: https://sustainabledevelopment.un.org/content/documents/full_report.pdf#page=37.
Damijan, J., and Kostevc, Č., 2015. Learning from tradethrough innovation. Oxford bulletin of economics andstatistics, 77(3), pp. 408463.
Deloitte, 2014. From bricks to clicks. Generating globalgrowth through eCommerce expansion. Available at:https://www2.deloitte.com/content/dam/Deloitte/za/Documents/consumerbusiness/za_generating _growth_through_ecommerce_24112014.pdf.
EBRD, 2016. Business Environment and Enterprise Performance Survey data. Available at: http://ebrdbeeps.com/data/
European Commission, 2013. Global value chains, globalinnovation networks and economic performance. Accessed December 15th 2016. https://ec.europa.eu/research/innovationunion/pdf/expertgroups/i4goecd_workshop_gvc_and_gin.pdf
Ganotakis, P. and Love, J.H., 2009. R&D, Innovation andExporting: Evidence from UK new technology basedfirms. Aston Business School Research Papers, RP0922. Accessed December 15th 2016.http://eprints.aston.ac.uk/6979/1/R_D_innovation_and_exporting.pdf
Hanley, A. and MonrealPérez, J., 2011. Are Newly Exporting Firms more Innovative? Findings from MatchedSpanish Innovators. Kiel Institute for the World Economy, Kiel Working Paper No. 1735. Available at:http://isndemo.atlasproject.eu/asset_demo/file/8e8e7fb0d907411ca9aa8f67d115d665/d3b1d8a9ecb640638b13c4177bf822c0/kwp_1735.pdf
IES, 2013. Marketing and branding your exports. Availableat: http://www.iesingapore.gov.sg/~/media/IE%20Singapore/Files/Export%20Overseas/Export%20Guide/Export%20Guide%202007%2008%2013%20Step%202%20Marketing%20and%20branding%20your%20exports.pdf
INTANINVEST, 2017. Crosscountry intangible investmentdata. Available at: http://www.intaninvest.net/
Ito, B. and Tanaka, A., 2006. Open Innovation, Productivity, and Export: Evidence from Japanese firms. RIETIDiscussion Paper Series 13E006. Available at:http://www.rieti.go.jp/jp/publications/dp/13e006.pdf
Katsikeas, C. S., and Morgan, R. E., 1994. Differences inPerceptions of Exporting Problems Based on Firm Sizeand Export Market Experience. European Journal ofMarketing, 28(5), pp. 17–35.
LopezBazo, E. and Motellon, E., 2013. Firm exports, innovation and regions. Institut de Recerca en EconomiaAplicada Regional i Pública. Working paper 2013/08.Available at: http://www.ub.edu/irea/working_papers/2013/201308.pdf
Melitz, M. and Ottawiano, G.I.P., 2007. Market Size,Trade, and Productivity. Review of Economic Studies,75, pp. 295–316.
Mittelstaedt, J. D., Ward, W. A., Nowlin, E., 2006. Location, industrial concentration and the propensity ofsmall US firms to export : Entrepreneurship in the international marketplace. International Marketing Review, 23(5), 486503.
Miyagawa, T., Lee, K., Kabe, S., Lee, J., Kim, H., Kim, Y., &Edamura, K., 2010. Management Practices and FirmPerformance in Japanese and Korean Firms An Empirical Study Using Interview Surveys. RIETI DiscussionPaper Series 10E013.
OECD, 2009. Top Barriers and Drivers to SME Internationalisation. Report by the OECD Working Party on SMEsand Entrepreneurship. Available at: https://www.oecd.org/cfe/smes/43357832.pdf
OECD, 2012. Innovation for Development. A discussion ofthe issues and an overview of work of the OECD directorate for science, technology and industry. Available at:http://www.oecd.org/innovation/inno/50586251.pdf
OECD, 2013. Supporting Investment in Knowledge Capital, Growth and Innovation. Organization for Economic Cooperation and Development. DOI:10.1787/97892641933074en
Parish, C. and Freeman, J., 2011. Factors contributing tothe export propensity of Australian seafood firms.Journal of New Business Ideas & Trends, 9(1), 117.
Prašnikar, J. (ed.), 2010. The role of intangible assets inexiting the crisis. Ljubljana: Časnik Finance.
Prašnikar, J., ed. (2012). Comparing companies’ successin dealing with external shocks : the case of the Western Balkans, Mediterranean countries and core European countries. Časnik Finance.
Prašnikar, J., Redek, T., and Koman, M. (2017). Robotsamong us. Ljubljana: Časnik Finance.
Prašnikar, J. and L. Knežević Cvelbar (eds), 2012. Intangible assets as a potential for growth in Republic of Srpska. Ljubljana: Faculty of Economics.
Redek, T., Čater, T., Čater, B., Černe, M., Koman, M. (2018).Industrija 4.0 v Sloveniji. Ekonomska fakulteta: mimeo.
Rosenbaum P.R., and Rubin D.B., 1983. The central roleof the propensity score in observational studies forcausal effects. Biometrika, 70, pp. 41–55.
Dynamic Relationships Management Journal, Vol. 7, No. 2, November 2018
Tjaša Redek, Črt Kostevc, Sonja Šlander: Intangible Capital Investment and Corporate Presence in Global Value Chains in Slovenia
70
Seker, M., 2011. Importing, Exporting, and Innovation in Developing Countries. World Bank, Enterprise Analysis UnitFinance and Private Sector Development. Available at:https://www.enterprisesurveys.org/~/media/GIAWB/EnterpriseSurveys/Documents/ResearchPapers/ImportingExportingInnovation.pdf
Serra, F., and Abdou, H.A., 2012. Factors Influencing thePropensity to Export: A Study of UK and PortugueseTextile Firms. International Business Review, 21(2), pp.
Spyropoulou, S., Skarmeas, D., and Katsikeas, C. S., 2011. Anexamination of branding advantage in export ventures.European Journal of Marketing, 45(6), pp. 910 – 935.
Steinwender, C., 2015. The Roles of Import Competitionand Export Opportunities for Technical Change. CEPRDiscussion Paper No 1334. Available at:http://cep.lse.ac.uk/pubs/download/dp1334.pdf.
Stevens, C., Irfan, M., Massa, I. and Kennan, J., 2015. Theimpact of free trade agreements between developedand developing countries on economic developmentin developing countries. Department for InternationalDevelopment. Available at: https://www.gov.uk/government/uploads/system/uploads/attachment_data/file/448862/REA_FreeTradeAgreements.pdf
Stiglitz, J. and Greenwald, B., 2014. Creating a learningsociety. New York: Columbia University Press.
Thompson, S.H. T, and Yuanyou Y., 2005. Online buyingbehavior: a transaction cost economics perspective.Omega, 33(5), pp. 451–465.
ThumThysen, A., Voigt, P., BilbaoOsorio, B., Maier, C.and Diana Ognyanova, 2017. Unlocking investment inintangible assets. European Commission DiscussionPaper 047.
UNCTAD, 2013. World Investment Report. Global valuechains: investment and trade for development. UnitedNations. Available at: http://unctad.org/en/PublicationsLibrary/wir2013_en.pdf
UNIDO, 2006. Responsible trade and market access Opportunities or obstacles for SMEs in developing countries? United Nations Industrial DevelopmentOrganization. Available at:https://www.unido.org/fileadmin/user_media/Publications/Pub_free/Responsible_trade_and_market_access.pdf
US Department of Commerce, 2009. Export programs guide.A business guide to federal export assistance. Available at:http://www.trade.gov/publications/pdfs/epg_2009.pdf
Van Ark B., Hao J., Corrado C., & Hulten C., 2009. Measuring intangible capital and its contribution to economic growth in Europe. European Investment BankPapers, EIB Paper No. 14.
Visser, E.J., 2007. Logistic innovation in global supplychains: an empirical test of dynamic transactioncosttheory. GeoJournal, 70(2), pp. 213226.
World bank, 2017. Global value chain development report2017: Measuring and analyzing the impact of GVCs on economic development.Available at https://www.wto.org/english/res_e/booksp_e/gvcs_report_2017.pdf
Zhenhua, Y. and Quiang, S., 2015. Problems in crossborder Ecommerce. Export trade in China and countermeasure analysis. International Conference onInformatization in Education, Management and Business (IEMB 2015).