Embed Size (px)
Citation preview

Estimation of the Investment in Intangible Assets for Belgian Firms:
A First Look
Vesna Stavrevska, Jiahua Tan1
Results from the research project The Estimation of Investment in Intangible Assets and Its Spillover Effects
Promotors: W. Meeusen and J. Plasmans Researchers: V. Stavrevska and J. Tan
University of Antwerp, Belgium
September, 2003
(Preliminary Version)
Abstract
This paper aims at developing more elaborate indicators to measure the value of intangible assets using financial market valuation data of firms. Namely, it is reasonable to expect that investing in intangible assets could ultimately be reflected in the market value of the firm. Based on the approach introduced by Griliches (1981, 1988) and Hall (1992, 1993a, 1993b and 1998, 2001), we develop a model that estimates relative contributions of proxies for different intangible assets (R&D expenditures, patents stock, advertising expenditures etc.) to a measure of Tobin’s Q. We try to apply a macro-correction of the stock-exchange indices for factors that cause irrationality in their movements. Obtained coefficients from the econometric panel-data estimation applied on firms quoted at the stock-exchange serve as relative weights for different forms of intangible investments in non-quoted firms. JEL Classification: L16, O11, O31, O32, Key Words: Intangible asset, Market value, Intellectual property evaluation 1 Correspondence: [email protected], [email protected] FTEW, University of Antwerp, Prinsstraat 13, Antwerp B-2000 Belgium.
1

1. Introduction The growing attention of policymakers and economists towards investments in
intangible assets (firm-specific accumulated knowledge, patents, trademarks,
copyrights etc.) in the last decades indicates the increasing awareness of the concept
of ‘knowledge-based economy’ and its implications for the economic growth and
international competitiveness. Therefore, the disposal of a reliable indicator for the
investment in intangible assets is of major importance for the policymakers.
The issue of measurement of investment in intangible assets faces serious conceptual
problems. Firstly, there are diversified definitions and categorizations of intangible
assets with respect to different research interests. For example, only in the accounting
literature we refer to a number of different classification criteria: Guilding and Pike
(1990) classify intangible assets with respect to their contribution to the
competitiveness of the firm; Mortensen, Eustace and Lannoo (1997), use financial
criteria, and Lev (2001) defines different intangible assets in terms of their position in
processing commercialized innovations. Cañibano, García-Ayuso and Sánchez (2000)
conclude the need of a harmonious definition and classification of the intangible
assets among the accounting specialists.
The direct inventorying-approach, which has been applied by some (macro-)
economic statistics researchers (Vosselman 1991; Minne 1997), is confronted with
the following problems:
2

- Measurement: proxies have to be used for different components of intangible
assets;
- Comparability: is e.g., the value of one unit cost on marketing equivalent to the
one spent for R&D?;
- Addition: double counting of inputs and outputs in the innovation process.
To develop more elaborate indicators, two fundamentally different approaches have
been taken in the literature-one by the academics in the accounting branch and the
other by innovation economists. Scarcity of cross-citations suggests that the two
approaches seem to be barely aware of each other. The accent in the economic
literature falls on the study of determinants of firm’s market value, and consequently,
on the weight of the different components of intangible capital to the market value.
The measure for investment in intangible assets represents a deducted result from this
valuation, which finds its theoretical basis in the Tobin’s Q model. Meanwhile, the
accounting literature has emphasized the problem of reporting and capitalization of
investment in intangible assets, as well as the importance of correct booking of these
assets. A more detailed overview of two different approaches is given in the
following section.
Section 3 describes the methodology, mainly based on the view taken by Griliches
and Hall. We introduce two novelties to the present state of theory on measurement of
investment in intangible assets. Taking into account that this methodology is based on
the financial market valuation of firms, we consider the problem of stock-exchange
volatility and the latter’s appropriateness to serve as an indicator of the value of
3

intangible assets. We attempt to apply a macro-correction of the stock-exchange
indices for factors that are causing irrationality in their movements. Using corrected
market value data yields presumably better measures of investment in intangible
assets.
The estimation is performed in two stages. Firstly, we estimate the value of
investment in intangible assets only for the firms that are quoted on the stock
exchange market. This estimation provides coefficients denoting individual relative
contributions of a unit of each type of intangible asset towards the economic
performance of the firm. Then we apply these coefficients as relative weights for
different forms of intangible investment to a sample of top 500 non-quoted firms,
selected on the base of net added-value criterion, to measure the total investment for
Belgian private sector in the observed period.
The empirical results from the estimation are presented and discussed in the section 4.
The final section concludes the paper and presents suggestions for further research.
2. Review of the Literature: the ‘Accounting’ Versus the ‘Economic’
Approach
2.1. Tobin’s Q Approach in the Estimation of the Investment in Intangible assets: the
Market Value Method
4

The basic philosophy of Tobin’s q investment theory is that a profit-maximizing firm
would extend its stock of capital if the market value of the accumulated capital
exceeds its replacement-or book-value2. In other words, the events that result in
positive (or negative) deviation of the market value from the book value represent a
signal that the firm is more (less) valued than what has been paid for acquiring its
capital, which implies that it is profitable to invest (disinvest). These investments
(disinvestments) continue until the point where q-value (the ratio of market to book
value of the capital) is equal to 1, i.e. the long-term equilibrium.
The weakness of this theory in its original appearance is that, while the market value
is the sum of equity and outstanding debt, the book value refers to capital in the
narrow sense, therefore excluding intangible assets and other assets. At the same
time, this model provides an opportunity to use the difference between the market and
the book value as a methodology to estimate the value of investment in intangible
assets.
The pioneering contribution in this context has been made by Griliches (1981). He
uses R&D ‘capital’ (a weighted sum of past R&D expenditures) and patents as
proxies for intangible capital. The basic approach is that in the case when R&D
2 Initially Tobin has taken marginal, rather than average values as numerator and denominator in the expression for q. In the actual application of this formula the average values have almost always been taken. Hayashi (1982) shows that there is precise equivalence under constant returns to scale and that the cost function is linearly homogenous with respect to investment and capital). Similarly, book value has been taken as a substitute for the replacement value, at least as a good approximation (see, for example Chung and Pruitt 1994).
5

expenditures and patents create intangible capital in the firm, it would ultimately be
reflected in the market value of this firm. Starting from Tobin's q model, he expresses
the market value of the firm as a function of the permanent firm-effect, the effect of
the market during the observed period and the relative price of the knowledge capital
with respect to the conventional capital3. Although he aimed in determining the
influence of the intangible capital on the market value of a firm, the same approach
can give a measure to the value of intangible capital.
Griliches and many authors, who follow his footsteps, distinguish between the
anticipated and the non-anticipated component of R&D and the patent variable, using
the deviation as a criterion with respect to an extrapolated trend. Only the non-
anticipated variables reflect a significant influence on the market value-a
confirmation for the efficiency assumption with respect to the stock exchange4.
Cockburn and Griliches (1988) further develop the established methodology. Instead
of deriving weighting coefficients for the R&D expenditures in order to create the
variable for the ‘R&D capital’, they determine a priori depreciation coefficient of
15%. For the stock of ‘patent-capital’ they use a priori depreciation coefficient of
30%, applied on the number of granted patents. The current R&D expenditures and
the number of patents have been separated from the respective values of the capital
3 This methodology is described in the section 3. 4 For more studies on the ‘news effect’ of the non-anticipated changes in the R&D capital and the patent stock and their influences on the stock-exchange, see e.g., Griliches (1981); Ben Zion (1984); and Bosworth, Wharton and Greenhalgh (2000).
6

and used in the same regression in order to capture the impact of the ‘newly created
value’.
Jaffe (1986) makes contribution in the same line of research. He puts forward the
issue of R&D spillovers into account, which is his principal focus of interest. R&D
spillover effects influence, according to Jaffe, the relative price of knowledge capital
to conventional capital to approximately same degree as they influence the
generalized q-value i.e. the market valuation coefficient of the firm in question. The
spillover variable itself has been modeled as a geometric proxy, based on R&D
expenditures and classified by technology class.
Further development is done by Hall (1992, 1993a, 1993b and 1998)5. Under the
assumption of constant returns to scale and long-term equilibrium, she derives two
versions of a model which results in hedonic price indices for various components of
intangible assets: an additive (linear) and a multiplicative (non-linear) form6. This
model has been applied in later empirical works.
Bosworth and Stoneman (1994), Bosworth and Mahdian (1998) and Bosworth,
Wharton and Greenhalgh (2000) make use of the Hall-model and apply it on US data.
Bosworth and Rogers (2001) work with Australian data. The study of Johnson and
Pazderka (1993) refers to Canadian database. These and other studies in the literature
differ in the choice they make regarding ‘intangible assets’ proxies. Almost all of
5 An extended model, based on the contributions of Hall, is discussed in section 3. 6 Hall and Kim (1997). See also Oriani (2000) for a non-linear application on US data.
7
them make use of R&D expenditures and the capitalized R&D expenditures, as well
as the number of patents and their stock. Hall and Oriani (2003) apply the market
value methodology on database for three countries in Continental Europe, namely
Italy, France and Germany.
As to patents, a number of recent studies further develop the traditional approach of
counting the number of patents the firm has applied for or it has been granted. Instead
of the traditional summing-up approach where each patent is equally treated
independent of its value, a number of authors, following the steps of Trajtenberg
(1990), weight the patents with the number of citations it received, the last being an
indicator for the value of each particular patent. Shane and Klock (1997) and Hall,
Jaffe and Trajtenberg (2000) provide examples of studies where patent citations are
used in market-valuation approach.
Advertising expenditures have been used in the analysis by Hirschey (1982),
Connolly and Hirschey (1984, 1988, 1990), Hall (1992, 1993a, 1993b) and Chauvin
and Hirschey (1993).
It is worthwhile to mention the attempt of Jaffe (1986) to take into account spillover
effects of R&D upon market value. He uses a proxy based upon the technological
specialization of the firm. Cockburn and Griliches (1988) measure spillovers by
means of ‘appropriation measures’, which they borrow from the so-called Yale
innovation-questionnaire (Levin et al., 1984).
8

The principal empirical findings in the market-valuation literature regarding
intangible assets, up to the present, have robustly been summarized by Bosworth,
Wharton and Greenhalgh (2000) in the following manner:
- R&D significantly affects the market value of a firm;
- The effect of the R&D expenditures is as much as direct as indirect via
spillovers from other firms;
- The impact of R&D expenditures has significantly decreased during the 80s;
- When both R&D and the number of patents are used in the regression equation,
R&D shows a dominating effect;
- When the regression includes both anticipated and non-anticipated changes of the
‘intangibles’, the effect of the last proves dominating;
- There are indications that differences in the market value of firms is not
exclusively a result of the differences in the intangible assets.
Although the market-valuation method for determining the intangible capital, based
upon the q-investment theory, has a solid theoretical base and many followers among
professional economists, it does not mean it has no disadvantages. The hedonic price-
index-interpretation introduced by Hall (1992) assumes equilibrium between supply
and demand at any observed moment. If the number of observations allows, it would
be the best if the time component were included (see Hall 1993a and 1993b; Chauvin
and Hirschey 1993; Stoneman and Toivanen 1997).
9

Another important and often pointed out objection against the market-valuation
approach is raised on the maneuverable efficiency assumption of stock exchange. The
supporters of this theory point out that all new available information related to the
future profit evolution is immediately reflected in share prices on well-functioning
stock exchange. The high volatility of the stock exchange (see for example, Shiller
1989) and long periods of manifestation of over- or undervaluing on stock prices
suggest the opposite. The theory of ‘rational speculative bubbles’ (see, for example,
Blanchard and Watson 1982)7 and the manifested presence of ‘fad behavior’ and
‘noise traders’ on the stock exchange increase the doubts around the stock exchange
efficiency.
[Insert Table 1 about here]
2.2. The Approach of Baruch Lev
The major concern of Baruch Lev, as an accounting specialist, is the incorrect
information obtainable from the annual accounts as a primary material to determine
the value of firm. In respect to this, he points out the continuously increasing market-
to-book ratio (Lev and Zarowin 1999; Lev 2000)8. One of the main reasons is,
according to Lev, the dramatic undervaluation of ‘intangibles’ in the annual
7 Some economists hold the opinion that the speculative bubbles are empirically impossible (see, for e.g. Campbell, Lo and MacKinlay, 1977). There is a going-on discussion in the literature on this topic. 8 In 1999 market-to-book ratio for the S&P 500 companies has reached value of 6.25 (Lev, 2000).
10

accounts9. He and his co-authors intend to verify this by regressing a variable for the
earnings upon different measures of intangible capital (like R&D expenditures,
patents and marketing-related expenditures) (Lev and Sougiannis 1996; Lev and
Zarowin 1998 and 1999; Amir, Lev and Sougiannis 1999; see also Sougiannis 1994;
Bond and Cummins 2000; Cummins 2002).
The application of a measure for earnings in the place of using market-valuation is
related to Lev’s disbelief in the relevance of stock-exchange data to determine market
value effectively. The methodology for estimation of the value of intangible capital of
a firm (Gu and Lev 2001) is derived from the following ‘production function’:
E = αKFIX + βKFIN + δKINT
E stands for economic performance and the K-variables represent respectively fixed,
financial and intangible capital. α, β and δ are the contributions of a unit of each form
of capital towards the economic performance. The last is measured as a weighted
average of the past and expected ‘core earnings’ (i.e. excluding unusual earnings).
KFIX and KFIN are taken from the annual accounts and adjusted for inflation.
9 Lev is strongly in favor of treating investment in ‘knowledge’ (in broad sense) indeed as investment, and not as current expenses. This means that the knowledge-related investment has to be depreciated during a longer period of time, exactly like the investment in fixed capital.
11

The average estimated values for α and β have been obtained from the empirical
literature: 0.07 for fixed capital, 0.045 for financial capital10. The earnings from the
intangible capital (IDE: ‘intangibles-driven earnings) are calculated as a residual:
IDE = δKINT = E - α KFIX - KFIN ˆ β̂
IDE, calculated in this way for the year 0, is the basic value for further estimation of
future expected returns from intangible capital in the following step on the basis of:
forecasts of financial specialists for the years 1 to 5, the long-term real rate of growth
of the economy (3%) from the year 11 and via linear interpolation for the
intermediate years 6-10. The discounted value of the series current and expected
IDE's is ultimately set equal to the value of intangible capital. In this way estimated
values of the intangible capital for a representative sample of big American firms
considerably improved the quality of the calculated association between the market
value and the (adjusted) book value.
The question is whether the abandonment of the (apparently unrealistic) assumption
about strictly efficient equity markets is paid too high price. There are three serious
problems with respect to the ‘accounting’ methodology:
- Reliability of the reported earnings data. Different authors have documented their
doubts (see for example Watts and Zimmerman 1980; Fisher and McGowan 1983
10 Gu and Lev anticipate the possibility for deviation form these values of the parameters in concrete cases of firms and/or periods.
12

regarding the difference between the depreciation in the annual accounts and the
economic depreciation; Salinger 1984). Also Hirschey and Wichern (1990) and
Connolly and Hirschey (1990) emphasize the statistical gaps of the earnings data
from the annual reports in comparison to the market value data originating from
the share prices. Cummins (2002), otherwise a supporter of Lev, points out the
weak reliability of the annual accounts regarding the physical capital stock.
- Usage of the averaged a priori values for the marginal earnings rates α and . ˆ β̂
- Extrapolation-procedure for the future IDE's. It is doubtful whether the reliance
upon the opinion of some financial specialists is not even more dangerous than
the reliance on the whole stock- exchange (confer the ‘Law of Big Numbers’).
With respect to the last problem, in another publication (Amir, Lev and Sougiannis
1999), Lev himself is doubtful about relying on the opinion of financial specialists
and this is based upon an empirical research11.
3. Methodology
The methodological approach towards measuring the value of investment in
intangible assets has been divided in two steps procedure. Beginning with the
financial market valuation established by Griliches and Hall, we derive a model to
11 The authors compute ‘adjusted R2’ in the regression of the ‘excess- returns’ upon a wide collection of indicators taken from the annual reports before and after inclusion of the forecasts of experts. The increment is 10%, which is, according to the authors, a modest result.
13

estimate the investment in intangible assets only for firms that are quoted on the stock
exchange. The obtained coefficients, which denote the individual relative
contributions of a unit of an intangible asset towards the economic performance of the
firm, serve as relative weights for different forms of intangible investment to a sample
of top 500 non-quoted firms. In so doing we measure the investment for the Belgian
private sector in the observed period.
3.1 First-stage (quoted firms) estimation
The model introduced by Griliches (1981) starts from the following simple
specification:
V = q (A+K) (3.1)
where V is the current market value of the firm (equity plus the book value of the
outstanding debt), A is the current value of assets (fixed, financial and current assets),
K is the value of the ‘knowledge capital’ and q is the current market evaluation
coefficient of the firm (mutually determined by the differential risk- and market-
position of the firm). Note that if K = 0, q coincides with Tobin’s q (V/A). q in the
expression (3.2) can be thus expressed as a generalization of Tobin’s q.
qi,t for the firm i during the period t, is a strictly positive variable which Griliches
decomposes into three measures: mi, permanent firm-effect; dt, the market-effect
during the period t and the error term ui,t:
14

qi,t = exp( mi+ dt+ ui,t) (3.2)
The combination of (3.1) and (3.2) gives:
ln vi,t ≡ lnti
ti
AV
,
, = mi+ dt+ ln (1+ti
ti
AK
,
, ) + ui,t (3.3)
Assuming that Ki,t/Ai,t is sufficiently small12, it could be observed as a combination of
R&D capital, and patents, . Griliches derives the following specification: RjiK ,
PjiK ,
ln vi,t = mi+ dt+ βR ti
Rti
AK
,
, + βP ti
Pti
AK
,
, + ui,t (3.4)
βR and βP can be interpreted as relative shadow prices. dt is a time-dependent sector
dummy. The specification (3.4) could be estimated in context of ‘fixed-effects’ panel.
v is, of course, nothing else but Tobin's q in the original denotation.
Described specification automatically solves the problems regarding measurement
and addition (R&D capital is an input in the innovation process, while patents are
output). In fact, regressions as (3.4) are of a ‘hedonic’ type: likewise the famous text-
book analysis of price-formation in automobiles industry (Griliches 1961), the
12 We use the result that log (1+a) a, for a ‘sufficiently’ small. In practice this does not hold for a > 0.15. Hall and Kim (1997) do not use this assumption and experiment with a non-linear regression specification in estimation of the coefficients.
≅
15

estimated regression coefficients β catch the influence of the factors that determine
the marginal shadow-prices of the components of intangible capital.
An expansion to this model has been introduced by Hall (1992, 1993a, 1993b, 1998).
Hall starts from the following generalized form of (3.1):
V = q(A+ β1K1+ β2K2 + ...βnKn)σ (3.5)
where σ represents the scale parameter. An equivalent regression, making use of the
above-mentioned assumptions, is given by the following linear equation:
ln Vi,t = mi+ dt+ σ ln Ai,t+ σ(β1ti
ti
AK
,
1, +...+ βn
ti
nti
AK
,
, ) + + ui,t (3.6) ∑l lγ ltiX ,
Note that the Xl variables represent other factors of influence upon the market-value,
which are not connected to the intangible assets, such as industry-concentration,
debt/equity ratio (as proxies for risk-sensitivity) and reputation, measured by the
lagged value of the market share (see for the last, for example, Blundell, Griffith and
Van Reenen 1999). Consequently, the measure for the value of the intangible capital
is once again Σk kK i . β̂k
t,
Hall offers an alternative for the above ‘additive’ form of the specification13. The
‘multiplicative’ version of the model is given as follows:
13 Additive form means that the firm is viewed as a sum of its assets.
16

V= qA (3.7) nkknKK ααασ ...1
1∑−
which leads to the following regression:
ln Vi,t = mi+ dt,+ σ ln Ai,t+α1 ln ti
ti
AK
,
1, +...+ αn ln
ti
nti
AK
,
, + + ui,t (3.8) ∑l lγ ltiX ,
Two difficulties arise in respect to the above specification. Firstly, the application of
(3.8) is hindered by the fact that in a representative sample of firms there would be
many units of observation that for various components of intangible assets would
have value of zero. Secondly, it is more realistic and more conformable to the
economic theory to assume that the shadow prices of the assets are equal for the firms
into consideration, than to assume equal elasticities. Therefore there are many more
examples of application of the additive expression in the present literature.
The intuitive idea that the difference between the market value and book value of a
firm could be used as a measure for the accumulated knowledge capital is based on
the assumption of long-term equilibrium and constant returns to scale. If these
conditions were not met, the econometric model would be misspecified, resulting in
faultily estimation. Here the long-term equilibrium represents an essential
assumption. In the case when, taken on average, q is different from 1, (q-1) A in the
regression (3.6) would be captured by the disturbance term which consequently
makes the interpretation of the results difficult.
17

The Griliches-Hall approach is theoretically consistent and empirically feasible, but it
requires efficiency of the stock exchange in narrow sense14. The previously reviewed
methodology proposed by Lev does not require efficiency of the market, but lacks
substantial theoretical basis for the reasons described in the previous section.
Therefore the Griliches-Hall approach is preferred if share prices could be ‘purified’
from the ‘irrational’ components. A relatively simple and rather raw way of doing so
consists in the possibility to regress series of representative stock market price index,
observed through long enough period, on an exponential trend and (a) business cycle
index(es). The deviations of the estimated value could be used as a base for
computing ‘fad-index’, which is used to correct the individual stock prices in the
following step:
log pt =β0 + β1T+ βcA(L)log ct+ βdB(L)log dt + ut (3.9)
where p is the market index and c and d are respectively domestic and international
business cycle indices. A(L) and B(L) are (estimated) lag-functions.
The expression (3.9) leads towards specification errors: the ‘fad-index’ (and
eventually other variables) are missing in the above specification and, in principle,
14 In recent publications Robert E. Hall (2001a, 2001b) takes a position with respect to the efficiency of the stock exchange, which by many has been considered extreme (see for e. g., Bond and Cummins 2000): the stock exchange is strictly efficient and the gap between the market value and the (measured) book value of the assets results fully from the (unmeasured) intangible capital.
18

can be a reason for biased regression coefficients. More generally holds that, in a
simple case when
A (L) = B(L) = 1
plim c = βc + βf βf,c β̂
where βf and βf,c represent respectively the coefficients of the missing ‘fad-index’ in
the real model of the stock exchange index and of the business cycle index in the
hypothetical regression of the ‘fad-index’ on this business cycle index. Obviously, the
estimation of βc would be consistent if the ‘fad-index’ is uncorrelated with the
business cycle index. If the last is not the case, the estimated coefficient of the
business cycle ‘picks up’ the part of ‘fad-index’ effect that converges with the
business cycle. The error term absorbs in this case the non-business-cycle-related part
of ‘fad-index’. A sufficiently broad-defined moving average of exp(ût) can serve as
(macro) correction for the ‘irrationality’ of the individual share prices used in the
regression of type as in (3.6). The results from the application of this correction on
the database are described in Appendix A.
3.2 Second stage estimation
The estimated model as in (3.6), corrected for the market ‘irrationality’, gives the
values of the coefficients. The estimation of the intangible capital in the set of nQ
firms is as follows:
kβ̂
19

= ∑∑ (3.10) QIMMtK ,
=
Qn
ik
Qktik K
1
,,β̂
while the corresponding value of the net-investment in intangible capital (assuming
that investment contributes to the stock of capital in the same period) is given by:
= - (3.11) QIMMtI , QIMM
tK , QIMMtK ,
1−
For the non-quoted firms, the market value is naturally unknown. As a sufficiently
good approximation for the rest of the private sector, we compute the value of the
intangible capital of the 500 non-quoted firms selected upon the criterion of the net
added value.
NQIMMtK , = (3.12) ∑ ∑
+
=
500
501
,,
ˆqn
ik
NQktik Kβ
The difference between the estimated intangible capital at two subsequent periods
denotes the level of the investment in intangible assets.
4. Data and Empirical Results
The studied sample of 113 Belgian firms quoted on Euronext excludes financial holdings
under the rationale that the reported investment in intangible assets, if any, would be
20

acquired via purchase of rights on other firms, financial holdings performing no actual
activity in producing goods and/or services. In other words, only investment in various
intangible assets conducted by the firm itself has been taken into consideration (such as
granted patents, intra-mural R&D expenditures etc.). The reason for doing so is to avoid
double counting, since we aim to estimate the investment in intangible assets for the
whole private sector of the Belgian economy15.
We aim at including in the estimation equation as many components/proxies of
intangible assets as possible. Belgian firms, likewise firms in many countries in
Continental Europe, are not required to report their expenditures in R&D, advertising,
patents or any other intangible assets. Therefore data are drawn from several
complementary sources. The dataset refers to the period from 1991 to 2001 and data
are collected at the firm level on an annual basis. Data on R&D expenditures and
patents go as far back as 1971, and we use them to calculate the stock of R&D and
the stock of patents, using the declining balance formula popularized by Hall (1990).
Accordingly, R&D capital is calculated as follows:
Kt=(1-δ) Kt-1+Rt or (4.1)
Kt=Rt +(1-δ)Rt-1+(1-δ)2Rt-2+….+(1-δ)sRt-s/( δ+r) (4.2)
where Kt is the R&D capital, Rt the current level of R&D expenditures, δ denotes the
depreciation rate chosen at 15%, and r represents the annual rate of growth in the
15 For example, extramural R&D expenditures of one firm could be reported as intramural R&D expenditures of another firm.
21

R&D expenditures which for the chosen period is on average 6% per year16. The
expression serves as an approximation for the initial stock of capital. Data on R&D
are drawn from the R&D surveys conducted by the IWT17 every second year in the
OECD framework. A firm is assumed not to be active in the R&D field if it has not
completed at least once the survey-questionnaire.
Similar to the calculation for the stock of R&D, the declining balance formula has
been used to compute the stock of citation-weighted patents18. Information on the
number of patents granted to Belgian firms comes from the USPTO. To identify
patents granted to Belgian firms, a matching procedure for the name of the owner has
been applied. This search procedure can lead to some undercounting for some firms,
which probably affects the results. However, a slight undercount of patens should not
change the result drastically, especially when care has been taken that the sum of
identified patents approximately corresponds to the number of patents annually
granted.
Most economists in the field of innovation and technical change have relied on the
popularly maintained hypothesis that patents serve as a proxy for inventive output,
while the R&D expenditure for inventive input. Previous works on the relationship
between equity market value and patents have shown that the simple patent counts
stock is a rather noisy indicator of the value of knowledge-based assets in a firm.
16 Science, Technology and Innovation Kay Figures 2002, European Commission. 17 Instituut voor de aanmoediging van innovatie door wetenschap en technologie in Vlaanderen. 18 See B. Hall (2000, 2001), PSt=0.85PSt-1+Pt
22

Except for different initiatives of firms to apply for patents, only a few patents are
very valuable. Therefore the number of patents held by a firm is not highly correlated
to the sum of the value of those patents and so the distribution of the value of
patented innovations is extremely skewed. (Scherer 1965, Hall et al. 2001).
Different from simple patent counts, patent citations are a proxy for knowledge flows
or impacts across organizational, technological and geographic boundaries. The
references information can be considered as a knowledge chain in an invention. This
makes it possible to identify the valuable patents in the stock of knowledge with the
assumption that valuable technological knowledge within the firm tends to generate
patents that future researchers build on and therefore cite when doing their own
innovation. On the other hand, the cited patents may be added by patent examiners
without the acknowledgement of citing inventor, which also reveals the staking-out
value of this patent in specific technological field. The more a particular patent is
cited, the more influential impact it has on the stock of knowledge. The research done
by Harhoff et al (1999) to validate the use of citations data to measure economic
impact claims explicitly that more valuable patents are more likely to renewed to full
term and that the estimated value is correlated with subsequent citations to that patent.
The most highly cited patents are very valuable and, ‘with a single U.S. citation
implying on average more than $1 million of economic value’ (Harhoff, et al 1999).
Practically, the value of a patent is discovered by its citations and so it becomes the
measure of patent ‘quality’.
23

Based on the assumptions mentioned above, we take subsequent citations to each
patent (if there is any) into account to calculate the citation-weighted patent stock,
and further on to relate each to its owner firm. Here we face another issue of
calculating citation-weighted patent stock for the patents which are not observed for
the complete time span (20 years), known as patents truncation bias problem. We
handle the problem by means of an empirically determined probability distribution of
citation frequency only dependent on citation lag. The citation-weighted patent is the
sum-up of all citations it receives throughout the lifetime of this specific patent. The
stock value of citation-weighted patent at time t is depreciated value of time t-1 at the
rate of 15%, plus the current value of citation-weighted at time t. Appendix B
describes the application of this methodology on the database.
Data on investment in sales and service are not available for the Belgian economy,
which limits the contents of this variable to advertising expenditures. Advertising
expenditures are often a proxy for investment in marketing (Hall 1993; Chauvin and
Hirschey 1993; Hirschey 1982). Data on annual advertising expenditures are
collected by the media agency Zenith Media Belgium.
The BelFirst database provided by Bureau Van Dijk and Trends Top 100000 are used
as sources of data on tangible, financial and current assets and short and long-term
liabilities. The DataStream database is used as a source of monthly data on the market
value of equity for companies quoted on the Euronext Stock Exchange. The sources
of data on intangible assets are summarized in Table 2.
24

[Insert Table 2 about here]
We apply on the database both the additive and the multiplicative specifications, as
described in (3.6) and (3.8), using market value corrected for the ‘fad’-component in
the share prices. Natural logarithm of the net-added value is used as a control variable
for the firm size. Description of variables is given in Table 3.
[Insert Table 3 about here]
To allow for inter-firm differences and other firm-specific unmeasured capital
components, we use ‘within’ estimates of the regressors and we compare these with
the random effects coefficients. Hausman test is used to check for significant
difference between fixed and random effect estimation. Table 4 reports the results of
the fixed (within) and random effects for both specifications, together with the total
OLS for comparison.
[Insert Table 4 about here]
The results from the additive regression indicate that the valuation of R&D stock is
not statistically different from zero for the quoted firms, except for the weak
significance at 10% in the random effects specification. The only significant
coefficient is the one for advertising expenditures and only in the fixed effects
25

estimation. On the other side, when running separate regressions for R&D stock and
advertising expenditures, both coefficients are significant respectively. We suggest
that the obtained result might be due to occurrence of a substitution effect between
the investment in R&D and advertising, meaning that firms may choose to invest in
the one or the other asset, but not often in both. Checking this assumption in our
database, we find only fifteen firms report investments both in R&D and advertising.
[Insert Table 5 about here]
The multiplicative form gives better result with respect to the R&D stock, the variable
being significant in both fixed and random effects estimation. Awkward result is
obtained for the advertising expenditures, where the coefficient is negative and
insignificant for fixed and random effects. Both the additive and the multiplicative
specification results show insignificant coefficients for the variable denoting citation
weighted patent stock. The later result suggests that the value of a patent is not
obviously recognized by investors.
5. Discussion and Conclusions
In our paper we have explored the relation between market value of firms and
investments in diversified intangible assets. It is the first comprehensive empirical
analysis of the valuation of firms in Belgium under the concept of ‘knowledge-based
26

economy’. We applied existing market value approach introduced by Griliches and
Hall. The methodology is tested on an original set of data, drawn from combined
resources. Similar research for other European countries, more precisely Germany,
France and Italy, was recently published by Hall and Oriani (2003). The major
concern in their paper is R&D expenditures, while as all other forms of intangible
assets are synthesized in one variable. In our paper we try to distinguish between as
many as possible types of intangible assets.
We introduced following novelties in the analysis. First, taking the argument on the
stock market efficiency assumption into account, we apply macro-correction of the
stock exchange indices for factors that cause irrationality in movements. Secondly,
we suggest a methodology how to compute the investment in intangible assets for the
economy as a whole, using the coefficients obtained from the regression on quoted
firms.
We arrive to the following findings. In general, the multiplicative form produces
more significant results than the additive form. The coefficient for capitalized R&D is
significant in the multiplicative form and more than one in both specifications, which
means that R&D investment is optimal choice for the company. The assets created are
worth more than their replacement value. Nevertheless, citation-weighted patent stock
shows insignificant. It seems that there exists a substitution effect between investment
in R&D and advertising, i.e. firms are more in favour of investing in one or another
27

type, but not in both. Advertising shows positive and significant influence on market
value in additive form, but not in the multiplicative.
We believe that the obtained ambiguous results are due to the limited data
availability. The firms are not required by law to report their R&D or advertising
expenditures. Moreover, the sample of quoted firms is small for Belgium and most
firms are of small to medium size. Further research is planned with respect to the
second-stage estimation results for the rest of Belgian private sector. Meanwhile, we
aim to improve the current database in order to achieve more representative results.
The evidence presented in this paper gives indication about investment behaviour in
Belgian private sector and serves as a macro-economic indicator for the importance of
intangible assets.
28

Table 1: Literature in Market Value Approach of Measuring Intangible Assets
Year Author Journal Country Dependent Variable Independent Variables (comments)
1977
Thomadakis REStat (59)
EV/S EV is market value of common stock + book value of debt – book value of tangible assets
measures of market power
1978 Ben-Zion JEcBus (30)
US
1981
Griliches EcLett (7)
US ln (V/A) V is market value of equity + book value of debt
distr. lag of R&D patentcount; accent op ‘new news’ analysis
1982
Hirschey JIE (30) US V/A R&D expenditures and advertising
1984 Ben-Zion in Griliches
(ed.)
US ln V R&D expenditure; firm patents as opposed to industry patents; earnings antic. vs unantic. Components
1984
Connolly and Hirschey
REStat (66)
US EV/S current R&D exp. patentcount, advertising see Hall (1998) on the estimation bias involved
1984 Hirschey and
Wichern
J. Buss. Ec. &
Stat. (4)
US cited in Jaffe (1986): accounting profits as a bad measure
1984
Salinger Rand J. (15)
argues for the use of market valuation data instead of accounting profits: fewer accounting biases and captures long-run effects; but: Shiller (1981)
1985 Pakes JPE(93) 1986
Jaffe
AER (76) US ln (V/A) uses a more detailed expression for q than
Griliches: spillover effects; spillover effects correlate with size effects of the presence of unions
1986 Connolly and Hirschey
RESt (68) US EV/S
29

Table1 (continued)
1988
Connolly and Hirschey
EcLett (27)
US EV/S id. as Connolly & Hirschey (1984)
1988
Cockburn and Griliches
AER, PP (78)
US ln (V/A) current R&D cumulated R&D (15% depr.rate) cumulated patents (30% depr.rate); spillover effects measured by appropriability variables
1990
Connolly and Hirschey
EcLett (32)
US V/S R&D-intensity patent-intensity advertising intensity; on the accounting biases of diff. measures; focus on firm-size issues
1991 Griliches, Hall and
Pakes
EINT (1)
US
1992
B. Hall WP (UC Berkeley)
US ln V cumulated R&D (15%) Current R&D (‘low variance of R&D series’) as a proxy for R&D stock; advertising exp.; R&D 4 times more important than advertising
1993 B. Hall AER(83) US id. id. 1993 B. Hall BPEA US ln (V/A)
evidence of the growing speed of
depreciation of R&D 1993
Megna and
Klock
AER(83)
US
V/A (semi-conductor industry)
accumulated R&D and patents using endogenous binomial weights; own vs competitor’s patents
1993
Chauvin and Hirschey
FinMgt (22)
US V (incl. debt ?)
R&D and advertising
1993 Johnson and Pazderka
MgtDecEc
(14)
Canada R&D spending and stock and patents; R&D depreciates much faster than at 15%
1994 Bosworth and Stoneman
private report
UK ln V R&D flows and stocks; patent flow and stocks; flows vs stocks does not make much difference
1996 Green, Stark and Thomas
JBFA (23)
UK
1997 B. Hall and Kim
US nonlinear regression model
30

Table1 (continued)
1997 Shane and Klock
RQFA (9)
US
ln (V/A) (semi-conductor industry)
patent citations
1997 Stoneman and Toivanen
WP (Warwick
BS)
UK ln V time variability of estimates
1998 Toivanen. Stoneman
and Bosworth
WP (Warwick
BS)
UK
1998
B. Hall
WP (NBER)
ln V about the assumption of additive separability of the value function; relation with hedonic price indices
1999
Bosworth and Mahdian
Ec. Appliquée
(52)
UK (pharmace
utical)
ln V incl. trademarks (and R&D exp. and stock, patents) good literature overview
1999
Blundell, Griffith and Van Reenen
RES(66) UK ln (V/A) innovation-count variable and patent-counts as an alternative; market share interacts with the effect of innovations; detailed econometric discussion
2000
Hall, Jaffe and
Trajtenberg
NBER WP
US ln (V/A) citation-weighted patent stocks are more highly correlated with market value
2000
Bosworth, Wharton and Greenhalgh
WP (OIPRC, Oxford)
UK ln V Pareto-Levy distribution for firm-specific V-effects; R&D flows under the equilibrium assumption; stocks of patents and trademarks; time-dummies to correct for inflation, using nominal variables; ‘new news’ analysis; good summary of main empirical findings; include current profit variables
2000
Oriani mimeo UK ln (V/A) only R&D capital nonlinear estimates
2001
Bosworth and Rogers
EcRec (77)
Austr. ln V R&D, patents, trademarks and designs; for non-manuf. firms a trademark weighs only about half of a patent
2003 Hall and Oriani
WP US ln (V/A) Only R&D capital Non-linear estimates
31
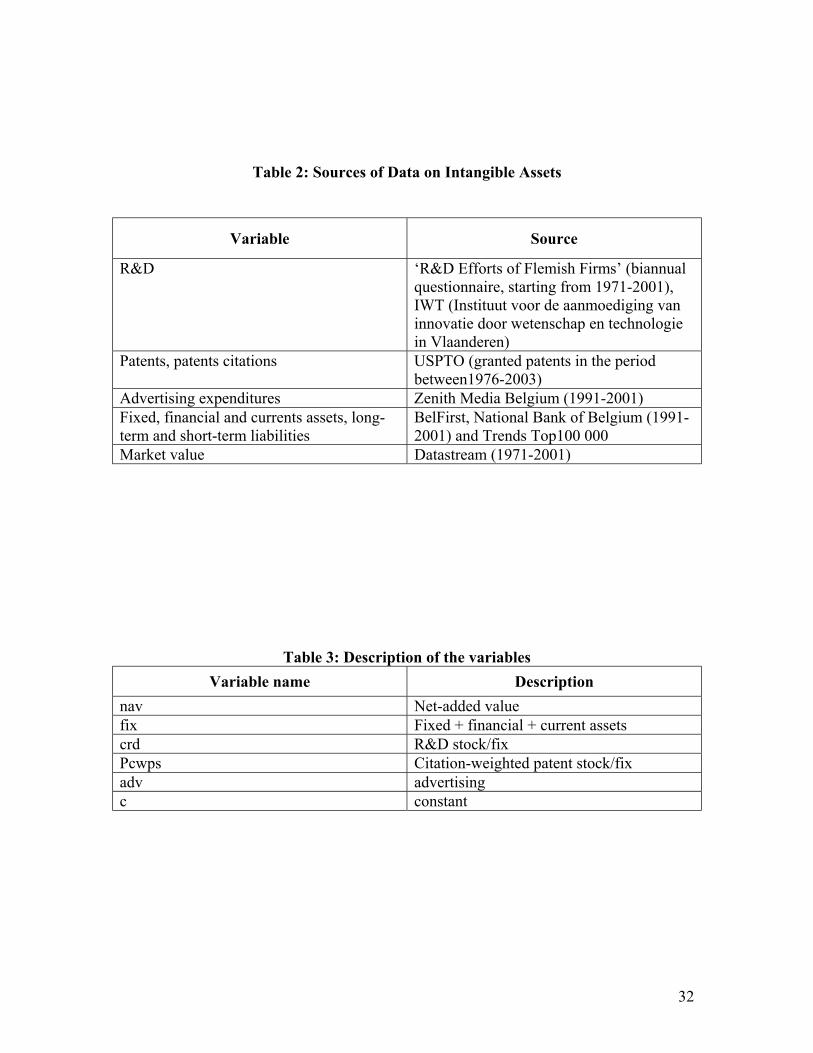
Table 2: Sources of Data on Intangible Assets
Variable Source
R&D ‘R&D Efforts of Flemish Firms’ (biannual questionnaire, starting from 1971-2001), IWT (Instituut voor de aanmoediging van innovatie door wetenschap en technologie in Vlaanderen)
Patents, patents citations USPTO (granted patents in the period between1976-2003)
Advertising expenditures Zenith Media Belgium (1991-2001) Fixed, financial and currents assets, long-term and short-term liabilities
BelFirst, National Bank of Belgium (1991-2001) and Trends Top100 000
Market value Datastream (1971-2001)
Table 3: Description of the variables Variable name Description
nav Net-added value fix Fixed + financial + current assets crd R&D stock/fix Pcwps Citation-weighted patent stock/fix adv advertising c constant
32

Table 4: Panel fixed and random effects estimation results (Dependent variable: ln corrected market value)
Total Fixed effects Random effects Additive form Year
ln(nav)
ln(fix)
Crd
Pcwps
Adv
C
.071*** (.014)
.172*** (.026)
.830*** (.035)
1.182† (.588)
-445.845* (151.602)
-1.075 (1.393)
-141.580***
(27.8011)
.047** (.016)
.415*** (.064)
1.088***
(.112)
2.066 (1.626)
319.151
(473.906)
3.739** (1.477)
.068*** (.012)
.227*** (.038)
.901*** (.055)
.757
(1.008)
-350.723 (200.111)
2.148
(1.281)
-135.901*** (23.825)
Multiplicative form
Year
ln(nav)
ln(fix)
ln(crd)
ln(pcwps)
ln(adv)
C
.053*** (.015)
.084
(.138)
.859*** (.127)
.522*** (.093)
.045
(.065)
-.096** (.029)
-103.927***
(30.086)
.062*** (.015)
.068
(.131)
1.474*** (.382)
1.028* (.392)
.076
(.077)
-.008 (.034)
.061*** (.012)
.149
(.115)
.835*** (.160)
.484** (.166)
.070
(.064)
-.018 (.031)
-119.858***
(24.180)
*** p<.001; ** p<.01; * p<.05; † p<.1; standard errors in parentheses.
33

Table 5: Panel fixed and random effects estimation results of R&D and Advertising in Additive Form (Dependent variable: ln mvcor_r)
Fixed effects
(within estimates) Random effects (variance components estimates)
R&D Stock Year ln(nav) ln(fix) Crd C
.028*** (.008) .229*** (.033) 1.067*** (.058) .891† (.519)
.046*** (.007) .154*** (.025) .847*** (.034) .221*** (.029) -90.741*** (14.111)
Advertising Year ln(nav) ln(fix) Adv C
.041** (.015) .421*** (.064) 1.079*** (.112) 3.721** (1.480)
.064*** (.012) .227*** (.038) .891*** (.055) 2.154 (1.285) -128.573*** (23.298)
R&D and Advertising Year ln(nav) ln(fix) Crd Adv C
.047** (.016) .415*** (.064) 1.089*** (.112) 1.874 (1.599) 3.736** (1.475)
.066*** (.012) .227*** (.039) .891*** (.055) .221 (.970) 2.175 (1.284) -133.243*** (23.832)
*** p<.001; ** p<.01; * p<.05; † p<.1; standard errors in parentheses.
34
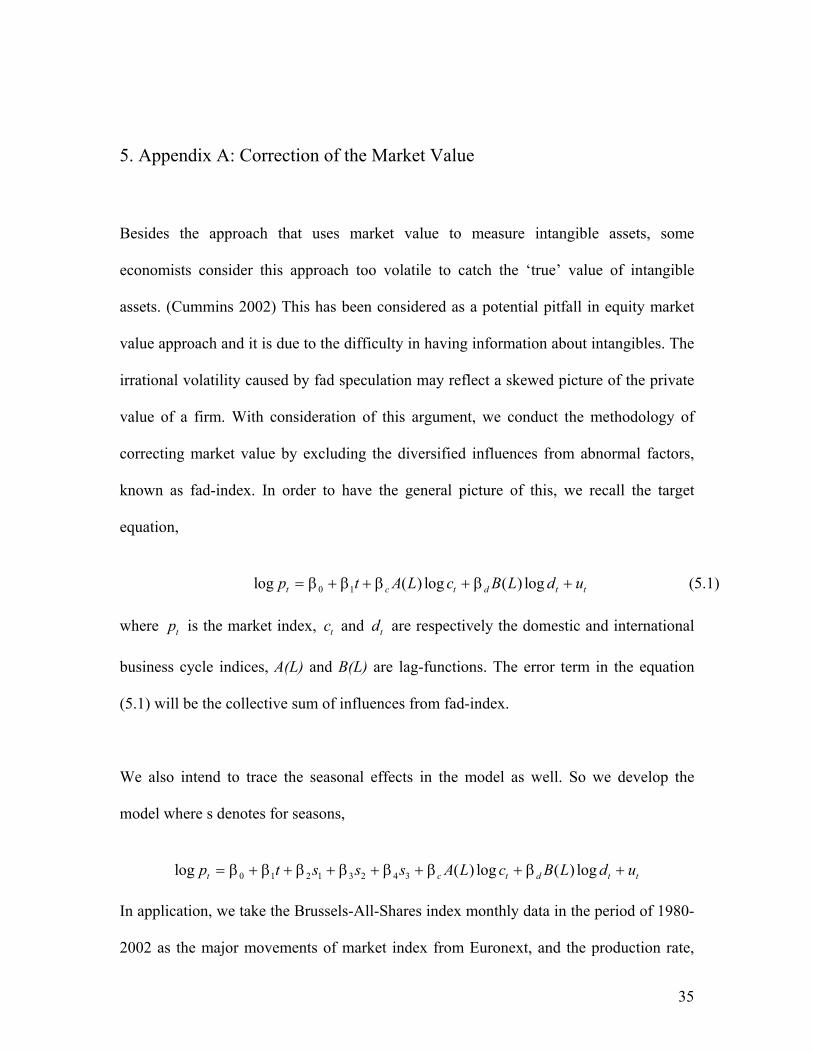
5. Appendix A: Correction of the Market Value
Besides the approach that uses market value to measure intangible assets, some
economists consider this approach too volatile to catch the ‘true’ value of intangible
assets. (Cummins 2002) This has been considered as a potential pitfall in equity market
value approach and it is due to the difficulty in having information about intangibles. The
irrational volatility caused by fad speculation may reflect a skewed picture of the private
value of a firm. With consideration of this argument, we conduct the methodology of
correcting market value by excluding the diversified influences from abnormal factors,
known as fad-index. In order to have the general picture of this, we recall the target
equation,
(5.1) 0 1log ( ) log ( ) logt c t dp t A L c B L dβ β β β= + + + +t tu
d t tu
where is the market index, and are respectively the domestic and international
business cycle indices, A(L) and B(L) are lag-functions. The error term in the equation
(5.1) will be the collective sum of influences from fad-index.
tp tc td
We also intend to trace the seasonal effects in the model as well. So we develop the
model where s denotes for seasons,
0 1 2 1 3 2 4 3log ( ) log ( ) logt c tp t s s s A L c B L dβ β β β β β β= + + + + + + +
In application, we take the Brussels-All-Shares index monthly data in the period of 1980-
2002 as the major movements of market index from Euronext, and the production rate,
35

known as one of the major domestic business cycle indicators and the export orders as the
proxy of international business cycle.19 We also take time trend into account. We have
estimation results as follows,
Table 6 Coefficient Standard Error t-value t-prob
Constant 2.49528 0.6047 4.12 0.025 t 0.0084071 0.0001593 52.8 0.00
1s 0.060509 0.03533 1.71 0.088
2s 0.0496935 0.03518 1.41 0.159
3s 0.0327446 0.03518 0.931 0.353
tc 1.04578 0.1926 5.43 0.003
1tc − 0.611951 0.1625 3.77 0.000
td -0.654789 0.1443 -4.54 0.008
Most coefficients show significant level of importance in the result and with R2 value of
0.921259. By inputting the expected coefficients back to the original model, we have the
expected value of abnormal disturbance of fad-index, û. And then, return e raised to the
power of û, noted as exp(ût). (see attached Graph 1)
By correcting market value with fad index, we aim to exclude the influences of irrational
speculation from investors in the market and so to explore the extent to which the present
value of a firm’s future profits varies with its knowledge-based assets.
19 The business survey conducted by National Bank of Belgium on monthly basis, also corrected with the change of base value from 1978.
36

Graph 1 Movements of exp(ût)
0
0.2
0.4
0.6
0.8
1
1.2
1.4
1.6
1.8
Jan-80
Jan-81
Jan-82
Jan-83
Jan-84
Jan-85
Jan-86
Jan-87
Jan-88
Jan-89
Jan-90
Jan-91
Jan-92
Jan-93
Jan-94
Jan-95
Jan-96
Jan-97
Jan-98
Jan-99
Jan-00
Jan-01
Jan-02
37

6. Appendix B: Citation-weighted patent stocks
We use the methodology of B. Hall, Jaffe and Trajtenberg (2000). Let C be the
number of citations in period s to patent x of company i submitted in period t (s ≥ t) by
the USPTO. The total number of citations received in period s of patents submitted in
period t by company i is obviously equal to,
),(, stxi
(6.1) ∑=
=)(
1, ),(),(
tNP
xxii
istCstC
where is the number of patents by company i submitted in period t. Consequently, )(tNPi
(6.2) ∑+
==
Tt
tsii stCtC ),()(
is the total number of citations received by company i for patents submitted in t, where T
is the maximum time span in which the patent gets cited. (the ‘citation duration’).
The basic assumption of the proposed methodology is that C is a good proxy for the
relative importance of the patents submitted in t by this company, as an alternative for
.
)(ti
)(tNPi
38

This leads to the following definition of the patent stock of a company: )(tK Ci
....)2,2()1(...)1,2()1()2,2()1(
)1,1()1(...),1()1()1,1()1(),(...)2,()1,(),(
...),2()1(),1()1(),(
),()1(
)()1()()1()1()(
222
2
2
21
1
+−+−−++−−−+−−−+
−+−−++−−+−−−++++++++=
+−−+−−+=
−=
−=+−−=
∑ ∑∑
∑ ∑
∑
+
=
−+
−=
−+
−=
−∞=
+
=
−
−∞=
−
TttCttCttC
TttCttCttCTttCttCttCttC
stCstCstC
sC
CtCtKtK
iii
iii
iiii
Tt
ts
Tt
tsi
Tt
tsii
t T
si
t
ti
ti
Ci
Ci
δδδ
δδδ
δδ
τδ
τδδ
τ
τ
τ
τ
τ
τ
(6.3)
In reality, however, there is only a finite series of observations of granted patents and
citations, which makes using equation (6.3) problematic. Assume, for instance, that we
have yearly citation data of the period 1960 to 2000 and assume further that the longest
citation lag is 20 years (T = 20). In that case, the citation history will only be complete for
patents granted till 1980. for patents granted after 1980 the history could be truncated and
the risk of truncation increases as patents are granted more recently.
A similar problem also occurs on the other side of the observation period. If all citations
at the beginning of the observation period are present in the database, a large number of
citations will refer to older patents granted before the beginning of the observation
period. Obviously these citations should not be taken into account.
The way Hall et al (2000) handle the truncation problem at the end of the observation
period is by means of an empirically determined probability distribution of the average
39

citation frequency. For this they used a model proposed by Caballero and Jaffe (1993)
and Jaffe and Trajtenberg (1996). These authors model the probability p(t,s) ≡ p(s–t) of
a patent granted in t to be cited in s as the result of a combination of an exponential
decay process and a second exponential process which represents the knowledge
diffusion process (the spillover effects) of the patent (s ≥ t):
{ }
0 1
( ) Prob citation occurs in the patent granted in
number of citations in to patents granted in E{ }total number of patents granted in
( , )E{ } for each ( )
exp[ ( )] (1 exp[
i
i
p s t s t
s tt
C t s iNP t
A s t
− =
=
=
= −β − − 2 ( )]) .s t−β −
(6.4)
β1 is the parameter of the rate of decay and β2 is the parameter of the knowledge
diffusion speed. A0 is a scale parameter.
In other words, we assume that the time distribution of the citations to a certain patent is
independent of the citing company, the company being cited, the sector or the total
number of citations a patent receives. Only the citation lag matters.
The coefficients of (6.4) can be estimated in a non-linear regression where the average
value of the citation-density per citation-year (the ratio of total number of citations
occurring s – t years after granting the patent), cross all the companies and industrial
40

sectors, is used as the dependent variable (see Jaffe and Trajtenberg 1996 and Hall, Jaffe
and Trajtenberg 2000)20. Because of the large sample they have, it seems appropriate to
use their regression results regarding to A0, β1 and β2.
In this case, if we only observe the first S – t years of the citation history (S is the last
observed citation year), then
∑∑==
−
−= S
ts
S
tsi
i
tsp
tsp
stC
stC
'')'(
)(
)',(
),(ˆ
and so, the estimated number of citations to patents granted to company i when only the
first S – t years of the citation history can be observed, is
1
'
1
'
ˆ ˆ( ) ( , ) ( , )
( , ')( , ) ( ) .
( ' )
S t T
i i is t s S
S
iS ts t
i Ss t s S
s t
C t C t s C t s
C t sC t s p s t
p s t
+
= = +
+=
= =
=
= +
= + −−
∑ ∑
∑∑ ∑
∑
T
+
(6.5)
This means that for patents of company i granted in 1998 (3 years before the end of the
observation period 2001), the corrected number of citations for 1998 could be calculated
as follows:
20 Hall, Jaffe and Trajtenberg (2000) explicitly take into account sector-effects and time-effects.
41

∑∑
∑∑
=
=
=
=−
−+=
2018
20022001
1998'
2001
1998'2001
1998)1998(
)1998'(
)',1998(),1998()1998(ˆ
s
s
si
sii sp
sp
sCsCC
(assuming that the last citation occurs 20 years after granting the patent).
There still is a final remark to be made about the implicit assumption of linearity in
equation (6.3) for calculating the citation-weighted patent stock.
In (6.3) we have implicitly assumed that the relative value of a patent is proportional to
the number of citations referring to that patent. But is the value of a patent that receives
2n citations twice that of a patent that receives n citations? In other words, couldn’t there
be increasing or decreasing returns to scale? And what with patents which are not cited at
all? Are they worth nothing?
Considering the large number of patents in the database, which are never cited, it is
especially precarious to apply the last implication. The intangible assets of a company
having incited USPTO patents would be, ceteris paribus, equal to that of a company
which has no patents at all.
Trajtenberg (1990) therefore suggests replacing the Ci,x(t)-terms implicitly present in
equation (6.3) by terms of the form
42

(6.6) , ( ) 1 , 0i xC t α + α >
He suggests an (in our view far-fetched) analytic method to determine the α-coefficient,
using an expression for the additional consumer surplus created by a representative
patent. The data we have do not allow such method. However, we keep the suggestion to
increase the citation weight of each patent with 1. So in (6.6) we assume that α = 1.
The expression for now becomes )(tK Ci
. ∑−∞=
− +−=t
iitC
i NPCtKτ
τ ττδ )]()([)1()(
Additionally, the zero values for the number of citations pose a separate problem of
purely statistical nature. If the value of in the ‘tail’ of the observation period
(when the number of remaining periods till the end of the observation period is less than
T) equals zero (see (6.5)), we cannot simply conclude that these patents will not be cited
in their lifespan. Such conclusion becomes more precarious as S – t is smaller. Hall et.al.
(2000) propose in this case to replace (zero according to (6.5)) with the
‘expected value’ of the number of citations in the last T – τ years (τ = 1,…,T – 1), given
∑=
S
tsi stC ),(
∑+
+=
Tt
Ssi tC
1,(ˆ s)
43

that during the first τ years the number of citations equals zero. The expected value is
calculated using the observed averages in the entire observation period.
However, given the relatively small number of observations we have for the Belgian
case, this line of reasoning would be based on a somewhat heroic assumption. In
addition, it seems illogical to take a small value for (for instance 1 or 2)
literally and a zero value not. Therefore we do not apply the suggestion from Hall et al
but keep equation (6.5) without any further modifications.
∑=
S
tsi stC ),(
44

Bibliography: Amir, E., B. Lev and T. Sougiannis (1999), ‘What value analysts’, Tel Aviv University,
Recanati Graduate School of Management, mimeo.
Ben-Zion, U. (1978), ‘The investment aspect of non-production expenditures: an
empirical test’, Journal of Economics and Business, 30: 224-229.
Ben-Zion, U. (1984), ‘The R&D investment decision and its relationship to the firm’s
market value: some preliminary results’, in: Z. Griliches (ed.), R&D, Patents and
Productivity (Chicago: Chicago University Press), pp. 299-314.
Blanchard, O. and M. Watson (1982), ‘Bubbles, rational expectations and financial
markets’,in: P. Wachtel (ed.), Crises in the Economic and Financial Structure
(Lexington,Mass.: Lexington Books), pp. 295-315.
Blundell, R., R. Griffith and J. Van Reenen (1999), ‘Market share, market value and
Innovation in a panel of British manufacturing firms’, Review of Economic Studies,
66:529-554.
Bond, S.R. and J.G. Cummins (2000), ‘The stock market and investment in the New
Economy: some tangible facts and intangible fictions’, Brookings Papers on
Economic Activity, 2000(1): 61-122.
Bosworth, D. (1996), ‘Static and dynamic measures of firm performance: a synthesis’,
Institute for Applied Economic and Social Research, University of Melbourne,
Working Paper no. 3/96.
Bosworth, D. and H. Mahdian (1999), ‘Returns to intellectual property in the
pharmaceuticals sector’, Economie Appliquée, 52: 69-93.
Bosworth, D. and M. Rogers (2001), ‘Market value, R&D and intellectual property: an
empirical analysis of large Australian firms’, Economic Record, 77: 323-337.
Bosworth, D. and P.A. Stoneman (1994), Feasibility Study for the Development of an
Innovation Scoreboard, Final Report to the DTI, London: Stoy Hayward Consulting.
Bosworth, D., A. Wharton and C. Greenhalgh (2000), ‘Intangible assets and market
valuation of UK companies: evidence from fixed effects models’, Oxford Intellectual
Property Research Centre, St. Peter’s College, working paper no. 2.
Campbell, J.Y., A.W. Lo and A.C. MacKinlay (1997), The Econometrics of Financial
45

Markets (Princeton: Princeton University Press).
Cañibano, L., M. García-Ayuso and P. Sánchez (2000), ‘Accounting for intangibles: a
literature review’, Autonomous University of Madrid, mimeo.
Chauvin, K.W. and M. Hirschey (1993), ‘Advertising, R&D expenditures and the market
value of the firm’, Financial Management, 22: 128-140.
Chung, K.H. and S.W. Pruitt (1994), ‘A simple approximation of Tobin’s q’, Financial
Management, 23: 70-74.
Cockburn, I. and Z. Griliches (1988), ‘Industry effects and appropriation measures in the
stock market’s valuation of R&D and patents’, American Economic Review, Papers
and Proceedings, 78: 419-423.
Connolly, R.A., B.T. Hirsch and M. Hirschey (1986), ‘Union rent seeking, intangible
capital and market value of the firm’, Review of Economics and Statistics, 68: 567-
577.
Connolly, R.A. and M. Hirschey (1984), ‘R&D, market structure and profits: a value-
based approach’, Review of Economics and Statistics, 64: 682-686.
Connolly, R.A. and M. Hirschey (1988), ‘Market value and patents. A Bayesian
approach’, Economics Letters, 27: 83-87.
Connolly, R.A. and M. Hirschey (1990), ‘Firm size and R&D effectiveness. A value-
based test’, Economics Letters, 32: 277-281.
Cummins, J.G. (2002), ‘A new approach to the valuation of intangible capital’, Division
of Research and Statistics of the Federal Reserve Board, mimeo.
Fisher, F.M. and J.J. McGowan (1983), ‘On the misuse of accounting rates of return to
infer monopoly profits’, American Economic Review, 73: 82-97.
Green, J.P., A.W. Stark and H.M. Thomas (1996), ‘UK evidence of the market valuation
of research and development expenditures’, Journal of Business Finance and
Accounting, 23: 191-216.
Griliches, Z. (1961), ‘Hedonic prices for automobiles: an econometric analysis of quality
change’, herdrukt in Z. Griliches (ed.), Price Indexes and Quality Change: Studies in
New Methods of Measurement (Cambridge, Mass.: Harvard University Press), pp.
55-87.
Griliches, Z. (1981), ‘Market value, R&D and patents’, Economics Letters, 7: 183-187.
46

Griliches, Z., B.H. Hall and A. Pakes (1991), ‘R&D, patents and market value revisited:
is there a second (technological opportunity) factor?’, Economics of Innovation and
NewTechnology, 1: 183-202.
Gu, F. and B. Lev (2001), ‘Intangible assets - measurement, drivers, usefulness’, mimeo.
Guilding, C. and R. Pike (1990), ‘Intangible marketing assets: a managerial accounting
perspective’, Accounting and Business Research, 21: 41-49.
Hall, B.H. (1992), ‘The value of intangible corporate assets: an empirical study of the
components of Tobin’s Q’, University of California at Berkeley, Dep. of Economics,
Working Paper 93-207.
Hall, B.H. (1993a), ‘The stock market’s valuation of R&D investment during the 1980’s’,
American Economic Review, Papers and Proceedings, 83: 259-264.
Hall, B.H. (1993b), ‘Industrial research during the 1980s: did the rate of return fall?’,
Brookings Papers on Economic Activity, 1993(2): 289-344.
Hall, B.H. (1998), ‘Innovation and market value’, paper prepared for the NIESR
Conference on Productivity and Competitiveness, London, 5 and 6 Feb. 1998.
Hall, B.H., A.B. Jaffe and M. Trajtenberg (2000), ‘Market value and patent citations: a
first look’, NBER Working Paper no. 7741.
Hall, B.H. and D. Kim (1997), ‘Valuing intangible assets: the stock market value of R&D
revisited’, University of California at Berkeley, Dep. of Economics, mimeo.
Hall, B.H. and Oriani R. (2003), ‘Does the market value R&D investment by European
firms? Evidence from a panel of manufacturing firms in France, Germany and Italy’,
working paper.
Hall, R.E. (2001), ‘The stock market and capital accumulation’, American Economic
Review, 91: 1185-1202.
Harhoff, Dietmar, Francis Narin, F.M. Scherer, and Kartin Vopel (1999), ‘Citation
Frequency and the Value of Patented Inventions’, The Review of Economics and
Statistics, 81: 511-515.
Hayashi, F. (1982), ‘Tobin’s marginal q and average q: a neo-classical interpretation’,
Econometrica, 50: 213-224.
Hirschey, M. (1982), ‘Intangible capital aspects of advertising and R&D expenditures’,
Journal of Industrial Economics, 30: 375-390.
47

Hirschey, M. and D. Wichern (1984), ‘Accounting and market value measures of
profitability: consistency, determinants and uses’, Journal of Business Economics and
Statistics, 4: 375-383.
Jaffe, A.B. (1986), ‘Technological opportunity and spillovers of R&D: evidence from
firms’ patents, profits and market value’, American Economic Review, 76: 984-1001.
Johnson, L.D. and B. Pazderka (1993), ‘Firm valuation and investment in R&D’,
Management Decision Economics, 14: 15-24.
Lev, B. (2000), ‘Knowledge and shareholder value’, NYU Stern School of Business,
mimeo.
Lev, B. (2001), Intangibles. Management, Measurement and Reporting (Wash. DC: The
Brookings Institution),
Lev, B. and T. Sougiannis (1996), ‘The capitalization, amortization and value-relevance
of R&D’, Journal of Accounting and Economics, 21: 107-138.
Lev, B. and P. Zarowin (1998), ‘The market valuation of R&D expenditures’, NYU Stern
School of Business Working Paper.
Lev, B. and P. Zarowin (1999), ‘The boundaries of financial reporting and how to extend
them’, Journal of Accounting Research, 37: 353-285.
Levin, R. et.al. (1984), ‘Survey research on R&D appropriability and technological
opportunity’, Yale University research paper.
Megna, P. and M.S. Klock (1993), ‘The impact of intangible capital on Tobin’s q in the
semi-conductor industry’, American Economic Review, 83: 265-269.
Meeusen, W. and G. Rayp (2000), ‘Patents and trademarks as indicators of international
competitiveness: the VAR versus the hysteresis approach’, in: P. Buigues, A.
Jacquemin and J.F. Marchipont (eds), Competitiveness and the Value of Intangible Assets
(Cheltenham, UK: Edward Elgar), p. 273-296.
Minne, B. (1995), ‘Onderzoek, ontwikkeling en andere immateriële investeringen in
Nederland’, Onderzoeksmemorandum 116, CPB, Den Haag.
Mortensen, J.,C. Eustace and K. Lannoo (1997), ‘Intangibles in the European economy: a
review essay’, presented at the ‘CEPS Workshop on Intangibles in the European
Economy’, Brussel.
Oriani, R. (2000), ‘R&D capital, uncertainty and the market value of the firm: a real
48

options approach’, presented at the Seminar on Innovation, Dep. of Economics and
Haas School of Business, University of California at Berkeley, 29 November 2000.
Pakes, A. (1985), ‘On patents, R&D and the stock market rate of return’, Journal of
Political Economy, 93: 390-409.
Salinger, M.A. (1984), ‘Tobin’s q, unionization and the concentration-profits
relationship’, Rand Journal of Economics, 15: 159-170.
Shane, H. and M.S. Klock(1997), ‘The relation between patent citations and Tobin’s Q in
the semiconductor industry’, Review of Quantitative Finance and Accounting, 9: 131-
146.
Shiller, R.J. (1989), Market Volatility (Cambridge, Mass.: MIT Press).
Sougiannis, T. (1994), ‘The accounting based valuation of corporate R&D’, Accounting
Review, 69: 44-68.
Stoneman, P. and O. Toivanen(1997), ‘Innovation and market value in the UK’, Warwick
Business School Working Paper.
Thomadakis, S.B. (1977), ‘A value-based test of profitability and market structure’,
Review of Economics and Statistics, 59: 179-185.
Tobin, J. (1969), ‘A general equilibrium approach to monetary theory’, Journal of
Money, Credit and Banking, 1: 15-29.
Toivanen, O., P. Stoneman and D. Bosworth (1998), ‘Innovation and the market value of
UK firms, 1989-1995’, Warwick Business School Working Paper.
Trajtenberg, M. (1990), ‘A penny for your quotes: patent citations and the value of
innovations’, Rand Journal of Economics, 21: 172-187.
Vosselman, W.H. (1991), ‘Investeringen in immateriële vaste activa door bedrijven’,
Statistische Onderzoekingen M 43, CBS, Den Haag.
Watts, R.L. and J.L. Zimmerman (1980), ‘On the irrelevance of replacement cost
disclosures for security prices’, Journal of Accounting and Economics, 2: 95-106.
49