Embed Size (px)
Citation preview
Vision Rex Vol. 33, No. 9, pp. 1281-1286, 1993 Printed in Great Britain. All rights reserved
0042-6989/93 $6.00 + 0.00 Copyright 0 1993 Pergamon Press Ltd
Research Note Induced Contrast from Radial Patterns QASIM ZAIDI,* NINA ZIPSER*
Received 27 October 1992
The perceived color of a region of visual space depends both on the spectral composition of the light incident from it and the light incident from surrounding regions. We studied the induced effect of combinations of colors surrounding a central test disk. Surround colors varied in a radially sinusoidal fashion around the perimeter of the test. Using a modulation nulling technique we show that when DC adaptation is controlled, the combined effect of such surrounds is equal to the sum of contrasts induced by individual elements of the surround. This result holds for both lightness and chromatic induction.
Lateral interaction Spatial integration Spatial nonlinearity Induced contrast Color appearance
INTRODUCTION
The perceived brightness, hue and saturation of lights depend not only on their spectral composition and radiance, but also on the spectral composition and radiance of surrounding lights (Chevreul, 1839). The induced effect of surrounding lights can be used to study visual mechanisms that compute color appearance, in particular the chromatic (for references see: Krauskopf, Zaidi & Mandler, 1986) and lateral interactions (for references see: Zaidi, Yoshimi & Flanigan, 1991; Zaidi, Yoshimi, Flanigan & Canova, 1992) that are a part of this computation. The combined induced effect of spatially complex surrounds, the best known example of which are the “mondrians” used by Land (1986), have been of particular interest to visual scientists. Though there are some claims that the combined effect of a complex surround is the sum of the effect of individual patches (e.g. Jameson & Hurvich, 1961), it is possible to generate counter-examples to this claim (e.g. White, 1979; Zaidi, 1990). The figures presented in Zaidi (1990) demonstrate that, in general, the induced effect due to one portion of a spatially complex surround is influenced by the effects of other parts of the surround. It is not clear whether the non-additivity of the induced effect is due just to spatial variations adjacent to the test, or occurs only for spatial configurations where the visual system uses relative radiance and chromaticity to com- pute apparent color in conjunction with more complex attributes like shape, transparency and depth (e.g. Judd, 1966; Gilchrist, 1980; Adelson, 1990; Spehar, Arend & Gilchrist, 1992). It is also possible that measurements showing non-additivity in previous studies may have been contaminated by variations in the state of DC
*Department of Psychology, Columbia University, New York, NY 10027, U.S.A.
adaptation and successive induced contrast due to eye movements.
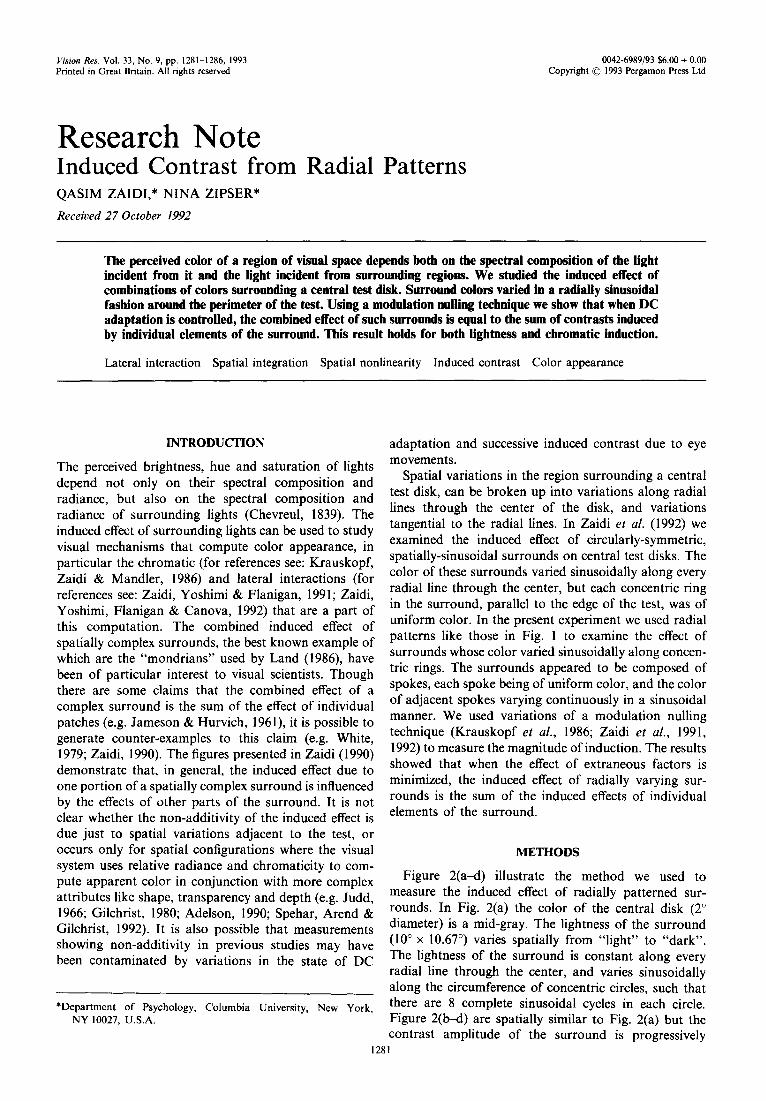
Spatial variations in the region surrounding a central test disk, can be broken up into variations along radial lines through the center of the disk, and variations tangential to the radial lines. In Zaidi et al. (1992) we examined the induced effect of circularly-symmetric, spatially-sinusoidal surrounds on central test disks. The color of these surrounds varied sinusoidally along every radial line through the center, but each concentric ring in the surround, parallel to the edge of the test, was of uniform color. In the present experiment we used radial patterns like those in Fig. 1 to examine the effect of surrounds whose color varied sinusoidally along concen- tric rings. The surrounds appeared to be composed of spokes, each spoke being of uniform color, and the color of adjacent spokes varying continuously in a sinusoidal manner. We used variations of a modulation nulling technique (Krauskopf et al., 1986; Zaidi et al., 1991, 1992) to measure the magnitude of induction. The results showed that when the effect of extraneous factors is minimized, the induced effect of radially varying sur- rounds is the sum of the induced effects of individual elements of the surround.
METHODS
Figure 2(a-d) illustrate the method we used to measure the induced effect of radially patterned sur- rounds. In Fig. 2(a) the color of the central disk (2” diameter) is a mid-gray. The lightness of the surround (loo x 10.67”) varies spatially from “light” to “dark”. The lightness of the surround is constant along every radial line through the center, and varies sinusoidally along the circumference of concentric circles, such that there are 8 complete sinusoidal cycles in each circle. Figure 2&-d) are spatially similar to Fig. 2(a) but the contrast amplitude of the surround is progressively
1281

1282 RESEAR :CH NOTE
FIGURE I FIGURE 2
RESEARCH NOTE 1283
reduced. Figure 2(d) at 0.0 contrast is a uniform sur- round at the same mid-gray as the test. The colors of the test-disks are an identical mid-gray in all four panels. Our measurement strategy was to compare the induced effect of surrounds like Fig. 2(a-d). The average light- ness of each concentric ring in all these surrounds is the same mid-gray. We were interested in seeing whether Fig. 2(ac) showed a different induced effect than the zero effect in Fig. 2(d), and whether this effect was a function of the contrast amplitude. To this end we sinusoidally counter-phase modulated (1 Hz) the light- ness of the surround, thus passing through all the phases depicted in Fig. 2. Pilot observations indicated that local “light” and “dark” patches were induced at the edge of the test, but there appeared to be no change in the appearance of the center of the test.
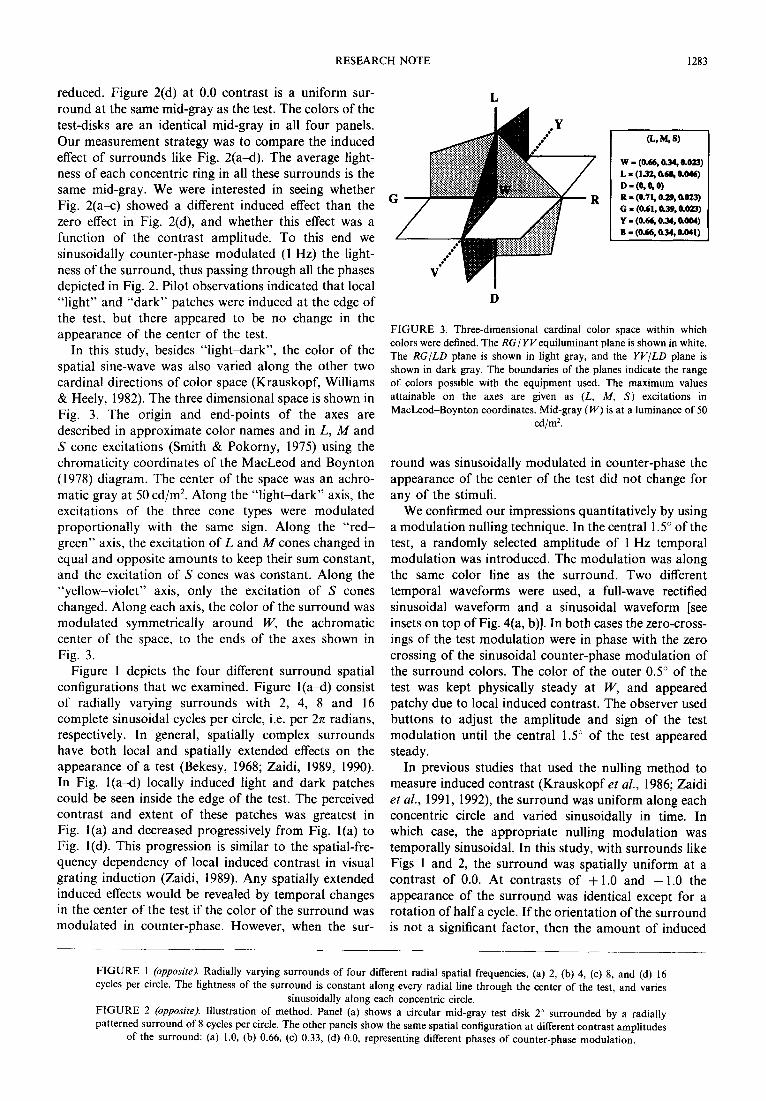
In this study, besides “light-dark”, the color of the spatial sine-wave was also varied along the other two cardinal directions of color space (Krauskopf, Williams & Heely, 1982). The three dimensional space is shown in Fig. 3. The origin and end-points of the axes are described in approximate color names and in L, M and S cone excitations (Smith & Pokorny, 1975) using the chromaticity coordinates of the MacLeod and Boynton (I 978) diagram. The center of the space was an achro- matic gray at 50 cd/m*. Along the “light-dark” axis, the excitations of the three cone types were modulated proportionally with the same sign. Along the “red- green” axis, the excitation of L and A4 cones changed in equal and opposite amounts to keep their sum constant, and the excitation of S cones was constant. Along the “yellow-violet” axis, only the excitation of S cones changed. Along each axis, the color of the surround was modulated symmetrically around W, the achromatic center of the space, to the ends of the axes shown in Fig. 3.
Figure 1 depicts the four different surround spatial configurations that we examined. Figure l(ad) consist of radially varying surrounds with 2, 4, 8 and 16 complete sinusoidal cycles per circle, i.e. per 27c radians, respectively. In general, spatially complex surrounds have both local and spatially extended effects on the appearance of a test (Bekesy, 1968; Zaidi, 1989, 1990). In Fig. l(a-d) locally induced light and dark patches could be seen inside the edge of the test. The perceived contrast and extent of these patches was greatest in Fig. l(a) and decreased progressively from Fig. l(a) to Fig. l(d). This progression is similar to the spatial-fre- quency dependency of local induced contrast in visual grating induction (Zaidi, 1989). Any spatially extended induced effects would be revealed by temporal changes in the center of the test if the color of the surround was modulated in counter-phase. However, when the sur-
FIGURE 3. Three-dimensional cardinal color space within which
colors were defined. The RGIYVequiluminant plane is shown in white.
The RG/LD plane is shown in light gray, and the YV/LD plane is
shown in dark gray. The boundaries of the planes indicate the range
of, colors possible with the equipment used. The maximum values
attainable on the axes are given as (L, M, S) excitations in
MacLeod-Boynton coordinates. Mid-gray (IV) is at a luminance of 50
cd/m2.
round was sinusoidally modulated in counter-phase the appearance of the center of the test did not change for any of the stimuli.
We confirmed our impressions quantitatively by using a modulation nulling technique. In the central 1.5” of the test, a randomly selected amplitude of 1 Hz temporal modulation was introduced. The modulation was along the same color line as the surround. Two different temporal waveforms were used, a full-wave rectified sinusoidal waveform and a sinusoidal waveform [see insets on top of Fig. 4(a, b)]. In both cases the zero-cross- ings of the test modulation were in phase with the zero crossing of the sinusoidal counter-phase modulation of the surround colors. The color of the outer 0.5” of the test was kept physically steady at W, and appeared patchy due to local induced contrast. The observer used buttons to adjust the amplitude and sign of the test modulation until the central 1.5” of the test appeared steady.
In previous studies that used the nulling method to measure induced contrast (Krauskopf et al., 1986; Zaidi et al., 1991, 1992) the surround was uniform along each concentric circle and varied sinusoidally in time. In which case, the appropriate nulling modulation was temporally sinusoidal. In this study, with surrounds like Figs 1 and 2, the surround was spatially uniform at a contrast of 0.0. At contrasts of + 1.0 and - 1.0 the appearance of the surround was identical except for a rotation of half a cycle. If the orientation of the surround is not a significant factor, then the amount of induced
FIGURE 1 (opposife). Radially varying surrounds of four different radial spatial frequencies, (a) 2, (b) 4, (c) 8, and (d) 16
cycles per circle. The lightness of the surround is constant along every radial line through the center of the test, and varies
sinusoidally along each concentric circle. FIGURE 2 (opposire). Illustration of method. Panel (a) shows a circular mid-gray test disk 2” surrounded by a radially
patterned surround of 8 cycles per circle. The other panels show the same spatial configuration at different contrast amplitudes
of the surround: (a) 1.0, (b) 0.66, (c) 0.33, (d) 0.0, representing different phases of counter-phase modulation.
1284 RESEARCH NOTE
la)
- Observer NZ o+++
i 3 50
‘*light-dark”
.%! Z
5 0 i
. ..~..~ _..... m . . . . . . . . . . . . . la...
..D.a.....B. . . . . . . . . . . .
-z
3 SO “yellow-violet”
?L B 0
u 1
..$..$. .,.,. I . . . . . . . . . . $...
24 8 16 24 8 16 24 a 16
..I .I
” light-dark”
‘red-green’
“yellow-violet”
.E.* . . @ . . . . . ,.... D I...
Radial spat,ial frequency of surround (cycles/circle)
fb)
- Observer QZ n+d
=; B 0
0.. . . . . . 3 . 0 ,........... (1 . . ..I
,:
z -so-
r” ._
2
5
$ so- “yellow-violet”
,’ .- B
S *: . ~...*.~ . . . . . . . . . . . . . $. ..,.
” light-dark”
“red-green”
“yellow-violet”
.,.., $,.~...S . . . . . . . . . . . . . m . . .
Radial spatiol frequency of surround
(cycles/circie)
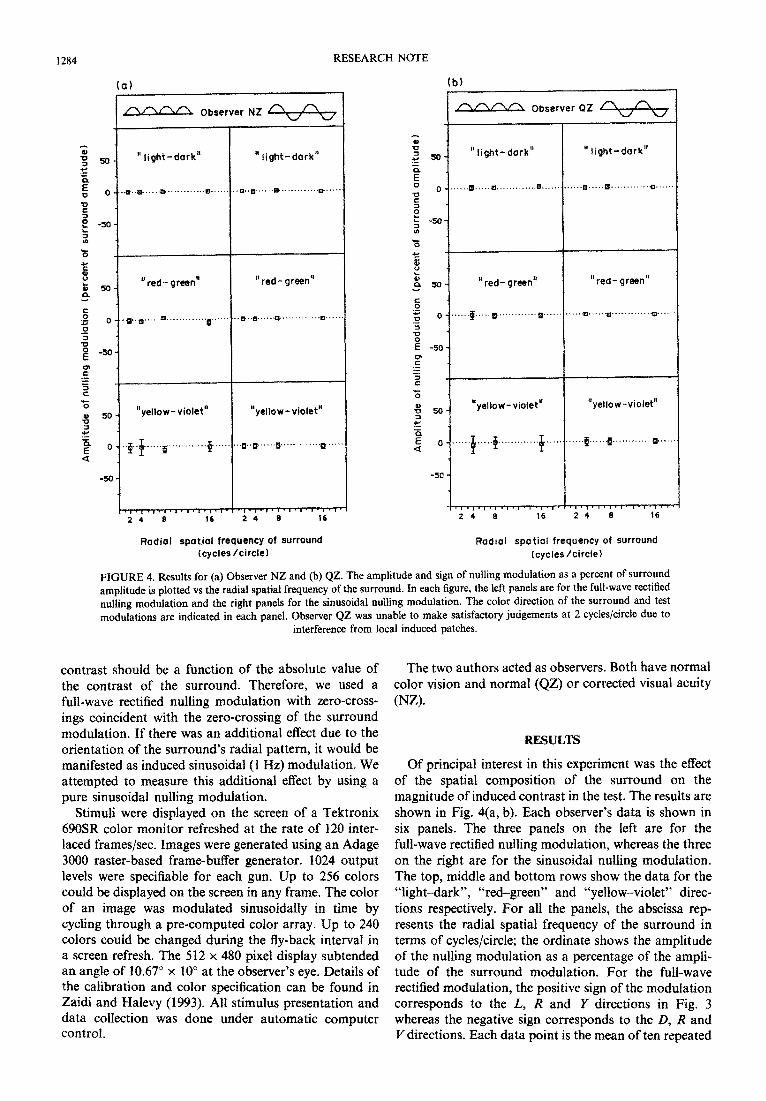
FIGURE 4. Results for (a) Observer NZ and (b) QZ. The amplitude and sign of nulling modulation as a percent of surround amplitude is plotted vs the radial spatial frequency of the surround. In each figure, the left panels are for the full-wave rectified nulling modulation and the right panels for the sinusoidal nulling modulation. The color direction of the surround and test m~ulations are indicated in each panel. Observer QZ was unable to make satisfactory judgements at 2 cycles/circle due to
interference from local induced patches.
contrast should be a function of the absolute value of the contrast of the surround. Therefore, we used a full-wave rectified nulling modulation with zero-cross- ings coincident with the zero-crossing of the surround modulation. If there was an additional effect due to the orientation of the surround’s radial pattern, it would be manifested as induced sinusoidal (1 Hz) modulation. We attempted to measure this additional effect by using a pure sinusoidal nulling modulation.
Stimuli were displayed on the screen of a Tektronix 690SR color monitor refreshed at the rate of 120 inter- laced frames/set. Images were generated using an Adage 3~0 raster-based frame-buffer generator. IO24 output levels were specifiable for each gun. Up to 256 colors could be displayed on the screen in any frame, The color of an image was modulated sinusoidally in time by cycling through a pre-computed color array. Up to 240 colors could be changed during the fly-back interval in a screen refresh. The 512 x 480 pixel display subtended an angle of 10.67” x 10” at the observer’s eye. Details of the ~libration and color specification can be found in Zaidi and Halevy (1993). All stimulus presen~tion and data collection was done under automatic computer control.
The two authors acted as observers. Both have normal color vision and normal (QZ) or corrected visual acuity
PJZ).
RESULTS
Of principal interest in this experiment was the effect of the spatial composition of the surround on the magnitude of induced contrast in the test. The results are shown in Fig. 4(a, b). Each observer’s data is shown in six panels. The three panels on the left are for the full-wave rectified nulling modulation, whereas the three on the right are for the sinusoidal nulling modulation. The top, middle and bottom rows show the data for the “light-dark”, “red-green” and “yellow-violet” direc- tions respectively. For all the panels, the abscissa rep- resents the radial spatial frequency of the surround in terms of cycles/circle; the ordinate shows the amplitude of the nulling modulation as a percentage of the ampli- tude of the surround modulation. For the full-wave rectified modulation, the positive sign of the modulation corresponds to the L, R and Y directions in Fig. 3 whereas the negative sign corresponds to the D, R and Ydirections. Each data point is the mean of ten repeated
RESEARCH NOTE 1285
observations. The vertical bars through each point show + 1.0 standard deviations. In many cases, the bars were shorter than the size of the symbols, indicating the precision of the nulling method. The results were very simple: for all three color directions and all spatial combinations in Fig. 4, the amount of induced contrast was not si~i~~ntly different from zero. That is, if the colors of a surround vary along any color line such that the sum of colors along every concentric ring is equal to W, then there is zero induced contrast in the center of a test whose color is also metameric to W.
DISCUSSION
In this paper and in Zaidi et af. (1992) we have measured the effects of spatially complex surrounds on the appearance of a central test disk. In Zaidi et al. (1992) the color of the surround varied sinusoidally along radii through the center of the test giving the appearance of continually varying concentric rings, whereas in this paper the color of the surround varied sinusoidally parallel to the edge of the test disk giving the appearance of continually varying spokes. The magni- tude of induced contrast was measured along each of the three cardinal directions of color space. Modulation nulling techniques were used in both studies. Hence, except for small errors of fixation, the portion of the retina that the test was imaged on, was not exposed to the surround. In addition, at the null setting, the time and space averaged adaptation was equal to W. The results of these two studies thus isolate lateral effects without contamination by variations in DC adaptation or by successive induced contrast.
The experiments in Zaidi et al. (1992) tested a simple model that postulates a weighted spatial integration of induced contrast. The perceived color at a point in visual space has two components, one due to the radiance and spectral composition of the light emanating from that point and the second due to the total induced effect of surrounding points. The model makes three assumptions about the induced effect. First, if the colors in a display are restricted to one line in color space, the induced effect of any surrounding point is in the complementary direction from the surround color with respect to the test color, with a magnitude proportional to the difference between the two colors. Second, the induced effect of each surrounding point is weighted by a decreasing function of spatial distance from the test point. Third, the total induced effect is simply the sum of the induced effects of individual surrounding points. Algebraically, the model is defined by equation (1):
5,
y=- z* s
s &)A @, 31 ds
0 dR (1) R=O 2n
where y is the total induced effect at the test point; Q is the direction away from the test point; s is the spatial distance in units of degrees of visual angle from the test, SO that the test point is at s = 0; g(s) is the monotonically
decreasing spatial weighting function of s; and A@, s) is the signed magnitude of the color difference between (Q, s) and the test point.
The “light-dark” results in Zaidi et al. (1992) showed additivity of the induced effects of surround elements along lines radiating from the center of the test, with an approximately exponential spatial weighting function. In the surrounds used in the present study, at all phases of the counter-phase modulation, the sum of colors parallel to the perimeter was equal to W, the color of the test. Additivity of induced effects predicts zero induction, which is what the “light-dark” results in Fig. 4 show. Therefore, the model is also correct for surrounds whose lightness varies tangential to the radial lines. These two results together indicate that in the computation of perceived lightness, the underlying lateral interactions are additive, isotropic and decrease in strength with increasing distance.
The chromatic induction results in Zaidi et al. (1992), on the other hand, were inconsistent with the assump- tions of the weighted spatial integration model and indicated the presence of nonlinear spatial interactions along radial lines through the center of the test. The present results in Fig. 4 show that even for chromatic induction the total induced effect was zero, indicating that the induced effects of different parts of the surround parallel to the edge of the test are roughly summed.
The figures in Zaidi (1990) demonstrate that for certain spatial configurations the “light-dark” results of the present study do not hold and that the induced effects due to different levels of lightness adjacent to the test region combine in a non-additive fashion. Since it is now clear that it cannot be spatial variations adjacent to the test per se that are responsible for the non-additivity, it will be worth examining configurations that show non-additivity to see whether perceived light- ness is confounded with other factors like perceived transparency.
REFERENCES
Adelson, E. H. (1990). Lightness judgements and perceptual organiz- ation. rnvestigative Ophthalmology and Visunf Science (Suppl.), 31, 265.
von Bekesy, G. (1968). Mach- and Hering-type lateral inhibition in vision. Vision Research, 8, 1483-1499.
Chevreul, M. E. (1839). De la loi du contraste simultane des couleurs. Paris: Pitois-Levreault.
Gilchrist, A. L. (1980). When does perceived lightness depend on perceived spatial arrangement? Perception & Psychophysics, 28, 527-538.
Jameson, D. 8c Hurvich, L. M. (1961). Complexities of perceived brightness. Science, 133, 174-179.
Judd, D. B. (1966). Color appearance. Proceedings inter~tiona~ color meeting, Lucerne, Switzerland, 1965 (Vol. 1, pp. 27-51). Gottingen: Musterschmidt.
Land, E. H. (1986). Recent advances in retinex theory. Vision Re- search, 26, 7-21.
Krauskopf, J., Williams, D. R. & Heely, D. M. (1982). The cardinal directions of color space. Vision Research, 22, 1123-I 131.
Krauskopf, J., Zaidi, Q. % Mandler, M. B. (1986). Mechanisms of simultaneous color induction. Journal of the OpticaI Society of
America, A3, 1752-1757.

1286 RESEARCH NOTE
MacLeod, D. I. A. & Boynton, R. M. (1978). Chromaticity diagram showing cone excitation by stimuli of equal luminance. Journal of rhe Optical Society of America, 69, 1183-I 186.
Sachtler, W. L. & Zaidi, Q. (1992). Chromatic and luminance signals in visual memory. Journal of the Optical Society of America, 9, 877-894.
Smith, V. C. & Pokomy, J. (1975). Spectral sensitivity of the fovea1 cone photopigments between 400 and 700 nm. Vision Research, 15, 161-171.
Spehar, B., Arend, L. E. & Gilchrist, A. L. (1992). White’s illusion: A new luminance distribution constraint. Investigative Ophthalmology and Visual Science, 33, 1260.
White, M. (1979). A new effect on perceived lightness. Perceprion, 8, 413-416.
Zaidi, Q. (1989). Local and distal factors in visual grating induction. Vision Research, 29, 691697.
Zaidi, Q. (1990). Apparent brightness in complex displays: A reply to Moulden and Kingdom. Vision Research, 30, 1253-1255.
Zaidi, Q. & Halevy, D. (1993) Visual mechanisms that signal the direction of color changes. Vision Research, 33, 1037-1051.
Zaidi, Q., Yoshimi, B. & Flannigan, J. (1991). The influence of shape and perimeter-length on induced color contrast. Journal of the Optical Society of America, A8, 18l(rl817.
Zaidi, Q., Yoshimi, B., Flanigan, N. & Canova, A. (1992). Lateral interactions within color mechanisms in simultaneous induced con- trast. Vision Research, 32, 1695-1707.
Acknowledgemenfs-We thank Ben Sachtler for comments and help with photography. This research was supported partially by the National Eye Institute through grant EY07556 to Qasim Zaidi.