Embed Size (px)
Citation preview
1
INDONESIAN ECONOMIC PERFORMANCE
MAY 2005
Coordinating Minister of Economic Affairs

2
Contents
I. Introduction ……………………………………………………………….. 5
II. Indonesian Economy A Recent Data ...................................……………… 8
1. ECONOMIC MARKET ...........…………………………………………… 8
2. FINANCIAL MARKET .............................………………….…………… 14
2.1 Stock Market Performance………………………………………. .. 14
2.2 Interest Rate ........................……………………………………..... 15
2.3 Rupiah Exchange Rate .........…………………………………….... 16
2.4 Banking ...............……………………………………………….... 19
3. INFLATION AND MONETARY POLICIES…………………………….. 20
4. INTERNATIONAL ECONOMY ...............................…………………… 22
5. EXPORTS AND IMPORTS ....…………………………………………… 24
6. FISCAL POLICIES .... ……………………………………………………. 26
III. Strategic Issues .............................…………………………………………. 32
2.1 National Infrastructure Development Challenges ………………… 32
IV. Conclusion ……………………………………………............................... 39

3
GRAPHIC
Graphic 1 Jakarta Stock Exhchange ………....………………………......... 6
Graphic 2 Sources of GDP Growth ………… …………………………..... 8
Graphic 3 Source of GDP Growth 2005………………..………………… 9
Graphic 4 Precentage of Investment Realization .....…………………….. 10
Graphic 5 Electricity Compsumption .............................. …….………… 12
Graphic 6 Car Sales ........................................................………………… 12
Graphic 7 Motor Sales ....................................................………………… 13
Graphic 8 Cement Sales ..................................................... ......................... 13
Graphic 9 Chart Fluctuations of the Rupiah and IHSG
(Composite Stock Index )............................................................ 14
Graphic 10 Fed Fund Rate Developments ……………….......................... 15
Graphic 11 Developments of Yield Curves in Indonesia ………............... 16
Graphic 12 Rp/USD Index and Inflations ………. ..................................... 20
Graphic 13 Domestic Interest Rates ........................................................... 21
Graphic 14 Imports by Types of Goods ……………................................. 25
Graphic 15 Non-Gas and Oil Exports (annual)………….. ........................ 25
Graphic 16 Relationship Between Oil Price and State
Budget 2005 Deficit ………………………………................. 27
Graphic 17 Real Wager of Farmers …………………………….. ............. 30
Graphic 18 Wages of Urban Internal Workers .......................................... 31
TABLE
Table 1 Number of Foreign and Domestic Investment Approvals……… 9
Table 2 Quartely GDP Growth by Industrial Origin ………………… .... 11
Table 3 Development of Interest Rates, Stock and Foreign Reserves....… 17
Table 4 National Banking Performance.....................…………………… 19
Table 5 Global Economy Indications (%)........…………………………. 22
Table 6 Global Oil Demands ........................................ ……….. ……… 23

4
BOX
Box 1 Oil rices and State Budget . ………………………………………. 27
Box 2 Steps Taken to Reduce Impacts of Fuel Price Hike......................... 29
PICTURE
Picture 1. Investment Needed for Infrastructural Development 2005-2009.. 33
Picture 2. Infrastructure Road Map 2005-2009 ...................................... 34
Picture 3. Reform of the Infrastructure Regulatory Framework…… ...... 36
Picture 4. Short-term Strategy for Infrastructure Development................ 37
Picture 5. Long-term Strategy for Infrastructure Development … ............ 38
�
�
�
�
�
�
�
�

5
I. INTRODUCTION
he first six months in office has been a historically challenging moment for Indonesian economic ministers under President Susilo Bambang Yudhoyono and Vice-President Jusuf Kalla (SBY-JK). It was during this particular period
(from October through May 2005 when this report was written) that they had to constantly work under duress and, almost always, under the watchful eyes of the public, who still harbors sky-high expectations of a quick economic recovery. Such high expectations – understandably so, with the popular election of SBY-JK last year - are normally good assets for the whole economic recovery process, because they can often create a great momentum for reform. However, they also bear risks: When not managed well, public discontents could quickly spread and public confidence subsequently weakens. And managing such sky-high expectations successfully has indeed proved to be so daunting an endeavor, though not impossible. Nobody can make instant economic recovery. President Yudhoyono himself has humbly admitted: “I am not superman.” The road to recovery is therefore an uphill battle. There are many factors beyond our control that have disrupted our endeavors. To mention but a few: the rising prices of world oil, the rising US interest rate, the tsunami in Aceh, and the earthquake in Nias. All these, compounded with skepticisms permeating our domestic politics, truly make economic recovery in Indonesia a formidable challenge. However, we have many good reasons to stay upbeat. Our efforts to set the course of our economic recovery to the right direction have been widely recognized. We keep working hard to improve our performance, and, encouragingly, we have achieved important progress. Many critics would surely beg to differ from us. But our claim has been based on a set of reliable data, as readers will see in this report. As an example, we have managed to maintain the relative stability of our macro economy. This can be seen from the strong capital market performance as shown in the record high Jakarta Stock Exchange Index (Graphic 1).
��

6
Graphic 1 Jakarta Stock Exchange Index
700
775
850
925
1000
1075
Jan-04
Mar-04
May-04
Jul-04
Sep-04
Nov-04
Jan-05
Mar-05
Source:JSX With increasingly well-coordinated macro-economic policies (fiscal and monetary), we have also managed to maintain the stability of our foreign exchange rate despite its temporary and cyclical fluctuations. Overall, there has been a heartening growth in the economy, as seen in the rising exports and investments in the first three months since the Cabinet was installed (October – December 2004). Our economy grew by 5.13% in 2004, better than expected. Signs of a recovery have subsequently led to several other positive developments as well. To mention but one: the upgrading of the country’s ratings by Fitch from B+ to BB-. Indonesia’s economic outlook has also been changed to “positive”, which can be taken to mean that our reform is gaining momentum and there is confidence more progress will be made. The prudent fiscal policy was especially commended as the right recipe for maintaining the macro-economic stability. The foreign indebtedness has also been lowered to 53% of the GDP in 2004. It is hoped that by the end of 2005 this indebtedness could further be reduced to 48% (a good ratio by the OECD standard). Inflation was also under control. Besides, the country’s political risks have also become lower, according to Fitch. Most importantly, Fitch was not alone to embrace such positive outlook. Other rating agencies like the Standard and Poor’s and the Moody’s also share such outlook. Furthermore, according to a recent report by BPS, the Central Bureau of Statistics, Indonesia’s economic growth in the first three months of 2005 has reached 6.4%, compared to 4.1% in the same period last year. More impressively, the non-oil-and-gas sector grew by an average of 7.5% over the October 2004 – April 2005 period, the highest growth since the 1997 Asian economic crisis. Meanwhile, we have also witnessed a big enthusiasm in Indonesia’s infrastructure development during a recent Infrastructure Summit. We are dedicating a section of this report to account for a number of works in progress that we have made since then to speed up development projects.

7
From the onset however, we would like to underscore the fact that despite all the positive developments that we are reporting here, our economy has yet to fully recover. This government still has a lot of issues to solve: the high unemployment figure, the high-cost economic problems, the poor quality infrastructure, and various other entrenched problems still discouraging investments, like our notorious red-tape.
8
II. INDONESIAN ECONOMY: A RECENT DATA
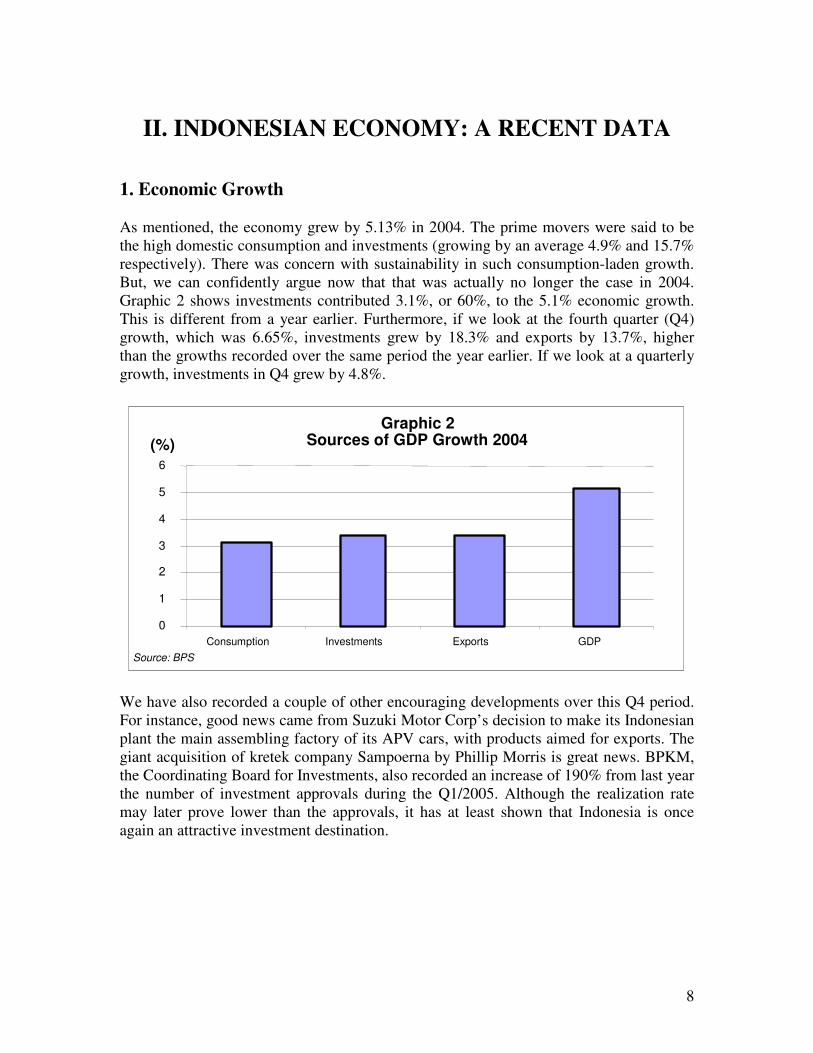
1. Economic Growth As mentioned, the economy grew by 5.13% in 2004. The prime movers were said to be the high domestic consumption and investments (growing by an average 4.9% and 15.7% respectively). There was concern with sustainability in such consumption-laden growth. But, we can confidently argue now that that was actually no longer the case in 2004. Graphic 2 shows investments contributed 3.1%, or 60%, to the 5.1% economic growth. This is different from a year earlier. Furthermore, if we look at the fourth quarter (Q4) growth, which was 6.65%, investments grew by 18.3% and exports by 13.7%, higher than the growths recorded over the same period the year earlier. If we look at a quarterly growth, investments in Q4 grew by 4.8%.
Graphic 2
Sources of GDP Growth 2004
0
1
2
3
4
5
6
Consumption Investments Exports GDP Source: BPS
(%)
We have also recorded a couple of other encouraging developments over this Q4 period. For instance, good news came from Suzuki Motor Corp’s decision to make its Indonesian plant the main assembling factory of its APV cars, with products aimed for exports. The giant acquisition of kretek company Sampoerna by Phillip Morris is great news. BPKM, the Coordinating Board for Investments, also recorded an increase of 190% from last year the number of investment approvals during the Q1/2005. Although the realization rate may later prove lower than the approvals, it has at least shown that Indonesia is once again an attractive investment destination.

9
0
2
4
6
8
10
12
14
16
Konsumsi Investasi Ekspor PDB
(%)
Source: BPS
Graphic 3Source of GDP Growth 2005
Table 1. Number of Foreign and Domestic Investment Approvals
Q1-2004
(billion rupiah)
Q1-2005 (billion rupiah)
Increase (y-o-y)
Domestic investments 7,824.7 9,083.4 16.09 1. New 4,451.5 7,200.3 61.75 2. Extension 2,697.3 1,544.6 -42.74 3. Status change 675.9 338.5 -49.92 Foreign investments 1,462.8 4,282.3 192.75 1. New 453.9 2,698.7 494.56 2. Extension 699.2 684.5 -2.10 3. Status change 309.7 899.1 190.31
Source: BPKM
10
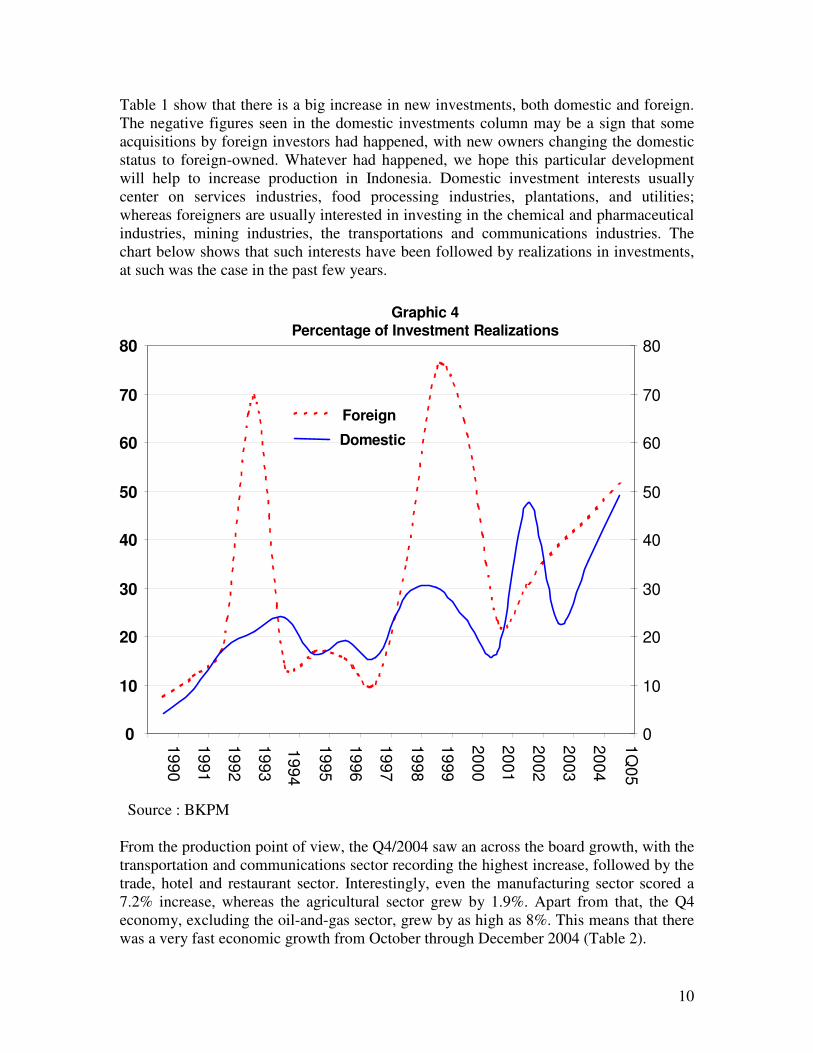
Table 1 show that there is a big increase in new investments, both domestic and foreign. The negative figures seen in the domestic investments column may be a sign that some acquisitions by foreign investors had happened, with new owners changing the domestic status to foreign-owned. Whatever had happened, we hope this particular development will help to increase production in Indonesia. Domestic investment interests usually center on services industries, food processing industries, plantations, and utilities; whereas foreigners are usually interested in investing in the chemical and pharmaceutical industries, mining industries, the transportations and communications industries. The chart below shows that such interests have been followed by realizations in investments, at such was the case in the past few years.
Source : BKPM From the production point of view, the Q4/2004 saw an across the board growth, with the transportation and communications sector recording the highest increase, followed by the trade, hotel and restaurant sector. Interestingly, even the manufacturing sector scored a 7.2% increase, whereas the agricultural sector grew by 1.9%. Apart from that, the Q4 economy, excluding the oil-and-gas sector, grew by as high as 8%. This means that there was a very fast economic growth from October through December 2004 (Table 2).
Graphic 4 Percentage of Investment Realizations
0%
10%
20%
30%
40%
50%
60%
70%
80%
1990
1991
1992
1993
1994
1995
1996
1997
1998
1999
2000
2001
2002
2003
2004
1Q05
0%
10%
20%
30%
40%
50%
60%
70%
80%
Foreign
Domestic

11
The same pattern was repeated in Q1/2005: all sectors saw positive growths, except the agricultural sector, which due to a shift in harvesting seasons, saw a below-average growth. The manufacturing sector managed to sustain its Q4/2004 growth. Consistent with the investment pace, the construction sector also grew by 8.56%, an above-average growth compared to 2004. Growth was also recorded in the trade, hotel and restaurant sector, which grew 10%, compared to 9.4% in Q4/2004. The acceleration of growth seen can be attributable to the expansion of the banking credits, chiefly channeled to SMEs, the small and medium enterprises, which operate in the trade sector. If this is a correct observation, then we can say that the increase in outputs that had happened during the first six months of the SBY-JK leadership was due to the expansion of SMEs. This can have a positive implication on income distribution. A sensible income distribution that follows sustained economic growths can often help speed up the process of poverty eradication.
Table 2. Quarterly GDP Growth by Industrial Origin (%)
Industrial origin Q3 from
Q2/2004 Q4 from Q3/2004
Q4/2004 from Q4/2003
1. Agricultural. livestock, forestry and fisheries
2. Mining and quarrying 3. Manufacturing industries 4. Electricity, gas, and water
supply 5. Construction 6. Trade, hotel, and restaurant 7. Transportation and
communications 8. Financial, ownership, and
business 9. Services
GDP GDP (excl. oil and gas)
5.56 3.86 1.98 1.26 4.71 4.30 5.10 2.50 0.72 3.36 3.43
-20.00 0.34 2.02 2.53 2.08 2.16 3.45 3.15 1.33 -1.55 -1.48
1.86 3.28 7.17 7.87 8.31 9.41 11.47 8.45 5.04 6.65 8.03
Source: BPS We have seen continued increase in electricity power consumption, an important indicator for gauging the activeness of an economy. It could be that increased power usage is due to the growing number of users, naturally so, given its relatively inexpensive price. Besides, last year’s diesel oil price hike could have forced people to abandon their own power generators and switch over to the service of PLN, the state-owned electricity company. However, this kind of argument could not help us explain fully why the power

12
consumption continues to increase. Graphic 3 shows the increase in power consumption during the first six months of the SBY-JK government: It was higher than the same period a year earlier. This shows that the economy during SBY-JK period has been more buoyant than ever before. In February 2005, the power consumption has even increased to 12.1%, closer to the pre-crises level of 14%.
Graphic 5
Electricity Consumption (y-o-y increase)
9.60
9.80 10.00
10.20 10.40 10.60 10.80
oct-feb 04 oct-feb 05
Source: PLN
%
A strong mode of consumption can be seen also in car sales, which over the first six-month period of the new government (compared to the same period a year earlier) has increased more than 40% (graphic 6). Gaikindo, the association of motor businesses owners, has projected a total sale of 520,000 car units in 2005. Up to February alone, it has recorded the sales of 100,000 units (including exports).
Graphic 6 Car Sales (y-o-y increase)
0 10 20 30 40 50
Oct-Mar 04 Oct-Mar 05
Source: CEIC (PT. ASTRA)
%
13
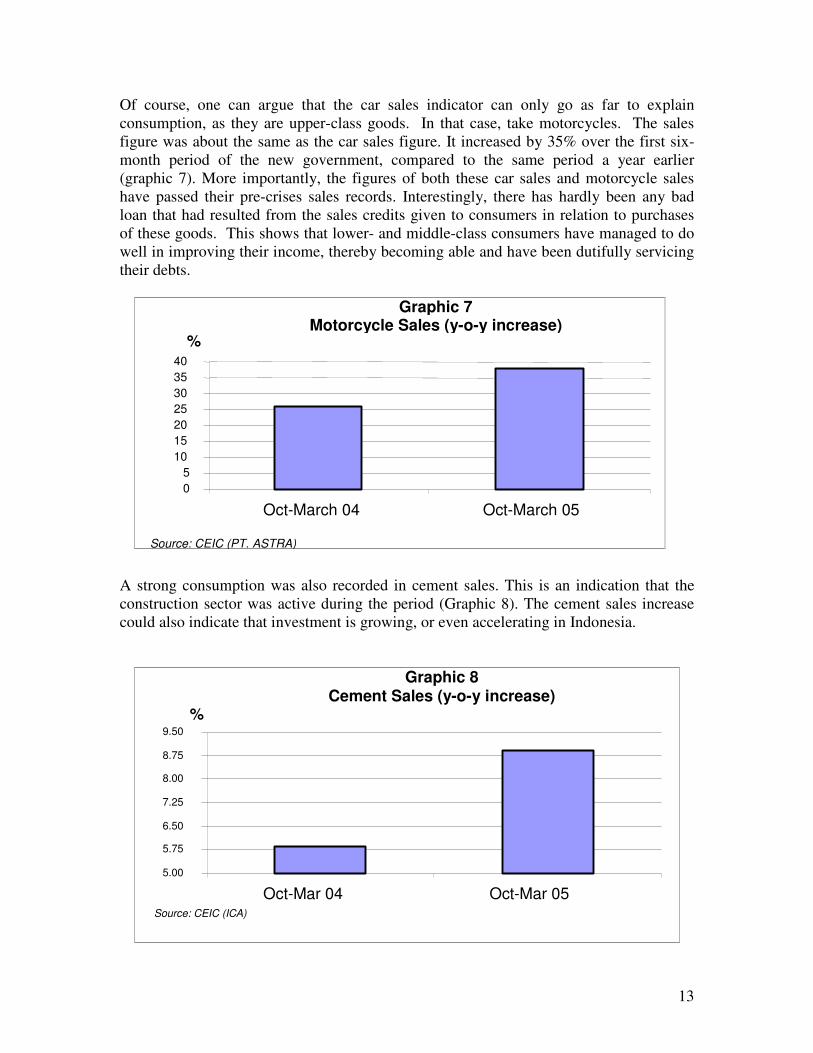
Of course, one can argue that the car sales indicator can only go as far to explain consumption, as they are upper-class goods. In that case, take motorcycles. The sales figure was about the same as the car sales figure. It increased by 35% over the first six-month period of the new government, compared to the same period a year earlier (graphic 7). More importantly, the figures of both these car sales and motorcycle sales have passed their pre-crises sales records. Interestingly, there has hardly been any bad loan that had resulted from the sales credits given to consumers in relation to purchases of these goods. This shows that lower- and middle-class consumers have managed to do well in improving their income, thereby becoming able and have been dutifully servicing their debts.
Graphic 7 Motorcycle Sales (y-o-y increase)
0 5
10 15 20 25 30 35 40
Oct-March 04 Oct-March 05
Source: CEIC (PT. ASTRA)
%
A strong consumption was also recorded in cement sales. This is an indication that the construction sector was active during the period (Graphic 8). The cement sales increase could also indicate that investment is growing, or even accelerating in Indonesia.
Graphic 8 Cement Sales (y-o-y increase)
5.00 5.75 6.50 7.25 8.00 8.75 9.50
Oct-Mar 04 Oct-Mar 05 Source: CEIC (ICA)
%
14
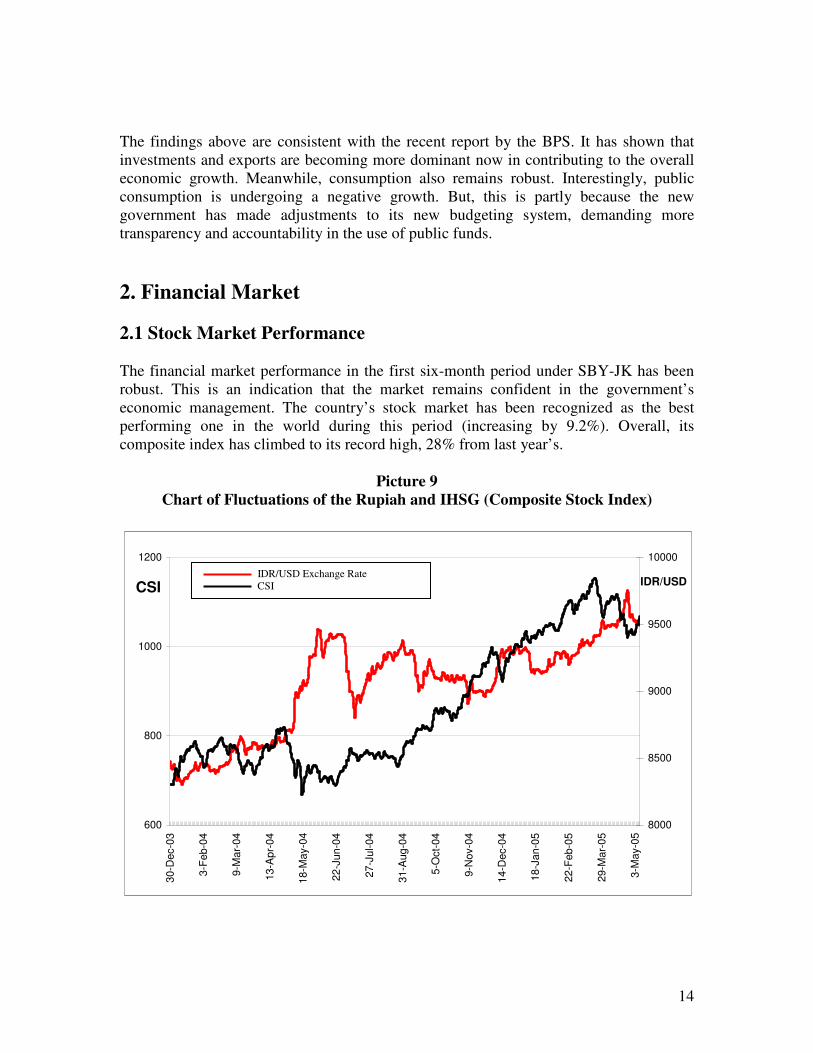
The findings above are consistent with the recent report by the BPS. It has shown that investments and exports are becoming more dominant now in contributing to the overall economic growth. Meanwhile, consumption also remains robust. Interestingly, public consumption is undergoing a negative growth. But, this is partly because the new government has made adjustments to its new budgeting system, demanding more transparency and accountability in the use of public funds. 2. Financial Market 2.1 Stock Market Performance The financial market performance in the first six-month period under SBY-JK has been robust. This is an indication that the market remains confident in the government’s economic management. The country’s stock market has been recognized as the best performing one in the world during this period (increasing by 9.2%). Overall, its composite index has climbed to its record high, 28% from last year’s.
Picture 9 Chart of Fluctuations of the Rupiah and IHSG (Composite Stock Index)
600
800
1000
1200
30-D
ec-0
3
3-Fe
b-04
9-M
ar-0
4
13-A
pr-0
4
18-M
ay-0
4
22-J
un-0
4
27-J
ul-0
4
31-A
ug-0
4
5-O
ct-0
4
9-N
ov-0
4
14-D
ec-0
4
18-J
an-0
5
22-F
eb-0
5
29-M
ar-0
5
3-M
ay-0
5
8000
8500
9000
9500
10000
Nilai Tukar IDR/USD IHSGCSI
IDR/USD
IDR/USD Exchange Rate CSI
15
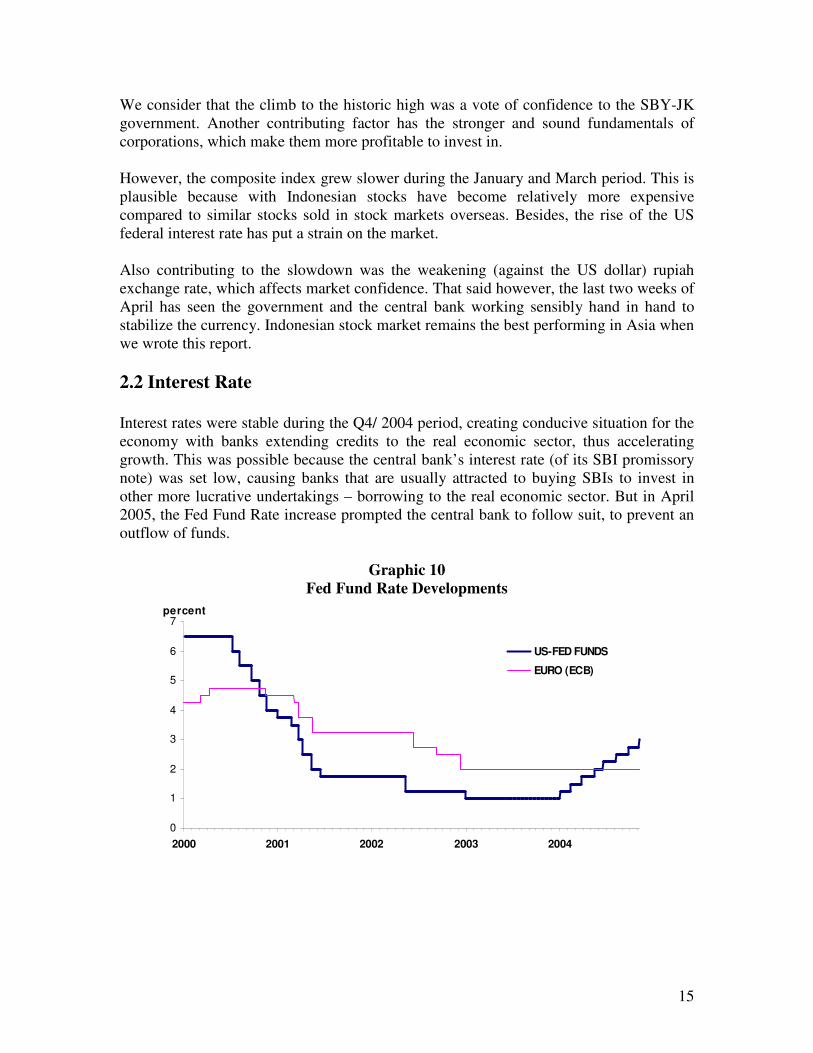
We consider that the climb to the historic high was a vote of confidence to the SBY-JK government. Another contributing factor has the stronger and sound fundamentals of corporations, which make them more profitable to invest in. However, the composite index grew slower during the January and March period. This is plausible because with Indonesian stocks have become relatively more expensive compared to similar stocks sold in stock markets overseas. Besides, the rise of the US federal interest rate has put a strain on the market. Also contributing to the slowdown was the weakening (against the US dollar) rupiah exchange rate, which affects market confidence. That said however, the last two weeks of April has seen the government and the central bank working sensibly hand in hand to stabilize the currency. Indonesian stock market remains the best performing in Asia when we wrote this report. 2.2 Interest Rate Interest rates were stable during the Q4/ 2004 period, creating conducive situation for the economy with banks extending credits to the real economic sector, thus accelerating growth. This was possible because the central bank’s interest rate (of its SBI promissory note) was set low, causing banks that are usually attracted to buying SBIs to invest in other more lucrative undertakings – borrowing to the real economic sector. But in April 2005, the Fed Fund Rate increase prompted the central bank to follow suit, to prevent an outflow of funds.
Graphic 10 Fed Fund Rate Developments
0
1
2
3
4
5
6
7
2000 2001 2002 2003 2004
US-FED FUNDS
EURO (ECB)
percent

16
Although banks do not normally follow the BI’s lead in raising interest rates (for private savings and loans), they would eventually forced to do that if the BI’s interest rate continues to rise. But this is of course not an automatic process. More importantly, banks may not necessarily raise the interests for their credits as they could vie for efficiency measures to cut costs. Banks could still profit despite the rising SBI rate, because they can expand by extending more loans, prudently at that, to the real sector. Admittedly, the cost of fund in the country is rising. This applies for the fund with various yields and maturity dates (graphic 11). This poses a huge management challenge for the monetary authority. Both the public and the private sectors are also challenged to be able to seek alternative sources of funding. We still have an opportunity to fix this yield curve or lower the cost of fund; despite the tendency for further interest rate hike in the US. What the government can do now under the current circumstance is undertaking a number of measures to reduce business and investment risks. It is hoped that these measures will help to improve the country’s credit ratings and lower the cost of fund.
Graphic 11 Developments of Yield Curves in Indonesia
6
7
8
9
10
11
12
0 1 2 3 4 5 6 7 8 9 10 11 12Maturity (Tahun)
29-Apr-05
-1 bulan
-3 bulan
-6 bulan
-1tahun
Yield (%)
2.3 Rupiah Exchange Rate Our currency exchange rate against the US dollar has hovered around 9,200 and 9,500 throughout September 2004 and March 2005. There has been a tendency that it is weakening, partly due to huge demands for dollars from corporations – both private and state – that were buying dollars for servicing their debts. The sky-high international oil price has also played a role in driving down the currency value, because Indonesia has now become a net oil importer. With the higher oil price, Pertamina (state-owned oil company) needs more dollars to buy oil from the international market. Another factor that is also weakening the national currency has been the rising interest rate in most parts of the world, while domestic banks have yet to follow suit.
April 29th 2005 1 Month 3 Month 6 Month 1 Year
17
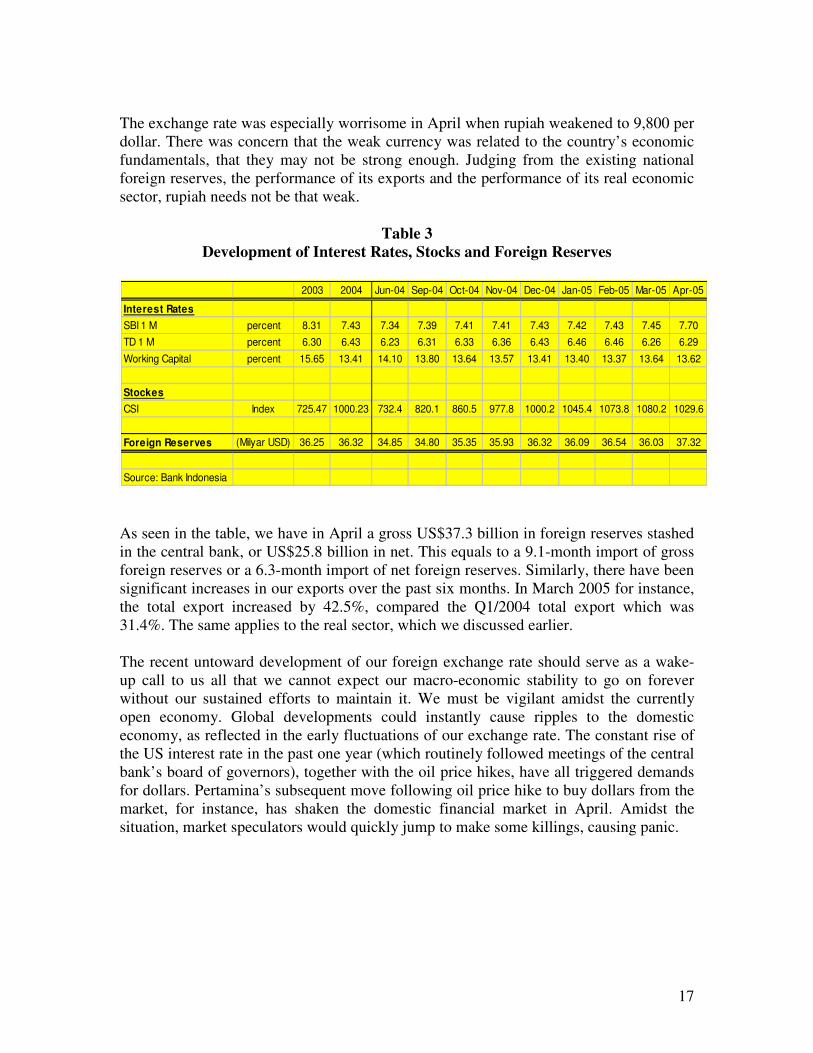
The exchange rate was especially worrisome in April when rupiah weakened to 9,800 per dollar. There was concern that the weak currency was related to the country’s economic fundamentals, that they may not be strong enough. Judging from the existing national foreign reserves, the performance of its exports and the performance of its real economic sector, rupiah needs not be that weak.
Table 3 Development of Interest Rates, Stocks and Foreign Reserves
As seen in the table, we have in April a gross US$37.3 billion in foreign reserves stashed in the central bank, or US$25.8 billion in net. This equals to a 9.1-month import of gross foreign reserves or a 6.3-month import of net foreign reserves. Similarly, there have been significant increases in our exports over the past six months. In March 2005 for instance, the total export increased by 42.5%, compared the Q1/2004 total export which was 31.4%. The same applies to the real sector, which we discussed earlier. The recent untoward development of our foreign exchange rate should serve as a wake-up call to us all that we cannot expect our macro-economic stability to go on forever without our sustained efforts to maintain it. We must be vigilant amidst the currently open economy. Global developments could instantly cause ripples to the domestic economy, as reflected in the early fluctuations of our exchange rate. The constant rise of the US interest rate in the past one year (which routinely followed meetings of the central bank’s board of governors), together with the oil price hikes, have all triggered demands for dollars. Pertamina’s subsequent move following oil price hike to buy dollars from the market, for instance, has shaken the domestic financial market in April. Amidst the situation, market speculators would quickly jump to make some killings, causing panic.
2003 2004 Jun-04 Sep-04 Oct-04 Nov-04 Dec-04 Jan-05 Feb-05 Mar-05 Apr-05
Interest RatesSBI 1 M percent 8.31 7.43 7.34 7.39 7.41 7.41 7.43 7.42 7.43 7.45 7.70TD 1 M percent 6.30 6.43 6.23 6.31 6.33 6.36 6.43 6.46 6.46 6.26 6.29
Working Capital percent 15.65 13.41 14.10 13.80 13.64 13.57 13.41 13.40 13.37 13.64 13.62
StockesCSI Index 725.47 1000.23 732.4 820.1 860.5 977.8 1000.2 1045.4 1073.8 1080.2 1029.6
Foreign Reserves (Milyar USD) 36.25 36.32 34.85 34.80 35.35 35.93 36.32 36.09 36.54 36.03 37.32
Source: Bank Indonesia

18
To control the situation, the government worked closely with the central bank and took effective measures to stop rupiah from sliding further. President Yudhoyono assigned Vice-President Kalla and a number of related ministers to rein in the situation. Communication with the monetary authority was made effective. The President himself went down to visit traders at the Jakarta Stock Exchange. He effectively sent signals to the market that the government was been closely monitoring the situation and has rightly moved in to rectify what it considered to have crossed the line of tolerance. The policy measures taken at the time after are:
1. To limit the amount of dollars that can be bought directly from the market. a. The central bank provides Pertamina with a facility to obtain dollars
through three government banks: Bank Mandiri, BNI and BRI. This allows better control of Pertamina’s demands of dollars in the market.
b. The central bank provides a new swap facility that will help state-owned-enterprises – even the market in general - to obtain dollars. It is hoped that the new instrument will ease up the pressure on rupiah when dollars still remain up for grab in spot markets.
2. To limit the amount of liquidity excess that indirectly could trigger demands for
dollars. a. By conducting open market operations that will allow the central bank to
absorb liquidity when needed. b. By increasing the frequency of SBI auction from once every fortnight to
once a week so the number of mature SBI notes could be put to the minimum.
c. The central bank opening possibilities for raising the minimum limit of checking accounts.
3. To minimize the possibility of foreign exchange abuse (used for speculation) by
lowering the net foreign exchange position from the maximum 30% to 20%. These measures have already had positive impacts. The rupiah exchange rate has returned to the 9,400/US dollar level. The stock index has also gradually recovered. This experience has strengthened the government’s resolve to always be vigilant with similar future shocks. We will work with more disciplines and consistency in order to maintain the macro-economic stability that has been achieved. We will also keep our close coordination with the monetary authority while remaining respectful of its independence. More importantly, we will continue to strive for stronger economic fundamentals, such as improving our business climate, increasing investments and exports. We believe that the right balance between the supply and demand for foreign exchange and a sound and sustainable economic growth could only be achieved by staying true to these measures.

19
2.4 Banking The banking performance throughout 2004 ran parallel with the development of the economy. The loan-to-deposit ratio increased faster than a year earlier. In the end of 2004, Rp 595 trillion (up by Rp 118 trillion from the year earlier) of loans has been extended as loans. Within the October – December 2004 period, the loans extended by banks was even recorded at Rp 40 trillion. The amount of loans extended was of course higher than the said figure because, on top of new loans, a large chunk of loans which matured might have been either re-channeled or extended in the same year. This amount of banking credits will certainly bring yields throughout 2004 (see table 4). Due to increased profits generated from their loans, interest rates margins, or other services, all banks reported improved performance. Encouragingly, national banks have been competing with one another in improving their services and efficiencies, including in finding to reduce the cost of fund.
Table 4
National Banking Performance
Meanwhile, the number of bad loans was also down in 2004, from the 8.2% (of the gross position) in late 2003 to 5.8% in 2004, or from the 3.0% (of the net position) in late 2003 to 1.7% in late 2004. From a number of financial reports already released by some banks, we can see that the performance of national banks remains well within Q1/2005, as analysts have forecasted. The good performance of national banks has also been reflected in their stocks. Despite the heartening performance however, national banks still have to me many challenges. It is only by rising up through these challenges can our national banking become stronger. The first challenge is rising interest rates, which could impact profitability and the financial market if not well managed. The second challenge regards the fiercer competition climate which demands that banks improve their services and
Rp TrilliunDec-03 Mar-04 Jun-04 Sep-04 Dec-04
Total Assets 1068.4 1,150.0 1,185.7 1,213.1 1,272.0Third Party Fund 888.6 875.1 912.8 926.4 963.0Credit 477.2 485.9 528.7 555.1 595.0
SBI 101.4 133.2 110.6 63.1 94.1NPPL Gross (%) 8.2 7.8 7.5 6.9 5.8Net (%) 3.0 2.7 2.1 2.1 1.7Net Interest Margin 3.2 5.66 5.41 5.30 6.3Capital 110.9 120.9 119.8 114.0 118.6
Source: Bank Indonesia
20
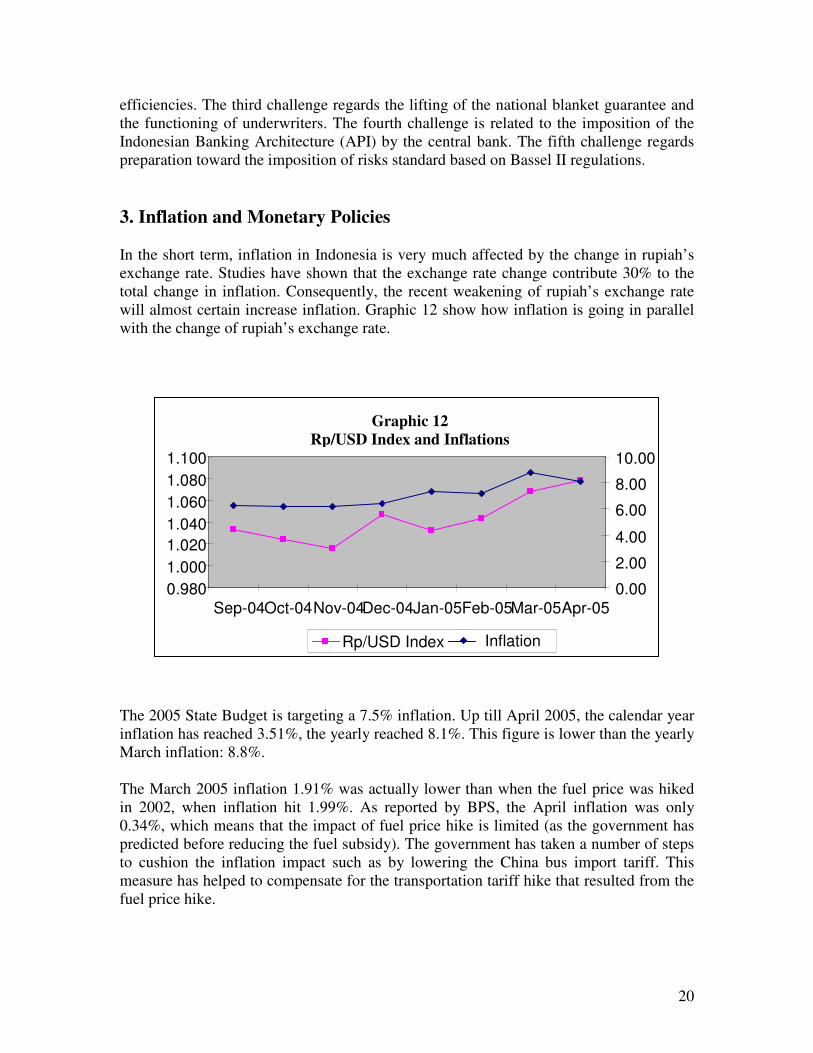
efficiencies. The third challenge regards the lifting of the national blanket guarantee and the functioning of underwriters. The fourth challenge is related to the imposition of the Indonesian Banking Architecture (API) by the central bank. The fifth challenge regards preparation toward the imposition of risks standard based on Bassel II regulations. 3. Inflation and Monetary Policies In the short term, inflation in Indonesia is very much affected by the change in rupiah’s exchange rate. Studies have shown that the exchange rate change contribute 30% to the total change in inflation. Consequently, the recent weakening of rupiah’s exchange rate will almost certain increase inflation. Graphic 12 show how inflation is going in parallel with the change of rupiah’s exchange rate.
The 2005 State Budget is targeting a 7.5% inflation. Up till April 2005, the calendar year inflation has reached 3.51%, the yearly reached 8.1%. This figure is lower than the yearly March inflation: 8.8%. The March 2005 inflation 1.91% was actually lower than when the fuel price was hiked in 2002, when inflation hit 1.99%. As reported by BPS, the April inflation was only 0.34%, which means that the impact of fuel price hike is limited (as the government has predicted before reducing the fuel subsidy). The government has taken a number of steps to cushion the inflation impact such as by lowering the China bus import tariff. This measure has helped to compensate for the transportation tariff hike that resulted from the fuel price hike.
0.980 1.000 1.020 1.040 1.060 1.080 1.100
Sep-04 Oct-04 Nov-04 Dec-04 Jan-05 Feb-05 Mar-05 Apr-05 0.00
2.00
4.00
6.00
8.00
10.00
Rp/USD Index Inflation
Graphic 12 Rp/USD Index and Inflations

21
Another measure was aimed at lowering the prices of rice, which was by conducting market operations and by temporarily freeing imports of rice. But administered prices have worked les effective in lowering inflation, unfortunately. A more important measure is for the central bank to control the amount of circulating money. With a controlled inflation rate, there is no need for the central bank to raise its SBI rate to maintain a favorable interest rate. Graphic 13 show the movement of loan interest rates and the SBI rates. We can see that the problem is with the still high loan interest rates. One of the main issues is the improvement of the monetary policy’s transmission mechanism in order push for more real sector development. High risks have been the main hindrance for banks to extend their credits to the real sector. Risks are triggered asymmetrical information – as demonstrated by Stiglitz –Weiss – the loan interest rates will always be higher that the rates “should have been” under normal situation. The reason being: banks must factor in risks in setting their interest rates. To address this asymmetrical information issue, the central bank has actually set up the Credit Bureau, which is assigned to provide a comprehensive picture of the corporate loans condition, as well as the condition of retail, consumer loans and micro loans. But since it a newly created bureau, it has yet to have any mapping of the whole situation.
Graphic 13 Domestic Interest Rates
4 6 8
10 12 14 16 18
Jan-04 Mar-04 May-04 Jul-04 Sep-04 Nov-04 Jan-05 Mar-05
Source: Bank Indonesia
% p.a
30-day SBI
Deposit
90-day SBI
Loans
22
4. International Economy
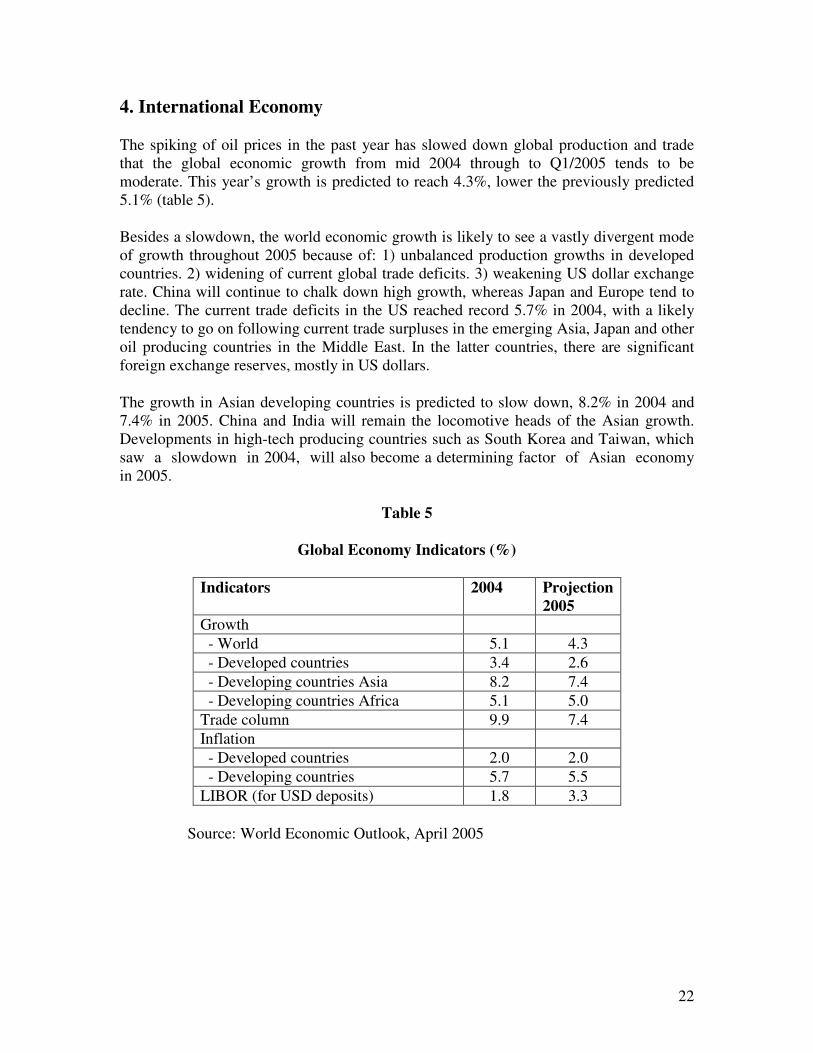
The spiking of oil prices in the past year has slowed down global production and trade that the global economic growth from mid 2004 through to Q1/2005 tends to be moderate. This year’s growth is predicted to reach 4.3%, lower the previously predicted 5.1% (table 5).
Besides a slowdown, the world economic growth is likely to see a vastly divergent mode of growth throughout 2005 because of: 1) unbalanced production growths in developed countries. 2) widening of current global trade deficits. 3) weakening US dollar exchange rate. China will continue to chalk down high growth, whereas Japan and Europe tend to decline. The current trade deficits in the US reached record 5.7% in 2004, with a likely tendency to go on following current trade surpluses in the emerging Asia, Japan and other oil producing countries in the Middle East. In the latter countries, there are significant foreign exchange reserves, mostly in US dollars.
The growth in Asian developing countries is predicted to slow down, 8.2% in 2004 and 7.4% in 2005. China and India will remain the locomotive heads of the Asian growth. Developments in high-tech producing countries such as South Korea and Taiwan, which saw a slowdown in 2004, will also become a determining factor of Asian economy in 2005.
Table 5
Global Economy Indicators (%)
Indicators 2004 Projection 2005
Growth - World 5.1 4.3 - Developed countries 3.4 2.6 - Developing countries Asia 8.2 7.4 - Developing countries Africa 5.1 5.0 Trade column 9.9 7.4 Inflation - Developed countries 2.0 2.0 - Developing countries 5.7 5.5 LIBOR (for USD deposits) 1.8 3.3
Source: World Economic Outlook, April 2005

23
The international oil price reached US$54.30 in early April 2005, 73% higher than in 2004. A number of factors caused this spike: the unexpectedly high demand for oil, temporary oil supply disruptions, the uncertain geopolitical situation, and the limited producing capacities of OPEC countries. The global demand for oil grew by 3.4% in 2004, or by 2.74 million barrels per day (mbd). The highest came from China and North America (table 6).
Meanwhile, oil supplies in non-OPEC producing countries have declined. According to the International Energy Agency (IEA) analyses, oil supplies in non-OPEC countries will decline by 1.1 mbd in 2003 and 2004 and by 0.9 mbd in 2005, so its production will become 50.5 mbd. At the same time, 10 OPEC countries have increased their official production in March 2005 to 27.5 mbd and there is possibility that it will be increased again to 28 mbd in June 2005.
Based on developments in international oil future markets up till April 2005, the price of oil will remain on average US$52.23 per barrel in 2005 and US$52.59 per barrel in 2006. In a medium term (2007-2010), the international oil price is predicted to undergo a structural shift, resulting in permanently high oil price due to limited supplies and increased demands.
Table 6
Global Oil Demands
(mbd)
Wilayah 2004 % increase from 2003
North America 25.18 2.5 Europe 16.47 1.6 OECD countries in Pacific 8.62 -1.8 China 6.38 15.6 Other Asian countries 8.55 5.6 Commonwealth countries 3.71 3.8 Middle East 5.88 5.7 Africa 2.81 2.4 Latin America 4.91 3.8 World 8.51 3.4
Source : World Economic Outlook, April 2005

24
With such global development, the IMF has predicted a number of high risk factors: a high international oil price, global economic slowdown, rising interest rates in developed countries. All these could send widespread shocks in 2005 and a few years to come. The IMF has recommended that Asia developing countries maintain a flexible exchange rate as appreciation against dollars may bring down their foreign debt ratio, although it might disrupt also their current trade balance.
A lower foreign debt ratio is useful in helping economic fundamentals to become stronger. Besides, it has also been recommended that developing countries implement credible growth policies in order to brace for the global imbalances. A global economic growth is a prerequisite for improving the welfare of the world population, especially those living in poor and developing countries, as suggested in the Millennium Development Goals.
Meanwhile, the World Bank in its April 2005 East Asia Up-date recommended that East Asia developing countries keep up with their capital and financial markets reform. It says such measures are important to maintain the level of incoming foreign capital, despite the possibility of a decline brought forth by the global imbalances. Efficiency in these two markets and a well directed (i.e. to productive sectors) of funds generated from there will determine domestic economic growth. On top that, it has also been suggested that governments improve investment climate and encourage developments of infrastructure to increase foreign direct investments.
5. Exports and Imports There are some urgent notes related to exports and imports. Firstly, exports’ contribution to the economic growth in 2004 was in the negative (-3.6%). This was driven by the fact that there has been a sharp increase in imports. But a more detailed look into the matter should appease our concerns because 92% of the imports were production materials and capital goods. Production materials imports grew by 40.3%. Increases of such imports show increases in investments. This has been the case in 2004. Quantitative analyses show that with a 1% increase in the importation of capital goods, there has been a quarterly growth 0.2-0.4% increase in investments. This means that if the importation of capital goods increased by 40%, the potential of investment increase would be between 8-16%. This is consistent with the 15.7% increases recorded in investments. Besides that, analyses also suggest that 1% increase in capital goods imports is likely to be followed by a 0.27% increase in exports in the following quarter. In other words, a 40% increase in capital goods imports is likely to be followed by an 11% increase in exports. Again, this finding is consistent with the 2004 data of exports, 11.5%. That said, we now already have the empirical data to claim that investments and exports have become the new sources of our economic growth. This should answer concerns that our growth has been too consumption-driven.

25
In Q1/2005, capital goods imports grew by 39.5%, while production materials increased by 27.3% (Graphic 14). Indeed there have been concerns that the imports increase has not been followed by increase in exports, which resulted in a declining trade balance. It is believed that this is alarming as, given the fact investment has yet to fully recover, it may affect the rupiah’s exchange rate. However, such concerns are unfounded as 92% of the imports are in the form of capital goods and production materials, which in turn will increase exports. To bear in mind, our non-oil-and-gas exports increased by 34% in Q1/2005 (Graphic 15)1. Therefore, such high imports should not be of particular concern.
1 There is possibility that the increase may be related to the change of calculation method by BPS. Apart from that however, there is factually a sharp increase in exports.
Graphic 14
Imports by Types of Goods (y-o-y growth)
0 10 20 30 40 50
Jan-Mar 04 Jan-Mar 05
Source:BPS
%
Consumption goods Raw materials Capital goods
Graphic 8 Non-gas-and-oil Exports (annual)
0 5
10 15 20 25 30 35 40
Jan-March 04 Jan-March 05
Source:BPS
%

26
6. Fiscal Policies Although our recovery is already on the right track, maintaining macro-economic stability – especially ensuring an efficient budget allocation - remains highly important. This is so despite the government’s success is securing through CGI a US$5.1 billion worth of assistance ($3.4 billion regular and $1.7 billion earmarked for Aceh) This year’s budget deficit is aimed for 0.8% of GDP, compared with 1.5% in 2004. Until Q1/2005, the budget has been on the surplus. There are a number of explanations: i) there is an outstanding subsidy that has yet to be paid to Pertamina2; (ii) the budget spending patter that is usually in Q3 and Q4; (iii) related to (ii), the belated completion of project spending forms (DIPA) especially of ministries affected by the new Law 7/2003 on Public Finance and Law 1/2004 on Public Treasury; (iv) the postponement of debt payment (moratorium) which had been agreed by Paris Club donors. It is hoped that our April subsidy reduction will not only improve our State Budget health, but also cushion the revenue redistribution impacts as well (see Box 1 to see the relation between oil prices and the budget’s deficit position).
2 Reconciled data shows tha the government’s outstanding obligation in 2005 is relatively small, thus the contribution of the postponement to the surplus is relatively small.

27
Box 1: Oil Prices and State Budget There are many concerns raised related to the possible impact of high international oil prices on our State Budget. Although we have become a net importer of oil, we are still a net exporter of gas (although smaller now). Consequently, the rise of oil price actually remains positive for our economy as a whole. The April 2005 adjustment of fuel prices actually has strengthened the government’s fiscal position. An oil price simulation shows that as a result of the price hike, the State Budget’s position (deficit) will improve until the oil price reaches US$50. But, when it reaches US$60, the deficit will rise although still within controllable limit. This simulation shows that the concerns over the impact of a high international oil price on the State Budget’s liquidity are unfounded.
In relation to this fiscal policy, one of the big issues is how to protect the poor. The problem is not with the budget deficit, but how the government can make enough fiscal space for its efforts to eradicate poverty, improve infrastructure, health and education. Based on this, the government realized that rather than allocating the already tight available resources for subsidizing fuel, it is more justified to allocate the resources to poverty eradication and other development projects mentioned. The previous subsidy was actually unfairly enjoyed by the top 10% of the society’s upper class, who received Rp 393,000 per year, while the lowest 10% of the poor enjoyed only Rp 72,500 per year. However, it is of course too naïve to say that the subsidy cut has no impact whatsoever on the poor. The measure has driven up prices, weakening the poor’s purchasing power and thereby adding the number of poor people to the country’s statistics. But the question that should be raised here is to what extent the fuel price hike affected inflation, the poor’s purchasing power, and the number of poor people in statistics.
Graphic 16 Relationship between Oil Price and State Budget 2005 Deficit
17 17,5
18 18,5
19 19,5
20 20,5
21
35 40 45 50 60 Oil Price (US$/Barrel)
Rp Trillion
0,65
0,7
0,75
0,8
0,85 % of GDP
Rp trillion % of GDP

28
The fuel hike’s inflationary impact has been limited. The 2002 and 2003 data showed us that between January and March 2002 inflation rates were respectively 1.99%, 1.55%, and 0.02%. Between January and March 2003, they were respectively 0.8%, 0.2%, and -0.23%. This tells us that inflation had occurred when the fuel price was raised, and then it declined, even to deflation two months afterwards. This means the inflationary impact of price hike has been relatively small. This patter is repeated in 2005. When the government cut the subsidy in March, inflation was 1.91%, but down to 0.34% in April. This confirms the belief that fuel price hikes cause only minor inflationary impact. Taken a step further, there is reason to believe that its impact of the poor is also limited. We can confirm this by looking at the real wage indicator in April 205.

29
Box 2
Steps Taken To Reduce Impacts of Fuel Price Hike
The 1.91% inflation in March 2005 has been used by critics to accuse the government of incompetency to address impacts of its fuel subsidy cut. Such criticism however, is unfounded, as the government has prepared a separate compensation scheme aiming to cushion the fuel price hike impacts. The government has taken a series of anticipatory steps and has planned a number of corrective measures aiming to control the impacts of fuel price hike. The government has also devised a long-term plan to drive down the level of fuel consumption and to move toward using alternative energy sources in the future. Among the anticipatory measures taken to secure the policy were: intensive monitoring of the distribution and supplies of goods, increasing the supplies of primary consumption goods, and intensifying coordination with business players. Meanwhile, corrective measures took the form of market operations, in which cheap consumption goods like rice, sugar and cooking oils were provided. A number of other measures to control the fuel price hike have also been taken, with a focus on controlling the price of patrol oil. It was monitored by involving provincial governments down to subdistrict governments. Overpricing was detected. The police have been commissioned to deal with such violations. The government has also told Pertamina to control the consumption of patrol oil, such as to bring to order its filling stations by categorizing into regions and destinations. Those assigned for gas stations, industries or smaller agents were clearly marked. Pertamina was also told to coordinate with regional governments to develop “model” filling stations. The Department of Trade was also told to prohibit the importation of motor boats that use patrol oil as fuel. Pertamina has also been told to control the use of diesel oil for industries. It was told to provide a monthly evaluation of the fuel allocation and based on it adjust their share of fuel based on real consumption. Pertamina has been encouraged to double-check the industries’ consumption of fuel and to take measures against those suspected of stockpiling. Pertamina is in charge with controlling the use of fuel for boats. It is coordinating with the Communications Ministry/Seaports Administration, Customs and Excise Office, TNI (military) and Polri (police) and other related agencies. Such measures have been conducted seriously. In March 2005, the police investigated 10 criminal cases and compounded 282 tons of fuel as crime evidence.

30
Graphic 17 Real Wages of Farmers (1996-Feb 2005)
Source: BPS There has been constant increase in the real wages of non-landing-owning farmers. This indicator is important for determining the percentage of the poorest of farmers. Graphic 17 show that their wages until February 2005 have been increasing, despite the high inflation in January 2005. The fuel price hike has caused concerns that it may lower the real wages of unskilled workers (many of whom are working in the informal sector). But the BPS data shows the contrary. Compared to April 2004, construction workers are earning 5.9% more in April 2005. This is a 0.37% increase from the March 2005 figure. This empirical evidence should serve to rebut critics who accuse the government’s economic policies as anti-poor. If we should make a more general comparison, we can see that the wages of urban informal workers in the construction sector have passed the pre-crisis level. Even so however, the wages of household workers and hair-dressers are still far below the pre-crisis level (Graphic 18).
Java Outer Java Indonesia

31
Grafik 10
Wages of Urban Informal Workers (Jan 1996=100)
Source: BPS
Construction worker Haridresser tariff Housemaid

32
III. STRATEGIC ISSUES
1. National Infrastructure Development Challenges The recent successful Infrastructure Summit (held on 17-18 January 2005) has been an important milestone for the development of Indonesian economy. Chaired directly by SBY-JK, aided by10 ministers, the summit shows the government’s strong commitment to encourage the real economic sector development in the country. The international summit concluded with the “Declaration of Action on Developing Infrastructure and Public-Private Partnership”, signed by representatives (public and private) of 22 participating countries and donor agencies. In his keynote speech, SBY set out three discussion topics: opportunity, partnership, progress. These three words sum up the essence of the government’s infrastructure development agenda. There are three targets set by the National Unity Cabinet: 1. To reduce the rate of unemployment from 9.5% in 2003 to 5.1% in 2009. 2. To reduce the rate of poverty from 16.6% in 2004 to 8.2% in 2009. 3. To accelerate economic growth from 5% in 2004 to 7.9% in 2009. This means
Indonesia should reach an annual growth of 6.6% until 2009. According to our calculations, such growth rate could only be achieved if we could increase our investment-to-GDP ratio from 20.5% to 28.4% over the next five years. The immediate problem that the government is facing is the poor infrastructure in the country. Various studies have shown that poor infrastructures hamper investments in many countries. Taking that as a cue, we have immediately moved to encourage development in infrastructures. Infrastructure development projects not only could instantly create employments, but also provide the foundations for an acceleration of economic growth in other sectors as well. Besides, communications will become much easier. Now is the right momentum for major development projects. Such projects have ceased to exist in Indonesia since the 1997 crisis hit. Understandably, we can now see damaged roads everywhere, aging seaports, decreasing power generation capacity, and so on.

33
The figures below show why the government focuses on accelerating such development: • 45% Indonesian households have yet to electricity, compared to other ASEAN
countries, including Vietnam, which is around 10-15%. • Toll roads in Indonesia is about 562 km long, compared to Malaysia which is about
1,127 km long and China 4,735 km (Indonesia constructed its Jagorawi toll road in 1978, while Malaysia and China only began a few years later).
• Indonesia has the lowest telephone density in ASEAN, 27 landlines for every 1,000 people and eight cell phones for 1,000 people.
In the next five years, Indonesia will need 22,261 megawatts more of electricity to be able to deal with power shortage. It must develop its irrigation system in order to support a sustainable food provision. It must be able to protect its water resources, improve access for clean water, rehabilitate more than 331,000 kilometers of national/regional roads, building up to 1,700 kilometers of tollroads, modernize its railway system, and to install 9 million more new landlines to be able to close the existing and widening telecommunication and digital gap. These are all blatant reasons why Indonesia should move fast. In the next five years, in order to reach the annual 6.6% growth, we need a total investment of US$150 billion (Rp 1,300 trillion) in infrastructural developments.
Picture 1: Investments Needed for Infrastructural Development 2005-2009
US$25bn (Rp.225Tn)
Sumber dana domestik ( peningkatan sisi permintaan ) : • Perbankan ( asumsi maturitas 5 tahun ) • Asuransi • Dana Pensiun • Reksadana
dari :
• Swasta (funding investor , operator, s trategic & equity investor)
• Perbankan • Pinjaman Jangka Panjang
Domestik • Infrastructure Fund • Reformasi Dana Pensiun
dan Asuransi
Kebutuhan Investasi
Private Sector
US$80bn (Rp.720Tn)
US$ 145bn
(Rp.1303Tn)
0
200
400
600
800
1000
1200
1400 Rp Tn
US$30bn (Rp.270Tn)
Donor US$10bn (Rp.90Tn)
APBN (17%)
Batch I US$22.5bn (Rp.202.5Tn)
Next Batch US$57.5bn
( Rp . 517.5Tn)
Dana
Funding Gap (62%)
US$ 2.8 bn US$ 2.8 bn Kebutueconstruction costs Rekonstruksi Infrastruktur Aceh ( paska Tsunami)
(21%)
US$90bn (Rp.810Tn)
Ditawarkan dalam Infrastructure Summit 2005
Nilai Tukar
US$25bn (Rp.225Tn)
Domestic Funds: • Banking • Insurance • Pension Fund (21%) • Mutual Fund
Needed Investment
Private Sector US$80bn
(Rp.720Tn)
US$ 145bn
(Rp.1303Tn)
0
200
400
600
800
1000
1200
1400 Rp Tn
US$30bn (Rp.270Tn)
Donor US$10bn (Rp.90Tn)
State Budget (17%)
Batch I US$22.5bn
(Rp.202.5Tn)
Next Batch US$57.5bn
( Rp . 517.5Tn)
Funding Gap (62%)
US$ 2.8 bn US$ 2.8 bn Post Tsunami Aceh Reconstruction Costs
US$90bn (Rp.810Tn)
Resource Fund Exchange Rate US$1 = Rp. 9.000,-
Expected From: International:
• Multirateral Agencies • Private sector
(funding investor, operator, strategic & equity investor)
• Banking • Long-term loan
Domestic:
• Infrastructure fund • Pension and insurance
fund reform
Offered in Infrastructure Summit 2005

34
We realize that it takes a series of well-coordinated action plans to be able to raise such huge fund needed for the developments. A portion of the fund (US$60 billion) can potentially be generated domestically: through government budget allocation, banking, capital market, and several other funding instrument such as pension fund and life insurances. About US$70 billion could be obtained from donors. But the financing gap remains so high. We still ought to find US$90 billion more. It is here that we expect the private sector to play their roles. We will offer commercially viable infrastructures to the private sector, while the government focusing on non-commercially viable ones. Examples of the latter are village roads, village electricity, irrigation channels, clean water facilities in villages, and various other basic infrastructures. We have launched during the summit what we call Infrastructure Road Map 2004-2009. There are four components: regulatory framework reform, investments, communications, and capacity building. This Road Map will be followed up with a blue print for every sector. All these blue prints shall converge as the Long-Term Development Plan of the Bappenas, the national development planning agency. In each of this blue print, we can see the policy framework for the sector development, its financing framework, and its sectoral strategy (where we see the roles played by the government, the public, and the private sector).
Operasionalisasi FII
Project Development Facilities - PDF
Infrastructure Fund
Reformasi Kerangka Pengaturan Sektoral
Reformasi Kerangka Pengaturan Sektor Keuangan
Reformasi Kerangka Pengaturan Sektor Konstruksi
Reformasi Kerangka Pengaturan Terkait lainnya
Reformasi Kerangka Pengaturan Lintas Sektor Infrastruktur
Strategi Kerjasama Pemerintah Swasta
> 1 tahun
ReformasiKerangka
PengaturanDan Kebijakan
InvestasiInfrastruktur
0 – 1 tahun
Komunikasi
Proyek Percontohan - Demo
PembentukkanForum InfrastrukturIndonesia (FII)
PDF: sebagai fasilitas dalam mendukung persiapan penyusunan memorandum informasi proyek-proyek yang akan dikerjasamakan dengan pihak swasta
Kelembagaan Pengembangan Kapasitas Kelembagaan
1
2
3
4
Picture. 2. Infrastructure Road Map 2005-2009
Reform of Regulatory and
Policy Framework
Infrastructure Investment
Communication
Communication Institutional capacity building
35
On the investment front, the government will facilitate the creation of Infrastructure Fund, which will function as an equity source and catalyst for the financing of prioritized projects. The government will also develop a risk management policy to boost confidence of financing institutions interested in the projects. In the matter of communication, we have set up Indonesian Infrastructure Forum that will function as an information exchange forum where stakeholders meet. This forum is an independent forum that stands as a dialog partner for the government. To effectively implement the reform steps and to be able to bridge the capacity gap between planning the development and managing the resulting infrastructure, the government will continue to build its institutional capacity. During the summit, the government offered as a first step 91 projects totaling US$22.5 billion in money worth. The government opens tenders for 20 of the projects from April 2005 to June 2005, including 8 tool road projects (six had been tendered in February), 1 power generation project (IPP), 2 gas piping projects, 2 oil transmission projects, 3 clean water projects, 1 railway project and 3 airport projects. The remaining projects will be tendered from July through September 2005. From the first prequalification selection, we have found quite a few investors (foreign and domestic) participating in the tender. Out of these various projects to be implemented by the private sector, one or two exemplary projects will be selected later to showcase the success of private-public partnership in our infrastructure development. In his speech when opening the summit, SBY talked about a “new partnership” concept. This is by no means just rhetoric. Believing that the private sector is indispensable for development, the government is currently revising various regulations (by the Ministry of Laws and Human Rights) to accommodate this new partnership ideals.
The current regulation regulating the private-public partnership is Keppres 7/1998. A revision is currently being drafted by KKPPI, the committee for the acceleration of infrastructure development. A new process can be seen in the chart below.

36
Pola Lama
1. Pendekatan
2.
3.
4.
5. berdasarkan atas azas pemulihan biaya – ditentukan dengan keputusan
6. Pelayanan terintegrasi dari hulu hingga hilir
Pola Baru 1. Mengakomodas
i peran daerah
2. Penyediaan Infrastruktur terbuka bagi : BUMN/BUMD, Badan Usaha Swasta , Masyarakat , Koperasi , dan lembaga berbadan hukum
3. Pemisahan peran operator dan regulator
4. Pembentukan Badan Pengatur
5. Tarif ditentukan berdasarkan atas azas pemulihan biaya , tarif ditetapkan dengan kontrak guna memberi kepastian atas arus penerimaan dan mengurangi resiko atas proyek
6. Memperkenankan
prinsip pemisahan pelayanan ( unbundling )
Picture. 3. Reform of the infrastructure regulatory framework Within the infrastructure development framework, three PPs (government regulations) have been issued, respectably on electricity (PP 3/2005), tollroads (PP15/2005), and water piping system (PP 16/2005). There are also some significant changes, as seen in the chart. Besides the sectoral regulations, the government is currently revising regulations that regulate acquisitions of land for public use. Land acquisition is one of the biggest issues hindering infrastructure development in this country. A new regulation is now in the final preparation. On the financing side, the government will attempt to increase its allocation for the infrastructure sector. This is possible by the combination of tax revenues increase, reallocation from other unproductive spending, and prudence in loan acquisition.
The national financial sector, banking and financial market, is also expected to increase their portfolio for infrastructure. Early this year, the financial sector has given its commitment to do this. The government is also coordinating with the central bank, which is acting as the supervisor, and commercial banks to make sure that Indonesia’s macro-economic stability will be maintained. A close coordination between the monetary authority and the financial authority will serve to monitor the lending process by commercial banks, ensuring that they do them prudently.
1. Centralistic Approach 2. Infrastructure provision by
parastatals 3. Double rule as regulator-operator 4. Unregulated monopolistic
business 5. Tariff set not based on the
principles of investmentreturn-set by decrees
6. Intergrated services from
upstream to downstream
Old Pattern New Pattern 1. Regions rules accomodates 2. Infrastructure provision open for
parastatals, private cooperation, public cooperatives, legal entities
3. Separation of regulatory – operator bodies
4. Establishment of regulatory bodies
5. Tariff determined on the principle of return on investment, based on contract certainly for revenues and risks reduction is assured
6. Unbundling principle allowed

37
yang “ commercially viable ”
• Percepatan Pembangunan infrastruktur ‘ non - komersial ’ yang akan dibiayai pemerintah diantaranya infrastruktur pedesaan dan yang bersifat kebutuhan dasar : air bersih perdesaan , telekomunikasi perdesaan , irigasi , dsb
• Kerangka
Policy
yang outdated
• Kerjasama dengan pihak swasta dalam penyediaan infrastruktur semakin menurun
• Pembangunan infrastruktur dasar yang masih rendah
• Pinjaman
• Obligasi
• Internal cash
• Meningkatkan alokasi rasio pinjaman dan investasi kedalam sektor infrastruktur.
• Sektor perbankan mampu mengevaluasi resiko melalui pendekatan project finance .
• Mendorong pembentukkan Infrastructure Fund dalam hal pengadaan ekuitas .
• Credit Enhancement . • Restrukturisasi permodalan perusahaan -
perusahaan pelayanan infrastruktur . • Komunikasi yang efektif dengan BI dan Bank -
Bank Komersial
Investment Pattern
Present Future
• Reform of the regulatory framework enforcement of toll road law, electricity law, natural resources law, communications law, land acquisition law
• Sped-up public-private partnership for the development of “commercially viable” infrastructure
• Sped-up development of infrastructure by the non commercial government, such as village basic infrastructure, village clean water provision, village communication, irrigation etc
• Improved ratio of the allocation of loans and investment to infrastructure
• Banking sector abled to evaluate risks through public finance approach
• Establishment of infrastructure fund for equity provision
• Credit Enhancement • Restructuration of corporate capital for
infrastructure services • Effective communication between BI and
commercial Banks
• Outdated regulatory framework
• Declining public-private patnership in providing infrastructure
• Low-level development of basic infrastructure
• Loans • Promissory
• Internal Cash
Picture. 4. Short-term Strategy for Infrastructure Development
Another issue is on tariff setting. The tariff for using infrastructure should be determined rationally and commercially in the future. At the end of the day, the cost and tariff of services will be competitive amongst providers. If the cost and tariff of the infrastructure services could be determined competitively and based on results of bidding, risks could be lowered and at the same time the financial capital will be available at a more reasonable price. With a reasonable financing, better quality infrastructure services may follow, under reasonable costs or tariffs. This will eventually reduce subsidy and subsequently the subsidy could be reallocated for some more pro-poor measures. This infrastructure development plan is therefore pro-poor, pro-employment and pro-growth. In the future, the tariff issue must be made clear. For instance, there is a process called toll tariff indexation process. Before the new toll road law was enacted late last year, the tariff hike needed a Keppres (presidential decree) and a consultation with the DPR (House of Representatives). Under the new law, tariff can be revised automatically based on the price index which has been agreed upon. This is called tariff indexation, and it is friendly to the market and the business. The government will develop a framework for a clear and practical risks management control for private investors. The government will avoid old practices like the provision of “comfort letters” to private sectors.

38
ReformasiPengaturan & Kebijakan
Sektor Infrastruktur, termasuk didalamnya penentuan tarif, pembebasan lahan, alokasi
resiko, cetak biru pengembangan sektor, dsb
PROYEKLENDER
INVESTOR
PEMERINTAHPROYEK
• Dana pensiun/asuransijiwa,
• Pola investasi• Pasar modal• Pengadaan instrumen-
instrumen barukeuangan
Reformasi Komitmen
• Ekuitas
• Infrastructure spending
Picture 5. Long-term Strategy for Infrastructure Development A sound regulatory framework also covers the establishment of credible and effective regulatory bodies. In principal, we have set up Baden Premature Japan Toll Indonesia (BPJT) and Baden Regulars Telekomunikasi Indonesia (BRTI), which is in accordance with the laws cited above. We will empower these bodies so they could become independent and transparent in doing their jobs as regulators. From the financial side, we understand that there is a real challenge now to mobilize long term funds, both from abroad and domestic, in order to finance our infrastructure development. These funds could be in the forms of long-term deposits, promissory notes, or municipal bond, pooled infrastructure financing institutions, pension fund, insurance funds, or asset backed securities. Before the 1997 crisis, our saving ratio was less than 28% of GDP. Now, it is slightly above 18% of GDP. This illustration shows there is a need to mobilize the national saving, especially long-term deposits. To effectively mobilize long-term deposits, the government will seek to reform the pension funds and life insurance and all capital market activities. Therefore, the government will need to promise all investors that they will all receive equal treatment. The government will be active in monitoring every process of rule making and in helping to solve disputes that may arise, while at the same time promise to treat investors fairly. And for that, we will work hard to make sure that a contract mechanism is applied, that it is enforceable, decided upon fairly and wisely.
Reform Commitment
• Pension Fund / Insurance
• Investment Pattern
• Capital Market • Creation of new
financial investment
• Equity • Infrastructure
Speeding
Reform of the infrastructure sector regulatory framework
Including tariff setting, land, acquisition, risk allocation, sectoral development blueprint etc
Project Goverment
Project
39
IV. CONCLUSION
e have outlined data showing that our economy is recovering. But we have also demonstrated our awareness of the daunting task that we still have to face ahead of us. There are still challenges that we still must rise up to.
Our growth rate is yet big enough to reduce our unemployment rate significantly. The 5.1% growth achieved in 2004 provided up to 2.3 million jobs, still lower than the number of new job seekers entering the job market each year. We have mentioned that we need an annual 6.6% growth to be able to provide enough job opportunities. We are confident that we will be able to achieve such quality growth. We have shown that figures in Q1/2005 are indicating that a 5.8% – 6.2% growth (from the targeted 5.5%) is reasonable. If we could reach 5.5%, we will able to meet demands for new jobs for almost all new job seekers entering the market every year. But, we realize that there are caveats to this optimism. The global economy, as already shown above, is volatile due to the high oil price and fluctuating interest rates among other things. At the micro level, we still face issues of high cost economy. It will remain the government’s resolve to improve our business climate, which will, among other things, include rooting out corruption. Among other measures to root out corruption and to cut red-tape is through economic deregulation. We are also reforming our taxation system, improving manpower system, and so on. In the 100 days of SBY-JK government, a number of problematic regional regulations have been annulled. In the months ahead, we will also make investments easier to do in Indonesia. We are looking to change our investment approval regime from permission to registration. We aim to cut the number of days needed for an approval, from 158 days to 30 days. This we will do by seeking amendments to the investment law and deregulation. As shown, investments have by all means become one of the locomotives pulling our growth, along with consumption and exports. Interestingly, we have shown that the high imports recorded in Q1/2005 are nothing to worry about as imported goods were almost all capital goods and raw production materials. Our data have shown that such imports will subsequently lead to higher exports in the future. To boost exports also mean that the government must tackle head on the efficiency problem often seen in Indonesian seaports. The government realizes that seaports have one of the most notorious sources of red tape (illegal fees) problem in the country. We have been reviewing legal fees demanded by government agencies to start with and hope to see encouraging impacts in the near future.
��

40
As a positive sign that the government is reforming itself to be more efficient, the public spending has seen a negative growth during Q1/2005. We have explained that this has partly been caused by the new budget allocation system introduced, which demand more transparency and accountability. But, of course we hope to spend more to be able to better serve our public.