Embed Size (px)
Citation preview

1
Image source: Facebook “18th Asian Games Jakarta-Palembang 2018”
Indonesia Stock Exchange @indonesiastockexchangewww.idx.co.id @IDX_BEI
Indonesian Economic and Capital Market Development
August 2018
Economic and Analysis Unit
Research and Development Division
Current Global Issues
2Source: Financial Times, The Cagle Post, The Economist, Royal Dutch Shell Group (News and Information Portal), Global Americans.
3
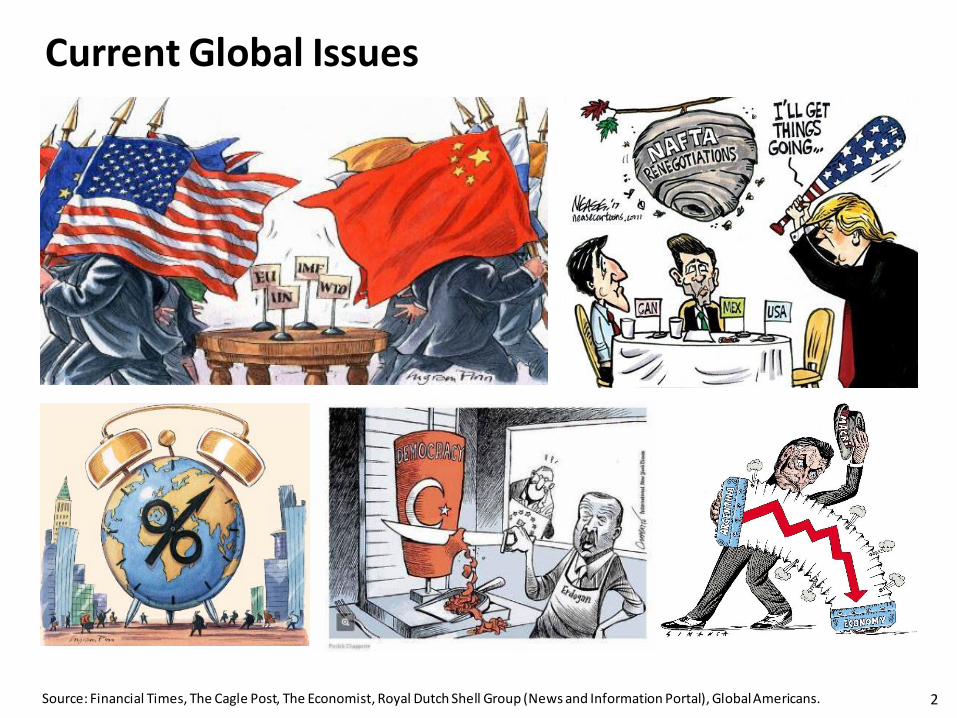
Indonesia EconomyAugust 2018
Source: Bank Indonesia, Statistics Indonesia
+3.20% (yoy)
Headline Inflation
Target 2018: (3.5%±1%)
-7.89% (ytd)
IDR/USDIDR14,730
+5.27%Real Economic Growth Q2-2018(yoy)
Foreign Reserve
USD118.31 bn-9.13% (ytd)
5.50%BI 7-Day RR Rate
Trade Surplus/DeficitUSD2.03 bn
as of July 2018
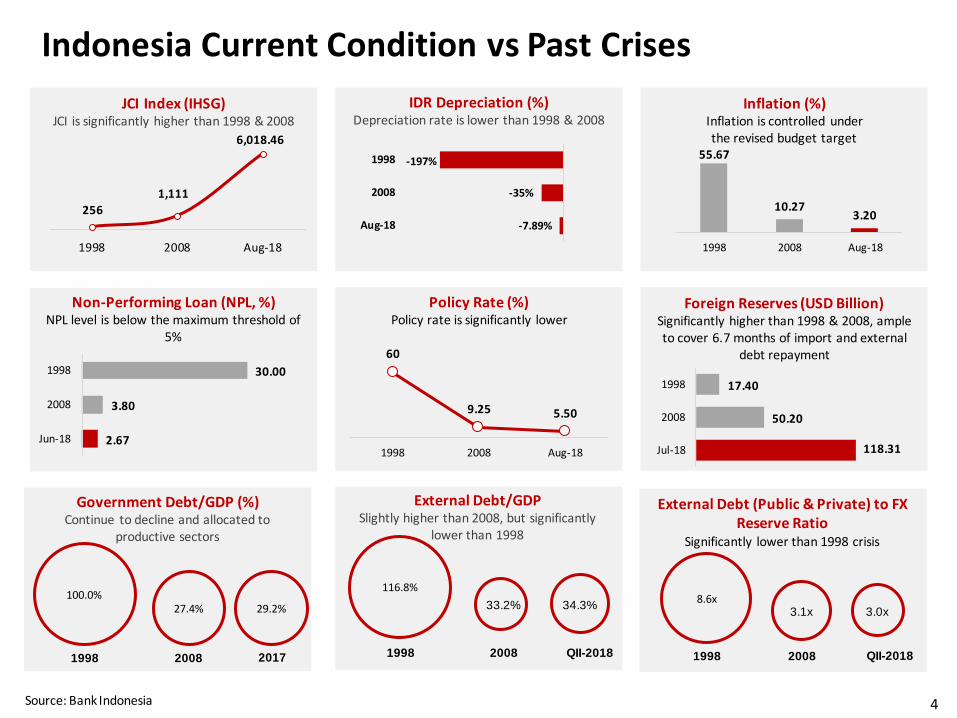
Indonesia Current Condition vs Past Crises
IDR Depreciation (%)Depreciation rate is lower than 1998 & 2008
Inflation (%)Inflation is controlled under the revised budget target
Policy Rate (%)Policy rate is significantly lower
External Debt/GDPSlightly higher than 2008, but significantly
lower than 1998
Foreign Reserves (USD Billion)Significantly higher than 1998 & 2008, ample to cover 6.7 months of import and external
debt repayment
Government Debt/GDP (%)Continue to decline and allocated to
productive sectors
External Debt (Public & Private) to FX Reserve Ratio
Significantly lower than 1998 crisis
100.0%27.4%
20172008
8.6x
2008 QII-2018
3.1x 3.0x
116.8%
2008 QII-2018
33.2% 34.3%
Source: Bank Indonesia
1998 19981998
4
256
1,111
6,018.46
1998 2008 Aug-18
2.67
3.80
30.00
Jun-18
2008
1998
Non-Performing Loan (NPL, %)NPL level is below the maximum threshold of
5%
118.31
50.20
17.40
Jul-18
2008
1998
-7.89%
-35%
-197%
Aug-18
2008
1998
JCI Index (IHSG)JCI is significantly higher than 1998 & 2008
29.2%
60
9.25 5.50
1998 2008 Aug-18
55.67
10.273.20
1998 2008 Aug-18
5
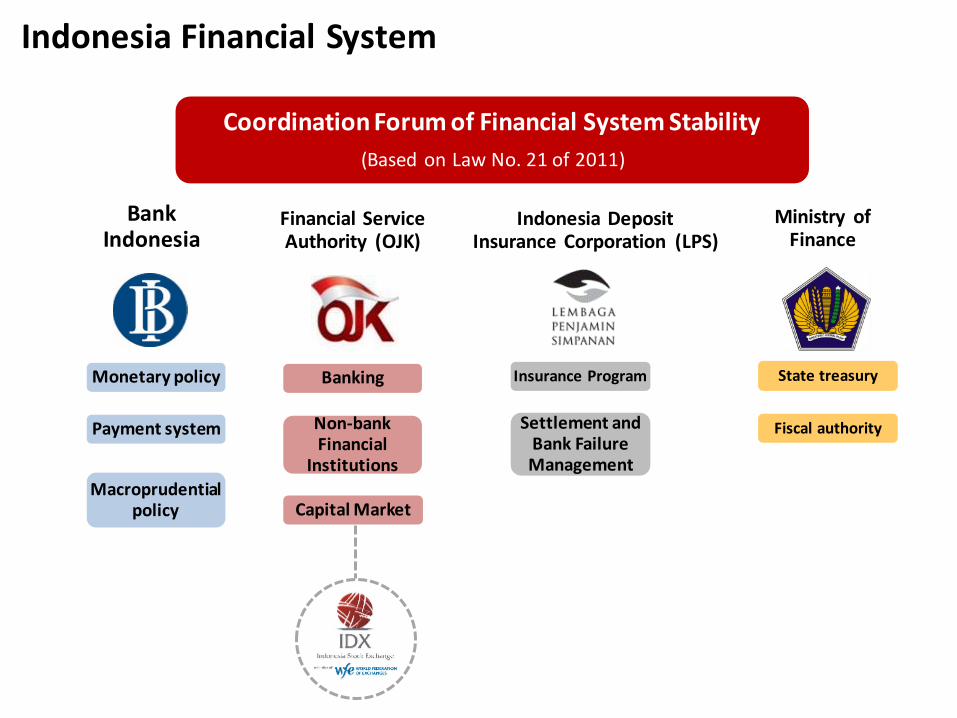
Coordination Forum of Financial System Stability
(Based on Law No. 21 of 2011)
BankIndonesia
Monetary policy
Payment system
Macroprudentialpolicy
Financial Service Authority (OJK)
Banking
Non-bank Financial
Institutions
Capital Market
Indonesia DepositInsurance Corporation (LPS)
Insurance Program
Settlement and Bank Failure Management
Ministry ofFinance
State treasury
Fiscal authority
Indonesia Financial System 5
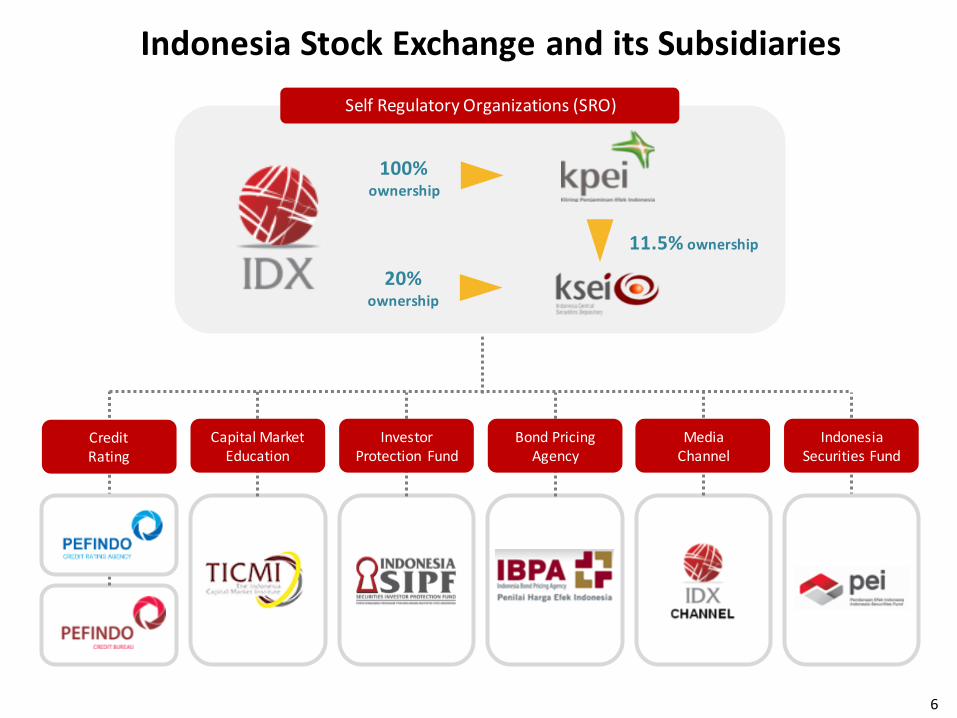
Indonesia Stock Exchange and its Subsidiaries
6
Self Regulatory Organizations (SRO)
100%ownership
20%ownership
11.5% ownership
Capital Market Education
Credit Rating
Investor Protection Fund
Bond Pricing Agency
Media Channel
Indonesia Securities Fund
77
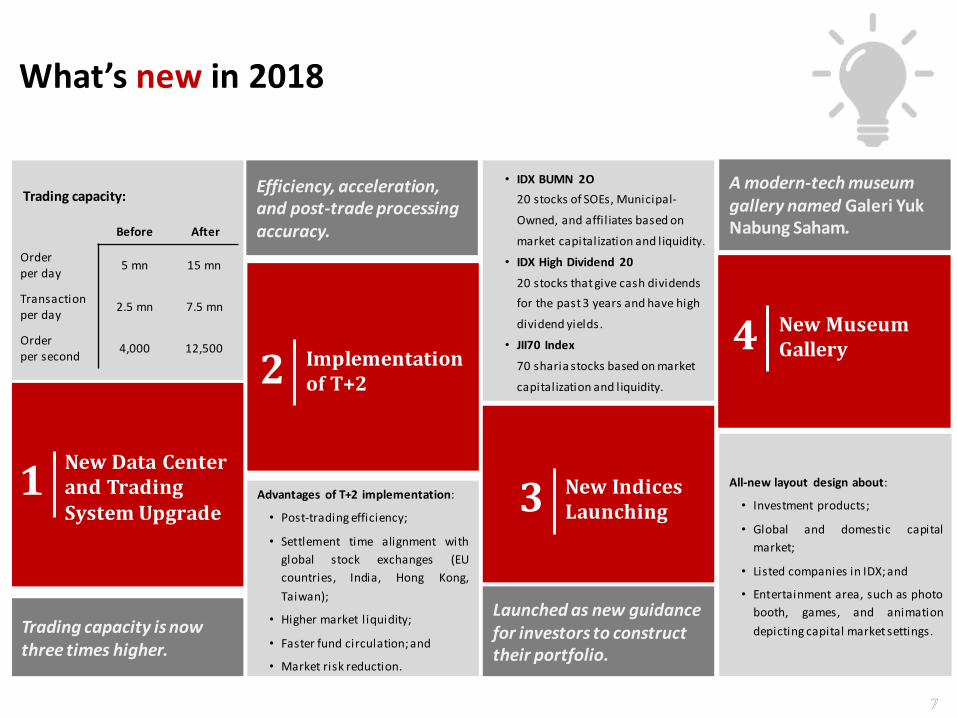
Advantages of T+2 implementation:
• Post-trading efficiency;
• Settlement time alignment with
global stock exchanges (EU
countries, India, Hong Kong,
Taiwan);
• Higher market liquidity;
• Faster fund circulation; and
• Market risk reduction.
• IDX BUMN 2O
20 stocks of SOEs, Municipal-
Owned, and affi l iates based on
market capitalization and liquidity.
• IDX High Dividend 20
20 stocks that give cash dividends
for the past 3 years and have high
dividend yields.
• JII70 Index
70 sharia stocks based on market
capitalization and liquidity.
All-new layout design about:
• Investment products;
• Global and domestic capital
market;
• Listed companies in IDX; and
• Entertainment area, such as photo
booth, games, and animation
depicting capital market settings.
1New Data Centerand TradingSystem Upgrade
Trading capacity is now three times higher.
Efficiency, acceleration, and post-trade processing accuracy.
Launched as new guidance for investors to construct their portfolio.
A modern-tech museum gallery named Galeri Yuk Nabung Saham.Before After
Orderper day
5 mn 15 mn
Transactionper day
2.5 mn 7.5 mn
Orderper second
4,000 12,500
Trading capacity:
2 Implementationof T+2
3 New IndicesLaunching
4 New Museum Gallery
What’s new in 2018
8
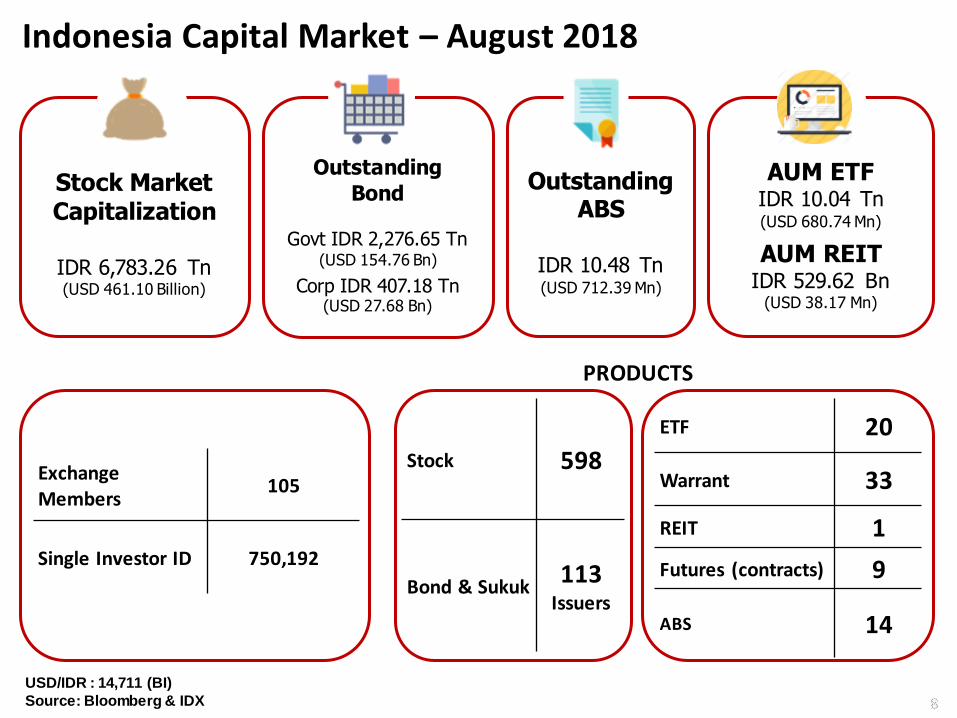
AUM ETFIDR 10.04 Tn(USD 680.74 Mn)
AUM REITIDR 529.62 Bn
(USD 38.17 Mn)
Outstanding ABS
IDR 10.48 Tn(USD 712.39 Mn)
Outstanding
Bond
Govt IDR 2,276.65 Tn(USD 154.76 Bn)
Corp IDR 407.18 Tn(USD 27.68 Bn)
Stock Market Capitalization
IDR 6,783.26 Tn(USD 461.10 Billion)
Indonesia Capital Market – August 2018
8
PRODUCTS
ExchangeMembers
105
Single Investor ID 750,192
Stock 598
Bond & Sukuk113
Issuers
ETF 20
Warrant 33
REIT 1
Futures (contracts) 9
ABS 14
USD/IDR : 14,711 (BI)
Source: Bloomberg & IDX

4,873 4,284 5,503 5,484 5,928
7,827
11,953 10,558
2011 2012 2013 2014 2015 2016 2017 2018
4,953 4,537
6,238 6,006 5,764
7,498 7,603 8,712
2011 2012 2013 2014 2015 2016 2017 2018
113,454 121,712 153,686
212,635 221,583 264,127
312,485
390,386
2011 2012 2013 2014 2015 2016 2017 2018
3,5374,127 4,219
5,228 4,8735,754
7,052 6,783
2011 2012 2013 2014 2015 2016 2017 2018
9
Average Daily Trading Volumemillion shares
Average Daily Trading Turnoverbillion IDR
Average Daily Number of Tradestimes
Market Capitalizationtrillion IDR
+16.1% p.a
+7.4% p.a
+18.4% p.a
+12.2% p.a
Average Daily Trading and Market Capitalization2011 – 31 Agustus 2018
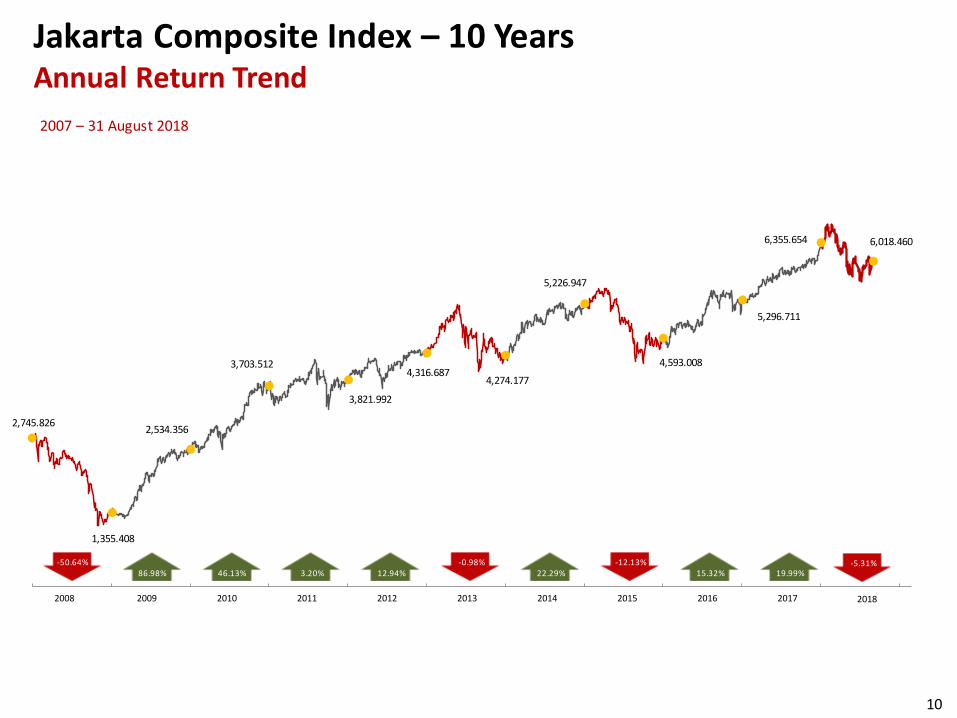
Jakarta Composite Index – 10 YearsAnnual Return Trend
10
2,745.826
1,355.408
2,534.356
3,703.512
3,821.992
4,316.687 4,274.177
5,226.947
4,593.008
5,296.711
6,355.654 6,018.460
D-07 D-08 D-09 D-10 D-11 D-12 D-13 D-14 D-15 D-16 D-17 D-182008 2009 2010
86.98%-50.64%
3.20%
2011 2012 2013
46.13% 12.94%
2014
-0.98%
2015
22.29%
2016
15.32%-12.13%
2017
19.99%
+245%+12% pa
2006 - 2017
2007 – 31 August 2018
2018
-5.31%
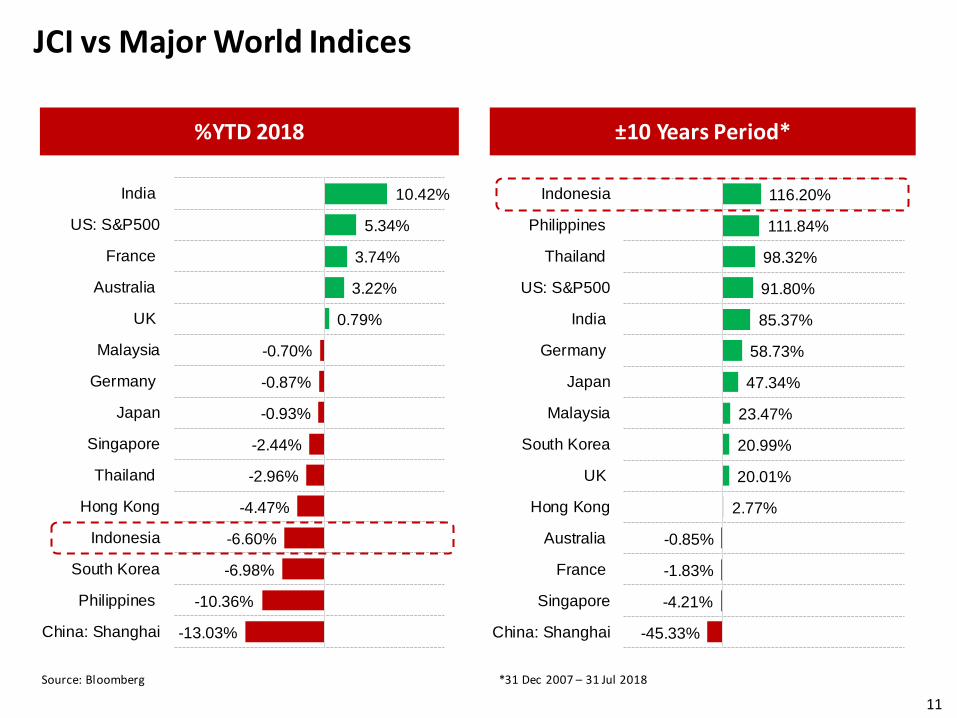
JCI vs Major World Indices
11
±10 Years Period*%YTD 2018
Source: Bloomberg *31 Dec 2007 – 31 Jul 2018
-13.03%
-10.36%
-6.98%
-6.60%
-4.47%
-2.96%
-2.44%
-0.93%
-0.87%
-0.70%
0.79%
3.22%
3.74%
5.34%
10.42%
China: Shanghai
Philippines
South Korea
Indonesia
Hong Kong
Thailand
Singapore
Japan
Germany
Malaysia
UK
Australia
France
US: S&P500
India
-45.33%
-4.21%
-1.83%
-0.85%
2.77%
20.01%
20.99%
23.47%
47.34%
58.73%
85.37%
91.80%
98.32%
111.84%
116.20%
China: Shanghai
Singapore
France
Australia
Hong Kong
UK
South Korea
Malaysia
Japan
Germany
India
US: S&P500
Thailand
Philippines
Indonesia
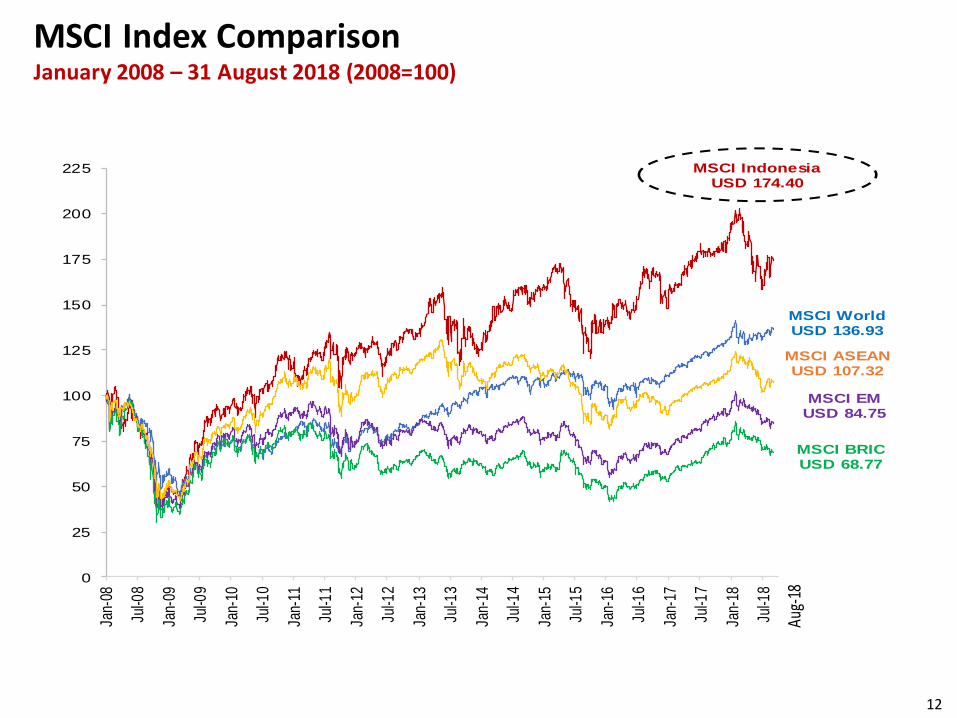
MSCI Index Comparison January 2008 – 31 August 2018 (2008=100)
12
0
25
50
75
100
125
150
175
200
225
Jan-
08
Jul-0
8
Jan-
09
Jul-0
9
Jan-
10
Jul-1
0
Jan-
11
Jul-1
1
Jan-
12
Jul-1
2
Jan-
13
Jul-1
3
Jan-
14
Jul-1
4
Jan-
15
Jul-1
5
Jan-
16
Jul-1
6
Jan-
17
Jul-1
7
Jan-
18
Jul-1
8
MSCI IndonesiaUSD 174.40
MSCI World USD 136.93
MSCI EM USD 84.75
MSCI BRIC USD 68.77
MSCI ASEAN USD 107.32
Aug-
18
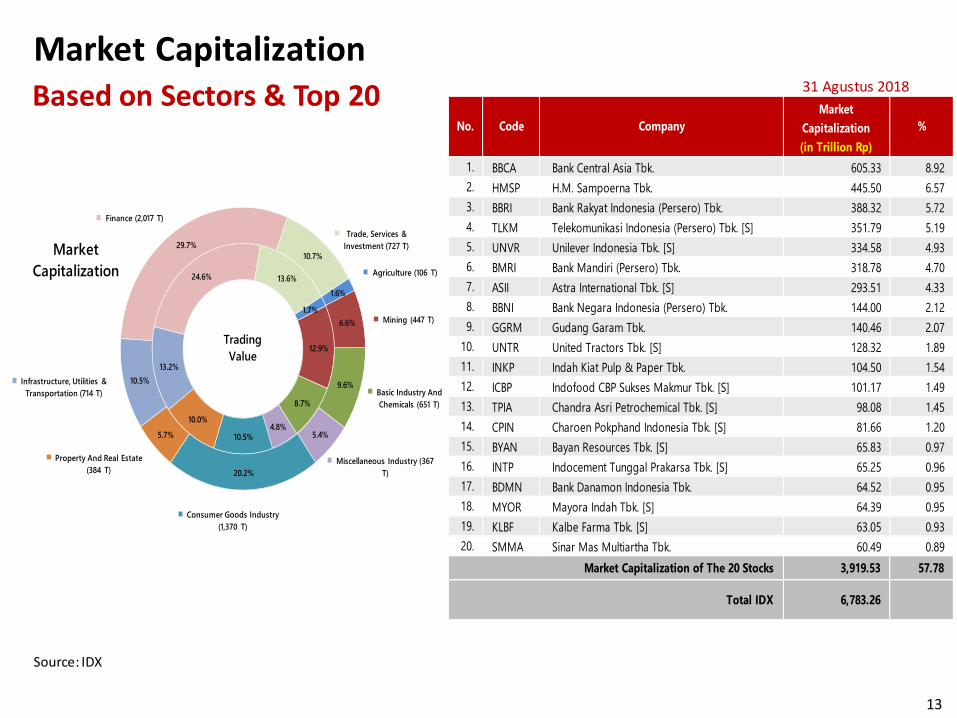
Based on Sectors & Top 20
Market Capitalization
13
31 Agustus 2018
Source: IDX
Market
Capitalization
(in Trillion Rp)
1. BBCA Bank Central Asia Tbk. 605.33 8.92
2. HMSP H.M. Sampoerna Tbk. 445.50 6.57
3. BBRI Bank Rakyat Indonesia (Persero) Tbk. 388.32 5.72
4. TLKM Telekomunikasi Indonesia (Persero) Tbk. [S] 351.79 5.19
5. UNVR Unilever Indonesia Tbk. [S] 334.58 4.93
6. BMRI Bank Mandiri (Persero) Tbk. 318.78 4.70
7. ASII Astra International Tbk. [S] 293.51 4.33
8. BBNI Bank Negara Indonesia (Persero) Tbk. 144.00 2.12
9. GGRM Gudang Garam Tbk. 140.46 2.07
10. UNTR United Tractors Tbk. [S] 128.32 1.89
11. INKP Indah Kiat Pulp & Paper Tbk. 104.50 1.54
12. ICBP Indofood CBP Sukses Makmur Tbk. [S] 101.17 1.49
13. TPIA Chandra Asri Petrochemical Tbk. [S] 98.08 1.45
14. CPIN Charoen Pokphand Indonesia Tbk. [S] 81.66 1.20
15. BYAN Bayan Resources Tbk. [S] 65.83 0.97
16. INTP Indocement Tunggal Prakarsa Tbk. [S] 65.25 0.96
17. BDMN Bank Danamon Indonesia Tbk. 64.52 0.95
18. MYOR Mayora Indah Tbk. [S] 64.39 0.95
19. KLBF Kalbe Farma Tbk. [S] 63.05 0.93
20. SMMA Sinar Mas Multiartha Tbk. 60.49 0.89
3,919.53 57.78
6,783.26
%No. Code Company
Market Capitalization of The 20 Stocks
Total IDX
1.7%
12.9%
8.7%
4.8%10.5%
10.0%
13.2%
24.6% 13.6%
1.6%
6.6%
9.6%
5.4%
20.2%
5.7%
10.5%
29.7%
10.7%
Agriculture (106 T)
Mining (447 T)
Basic Industry And
Chemicals (651 T)
Miscellaneous Industry (367
T)
Consumer Goods Industry
(1,370 T)
Property And Real Estate
(384 T)
Infrastructure, Utilities &
Transportation (714 T)
Finance (2,017 T)
Trade, Services &
Investment (727 T)Market
Capitalization
Trading
Value

Top 20 Listed Companies by Net Income
14
*) 557 companies out of 569
Jun 2018* compared to Jun 2017
30-Jun-18 30-Jun-17
1. BBRI 14.93 13.45 11.05%
2. ASII 13.19 11.36 16.18%
3. TLKM 12.81 17.50 -26.80%
4. BMRI 12.58 9.86 27.61%
5. BBCA 11.42 10.54 8.39%
6. BBNI 7.45 6.47 15.09%
7. HMSP 6.11 6.05 1.04%
8. UNTR 5.74 3.58 60.63%
9. INKP 4.91 2.28 115.21%
10. TOBA 4.51 0.19 2212.91%
11. MPMX 4.22 0.35 1101.94%
12. BYAN 4.14 1.72 141.49%
13. WSKT 3.96 1.43 177.36%
14. GGRM 3.56 3.13 13.79%
15. UNVR 3.53 3.62 -2.60%
16. ADRO 3.23 3.32 -2.66%
17. ELTY 3.05 0.03 9112.17%
18. PTBA 2.62 1.75 49.99%
19. INDF 2.43 3.07 -20.85%
20. CPIN 2.43 1.52 59.60%
Total of 20 Listed Companies 126.83 101.20 25.32%
Total IDX 191.00 169.00 13.02%
Unilever Indonesia Tbk.
Bakrieland Development Tbk.
United Tractors Tbk.
Indah Kiat Pulp & Paper Tbk.
Toba Bara Sejahtra Tbk.
Mitra Pinasthika Mustika Tbk.
Bayan Resources Tbk.
Telekomunikasi Indonesia (Persero) Tbk.
Bank Mandiri (Persero) Tbk.
Bank Rakyat Indonesia (Persero) Tbk.
Astra International Tbk.
Indofood Sukses Makmur Tbk.
Charoen Pokphand Indonesia Tbk.
Bank Negara Indonesia (Persero) Tbk.
H.M. Sampoerna Tbk.
Waskita Karya (Persero) Tbk.
Gudang Garam Tbk.
Code Listed CompaniesChange
(%)No
Adaro Energy Tbk.
Bukit Asam Tbk.
Bank Central Asia Tbk.
Profit For The Period
(Trillion Rp)
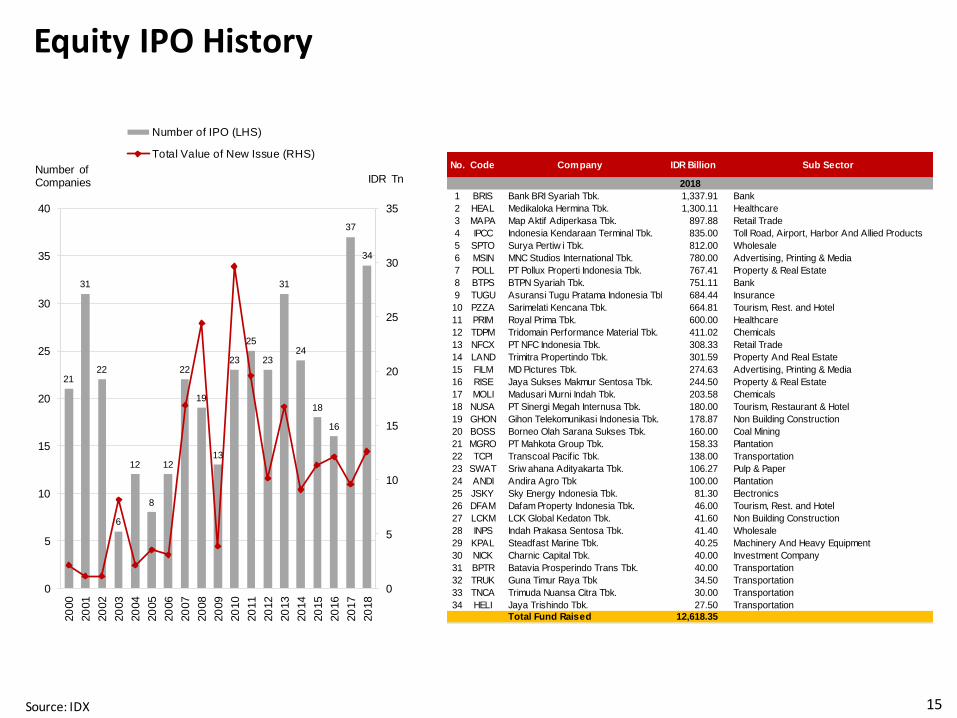
Equity IPO History
15Source: IDX
No. Code Company IDR Billion Sub Sector
1 BRIS Bank BRI Syariah Tbk. 1,337.91 Bank
2 HEAL Medikaloka Hermina Tbk. 1,300.11 Healthcare
3 MAPA Map Aktif Adiperkasa Tbk. 897.88 Retail Trade
4 IPCC Indonesia Kendaraan Terminal Tbk. 835.00 Toll Road, Airport, Harbor And Allied Products
5 SPTO Surya Pertiw i Tbk. 812.00 Wholesale
6 MSIN MNC Studios International Tbk. 780.00 Advertising, Printing & Media
7 POLL PT Pollux Properti Indonesia Tbk. 767.41 Property & Real Estate
8 BTPS BTPN Syariah Tbk. 751.11 Bank
9 TUGU Asuransi Tugu Pratama Indonesia Tbk. 684.44 Insurance
10 PZZA Sarimelati Kencana Tbk. 664.81 Tourism, Rest. and Hotel
11 PRIM Royal Prima Tbk. 600.00 Healthcare
12 TDPM Tridomain Performance Material Tbk. 411.02 Chemicals
13 NFCX PT NFC Indonesia Tbk. 308.33 Retail Trade
14 LAND Trimitra Propertindo Tbk. 301.59 Property And Real Estate
15 FILM MD Pictures Tbk. 274.63 Advertising, Printing & Media
16 RISE Jaya Sukses Makmur Sentosa Tbk. 244.50 Property & Real Estate
17 MOLI Madusari Murni Indah Tbk. 203.58 Chemicals
18 NUSA PT Sinergi Megah Internusa Tbk. 180.00 Tourism, Restaurant & Hotel
19 GHON Gihon Telekomunikasi Indonesia Tbk. 178.87 Non Building Construction
20 BOSS Borneo Olah Sarana Sukses Tbk. 160.00 Coal Mining
21 MGRO PT Mahkota Group Tbk. 158.33 Plantation
22 TCPI Transcoal Pacif ic Tbk. 138.00 Transportation
23 SWAT Sriw ahana Adityakarta Tbk. 106.27 Pulp & Paper
24 ANDI Andira Agro Tbk 100.00 Plantation
25 JSKY Sky Energy Indonesia Tbk. 81.30 Electronics
26 DFAM Dafam Property Indonesia Tbk. 46.00 Tourism, Rest. and Hotel
27 LCKM LCK Global Kedaton Tbk. 41.60 Non Building Construction
28 INPS Indah Prakasa Sentosa Tbk. 41.40 Wholesale
29 KPAL Steadfast Marine Tbk. 40.25 Machinery And Heavy Equipment
30 NICK Charnic Capital Tbk. 40.00 Investment Company
31 BPTR Batavia Prosperindo Trans Tbk. 40.00 Transportation
32 TRUK Guna Timur Raya Tbk 34.50 Transportation
33 TNCA Trimuda Nuansa Citra Tbk. 30.00 Transportation
34 HELI Jaya Trishindo Tbk. 27.50 Transportation
Total Fund Raised 12,618.35
2018
21
31
22
6
12
8
12
22
19
13
23
25
23
31
24
18
16
37
34
0
5
10
15
20
25
30
35
0
5
10
15
20
25
30
35
40
20
00
20
01
20
02
20
03
20
04
20
05
20
06
20
07
20
08
20
09
20
10
20
11
20
12
20
13
20
14
20
15
20
16
20
17
20
18
Number of Companies IDR Tn
Number of IPO (LHS)
Total Value of New Issue (RHS)

Latest Equity IPO (2017)
16Source: IDX
No. Code Company IDR Billion Sub Sector
1 GMFI Garuda Maintenance Facility Aero Asia Tbk. 1,129.34 Machinery and Heavy Equipment
2 PPRE PP Presisi Tbk. 1,011.03 Non Building Construction
3 WEGE Wijaya Karya Bangunan Gedung Tbk. 832.88 Building Construction
4 KMTR Kirana Megatara Tbk. 527.82 Others
5 TOPS Totalindo Eka Persada Tbk. 516.46 Building Construction
6 ARMY Armidian Karyatama Tbk. 491.25 Property And Real Estate
7 DWGL Dwi Guna Laksana Tbk. 465.00 Wholesale (Durable & Non-Durable Goods)
8 IPCM Jasa Armada Indonesia Tbk. 461.89 Transportation
9 HRTA Hartadinata Abadi Tbk. 331.58 Others
10 WOOD Integra Indocabinet Tbk 325.00 Houseware
11 PBID Panca Budi Idaman Tbk. 318.75 Plastics & Packaging
12 NASA Ayana Land International Tbk. 309.00 Tourism, Restaurant and Hotel
13 PORT Nusantara Pelabuhan Handal Tbk. 308.62 Transportation
14 MCAS M Cash Integrasi Tbk. 300.52 Retail Trade
15 CAMP Campina Ice Cream Industry Tbk. 292.05 Food & Beverages
16 CARS Industri dan Perdagangan Bintraco Dharma Tbk. 262.50 Wholesale (Durable & Non-Durable Goods)
17 HOKI Buyung Poetra Sembada Tbk. 217.00 Food And Beverages
18 MDKI Emdeki Utama Tbk. 184.35 Chemicals
19 FIRE Alfa Energi Investama Tbk. 150.00 Coal Mining
20 PSSI Pelita Samudera Shipping Tbk. 135.81 Transportation
21 TGRA Terregra Asia Energy Tbk. 110.00 Energy
22 TAMU Pelayaran Tamarin Samudra Tbk. 82.50 Transportation
23 FINN First Indo American Leasing Tbk. 80.43 Financial Institution
24 ZINC Kapuas Prima Coal Tbk. 77.00 Metal and Mineral Mining
25 PCAR Prima Cakrawala Abadi Tbk. 70.00 Food And Beverages
26 FORZ Forza Land Indonesia Tbk. 68.75 Property And Real Estate
27 CSIS Cahayasakti Investindo Sukses Tbk. 62.10 Building Construction
28 JMAS Asuransi Jiwa Syariah Jasa Mitra Abadi Tbk. 56.00 Insurance
29 MABA Marga Abhinaya Abadi Tbk. 53.09 Tourism, Restaurant And Hotel
30 CLEO Sariguna Primatirta Tbk. 51.75 Food And Beverages
31 MPOW Megapower Makmur Tbk. 49.02 Energy
32 BELL Trisula Textile Industries Tbk. 45.00 Textile, Garment
33 KIOS Kioson Komersial Indonesia Tbk. 45.00 Retail Trade
34 MARK Mark Dynamics Indonesia Tbk 40.00 Ceramics, Glass, Porcelain
35 MAPB MAP Boga Adiperkasa Tbk. 37.25 Tourism, Restaurant And Hotel
36 MTWI Malacca Trust Wuwungan Insurance Tbk. 31.00 Insurance
37 MINA Sanurhasta Mitra Tbk. 27.56 Tourism, Restaurant And Hotel
Total Fund Raised 9,557.30
2017
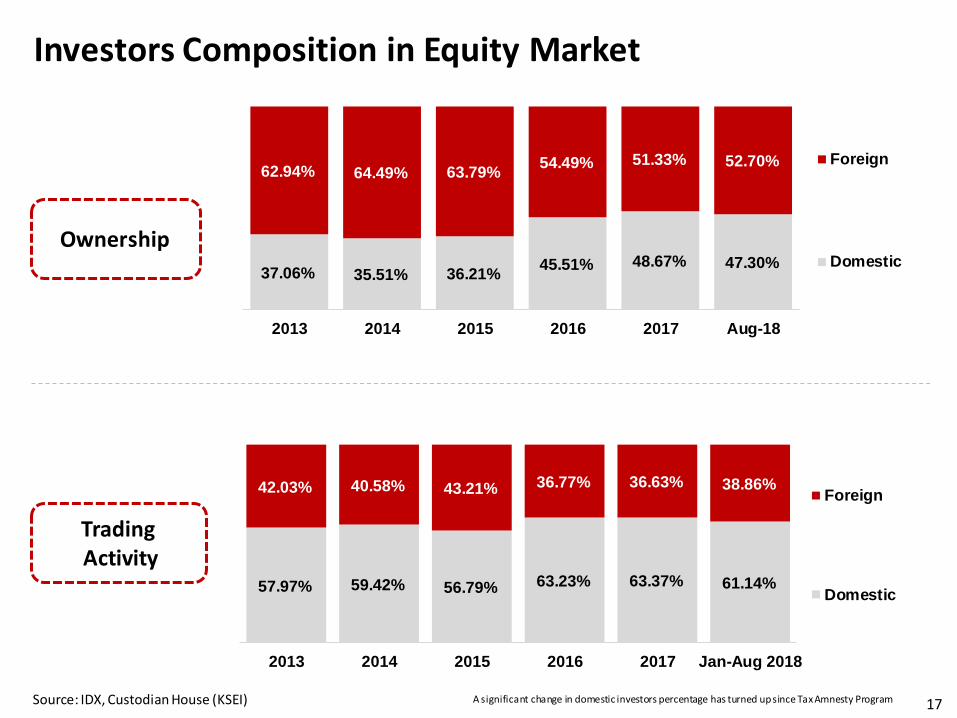
Investors Composition in Equity Market
17
Ownership
TradingActivity
Source: IDX, Custodian House (KSEI) A significant change in domestic investors percentage has turned upsince TaxAmnesty Program
57.97% 59.42% 56.79% 63.23% 63.37% 61.14%
42.03% 40.58% 43.21% 36.77% 36.63% 38.86%
2013 2014 2015 2016 2017 Jan-Aug 2018
Foreign
Domestic
37.06% 35.51% 36.21%45.51% 48.67% 47.30%
62.94% 64.49% 63.79%54.49% 51.33% 52.70%
2013 2014 2015 2016 2017 Aug-18
Foreign
Domestic
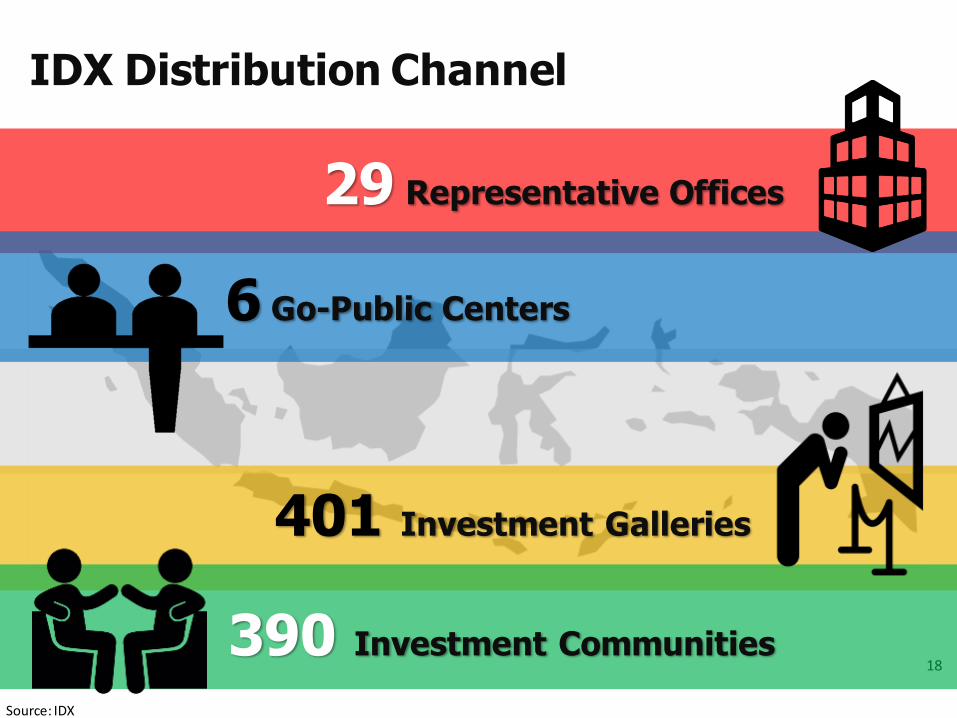
Source: IDX
18
IDX Distribution Channel
29 Representative Offices
6 Go-Public Centers
401 Investment Galleries
390 Investment Communities
End of This Document
23
DISCLAIMER
The facts and opinions stated or expressed in this publication are for information purposes only and are not necessarily and mustnot be relied upon as being those of the publisher or of the institutions for which the contributing authors work. Although everycare has been taken to ensure the accuracy of the information contained within the publication, it should not be by any personrelied upon as the basis for taking any action or making any decision. The Indonesia Stock Exchange cannot be held liable orotherwise responsible in anyway for any advice, action taken or decision made on the basis of the facts and opinions stated orexpressed or stated within this publication
For further inquiries :
Heidy Ruswita SariHead of Economic Analysis [email protected]+6221 515015 ext.4120
Adhel [email protected]+6221 515015 ext.4110
Luthfi F [email protected]+6221 515015 ext.4109
Anita K [email protected]+6221 515015 ext.4110
Lebih Baik!