Embed Size (px)
Citation preview
Sistema Económico Latinoamericano y del Caribe Latin American and Caribbean Economic System Sistema Econômico Latino-Americano e do Caribe Système Economique Latinoaméricain et Caribéen
India’s economy and relations with Latin America and the Caribbean: Current status and prospects
Regional Meetings on the Economic Relations between the People’s Republic of China, t he Republic of India and the Russian Federation with the countries of Latin America and the Caribbean C aracas, Venezuela 20, 21 and 22 July 2009 SP/RRREE-CHINA-INDIA-RUSIA-ALC/DT N° 3-09
Copyright © SELA, July 2009. All rights reserved. Printed in the Permanent Secretariat of SELA, Caracas, Venezuela. The Press and Publications Department of the Permanent Secretariat of SELA must authorize reproduction of this document, whether totally or partially, through [email protected]. The Member States and their government institutions may reproduce this document without prior authorization, provided that the source is mentioned and the Secretariat is aware of said reproduction.

India’s economy and relations with Latin America SP/RRREE-CHINA-INDIA-RUSIA-ALC/DT N° 3-09 and the Caribbean: Current status and prospects
C O N T E N T S FOREWORD EXECUTIVE SUMMARY 3 I. INTRODUCTION 6 II. INDIA IN THE GLOBAL ECONOMY 7 - India and the BRIC group 13 III. INDIA VIS-À-VIS THE CURRENT CRISIS 19 IV. INDIA’S ECONOMIC RELATIONS WITH LATIN AMERICA AND THE CARIBBEAN 25 IV.1. Trade flows 25 IV.2. Investment flows 29 V. SELA’S PROPOSALS TO STRENGTHEN ECONOMIC RELATIONS BETWEEN LATIN AMERICA AND THE CARIBBEAN AND INDIA 33 VI. CONCLUSIONS 35 ANNEXES: Table A.1. Exports from India to Latin America and the Caribbean 37 Table A.2. Imports to India from Latin America and the Caribbean 38 Table A.3. Major Indian companies by total revenue in 2006 39 TABLES: Table N° 1: Fixed gross investment and Foreign Direct Investment 16 Table N° 2: Exports and imports 17 Table N° 3: India’s exports and imports to and from its six major trade partners in the region. From April to December 2008 28

-ii- CHARTS: Chart N° 1: GDP growth rate and inflation (left axis); unemployment 8 Chart N° 2: Growth rates 9 Chart N° 3: Main components of the current account 10 Chart N° 4: Breakdown of exports 11 Chart N° 5: Breakdown of imports 12 Chart N° 6: Fiscal sector 13 Chart N° 7: GDP growth in BRIC economies 14 Chart N° 8: GDP breakdown by sectors, year 2008 15 Chart N° 9: FDI income 17 Chart N° 10: Current account balance as % of GDP 18 Chart N° 11: Fiscal balance as % of GDP 19 Chart N° 12: GDP growth by sectors 20 Chart N° 13: Industrial production index and inflation 22 Chart N° 14: Foreign exchange rate and Bombay stock exchange index 24 Chart N° 15: India’s exports and imports to and from Latin America and the Caribbean 26 Chart N° 16: Main destinations for Indian exports 27 Chart N° 17: Main origins of Indian imports 27 Chart N° 18: India’s foreign direct investment flows 29

India’s economy and relations with Latin America SP/RRREE-CHINA-INDIA-RUSIA-ALC/DT N° 3-09 and the Caribbean: Current status and prospects
F O R E W O R D
This document, prepared by the Permanent Secretariat of SELA, is aimed at providing the basis for the debates that will take place among the representatives of the organization’s Member States during the Regional Meeting on the Economic Relations between India and Latin America and the Caribbean, scheduled for late July 2009. Following the introduction, Chapter II presents an overview of India’s position in the global economy, which ends up with a comparison between India and the other three countries of the BRIC group in terms of their recent economic performance. Chapter III analyzes the impacts of the current international crisis on India’s economy. And Chapter IV focuses on the economic relations of this key Asian nation with the countries of Latin America and the Caribbean. Based on the recent developments that have characterized the economic relations between India and Latin America and the Caribbean, Chapter V includes proposals to strengthen such relations. Finally, Chapter VI summarizes the conclusions of the study.

India’s economy and relations with Latin America SP/RRREE-CHINA-INDIA-RUSIA-ALC/DT N° 3-09 and the Caribbean: Current status and prospects 3
EXECUTIVE SUMMARY The Republic of India is the second most highly populated country in the world. It is the world’s seventh largest country - with a total extension of 3,287,590 square kilometres – and, based on purchasing power parity; it is the twelfth largest economy in the planet. India's economy has expanded significantly in recent times, with the Gross Domestic Product (GDP) average growing at a rate of 8.5 percent during the period 2004-2008, on a year-on-year basis. Economic growth in India and China has been significantly faster than that in developed countries, as well as other emerging economies such as Latin American and Caribbean (LAC) nations. Based on SELA's forecasts herein, neither the Indian nor the Chinese economies are going to slow down in 2009. One of the major reasons behind the economic drive seen recently is the high capital formation rate in the Indian economy. Further, both exports and imports have soared significantly over the last few years. However, India's balance of foreign trade of goods has been negative, with the deficit increasing in recent times. Nevertheless, the current account balance has not been so negative, due to the favourable net balance of the foreign trade of services. India has gained ground in world trade, in capital inflow and particularly in the inflow of foreign direct investment (FDI). Based on estimations of the Economic Intelligence Unit (EIU), in 2008 the FDI in Indian economy amounted to US$ 41.077 billion. Most outstandingly, in 2008, India's FDI outflow increased ten-fold compared to 2004, and totalled US$ 19.354 billion. India's economy has endured the impacts of the current international crisis better than most Asian economies, largely based on its dynamic domestic demand. According to the Reserve Bank of India, the structural factors underlying India’s growth remain undisturbed, while domestic demand will continue to be boosted both by rural consumption and the coordinated tax and monetary incentives implemented by the government authorities. Even though the indicators suggest that the Indian economy will endure the crisis without falling into recession, there are some tight spots that may lead to problems in the future. The recent increase in oil prices and other commodities may worsen the current account negative balance. India’s rising fiscal deficit, as well as the consequent increase in the public debt, may ignite some problems in the medium and long term. Except for the above considerations, the Indian economy continues to be one of the world’s strongest and fastest growing emerging economies. Despite India's major role in the world scenario, India's economic ties with most LAC countries are actually incipient. India’s trade with Latin America and the Caribbean is quite limited in relative terms. However, it has expanded significantly over the last few years. India’s overall exports have increased by 24.6 percent in nominal terms in the last five years. Only 3.2 percent of India’s total exports is shipped to Latin America and the Caribbean. However, since the India-LAC trade growth rate has been higher than India’s economic growth rate, the relative weight of Indian exports to LAC has increased over the last few years. Additionally, India’s trade with Latin America and the Caribbean is highly focused on some countries, and reciprocal trade basically involves commodities and manufactured goods based on natural resources. These two items amount to more than 74 percent of
Permanent Secretariat Extra-regional Relations
4Indian imports from its major trade partners in LAC and over 51 percent of Indian exports to LAC nations. Noteworthy, however, is the fact that India’s exports to LAC include fewer commodities than LAC exports to the Indian market. It is interesting to note that India-Chile trade has grown exponentially over the last two years. In August 2007, India and Chile entered into a Partial Scope Agreement (PSA) and in the short term they are expected to initial a Free Trade Agreement providing for more ambitious tariff reductions. This is the first bilateral agreement India has signed with any single country in the region. India and MERCOSUR had initialled a treaty earlier, but it has not entered into force yet. Concerning investments, in recent years major Indian firms have taken on the challenge to become multinationals, which has resulted in increased Indian investment capital flowing to foreign countries. Most of such capital flows have been invested in countries geographically close to India or used to purchase world-class corporations. However, a small percentage of such resources has been invested in LAC nations. While India is not one the largest investors in the region, except for Trinidad and Tobago, it has an increasing role in LAC. India is the world’s leader in service outsourcing. Therefore, it is hardly surprising that most Indian investments in LAC are conducted by the largest corporations in this sector. Further, India has renowned consultancy firms that have been established in the region to provide services to both the public and private sectors. Indian investments in LAC have thriven significantly in mining and hydrocarbons. India needs to secure stable sources of commodities, and the region is particularly rich in such resources. This is the reason why major investments and acquisitions by Indian multinationals focus on these sectors in LAC. Regarding pharmaceutical laboratories, where India has built up a vast expertise in generic drugs manufacturing, Indian companies have started operations in Brazil and Argentina. As to the LAC corporations with investments in India, the group is quite smaller. It includes a joint venture between Brazilian bus maker Marcopolo and Tata Motors, which in 2008 started to manufacture buses in its Dharwad-based plant. Brazil’s major steelmaker Gerdau and Indian firm Kalyan initialled an agreement to organize a US$ 170 million joint venture to operate SJK Steel Plant Limited in Tadipatri, in the state of Andhra Pradesh. In June, 2007, Petrobras and ONGC entered into a joint venture agreement to participate in oil exploration activities, thus marking the beginning of Brazilian oil operations in India. The study concludes that India-LAC economic ties are incipient, but they have been outstanding in the last few years. Noteworthy is the fact that India involves a great opportunity for diversification and encouragement of the region’s foreign economic relations. However, making the best of such potential calls for the governments, both individually and collectively, to adopt actions or initiatives galvanizing the benefits and minimizing the risks involved in any economic interaction process under the globalization. Based on the above considerations, at the end of this paper three working areas are addressed that should be included in a regional strategy – under the aegis of SELA – to strengthen India-LAC economic ties.

India’s economy and relations with Latin America SP/RRREE-CHINA-INDIA-RUSIA-ALC/DT N° 3-09 and the Caribbean: Current status and prospects 5
1.- First, it is vital to deepen and disseminate information and knowledge throughout the region about India’s economic, political and social situation. 2.- Second, and related to the item above, a regional scope body such as SELA should make efforts to preserve a regular coordination mechanism allowing the Member States to debate the advantages and potentials of the economic relations with India. 3.- Last, based on the systematic actions defined, growing interaction between the different LAC and Indian economic and social players – public officials, entrepreneurs, academicians and others – should be encouraged.
Permanent Secretariat Extra-regional Relations
6
I. INTRODUCTION This paper is in line with the commitments made by the Permanent Secretariat of SELA, under Project III.4 as included in the organization’s Working Programme for this year, which was adopted by the Member States during the last Regular Meeting of the Latin American Council. Such project, called Diversification of Latin American and Caribbean foreign economic relations, includes the conduction of a regional meeting to assess LAC-India economic ties. Consequently, the objectives of this study include assessing the recent economic dynamics of India and its role in the world economy; describing the main features of India-LAC relations; and proposing some policies that may help expand the economic relations between India and Latin America and the Caribbean, both in quantity and quality. This paper comprises four sections. The first section is an analysis of India’s role in global economy. It includes some economic indicators to weigh such role. This section includes not only figures and facts, but also forecasts based on some economic variables as assessed by some international bodies and Indian government authorities. Further, this section examines and compares the Indian economy with the economies of the remaining members of the BRIC group. This will help determine India’s economic potential and performance in some areas, as compared to the developing world’s most dynamic economies. The second section includes different economic indicators for the last 12 months at most, which are intended to assess the impact of the recent global economic crisis on India. Further, it shows important figures and facts about economic policies recently implemented both by India’s central government and the Reserve Bank of India (India’s central bank) to cope with the adverse world economic scenario. The third section focuses on trade exchanges between India and the region, including reciprocal foreign direct investment flows. This section provides updated figures to evaluate exports and imports between India and LAC, in addition to India’s major exports to the region and some endeavours by Latin American and Caribbean countries in the Asian country. Finally, the fourth section outlines some recommendations likely to be implemented in the short and medium term – through organizations such as SELA – in order to expand both in quantity and quality the knowledge and dissemination of information about India’s recent economic experience, as well as to encourage the economic relations between LAC countries and the Asian nation.
India’s economy and relations with Latin America SP/RRREE-CHINA-INDIA-RUSIA-ALC/DT N° 3-09 and the Caribbean: Current status and prospects 7
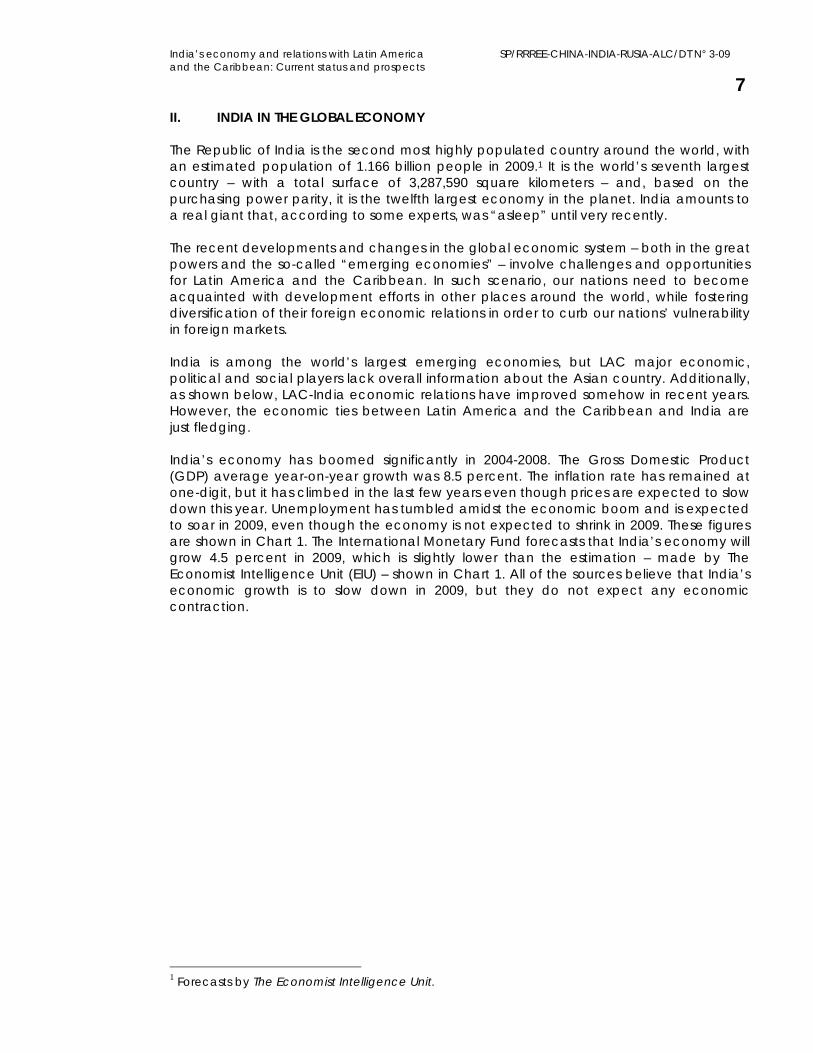
II. INDIA IN THE GLOBAL ECONOMY The Republic of India is the second most highly populated country around the world, with an estimated population of 1.166 billion people in 2009.1 It is the world’s seventh largest country – with a total surface of 3,287,590 square kilometers – and, based on the purchasing power parity, it is the twelfth largest economy in the planet. India amounts to a real giant that, according to some experts, was “asleep” until very recently. The recent developments and changes in the global economic system – both in the great powers and the so-called “emerging economies” – involve challenges and opportunities for Latin America and the Caribbean. In such scenario, our nations need to become acquainted with development efforts in other places around the world, while fostering diversification of their foreign economic relations in order to curb our nations’ vulnerability in foreign markets. India is among the world’s largest emerging economies, but LAC major economic, political and social players lack overall information about the Asian country. Additionally, as shown below, LAC-India economic relations have improved somehow in recent years. However, the economic ties between Latin America and the Caribbean and India are just fledging. India’s economy has boomed significantly in 2004-2008. The Gross Domestic Product (GDP) average year-on-year growth was 8.5 percent. The inflation rate has remained at one-digit, but it has climbed in the last few years even though prices are expected to slow down this year. Unemployment has tumbled amidst the economic boom and is expected to soar in 2009, even though the economy is not expected to shrink in 2009. These figures are shown in Chart 1. The International Monetary Fund forecasts that India’s economy will grow 4.5 percent in 2009, which is slightly lower than the estimation – made by The Economist Intelligence Unit (EIU) – shown in Chart 1. All of the sources believe that India’s economic growth is to slow down in 2009, but they do not expect any economic contraction.
1 Forecasts by The Economist Intelligence Unit.
Permanent Secretariat Extra-regional Relations
8
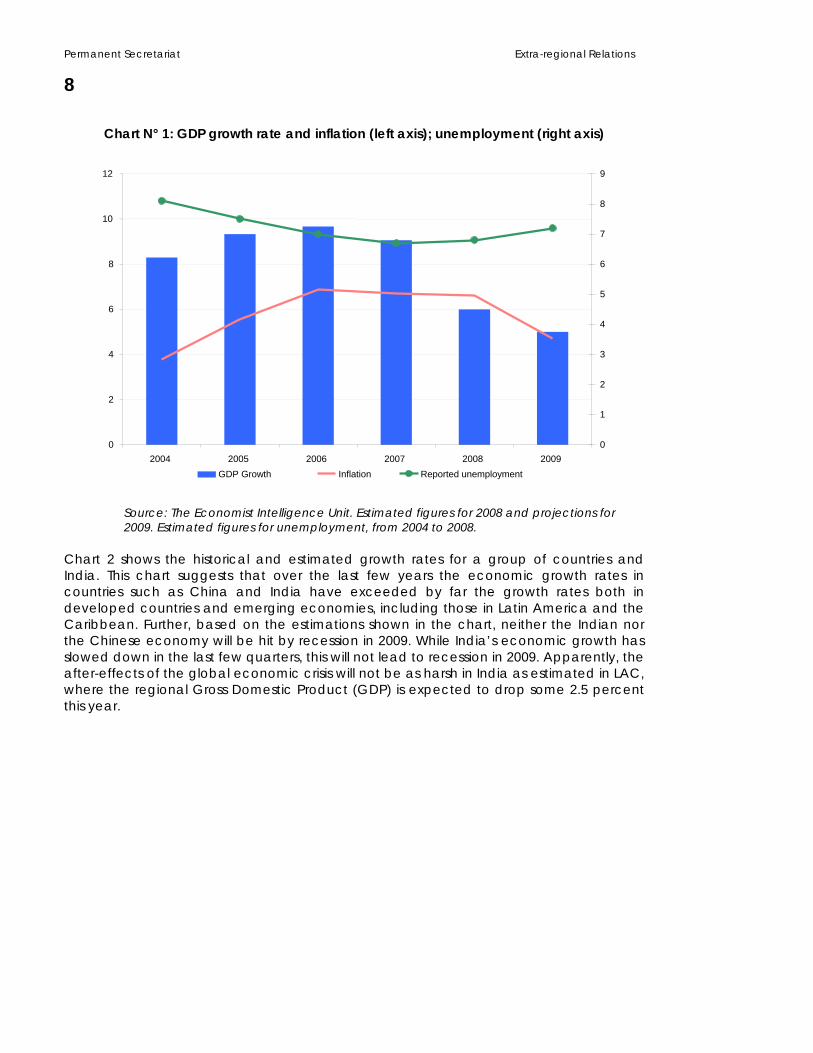
Chart N° 1: GDP growth rate and inflation (left axis); unemployment (right axis)
12 9
8 10
7
6 8
5 6
4
3 4
2 2
1
0 02004 2005 2006 2007 2008 2009
GDP Growth Inflation Reported unemployment
Source: The Economist Intelligence Unit. Estimated figures for 2008 and projections for 2009. Estimated figures for unemployment, from 2004 to 2008.
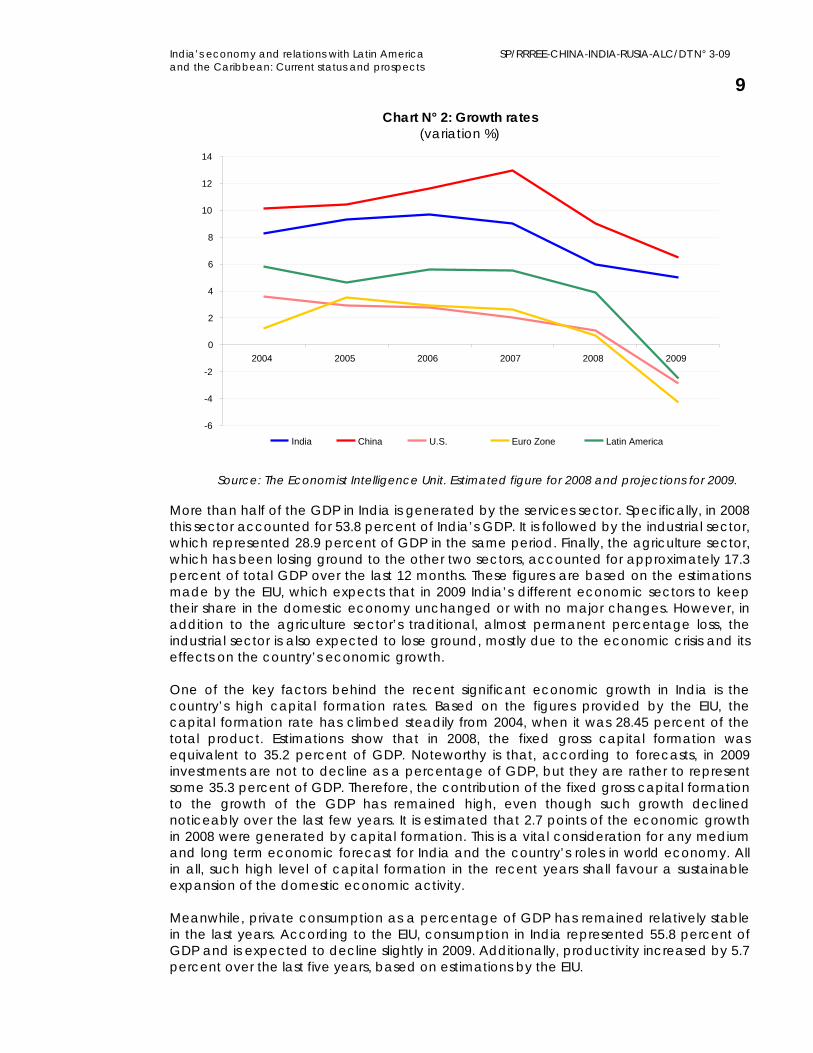
Chart 2 shows the historical and estimated growth rates for a group of countries and India. This chart suggests that over the last few years the economic growth rates in countries such as China and India have exceeded by far the growth rates both in developed countries and emerging economies, including those in Latin America and the Caribbean. Further, based on the estimations shown in the chart, neither the Indian nor the Chinese economy will be hit by recession in 2009. While India’s economic growth has slowed down in the last few quarters, this will not lead to recession in 2009. Apparently, the after-effects of the global economic crisis will not be as harsh in India as estimated in LAC, where the regional Gross Domestic Product (GDP) is expected to drop some 2.5 percent this year.
India’s economy and relations with Latin America SP/RRREE-CHINA-INDIA-RUSIA-ALC/DT N° 3-09 and the Caribbean: Current status and prospects 9
Chart N° 2: Growth rates (variation %)
14
12
10
8
6
4
2
02004 2008 2005 2006 2007 2009
-2
-4
-6 India China U.S. Euro Zone Latin America
Source: The Economist Intelligence Unit. Estimated figure for 2008 and projections for 2009.
More than half of the GDP in India is generated by the services sector. Specifically, in 2008 this sector accounted for 53.8 percent of India’s GDP. It is followed by the industrial sector, which represented 28.9 percent of GDP in the same period. Finally, the agriculture sector, which has been losing ground to the other two sectors, accounted for approximately 17.3 percent of total GDP over the last 12 months. These figures are based on the estimations made by the EIU, which expects that in 2009 India’s different economic sectors to keep their share in the domestic economy unchanged or with no major changes. However, in addition to the agriculture sector’s traditional, almost permanent percentage loss, the industrial sector is also expected to lose ground, mostly due to the economic crisis and its effects on the country’s economic growth. One of the key factors behind the recent significant economic growth in India is the country’s high capital formation rates. Based on the figures provided by the EIU, the capital formation rate has climbed steadily from 2004, when it was 28.45 percent of the total product. Estimations show that in 2008, the fixed gross capital formation was equivalent to 35.2 percent of GDP. Noteworthy is that, according to forecasts, in 2009 investments are not to decline as a percentage of GDP, but they are rather to represent some 35.3 percent of GDP. Therefore, the contribution of the fixed gross capital formation to the growth of the GDP has remained high, even though such growth declined noticeably over the last few years. It is estimated that 2.7 points of the economic growth in 2008 were generated by capital formation. This is a vital consideration for any medium and long term economic forecast for India and the country’s roles in world economy. All in all, such high level of capital formation in the recent years shall favour a sustainable expansion of the domestic economic activity. Meanwhile, private consumption as a percentage of GDP has remained relatively stable in the last years. According to the EIU, consumption in India represented 55.8 percent of GDP and is expected to decline slightly in 2009. Additionally, productivity increased by 5.7 percent over the last five years, based on estimations by the EIU.
Permanent Secretariat Extra-regional Relations
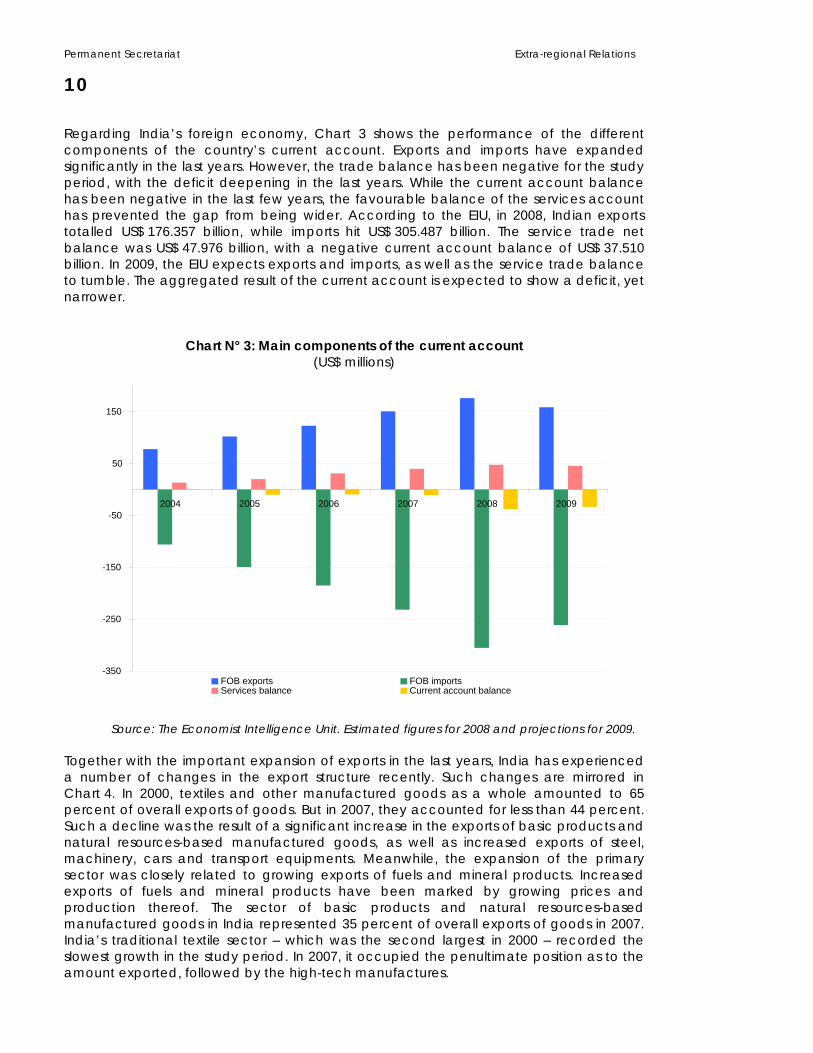
10 Regarding India’s foreign economy, Chart 3 shows the performance of the different components of the country’s current account. Exports and imports have expanded significantly in the last years. However, the trade balance has been negative for the study period, with the deficit deepening in the last years. While the current account balance has been negative in the last few years, the favourable balance of the services account has prevented the gap from being wider. According to the EIU, in 2008, Indian exports totalled US$ 176.357 billion, while imports hit US$ 305.487 billion. The service trade net balance was US$ 47.976 billion, with a negative current account balance of US$ 37.510 billion. In 2009, the EIU expects exports and imports, as well as the service trade balance to tumble. The aggregated result of the current account is expected to show a deficit, yet narrower.
Chart N° 3: Main components of the current account (US$ millions)
150
50
2004 2005 2006 2007 2008 2009-50
-150
-250
-350 FOB exports FOB imports Services balance Current account balance
Source: The Economist Intelligence Unit. Estimated figures for 2008 and projections for 2009.
Together with the important expansion of exports in the last years, India has experienced a number of changes in the export structure recently. Such changes are mirrored in Chart 4. In 2000, textiles and other manufactured goods as a whole amounted to 65 percent of overall exports of goods. But in 2007, they accounted for less than 44 percent. Such a decline was the result of a significant increase in the exports of basic products and natural resources-based manufactured goods, as well as increased exports of steel, machinery, cars and transport equipments. Meanwhile, the expansion of the primary sector was closely related to growing exports of fuels and mineral products. Increased exports of fuels and mineral products have been marked by growing prices and production thereof. The sector of basic products and natural resources-based manufactured goods in India represented 35 percent of overall exports of goods in 2007. India’s traditional textile sector – which was the second largest in 2000 – recorded the slowest growth in the study period. In 2007, it occupied the penultimate position as to the amount exported, followed by the high-tech manufactures.

India’s economy and relations with Latin America SP/RRREE-CHINA-INDIA-RUSIA-ALC/DT N° 3-09 and the Caribbean: Current status and prospects 11 The pattern of Indian imports has been more stable than that of exports, as shown in Chart 5. In 2007, the major imported items were basic goods and other manufactured goods, similarly to 2000. No sector has recorded an explosive growth similar to that in exports. Therefore, the distribution of imports has remained relatively stable in 2000-2007. Probably the only sector showing an increase significantly higher than the mean was steel, machinery, cars and transport equipments. Some of these items are associated to the strong capital formation process taking place in India recently. Particularly, India’s imports of iron and steel have climbed significantly, in parallel to the big expansion of the construction and automobile sectors in the country.
Chart N° 4: Breakdown of exports
100%
90%
80%
70%
60%
50%
40%
30%
20%
10%
0% 2000 2007
Commodities Commodity-based manufactures
automobiles and transport equipment Steel, machinery, Chemical and pharmaceutical products High-tech manufactured goods Textile productsOther manufactured goods
Source: World Trade Organization. Classification by the author.

Permanent Secretariat Extra-regional Relations
12Chart N° 5: Breakdown of imports
100%
90%
80%
70%
60%
50%
40%
30%
20%
10%
0% 2000 2007
Commodities Commodity-based manufactures
Steel, machinery, automobiles and transport equipment Chemical and pharmaceutical products Hi-tech manufactured goods Textile productsOther manufactured goods
Source: World Trade Organization. Classification by the author.
India has both expanded its role in world trade and increased its share in capital flows, and particularly in the Foreign Direct Investment (FDI) inflows. Back in 2004, India’s FDI inflow was only US$ 5.771 billion, which represented only 0.9 percent of the world’s investment flows. In 2008, based on the figures provided by the EIU, FDI in Indian economy amounted to US$ 41.077 billion. This amount was 2.6 percent of the world’s Foreign Direct Investment flows. Most interestingly, India’s FDI outflows climbed. In 2004, the Indian economy’s investments abroad hit US$ 1.879 billion. During 2008, such amount increased more than tenfold and totalled US$ 19.354 billion. According to the estimations of the EIU, investment inflows and outflows to and from India are to fall in 2009, which is predictable in a scenario of world economic shrinkage. FDI inflows are likely to amount to US$ 29.700 billion, while FDI outflows may hit some US$ 12 billion. Regarding the fiscal sector, India has recorded a deficit in its official budget ever since 2004. This deficit is attributable to the fact that public revenues have remained below public outlays. Public revenues averaged 11.2 percent of GDP in 2004-2008, while public expenses averaged 15.4 percent of total GDP. The fiscal deficit amounted to virtually 7 percent of GDP in 2008, and it is expected to hit some 7.7 percent of GDP in 2009.

India’s economy and relations with Latin America SP/RRREE-CHINA-INDIA-RUSIA-ALC/DT N° 3-09 and the Caribbean: Current status and prospects 13
Chart N° 6: Fiscal sector
20
15
10
5
0 2004 2008 2005 2006 2007 2009
-5
-10 Fiscal balance Public expenses Public Revenues
Source: The Economist Intelligence Unit. Estimated figures for 2008 and projections for 2009.
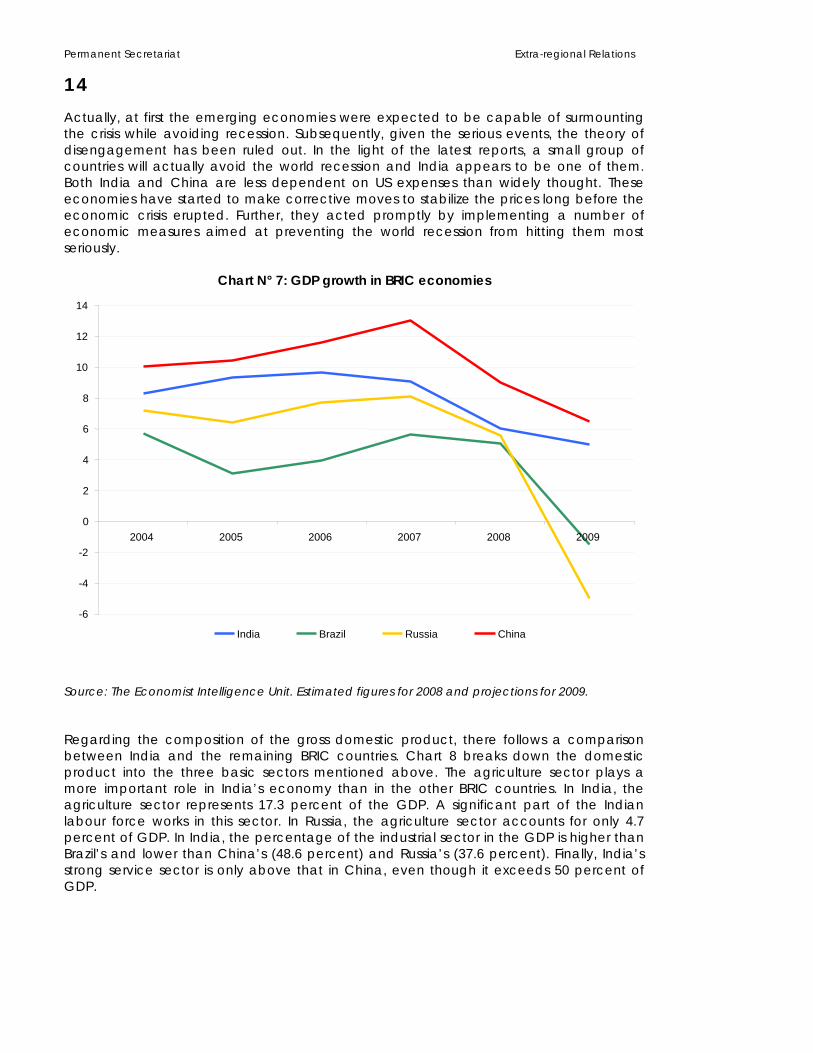
- India and the BRIC group In 2001, Jim O’Neill, an economist with Goldman Sachs, coined the term BRIC to refer to the four largest emerging economies. This group of countries comprises Brazil, Russia, India and China. Without going into the issue of whether these economies should be grouped or not, as they are noticeably different, there is no doubt that this group of countries has a huge potential. In the near future, these economies may be at the centre of significant changes in the world’s economic structure and power balance in the planet. The idea behind the acronym BRIC was intended neither to forge an alliance among these countries nor to create any formal or informal cooperation mechanism among them. Nevertheless, the leaders of these nations have held meetings, with the latest taking place in mid June this year in Russia. Pondering India’s weight in the world economy requires a comparison with the other three major emerging economies. India’s economic growth in 2004-2008, has been lower than China’s yet fastest than Brazil’s and Russia’s, as depicted in Chart 6. Unlike Brazil and Russia, India is not expected to fall into recession in 2009. There have been many speculations on a likely "disengagement" between emerging economies and developed countries, amidst the present world crisis. The emerging economies are not exempted from effects of the credit crunch and trade collapse. However, countries such as India, with a strong domestic demand, are to cope with the crisis without a contraction of their aggregated economic activity.
Permanent Secretariat Extra-regional Relations
14Actually, at first the emerging economies were expected to be capable of surmounting the crisis while avoiding recession. Subsequently, given the serious events, the theory of disengagement has been ruled out. In the light of the latest reports, a small group of countries will actually avoid the world recession and India appears to be one of them. Both India and China are less dependent on US expenses than widely thought. These economies have started to make corrective moves to stabilize the prices long before the economic crisis erupted. Further, they acted promptly by implementing a number of economic measures aimed at preventing the world recession from hitting them most seriously.
Chart N° 7: GDP growth in BRIC economies
14
12
10
8
6
4
2
02004 2005 2009 2006 2007 2008
-2
-4
-6
Source: The Economist Intelligence Unit. Estimated figures for 2008 and projections for 2009. Regarding the composition of the gross domestic product, there follows a comparison between India and the remaining BRIC countries. Chart 8 breaks down the domestic product into the three basic sectors mentioned above. The agriculture sector plays a more important role in India’s economy than in the other BRIC countries. In India, the agriculture sector represents 17.3 percent of the GDP. A significant part of the Indian labour force works in this sector. In Russia, the agriculture sector accounts for only 4.7 percent of GDP. In India, the percentage of the industrial sector in the GDP is higher than Brazil’s and lower than China’s (48.6 percent) and Russia’s (37.6 percent). Finally, India’s strong service sector is only above that in China, even though it exceeds 50 percent of GDP.
India Brazil Russia China

India’s economy and relations with Latin America SP/RRREE-CHINA-INDIA-RUSIA-ALC/DT N° 3-09 and the Caribbean: Current status and prospects 15
Chart N° 8: Breakdown of GDP by sectors, year 2008
70
60
50
40
30
20
10
0 Agriculture Industry Services
China India Brazil Russia
Source: The Economist Intelligence Unit. Estimated figures for 2008.
Table 1 shows the figures of Gross Fixed Investment (GFI) and Foreign Direct Investment in India and the other three countries. These figures were provided by the EIU as the forecasts for 2009. In India, just like in the remaining economies of the group, fixed capital formation plays a vital role in the outstanding economic growth they have experienced. Except for the last few years, the contribution was higher in India than the average in the four countries. Besides their high capital formation rates, these countries are major recipients of FDI inflows. The related key indicator is the index of FDI inflows as a percentage of GDP. While India is lagging behind in this index as compared to the rest of the group, financing based on FDI inflows has been playing an increasingly significant role in Indian economy. In 2008, based on the estimations, the FDI inflow into India totalled 3.5 percent of GDP. This is an outstanding performance, as in relative terms the index jumped more than four times in only five years. In 2009, the index is expected to fall slightly, but India will remain a major destination of FDI inflows. One of the most significant differences between these economies is the capital formation rate as percentage of the GDP. In Brazil and Russia, the fixed gross capital formation is around 20 percent of GDP, but in India this indicator’s performance is similar to China’s, above 30 percent of GDP in most of the study period. Based on the forecasts, even though the share of investments in India in the growth of GDP is to decline in 2009, they are going to soar as a percentage of the GDP. This suggests that investments in India will not be seriously undermined by the world economic crisis.

Permanent Secretariat Extra-regional Relations
16Table N° 1: Fixed gross investment and Foreign Direct Investment
2004 2005 2006 2007 2008 /1 2009 /2 India
Contribution of FGI to real GDP growth 4.7 4.8 4.2 4.0 2.7 1.6
FDI income as % of GDP 0.8 0.9 2.1 2.2 3.5 2.6 FGI as % of GDP 28.4 31.0 32.5 34.0 35.2 35.3
Brazil Contribution of FGI to real
GDP growth 1.4 0.6 1.5 2.2 2.4 -2.2 FDI income as % of GDP 2.7 1.7 /1 1.7 2.6 2.9 1.5 FGI as % of GDP 16.1 15.9 16.4 17.5 19.0 16.8
Russia Contribution of FGI to real
GDP growth 2.3 2.0 3.6 4.6 2.5 -4.1 FDI income as % of GDP 2.6 1.7 3.0 4.3 3.6 2.5 FGI as % of GDP 18.4 17.7 18.5 21.1 22.1 20.8
China Contribution of FGI to real
GDP growth /1 4.7 4.4 4.5 4.2 2.9 3.1 FDI income as % of GDP 2.8 3.4 2.8 4.0 3.5 1.5 FGI as % of GDP 40.6 41.0 40.7 40.0 40.5 41.5
BRIC average Contribution of FGI to real
GDP growth 4.4 3.9 4.6 5.0 3.5 -0.5 FDI income as % of GDP 3.0 2.6 3.2 4.3 4.5 2.7 FGI as % of GDP 34.5 35.2 36.1 37.5 38.9 38.1
Source: The Economist Intelligence Unit. /1 Estimated /2 Projections
India’s role in the world trade has been on the rise in the last few years. In 2004-2008, exports of goods (FOB) climbed 126 percent, from US$ 77.939 billion in 2004 to US$ 176.347 billion in 2008. Meanwhile, imports skyrocketed 188 percent during the same period. India’s imports of goods (FOB) jumped from US$ 105.975 billion in 2004 to US$ 305.487 billion in 2008, as stated above. For a better understanding of the relative performance of India’s foreign trade, there follows a comparison with the other three major emerging economies. The growth of Indian exports was exceeded only by Russia and China in 2008, while the increase in imports was exceeded only by Russia. As depicted in Table 2, note the growing importance of this group of countries worldwide. According to the EIU, in 2009 the BRIC group’s exports are to account for 16 percent of exports worldwide and 13 percent of global imports.

India’s economy and relations with Latin America SP/RRREE-CHINA-INDIA-RUSIA-ALC/DT N° 3-09 and the Caribbean: Current status and prospects 17
Table N° 2: Exports and imports (US$ millions)
2004 2005 2006 2007 2008 2009 India
FOB exports 77,939 102,175 122,963 150,710 176,357 158,540 FOB imports 105,975 149,430 185,041 231,571 305,487 261,345
Brazil FOB exports 96,475 118,309 137,808 160,649 197,943 147,627 FOB imports 62,835 73,606 91,351 120,618 173,107 128,584
Russia FOB exports 183,207 243,569 303,550 354,401 471,603 281,970 FOB imports 97,382 125,303 164,281 223,486 291,861 215,006
China FOB exports 593,393 762,484 969,682 1,220,000 1,434,601 1,163,500 FOB imports 534,410 628,295 751,936 904,618 1,073,919 841,239
Total BRIC FOB exports 951,014 1,226,537 1,534,003 1,885,760 2,280,504 1,751,637 FOB imports 800,602 976,634 1,192,609 1,480,293 1,844,374 1,446,174
World /1 FOB exports 8,873,714 10,109,671 11,686,626 13,492,863 15,408,267 11,020,189 FOB imports 8,817,421 10,057,282 11,578,369 13,300,425 15,278,848 11,298,567
BRIC / World FOB exports 11% 12% 13% 14% 15% 16% FOB imports 9% 10% 10% 11% 12% 13%
Source: The Economist Intelligence Unit. Estimated figures for 2008 and projections for 2009. /1 The category world comprises the 82 countries included in the EUI Viewswire database. The Gross Fixed Investment inflows are shown in Chart 9. While in average India is among the countries receiving less Gross Fixed Investment inflows, in India such inflows have climbed at the fastest pace. In 2004, India received US$ 5.771 billion, while in 2008 such inflows hit US$ 41.077 billion.
Chart N° 9: FDI income (US$ billions)
160
140
120
100
80
60
40
20
02008 2004 2005 2006 2007 2009
Source: The Economist Intelligence Unit. Estimated figures for 2008 and projections for 2009.
India China Russia Brazil

Permanent Secretariat Extra-regional Relations
18 Among the four BRIC countries, India is the only one recording a negative foreign trade balance. However, unlike Brazil, Russia and China, India keeps a strong favourable service trade balance. This is one of India’s peculiar features: the outstanding development of the services sector, as well as the booming internationalization thereof. In 2004, India’s revenues from the service sector amounted to US$ 38.282 billion. In 2008, they increased by 162 percent to US$ 100.597 billion, according to the EIU. While outlays for service purchase grew too, they increased less than revenues. Therefore, the service trade balance ended 2008 with a surplus of US$ 47.916 billion. The current account balance in 2008 recorded a deficit at US$ 37.510 billion, and such deficit is expected to fall slightly in 2009.
Chart N° 10: Current account balance as % of GDP
12
10
8
6
4
2
02004 2005 2006 2007 2008 2009
-2
-4 India China Russia Brazil
Source: The Economist Intelligence Unit. Estimated figures for 2008 and projections for 2009.
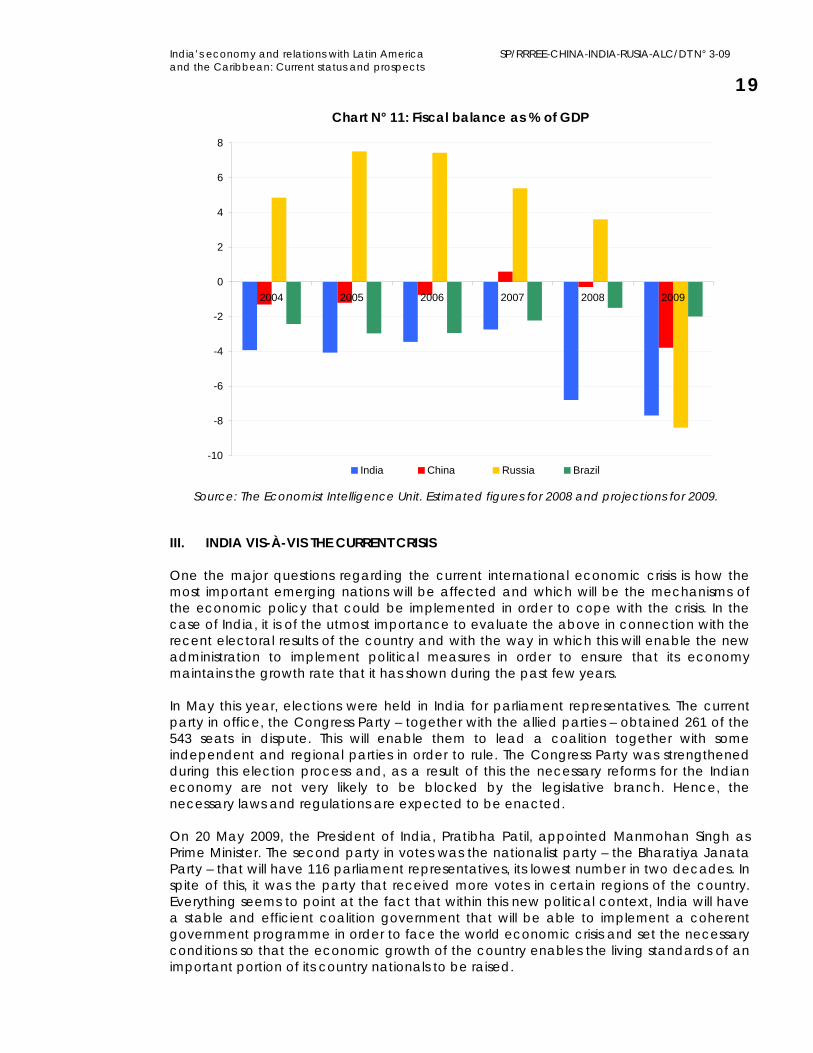
The last indicator that was used to compare India and the remaining BRIC countries is the fiscal balance as a percentage of GDP. Similarly to Brazil, India’s fiscal deficit persists. There is a marked contrast with Russia’s constant surpluses in 2004–2008. India’s average deficit in the period was 4.2 percent of GDP. All of these countries are expected to record a larger deficit in 2009, both because of their economic stimulus packages and the decline of fiscal revenues resulting from the slowdown / fall of the economic activity levels.
India’s economy and relations with Latin America SP/RRREE-CHINA-INDIA-RUSIA-ALC/DT N° 3-09 and the Caribbean: Current status and prospects 19
Chart N° 11: Fiscal balance as % of GDP
8
6
4
2
02004 2008 2005 2006 2007 2009
-2
-4
-6
-8
-10 India China Russia Brazil
Source: The Economist Intelligence Unit. Estimated figures for 2008 and projections for 2009.
III. INDIA VIS-À-VIS THE CURRENT CRISIS One the major questions regarding the current international economic crisis is how the most important emerging nations will be affected and which will be the mechanisms of the economic policy that could be implemented in order to cope with the crisis. In the case of India, it is of the utmost importance to evaluate the above in connection with the recent electoral results of the country and with the way in which this will enable the new administration to implement political measures in order to ensure that its economy maintains the growth rate that it has shown during the past few years. In May this year, elections were held in India for parliament representatives. The current party in office, the Congress Party – together with the allied parties – obtained 261 of the 543 seats in dispute. This will enable them to lead a coalition together with some independent and regional parties in order to rule. The Congress Party was strengthened during this election process and, as a result of this the necessary reforms for the Indian economy are not very likely to be blocked by the legislative branch. Hence, the necessary laws and regulations are expected to be enacted. On 20 May 2009, the President of India, Pratibha Patil, appointed Manmohan Singh as Prime Minister. The second party in votes was the nationalist party – the Bharatiya Janata Party – that will have 116 parliament representatives, its lowest number in two decades. In spite of this, it was the party that received more votes in certain regions of the country. Everything seems to point at the fact that within this new political context, India will have a stable and efficient coalition government that will be able to implement a coherent government programme in order to face the world economic crisis and set the necessary conditions so that the economic growth of the country enables the living standards of an important portion of its country nationals to be raised.

Permanent Secretariat Extra-regional Relations
20 Although growth in India has been slowing down, as mentioned before, the economy is not expected to fall into a recession in the near future. Chart No. 12 contains the annual growth figures for the country in quarters. The data, derived from the Central Statistical Organization, and the quarters have been moved ahead in time in order to present them in terms of the calendar year.2 The average annual growth of India during the last 21 quarters accounted for 8.5 %. The most dynamic sectors of the economy have been construction, trade and services and financial and real estate services. As can be seen, although some of these sectors continue to grow, they have been doing so at a lesser degree and have recorded an abrupt deceleration during the fourth quarter of the year 2008. The contraction is especially noteworthy in the manufacturing sector. Manufacturing accounts for almost 30% of India’s GDP. Hence, an important contraction in this sector definitively has significant effects on the general growth of the economy. During the first quarter of 2009, the industrial sector was the only sector that showed a decrease, while the manufacturing sector decreased by 1, 4%. This seems to highlight that the economic crisis will affect certain sectors in India, despite the fact that others have shown to be resistant to the ravages of the international environment. It is still too early to evaluate the impacts that the crisis will have in real terms on key sectors that have shown considerable dynamism – as is the case of construction and trade.
Chart N° 12: GDP growth by sectors
20
15
10
5
0 Q1 Q2 Q3 Q4 Q1 Q2 Q3 Q4 Q1
Source: Central Statistical Organization.
2 The quarterly figures that have normally been submitted in India are those that correspond to the fiscal year that starts on 1 April and ends on the last day of March. These figures have been rolled forward so as to present them on the basis of the calendar year.
-5
Q2 Q3 Q4 Q1 Q2 Q3 Q4 Q1 Q2 Q3 Q4 Q1 2004 2005 2009 2006 2007 2008
Agriculture Manufacturing Construction Trade and services Total
India’s economy and relations with Latin America SP/RRREE-CHINA-INDIA-RUSIA-ALC/DT N° 3-09 and the Caribbean: Current status and prospects 21
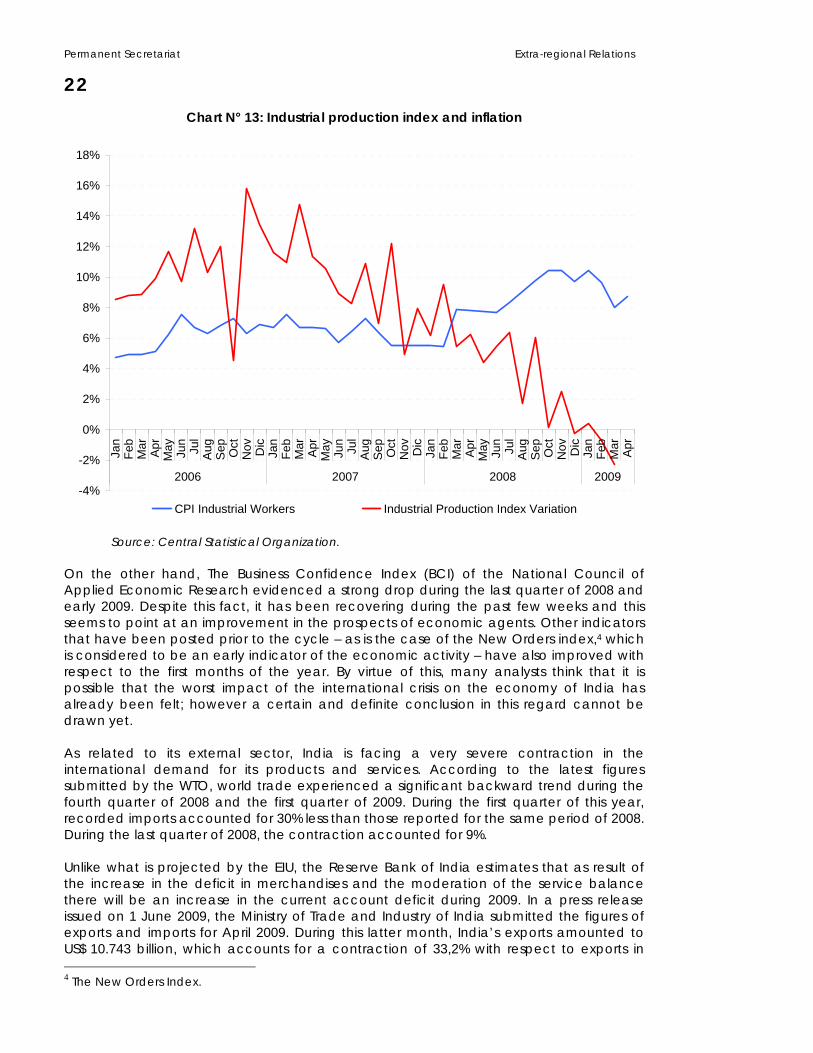
The performance of the industrial sector has been assessed month by month by means of the industrial production index that is prepared by the Central Statistical Organization. It is contained in Chart 13. This Chart shows that industrial sector growth decreased during most of 2008, even before the financial crisis started. By the end of 2008 and during most of the months of the year 2009 to date, such growth has been negative and it is quite likely to continue with this poor performance for some additional months. Chart 13 also illustrates the variation in the CPI for industrial workers as a measure of inflation. As of the year 2006, the monthly variation of yearly prices remained below 8%. But since the second half of 2008, there was evidence of acceleration in the increase recorded in price levels, although strangely it has been coupled with a drop in the industrial sector growth. Although in 2009 the price variation has decreased, it is still higher than the average registered in previous years. The increase in inflation has mostly been the result of the increase in the prices of foodstuffs and raw materials. The deceleration evidenced during the past months is also due to the decline in the quotations of these items. Both the government and the Reserve Bank of India have been taking up the task of re-establishing trust in financial markets, while trying to foster the aggregate demand. The issue of inflation holds a second place in the priorities of the economic policy at present, as is also the case in most of the countries where there has been relative stability with respect to price variations. The Indian economy has been able to cope better with the crisis than most of the Asian economies, mostly supported by its internal demand. According to the 2009-10 Monetary Policy Statement, published by the Reserve Bank of India, the structural factors that support growth in the country will remain unaltered and domestic demand will be further boosted by rural consumption and by the coordinated fiscal and monetary stimulus. However, the decrease in economic growth during the last quarters has been associated both to the drop in investments and to a certain degree of deceleration in product consumption figures. Investment – which has been the basic support for the country’s economic growth – has started to show signs that it is being affected by the crisis. Sales of commercial vehicles – which are related to investment activities – dropped by 26% in March 2009 vis-à-vis the figures posted for the same month the previous year.3 During the last quarter of 2008, the drop in sales was higher than the drop in expenses. As a result of this, profits of companies – measured as gross profits over sales – were lower, which points at pressures on profit margins.
3 The Economist Intelligence Unit, Monthly Report May 2009.
Permanent Secretariat Extra-regional Relations
22Chart N° 13: Industrial production index and inflation
-4%
-2%
0%
2%
4%
6%
8%
10%
12%
14%
16%
18%
Jan
Feb
Mar
Apr
May Jun
Jul
Aug
Sep Oct
Nov Dic
Jan
Feb
Mar
Apr
May Jun
Jul
Aug
Sep Oct
Nov Dic
Jan
Feb
Mar
Apr
May Jun
Jul
Aug
Sep Oct
Nov Dic
Jan
Feb
Mar
Apr
2006 2007 2008 2009
CPI Industrial Workers Industrial Production Index Variation
Source: Central Statistical Organization. On the other hand, The Business Confidence Index (BCI) of the National Council of Applied Economic Research evidenced a strong drop during the last quarter of 2008 and early 2009. Despite this fact, it has been recovering during the past few weeks and this seems to point at an improvement in the prospects of economic agents. Other indicators that have been posted prior to the cycle – as is the case of the New Orders index,4 which is considered to be an early indicator of the economic activity – have also improved with respect to the first months of the year. By virtue of this, many analysts think that it is possible that the worst impact of the international crisis on the economy of India has already been felt; however a certain and definite conclusion in this regard cannot be drawn yet. As related to its external sector, India is facing a very severe contraction in the international demand for its products and services. According to the latest figures submitted by the WTO, world trade experienced a significant backward trend during the fourth quarter of 2008 and the first quarter of 2009. During the first quarter of this year, recorded imports accounted for 30% less than those reported for the same period of 2008. During the last quarter of 2008, the contraction accounted for 9%. Unlike what is projected by the EIU, the Reserve Bank of India estimates that as result of the increase in the deficit in merchandises and the moderation of the service balance there will be an increase in the current account deficit during 2009. In a press release issued on 1 June 2009, the Ministry of Trade and Industry of India submitted the figures of exports and imports for April 2009. During this latter month, India’s exports amounted to US$ 10.743 billion, which accounts for a contraction of 33,2% with respect to exports in 4 The New Orders Index.
India’s economy and relations with Latin America SP/RRREE-CHINA-INDIA-RUSIA-ALC/DT N° 3-09 and the Caribbean: Current status and prospects 23
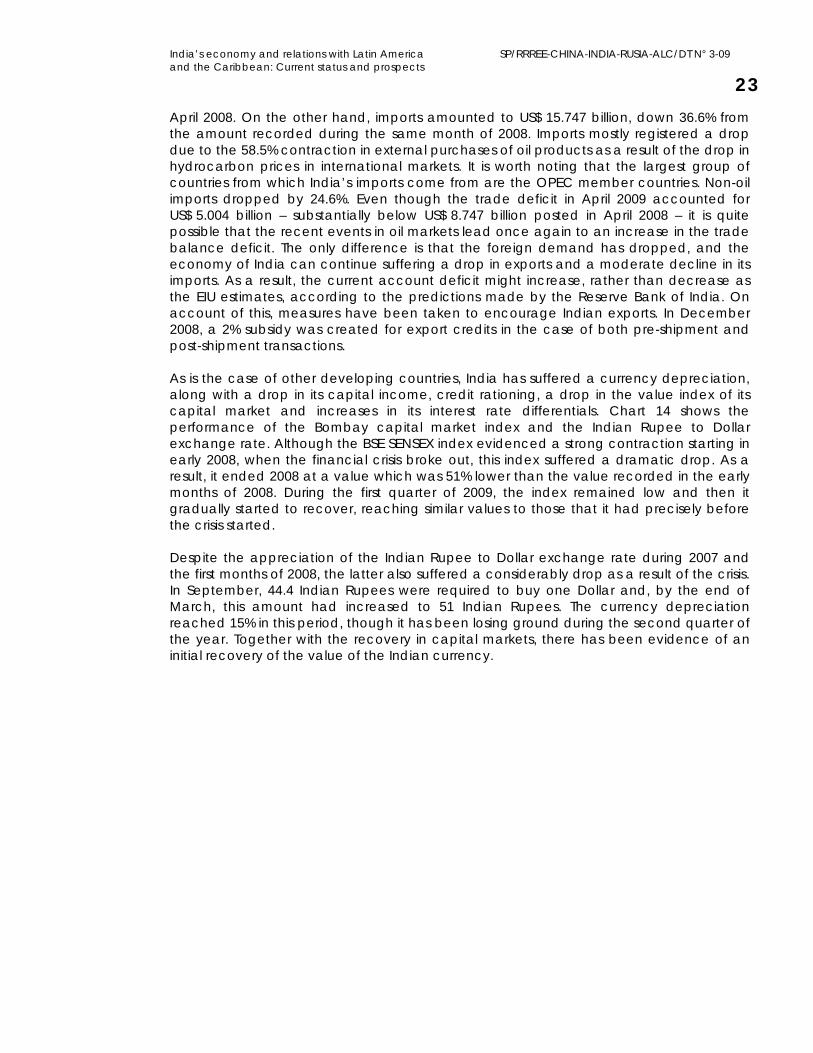
April 2008. On the other hand, imports amounted to US$ 15.747 billion, down 36.6% from the amount recorded during the same month of 2008. Imports mostly registered a drop due to the 58.5% contraction in external purchases of oil products as a result of the drop in hydrocarbon prices in international markets. It is worth noting that the largest group of countries from which India’s imports come from are the OPEC member countries. Non-oil imports dropped by 24.6%. Even though the trade deficit in April 2009 accounted for US$ 5.004 billion – substantially below US$ 8.747 billion posted in April 2008 – it is quite possible that the recent events in oil markets lead once again to an increase in the trade balance deficit. The only difference is that the foreign demand has dropped, and the economy of India can continue suffering a drop in exports and a moderate decline in its imports. As a result, the current account deficit might increase, rather than decrease as the EIU estimates, according to the predictions made by the Reserve Bank of India. On account of this, measures have been taken to encourage Indian exports. In December 2008, a 2% subsidy was created for export credits in the case of both pre-shipment and post-shipment transactions. As is the case of other developing countries, India has suffered a currency depreciation, along with a drop in its capital income, credit rationing, a drop in the value index of its capital market and increases in its interest rate differentials. Chart 14 shows the performance of the Bombay capital market index and the Indian Rupee to Dollar exchange rate. Although the BSE SENSEX index evidenced a strong contraction starting in early 2008, when the financial crisis broke out, this index suffered a dramatic drop. As a result, it ended 2008 at a value which was 51% lower than the value recorded in the early months of 2008. During the first quarter of 2009, the index remained low and then it gradually started to recover, reaching similar values to those that it had precisely before the crisis started. Despite the appreciation of the Indian Rupee to Dollar exchange rate during 2007 and the first months of 2008, the latter also suffered a considerably drop as a result of the crisis. In September, 44.4 Indian Rupees were required to buy one Dollar and, by the end of March, this amount had increased to 51 Indian Rupees. The currency depreciation reached 15% in this period, though it has been losing ground during the second quarter of the year. Together with the recovery in capital markets, there has been evidence of an initial recovery of the value of the Indian currency.
Permanent Secretariat Extra-regional Relations
24Chart N° 14: Foreign exchange rate and Bombay stock exchange index
30
35
40
45
50
55
Jan-
07
Mar
-07
May
-07
Jul-0
7
Sep
-07
Nov
-07
Jan-
08
Mar
-08
May
-08
Jul-0
8
Sep
-08
Nov
-08
Jan-
09
Mar
-09
May
-09
5.000
7.000
9.000
11.000
13.000
15.000
17.000
19.000
21.000
23.000
Rupees per Dollar BSE SENSEX
Source: Federal Reserve and Yahoo Finance.
In order to restore trust in financial markets, the Reserve Bank of India has responded with certain measures for ensuring greater liquidity. The short term interest rates have been lowered 361 base points from September 2008, to reach 4.95% in March 2009. In this regard, the Reserve Bank of India has followed the lead of the rest of the major central banks of the world that have tried to grant more liquidity to the markets in order to re-establish credits. In the last quarter of 2008 and the first quarter of 2009, public finances – both at central and general level – have been considerably impacted by the drop in economic growth. Coupled to this, a tax reduction has been implemented by the government as a mechanism to boost the economy, and expenses have been increased to encourage aggregate demand. In an attempt to promote counter-cyclical measures, a fiscal stimulus package for US$ 4.200 billion was implemented in December 2008.5 Almost 300 million dollars were made available to cover the orders of the Technological Update Fund of the textile sector. Likewise, the Infrastructure Finance Company of India was enabled to issue tax free bonds for US$ 2.100 billion in order to support investments in infrastructure under the modality of public and private joint ventures. In January 2009, the rules were modified in order to enable the states to contract debt for up to 3.5% of the gross domestic product, provided this amount would be devoted to capital expenses. Other measures were also implemented in order to grant greater
5 The amount of the additional expense is Rs 20,000 crore. In the Indian numeral system, a crore is equivalent to 107. Hence, the amount in dollars is derived after making this calculation and then dividing it into the exchange rate of Dollar for Indian Rupees.

India’s economy and relations with Latin America SP/RRREE-CHINA-INDIA-RUSIA-ALC/DT N° 3-09 and the Caribbean: Current status and prospects 25
flexibility to the states in the fiscal balances. In February 2009, the fiscal reductions that had been implemented in December 2008 were further expanded and additional reductions were established for several indirect taxes. It is worth stating that with strengthening of the Congress Party during the last legislative elections, the proposal of the 1% stimulus package of the GDP for US$ 10 billion started to acquire significance once again in order to foster public investment and infrastructure projects. The main purpose of all these measures is rendering the domestic demand more dynamic as it is the prime driving force for growth of the Indian economy. Although this type of activities are to be expected in view of the current global context, this does not imply that important costs will not be faced in the future associated to this expansion in expenses which will undoubtedly generate more tension in fiscal terms, especially when bearing in mind the recurrent situation of high budget deficits that have lately characterized the Indian economy. As a whole, indicators seem to point at the fact that although the Indian economy might endure the crisis without a recession, there are still some stress points that could generate problems further ahead. The recent increases in oil prices and other raw materials could even force an increase in the negative balance of the current account. The increase in the fiscal deficit and, consequently, in the public debt of the country could bring about problems that will be experienced at the medium and long term. Beyond those hurdles, the economy of India is still one of the most solid emerging economies with high growth. It still has a growth potential which is very important by world standards, and it is one of the economies with which Latin America and the Caribbean should have closer trade, investment and economic cooperation links. IV. INDIA’S ECONOMIC RELATIONS WITH LATIN AMERICA AND THE CARIBBEAN Despite the significance of India in the world context, the reality is that the economic relations of India with most of the countries in the region are at a very early stage. In this section, we will try to assess the areas for relations mentioned before. To this end, this analysis will address in the first place the considerations on reciprocal trade flows and, afterwards, the recent dynamics will be described in terms of capital flows. IV.1. Trade flows Trade flows are most probably the area of economic exchange that is relatively easier to analyze because there is normally a greater availability of reliable information in this respect. Trade flows between countries can be taken from the official sources of each country or directly from the Direction of Trade Statistics (DOTS) published by the International Monetary Fund. The figures that will be used as follows were taken from the latter source. India’s trade with the region is quite limited in relative terms. Nevertheless, it has been increasing significantly during the past few years. India’s exports to the world have grown in nominal terms during the past five years by 24.6%.6 During the last year, exports totalled US$ 183.084 billion. When compared with US$ 75.386 billion that were exported during 2004, we can have a clear idea of the dynamic growth of the export sector in India during this period. Only 3.2% of the total exports of this country have Latin America and the Caribbean as its final destination. During 2008, the total amount of exports to the region amounted to US$ 5.898 billion. Even though these figures do not appear to be
6 The 2008 figures correspond to the third yearly quarter.
Permanent Secretariat Extra-regional Relations
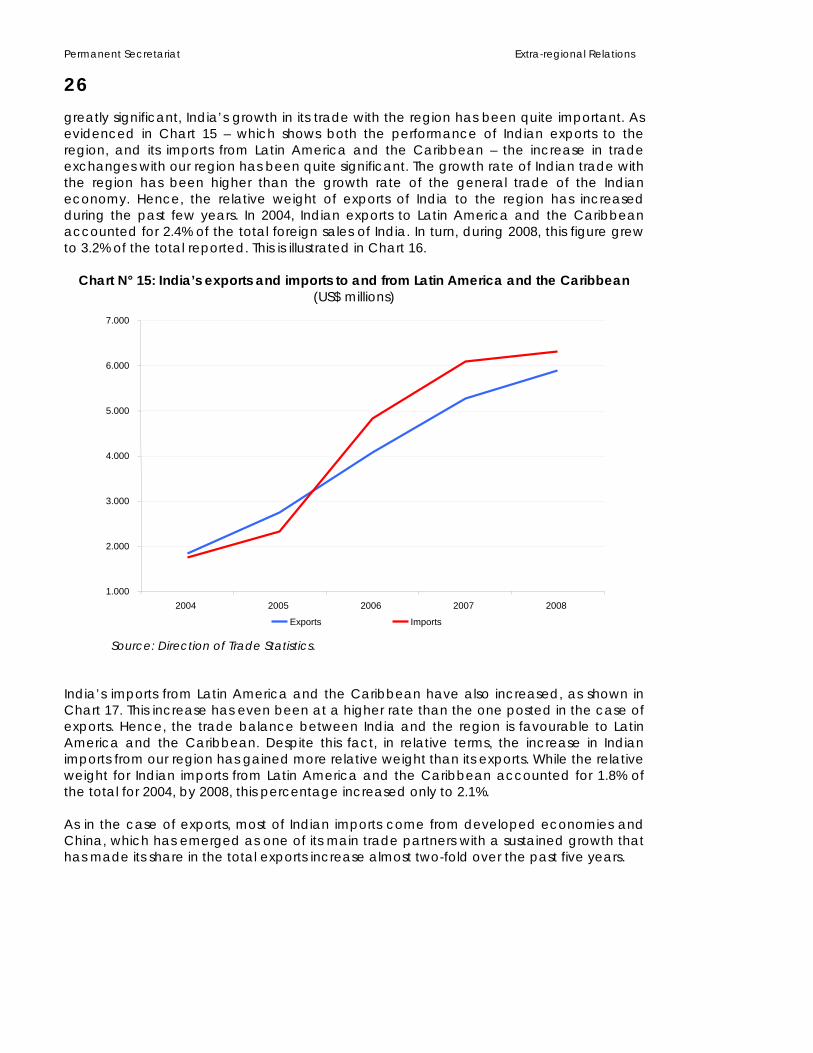
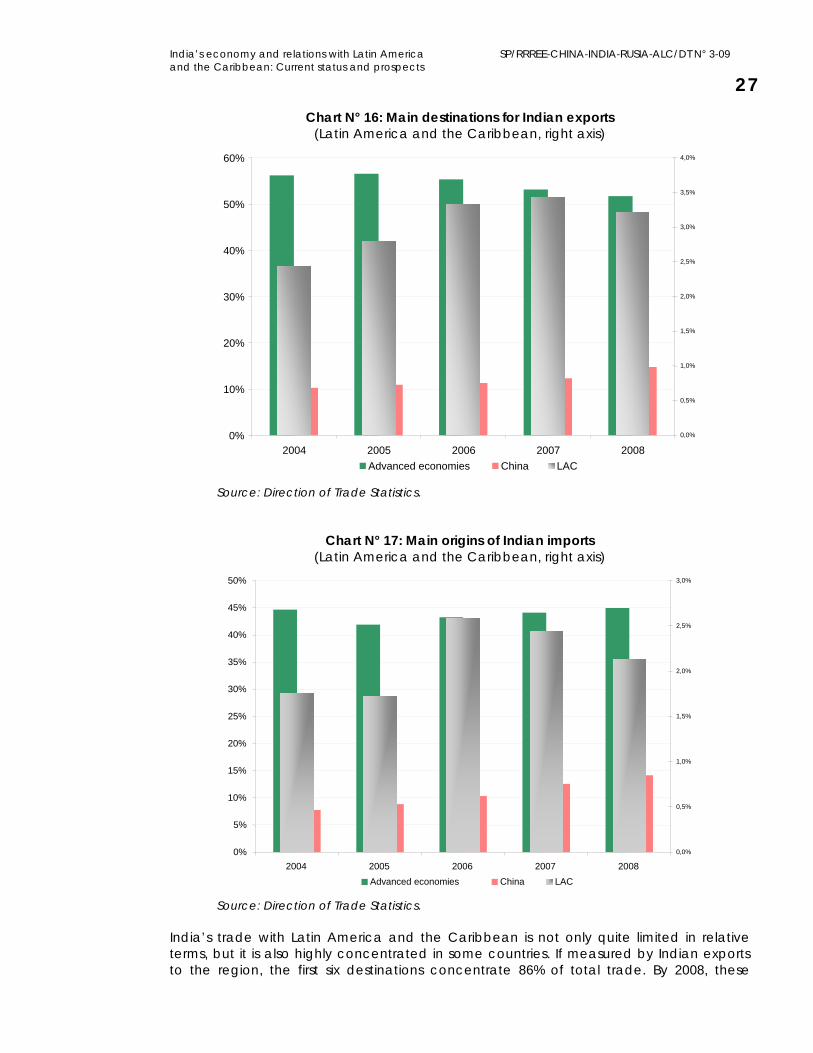
26greatly significant, India’s growth in its trade with the region has been quite important. As evidenced in Chart 15 – which shows both the performance of Indian exports to the region, and its imports from Latin America and the Caribbean – the increase in trade exchanges with our region has been quite significant. The growth rate of Indian trade with the region has been higher than the growth rate of the general trade of the Indian economy. Hence, the relative weight of exports of India to the region has increased during the past few years. In 2004, Indian exports to Latin America and the Caribbean accounted for 2.4% of the total foreign sales of India. In turn, during 2008, this figure grew to 3.2% of the total reported. This is illustrated in Chart 16.
Chart N° 15: India’s exports and imports to and from Latin America and the Caribbean
(US$ millions) 7.000
6.000
5.000
4.000
3.000
2.000
1.0002005 2004 2006 2007 2008
Source: Direction of Trade Statistics.
India’s imports from Latin America and the Caribbean have also increased, as shown in Chart 17. This increase has even been at a higher rate than the one posted in the case of exports. Hence, the trade balance between India and the region is favourable to Latin America and the Caribbean. Despite this fact, in relative terms, the increase in Indian imports from our region has gained more relative weight than its exports. While the relative weight for Indian imports from Latin America and the Caribbean accounted for 1.8% of the total for 2004, by 2008, this percentage increased only to 2.1%. As in the case of exports, most of Indian imports come from developed economies and China, which has emerged as one of its main trade partners with a sustained growth that has made its share in the total exports increase almost two-fold over the past five years.
Exports Imports
India’s economy and relations with Latin America SP/RRREE-CHINA-INDIA-RUSIA-ALC/DT N° 3-09 and the Caribbean: Current status and prospects 27
Chart N° 16: Main destinations for Indian exports (Latin America and the Caribbean, right axis)
60% 4,0%
3,5%
50%
3,0%
40%2,5%
30% 2,0%
1,5%
20%
1,0%
10%0,5%
0% 0,0%
2004 2008 2005 2006 2007LAC Advanced economies China
Source: Direction of Trade Statistics.
Chart N° 17: Main origins of Indian imports (Latin America and the Caribbean, right axis)
50% 3,0%
45%
2,5%40%
35%2,0%
30%
25% 1,5%
20%
1,0%15%
10%0,5%
5%
0% 0,0%
2004 2005 2006 2007 2008LAC Advanced economies China
Source: Direction of Trade Statistics.
India’s trade with Latin America and the Caribbean is not only quite limited in relative terms, but it is also highly concentrated in some countries. If measured by Indian exports to the region, the first six destinations concentrate 86% of total trade. By 2008, these
Permanent Secretariat Extra-regional Relations
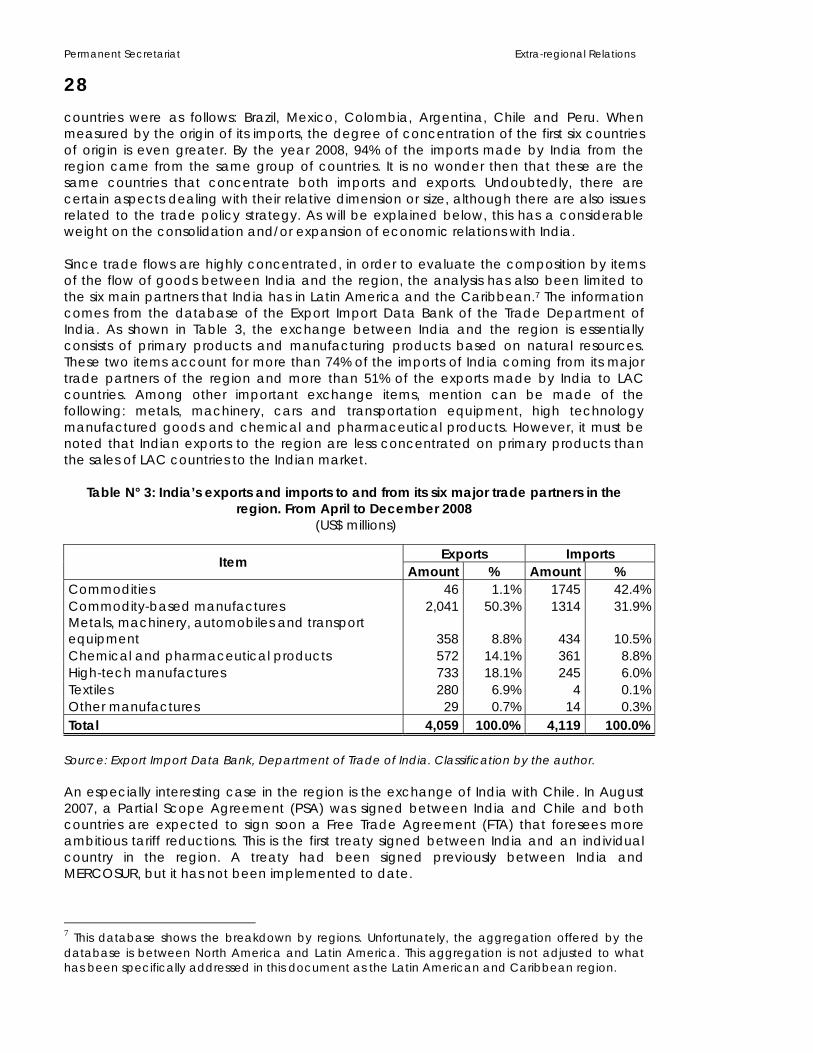
28countries were as follows: Brazil, Mexico, Colombia, Argentina, Chile and Peru. When measured by the origin of its imports, the degree of concentration of the first six countries of origin is even greater. By the year 2008, 94% of the imports made by India from the region came from the same group of countries. It is no wonder then that these are the same countries that concentrate both imports and exports. Undoubtedly, there are certain aspects dealing with their relative dimension or size, although there are also issues related to the trade policy strategy. As will be explained below, this has a considerable weight on the consolidation and/or expansion of economic relations with India. Since trade flows are highly concentrated, in order to evaluate the composition by items of the flow of goods between India and the region, the analysis has also been limited to the six main partners that India has in Latin America and the Caribbean.7 The information comes from the database of the Export Import Data Bank of the Trade Department of India. As shown in Table 3, the exchange between India and the region is essentially consists of primary products and manufacturing products based on natural resources. These two items account for more than 74% of the imports of India coming from its major trade partners of the region and more than 51% of the exports made by India to LAC countries. Among other important exchange items, mention can be made of the following: metals, machinery, cars and transportation equipment, high technology manufactured goods and chemical and pharmaceutical products. However, it must be noted that Indian exports to the region are less concentrated on primary products than the sales of LAC countries to the Indian market.
Table N° 3: India’s exports and imports to and from its six major trade partners in the
region. From April to December 2008 (US$ millions)
Exports Imports Item Amount % Amount %
Commodities 46 1.1% 1745 42.4% Commodity-based manufactures 2,041 50.3% 1314 31.9% Metals, machinery, automobiles and transport equipment 358 8.8% 434 10.5% Chemical and pharmaceutical products 572 14.1% 361 8.8% High-tech manufactures 733 18.1% 245 6.0% Textiles 280 6.9% 4 0.1% Other manufactures 29 0.7% 14 0.3% Total 4,059 100.0% 4,119 100.0%
Source: Export Import Data Bank, Department of Trade of India. Classification by the author. An especially interesting case in the region is the exchange of India with Chile. In August 2007, a Partial Scope Agreement (PSA) was signed between India and Chile and both countries are expected to sign soon a Free Trade Agreement (FTA) that foresees more ambitious tariff reductions. This is the first treaty signed between India and an individual country in the region. A treaty had been signed previously between India and MERCOSUR, but it has not been implemented to date.
7 This database shows the breakdown by regions. Unfortunately, the aggregation offered by the database is between North America and Latin America. This aggregation is not adjusted to what has been specifically addressed in this document as the Latin American and Caribbean region.
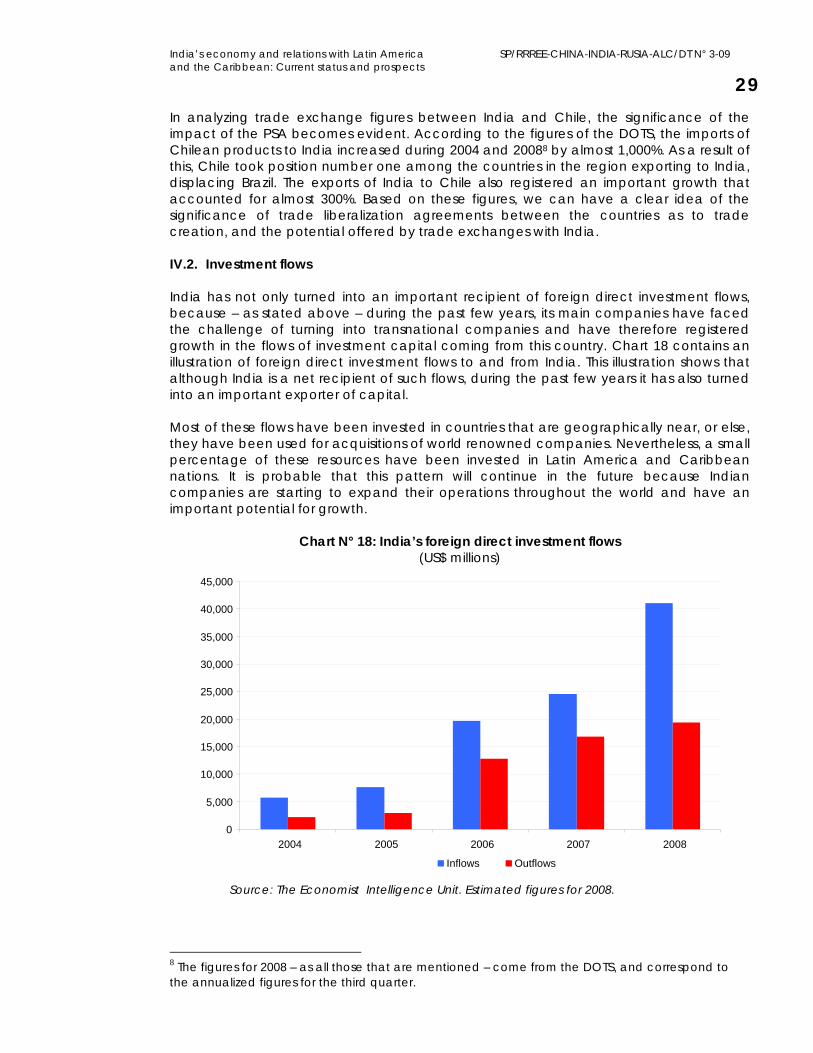
India’s economy and relations with Latin America SP/RRREE-CHINA-INDIA-RUSIA-ALC/DT N° 3-09 and the Caribbean: Current status and prospects 29In analyzing trade exchange figures between India and Chile, the significance of the impact of the PSA becomes evident. According to the figures of the DOTS, the imports of Chilean products to India increased during 2004 and 20088 by almost 1,000%. As a result of this, Chile took position number one among the countries in the region exporting to India, displacing Brazil. The exports of India to Chile also registered an important growth that accounted for almost 300%. Based on these figures, we can have a clear idea of the significance of trade liberalization agreements between the countries as to trade creation, and the potential offered by trade exchanges with India. IV.2. Investment flows India has not only turned into an important recipient of foreign direct investment flows, because – as stated above – during the past few years, its main companies have faced the challenge of turning into transnational companies and have therefore registered growth in the flows of investment capital coming from this country. Chart 18 contains an illustration of foreign direct investment flows to and from India. This illustration shows that although India is a net recipient of such flows, during the past few years it has also turned into an important exporter of capital. Most of these flows have been invested in countries that are geographically near, or else, they have been used for acquisitions of world renowned companies. Nevertheless, a small percentage of these resources have been invested in Latin America and Caribbean nations. It is probable that this pattern will continue in the future because Indian companies are starting to expand their operations throughout the world and have an important potential for growth.
Chart N° 18: India’s foreign direct investment flows (US$ millions)
45,000
40,000
35,000
30,000
25,000
20,000
15,000
10,000
5,000
0 2004 2007 2005 2006 2008
Inflows Outflows
Source: The Economist Intelligence Unit. Estimated figures for 2008.
8 The figures for 2008 – as all those that are mentioned – come from the DOTS, and correspond to the annualized figures for the third quarter.

Permanent Secretariat Extra-regional Relations
30Unlike what is happening with the flows of goods and services, the information regarding capital flows is more difficult to access. There is no database that has been regularly updated – unlike the case of the DOTS – which would make it possible to determine matrixes of capital flows. Among other things, this is due to the fact that flows can come from a country that is only an intermediary. This section includes a summary about the main Indian companies operating in the region and their more recent transactions. This is not an all-inclusive list, but it contains the most important investments made by the main Indian companies in Latin America and the Caribbean. Whereas India is not one of the major investors in the region – except maybe in the case of Trinidad and Tobago – its presence has been increasing during the past few years. India is a world leader in service outsourcing companies. As a result, it was to be expected that most of Indian investments in the region have been carried out by the main companies that operate in this sector. Additionally, India has important consulting service companies that have gradually started to set up in the region to render services to both the public sector and the private sector. Tata Consultancy Services has been one of the Indian companies with a strong presence in Latin America and the Caribbean. The company was a pioneer in the trend of investments of this Asian country in the region and it paved the way for others when it opened operations in Brazil in the nineties. Currently, this company has operations in Mexico, Argentina, Brazil, Chile, Ecuador, Colombia and Uruguay.9 It is expected to expand its activities and set up operations in Peru.10 In turn, 24/7 Costumer – a company supplying remote customer services – opened operations in Guatemala in the year 2008.11 Wipro Technologies Ltd. has operations in Mexico and Brazil. This software development firm set up operations in 2007 in Monterrey, Mexico, to service North America and Latin America, and it has a payroll of approximately 1,000 employees.12 Infosys Technologies also opened operations in Monterrey, Mexico. This company plans to expand its operations in Mexico and Brazil by means of acquisitions. In the case of Brazil, it is expecting to start operations before the end of 2009.13 Satyam Computer Services Ltd. set up the Satyam Latam Centre in San Paulo, Brazil, to offer services to both Brazil and the countries in the region.14 Evalueserve –a market research company that also carries out other activities – started operations in Chile in 2007. It is located in Valparaiso and it currently generates 10% of the global sales of the company and hires 6% of its labour force.15 Another area where important Indian investments have been made in the region is mining and hydrocarbons. The Indian economy needs to count on stable sources for supply of raw materials, and our region is particularly rich in these resources. This is the reason that has led to many of the major investments and acquisitions made by Indian transnational companies in the region. In the area of hydrocarbons, the major player is Oil and Natural Gas Corporation Ltd. (ONGC). During 2006, ONGC signed an agreement to explore Cuban waters in the Gulf of Mexico looking for oil. This area covers a surface of
9 http://www.tcs.com/worldwide/s_america/locations/Pages/default.aspx 10 http://nuevaspymes.blogspot.com/2008/04/tata-consultancy-services-de-la-india.html 11 http://www.centralamericadata.com/es/article/home/247_Customer_starts operations in Guatemala 12 http://www.networkworld.com/news/2007/091107-wipro-expands-into.html 13 http://www.moneycontrol.com/mccode/news/article/news_article.php?autono=401816&special=highlights 14 http://www.itnewsonline.com/news/Satyam-Opens-Satyam-Latam-Development-Center-in-Sao-Paulo,-Brazil/9255/8/8 15 http://india.bcn.cl/noticias/economia-y-negocios/evalueserve-servicios-indios-chile
India’s economy and relations with Latin America SP/RRREE-CHINA-INDIA-RUSIA-ALC/DT N° 3-09 and the Caribbean: Current status and prospects 31
4,300 square kilometres.16 In 2008, this company invested the amount of US$ 356 million to acquire 40% of a joint development with PDVSA in the fields of San Cristóbal and Junín, both belonging to the Orinoco Oil Belt. ONGC – together with Sinopec – acquired Colombian oil company Omimex in 2006. This company has proven reserves accounting for more than 300 million barrels and an approximately daily production of 20,000 barrels. Additionally, in 2007, the company was awarded a deep water block and a shallow water block in the ninth round of the bidding process opened by the Agencia Nacional do Petroleo de Brasil.17 ONGC – along with the Indian Oil Corporation, Oil India, and Reliance Industries – is thinking about a joint investment in the Orinoco Oil Belt. The investments for this project would account for US$ 16 to 18 billion.18 Furthermore, the company Videocon Industries Ltd. and Bharat Petroresources – both belonging to the BPCL consortium – were awarded an exploration contract in Brazil for US$ 283 million. Both acquired all of the shares of Encana Brasil Petróleo Limitada that belongs, in turn, to the company Encana and Alberta from Canada.19 It is also worth mentioning that important investments have also been made in Peru and Colombia in the area of hydrocarbons. Jindal Steel and Power Ltd. joined efforts with Enigma Oil and Gas Exploration Ltd. in order to be awarded blocks 147, 159 and 153 in the round of bids opened for oil and gas in Peru during 2008. Reliance Industries Ltd. joined efforts with China Nacional Petroleum Corporation and Pluspetrol Energy in order to be awarded block 155 in Puno. Additionally, in June 2008, it acquired 10% of block 39. In May of that same year, Burligton Resources Inc. set up an alliance with Woodside Petroleum to acquire 50% of block 108 from Pluspetrol Energy, the company that had acquired 90% of block 141 from Pan Andean Resources Plc. in April that year.20 In 2005, Reliance Industries Ltd. signed a technical evaluation agreement which has turned into a production and exploration agreement with the National Hydrocarbon Agency (ANH for its Spanish acronym) of Colombia. The blocks that have been included under this agreement are Borojo Norte and Borojo Sur. The petrochemical company GAIL (India) announced its plans to build a petrochemical complex in Colombia, along with a gas pipeline network. The announcement was made in September 2008.21 Along with the hydrocarbons sector, mining – another key branch of the economy – concentrates important Indian capital flows in the region. The Indian iron and steel company Ispat Industries Ltd. will start operations for iron extraction in Brazil and carbon exploitation in Colombia.22 The mine in Brazil has reserves for approximately 300 to 500 million tons, while the Colombian mine ranges between 60 and 70 million. Another company that operates in the same industry – Essar Steel Ltd. – is planning to set up a plant for producing 2.5 million tons of plain steel and steel products in Trinidad and Tobago.23 The company was awarded a mining concession in Amapa, located in the North of Brazil, and the material of Amapa will be processed in the plant in Trinidad and Tobago. The area that has been awarded covers more than 7,850 hectares. JSW Steel
16 http://findarticles.com/p/articles/mi_hb5140/is_4_14/ai_n29292744/ 17 http://www.thaindian.com/newsportal/business/ongc-videsh-wins-two-exploration-blocks-in-brazil_1007012.html 18 http://www.rigzone.com/news/article.asp?a_id=74946 19 http://www.india-server.com/news/videocon-bpcl-consortium-buys-brazil-3884.html 20 http://www.rediff.com/money/2008/sep/18reliance2.htm 21 http://www.business-standard.com/india/news/gail-india-plans-petrochem-project-in-colombia/333598/ 22 http://news.oneindia.in/2008/08/28/ispat-to-mine-iron-ore-and-coal-in-latin-america-and-africa-1219944706.html 23 http://www.essar.com/steel/plants_overseas_Caribbean.htm
Permanent Secretariat Extra-regional Relations
32obtained the licence for exploring and extracting magnetite in the Northern Chile, specifically in the region of Atacama. The amount of the transaction for obtaining the licence of the 1,200 hectares was US$ 53 million. This licence was awarded in 2008, and mention has been made of future plans for continuing expanding its operations in the region.24 A steel company – Arcelor Mittal – acquired Acindar in Argentina for an amount equivalent to US$ 543 million.25 Jindal Steel and Power Limited signed a mining agreement with the government of Bolivia for exporting 10 million tons of iron ore per year from the El Mutun bed. It is estimated that approximately US$ 2.1 million will be invested from 2007 through 2011.26 In the construction sector, engineering and construction firm Larsen and Toubro was awarded a project for supplying equipment to Petrobras in 2008. Additionally, early this year, the company started operations in Brazil, where it is planning to set up its oil and gas, cement and paper divisions.27 The Indian company DS Construction – together with Israd Corp. from Israel – acquired assets for power generation in Brazil.28 In the sector of machinery, equipment and transportation vehicles, investments have also increased in the past few years. The vehicles of Tata Motors are being sold in several Latin American and Caribbean countries. The company has also forged an agreement for joint production with Fiat to refloat the Fiat’s plant that operates in Córdoba, Argentina.29 The company Bajaj Auto – that manufactures motorcycles in India – entered an association agreement with the Guerrero Group in order to assemble motorcycles in Argentina. Furthermore, Mahindra & Mahindra Ltd, – which manufactures all-terrain vehicles and tractors – joined efforts with the company Bramont, and they have set up an assembly plant in Manaus, Brazil. They have also foreseen to additionally manufacture tractors together with the Venezuelan company Corporación Elice 2222 on Margarita Island.30 In the area of pharmaceutical companies – where India has a wide experience in the production of generic drugs – Ranbaxy Laboratories Limited started up operations in Brazil in 2000. Currently, it is the sixth largest company of generic drugs in Brazil and it directly hires 130 employees.31 United Phosphorous Ltd., which produces chemical products and agricultural products, has set up two operating plants in Argentina, one in Reposo and the other one in Icona. Additionally, it started operations in Brazil back in 2003.32 In the field of renewable energy, Indian Oil Ltd. is currently exploring the possibility of setting up an ethanol refinery in Brazil33, while Praj Industries Ltd established a joint venture with Jaragua Equipamentos Industriais Ltda. to build an ethanol plant in Brazil.34 With respect to the participation of companies from our region that are investing in India, it is clear that the group is considerably smaller. Special mention must be made of a joint company between the Brazilian manufacturer of buses Marcopolo and Tata Motors, which started to produce buses in India in 2008 in its plant located in Dharwad. This plant
24 http://in.rediff.com/money/2008/jan/17jindal.htm 25 ECLAC 2007 26 http://www.adnmundo.com/contenidos/economia/jindal_steel_bolivia_inversiones_200707_ec.html 27 http://www.india-server.com/news/larsen-and-toubro-to-foray-into-brazil-4284.html 28 ECLAC 2008 29 http://www.pergaminovirtual.com.ar/revista2/cgi-bin/hoy/archivos/00001104.shtml 30 http://www.guiamotor.com/flashmotor/Noticia.aspx?IdNoticia=17613 31 http://www.ranbaxy.com/operations/operationcountry.aspx?Cid=149&flag=&Rid=77 32 http://www.uplonline.com/index.php3?pgidee=upllatin 33 http://www.topnews.org/content/2202-indian-oil-set-refinery-ethanol-brazil 34 http://news.mongabay.com/bioenergy/2007/06/indias-praj-industries-creates-biofuel.html

India’s economy and relations with Latin America SP/RRREE-CHINA-INDIA-RUSIA-ALC/DT N° 3-09 and the Caribbean: Current status and prospects 33
has the capacity to manufacture 30,000 units per year and generate 6,500 direct jobs. The Grupo Gerdau – Brazil’s largest steel manufacturer – and the Indian company Kalyan Group signed a contract for a joint venture for US$ 170 million to operate SJK Steel Plant Limited in the city of Tadipatri, state of Andhra Pradesh.35 In June 2007, Petrobras and ONGC signed an agreement that would grant them joint participation in exploration blocks, which marked the beginning of oil operations by Brazil in Indian territory.36 V. SELA’S PROPOSALS TO STRENGTHEN ECONOMIC RELATIONS BETWEEN LATIN AMERICA
AND THE CARIBBEAN AND INDIA In addition to an emblematic culture and a great history, India is a giant that has started to gain ground in the global economy. It is the second most populated nation in the world, and a substantial market for all the companies willing to have some clout in the world market. However, most of India is still poor, with some ethnic clashes and enormous restrictions to its full-fledged development. Fortunately, its tremendous development over the past few years has helped improve the living conditions of most people who used to live below the poverty line. India has also become a global major exporter, mostly of services, and a major importer. It is a recipient of capital for investment and has lately become a major importer of capital. Finally, while the current economic crisis will have untoward effects on India, they will be not as severe as expected elsewhere in the world. The Indian economy is estimated to continue growing, yet at a slower pace in the short time. India’s economic relations with Latin America and the Caribbean are new, but noteworthy. Despite a tiny trade, its growth rate is not insignificant in percentage terms. Some examples of policies and agreements in the region show the potential of substantial quantitative leaps in trade relations. Also, still limited investment flows have increased. They are basically composed of incoming Indian capital into the region, but some efforts at expansion have been made by Latin American and Caribbean companies in the Asian country. Therefore, India provides a great opportunity for diversification and an incentive to economic relations outside the LAC region. In order to cash in on these potentials, governments, both jointly and severally, need to take actions or initiatives to power benefits and minimize any risks inherent in every economic exchange in times of globalization. Among the main issues herein discussed about the recent trends in the Indian economy and its relations with Latin American and Caribbean nations, three primary work areas should be included in a regional strategy – under the umbrella of SELA – to enhance said relations. 1.- Firstly, information and knowledge of the economic, political and social status of India should be expanded and disseminated in the LAC region. Such dissemination of information, experiences and knowledge would be helpful to set national and regional
35http://www.gerdau.com.br/esp/noticia/noticias_geral_pop.asp?cd_noticias=1761&categoria=12&site=SI 36 http://www.expressindia.com/news/fullstory.php?newsid=87656
Permanent Secretariat Extra-regional Relations
34strategies aimed at capitalizing on the India-LAC economic exchange. In this regard, the following should be considered:
a) Joint efforts and cooperation to better understand the economic status of India should be related, not only to the substantial economic progress, but also to the successful reduction of poverty in the Asian region. The latter is of the essence, as the political agenda of the LAC region includes a higher profile in world economic exchange, diversified foreign relations and, most important, making strides to shorten the historical social gap that hinders the Latin American and Caribbean development. b) In order to expand and disseminate information, experiences and knowledge of India, the Permanent Secretariat is recommended to provide Member States with the expert services of the SELA’s Information and Knowledge Network, including relevant systematized information about LAC integration and trade exchange. Based on this, any information in addition to that included last year in the data base about the Indian experience in public policies to reduce poverty is highly advisable. c) A thought should be spared about the criteria and predominant principles in the Indian current trade policy. The trade agreements that have been reached or are being discussed between India and some Latin American and Caribbean countries, and the general trends of the Indian government in the field of trade policy should be continuously analyzed. Any input from the governments of Chile and MERCOSUR –the only sub regional integration bloc that has discussed a free trade agreement with India- would be very useful for such purposes. 2.- Secondly, and linked with the foregoing, SELA, as a regional organization, should try to hold frequent discussions and keep a coordination mechanism with its Member States with regard to the assets and potentials of increasing economic relations with India. a) As a regional organization for consultation and coordination, SELA should ponder on the possibility of convening every two years a Regional Meeting to assess the Indian economic development and the dynamics, changes and main restrictions to the economic relations between LAC countries and India. b) This type of standing regional sessions hosted by SELA would be crucial to consider also the differences between national legal systems, policies and views of decision-makers about the benefits of a closer economic relationship with India, particularly for smaller, less economically diversified countries in the LAC region. c) As soon as there is good timing, SELA Member States could weigh the possibility of a regional programme within the context of SELA, under the aegis of Indian authorities, to expand bilateral economic relations. 3.- Last, based on the definition of systematic actions, increasing interaction should be encouraged between Latin American and Indian economic and social parties, including, among others, public officials, businessmen and academicians. Sure enough, a stronger interaction between the relevant parties will need proper coordination and intertwined policies among the government agencies of SELA Member States responsible for economic issues and foreign policy. a) Note that some restrictions to said interaction have been acknowledged as to the scope, particularly management and impact, of the local, national and regional, public and private, parties involved. This prompts the generation of synergies among the parties
India’s economy and relations with Latin America SP/RRREE-CHINA-INDIA-RUSIA-ALC/DT N° 3-09 and the Caribbean: Current status and prospects 35
so as to take an actual part in the making and implementation of mechanisms to foster relations with India. For this reason, an encouraging pat on the interaction between LAC and Indian parties would be a decisive step for their increasing involvement in taking and implementing initiatives to further bilateral links. b) In this regard, and reaping the benefit of the SELA-IBERPYME experience, any meetings between Indian and LAC small and medium-sized businesses are advisable. Also, representatives of business associations from Latin America and the Caribbean could attend some of the main industrial fairs and meetings that are held in India. Contacts should be made with the India Trade Promotion Organization (ITPO), and three major industrial and business associations: a) Indian Chamber of Commerce, b) Federation of Indian Chambers of Commerce and Industry (FICCI), and c) The Associated Chambers of Commerce and Industry of India (ASSOCHAM). c) Also, and bearing in mind the major historical role of India in multiple forums on South-South cooperation, Indian agencies and persons in the field of economic and technical cooperation could frequently participate in the annual Latin American and Caribbean meetings on international cooperation hosted by SELA. d) Of course, any move towards increasing interaction between LAC and Indian public and private major economic parties, prompts consideration of available funds to implement the proposed actions. This entails joint efforts at planning and management of funds where regional integration schemes, business associations and international agencies should play a decisive role. VI. CONCLUSIONS The Indian economy has significantly grown over the past few years and it seems that the effects of the global economic crisis on that nation will not be as severe as on Latin American and the Caribbean countries. As a matter of fact, recent estimates point to economic slowdown this year, but in no event there will be economic shrinkage. Even, surveys conducted by expert agencies found that the Indian economy has coped with the crisis better than most Asian nations, mostly due to a strong domestic demand. High capital accumulation rates and a sound development in the service sector, part of which is in the process of marked internationalization, substantiate the recent, strong economic growth in India. Exports and imports have also soared. In addition to wider participation in the world trade, India has a fair share in capital flows, particularly foreign direct investment (FDI). Based on the analysis on India-LAC relations and no matter the importance of India in the world context, economic relations between India and most Latin American and Caribbean nations are in their early stage. In fact, the India-LAC trade is lean in relative terms and highly focused on few countries. However, it should be noted that bilateral trade has lately heightened, even at higher rates compared with total foreign trade. While India is a net recipient of foreign direct investment, it has lately become a major capital exporter. Most of the investment goes to neighbouring countries or has been used to buy world-class firms. In any case, a small percentage of these funds have been invested in some Latin American and Caribbean nations.
Permanent Secretariat Extra-regional Relations
36India provides a great opportunity for the requisite diversification of foreign economic relations. However, governments, jointly and collectively, need to take actions or initiatives in order to seize the opportunity. Three major areas of action where SELA could play a major role as a regional cooperation organization are, namely: a) expansion and dissemination of information and knowledge across the LAC region about the economic, political and social status of India; b) standing mechanism of discussion and coordination among the LAC governments concerning the assets and potentials of closer economic ties with India, and c) increasing interaction between LAC and Indian economic and social counterparts.
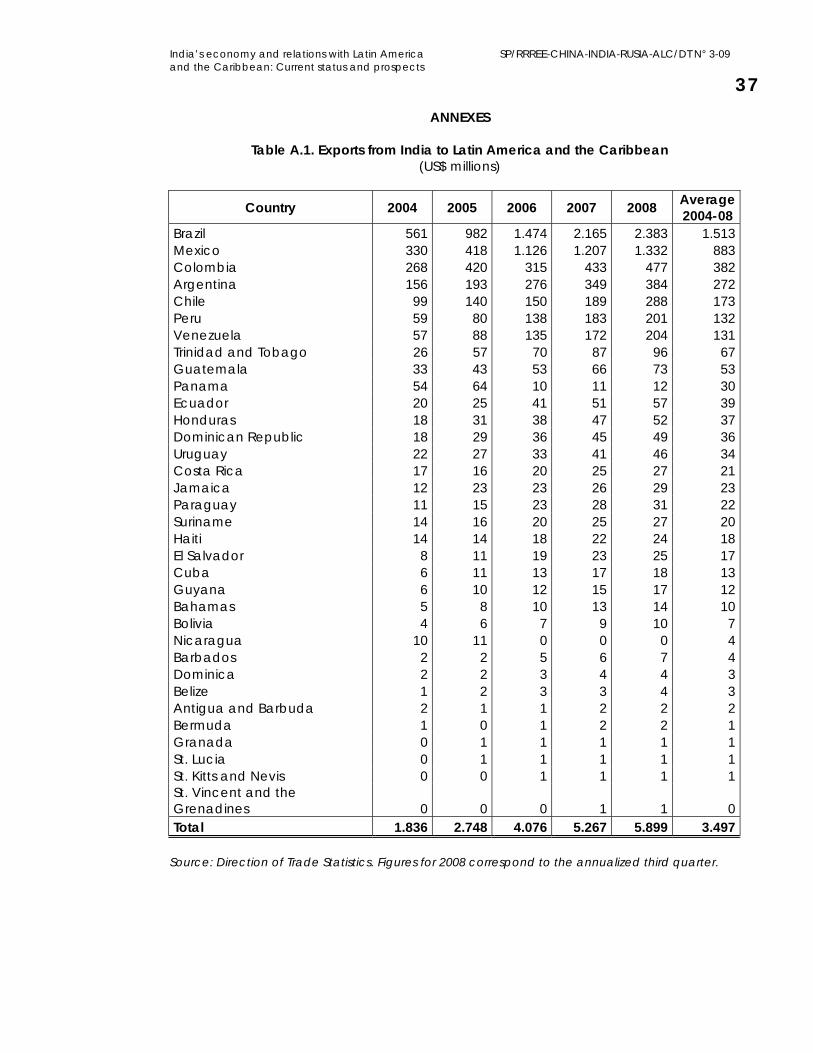
India’s economy and relations with Latin America SP/RRREE-CHINA-INDIA-RUSIA-ALC/DT N° 3-09 and the Caribbean: Current status and prospects 37
ANNEXES
Table A.1. Exports from India to Latin America and the Caribbean (US$ millions)
Country 2004 2005 2006 2007 2008 Average 2004-08
Brazil 561 982 1.474 2.165 2.383 1.513 Mexico 330 418 1.126 1.207 1.332 883 Colombia 268 420 315 433 477 382 Argentina 156 193 276 349 384 272 Chile 99 140 150 189 288 173 Peru 59 80 138 183 201 132 Venezuela 57 88 135 172 204 131 Trinidad and Tobago 26 57 70 87 96 67 Guatemala 33 43 53 66 73 53 Panama 54 64 10 11 12 30 Ecuador 20 25 41 51 57 39 Honduras 18 31 38 47 52 37 Dominican Republic 18 29 36 45 49 36 Uruguay 22 27 33 41 46 34 Costa Rica 17 16 20 25 27 21 Jamaica 12 23 23 26 29 23 Paraguay 11 15 23 28 31 22 Suriname 14 16 20 25 27 20 Haiti 14 14 18 22 24 18 El Salvador 8 11 19 23 25 17 Cuba 6 11 13 17 18 13 Guyana 6 10 12 15 17 12 Bahamas 5 8 10 13 14 10 Bolivia 4 6 7 9 10 7 Nicaragua 10 11 0 0 0 4 Barbados 2 2 5 6 7 4 Dominica 2 2 3 4 4 3 Belize 1 2 3 3 4 3 Antigua and Barbuda 2 1 1 2 2 2 Bermuda 1 0 1 2 2 1 Granada 0 1 1 1 1 1 St. Lucia 0 1 1 1 1 1 St. Kitts and Nevis 0 0 1 1 1 1 St. Vincent and the Grenadines 0 0 0 1 1 0 Total 1.836 2.748 4.076 5.267 5.899 3.497 Source: Direction of Trade Statistics. Figures for 2008 correspond to the annualized third quarter.
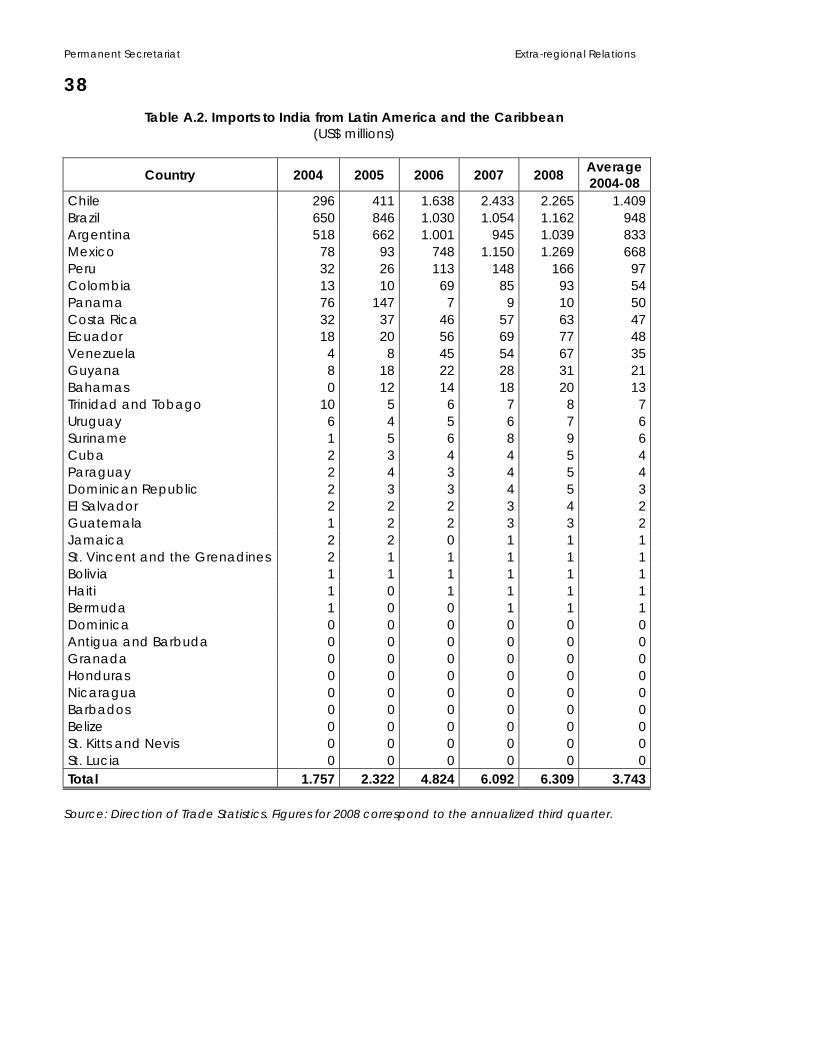
Permanent Secretariat Extra-regional Relations
38Table A.2. Imports to India from Latin America and the Caribbean
(US$ millions)
Country 2004 2005 2006 2007 2008 Average 2004-08
Chile 296 411 1.638 2.433 2.265 1.409 Brazil 650 846 1.030 1.054 1.162 948 Argentina 518 662 1.001 945 1.039 833 Mexico 78 93 748 1.150 1.269 668 Peru 32 26 113 148 166 97 Colombia 13 10 69 85 93 54 Panama 76 147 7 9 10 50 Costa Rica 32 37 46 57 63 47 Ecuador 18 20 56 69 77 48 Venezuela 4 8 45 54 67 35 Guyana 8 18 22 28 31 21 Bahamas 0 12 14 18 20 13 Trinidad and Tobago 10 5 6 7 8 7 Uruguay 6 4 5 6 7 6 Suriname 1 5 6 8 9 6 Cuba 2 3 4 4 5 4 Paraguay 2 4 3 4 5 4 Dominican Republic 2 3 3 4 5 3 El Salvador 2 2 2 3 4 2 Guatemala 1 2 2 3 3 2 Jamaica 2 2 0 1 1 1 St. Vincent and the Grenadines 2 1 1 1 1 1 Bolivia 1 1 1 1 1 1 Haiti 1 0 1 1 1 1 Bermuda 1 0 0 1 1 1 Dominica 0 0 0 0 0 0 Antigua and Barbuda 0 0 0 0 0 0 Granada 0 0 0 0 0 0 Honduras 0 0 0 0 0 0 Nicaragua 0 0 0 0 0 0 Barbados 0 0 0 0 0 0 Belize 0 0 0 0 0 0 St. Kitts and Nevis 0 0 0 0 0 0 St. Lucia 0 0 0 0 0 0 Total 1.757 2.322 4.824 6.092 6.309 3.743 Source: Direction of Trade Statistics. Figures for 2008 correspond to the annualized third quarter.
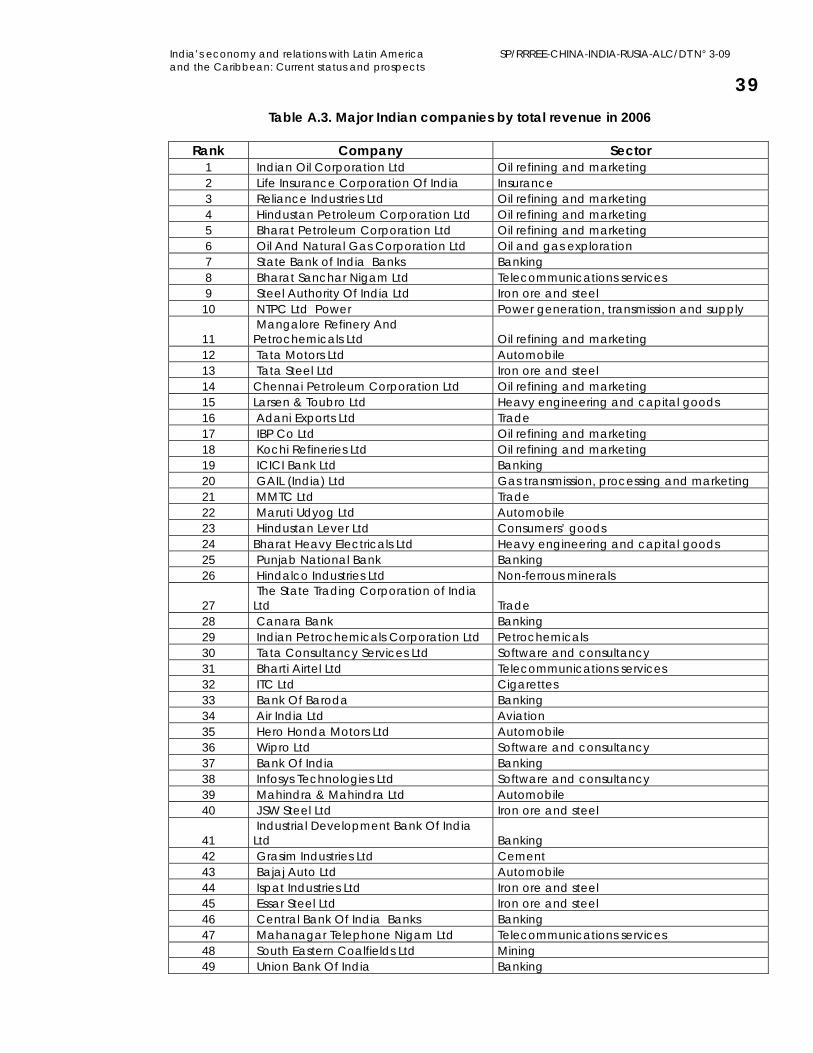
India’s economy and relations with Latin America SP/RRREE-CHINA-INDIA-RUSIA-ALC/DT N° 3-09 and the Caribbean: Current status and prospects 39
Table A.3. Major Indian companies by total revenue in 2006
Rank Company Sector 1 Indian Oil Corporation Ltd Oil refining and marketing 2 Life Insurance Corporation Of India Insurance 3 Reliance Industries Ltd Oil refining and marketing 4 Hindustan Petroleum Corporation Ltd Oil refining and marketing 5 Bharat Petroleum Corporation Ltd Oil refining and marketing 6 Oil And Natural Gas Corporation Ltd Oil and gas exploration 7 State Bank of India Banks Banking 8 Bharat Sanchar Nigam Ltd Telecommunications services 9 Steel Authority Of India Ltd Iron ore and steel
10 NTPC Ltd Power Power generation, transmission and supply
11 Mangalore Refinery And Petrochemicals Ltd Oil refining and marketing
12 Tata Motors Ltd Automobile 13 Tata Steel Ltd Iron ore and steel 14 Chennai Petroleum Corporation Ltd Oil refining and marketing 15 Larsen & Toubro Ltd Heavy engineering and capital goods 16 Adani Exports Ltd Trade 17 IBP Co Ltd Oil refining and marketing 18 Kochi Refineries Ltd Oil refining and marketing 19 ICICI Bank Ltd Banking 20 GAIL (India) Ltd Gas transmission, processing and marketing 21 MMTC Ltd Trade 22 Maruti Udyog Ltd Automobile 23 Hindustan Lever Ltd Consumers’ goods 24 Bharat Heavy Electricals Ltd Heavy engineering and capital goods 25 Punjab National Bank Banking 26 Hindalco Industries Ltd Non-ferrous minerals
27 The State Trading Corporation of India Ltd Trade
28 Canara Bank Banking 29 Indian Petrochemicals Corporation Ltd Petrochemicals 30 Tata Consultancy Services Ltd Software and consultancy 31 Bharti Airtel Ltd Telecommunications services 32 ITC Ltd Cigarettes 33 Bank Of Baroda Banking 34 Air India Ltd Aviation 35 Hero Honda Motors Ltd Automobile 36 Wipro Ltd Software and consultancy 37 Bank Of India Banking 38 Infosys Technologies Ltd Software and consultancy 39 Mahindra & Mahindra Ltd Automobile 40 JSW Steel Ltd Iron ore and steel
41 Industrial Development Bank Of India Ltd Banking
42 Grasim Industries Ltd Cement 43 Bajaj Auto Ltd Automobile 44 Ispat Industries Ltd Iron ore and steel 45 Essar Steel Ltd Iron ore and steel 46 Central Bank Of India Banks Banking 47 Mahanagar Telephone Nigam Ltd Telecommunications services 48 South Eastern Coalfields Ltd Mining 49 Union Bank Of India Banking
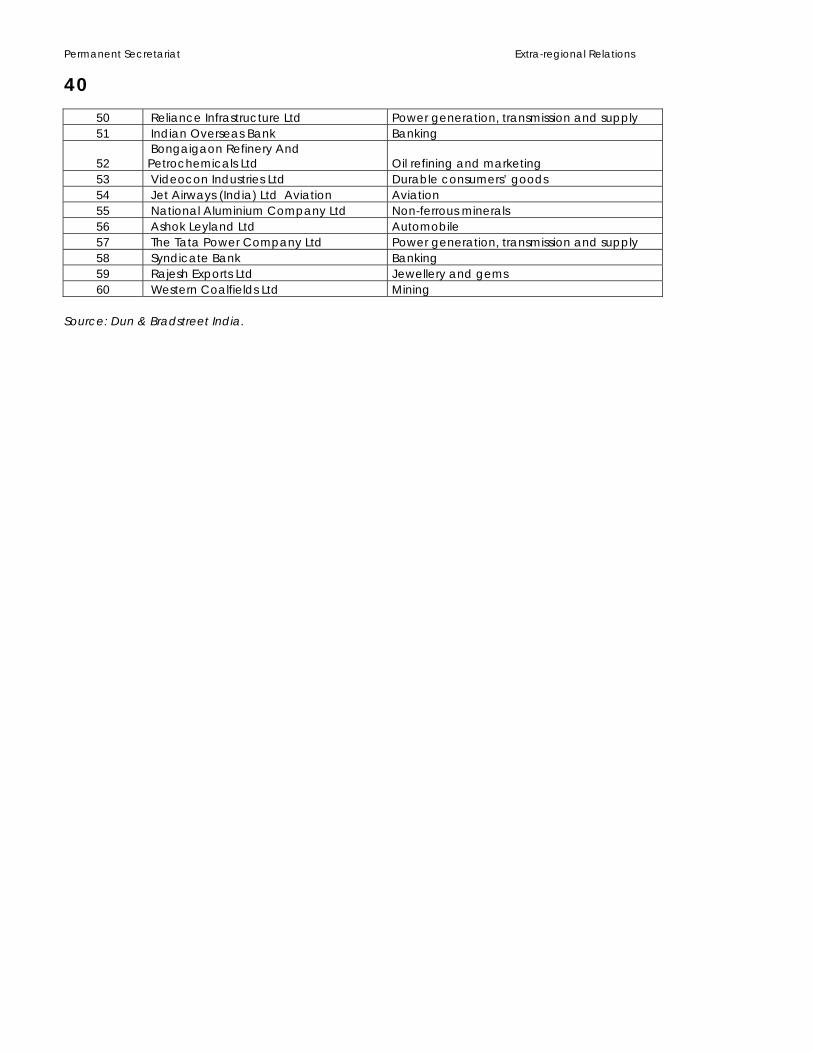
Permanent Secretariat Extra-regional Relations
4050 Reliance Infrastructure Ltd Power generation, transmission and supply 51 Indian Overseas Bank Banking
52 Bongaigaon Refinery And Petrochemicals Ltd Oil refining and marketing
53 Videocon Industries Ltd Durable consumers’ goods 54 Jet Airways (India) Ltd Aviation Aviation 55 National Aluminium Company Ltd Non-ferrous minerals 56 Ashok Leyland Ltd Automobile 57 The Tata Power Company Ltd Power generation, transmission and supply 58 Syndicate Bank Banking 59 Rajesh Exports Ltd Jewellery and gems 60 Western Coalfields Ltd Mining
Source: Dun & Bradstreet India.