Embed Size (px)
Citation preview

MPRAMunich Personal RePEc Archive
Inclusive Growth Strategies for Pakistan:Myth or Reality for Policymakers!
Atif Syed Muhammad and Mohazzam Sardar
7. July 2012
Online at http://mpra.ub.uni-muenchen.de/41376/MPRA Paper No. 41376, posted 17. September 2012 13:31 UTC

Inclusive Growth Strategies for Pakistan ─ Myth or Reality for Policymakers!
Sardar Mohazzam
Fulbright PhD Scholar, University of Delaware USA
Assistant Professor, Department of Government and Public Policy
National Defence University, sector E-9, Islamabad Pakistan.
Syed M. Atif Bukhari
HEC PhD Scholar
Department of Economics
University of Sydney
NSW, Australia

Pag
e2
Abstract
The mantra of inclusive growth is taking over the public policy debates
addressing poverty alleviation and sustained development in the
developing world. In order to reduce poverty substantially, rapid pace of
growth is not only necessary, but it should be sustainable in the long run
and broad-based across sectors, nonetheless, inclusive of country’s labour
force at large. Poverty and growth were much discussed and analysed in
separation by policymakers in the previous decades. Inclusive growth
strategy is an integration of these two strands of analyses implying
relationship between the macro and micro determinants of growth.
This paper examines the nature of relationship between the macroeconomic
and social-development indicators by using a Multiple Regression
Framework and Vector Auto Regression Model, as proposed by Toda-
Yamamoto, is used to determine the direction of causality between the key
macroeconomic variables of Pakistan over the period of 1997-98s to 2009-
10. The paper critically examines Inclusive growth paradigm ─ for market
led growth, and suggests its weaknesses which can be addressed through
review of the pro-poor goals of economic policy of Post Washington
Consensus (PWC). Finally, the paper urges to explore the myths and
realities of inclusive growth strategies for policymakers in Pakistan to
identify and prioritize the Pakistan specific constraints i.e. Low spending
on health and education, promote growth in agriculture and rural
development for sustained and inclusive growth.
Introduction
The mantra of inclusive growth is taking over the public policy debates addressing poverty
alleviation and sustained development in the developing world. In the last decade, the Asian
countries especially China and India have maintained a rapid and sustainable economic
growth.1 The double digit growth of these elephant economies on one hand surprised the
world with overall increase in the GDP, and per capita income, but on the other hand there
has been a persistent negative impact on the income distribution.2 Poverty and growth which
is much discussed and analyzed in separation by policymakers before and somewhat after
Washington Consensus. The policy-makers have been once again challenged to gear the
public policies towards a growth which is market led in nature, broad based in terms of
1 Ghosh, J. (2010). “Poverty reduction in China and India: Policy implications of recent trend”. DESA Working
Paper No. 92 2 Ali, I. (2007). “Inequality and the Imperative for Inclusive Growth in Asia”. Asian Development Review, 24(2),
pp. 1-16

Pag
e3
sectors, and inclusive of majority of labour force of the country. The desired growth strategy
should not only foster the private sector but should also protect the vulnerable segment of the
society.
Pakistan has a growth rate of 4.1% in 2009-10 after turbulence of economic growth of two
years.3 From the experience of Pakistan and other developing countries, it can be inferred
that “period of high economic growth occurred at the expense of macroeconomic stability,
but did not produced the desired outcomes with regards to poverty reduction in a sustainable
manner.”4 It poses the question that how we can make growth more inclusive? How can be
the dividend of the growth is accessible to large segment of the population? How
policymakers can stimulate the markets led growth and also protect the vulnerable segment of
the society in Pakistan.
This paper critically examines different growth paradigm offered to the developing countries
by developed countries and its affiliated agencies and financial institutions. The pre-
Washington Consensus economic policies and post-Washington Consensus pro-poor growth
policies have been compared and contrasted to conclude the weakness of Inclusive growth
paradigm and suggests that how it weaknesses can be addressed through review of the pro-
poor goals of Post Washington Consensus (PWC).
Data from 1997-98 to 2009-10 have been regressed to observe the existing trends of pro-poor
growth mechanism in Pakistan. An index for social development has been devised, based on
health, education, governance and demographical indicators, to examine the establishment of
effective human capital, which in turn leads to labor-inclusive pro-poor growth. The study
3 Pakistan, Govt. of, (2010). “Economic Survey of Pakistan 2009-10”. Ministry of Finance, pg. 129
After a high growth rate of 6.8 percent in 2006‐07, Pakistan has experienced a declining rate of economic growth, during 2007‐08 and 2008‐09 (3.7% and 1.2% respectively). However, there has been an increase to 4.1 percent in 2009‐10. As may be seen, the growth rate declined, given the international economic crisis during 2008‐09 ‐ although it was not negative as in case of some other countries.” 4 Ibid pg.132

Pag
e4
applies Modified WALD test, as proposed by Toda and Yamamoto (1995), on the Vector
Autoregression Model designed in subsequent sections, estimated through seemingly
Unrelated Regression analysis. Existence of a unidirectional causal relationship from
economic growth to social development has been examined, which satiates the hypothesis of
deliverance of inclusive growth by producing highly-skilled, healthy and effective labour
force.
Finally, the paper also suggested a set of strategies for policymakers in Pakistan to identify
and prioritize the Pakistan specific constraints to sustained and inclusive growth.
Review of Literature: Historical Perspective
It was in the late 1950s and early 1970s that the growth theories were dominated by the
influential work of Kuznets (1955) and Robert Solow (1956) growth models which depicted
the relationship between economic growth, inequality and poverty. The discovery of
Kuznets’ U shaped relationship between income inequality and economic growth in poor
countries suggested that economic growth will lead to greater income inequalities, followed
by decrease in this inequality provided economy continued to grow; for this continued
economic growth countries had to shift from agriculture to industrial sector as there is a little
variation in agricultural income as compared to industrial income. According to the
framework of Convergence explained by Solow Growth Model, the developing economies
contain a tendency to converge to developed economies by maintaining higher levels of
growth, forced through equalization of marginal returns of factors of production between
developing and developed economies, as the country progresses. Subsequently, Government
and International Financial Institutions under this context of “big push” formulated policies
of development for infrastructure and capital building projects in the developing countries.
By late 1970s and 1980s, the policy prescription from these models were realized as false

Pag
e5
hope, as neither these poor countries converged with developed countries, and nor income
inequality reduced.
With the displacement of Keynesianism and the rise of monetarism and new classical
economics, development theory shifted towards the so called phenomena of trickle down
proposition. The proponent of “free market” policies this time offered this paradigm for
poverty alleviation and better income distribution with strong argument that government
intervention was reason of failure. Washington Consensus (WC) type economic policies were
prescribed to “operationalize” the trickle down proposition. Dani Roderick explains WC
policies as ““Stabilize, Privatize, and Liberalize” became the mantra of a generation of
technocrats who cut their teeth in the developing world and of the political leaders they
counselled.”5 By early 1990s, the prescribed policies were immensely criticised by all spheres
of life and International financial institutions were once again assigned to provide policies to
deal with the problem of inequality and poverty reduction.
Millennium Development Goals (MDGs)6 were the new shift from the Washington
Consensus type economic policies, and emerged as pro-poor alternative. However, as we are
reaching close to the timeline to achieve the goals set by MDGs, and there is another apparent
failure. “The scale of the task of achieving the Millennium Development Goals (MDGs) is
daunting. The region is home to more than 900 million poor comprising more than two-thirds
of the world’s population in extreme poverty.”7 (ADB 2010)
In late 1990s, debates about growth and inequalities tended to focus on the concept of pro-
poor growth. The earlier notion of poverty reduction and redistribution as a by-product of
5 Roderick, D. (2006). “Good Bye Washington Consensus, Hello Washington Confusion?”. Cambridge: Haravard
University Press. 6 U. N. (2011). “Millennium Development Goals Report-2011”, Available at:
http://www.un.org/millenniumgoals/11_MDG%20Report_EN.pdf, Accessed on: 17/10/2011. 7 A.D.B. (2011), “Asian Development Bank Annual Report 2010”, Vol. 1, Available at:
http://www.adb.org/documents/reports/annual_report/2010/adb-ar2010-v1.pdf, Accessed on: 13/10/2011, pg. 16

Pag
e6
growth and macroeconomic stability was disqualified. Mainstream admitted that “Instead,
poverty has to be addressed directly through a dedicated set of economic and social tools. The
International Financial Institutions also had to confront claims that inequality is harmful
because it induces political and economic instability and, in extreme cases, political violence
and civil war.”8 The two different definition of pro-poor growth (Kakwani, Khandker and
Son, 2004 and Kakwani and Pernia 2000, Baulch and McCullock, 2000, Ravallion, 2004;
Ravallion and Chen, 2003, Besley and Cord, 2007, and McKinley, 2009) were presented by
Nanak Kakwani and Martin Ravallion. According to Kakwani ““pro-poor growth” means
that poverty falls more than it would have if all incomes had grown at the same rate.”9 This
definition prioritizes the concept of relative improvement in the poor’s condition. It advocates
the growth that can promote equity, so the criteria for selection of economic policies will be
equity; hence all those policies which promote equity are “pro-poor”. According to Ravallion
““pro-poor growth” is growth that reduces poverty.”10
His definition is in absolute term,
which focuses on absolute improvement of living standard of poor, without considering
inequality. In this case equity has instrumental value, and it is a non-perverse type of
growth.11
So in this case equity will be applied if it can enhance the impact of economic
policies which target poverty alleviation ─ as in case of China where growth lead to decrease
in the poverty but not to inequality. Both these definitions over time seems similar as both
tended to reach on an agreement to reduce the poverty at the maximum level. “And for this
goal, they have tended to agree that both faster growth (implying absolute improvements) and
greater equity (implying relative Improvements) should be priorities” (MacKinely, 2009, pg.
6). In specifically everyone gains from faster growth, there may be some loss in case of
equity promoting growth policies which may cause some political tension and partly
8 Saad-Filho, A. (2010). “Growth, Poverty and Inequality: From Washington Consensus to Inclusive growth”.
DESA Working Paper No. 100, pg. 8 9 Ravallion, M. (2004). “Pro-Poor Growth: A Primer”. Development Research Group: World Bank. pg. 2
10 Ibid pg. 2
11 Ibid. 8, Saad-Filho, A. (2010). Pp.9

Pag
e7
economic efficiency loss. So the shift from goal of reducing poverty through the principle of
equity has been shifted to principle of growth as logical consequence of this discussion.
With the departure of the equity from these debates and rise of definition of absolute pro-poor
growth, World Bank and Commission on Growth and Development (CGD)12
- Group,
described the growth and social development in the following way:
“Growth is not an end in itself. But it makes it possible to achieve other important objectives
of individuals and societies. It can spare people en masse from poverty and drudgery.
Nothing else ever has. It also creates the resources to support health care, education, and the
other Millennium Development Goals to which the world has committed itself. In short, we
take the view that growth is a necessary, if not sufficient, condition for broader development,
enlarging the scope for individuals to be productive and creative.”13
The CGD Report 2008, on one hand explains growth in terms of competitive pressure and on
the other hand re-iterates the role of government. It explains to address the pressure of
competitiveness; the government should liberate the product markets, and remove entry
barriers for more productive firms. Surprisingly, it indicated that government should
intervene into the labour market for the quick creation of jobs and for worker mobility within
the labour market to fill the job.14
Along with the public sector expenditure on the
development of Infrastructure and creation of physical and human capital this would crowd-
in private investment. World Bank report “What is Inclusive growth?” (World Bank 2009)
and CGD Report 2008 mentioned different strategies that governments should adopt for the
12
The Commission of Growth and Development is an autonomous body of policy makers, businessmen and scholars supported by World Bank and other Multinational giants and Governments. 13
Commission of Growth and Development, “The Growth Report: Strategies for Sustained Growth and Inclusive Development Report”. Avaiable at: cgd.s3.amazonaws.com/GrowthReportComplete.pdf, Accessed on: 04/10/2011, pg. 1 14
Ibdi pg. 6

Pag
e8
sustained and steady growth along with commitment of World Bank itself with “Growth
Diagnostic” approach.
Inclusive Growth: Tinkering for Poverty Reduction and Growth
In late 2000s, World Bank and its affiliates supported the development Inclusive growth
paradigm. The Inclusive growth paradigm emerged with the convergence of debates on Pro-
poor growth (differentiation between pro-poor and inclusive growth, the former approach
focuses on welfare of the poor, and the later focuses on majority of labour force, poor and
middle class and is in line absolute definition of pro-poor growth), and development of new
(neo-classical) growth framework by World Bank. Inclusive growth paradigm focuses on the
importance of growth for the reduction of poverty, further, it explains that the achievement of
these outcomes are possible with a combinations of broad range of policies which can be
selected through the “growth diagnostics.”15
Inclusive growth strategy is an integration of two strands of analyses i.e. Poverty and growth,
which implies relationship between the macro and micro determinants of growth.16
The
paradigm of Inclusive growth can be defined as to reduce poverty substantially, rapid pace of
growth is not only necessary, but it should be sustainable in the long run and broad-based
across sectors, nonetheless, inclusive of country’s labour force at large.17
“[This] broad based
and inclusive growth does not imply a return to Government-sponsored industrial policies,
but instead puts the emphasis on policies that remove constraints to growth and create a level
playing field for investment.” 18
15
Ibid. 8, Saad-Filho, A. (2010). Pp. 13 16
Elena, I. and Susanna, L. (2009). “What is Inclusive Growth?”. Available at: http://siteresources.worldbank.org/INTDEBTDEPT/Resources/468980-1218567884549/WhatIsInclusiveGrowth20081230.pdf, Accessed on: 04/10/2011 17
Ibid pg.1 18
Ibid. pg.2

Pag
e9
Inclusive growth paradigm is has two distinct feature, first as it is based on the successful
growth experience of the development countries around the world. Second, it is not only
identical with post-Washington Consensus (see fig. 1) but also have similarity of “big push”
model led by government for the development for growth – which demands “public sector
investment in infrastructure and physical and human capital, including roads, ports, airports,
power, telecommunications, health and education especially for girls.”19
There are certain limitations of Inclusive growth paradigm. With the premise that economic
growth is the sole driver of poverty reduction, growth has inbuilt “process of creative
destruction”20
and it can create poverty. Growth brings with itself technological can alter in
property and user rights. The transformation in labour market can lead to unemployment and
increase in poverty. If the growth is not sustained and there is insufficient growth in GDP as
in case of Pakistan, this may lead to decline in welfare of large population. It contradicts with
the claims of the “absolute definition” of pro-poor growth.
Original Washington Consensus Post-Washington Consensus
(Original WC plus) Inclusive Growth
Secure property rights
Deregulation
Fiscal Discipline
Tax reform
Privatization
Reorientation of public expenditure
Financial liberalization
Trade liberalization
Openness to FDI
Unified and competitive exchange
rates
Anti-corruption
Corporate governance
Independent central bank and IT
Financial codes and standards
Flexible labour markets
WTO agreements
“Prudent” capital account opening
Non-Intermediate exchange rate
regimes
Social safety nets
Targeted poverty reduction
Competitive Environment
Government commitment to
growth
“Good policies”
Labour market deregulation
Employment and productivity
growth
International integration
Exchange rate management
“Prudent” capital account opening
Social safety nets
19
Ibid. 8, Saad-Filho, A. (2010), pg.12 20
Schumpeter, J. A. (1975). “Capitalism, Socialism and Democeacy, Schumpeter”, Chapter VIII. NY: Harper and Row Pub.
Fig .1 Sources: (Alfredo Saad-Filho, 2010 pg. 14)
Pag
e10
METHODOLOGY AND DATA ANALYSIS
DATA
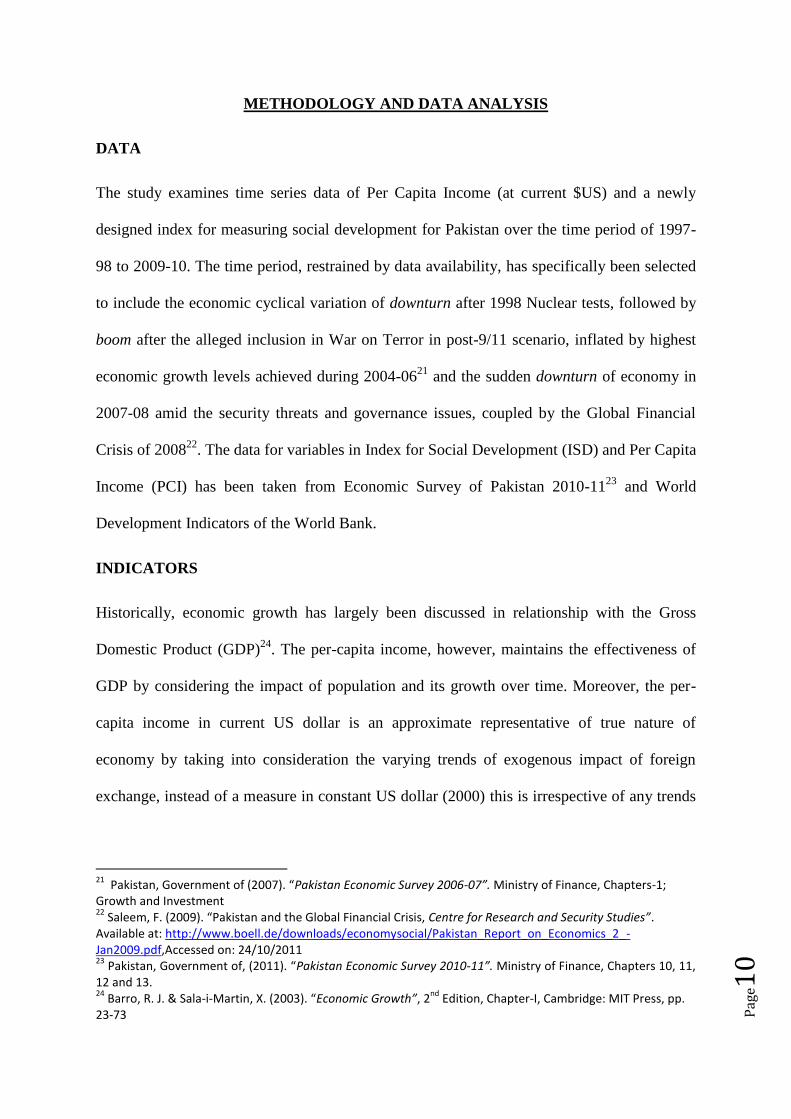
The study examines time series data of Per Capita Income (at current $US) and a newly
designed index for measuring social development for Pakistan over the time period of 1997-
98 to 2009-10. The time period, restrained by data availability, has specifically been selected
to include the economic cyclical variation of downturn after 1998 Nuclear tests, followed by
boom after the alleged inclusion in War on Terror in post-9/11 scenario, inflated by highest
economic growth levels achieved during 2004-0621
and the sudden downturn of economy in
2007-08 amid the security threats and governance issues, coupled by the Global Financial
Crisis of 200822
. The data for variables in Index for Social Development (ISD) and Per Capita
Income (PCI) has been taken from Economic Survey of Pakistan 2010-1123
and World
Development Indicators of the World Bank.
INDICATORS
Historically, economic growth has largely been discussed in relationship with the Gross
Domestic Product (GDP)24
. The per-capita income, however, maintains the effectiveness of
GDP by considering the impact of population and its growth over time. Moreover, the per-
capita income in current US dollar is an approximate representative of true nature of
economy by taking into consideration the varying trends of exogenous impact of foreign
exchange, instead of a measure in constant US dollar (2000) this is irrespective of any trends
21
Pakistan, Government of (2007). “Pakistan Economic Survey 2006-07”. Ministry of Finance, Chapters-1; Growth and Investment 22
Saleem, F. (2009). “Pakistan and the Global Financial Crisis, Centre for Research and Security Studies”. Available at: http://www.boell.de/downloads/economysocial/Pakistan_Report_on_Economics_2_-Jan2009.pdf,Accessed on: 24/10/2011 23
Pakistan, Government of, (2011). “Pakistan Economic Survey 2010-11”. Ministry of Finance, Chapters 10, 11, 12 and 13. 24
Barro, R. J. & Sala-i-Martin, X. (2003). “Economic Growth”, 2nd
Edition, Chapter-I, Cambridge: MIT Press, pp. 23-73

Pag
e11
in the global economy. Therefore, the study deals per-capita income in current US dollar as a
proxy for Economic Growth.
Furthermore, based on literature review25
, the index for social development is devised on four
major indicators; Health, Education, Governance and Demographics, further subdivided into
21 variables.
Health Indicator
It includes the variables; Crude Birth Rate (per 1000 people), Crude Death Rate (per 1000
people), Life Expectancy at Birth (years), Infant Mortality Rate (per 1000 live births),
Fertility Rate (births per woman) and Population per Hospital Bed. Other variables
explaining the nature of nourishment of population, such as per capita calories and protein
consumption could not be included in the indicator due to insufficient data availability.
Education Indicator
In a society where literal definition of literacy includes being able to write one’s name and
reading the newspaper, the education indicator focuses on lower level education by including
Primary, Middle and Secondary stage enrolment of pupils, and number of teachers in
Primary, Middle and Secondary stage, and literacy rate. The Pupil/Teacher ratio has been
calculated by division of cumulative pupils and teachers, which gives an overall estimate of
the lower level education in Pakistan, excluding the University enrolment and teachers.
Demographics
This indicator focuses on the demographical aspects by examining the nature of urbanization,
level of employment and population statistics. It includes Population Density (people per sq.
25
Szirmai, A. (2005). “The Dynamics of Socio-Economic Development: An Introduction”, Chapter 5-7. UK: Cambridge University Press, pp. 141-248; and Mazumdar, K. (1996). “An Analysis of Causal Flow between Social Development and Economic Growth: The Social Development Index”. Americal Journal of Economics and Sociology, 55(3), pp.361-383; and Khan, H. (1986). “Socio Economic Development of ASEAN: An International Perspective (Chapter-2)”. Singapore: Chopman Publisher, pp 13-28

Pag
e12
kilometer of land area), Total Population, Total Labor Force, Labor Force Participation Rate,
Unemployment (percentage of total labor force).
Governance Indicator
This indicator includes different modes of public spending, with focus on the fundamental
needs of people. Public spending on health, on education and military expenditure, as
percentage of GDP, aides in determining the public priorities, meaning thereby the
governments focus on provision of social amenities.
The intuitive explanation of variables explained above, delineates a positive relationship
between individual variable and economic growth. As it can be addressed that an improved
health index, owing to the better provision of health services, can be examined by periodic
movement of the variables in this index. By looking into the raw data, it is viewed that crude
birth rate and crude death rate are declining over time, meaning thereby that the prevailing
problem of significantly high population growth may eventually be controlled. Likewise the
increase in life expectancy at birth, and hospital beds, and decrease in infant mortality also
portray an improved health sector. But these variables individually can not account for a
significant impact on economic growth, whereas an overall improved health index is
supposed to be augmenting the economic growth process by means of effective human
capital26
.
However, this generalization excludes the expenditure on military and defense, as apparently
the defense expenditure bears the opportunity cost of expenditure on other pro-poor sectors.
The defense expenditure may be considered as a non-development expenditure due to its
incapability of directly impacting the economic growth of any economy. The portion of
economic growth owing to the improvement in health index, can thereby be regarded as the
26
Ranis, G. (2004). “Human Development and Economic Growth”. Centre Discussion Paper No. 887, USA: Yale University.

Pag
e13
pro-poor growth because it is eventually increasing the efficiency of labor, and hence an
improved marginal product, which satiates the Solow’s concept of convergence through
equalization of marginal product of factors of production27
.
Based on the same footings, an explanation for the education sector can be attained. An
intuitive description of improved education index leads to an improved employment scenario
by producing more literate and skilled labor force, which again follows the same modeling of
Endogenous Growth Theory as discussed earlier. However, unlike the health index, education
index focuses on other factors of production too. Highly skilled labor produced through
increased literacy eventually leads to induction of effective physical capital and structural
transformation of a more capital intensive economy. Alongside, the education index produces
improved entrepreneurial scenario for the economy. Hence, the concept of convergence again
comes into effect if an improved education index can be established for a developing
economy. Lastly, the demographics index deals with the dynamics of population, and direct
inductions and deductions in the effective labor force in the economy. The apparent incline in
the unemployment statistics overtime is alarming for policy makers. The dynamics of
landmark Philip’s Curve have been overturned in developing economies such as Pakistan,
where inflation and unemployment are presenting a positive relationship over time28
, against
the traditional negative relationship as explained by the Philip’s curve29
.
INDEX FOR SOCIAL DEVELOPMENT
The Index for Social Development is constructed, by using the statistical technique for data
reduction, called Principal Component Analysis, applied on 21 variables explained above to
formulate the combination of principal components explaining at least 70 percent of the
27
Ibid 24. Barro, J. R., and Salah-i-Martin, X. (2003) 28
Ibid 23, Economic Survey of Pakistan 2010-11. Chapter 7: Inflation, and Chapter-12: Population, Labor Force and Employment 29
Dufour, J., Khalaf, L. and Kichian, M. (2005). “Inflation Dynamics and the New Keynesian Phillips Curve: An Identification Robust Econometric Analysis”. Bank of Canada Working Paper 2005-27

Pag
e14
variation in data. The Principal Component Analysis (commonly known as PCA) is one of
the simplest forms of Applied Multivariate Analysis, that takes p-variables (X1, X2, …,Xp)
and finds combinations on standardized form of these variables to produce uncorrelated
indexes (Z1, Z2, …Zp), known as the principal components, ordered according to weight of
respective principal component (known as Eigen Values), whereby Eigen values explicate the
percentage variance of whole data explained by respective principal component30
.
Standardization of the variables has been formed based on the methodology explained by
Mazumdar (1996)31
:
𝑌𝑖𝑗 =𝑋𝑖𝑗 − 𝑋𝑖min
𝑋𝑖max − 𝑌𝑖min
Where Xi min and Xi max are the minimum and maximum values of ith
series, respectively.
METHODOLOGY
The paper discusses causal relationship between economic growth and social development by
examining selective indicators of health, education, governance and demographics of
Pakistan. The core steps include formulation of functional form of the model, based on the
indicators discussed above, followed by a multiple linear regression, explaining the impact of
individual indicator on economic growth. This helps in formulating the grounds for
estimating the causal relationship between both indices, based on which the study proceeds
by examining of the order of integration of individual series, and in the final step, testing the
true direction of causality by applying Modified WALD (MWALD) test as proposed by Toda
30
Manly, B. F. J. (2005). “Multivariate Statistical Methods: A Primer”. 3rd
Edition, Chapter-6, New York: Chapman and Hall/CRC, pp. 75-90 31
Ibid. 25, Mazumdar, K. (1996)

Pag
e15
and Yamamoto (1995)32
, on the Vector Autoregression (VAR) Model estimated through
Seemingly Unrelated Regression (SUR)33
.
Functional Form and Multiple Linear Regression
Based on the above discussion, the functional form of model is devised as follows:
PCIt = f (Ht , Et , Gt , Dt ) (1)
Where PCIt is the per-capita income (proxy for economic growth), Ht explains the health
indicator, Et relates to the education indicator, Gt measures the index for governance and Dt is
the indicator of demographical conditions of the economy, where education index contains
cumulative teachers per 1000 cumulative students.
The indices for each variable are designed by using the Principal Component Analysis and
the multiple linear regression model is framed as follows:
𝑷𝑪𝑰𝒕 = 𝝋𝟎 + 𝝋𝟏𝑯𝒕 + 𝝋𝟐𝑬𝒕 + 𝝋𝟑𝑮𝒕 + 𝝋𝟒𝑫𝒕 + 𝒖𝒕 (2)
Where 𝜑𝑖 (𝑖 = 1,2,3 𝑎𝑛𝑑 4), explains the average change in PCI caused by average change in
the ith
variable over the unitary time movement, holding all else constant, and ut, the error
term, explains the change in dependent variable by any regressing factors other than those
included in the model. The estimated model is given in equation (3):
𝑷𝑪𝑰 𝒕 = −𝟏𝟎𝟎. 𝟏𝟔𝟑𝟐 + 𝟏. 𝟒𝟐𝟕 𝑯𝒕 + 𝟑. 𝟗𝟕𝟏(𝑬𝒕) − 𝟏. 𝟏𝟖𝟐 𝑮𝒕 + 𝟏. 𝟕𝟎𝟓(𝑫𝒕) (3)
SE (215.167) (0.286) (4.17) (0.587) (0.21)
The estimated equation elaborates that per-capita income is positively associated with the
health index, education index and demographics index, and inversely related with the
governance index which mainly deals with public expenditure on health, education and
32
Toda H.Y. and Yamamoto, T. (1995). “Statistical inference in vector autoregressions with possibly integrated process”. Journal of Econometrics, 66, 225-250 33
Gujarati, D. N. (2002). “Basic Econometrics”. Fourth Edition, Chapter-21&22. New York: McGraw Hill, pp.792-868

Pag
e16
defense. The governance index has significantly emerged to be an important factor in the
policy making for Pakistan. The interesting point that emerges here is the negative
relationship between economic growth and the governance index. It has been observed that
over the period of time, public expenditure on military and defense has superseded the
expenditure on other sectors, or according to this study specifically education and health
sector34
. Intuitively, it can be deduced that the excessive overburdening of government by
defense sector, has reduced its competencies for excelling in other sectors. Or in other words,
the government’s focus on its defense, which can not be considered as an element directly
impacting the economic growth, is leading to its poor performance in other sectors of the
economy, which is eventually leading to lower economic growth in other sectors, which is
compatible to our assumption in variable explanation about inclusion of military expenditure
in the model.
The apparent situation in estimated equation in (3), focuses on education sector, by relating
that a unitary increase in the educational index, will lead to a great than unitary change in
economic growth, thereby laying insistence on priority in this sector. However, these results
do not portray a vivid picture of the nature of causal relationship, i.e. from the above model it
can not be deduced whether the causal relationship flows from these four indicators to the
economic growth.
Amid this problem of determination in the direction of causality, the Index for Social
Development is formed by using PCA, based on the variables discussed above, so that the
functional form for Vector Autoregressive Model is given as:
𝑷𝑪𝑰𝒕 = 𝒇(𝑰𝑺𝑫𝒕) (4)
34
Ibid 23, Pakistan Economic Survey 2010-11. Chapter-1, Growth and Investment, Chapter-4: Fiscal Development, Chapter-11: Health

Pag
e17
Where PCI is the real per capita income in current US dollar and ISD is the Index for Social
Development devised in the previous section.
Order of Integration
The order of integration for respective
series is determined by using
Augmented-Dickey Fuller test35
.
Assuming 5 percent level of
significance and null hypothesis of
absence of unit root, exhibits the
results in table-1, for both the series. It
is observed that both the series are augmented at order-2, i.e. I(2)
Toda-Yamamoto Augmented Granger Causality Test
This study uses the Modified WALD Test (MWALD) as proposed by Toda and Yamamoto
(1995)36
. Toda and Yamamoto (1995) introduced a relatively simpler and straightforward
causality test involving the WALD test based on augmented VAR modeling that
asymptotically has a chi-square distribution irrespective of the order of integration or
cointegration properties of the variables. The test is valid regardless of whether the series is
I(0), I(1) or I(2), cointegrated or noncointegrated. The test artificially augments the correct
VAR order (k) by the maximum order of integration (dmax). Then k+dmax th order of VAR is
estimated and the coefficients of the last lagged dmax are ignored37
. This validates that
35
Ibid 33. Gujarati, D. N. (2002) 36
Ibid 32. Toda H.Y. and Yamamoto, T. (1995) 37
Wolde-Rufael, Y. (2008). Energy consumption and economic growth: the experience of African countries revisited. Energy Economics, 31, 217-224.
AUGMENTED DICKEY FULLER TEST
Per Capita Income
t-value p-value Inference
At level 0.683 0.985 Accept
H0
At 1st difference -2.327 0.181
Accept
H0
At 2nd
difference -3.215 0.04 Reject H0
Index for Social Development
t-value p-value Inference
At level -1.45 0.519 Accept
H0
At 1st difference -3.132 0.054
Accept
H0
At 2nd
difference -3.354 0.002 Reject H0
Table-1

Pag
e18
standard asymptotic distribution is prevalent in the test statistic for Granger Causality test and
valid inferences could be made.
The study follows the model proposed by Wolde-Rufael (2008)38
:
𝑃𝐶𝐼𝑡 = 𝛼0 + 𝛼1𝑖
𝑘
𝑖=1
𝑃𝐶𝐼𝑡−𝑖 + 𝛼2𝑗
𝑑 max
𝑗=𝑘+1
𝑃𝐶𝐼𝑡−𝑗 + 𝛽1𝑖
𝑘
𝑖=1
𝐼𝑆𝐷𝑡−𝑖 + 𝛽2𝑗
𝑑 max
𝑗=𝑘+1
𝐼𝑆𝐷𝑡−𝑗 + 휀1𝑡 (𝟓)
𝑆𝐷𝐼𝑡 = 𝛾0 + 𝛾1𝑖
𝑘
𝑖=1
𝐼𝑆𝐷𝑡−𝑖 + 𝛾2𝑗
𝑑 max
𝑗=𝑘+1
𝐼𝑆𝐷𝑡−𝑗 + 𝛿1𝑖
𝑘
𝑖=1
𝑃𝐶𝐼𝑡−𝑖 + 𝛿2𝑗
𝑑 max
𝑗=𝑘+1
𝑃𝐶𝐼𝑡−𝑗 + 휀2𝑡 (𝟔)
The above system of equations is estimated by Seemingly Unrelated Regression (SUR)
method. For equation (5), ISD Granger Causes PCI if H0: 𝛽1𝑖 = 0 is rejected against HA: at
least one 𝛽1𝑖 ≠ 0 and for equation (6), PCI Granger Causes ISD if H0: 𝛿1𝑖 = 0 is rejected
against HA: at least one 𝛿1𝑖 ≠ 0 (where i=1,…,k and the parameters of i=k+1,…,dmax are
ignored). Bidirectional causality exists if both the null hypotheses are rejected against the
respective alternative hypotheses. And there will be no causality if both the null hypotheses
are accepted.
According to the Akaike and Schwarz Information criteria the optimal log-length for the
model is 1 (i.e. k=1) and the highest order of integration has been determined at 2 (i.e dmax=2,
and k+dmax=3), thereby formulating the estimated model as follows:
PCIt = 224.53+0.862*SDI(t-1)+0.513*SDI(t-2) -1.296*SDI(t-3)+1.161*PCI(t-1) -
0.277*PCI(t-2) - 0.266*PCI(t-3) (7)
SDIt = 372.331- 0.462*SDI(t-1)+0.002*SDI(t-2)+0.213*SDI(t-3) -0.103*PCI(t-1)
+0.291*PCI(t-2)+0.282*PCI(t-3) (8)
38
Ibid.

Pag
e19
Table-2
The results for the Modified WALD test, as proposed by Toda and Yamamoto, suggest that
there is unidirectional causality from per-capita income to the index for social development,
but vicé versa is not true. In other words, there exists a unidirectional relationship from
Economic Growth to the Social Development of society, and based on the past trends
examined by this study, a persistent increase in the economic growth, will eventually lead to
an increased social development.
It may therefore be inferred, that according to the available statistics, over the given period of
time, economic growth resulted in better education by means of high literacy rates, improved
strength of enrolment and teachers in lower education sector, improved health services by
means of reduced death rates, controlled birth rates and increased availability of health
services to the lower income group, and relatively higher opportunities of employment (as the
increase in labor force supersedes the increase in unemployment rate, which means that the
marginal increase in labor force through high population growth rate is being absorbed by the
improved employment scenario in economy).
An overall impact of economic growth can be dealt as an increase in Inclusive growth by
effectively improving the overall scenario in the market for factors of production, which
includes generating effective human capital, transforming to more capital intensive
techniques of production through highly skilled labor, and establishing a significant
entrepreneurial sector by the comparatively more literate human capital.
Equation Null Hypothesis Chi-Sq. p-value Inference
(4) ISD does not Granger Cause PCI 1.401 0.237 Accept H0
(5) PCI does not Granger Causes ISD 3.971 0.046 Reject H0

Pag
e20
Conclusion and Strategy for Pakistan
Pakistan and its neighbors emerging Asian economies feel the positive thrust of inclusive
growth, which is demanding broad based expansion of opportunities and enhancement of the
capabilities at economy wide with entailment at household level. Public policy intervention
should be exercised for circumstance-based disadvantaged ensuring level playing field for the
empowerment of people to explore and utilize the opportunity produced by sustainable
growth.
Based on the finding an interesting implication that can be drawn from results discussed in
earlier sections, deals with the negativity of coefficient for governance indicator. Though, the
variables included in this indicator make it a politics-free variable, by considering only public
expenditure, yet the inferences that can be drawn are not really free of politics. An overall
negative impact of public expenditure on education, health and defense, does not satiate the
rational myths of Inclusive growth. However, if the indicator is dealt in opportunity cost
terms, the inference starts making sense. Amid the security threats, inter-regional and intra-
regional, Pakistan has been maintaining a competitively large army, but the results of this
study suggest that opportunity cost of maintaining a massive military-budget is occurring to
be too high for Pakistan by exposing its effective labor, or in a broader sense, inclusive
growth at stake.
Hence, an intuitive resolution is to revisit the focus of public expenditure and construct a
mechanism prone to the pro-poor sector by investing more into two core sectors of the
economy; health and education. Reforms related to governance, public policies and
institutions which deal with economics should be addressed systematically. An active and
enlightened Pakistan is needed to bind with private sector to drive growth for the happiness
and prosperity that is shared among its people.

Pag
e21
REFERENCES
A.D.B. (2011), “Asian Development Bank Annual Report 2010”, Vol. 1, Available at:
http://www.adb.org/documents/reports/annual_report/2010/adb-ar2010-v1.pdf,
Accessed on: 13/10/2011, pg. 16
Ali, I. (2007). “Inequality and the Imperative for Inclusive Growth in Asia”. Asian
Development Review, 24(2), pp. 1-16
Barro, R. J. & Sala-i-Martin, X. (2003). “Economic Growth”, 2nd
Edition, Chapter-I,
Cambridge: MIT Press, pp. 23-73
Baulch, B. & McCulloch, N. (2000). "Simulating the Impact of Policy upon Chronic
and Transitory Poverty in Rural Pakistan". Econometrics, (43). EconWPA.
Besley, T. and Cord, L. (2006). “Delivering on the Promise of Pro-poor Growth:
Insights and Lessons from Country Experiences”. Basingstoke: Palgrave Macmillan
Commission of Growth and Development, “The Growth Report: Strategies for
Sustained Growth and Inclusive Development Report”. Avaiable at:
cgd.s3.amazonaws.com/GrowthReportComplete.pdf, Accessed on: 04/10/2011, pg. 1
Dufour, J., Khalaf, L. and Kichian, M. (2005). “Inflation Dynamics and the New
Keynesian Phillips Curve: An Identification Robust Econometric Analysis”. Bank of
Canada Working Paper 2005-27
Elena, I. and Susanna, L. (2009). “What is Inclusive Growth?”. Available at:
http://siteresources.worldbank.org/INTDEBTDEPT/Resources/468980-
1218567884549/WhatIsInclusiveGrowth20081230.pdf, Accessed on: 04/10/2011
Ghosh, J. (2010). “Poverty reduction in China and India: Policy implications of recent
trend”. DESA Working Paper No. 92
Gujarati, D. N. (2002). “Basic Econometrics”. Fourth Edition, Chapter-21&22. New
York: McGraw Hill, pp.792-868

Pag
e22
Kakwani, N. and E. Pernia. (2000). “What is Pro-poor growth?”, Asian Development
Review, 18(1)
Kakwani, N., Shahid K. and Hyun H. S. (2004). “Pro-Poor Growth: Concepts and
Measurements with Country Case Studies”. Working Paper #1 of the International
Poverty Centre, Brasilia.
Khan, H. (1986). “Socio Economic Development of ASEAN: An International
Perspective (Chapter-2)”. Singapore: Chopman Publisher, pp 13-28; and
Manly, B. F. J. (2005). “Multivariate Statistical Methods: A Primer”. 3rd
Edition,
Chapter-6, New York: Chapman and Hall/CRC, pp. 75-90
McKinely, T. (2009). Revisiting the dynamics of growth, inequality and poverty
reduction. Centre for Development Policy and Research, SOAS, Discussion Paper No.
25/90.
Mazumdar, K. (1996). “An Analysis of Causal Flow between Social Development
and Economic Growth: The Social Development Index”. Americal Journal of
Economics and Sociology, 55(3), pp.361-383; and
Pakistan, Government of (2007). “Pakistan Economic Survey 2006-07”. Ministry of
Finance.
Pakistan, Govt. of, (2010). “Economic Survey of Pakistan 2009-10”. Ministry of
Finance.
Pakistan, Government of, (2011). “Pakistan Economic Survey 2010-11”. Ministry of
Finance.
Ranis, G. (2004). “Human Development and Economic Growth”. Centre Discussion
Paper No. 887, USA: Yale University.
Ravallion, M. (2004). “Pro-Poor Growth: A Primer”. Development Research Group:
World Bank.

Pag
e23
Ravallion, M. & Chen, S. (2003). “Measuring Pro-Poor Growth”. Economic Letters,
(78), pp. 93-99.
Roderick, D. (2006). “Good Bye Washington Consensus, Hello Washington
Confusion?”. Cambridge: Haravard University Press.
Saad-Filho, A. (2010). “Growth, Poverty and Inequality: From Washington
Consensus to Inclusive growth”. DESA Working Paper No. 100, pg. 8-14
Schumpeter, J. A. (1975). “Capitalism, Socialism and Democeacy, Schumpeter”,
Chapter VIII. NY: Harper and Row Pub.
Saleem, F. (2009). “Pakistan and the Global Financial Crisis, Centre for Research and
Security Studies”. Available at: http://www.boell.de/downloads/economysocial/
Pakistan_Report_on_Economics_2_-Jan2009.pdf,Accessed on: 24/10/2011
Szirmai, A. (2005). “The Dynamics of Socio-Economic Development: An
Introduction”, Chapter 5-7. UK: Cambridge University Press, pp. 141-248; and
Toda H.Y. and Yamamoto, T. (1995). “Statistical inference in vector autoregressions
with possibly integrated process”. Journal of Econometrics, 66, 225-250
U. N. (2011). “Millennium Development Goals Report-2011”, Available at:
http://www.un.org/millenniumgoals/11_MDG%20Report_EN.pdf, Accessed on:
17/10/2011.
Wolde-Rufael, Y. (2008). Energy consumption and economic growth: the experience
of African countries revisited. Energy Economics, 31, 217-224.