Embed Size (px)
Citation preview

The Case for Investing in Natural Capital and Restoration
INCLUSIVE WEALTH OF PAKISTAN:
Report Director: Pushpam Kumar, United Nations Environment Programme, Nairobi
Authors: Shunsuke Managi, Urban Institute at Kyushu UniversityMoinul Islam, Urban Institute at Kyushu UniversityBingqi Zhang, Urban Institute at Kyushu UniversityAmelia Holmes, United Nations Environment Programme, NairobiMuhammad Khurshid, former DG, South Asia Cooperative Environment Programme
Reviewers: Jamil Ahmad, United Nations Environment Programme, New YorkBarney Dickson, United Nations Environment Programme, NairobiAndrea Hinwood, United Nations Environment Programme, NairobiPaulo Augusto Lourenço Dias Nunes, Food and Agriculture Organization of the United Nations, RomeSusan Mutebi-Richards, United Nations Environment Programme, NairobiUnai Pascual, Basque Centre for Climate Change (BC3) , SpainDoreen Robinson, United Nations Environment Programme, NairobiAshbindu Singh, Environmental Pulse Institute, Washington, D.C.Francesco Tubiello, Food and Agriculture Organization of the United Nations, Rome
Data collection and support by Aysha Rabia, B.S. Department of Environmental Sciences, University of Northampton, UK.
Disclaimer: The designations employed and the presentation of the material in this publication do not imply the expression of any opinion whatsoever on the part of the Secretariat of the United Nations concerning the legal status of any country, territory, city or area or of its authorities, or concerning the delimitation of its frontiers or boundaries.
Design: Viola Kup, United Nations Environment Programme, Nairobi
© 2021 United Nations Environment ProgrammeInclusive Wealth of Pakistan: The Case for Investing in Natural Capital and RestorationISBN No: 978-92-807-3866-7Job No: DEP/2364/NA
This publication may be reproduced in whole or in part and in any form for educational or non-profit services without special permission from the copyright holder, provided acknowledgement of the source is made. The United Nations Environment Programme would appreciate receiving a copy of any publication that uses this publication as a source.
No use of this publication may be made for resale or any other commercial purpose whatsoever without prior permission in writing from the United Nations Environment Programme. Applications for such permission, with a statement of the purpose and extent of the reproduction, should be addressed to the Director, Communication Division, United Nations Environment Programme, P. O. Box 30552, Nairobi 00100, Kenya.
DisclaimersThe designations employed and the presentation of the material in this publication do not imply the expression of any opinion whatsoever on the part of the United Nations Environment Programme concerning the legal status of any country, territory or city or its authorities, or concerning the delimitation of its frontiers or boundaries. For general guidance on matters relating to the use of maps in publications please go to http://www.un.org/Depts/Cartographic/english/htmain.htmMention of a commercial company or product in this document does not imply endorsement by the United Nations Environment Programme or the authors. The use of information from this document for publicity or advertising is not permitted. Trademark names and symbols are used in an editorial fashion with no intention on infringement of trademark or copyright laws.The views expressed in this publication are those of the authors and do not necessarily reflect the views of the United Nations Environment Programme. We regret any errors or omissions that may have been unwittingly made.© Maps, photos and illustrations as specified
Suggested CitationUnited Nations Environment Programme (2021). Inclusive Wealth of Pakistan: The case for investing in natural capital and restoration. Nairobi.
ProductionUnited Nations Environment Programme (UNEP) and Urban Institute at Kyushu University
unep.org/resources/report/inclusive-wealth-pakistan-case-investing-natural-capital-and-restoration

Inclusive Wealth of Pakistan:
The Case for Investing in Natural Capital and Restoration
4
GLOSSARY OF TERMS AND REFERENCES MAY BE INCLUDED
HC Human CapitalIW Inclusive WealthIWI Inclusive Wealth IndexNC Natural Capital PC Produced Capital
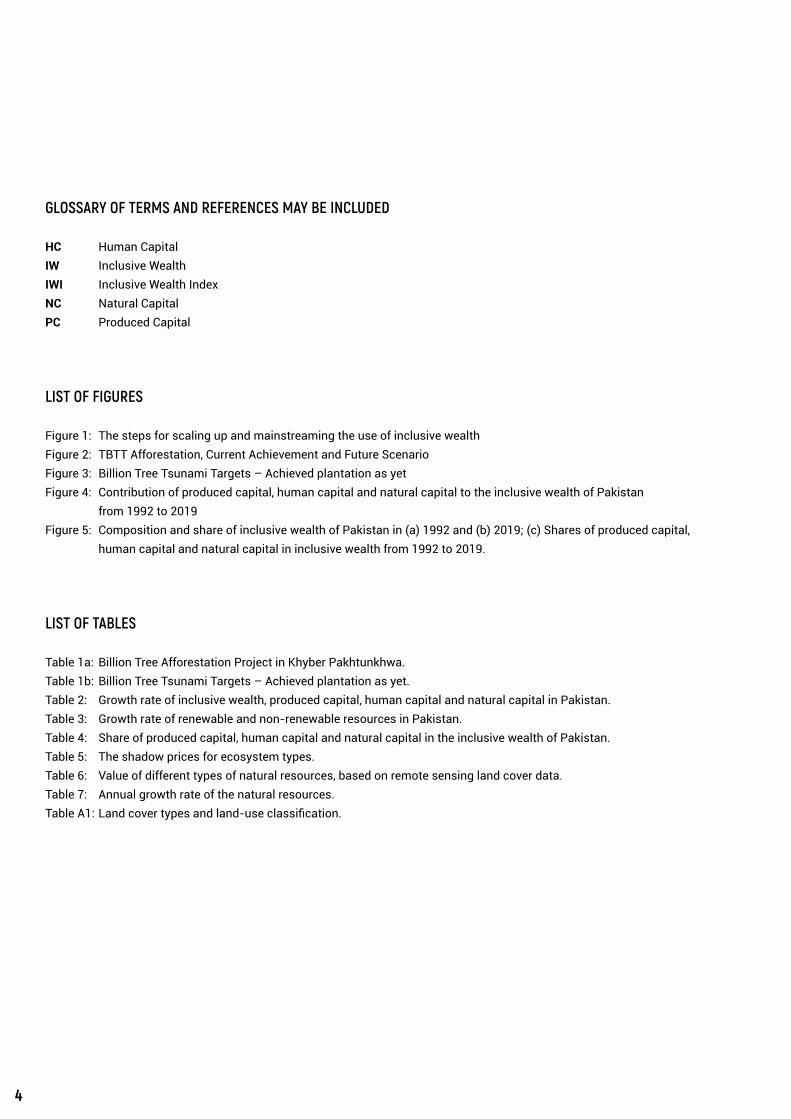
LIST OF FIGURES
Figure 1: The steps for scaling up and mainstreaming the use of inclusive wealthFigure 2: TBTT Afforestation, Current Achievement and Future Scenario Figure 3: Billion Tree Tsunami Targets – Achieved plantation as yetFigure 4: Contribution of produced capital, human capital and natural capital to the inclusive wealth of Pakistan from 1992 to 2019Figure 5: Composition and share of inclusive wealth of Pakistan in (a) 1992 and (b) 2019; (c) Shares of produced capital, human capital and natural capital in inclusive wealth from 1992 to 2019.
LIST OF TABLES
Table 1a: Billion Tree Afforestation Project in Khyber Pakhtunkhwa.Table 1b: Billion Tree Tsunami Targets – Achieved plantation as yet.Table 2: Growth rate of inclusive wealth, produced capital, human capital and natural capital in Pakistan.Table 3: Growth rate of renewable and non-renewable resources in Pakistan.Table 4: Share of produced capital, human capital and natural capital in the inclusive wealth of Pakistan.Table 5: The shadow prices for ecosystem types.Table 6: Value of different types of natural resources, based on remote sensing land cover data. Table 7: Annual growth rate of the natural resources.Table A1: Land cover types and land-use classification.
5
CONTENTS
Forewords ......................................................................................................................................................................................7Executive summary .....................................................................................................................................................................11
1. Introduction ...............................................................................................................................................................13
2. Economy of Pakistan .................................................................................................................................................17
3. Environmental pressures in Pakistan.........................................................................................................................213.1 Previous trends in natural capital according to IWI ............................................................................................................223.2 Pathways to improvements and restoration efforts ...........................................................................................................22
4.Inclusive wealth of Pakistan at the national level ........................................................................................................274.1 Stock of inclusive wealth at the national level ....................................................................................................................274.2 Growth of inclusive wealth at the national level ..................................................................................................................29
5. Inclusive wealth of Pakistan at the regional level .......................................................................................................315.1 Inclusive wealth at the grid level ..........................................................................................................................................315.2 Human capital at the grid level ............................................................................................................................................315.3 Produced capital at the grid level .........................................................................................................................................315.4 Natural capital at the grid level ............................................................................................................................................325.4.1 Renewable natural resources ............................................................................................................................................325.4.2 Land cover ..........................................................................................................................................................................335.4.3 Non-renewable resources .................................................................................................................................................355.5 Growth of inclusive wealth overall at the grid level .............................................................................................................355.6 Inclusive wealth of Pakistan at the province level ..............................................................................................................35
6. Summary of findings .................................................................................................................................................37
7. Conclusion ................................................................................................................................................................39
8. References.................................................................................................................................................................43
9. Annex ........................................................................................................................................................................47
6
FOREWORD
6
COVID19 has tragically revealed that a business-as-usual approach will not take us to a world of living in harmony with nature. We need a fresh approach to measure progress and sustainability. It is time to adopt a new paradigm that recognizes the comprehensive value of nature and understands that quality of life and well-being cannot be measured adequately through gross domestic product (GDP) alone. Our current linear way of thinking – where we use and discard with a blink of an eye – as the health of natural capital like forests, topsoil and marine life continues to erode – will simply not work anymore. Yet, it is our collective responsibility to ensure that each generation leaves behind at least as much of a productive base as it has inherited from its predecessor. How does one therefore measure a productive base in a way that ensures sustainability?
Nature is fundamental to the existence and flourishing of a nation’s economy. Measuring the stock of wealth in a manner that includes natural capital is key to tracking sustainability and well-being of the nation. I am delighted that the Ministry of Climate Change of Pakistan and the United Nations Environment Programme have released an assessment of the inclusive wealth of Pakistan between 1990 and 2019. The Report estimates that while wealth and income in Pakistan has increased, its natural capital – as in other parts of the world – has deteriorated. However, as the Report also notes, the recent restoration work undertaken by Pakistan has halted the decline in natural capital since 2018.
An economy’s inclusive wealth is such because it accounts for the value of its stock of assets of manufactured capital (roads, buildings, machines, equipment), human capital (knowledge, aptitude, education, skills), and natural capital (forests, agricultural land, rivers and estuaries, the atmosphere and the oceans – ecosystems more generally). The value of natural capital is notoriously difficult to capture but is nonetheless foundational to an economy’s ability to produce goods and services for its citizens.
If inclusive wealth, adjusted for population and equitable distribution, increases as governments try to meet the 17 Sustainable Development Goals (SDGs), then the Goals will be sustainable. If not, we risk eroding the productive capacities of nations to achieve sustainable development.
To shift the world in a direction of more sustainable measures of wealth and well-being, UNEP continues to improve the advancement of Inclusive Wealth through a bi-annual global analysis. UNEP is also supporting countries to carry out their own estimates of inclusive
7
wealth to deepen their understanding of sub-national national disparities that may exist in the trends of natural, human and produced capital. An inclusive wealth analysis allows governments to track whether they are on course to meet the Sustainable Development Goals. The importance of this approach has been underscored by the Dasgupta Review of Economics of Biodiversity undertaken for the United Kingdom’s Treasury.
It is heartening to see new investments in natural capital since 2018 as a result of massive restoration programmes lead by the Government of Pakistan. A greater emphasis on investments in nature will support the country on the path to sustainability, and in addressing the devastating impacts of climate change, which are more acutely felt by the most vulnerable communities.
I welcome the launch of this Report as we mark World Environment Day 2021, with Pakistan as the global host. The Report makes a powerful case for continued improvements in our understanding of inclusive wealth, and therefore, on the crucial role of restoration in the economic decisions of Pakistan. As we embark on the United Nations Decade of Ecosystem Restoration aiming to protect, halt and reverse ecosystem degradation, I hope this Report will provide a useful compliment to important restoration efforts underway across the world.
7
Inger AndersenUnder-Secretary-General of the United Nations and Executive Director of the UN Environment Programme
FOREWORD

8
FOREWORD
8
Pakistan is fortunate to be custodians of such rich diversity in landscapes, including the towering Pamirs and Karakoram Range, grand plateaus, dramatic Sindh and Makran coastlines and the Indus River system providing some of the most fertile land on earth. Pakistan’s thriving agricultural sector is especially susceptible to increasing irregularity and uncertainty over climatic conditions.
The threats associated with climate change and rapid loss of biodiversity and ecosystems are rising. It is with this impetus that Prime Minister Imran Khan scaled Khyber Pakhtunkhwa’s response in 2014 to the Bonn Challenge which saw 872.000 (millions) seedlings planted up to June 2017. This nation-wide initiative was named the Ten Billion Tree Tsunami Project (TBTTP) and the ongoing objective is to replenish wildlife and forests in Pakistan and improve protected area conservation. The Ten Billion Afforestation Project has a total target of 3.296 billion plants to be planted/ regenerated by the end of Phase - I in June, 2023. A total of 859.426 million plants were planted/regenerated over an area of 381,374 hectares between 2018 and April, 2021 all over Pakistan.
These objectives will see large amounts of carbon sequestered, helping to mitigate climate change and provide resilient ecosystems that will provide some buffers against devastating impacts of natural disasters. This is not to say that the provincial level initiative was without challenges; serious losses, irregularities and deviations from federal and provincial components had to be addressed and need to be improved when scaling up afforestation. These efforts led to the increase of forest area in KPK from 20.31% to 26.6% and greatly helped in increasing the forest cover by 6.3% during 2014-19.
The pilot project Clean Green Pakistan Movement (CGPM), initiated by the Prime Minister Imran Khan has been successfully implemented in 20 cities of Pakistan in 2020, and it is now being scaled up in 93 cities of Pakistan across the country from 2021. In the first phase, Clean Green Pakistan Index (CGPI) and Champions Program which was piloted in 20 selected cities of Punjab and KPK was concluded in October 2020.
It is absolutely necessary that Pakistan follows the sustainability path for the long term wellbeing and sustainability of people. In order to operationalize sustainable development, we need to measure and monitor the productive base of the economy and environment. Measuring natural capital and wealth of the nation easily comes as the first step towards sustainability.The Inclusive Wealth Index Framework is the United Nations Environment Programme’s Flagship indicator for
99
FOREWORD
measuring nations’ potential for sustaining their citizens’ wellbeing into future decades. Due to its inclusion of natural and human capital into the index (alongside manufactured capital), it is invaluable as a tool for Pakistan to understand the benefits of restoration within the wider context of our natural capital assets.
The Report- Inclusive Wealth of Pakistan: The Case for Investing in Natural Capital and Restoration, provides state of art analysis of the productive base of the economy since 1990. This report estimates all capital stocks at the regional level for Pakistan, and as such, provides a holistic measure of sustainability. The findings are concerning and important – natural capital is being degraded while other capital is prioritised. By understanding restoration, among other assets, in the context of inclusive wealth, it will help us to realise the objectives and vision of the Ten Billion Tree Tsunami Programme.
I am so glad to see that the scientific report like this is also able to capture the effort of restoration in Pakistan where since 2018 the natural capital is on rise. This will go a long way to enhance people’s well-being and prosperity in the coming years.
I congratulate UNEP for providing this excellent support to Pakistan on the eve of the World Environment day.
Malik Amin AslamFederal Minister of Climate Change and Advisor to Prime Minister,Government of Islamic Republic of Pakistan
10
EXECUTIVE SUMMARY
Climate change, biodiversity loss and emerging pandemics, such as COVID-19, are urgent reminders that human activity is placing increasing pressures on the health of our biosphere, with devastating consequences to society. To secure a resilient, sustainable future, we must ensure that the health of ecosystems and their capacity to provide the goods and services we rely on are protected. In economic terms our collective demand for nature’s goods and services must not exceed its capacity to provide them. An historical focus upon national income (GDP) as the main metric for measuring progress has significantly influenced the widespread environmental decline being observed across the globe. By taking an approach to economic analysis that focuses on wealth (rather than income) of nations, it is possible to balance environmental protection with other factors essential for human well-being such as health and infrastructure, to achieve sustainable development.
Recent reports, including the UK’s HM treasury’s The Dasgupta Review: The Economics of Biodiversity (Dasgupta 2021) and Making Peace with Nature (UNEP 2021), suggest that investment decisions need to be guided by indicators pertaining to wealth, rather than GDP (income) alone. UNEP’s Inclusive Wealth (IW) framework demonstrates that future pathways and possibilities of economic development depend on the current management of all forms of capital — produced, natural and human — which together comprise a country’s wealth. By disaggregating assets into human, produced and natural capital stocks, the inclusive wealth framework provides a means for comparing the relative decline and improvements of different capital types. These capital assets at the national and global scale form the building blocks for achieving progress on the Sustainable Development Goals (SDGs).
By population Pakistan is the fifth largest nation in the world. It is endowed with significant wealth in natural resources across a diversity of landscapes that support key sectors of Pakistan’s economy, including agriculture, forestry and fishing. Consequently, Pakistan’s management of natural capital significantly impacts the household income of communities that rely directly on natural resources, as well as the overall economy.
The Inclusive Wealth of Pakistan: The Case for Investing in Natural Capital and Restoration estimates the IW of Pakistan from 1992 to 2019 at the national and regional level. The findings are based on the application of the inclusive wealth framework from a geospatial perspective. According to the grid cell level data analysis, from 2000 to 2019, Pakistan’s human capital and produced capital grew positively because of measures taken by government.
10
11
Impressively, Pakistan’s inclusive wealth increased at an average of 2.3 per cent annually in absolute terms during the period 1992-2019. Analysis of the individual capital categories show that human capital and produced capital grew at a rate of 2.9 per cent and 3.2 per cent respectively, while natural capital declined negligibly, around 0.1 per cent. Natural capital in Pakistan decreased in the areas where the reserve of fossil fuels decreased and where natural land cover was converted to other uses, particularly in the process of urbanization. However, natural capital increased in areas where bare lands have been converted to vegetated land.
There have been exciting recent developments in Pakistan’s management of natural capital. Afforestation across the country as part of the Ten Billion Tree Tsunami Programme (TBTTP) is expected to boost the nation’s renewable natural capital resources, particularly in the decades to come. The TBTTP, initiated by Prime Minister Imran Khan upon his election, has helped to make Pakistan a global pioneer in forest restoration by combining community participation, green job creation and strong political commitment. Overall objectives of the initiative, as stated by Pakistan’s Ministry of Climate Change, were to improve the quality and extent of protected areas, encourage eco-tourism and promote community engagement and job creation.
To ensure that inclusive wealth continues to grow sustainably, Pakistan’s policymakers should invest adequate resources to ensure positive growth of natural capital continues. That investment should be mindful of inclusive of renewable and non-renewable resources, as well as less tangible ecosystem services, such as soil quality and water availability. Both are particularly important to Pakistan, which, though mostly arid, relies on agricultural production to support the nation’s economy.
The analysis in The Inclusive Wealth of Pakistan: The Case for Investing in Natural Capital and Restoration has provided Pakistan with a holistic, wealth-based framework for measuring economic progress. It highlights successes in human and natural capital investment, including the TBTTP, which are key to measuring the sustainable development of Pakistan’s society and economy.
Three key messages arise from the report’s analysis.
1. When making policy decisions that promote sustaina-bility, it is crucial to understand the trade-offs, which that occur both temporally and across types of asset bases (i.e. capital stocks). In a world of scarce resourc-es and ever-increasing demand, trade-offs are inevita-ble, and difficult decisions must be made when setting policy goals.
2. When weighing decisions on investment and navigating trade-offs, social prices of assets, including natural capital, must be understood in addition to market prices. Many of the assets that are critical for maintaining the productive base of Pakistan’s economy are either not priced or are priced at much lower levels than is reflec-tive of their value to the national economy or for human well-being. This is especially true for natural capital, which has historically suffered from systematic under-valuation in cost-benefit and other economic analyses.
3. Inclusive Wealth of Pakistan is a great leap forward towards measuring the contribution of natural resources and systems like expanded forest area, and the health and well-being of human societies. With the combina-tion of the systematic measurement of natural assets, natural capital accounts and the continued focus on restoration as a priority within economic policy, Pakistan is well-placed to be a pioneer in both restoration initiatives and the incorporation of natural capital in the country’s wealth management. Both are cornerstones of the Sustainable Development Goals (SDGs).
11
EXECUTIVE SUMMARY

12
1

13
1. INTRODUCTION
1. INTRODUCTION
13
The COVID-19 pandemic is a stark reminder that humans, animals and the natural environment are intimately connected. Anthropogenic drivers such as land conversion, deforestation, urbanization, climate change and pollution combine to exert ever greater pressure on the vital functions of our biosphere, with devastating consequences for society. It is increasingly acknowledged that post-COVID economic recovery policies cannot take a ‘business as usual’ approach, as doing so will further degrade ecosystems and exacerbate existing risks associated with carbon emissions, biodiversity loss, emerging infectious diseases and land degradation. As governments introduce stimulus packages to support job creation, reduce poverty and boost economic growth, we need to support efforts to ‘build back better’ that aim to reduce the impact of future disasters and shocks. Resilience-based recovery ensures that the health of ecosystems and their capacity to provide essential resources is protected, without undermining people’s well-being (Organisation for Economic Co-operation and Development [OECD] 2020). To build back better, policy formation should focus on green investments, renewable energy, gender equality, ecosystem restoration and the transition to circular economies.
Nations need a guiding compass that will assist them in making rational trade-offs between competing objectives. A UK Government report argues that because the global economy has grown at the expense of natural capital, which has been severely degraded, what we have routinely celebrated as ‘economic growth’ – gross domestic product (GDP) – is no longer an appropriate proxy for progress (Dasgupta 2021). GDP is a measure of economic quantity, not economic quality or welfare, let alone social or environmental well-being (Costanza et al. 2009). Policy and investment decisions made in the post-COVID recovery process should therefore be guided by indicators of wealth rather than income (GDP) alone.
The methodologies and frameworks around wealth accounting have advanced significantly in the past decade. They include the United Nations Environment Programme (UNEP)’s Inclusive Wealth Index (IWI) (see Box 1) and the World Bank’s Changing Wealth of Nations, which have demonstrated that it is possible to assess changes in natural capital, human capital and produced capital across all countries, regardless of their income level. Importantly, the inclusive wealth paradigm shows that future economic possibilities depend on the current management of all forms of capital, or wealth. For a country to increase its inclusive wealth, it must effectively manage human health and skills, manufactured physical infrastructure (e.g. transport, housing, utilities and information and communications technology (ICT)), natural resources
14
(renewable and non-renewable) and ecosystem health (including air quality and climate, biodiversity, soil and oceans), social cohesion and trust, as well as the quality of democratic institutions. Together, these assets form the building blocks needed to progress towards the SDGs.
A notable strength of the IWI as a measure of progress is that it includes natural capital in its estimations. Allocating monetary values to the components of natural capital however is a notoriously complex and difficult task. Fortunately, the available support has been constantly improving, with the United Nations launching the System of Environmental Economic Accounting Ecosystem Accounting (SEEA EA) in 2021. SEEA EA establishes a suite of internationally comparable indicators for ecosystem function and provisions that can be used in natural capital accounting.
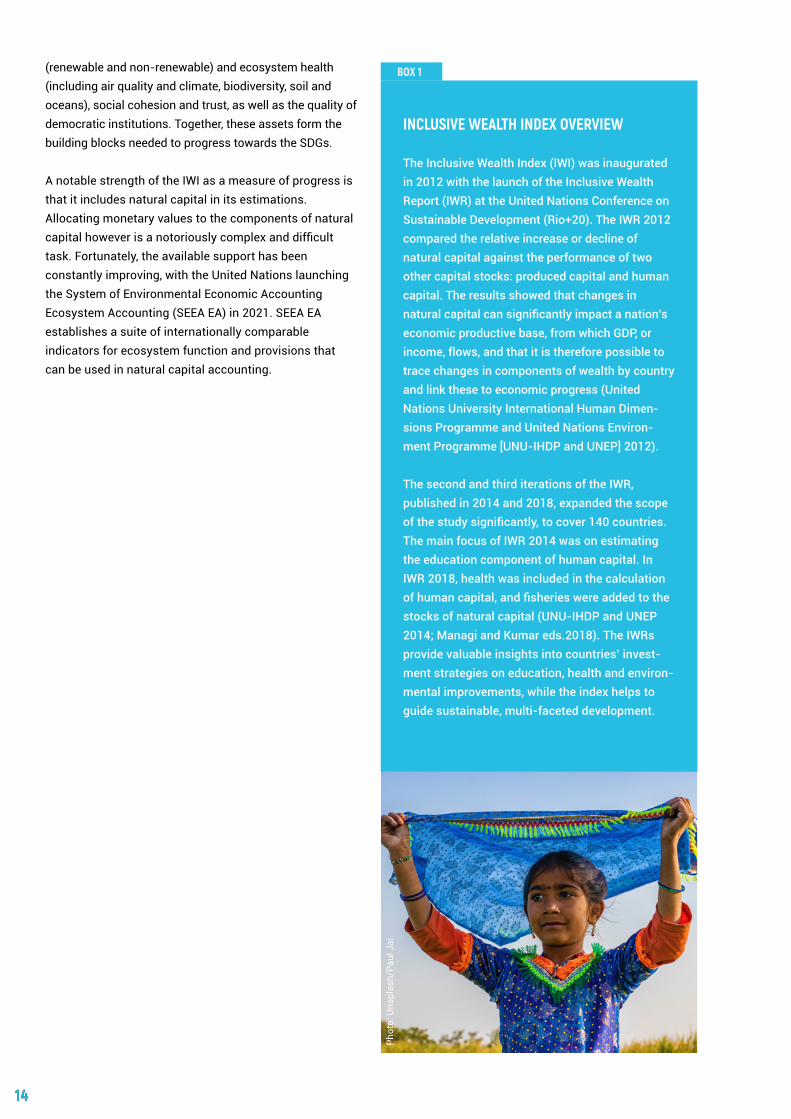
INCLUSIVE WEALTH INDEX OVERVIEW
The Inclusive Wealth Index (IWI) was inaugurated in 2012 with the launch of the Inclusive Wealth Report (IWR) at the United Nations Conference on Sustainable Development (Rio+20). The IWR 2012 compared the relative increase or decline of natural capital against the performance of two other capital stocks: produced capital and human capital. The results showed that changes in natural capital can significantly impact a nation’s economic productive base, from which GDP, or income, flows, and that it is therefore possible to trace changes in components of wealth by country and link these to economic progress (United Nations University International Human Dimen-sions Programme and United Nations Environ-ment Programme [UNU-IHDP and UNEP] 2012).
The second and third iterations of the IWR, published in 2014 and 2018, expanded the scope of the study significantly, to cover 140 countries. The main focus of IWR 2014 was on estimating the education component of human capital. In IWR 2018, health was included in the calculation of human capital, and fisheries were added to the stocks of natural capital (UNU-IHDP and UNEP 2014; Managi and Kumar eds.2018). The IWRs provide valuable insights into countries’ invest-ment strategies on education, health and environ-mental improvements, while the index helps to guide sustainable, multi-faceted development.
14
Phot
o: U
nspl
ash/
Paul
Jai
BOX 1
15
Influential, paradigm-shifting reports, including the Dasgupta Review (Dasgupta, 2021), Shaping the Trends of Our Time (United Nations Economist Network [UNEN] 2020) and Making Peace with Nature, explicitly call for the IWI to be utilized to move beyond GDP in the post-pandemic era. The message is clear: to adequately capture the costs of environmental degradation, the inclusive wealth measure should be used to give more accurate appraisals of holistic, sustainable economic progress (UNEP 2021). At the national level, a large number of countries have embraced the wealth measurement. Countries including India, Morocco, Canada and China have produced their estimates of national and regional wealth following UNEP’s IWI approach. Additionally, Thailand, St Lucia, Barbados, Botswana and Vietnam began working with the index in 2020.
Key arguments for scaling up and mainstreaming the use of inclusive wealth:
a. Statistical infrastructure actively shapes the future. Economic statistics are more than a benign measure-ment tool, they influence and guide policy. This has been the case from the 1940s, when the success of the Marshall Plan was measured by growth in GDP, to the present day, when this national objective tends to be prioritized above all else.
b. Inclusive wealth statistics can help guide policy efforts towards enhancing the capacity of nations to deliver the 2030 Agenda. Sustainable development encompasses a broader set of guiding objectives than economic growth and requires a more inclusive statistical infrastructure than the one currently used to reflect it. There is an urgent need for countries to compile inclusive wealth statistics at the national and regional levels so that post-pandemic recovery can be holistic and well-directed.
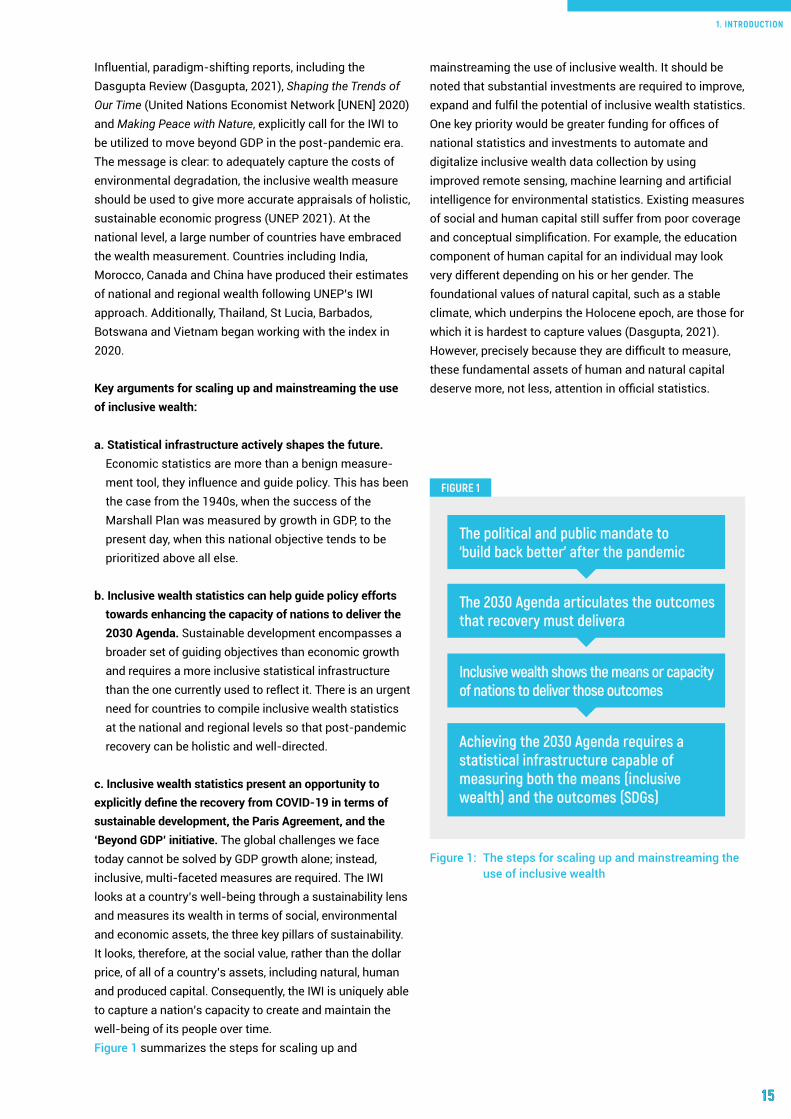
c. Inclusive wealth statistics present an opportunity to explicitly define the recovery from COVID-19 in terms of sustainable development, the Paris Agreement, and the ‘Beyond GDP’ initiative. The global challenges we face today cannot be solved by GDP growth alone; instead, inclusive, multi-faceted measures are required. The IWI looks at a country’s well-being through a sustainability lens and measures its wealth in terms of social, environmental and economic assets, the three key pillars of sustainability. It looks, therefore, at the social value, rather than the dollar price, of all of a country’s assets, including natural, human and produced capital. Consequently, the IWI is uniquely able to capture a nation’s capacity to create and maintain the well-being of its people over time. Figure 1 summarizes the steps for scaling up and
mainstreaming the use of inclusive wealth. It should be noted that substantial investments are required to improve, expand and fulfil the potential of inclusive wealth statistics. One key priority would be greater funding for offices of national statistics and investments to automate and digitalize inclusive wealth data collection by using improved remote sensing, machine learning and artificial intelligence for environmental statistics. Existing measures of social and human capital still suffer from poor coverage and conceptual simplification. For example, the education component of human capital for an individual may look very different depending on his or her gender. The foundational values of natural capital, such as a stable climate, which underpins the Holocene epoch, are those for which it is hardest to capture values (Dasgupta, 2021). However, precisely because they are difficult to measure, these fundamental assets of human and natural capital deserve more, not less, attention in official statistics.
15
The political and public mandate to‘build back better’ after the pandemic
Achieving the 2030 Agenda requires a statistical infrastructure capable of measuring both the means (inclusive wealth) and the outcomes (SDGs)
Figure 1: The steps for scaling up and mainstreaming the use of inclusive wealth
The 2030 Agenda articulates the outcomes that recovery must delivera
Inclusive wealth shows the means or capacity of nations to deliver those outcomes
1. INTRODUCTION
FIGURE 1

16
2
17
2. ECONOMY OF PAKISTAN
Pakistan’s economy has been growing slowly over the last two decades, with annual per capita GDP growth at around 2 per cent (less than half the South Asian average growth). However Financial Year 2020 (FY2020) witnessed remarkable turnaround resulting in sustained adjustment in current account deficit and continued fiscal prudence. During July-March, FY2020, fiscal deficit decreased to 4.0 percent of GDP, while current account deficit reduced by 71 percent during July-April, FY2020 (Economic Survey of Pakistan, 2019-20). In addition, the exchange rate remained stable and FDI growth showed improved ranking in the World Bank’s ease of doing business index, along with a stable credit outlook to B3 from negative by Moody’s (Economic Survey of Pakistan, 2019-20). Consistent with global trends, the lockdown measures introduced to tackle the COVID-19 pandemic in Pakistan caused a sharp slowdown in economic activity, with the economy contracting by around 1.5 per cent during the final quarter of Fiscal Year 2020 (FY20). Job and income losses affected half the working population, with the burden falling mostly on those in informal and low-skilled employment. A devastating flow-on effect was that, according to estimates, poverty increased from 4.4 per cent to 5.4 per cent in FY2020, affecting more than 2 million people (World Bank 2021).
In response, immediate relief of Rs.12000/per month was given to 12 million poor families under EHSAS social protection programme. As well, stimulus packages equivalent to 2.9 per cent of GDP were implemented by the Government. These enabled a fragile recovery in the latter half of 2020, which was assisted by increased community mobility, consumption, record remittance inflows and slight increases in produced capital investment. Although a current account deficit of US$2 billion was recorded in the June-December period of 2019, a surplus of US$1.1 billion was recorded for the same period in 2020. This was the first half-yearly surplus in almost a decade and was attributed to remittances inflows more than offsetting the wider trade deficit (World Bank 2021). During July-April 2019-20 exports were US$19.7 billion compared to 20.1 billion for the same period last year, and remittances increased to US$18.8 billion from US$17.8 billion for the corresponding period. Foreign exchange reserves also indicated a positive increase during 2019-20 (Economic Survey of Pakistan, 2019-20).
17
2. ECONOMY OF PAKISTAN

18
Pakistan’s economy has three main sectors; Agriculture, Industry and Services sectors. Agriculture sector grew by 2.67 per cent during FY 2020, Industry has shown negative growth in mining and quarrying (-8.82), large scale manufacturing (-7.78). Services sector also exhibited a decline at the rate of 0.59 per cent mainly due to whole sale and retail trade, transport, storage and communication subsectors. However housing, General Government Services and other private services contributed 4.02 per cent, 3.92 per cent and 5.39 per cent respectively (Economic Survey of Pakistan, 2019-2020).
19
Phot
o: U
nspl
ash/
Has
eeb
Jam
il
2. ECONOMY OF PAKISTAN

20
3
21
3. ENVIRONMENTAL PRESSURES IN PAKISTAN
By population, Pakistan is the fifth largest nation in the world, and it is endowed with significant wealth in natural resources. The diversity of landscapes and ecosystems in Pakistan is tremendous, extending from the Karakoram and Himalayan ranges in the north to the Sindh coastal zones in the south, which support a thriving fishing industry. Pakistan is generally very arid and relies upon a single river system, the Indus. The floodplains and water available from the Indus are critically important for the country’s agricultural sector, which accounts for over 21 per cent of GDP and employs 45 per cent of the labour force (UNEP 2013). The rangelands, which cover the majority of the mountainous landmass, support Pakistan’s flourishing livestock industry. Pakistan’s diverse biomes provide vital ecosystem services for the nation, including robust soil quality, water availability, cultural values and primary resources such as timber, fuel and minerals.
In Pakistan, as around the world, numerous drivers of environmental decline are at work. The focus on narrow metrics such as GDP instead of on the quality of pathways to sustainable development is one such driver. In general, environmental considerations have not been properly integrated into planning and development strategies (UNEP 2014), though in recent years there has been a new focus on protecting Pakistan’s natural wealth. The large and growing population of Pakistan exacerbates many existing pressures on environmental resources. Since 1947, Pakistan’s population has increased at an average rate of 2.7 per cent per annum, resulting in an estimated population of 225.2 million in 2021 (Pakistan Bureau of Statistics [PBS] 2021). Human activity and greater urbanization and industrialization have brought economic benefits for citizens, but they have also resulted in widespread degradation of land, deforestation, intensified water scarcity and loss of biodiversity. Coastal areas of Pakistan have especially suffered from environmental degradation through, for instance, overfishing, salt intrusion, and land reclamation. Deforestation is a countrywide concern and has severely degraded not just the coastal but also the mountainous and riverine regions. The chronic pressures of pollution, overexploitation of species, and a lack of knowledge and conservation practices at the household level are compounded by climate change, resulting in widespread threats to livelihoods and economic and socio-political tensions (International Union for Conservation of Nature [IUCN] 2017 and UNEP 2013).
Although Pakistan’s contribution to global CO2 emissions is only around 0.5 per cent of the annual total, it remains one of the nations most vulnerable to the ramifications of climate change. Climate change impacts are already
21
3. ENVIRONMENTAL PRESSURES IN PAKISTAN
22
appearing across the country, with glacial melt in the Hindu Kush-Himalaya region, higher temperatures and increased variability in monsoon patterns adversely affecting agricultural production and food security. Increased flood and drought incidence and saline water intrusion from sea level rise will only compound these effects. Public health risks increase as the environmental burden of disease may rise with water-borne diseases associated with flooding, heat stress from rising temperatures, and malnutrition associated with food insecurity (UNEP, 2019).
3.1 PREVIOUS TRENDS IN NATURAL CAPITAL ACCORDING TO IWI
The term ‘natural capital’ is used to describe the world’s stocks of natural assets, which include geology, soil, air, water and ecosystems generally (World Forum on Natural Capital 2021). The depreciation and degradation of natural capital is closely related to the negative externalities resulting from the development of various sectors of the economy, particularly non-renewable resources.
According to the most recent iteration of UNEP’s IWR (2018), many countries in Asia have been experiencing declines in natural capital 1, and Pakistan is no exception. From 1990 to 2014, Pakistan suffered an average decline of natural capital per capita of 5 per cent, the steepest fall of the 26 Asian countries included in the IWI calculations (Managi and Kumar (eds.) 2018). A closer look at specific components of natural capital shows some components declining while others improve. For Pakistan, IWR 2018 shows a steady increase of agricultural land area, with an average annual growth rate of 0.58 per cent. However, it also shows a sharp decline in forest cover, which is even starker if per capita loss is considered: from the baseline, cover had declined by 5 per cent in 1990, by 12.1 per cent in 1995, by 17.8 per cent in 2000, by 23.5 per cent in 2010 and by 35.9 per cent in 2014 (Managi and Kumar (eds.) 2018). Particularly in the renewable category of natural capital, Pakistan has seen remarkable improvement in recent years, and these trends, drivers, and policy initiatives will be discussed in the following sections.
1 In the current inclusive wealth methodology, the calculation of natural capital takes into account both renewable resources (agricultural land, forests and fisheries) and non-renewable resources (fossil fuels and minerals) (Managi and Kumar (eds.) 2018).
3.2 PATHWAYS TO IMPROVEMENTS AND RESTORATION EFFORTS
The objectives of environmental improvement and economic growth are interconnected by necessity. It has been shown time and again that it is not possible to simply ‘grow out’ of environmental or social problems by focusing on economic growth alone. The World Bank (2006) found that focusing on prevention and mitigation of environmental degradation was much more cost-effective than allowing environmental neglect and hoping that GDP growth would improve environmental and social indicators. An example of this paradigm is that, in 1990, despite enjoying better economic growth, Pakistan had a higher deforestation rate than other countries in the same income group. In recent years, Pakistan has recognized that the cost of inaction is greater than that of ecosystem restoration itself and has implemented ambitious and successful strategies for halting and reversing the patterns of decline in natural capital. Having been elected Prime Minister in 2018, Imran Khan launched the Ten Billion Tree Tsunami Programme (TBTTP), which is the 4th largest afforestation and restoration initiative in the world, thereby establishing Pakistan among global pioneers in forest restoration. The programme is evidence of strong political commitment and will involve community participation and green job creation. This is one of the world’s most ambitious afforestation efforts and will initially be implemented over five years. Momentum for the TBTTP arose from the province of Khyber Pakhtunkhwa, which in 2014 became the first entity worldwide to complete the Bonn Challenge, a global effort to restore 350 million hectares of degraded and deforested land by 2030. Moreover, it did so in half the planned time and on half the initial budget (Khan et al. 2017). This achievement was largely possible due to the joint efforts of the province’s communities and the Khyber Pakhtunkhwa forest department (IUCN 2017). According to the UN Food and Agriculture Organisation, these efforts led to an increase of 6.3 per cent of forest cover in KPK province, from 20.31 million Ha to 26.6 million from 2014 to 2019. The total area planted or regenerated under this project is around 593 292 ha. (Food and Agriculture Organization of the United Nations [FAO], 2020). The BTAP (in Khyber Pakhtunkhwa) has greatly helped in modeling one of the major restoration programmes not only in Pakistan but also globally. This has not only halted but reversed the deforestation trends in the fragile mountain ecosystem in the northwestern part of the country considered as the major source of fresh water supply and hosting biodiversity hotspots.

Table 1a: Billion Tree Afforestation Project in Khyber Pakhtunkhwa
23
The TBTTP is extensive, and its plans include restoring mangroves and forests, as well as planting trees in urban settings, including schools, colleges, public parks and green belts. Pakistan has launched an Ecosystem Restoration Fund to support nature-based solutions to climate change and facilitate the transition towards environmentally resilient, ecologically-targeted initiatives covering afforestation and biodiversity conservation. With far-reaching programmes such as the TBTTP, Pakistan is demonstrating how nature-based initiatives can provide solutions to multiple objectives, such as ensuring sustainable livelihoods and food and water security and reducing poverty (Perring, Erickson and Brancalion 2018). The overall objectives of this initiative, as stated by Pakistan’s Ministry of Climate Change, are to revive forest and wildlife resources, improve conservation of existing protected areas, encourage eco-tourism and promote community engagement and job creation. The programme will also create powerful entry points for improving gender equality and bringing greater visibility to the contributions, in terms of labour and knowledge, that women make to Pakistan’s agricultural sector (FAO 2015). Importantly, the TBTTP will help to mitigate the impact of climate change through forest carbon sequestration and by preventing land and soil degradation (IUCN 2020). Moreover, the neem tree (Azadirachta indica) is one of the main species chosen for afforestation; products made from these trees are known to offer multiple benefits, being used in medicines (Al-Hashemi and Hossain 2016) and for disease control in crops, such as chickpeas, that are critical for food security (Khan et al. 2020).
The TBTTP has also had a very positive impact on employment in Pakistan, with an estimated 85,000 jobs being created through paying unemployed community members of the community to work in tree nurseries. Additionally, Prime Minister Khan announced in 2020 that over 7,300 square kilometers within 15 national parks will be established in the near future, creating 5,000 jobs in the process (Farand 2021). A summary of restoration achievements of both the KPK Province-level and national-level restoration projects are seen in Tables 1a, 1b, and Figures 2a and 2b.
Source: Khyber Pakhtunkhwa Forest Department, 2020
3. ENVIRONMENTAL PRESSURES IN PAKISTAN
Figure 2: TBTT Afforestation, Current Achievement and Future Scenario
Years Number of plants (million)
Area (Ha)
2015-16 139.7 53904
2016-17 990.97 488480
2017-18 77.33 50908
Total 1208 593,292
Target (June 2023)
Number of plants Planted/Regenerated/Distributed Till April 2021
TARGETS AND ACHIEVEMENTS OF TBTT PROJECT
1000
400
800
200
600
0KPK Punjab Sindh Baluchistan AJK GB
FIGURE 2

The Ten Billion Tree Project has a total target of 3.296 billion plants to be planted/ regenerated by the end of Phase – I in June, 2023. A total of 859.426 million plants were planted/ regenerated over an area of 381,374 hectares between 2018 and April, 2021 all over Pakistan. It is anticipated that the regeneration involving one billion plants will be completed by June 2021. The restoration and plantation targets disaggregated by region is presented in Table 1b and Figure 3.
24
Pakistan’s marine conservation strategies are also gaining momentum with Astola - the largest of the nation’s offshore islands - declared the nation’s first Marine Protected Area (MPA) in 2017. Many other projects facilitated by local and national government entities in partnership with IUCN Pakistan have had notable achievements such as improving education and capacity-building of fisher folk and tourism operators and sea-turtle conservation along the Karachi coast to tackle illegal wildlife trade (IUCN, 2017). The government of Sindh also funded an IUCN project that tackles the sea intrusion and erosion through ecosystem-based solutions, including planting 50,000 hectares of mangroves and inland protective plantations, as well as sustainable livelihood creation for coastal communities (IUCN, 2017). Pakistan has initiated a major mangrove restoration program, and so far mangrove cover in Pakistan has increased from an estimated 477.22 km2 in 1990 to 1463.59 km2 in 2020, with a 3.74 per cent annual rate of change. Overall, there has been 300 per cent increase in mangrove cover since 1990 i.e. by 986.36 km2, in addition to a marked enhancement in tree canopy density (Gilani et al., 2020).
Furthermore, the pilot project Clean Green Pakistan Movement (CGPM) has been successfully implemented in 20 cities in 2020, and it is now being scaled up in 93 cities of Pakistan across the country in 2021 (MoCC, 2019). In the first phase, the Clean Green Pakistan Index (CGPI) and the Champions Program, which was piloted in 20 selected cities of Punjab and KPK, was concluded in October 2020. The Prime Minister of Pakistan chaired an encouragement award ceremony, at the Prime Minister’s Office.
Table 1b: Ten Billion Tree Tsunami progress across provinces
Source: (TBTTP, Ministry of Climate Change Pakistan)
Province Target number of plants distributed
and planted by June 2023
(in millions)
Number of plants distributed
and planted as of April 2021
(in millions)
Area (Hectare)
KPK 1000 310.94 278450
Punjab 466 66.675 24393
Sindh 1000 359.98 25139
Baluchistan 100 5.552 1912
AJK 560 105.09 47857
GB 170 11.19 3623
NSSU/MoCC 0.25 - -
Total 3296.25 859.426 381,374
AREA (HA)
NUMBER OF PLANTS (MILLION)
500000
1000
200000
400
400000
800
100000
200
300000
600
0
0
2015-16
2015-16
2016-17
2016-17
2017-18
2017-18
FIGURE 3

25
3. ENVIRONMENTAL PRESSURES IN PAKISTAN
Phot
o: U
nspl
ash/
Muh
amm
ad K
huba
ib

26
4

27
4. INCLUSIVE WEALTH OF PAKISTAN AT THE NATIONAL LEVEL
4.1 STOCK OF INCLUSIVE WEALTH AT THE NATIONAL LEVEL
This section investigates the inclusive wealth estimates of Pakistan at the national level. As discussed earlier, inclusive wealth comprises three different categories of capital assets: natural capital, human capital and produced capital. Assets in all three categories provide the inputs for production and are therefore referred to as the productive base of the economy. Produced capital is perhaps the easiest to conceptualize, as it encompasses assets that economists have historically referred to as ‘capital’. It includes investment in roads, ports, cables, buildings, machines, equipment and other physical, manufactured infrastructure. Human capital refers to the population (both the size and composition) and to the knowledge and skills acquired by education. Some wealth estimates include heath metrics in human capital accounts, but the scope of this paper allows for education-related human capital only. Natural capital is estimated according to subsoil non-renewable resources, forests and agricultural land. Conceptually, ecosystem services such as microclimates, biodiversity and cultural values contribute to natural capital too but are excluded from this report due to data availability constraints.
Here we lay out the methodology and data used to compute inclusive wealth. We are interested in the change of intertemporal well-being at:
Assuming equivalence between wealth and well-being, this is measured by wealth in practice. Denoting produced, human, and natural capital as K,H, and N, the change in inclusive wealth W is expressed by:
where p_K,p_H and p_K are the marginal shadow prices of produced, human and natural capital, respectively. They are formally defined by:
27
4. INCLUSIVE WEALTH OF PAKISTAN AT THE NATIONAL LEVEL
𝑉𝑉(𝑡𝑡) = & 𝑈𝑈(𝐶𝐶!)𝑒𝑒"#(!"%)𝑑𝑑𝑑𝑑'
%
𝑑𝑑𝑊𝑊(𝐾𝐾,𝐻𝐻,𝑁𝑁, 𝑡𝑡)𝑑𝑑𝑡𝑡 = 𝑝𝑝𝐾𝐾
𝑑𝑑𝐾𝐾𝑑𝑑𝑡𝑡 + 𝑝𝑝𝐻𝐻
𝑑𝑑𝐻𝐻𝑑𝑑𝑡𝑡 + 𝑝𝑝𝑁𝑁
𝑑𝑑𝑁𝑁𝑑𝑑𝑡𝑡 +
𝜕𝜕𝑉𝑉𝜕𝜕𝑡𝑡
𝑝𝑝𝐾𝐾 ≡𝜕𝜕𝑉𝑉𝜕𝜕𝐾𝐾 ,𝑝𝑝𝐻𝐻 ≡
𝜕𝜕𝑉𝑉𝜕𝜕𝐻𝐻 ,𝑝𝑝𝑁𝑁 ≡
𝜕𝜕𝑉𝑉𝜕𝜕𝑁𝑁,
𝐼𝐼𝑊𝑊𝐼𝐼 = 𝑝𝑝+𝐾𝐾 + 𝑝𝑝,𝐻𝐻 + 𝑝𝑝-𝑁𝑁
𝑉𝑉(𝑡𝑡) = & 𝑈𝑈(𝐶𝐶!)𝑒𝑒"#(!"%)𝑑𝑑𝑑𝑑'
%
𝑑𝑑𝑊𝑊(𝐾𝐾,𝐻𝐻,𝑁𝑁, 𝑡𝑡)𝑑𝑑𝑡𝑡 = 𝑝𝑝𝐾𝐾
𝑑𝑑𝐾𝐾𝑑𝑑𝑡𝑡 + 𝑝𝑝𝐻𝐻
𝑑𝑑𝐻𝐻𝑑𝑑𝑡𝑡 + 𝑝𝑝𝑁𝑁
𝑑𝑑𝑁𝑁𝑑𝑑𝑡𝑡 +
𝜕𝜕𝑉𝑉𝜕𝜕𝑡𝑡
𝑝𝑝𝐾𝐾 ≡𝜕𝜕𝑉𝑉𝜕𝜕𝐾𝐾 ,𝑝𝑝𝐻𝐻 ≡
𝜕𝜕𝑉𝑉𝜕𝜕𝐻𝐻 ,𝑝𝑝𝑁𝑁 ≡
𝜕𝜕𝑉𝑉𝜕𝜕𝑁𝑁,
𝐼𝐼𝑊𝑊𝐼𝐼 = 𝑝𝑝+𝐾𝐾 + 𝑝𝑝,𝐻𝐻 + 𝑝𝑝-𝑁𝑁
𝑉𝑉(𝑡𝑡) = & 𝑈𝑈(𝐶𝐶!)𝑒𝑒"#(!"%)𝑑𝑑𝑑𝑑'
%
𝑑𝑑𝑊𝑊(𝐾𝐾,𝐻𝐻,𝑁𝑁, 𝑡𝑡)𝑑𝑑𝑡𝑡 = 𝑝𝑝𝐾𝐾
𝑑𝑑𝐾𝐾𝑑𝑑𝑡𝑡 + 𝑝𝑝𝐻𝐻
𝑑𝑑𝐻𝐻𝑑𝑑𝑡𝑡 + 𝑝𝑝𝑁𝑁
𝑑𝑑𝑁𝑁𝑑𝑑𝑡𝑡 +
𝜕𝜕𝑉𝑉𝜕𝜕𝑡𝑡
𝑝𝑝𝐾𝐾 ≡𝜕𝜕𝑉𝑉𝜕𝜕𝐾𝐾 ,𝑝𝑝𝐻𝐻 ≡
𝜕𝜕𝑉𝑉𝜕𝜕𝐻𝐻 ,𝑝𝑝𝑁𝑁 ≡
𝜕𝜕𝑉𝑉𝜕𝜕𝑁𝑁,
𝐼𝐼𝑊𝑊𝐼𝐼 = 𝑝𝑝+𝐾𝐾 + 𝑝𝑝,𝐻𝐻 + 𝑝𝑝-𝑁𝑁
28
given a forecast of how produced, human and natural capitals, as well as other flow variables, evolve in the future in an economy. Practically, shadow prices act as a weight factor attached to each capital, resulting in the measure of wealth, or IWI:
In practice, we can use W and IWI interchangeably, although they can differ in that IWI also uses shadow prices (prices that are calculated for non-market goods and services) on the margin. In addition, the unit of IWI is in monetary (US$) terms, rather than utility units. This does not affect sustainability assessment.
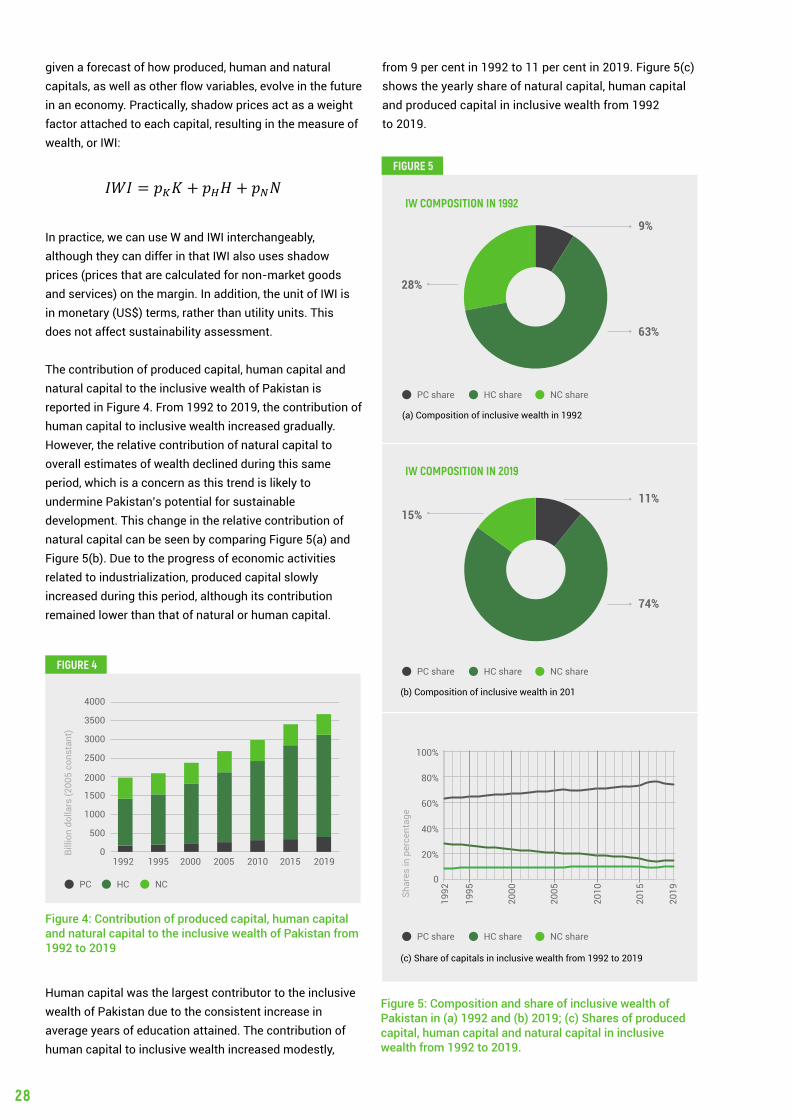
The contribution of produced capital, human capital and natural capital to the inclusive wealth of Pakistan is reported in Figure 4. From 1992 to 2019, the contribution of human capital to inclusive wealth increased gradually. However, the relative contribution of natural capital to overall estimates of wealth declined during this same period, which is a concern as this trend is likely to undermine Pakistan’s potential for sustainable development. This change in the relative contribution of natural capital can be seen by comparing Figure 5(a) and Figure 5(b). Due to the progress of economic activities related to industrialization, produced capital slowly increased during this period, although its contribution remained lower than that of natural or human capital.
Human capital was the largest contributor to the inclusive wealth of Pakistan due to the consistent increase in average years of education attained. The contribution of human capital to inclusive wealth increased modestly,
Figure 4: Contribution of produced capital, human capital and natural capital to the inclusive wealth of Pakistan from 1992 to 2019
Figure 5: Composition and share of inclusive wealth of Pakistan in (a) 1992 and (b) 2019; (c) Shares of produced capital, human capital and natural capital in inclusive wealth from 1992 to 2019.
FIGURE 4
FIGURE 5
from 9 per cent in 1992 to 11 per cent in 2019. Figure 5(c) shows the yearly share of natural capital, human capital and produced capital in inclusive wealth from 1992 to 2019.
(a) Composition of inclusive wealth in 1992
(b) Composition of inclusive wealth in 201
(c) Share of capitals in inclusive wealth from 1992 to 2019
3000
3500
4000
Billi
on d
olla
rs (2
005
cons
tant
)
1000
2000
2500
500
1500
01992 1995 2000 2005 2010 2015 2019
PC HC NC
PC share HC share NC share
PC share HC share NC share
PC share HC share NC share
20%
0
40%
60%
80%
100%
1992
1995
2000
2005
2010
2015
2019Sh
ares
in p
erce
ntag
e
IW COMPOSITION IN 1992
9%
63%
28%
15%11%
74%
IW COMPOSITION IN 2019
𝑉𝑉(𝑡𝑡) = & 𝑈𝑈(𝐶𝐶!)𝑒𝑒"#(!"%)𝑑𝑑𝑑𝑑'
%
𝑑𝑑𝑊𝑊(𝐾𝐾,𝐻𝐻,𝑁𝑁, 𝑡𝑡)𝑑𝑑𝑡𝑡 = 𝑝𝑝𝐾𝐾
𝑑𝑑𝐾𝐾𝑑𝑑𝑡𝑡 + 𝑝𝑝𝐻𝐻
𝑑𝑑𝐻𝐻𝑑𝑑𝑡𝑡 + 𝑝𝑝𝑁𝑁
𝑑𝑑𝑁𝑁𝑑𝑑𝑡𝑡 +
𝜕𝜕𝑉𝑉𝜕𝜕𝑡𝑡
𝑝𝑝𝐾𝐾 ≡𝜕𝜕𝑉𝑉𝜕𝜕𝐾𝐾 ,𝑝𝑝𝐻𝐻 ≡
𝜕𝜕𝑉𝑉𝜕𝜕𝐻𝐻 ,𝑝𝑝𝑁𝑁 ≡
𝜕𝜕𝑉𝑉𝜕𝜕𝑁𝑁,
𝐼𝐼𝑊𝑊𝐼𝐼 = 𝑝𝑝+𝐾𝐾 + 𝑝𝑝,𝐻𝐻 + 𝑝𝑝-𝑁𝑁
29
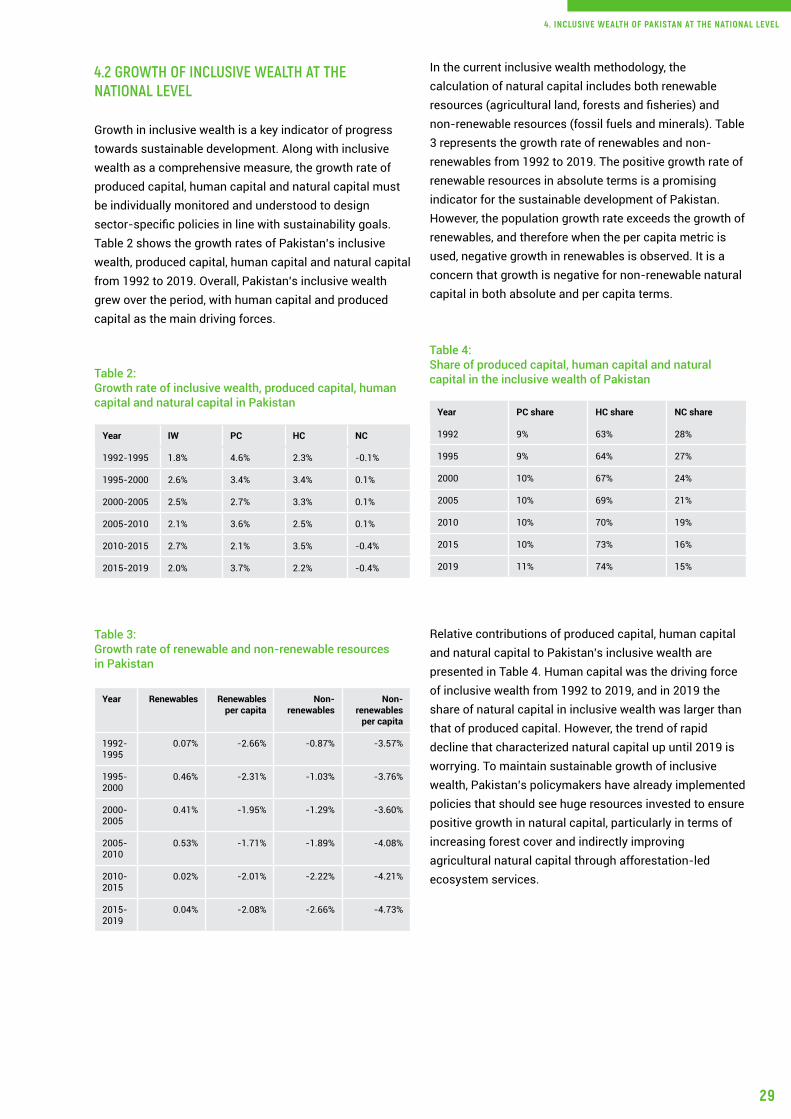
In the current inclusive wealth methodology, the calculation of natural capital includes both renewable resources (agricultural land, forests and fisheries) and non-renewable resources (fossil fuels and minerals). Table 3 represents the growth rate of renewables and non-renewables from 1992 to 2019. The positive growth rate of renewable resources in absolute terms is a promising indicator for the sustainable development of Pakistan. However, the population growth rate exceeds the growth of renewables, and therefore when the per capita metric is used, negative growth in renewables is observed. It is a concern that growth is negative for non-renewable natural capital in both absolute and per capita terms.
Relative contributions of produced capital, human capital and natural capital to Pakistan’s inclusive wealth are presented in Table 4. Human capital was the driving force of inclusive wealth from 1992 to 2019, and in 2019 the share of natural capital in inclusive wealth was larger than that of produced capital. However, the trend of rapid decline that characterized natural capital up until 2019 is worrying. To maintain sustainable growth of inclusive wealth, Pakistan’s policymakers have already implemented policies that should see huge resources invested to ensure positive growth in natural capital, particularly in terms of increasing forest cover and indirectly improving agricultural natural capital through afforestation-led ecosystem services.
4.2 GROWTH OF INCLUSIVE WEALTH AT THE NATIONAL LEVEL
Growth in inclusive wealth is a key indicator of progress towards sustainable development. Along with inclusive wealth as a comprehensive measure, the growth rate of produced capital, human capital and natural capital must be individually monitored and understood to design sector-specific policies in line with sustainability goals. Table 2 shows the growth rates of Pakistan’s inclusive wealth, produced capital, human capital and natural capital from 1992 to 2019. Overall, Pakistan’s inclusive wealth grew over the period, with human capital and produced capital as the main driving forces.
Table 2: Growth rate of inclusive wealth, produced capital, human capital and natural capital in Pakistan
Table 4: Share of produced capital, human capital and natural capital in the inclusive wealth of Pakistan
Table 3: Growth rate of renewable and non-renewable resources in Pakistan
Year IW PC HC NC
1992-1995 1.8% 4.6% 2.3% -0.1%
1995-2000 2.6% 3.4% 3.4% 0.1%
2000-2005 2.5% 2.7% 3.3% 0.1%
2005-2010 2.1% 3.6% 2.5% 0.1%
2010-2015 2.7% 2.1% 3.5% -0.4%
2015-2019 2.0% 3.7% 2.2% -0.4%
Year PC share HC share NC share
1992 9% 63% 28%
1995 9% 64% 27%
2000 10% 67% 24%
2005 10% 69% 21%
2010 10% 70% 19%
2015 10% 73% 16%
2019 11% 74% 15%
Year Renewables Renewables per capita
Non- renewables
Non-renewables
per capita
1992-1995
0.07% -2.66% -0.87% -3.57%
1995-2000
0.46% -2.31% -1.03% -3.76%
2000-2005
0.41% -1.95% -1.29% -3.60%
2005-2010
0.53% -1.71% -1.89% -4.08%
2010-2015
0.02% -2.01% -2.22% -4.21%
2015-2019
0.04% -2.08% -2.66% -4.73%
4. INCLUSIVE WEALTH OF PAKISTAN AT THE NATIONAL LEVEL

30
5
31
5. INCLUSIVE WEALTH OF PAKISTAN AT THE REGIONAL LEVEL
5. INCLUSIVE WEALTH OF PAKISTAN AT THE REGIONAL LEVEL
31
This section contains an analysis of Pakistan’s inclusive wealth at the grid-cell and province levels. The findings are based on the application of the inclusive wealth framework from a geospatial perspective. To identify the optimal grid-cell level information, we used a geographic, information system-based measure of the inclusive wealth of nations designed by Bingqi Zhang, Wataru Nozawa and Shunsuke Managi (Zhang, Nozawa and Managi 2020). The spatial resolution of gridded inclusive wealth data is 30 arc seconds (approximately 1 km). The inclusive wealth of Pakistan is calculated by using hybrid data comprising satellite images as well as regional and national data.
5.1 INCLUSIVE WEALTH AT THE GRID LEVEL
The distribution of inclusive wealth is heterogeneous across Pakistan. The Punjab and Sindh regions of Pakistan improved overall in terms of inclusive wealth from 2000¬-2019, compared to the other regions of Pakistan. Human capital was one of the most important contributors to the high inclusive wealth in Punjab, Sindh and Khyber Pakhtunkhwa. Pakistan’s produced-capital assets were concentrated in Punjab, Sindh and Balochistan regions, while the share of natural capital in Balochistan’s inclusive wealth was high compared with the other regions.
5.2 HUMAN CAPITAL AT THE GRID LEVEL
The grid-level data analysis shows Punjab, Sindh and Khyber Pakhtunkhwa all contributed to the increase in human capital in Pakistan, but Balochistan showed comparatively little progress on this metric. The investment and improvement in education in Pakistan across the country is reflected in the overall value increase in human capital.
5.3 PRODUCED CAPITAL AT THE GRID LEVEL
The distribution of produced capital mirrors the patterns in human capital distribution, outlined in section 4.2, in that produced capital, in terms of absolute and positive growth, is concentrated in Punjab, Sindh and Khyber Pakhtunkhwa, indicating an increased focus on infrastructure development in these areas. The personal capital of Balochistan is also growing, but at a slower rate than the other provinces. This is to be expected, given that Balochistan accounts for only around 6 per cent of the population (PBS 2017). Overall, the patterns of produced capital distribution show a promising trajectory for Pakistan’s development.

5.4 NATURAL CAPITAL AT THE GRID LEVEL
Box 2 outlines the valuation methodology. The data shows natural capital values to be especially high in the southern coastal regions, where the mangrove ecosystems make a significant contribution to inclusive wealth due to the benefits they provide, including breeding grounds for the fishing sector, carbon sequestration, buffering against extreme weather events, and erosion reduction.
5.4.1 Renewable natural resourcesIn Pakistan, the renewable resources component of natural capital accounted for 77 per cent in 1992 and 85 per cent in 2019. The contribution that renewable resources make to wealth tends to directly depend on the land cover dynamics and how they change over time. The following section (4.4.2) provides additional information about the land cover.
5.4.2 Land coverOver the period of 1992-2019, 7 per cent of Pakistan’s land area was converted to a different type of land cover. The urbanization of natural land (mainly between 2000 and 2010) was a strong trend, and 6 per cent of cropland alone was converted for urban use from 2000-2010. Wetlands accounted for the largest share of the value attributed to Pakistan’s renewable resources, due to the comparably high ecosystem service value of mangrove ecosystems (Box 2).
Table 5: The shadow prices for ecosystem types
Table 6 presents the value of different types of natural resources in Pakistan, based on remote sensing land cover data. This study calculates the total value of the land, based on coverage information at the grid-cell level. Land cover data from the European Space Agency’s Climate Change Initiative on Land Cover (http://www.esa-landcover-cci.org/?q=node/164) is used for high resolution (300m spatial resolution) information. This data informs the valuation of the selected ecosystem products and services. The natural resource values are calculated for the period 1992-2019 based on the unit values of land types and their coverage. The values of natural resources in Table 6 are represented in millions of US$. The values of cropland are significantly higher than other land-use types, particularly forests. The low valuation of forests has been a concern and, recently, the subject of policymaker’s attention, particularly with regard to the TBTTP.
THE VALUATION OF NATURAL RESOURCES BASED ON REMOTE SENSING LAND COVER DATA
Following the procedure presented by de Groot et al. (2012), this study uses a benefit transfer method to obtain values for each biome included in the Ecosystem Service Value Database (ESVD). The analysis also links each type of biome with a parallel or equivalent land cover type (Li, Fang and Wang 2016). Table 5 shows the shadow prices, i.e. prices that are calculated for non-market goods and services, for all land cover types, taking all types of ecosystem services into account, including provisioning services such as food and timber production.guide sustainable, multi-facet-ed development.
Land-use types Parallel biome type per km2 wealth of ES (in US$)
Forests in the tropical zone
Tropical forest 3.0765
Forests north of the tropical zone
Temperate/boreal forest
1.7934
Grasslands and shrublands
Grass/rangelands 2.3816
Mangroves Tidal marsh/mangroves
110.8169
Wetlands Swamps/floodplains 14.6814
Waterbodies Lakes/rivers 7.1528
Cultivated lands Cropland 3.1824
32
BOX 2
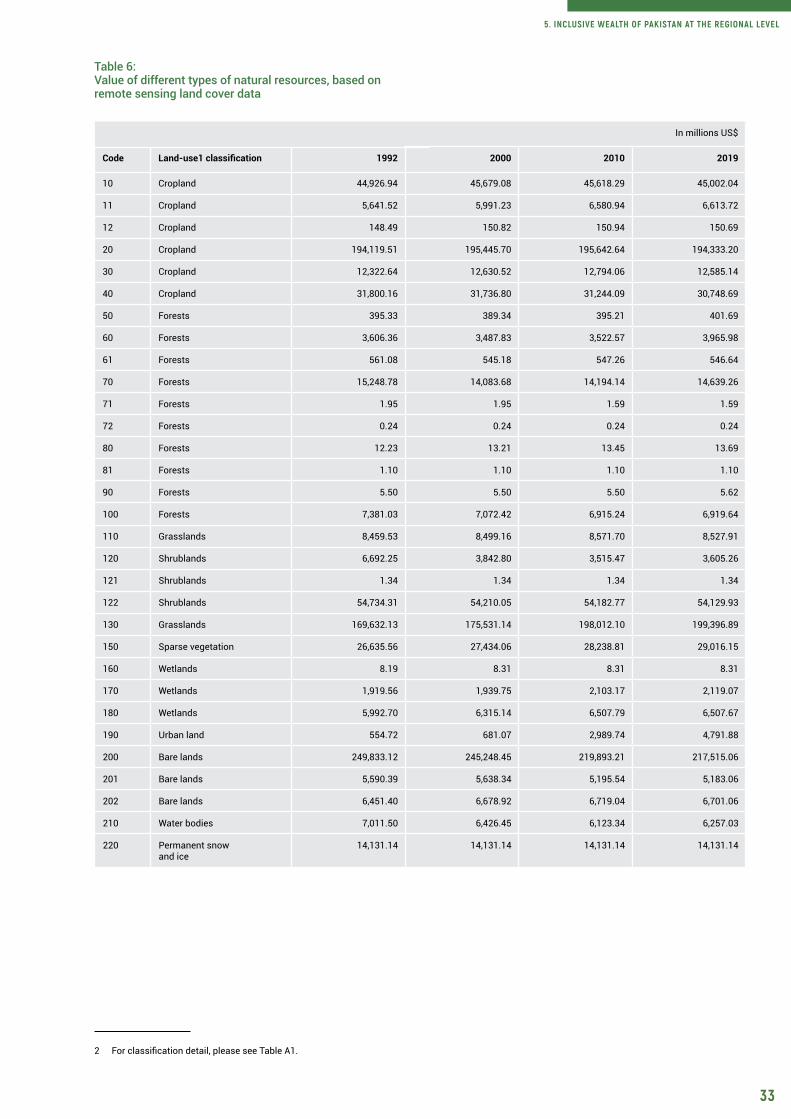
Table 6: Value of different types of natural resources, based on remote sensing land cover data
In millions US$
Code Land-use1 classification 1992 2000 2010 2019
10 Cropland 44,926.94 45,679.08 45,618.29 45,002.04
11 Cropland 5,641.52 5,991.23 6,580.94 6,613.72
12 Cropland 148.49 150.82 150.94 150.69
20 Cropland 194,119.51 195,445.70 195,642.64 194,333.20
30 Cropland 12,322.64 12,630.52 12,794.06 12,585.14
40 Cropland 31,800.16 31,736.80 31,244.09 30,748.69
50 Forests 395.33 389.34 395.21 401.69
60 Forests 3,606.36 3,487.83 3,522.57 3,965.98
61 Forests 561.08 545.18 547.26 546.64
70 Forests 15,248.78 14,083.68 14,194.14 14,639.26
71 Forests 1.95 1.95 1.59 1.59
72 Forests 0.24 0.24 0.24 0.24
80 Forests 12.23 13.21 13.45 13.69
81 Forests 1.10 1.10 1.10 1.10
90 Forests 5.50 5.50 5.50 5.62
100 Forests 7,381.03 7,072.42 6,915.24 6,919.64
110 Grasslands 8,459.53 8,499.16 8,571.70 8,527.91
120 Shrublands 6,692.25 3,842.80 3,515.47 3,605.26
121 Shrublands 1.34 1.34 1.34 1.34
122 Shrublands 54,734.31 54,210.05 54,182.77 54,129.93
130 Grasslands 169,632.13 175,531.14 198,012.10 199,396.89
150 Sparse vegetation 26,635.56 27,434.06 28,238.81 29,016.15
160 Wetlands 8.19 8.31 8.31 8.31
170 Wetlands 1,919.56 1,939.75 2,103.17 2,119.07
180 Wetlands 5,992.70 6,315.14 6,507.79 6,507.67
190 Urban land 554.72 681.07 2,989.74 4,791.88
200 Bare lands 249,833.12 245,248.45 219,893.21 217,515.06
201 Bare lands 5,590.39 5,638.34 5,195.54 5,183.06
202 Bare lands 6,451.40 6,678.92 6,719.04 6,701.06
210 Water bodies 7,011.50 6,426.45 6,123.34 6,257.03
220 Permanent snow and ice
14,131.14 14,131.14 14,131.14 14,131.14
2 For classification detail, please see Table A1.
33
5. INCLUSIVE WEALTH OF PAKISTAN AT THE REGIONAL LEVEL
34
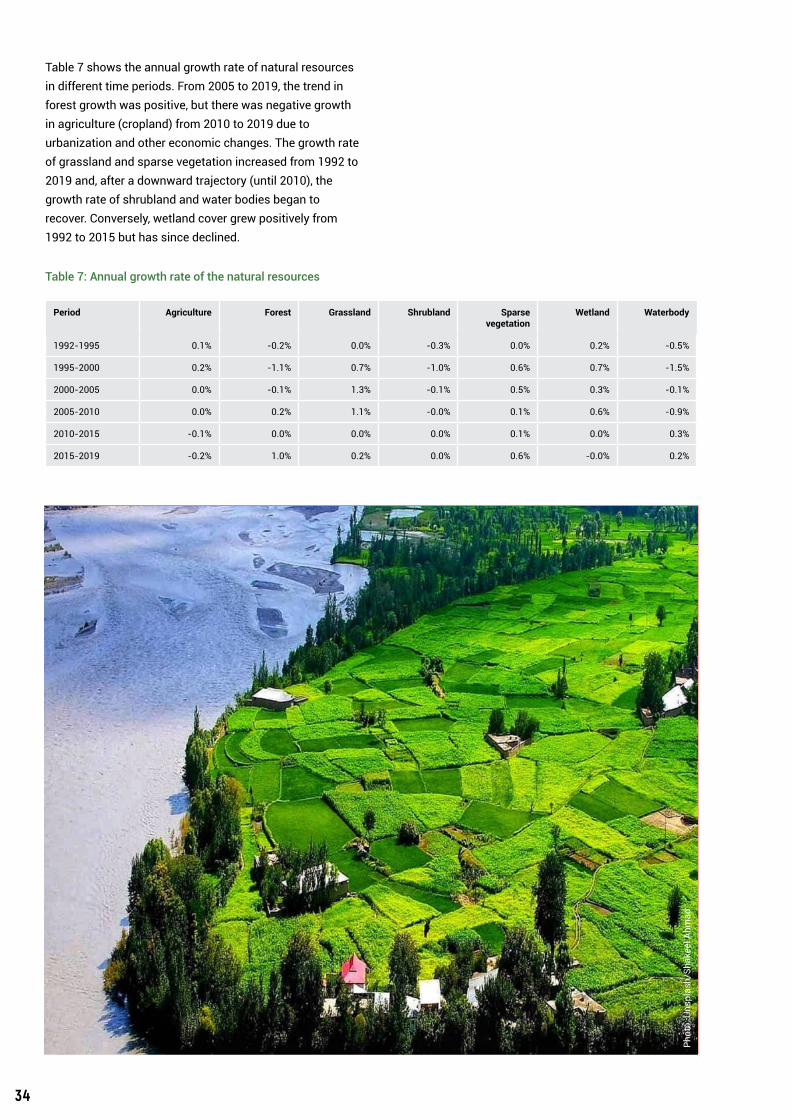
Table 7 shows the annual growth rate of natural resources in different time periods. From 2005 to 2019, the trend in forest growth was positive, but there was negative growth in agriculture (cropland) from 2010 to 2019 due to urbanization and other economic changes. The growth rate of grassland and sparse vegetation increased from 1992 to 2019 and, after a downward trajectory (until 2010), the growth rate of shrubland and water bodies began to recover. Conversely, wetland cover grew positively from 1992 to 2015 but has since declined.
Table 7: Annual growth rate of the natural resources
Period Agriculture Forest Grassland Shrubland Sparse vegetation
Wetland Waterbody
1992-1995 0.1% -0.2% 0.0% -0.3% 0.0% 0.2% -0.5%
1995-2000 0.2% -1.1% 0.7% -1.0% 0.6% 0.7% -1.5%
2000-2005 0.0% -0.1% 1.3% -0.1% 0.5% 0.3% -0.1%
2005-2010 0.0% 0.2% 1.1% -0.0% 0.1% 0.6% -0.9%
2010-2015 -0.1% 0.0% 0.0% 0.0% 0.1% 0.0% 0.3%
2015-2019 -0.2% 1.0% 0.2% 0.0% 0.6% -0.0% 0.2%
Phot
o: U
nspl
ash/
Shak
eel A
hmad

35
5.4.3 Non-renewable resourcesPakistan’s non-renewable resources are predominantly natural gas, oil and coal; these resources make a significant contribution to the nation’s natural capital stocks. The north of Sindh and some areas of Punjab are rich in natural gas while the southern part of Sindh and northern part of Punjab account for the majority of oil fields. The coal fields in different geographic regions of Pakistan are mainly located in Sindh and Balochistan.
5.5 GROWTH OF INCLUSIVE WEALTH OVERALL AT THE GRID LEVEL
Most of the regions of Pakistan experienced positive growth in inclusive wealth in the period of 2000-2019. Punjab in particular experienced high growth in inclusive wealth, with Sindh and Balochistan also seeing considerable growth in the same period.
From 2000 to 2019, Pakistan experienced growth in human and produced capital, with the strongest growth in Punjab and Sindh. Natural capital values in Pakistan decreased in areas where the reserve of fossil fuels decreased and where natural land cover was converted to other uses, such as settlement areas. Growth increased, however, in areas where bare lands were converted to vegetation cover, including shrubland and forest area. There was a decrease in natural capital in Punjab and Sindh, but a slight increase in Balochistan. Regarding the renewables component of natural capital, the TBTTP project is set to replenish forest and wildlife resources in the near future; tangible plans are in place and actions have started to increase vegetation cover. This tremendous effort has the potential to improve the overall condition of the existing protected areas, encourage eco-tourism and drive job creation through ecosystem restoration.
5.6 INCLUSIVE WEALTH OF PAKISTAN AT THE PROVINCE LEVEL
This subsection explains the distribution of inclusive wealth, human capital, produced capital and natural capital among the different administrative provinces of Pakistan. The country has four provinces and one federal territory. The four provinces are Balochistan, Punjab, Sindh and Khyber Pakhtunkhwa. The federally administered area is Islamabad Capital Territory. Pakistan also administers two autonomous territories of Pakistan-administered Kashmir. In terms of the stock of inclusive wealth at the province level in Pakistan, Punjab and Sindh have high values of inclusive wealth in absolute terms (from $5 million to
5. INCLUSIVE WEALTH OF PAKISTAN AT THE REGIONAL LEVEL
$15 million per km2). The inclusive wealth of Khyber Pakhtunkhwa is estimated at between US$2 million and US$5 million per km2. Balochistan province has a relatively low inclusive wealth in comparison, with only approximately US$0.5 million to US$2 million per km2, at least partly due to its relatively small population.
The distribution of human capital among Pakistan’s four provinces shows significant heterogeneity. Punjab is the most advanced province in Pakistan with regards to human capital, with stock of approximately US$5 million to US$15 million per km2. Sindh and Khyber Pakhtunkhwa are the second and third wealthiest provinces in terms of human capital stocks, while Balochistan shows the least development in this area.
Looking at the stock of produced capital at the province level, the highest values are found in Punjab and Sindh, reflecting relatively higher levels of industrialization and urbanization. The value of produced capital stock in Punjab is approximately US$0.5 million to US$1 million per km2, while in Khyber Pakhtunkhwa it is approximately US$0.1 million to US$0.5 million per km2.
Sindh, thanks to its vast area of coastline and the high value of mangrove forests, has the highest stock of natural capital of all the provinces. The southern part of this province is particularly rich in biodiversity and thus contributes significantly to the overall natural capital of Pakistan. The value of natural capital in Sindh is approximately US$0.6 million per km2.

36
6

37
6. SUMMARY OF FINDINGS
6. SUMMARY OF FINDINGS
37
Pakistan has experienced growth in inclusive wealth in absolute terms during the period 1992-2019. From 1992 to 2019, Pakistan’s IW grew at an annual rate of 2.3 per cent. Analysis of the individual capital categories shows that human capital and produced capital grew at a rate of 2.9 per cent and 3.2 per cent respectively, but natural capital decreased at an annual rate of 0.1 per cent. Because of the high growth rate of population of 2.4 per cent, IW per capita slightly decreased at the national scale. HC per capita and PC per capita increased at an annual rate of 0.5 per cent and 0.8 per cent, but NC per capita decreased at a rate of 2.5 per cent. However, the last five years have shown evidence of an environmental turnaround, with forests, grassland, sparsely vegetated areas and water bodies all growing in area since 2015. This is likely boosted by Pakistan’s effort on restoration policy and tree plantation schemes as part of the Ten Billion Tree Tsunami Programme.
Phot
o: U
nspl
ash/
Shak
eel A
hmad

38
7
39
7. CONCLUSION
7. CONCLUSION
39
The potential for Pakistan’s economy to expand and develop sustainably largely depends upon the management of, and investment in its natural capital (NC). Therefore, maintaining the quality and quantity of all components of natural capital (particularly land-based restoration for its multiple benefits) should be a priority for policymakers. From this report, there is clear evidence showing that over the past several decades, substantial growth has been observed in Inclusive Wealth. However, as this accumulation of wealth has been occurring, natural capital depreciation has been observed. By using the Inclusive Wealth Index Framework that includes natural capital as a prominent feature of capital stocks, we are able to identify specific trends such as the concerning trends of decline in natural capital, and the effects that restoration policies such as the TBTTP has upon the trends of natural capital.
Alhough the estimates of natural capital show a period of decline from 1990-2019, the data also suggests that the effort by the government especially since 2014 has paid a rich dividend, such that natural capital in the forms of forest, wetland and natural areas are on rise. The trend also promises to continue as a result of various restoration programmes including the TBTTP.
Specifically, the Inclusive Wealth estimates for Pakistan offer policymakers a framework for addressing three main issues. First, when making policy decisions that promote sustainability, it is critically important to understand the trade-offs that occur temporally, and across different types of asset bases (capital stocks). In a world of scarce resources and an ever-increasing set of demands, trade-offs are inevitable. Difficult decisions have to be made when prioritizing goals. Secondly, when weighing up decisions on investment and navigating these trade-offs, understanding the social prices and market prices and their deviations is essential. Many of the assets that are critical for maintaining the productive base for the economy of Pakistan are either not priced or are priced at much lower levels than is reflective of their value to the national economy and human wellbeing. This is especially true for natural capital, which has historically suffered from systematic undervaluation in cost-benefit and other economic analyses. For example, natural assets such as inland forests and mangroves have been valued to an extent, but only really in terms of the products they provide for the market like timber and fish biomass. In reality, these ecosystems offer a much larger suite of services such as water purification, water cycle, water regulation, oxygen generation, carbon sequestration, medicinal knowledge, biodiversity and soil quality, among many others. Pricing these benefits is much more difficult –
40
though not impossible – and therefore tend to be neglected in policy decisions where these values are overlooked or not made explicit. Third, the asset side of the national balance sheet is now expanded to include human capital and natural capital. This is great leap forward towards measuring the contribution to natural resources and systems (such as expanded forest area through restoration initiatives) to the health and existence of human societies. With the combination of systematic measurement of natural assets using natural capital accounts, and the continued focus on restoration as a priority within economic policy, Pakistan is well-placed to be a pioneer in restoration initiatives, regional-level natural capital accounting, and national wealth management, all three of which are cornerstones of the SDGs.
41
Phot
o: U
nspl
ash/
Fase
eh S
hahz
ad
7. CONCLUSION

42
8
43
8. REFERENCES
8. REFERENCES
43
Al-Hashemi, Z.S.S. and Hossain, M.A. (2016). Biological activities of different neem leaf crude extracts used locally in Ayurvedic medicine. Pacific Science Review A: Natural Science and Engineering, 18(2), 128-131.
Costanza, R., Hart, M., Posner, S. and Talberth, J. (2009). Beyond GDP: The Need for New Measures of Progress. The Pardee Papers no. 4. Boston University.
Dasgupta, P. (2021). The Economics of Biodiversity: The Dasgupta Review. London: HM Treasury.
de Groot, R., Brander, L., van der Ploeg, S., Costanza, R., Bernard, F., Braat, L. et al. (2012). Global estimates of the value of ecosystems and their services in monetary units. Ecosystem Services, 1(1), 50-61.
Farand, C. (2021). Pakistan explores debt-for-nature scheme to accelerate its 10 billion tree tsunami, 16 April. https://www.climatechangenews.com/2021/04/16/pakistan-explores-debt-nature-scheme-acceler-ate-10-billion-tree-tsunami/. Accessed 20 April 2021.
Food and Agricultural Organization of the United Nations (FAO). (2020). 2019 Forestry sector review: Pakistan. Islamabad. https://doi.org/10.4060/ca4869en
Food and Agricultural Organization of the United Nations (FAO) (2015). Women in Agriculture in Pakistan. Islamabad.
Government of Khyber Pakhtunkhawa, Forestry Depart-ment, (2020). Billion Tree Afforestation Project.
Government of Pakistan Ministry of Climate Change (2020). Clean and Green Pakistan Movement.
Government of Pakistan Ministry of Climate Change (2021). Ten Billion, Tree Tsunami Project.
Government of Pakistan, Ministry of Finance (2020). Pakistan Economic Survey 2019-20.
International Union for Conservation of Nature (IUCN) (2017). Annual Report Pakistan. Karachi: IUCN. https://www.iucn.org/sites/dev/files/2017_annual_report_iucn_pakistan.pdf
IUCN (2020). IUCN, FAO and WWF Pakistan join hands with Ministry of Climate Change to monitor the largest afforestation programme in Pakistan, 22 September. https://www.iucn.org/news/pakistan/202009/iucn-fao-and-wwf-pakistan-join-hands-ministry-cli-mate-change-monitor-largest-afforestation-pro-gramme-pakistan. Accessed 18 May 2021.
Khan, I.H., Javaid, A., Al-Taie, A.H., Ahmed, D. (2020). Use of Neem leaves as soil amendment for the control of collar rot disease of chickpea. Egyptian Journal of Biological Pest Control 30(98). https://doi.org/10.1186/s41938-020-00299-w.
44
Li, G., Fang, C., Wang, S. 2016. Exploring spatiotemporal changes in ecosystem-service values and hotspots in China. Science of the Total Environment 545-546, 609-620. https://doi.org/10.1016/j.scitotenv.2015.12.067.
Managi, S., and Kumar, P. (eds.) (2018). Inclusive Wealth Report 2018: Measuring Progress Towards Sustainability. Oxford: Routledge, Taylor and Francis Group. https://doi.org/10.4324/9781351002080.
Gilani, H., Naz, H.I., Arshad, M., Nazim, K., Akram, U., Abrar, A., Asif, M. (2021). Evaluating mangrove conservation and sustainability through spatiotemporal (1990–2020) man-grove cover change analysis in Pakistan. Estuarine, Coastal and Shelf Science, Vol: 249 (107128).
Organisation for Economic Co-operation and Development (2020). Building Back Better: A Sustainable, Resilient Recovery after Covid-19.OECD Publishing: Paris. https://read.oecd-ilibrary.org/view/?ref=133_133639-s08q2ridh-f&title=Building-back-better-_A-sustainable-resilient-re-covery-after-Covid-19
Pakistan Bureau of Statistics (2017). District Wise Census Results 2017.
Pakistan Bureau of Statistics (2021). Population Census. https://www.pbs.gov.pk/content/population-census. Accessed 18 May 2021.
Parker, R.S. (2006). Hazards of Nature, Risks to Develop-ment: an IEG Evaluation of World Bank Assistance for Natural Disasters. Washington D.C.: World Bank Group.
Perring, M.P., Erickson, T.E., Brancalion, P.H.S. (2018). Rocketing restoration: enabling the upscaling of ecological restoration in the Anthropocene. Restoration Ecology 26(6), 1017-1023. https://doi.org/10.1111/rec.12871.
United Nations Economist Network (2020). Report of the UN Economist Network for the UN 75th Anniversary: Shaping the Trends of our Time. New York.
United Nations Environment Programme (UNEP) (2013). The Environment and Climate Change Outlook of Pakistan. Nairobi: UNEP https://www.unep.org/resources/report/environment-and-climate-change-outlook-pakistan.
UNEP (2021). Making Peace with Nature: A Scientific Blueprint to Tackle the Climate, Biodiversity and Pollution Emergencies. Nairobi. UNEP https://www.unep.org/resources/making-peace-nature
UNEP and International Livestock Research Institute (2020). Preventing the Next Pandemic: Zoonotic diseases and how to break the chain of transmission. Nairobi. UNEP
United Nations University International Human Dimen-sions Programme and United Nations Environment Programme (2012). Inclusive Wealth Report 2012. Measur-ing Progress toward Sustainability. Cambridge: Cambridge University Press.
United Nations University International Human Dimen-sions Programme and UNEP (2014). Inclusive Wealth Report 2014. Measuring Progress toward Sustainability. Summary for Decision-Makers. Delhi.
World Bank (2021). The World Bank in Pakistan: Overview, 29 March. https://www.worldbank.org/en/country/pakistan/overview. Accessed 26 April 2021.
World Forum on Natural Capital (2021). https://natural-capitalforum.com/about/. Accessed 20 April 21.
Zhang, B., Nozawa, W. and Managi, S. (2020). Sustainabili-ty measurements in China and Japan: an application of the inclusive wealth concept from a geographical perspective. Regional Environmental Change 20, 1-13. https://doi.org/10.1007/s10113-020-01658-x.

45
8. REFERENCES

46
9

47
9. ANNEX
9. ANNEX
47
A1. DATA SOURCES
National level• Human capital: World Bank and Pakistan Bureau of
Statistics• Produced capital: World Bank• Fossil fuels: United States Geological Survey and British
Petroleum (BP) statistics
Grid-cell level• Gridded population data: Worldpop (100m resolution)
https://www.worldpop.org/geodata/listing?id=78• Night-time light data: NASA (U.S. Air Force Defense
Meteorological Satellite Program (DMSP) radiance calibrated data, Visible Infrarad Imaging Radiometer Suite (VIIRS) night-time lights) https://payneinstitute.mines.edu/eog/nighttime-lights/
• Land cover data: European Space Agency Climate Change Initiative Land Cover products (listed in Global Forest Watch) http://www.esa-landcover-cci.org/?q=node/164
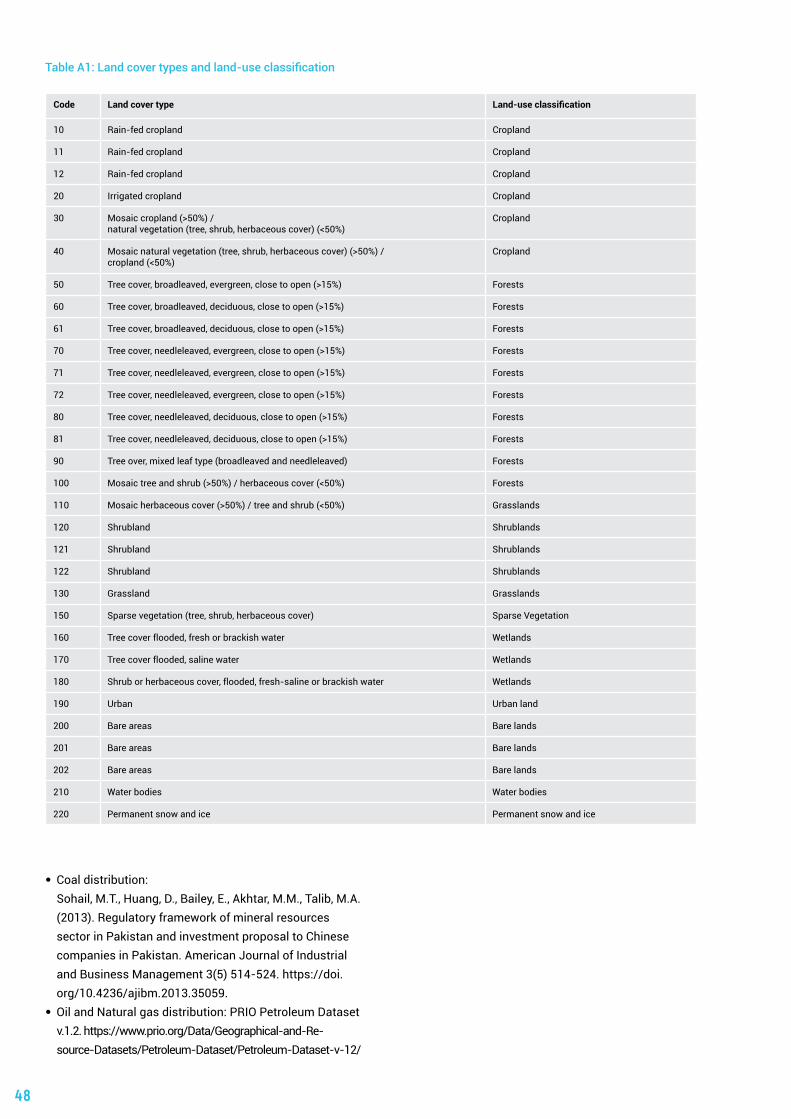
48
• Coal distribution: Sohail, M.T., Huang, D., Bailey, E., Akhtar, M.M., Talib, M.A.
(2013). Regulatory framework of mineral resources sector in Pakistan and investment proposal to Chinese companies in Pakistan. American Journal of Industrial and Business Management 3(5) 514-524. https://doi.org/10.4236/ajibm.2013.35059.
• Oil and Natural gas distribution: PRIO Petroleum Dataset v.1.2. https://www.prio.org/Data/Geographical-and-Re-source-Datasets/Petroleum-Dataset/Petroleum-Dataset-v-12/
Table A1: Land cover types and land-use classification
Code Land cover type Land-use classification
10 Rain-fed cropland Cropland
11 Rain-fed cropland Cropland
12 Rain-fed cropland Cropland
20 Irrigated cropland Cropland
30 Mosaic cropland (>50%) / natural vegetation (tree, shrub, herbaceous cover) (<50%)
Cropland
40 Mosaic natural vegetation (tree, shrub, herbaceous cover) (>50%) / cropland (<50%)
Cropland
50 Tree cover, broadleaved, evergreen, close to open (>15%) Forests
60 Tree cover, broadleaved, deciduous, close to open (>15%) Forests
61 Tree cover, broadleaved, deciduous, close to open (>15%) Forests
70 Tree cover, needleleaved, evergreen, close to open (>15%) Forests
71 Tree cover, needleleaved, evergreen, close to open (>15%) Forests
72 Tree cover, needleleaved, evergreen, close to open (>15%) Forests
80 Tree cover, needleleaved, deciduous, close to open (>15%) Forests
81 Tree cover, needleleaved, deciduous, close to open (>15%) Forests
90 Tree over, mixed leaf type (broadleaved and needleleaved) Forests
100 Mosaic tree and shrub (>50%) / herbaceous cover (<50%) Forests
110 Mosaic herbaceous cover (>50%) / tree and shrub (<50%) Grasslands
120 Shrubland Shrublands
121 Shrubland Shrublands
122 Shrubland Shrublands
130 Grassland Grasslands
150 Sparse vegetation (tree, shrub, herbaceous cover) Sparse Vegetation
160 Tree cover flooded, fresh or brackish water Wetlands
170 Tree cover flooded, saline water Wetlands
180 Shrub or herbaceous cover, flooded, fresh-saline or brackish water Wetlands
190 Urban Urban land
200 Bare areas Bare lands
201 Bare areas Bare lands
202 Bare areas Bare lands
210 Water bodies Water bodies
220 Permanent snow and ice Permanent snow and ice
A2. DATA NOTES
• National data from 1990 to 2014 were drawn from IWR 2018 data and consistent data for human capital, produced capital and fossil fuels from 2015 to 2019 were updated by the data sources listed above.
• The gridded population data have been adjusted to be consistent with the total number at district level accord-ing to the survey data by Gridded Population of the World version 4 (GWPv4).
• Gridded inclusive wealth data only date back to 2000 because gridded population data are only available from 2000.
• National data date back to 1992 rather than 1990 because land cover data are only available from 1992.
• Global Forest Watch also provides high resolution forest data (30m resolution with coverage rate) but as they are only available for 2010, they are not suitable for time-consistent analysis.
A3. METHOD NOTES
1. The gridded human capital data is calculated by multiplying gridded population count and national per capita human capital. The spatial disparity of human capital therefore mainly represents the spatial distribu-tion of population.
2. The national produced capital data in 2000 is directly disaggregated into grids in proportion to night-time light value. The gridded produced capital data in 2010 is calculated by adding the gridded 2020 data and the growth of produced capital between 2000 and 2010, disaggregated into grids in proportion to night-time light data value during this period. The data in 2019 are estimated in the same way.
3. Detailed distribution maps for fossil fuels are unavaila-ble. The national value is therefore distributed uniformly among field polygons.
4. The calculation method for renewable resources is different from that of the IWR. Renewable resources are calculated by the valuation of their ecosystem services and products.
49
9. ANNEX
Phot
o: U
nspl
ash/
Kam
ran
Ch
50

This report will be launched on June 5 in celebration of the 2021 World Environment Day hosted by Pakistan. World Environment Day is the United Nations flagship day for promoting worldwide awareness and action for the environment.
This World Environment Day, join #GenerationRestoration to revive and protect our ecosystems.