Embed Size (px)
Citation preview

1
Growth in Pakistan: Inclusive or Not?
Zunia Saif Tirmazee1 and Maryiam Haroon
2
Introduction
Cross country evidences reveal that Asian countries have experienced rapid growth over the last
two decades. The increase in growth is accompanied with reduction in poverty from 1990 to
2001 as the number of individuals living below the poverty line has decreased over the time
period (ADB 2006). Growth is considered to be a necessary condition for reduction in poverty
but growth does not necessarily imply that it will lead to improve in living standards of every
one. Growth does benefit and improve standards of living but it may lead to increase in
inequality if it leads to increase in benefits for few section of the society only. This has been
witnessed in China as economic growth benefited all segments of the society, it lead to
improvement in living standards for all, but the improvement benefited more to rich as compared
to poor. The same situation persists in India as well. In contrast, countries like Brazil, Mexico,
and Thailand have different scenario where there is increase in economic growth and this
increase is also accompanied with improvement in equity (Anand et al, 2013).
Pakistan historically has seen episodes of high growth but those unfortunately were not
coupled with such macroeconomic conditions as are required to achieve lower poverty levels.
Therefore Pakistan has always been facing the challenge of achieving rather more inclusive
growth that has its benefits spreading to all classes of society. The provision of basic services
such as education, health sanitation, and housing for all the segments of population, and social
security schemes to ensure social protection are critical for long run reductions in poverty.
This paper examines inclusive growth (growth accompanied with equitable distribution)
for Pakistan using the microeconomic concept of social welfare function (social concentration
curve) at the macroeconomic level. The methodology adopted is developed by Anand et al.
(2013) and analyze inclusive growth by decomposing it into two components equity and
efficiency. Efficiency requires the overall improvement in the country and equity requires the
improvement to be equally distributed across various segments of the population. Our measures
of welfare include; income per capita and a household asset index. The social mobility curve is
1 Teaching Fellow, Department of Economics, Lahore School of Economics. [email protected] 2 Teaching Fellow, Department of Economics, Lahore School of Economics. [email protected]
2
plotted for Pakistan in time periods 2008-09 and 2010-11 at a disaggregated and later at a
disaggregated level using the household level data from Pakistan Social and Living
Measurements (PSLM). Our objective is to test to what extent have the benefits of a positive
economic growth rate that Pakistan has witnessed for a decade now (despite the global financial
crisis of 2008) trickled down to all segments of population, rich and poor alike.
Brief glances at the macroeconomic indicators of Pakistan reveal important insights to the
issue of poverty. Poverty levels are determined by interplay of economic growth, inflation and
unemployment levels. All of these three macroeconomic indicators have been worsening for
Pakistan exacerbating poverty levels of the country. Pakistan’s economic growth rate has been
experiencing a decline since 2006-07 falling from a level of 6.8% to 4.1% in 2009-10. Inflation
on the other hand has continued to be a double digit figure where it peaked to a level of 23.7% in
2008-09 though it declined afterwards to 12% in 2009-10.Unemployment rate in Pakistan has
also witnessed a decline from a high of 6.8% in 2006-07 to a low of 5.5% in 2009-10.The rise in
the prices of staple food crops such as wheat that has undergone a substantial price hike from Rs
625/40 Kg to Rs950/40 Kg in the fiscal year 2009-10 is adding fuel to fire. Moreover the sharp
rise in international oil and food prices, combined with recurring natural disasters like the 2010
and 2011 floods have had a devastating impact on the economy (Economic Survey of Pakistan,
2009-10).
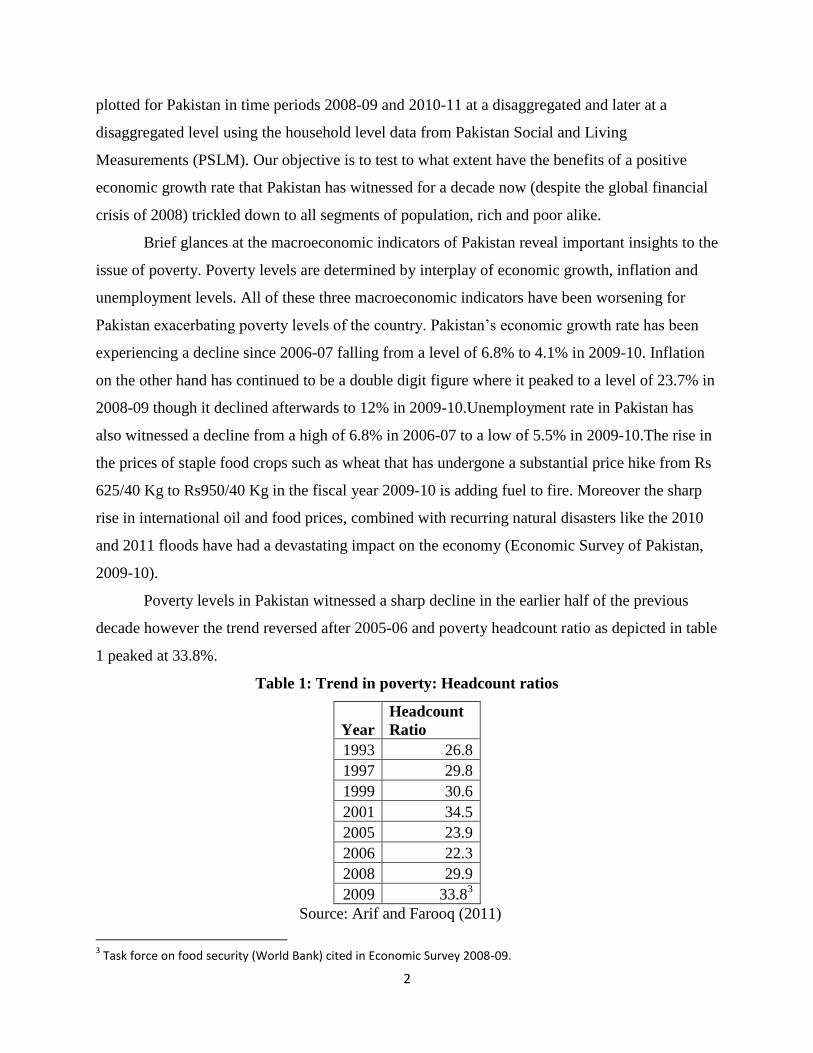
Poverty levels in Pakistan witnessed a sharp decline in the earlier half of the previous
decade however the trend reversed after 2005-06 and poverty headcount ratio as depicted in table
1 peaked at 33.8%.
Table 1: Trend in poverty: Headcount ratios
Year
Headcount
Ratio
1993 26.8
1997 29.8
1999 30.6
2001 34.5
2005 23.9
2006 22.3
2008 29.9
2009 33.83
Source: Arif and Farooq (2011)
3 Task force on food security (World Bank) cited in Economic Survey 2008-09.
3
Some plausible explanations of this trend reversal could be that Pakistan has faced severe
challenges since 2007/08 - a falling rate of economic growth, double-digit inflation particularly
the food inflation, energy crisis, oil price hikes and ailing law and order situation. The security
concerns like war on terror have resulted in a diversion of public expenditure from development
to defense. Thus the present socio-economic situation has adversely affected the efforts
concerning poverty reduction.
The concept of inclusive growth was measured initially using access to opportunity such
as education for countries like Phillipines (Ali and Son, 2007), Pakistan (Newman, 2012 and
Asghar and Javed, 2011) and (Ravaillon and Chen, 2003). The literature also examines
inclusiveness of growth using income per capita for Turkey (Taskin, 2014) which reveals that
increase in per capita income has been achieved at the expense of equity.
The macroeconomic picture suggests rising poverty and inequality for Pakistan. Given
this backdrop our objective in this study to see whether growth in Pakistan has been beneficial
for all or not. If the growth in Pakistan has been achieved at the expense of equity then the
benefits of growth are unevenly distributed and the poor benefit less from growth as compared to
the rich as the poor are constrained by circumstances or market failures. This situation prevails if
market mechanism operates. Thus, there government can play its role by formulating policies
that distributes the benefits of growth equally and reduce inequality.
2 Methodology
The methodology developed in this paper has been adopted from Anand et al (2013). Our
measure of inclusive growth is based upon a social welfare function which is also known as the
concentration curve. In the social welfare function, inclusive growth depends upon two factors:
average per capita income and distribution of income among the population. The inclusiveness of
growth can be depicted using the social welfare curve ( ). The social welfare curve can be
defined as follows:
( )
In the above equation, is the income of population which varies from to where
is the income of the poorest individual and income of the richest individual. The generalized
4
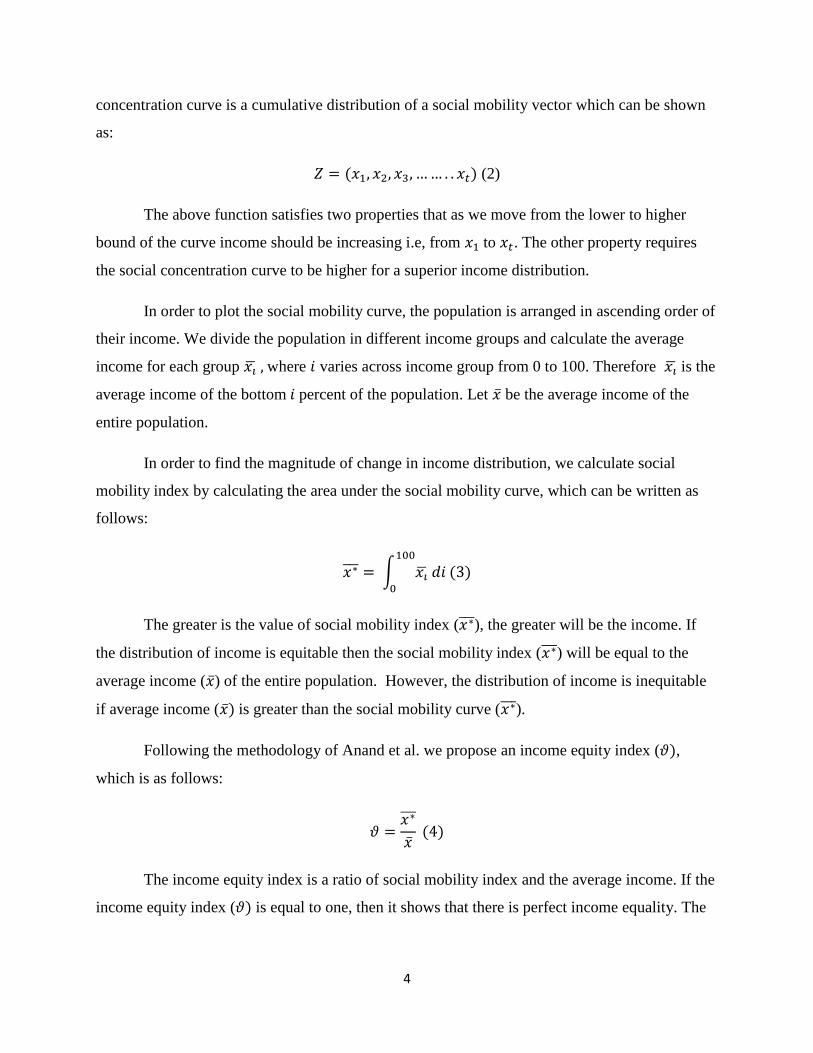
concentration curve is a cumulative distribution of a social mobility vector which can be shown
as:
( ) (2)
The above function satisfies two properties that as we move from the lower to higher
bound of the curve income should be increasing i.e, from to . The other property requires
the social concentration curve to be higher for a superior income distribution.
In order to plot the social mobility curve, the population is arranged in ascending order of
their income. We divide the population in different income groups and calculate the average
income for each group where varies across income group from 0 to 100. Therefore is the
average income of the bottom percent of the population. Let be the average income of the
entire population.
In order to find the magnitude of change in income distribution, we calculate social
mobility index by calculating the area under the social mobility curve, which can be written as
follows:
∫
( )
The greater is the value of social mobility index ( ), the greater will be the income. If
the distribution of income is equitable then the social mobility index ( ) will be equal to the
average income ( ) of the entire population. However, the distribution of income is inequitable
if average income ( ) is greater than the social mobility curve ( ).
Following the methodology of Anand et al. we propose an income equity index ( ),
which is as follows:
( )
The income equity index is a ratio of social mobility index and the average income. If the
income equity index ( ) is equal to one, then it shows that there is perfect income equality. The
5
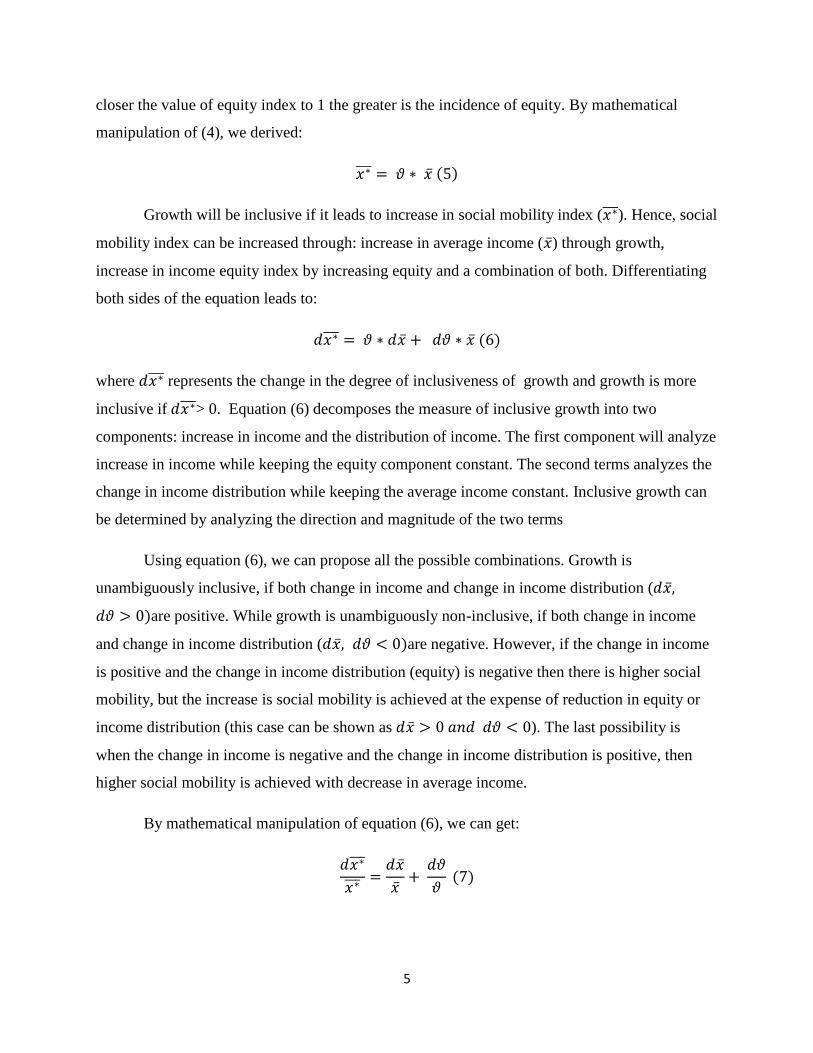
closer the value of equity index to 1 the greater is the incidence of equity. By mathematical
manipulation of (4), we derived:
( )
Growth will be inclusive if it leads to increase in social mobility index ( ). Hence, social
mobility index can be increased through: increase in average income ( ) through growth,
increase in income equity index by increasing equity and a combination of both. Differentiating
both sides of the equation leads to:
( )
where represents the change in the degree of inclusiveness of growth and growth is more
inclusive if > 0. Equation (6) decomposes the measure of inclusive growth into two
components: increase in income and the distribution of income. The first component will analyze
increase in income while keeping the equity component constant. The second terms analyzes the
change in income distribution while keeping the average income constant. Inclusive growth can
be determined by analyzing the direction and magnitude of the two terms
Using equation (6), we can propose all the possible combinations. Growth is
unambiguously inclusive, if both change in income and change in income distribution (
)are positive. While growth is unambiguously non-inclusive, if both change in income
and change in income distribution ( )are negative. However, if the change in income
is positive and the change in income distribution (equity) is negative then there is higher social
mobility, but the increase is social mobility is achieved at the expense of reduction in equity or
income distribution (this case can be shown as ). The last possibility is
when the change in income is negative and the change in income distribution is positive, then
higher social mobility is achieved with decrease in average income.
By mathematical manipulation of equation (6), we can get:
( )

6
Equation (7) shows the decomposition of inclusive growth (
) into growth in average income
(efficiency) (
) and change in income distribution (equity) (
). Efficiency requires the
overall improvement of income in a country and equity requires this improvement to be equally
distributed across various segments of the population. The social mobility curve has been
estimated for Pakistan using two measures which are income per capita and the wealth index.
3 Data
We empirically estimate equation (7) and plot the social mobility curve for Pakistan using
Pakistan Social and Living Standards Measurements (PSLM). The curve has been plotted for
three time periods 2010, 2009 and 2007. The table 2 summarizes some of the basic household
characteristics of our sample. The sample includes more than 71,000 households for each year.
Out of the total sample, 35% of the households are residing in urban areas while 65% are in rural
areas. On average, the size of the household is smaller for wealthier4 households as compared to
the poorer ones as in year 2011, the average size of the household in the top quintile is around
3.73 while the average household size is 5.61 in the bottom quintile. The average household
income has increased from year 2008 and 2011 for all the income groups which is also depicted
in the table 1 as the average household income for both the bottom and top quintile has
increased.
Table 2: Descriptive statistics of sample households: PSLM 2008-09 and 2010-11
Year Region No. of
HH5
Avg. HH
size of the
bottom
quintile
Avg. HH
size of the
top
quintile
Avg income
of the
bottom
quintile
Avg.
income of
the top
quintile
2010-11 Pakistan 71,951 5.61 3.73 8,406 45,199
Urban 35% 5.89 3.82 12055 61342
Rural 65% 5.59 3.58 7333 36450
2008-09
Pakistan 71,491 5.77 3.76 7,714 37,508
Urban 35% 5.95 3.64 9897 51160
Rural 65% 5.69 3.79 7247 30003
Source: Author’s own calculations
4 We have distinguished households based upon their income and have classified into 10 quintiles.
5 This sample does not include households for whom income was not reported in PSLM.

7
Though the top quintile has experienced a greater percentage rise (a rise of 20%) in their income
as compared to the bottom quintile (8.9% rise). The per capita income is greater for urban than
rural areas for all income quintiles.
The table 3 shows the distribution of wealth (ownership of assets) across income groups.
The wealth has been categorized into productive (land, animals for transport, poultry, residential
and commercial buildings) and non-productive assets (television, computer, refrigerator, air-
conditioner, fans, cooler, motorcycle and tractor). The percentage change in ownership of assets
has fallen from 2009 to 2011 for most of the assets except for fans, motorcycle, tractors,
residential and commercial buildings. The ownership of assets for the top quintile has remained
fairly constant for non productive assets while for the productive assets it has shown a
considerable increase where the reverse is so true for the bottom quintile for whom the
ownership has fallen for most of the assets.
The basic data description shows that there has been a general rise in income for all
quintiles. On the other hand, wealth distribution is mostly skewed towards the top quintile and
this concentration has increased for the given time period. This occurrence is only pointing
towards rising inequality which we also expect to see in our later analysis.
The table 3 also presents the region wise (rural vs. urban) distribution of assets. It can be
seen that in the urban areas for the top quintile the ownership of more valuable assets such as
land, residential building, computer, motorcycle etc. has gone up. These are the same assets
whose ownership for the bottom quintile has fallen. For the rural areas there is no clear pattern in
the distribution of assets however the data does point out that for the top quintile it is mostly the
productive assets that have experienced an increase in ownership whereas for the bottom quintile
the ownership cannot be linked to a specific type of asset as one can observe for the top quintile.

8
Table 3: Descriptive statistics of asset ownership for sample households: PSLM 2008-09
and 2010-11
2010-11 2008-09
Percentage of HH with
ownership of assets
Percentage of HH with
ownership of assets
Asset
ownership Bottom
10%
Top
10% 100%
Bottom
10% Top 10% 100%
Change in
percentage
of
ownership
Non-productive assets
Television 0.27 97.9 54 0.91 99.21 55.93 -3.45
Urban 0.55 98.61 80.24 1.39 99.34 80.68 -0.55
Rural 0.25 96.37 40.48 0.9 98.73 42.39 -4.51
Computer 0.01 58.35 7.4 0 60.38 7.55 -1.99
Urban 0 66.42 16.62 0 65.31 16.85 -1.36
Rural 0.01 37.34 2.43 0 41.78 2.46 -1.22
Refrigerator 0 98.73 35.98 0.03 99.03 36.66 -1.85
Urban 0 99.02 60.34 0 99.16 60.09 0.42
Rural 0 97.98 22.86 0.03 98.54 23.83 -4.07
A/C 0 48.88 5.21 0.01 49.33 5.31 -1.88
Urban 0 58.05 12.68 0 55.17 13.09 -3.13
Rural 0 25 1.18 0.01 27.26 1.05 12.38
Fan 37.18 99.91 86.97 30.37 99.99 86.55 0.49
Urban 73.76 99.87 98.91 38.89 100 98.67 0.24
Rural 34.37 100 80.54 30.12 99.94 79.92 0.78
Air cooler 0 49.23 8.18 0 53.3 9.51 -13.99
Urban 0 47.4 15.19 0 50.78 17.71 -14.23
Rural 0 54 4.4 0 62.8 5.03 -12.52
Motorcycle 3.53 69.87 27.74 2.87 66.72 23.98 15.68
Urban 0.55 66.94 35.51 1.85 65.2 31.67 12.13
Rural 3.76 77.5 23.55 2.9 72.42 19.77 19.12
Tractor 0.25 9.73 2.73 0.71 6.56 2.64 3.41
Urban 0.18 4.45 1.39 0 3.53 1.26 10.32
Rural 0.25 23.49 3.45 0.73 18.03 3.4 1.47

9
Productive Assets
Land 21.31 29.32 29.32 35.09 21.4 29.59 -0.91
Urban 3.3 14.81 8.47 18.98 13.17 9.55 -11.31
Rural 22.69 67.09 38.06 35.56 52.48 40.55 -6.14
Animals for
Transport
11.55 4.27 7.75 22.72 2.19 9.05 -14.36
Urban 6.42 0.8 1.68 18.98 0.79 1.89 -11.11
Rural 11.94 13.32 11.02 22.83 7.45 12.97 -72.82
Poultry 13.1 6.05 15.65 30.25 3.59 18.05 -13.30
Urban 3.12 1.48 3.01 17.59 0.89 3.44 -12.50
Rural 13.87 17.94 22.46 30.63 13.76 26.04 -13.75
Residential
building
85.59 88.12 86.84 83.8 86.34 86.82 0.02
Urban 69.54 84.61 78 77.31 83.62 78.79 -1.00
Rural 86.82 97.27 91.59 83.99 96.62 91.21 0.42
Commercial
Building
0.72 11.88 4.21 0.37 12.2 3.56 18.26
Urban 0.92 11.84 5.75 0.46 11.86 5.42 6.09
Rural 0.7 11.96 3.39 0.37 13.5 2.54 33.46
Source: Author’s own calculations
5 Results
The generalized concentration curves are plotted to examine inclusiveness of growth for entire
Pakistan and then also at disaggregated level for urban and rural areas separately for 2008-09 and
2010-2011. The inclusiveness of growth has been measured using income per capita and wealth
index. The upward sloping concentration curves for both years in figure 1, 2 and 3 reveal that as
one moves to a higher income group the per capita income increases but a rather steeper curve
towards the top quintiles shows that the inter quintile income gap is increasing in income. This
trend is evident in both the years for urban as well as rural areas. As shown in Figure 1 the
concentration curves for Pakistan for 2010-11 is above the concentration curve for 2008-09
which is indicative of a rise in income for all the segments of population distribution.
This trend is also evident for concentration curves of rural and urban areas in figure 2 and
3. A general rise in income for all shows positive contribution to growth in Pakistan. However, a
closer look at these curves reveals that this growth has given rise to increased income inequality
as there has been a pivotal shift in the curve. This shows that income has increased by a larger
10
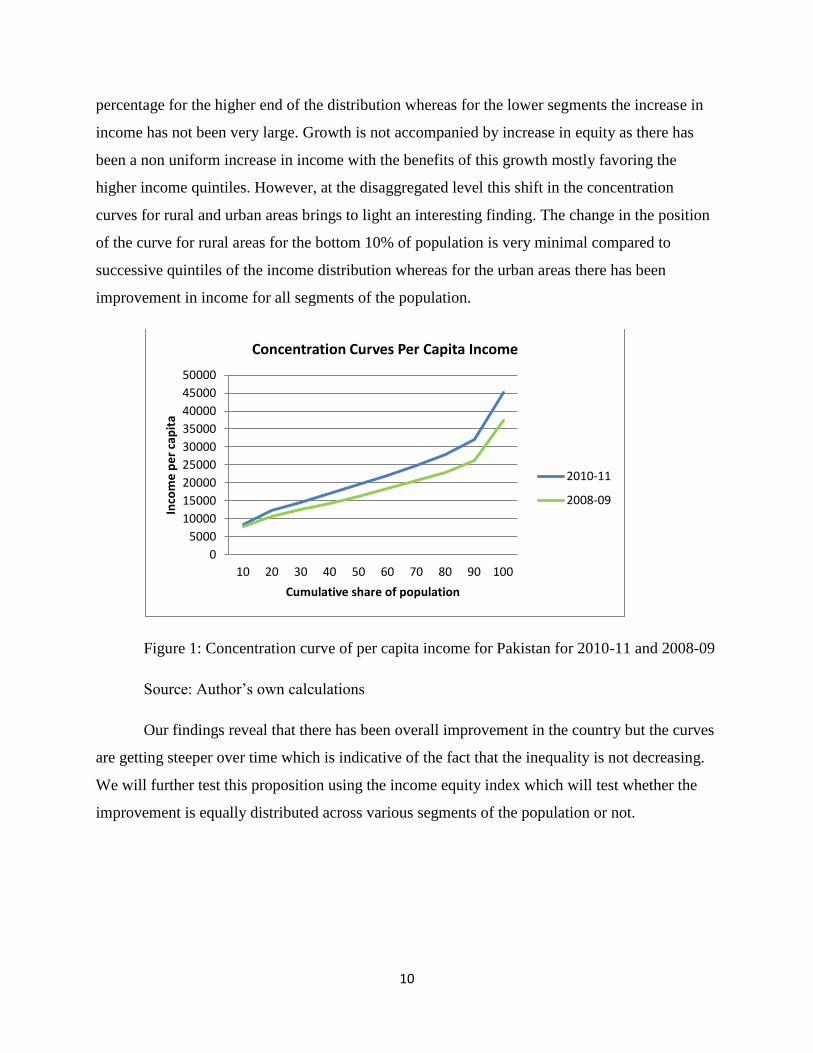
percentage for the higher end of the distribution whereas for the lower segments the increase in
income has not been very large. Growth is not accompanied by increase in equity as there has
been a non uniform increase in income with the benefits of this growth mostly favoring the
higher income quintiles. However, at the disaggregated level this shift in the concentration
curves for rural and urban areas brings to light an interesting finding. The change in the position
of the curve for rural areas for the bottom 10% of population is very minimal compared to
successive quintiles of the income distribution whereas for the urban areas there has been
improvement in income for all segments of the population.
Figure 1: Concentration curve of per capita income for Pakistan for 2010-11 and 2008-09
Source: Author’s own calculations
Our findings reveal that there has been overall improvement in the country but the curves
are getting steeper over time which is indicative of the fact that the inequality is not decreasing.
We will further test this proposition using the income equity index which will test whether the
improvement is equally distributed across various segments of the population or not.
0
5000
10000
15000
20000
25000
30000
35000
40000
45000
50000
10 20 30 40 50 60 70 80 90 100
Inco
me
pe
r ca
pit
a
Cumulative share of population
Concentration Curves Per Capita Income
2010-11
2008-09

11
Figure 2: Concentration curve of per capita income for urban Pakistan for 2010-11 and
2008-09
Source: Author’s own calculations
Figure 3: Concentration curve of per capita income for rural Pakistan for 2010-11 and
2008-09
Source: Author’s own calculations
0
10000
20000
30000
40000
50000
60000
70000
10 20 30 40 50 60 70 80 90 100
Inco
me
pe
r ca
pit
a
Cumulative share of population
Concentration Curves of Per Capita Income: Urban
2010-11
2008-09
0
5000
10000
15000
20000
25000
30000
35000
40000
10 20 30 40 50 60 70 80 90 100
nco
me
pe
r ca
pit
a
Cumulative share of population
Concentration Curves of Per Capita Income: Rural
2010-11
2008-09

12
We have also made use of the wealth index to analyze inclusiveness of growth for
Pakistan and for both regions. The wealth index has been constructed using the principal
component analysis. The PSLM dataset provides detailed information regarding the ownership of
productive and unproductive assets for the households. The index is constructed using both
productive and non productive assets and detail of those assets has been reported in table 3. The
figure 4, 5 and 6 present the concentration curves using wealth index. According to the
concentration curve there has been reduction in ownership of assets over the time period as the
curves have fallen from 2008-09 to 2010-11. The decline in the ownership of assets has not been
observed in the top quintile of population, the drop is mainly for the lower quintiles. This shows
that it is mainly the poorer segments of the population who are experiencing a decline in their
economic status. The rich, if not getting richer are able to maintain their existing economic
status. This has also been supported by descriptive stats on the ownership of assets where there
has been a rise in ownership of productive assets and a reduction in the ownership of non
productive assets. The change in ownership of assets is increasing in assets that are more
valuable, such as land and motor vehicles, and decreasing in less valuable assets such as
electronic equipments.
Figure 4: Concentration curve of wealth index for Pakistan for 2010-11 and 2008-09
Source: Author’s own calculations
-4
-3.5
-3
-2.5
-2
-1.5
-1
-0.5
0
0.5
10 20 30 40 50 60 70 80 90 100
We
alth
Ind
ex
Cumulative share of population
Concentration Curves of Wealth Index
2010-11
2008-2009

13
The concentration curve of wealth index for urban and rural areas also exhibit the same
pattern as of the entire Pakistan. The lower quintiles have experienced a decline in ownership of
assets while there has been no decline in economic status of the upper income groups. For the
urban areas the ownership of assets has experienced a magnificent decline for the lower income
groups as the curve has shifted by a larger magnitude. While, for the rural areas there has not
been any decline at the extreme ends income groups, it is only the middle income groups who
have endured a falling wealth.
Figure 5: Concentration curve of wealth index for urban Pakistan for 2010-11 and 08-09
Source: Author’s own calculations
The concentration curves of wealth index exhibit a contradiction to the results that we got
from the concentration curves of income per capita. Income per capita which represents
temporary income has shown signs of improvement for all income groups whereas the wealth
which is a measure of permanent income has declined between 2008-09 and 2010-11. One of the
explanations of this result could be that the rising income has not been able to keep pace with the
rising price level in the economy as inflation continued to be a double digit figure during this
time. With the rising price levels, the increase in income is being mostly used for consumption
and is therefore not leading to increase in saving or accumulation of wealth. Especially, the
lower quintile is not able to cope up with rising price. The alternative for them is to liquidate
their stock of wealth as is also shown by the downward shift of the concentration curves for
-4.5
-4
-3.5
-3
-2.5
-2
-1.5
-1
-0.5
0
0.5
10 20 30 40 50 60 70 80 90 100
We
alth
Ind
ex
Cumulative share of population
Concentration Curves of Wealth Index:Urban
2010-11
2008-09

14
wealth. For the top income groups also rising income levels are not contributing towards greater
accumulation of wealth. This can be due to the possibility that increasing income is being
channeled towards higher expenditures and is not facilitating savings.
Figure 6: Concentration curve of wealth index for rural Pakistan for 2010-11 and 2008-09
Source: Author’s own calculations
Decomposition of Inclusive Growth
The analysis of concentration curves of per capita income revealed that there has been
improvement for all income groups and whether that improvement is equitable or not has been
tested using the social mobility index6 and income equity index
7. The figure 7, 8 and 9 show the
comparison of average per capita income, social mobility index and income equity index
specifically for per capita income for 2008-09 and 2010-11. The figure 7 shows that the average
per capita income ( ) has increased from 2008-09 to 2010-11 for entire Pakistan and for both
regions as well. The magnitude of change in income distribution is demonstrated by the social
mobility index ( ) which is the area under the concentration curve.
6 It has been constructed using equation 3
7 It has been constructed using equation4
-3.5
-3
-2.5
-2
-1.5
-1
-0.5
0
0.5
10 20 30 40 50 60 70 80 90 100
We
alth
Ind
ex
Cumulative share of population
Concentration Curves of Wealth Index: Rural
2010-11
2008-09

15
Figure 7: Average per capita income for 2010-11 and 2008-09
Source: Author’s own calculation
Figure 8: Social mobility index for 2010-11 and 2008-09
Source: Author’s own calculations
The figure 8 depicts an increase in social mobility index for the given time period at the
aggregated and disaggregated level for Pakistan which is a sign of improvement in the income.
Equitable distribution of income requires the average per capita income to be equal to the social
mobility index which would be possible only if all income groups have the same average per
capita income in which case the social concentration curve would be horizontal and not upward
sloping like in our case. The figure 9 presents the comparison of average per capita income and
social mobility index depicting that the average per capita income is higher than social mobility
0
20000
40000
60000
80000
Pakistan Rural UrbanA
vera
ge p
er
cap
ita
inco
me
Region
Average Per Capita Income
2010-11
2008-09
0
10000
20000
30000
40000
Pakistan Rural Urban
Soci
al m
ob
ility
ind
ex
Region
Social Mobility Index
2010-11
2008-09

16
index for 2010. This implies that the distribution of income is inequitable as the average per
capita income is not equal to average per capita income for all groups.
Figure 9: Social mobility index and average per capita income for 2010
Source: Author’s own calculations
Figure 10: Income Equity Index for 2010-11 and 2008-09
Source: Author’s own calculations
The figure 10 shows the income equity index, which is a direct measure of income
inequality, this index ranges from 0 to 1 where the equality increases from as the index
approaches 1. The income equity index is less than 1 across all regions for both the years.
However, the magnitude of inequality varies across regions. The value of the index for entire
Pakistan is less than 0.5 which is a depiction of very high level of inequality and the index has
0
20000
40000
60000
80000
Inco
me
pe
r ca
pit
a
Region
Social mobility index and Average per capita income for 2010
Social mobilityindex
Average percapita income
0.420.440.460.48
0.50.520.540.56
Pakistan Rural Urban
Inco
me
Eq
uit
y In
de
x
Region
Income Equity Index
2010-11
2008-09
17
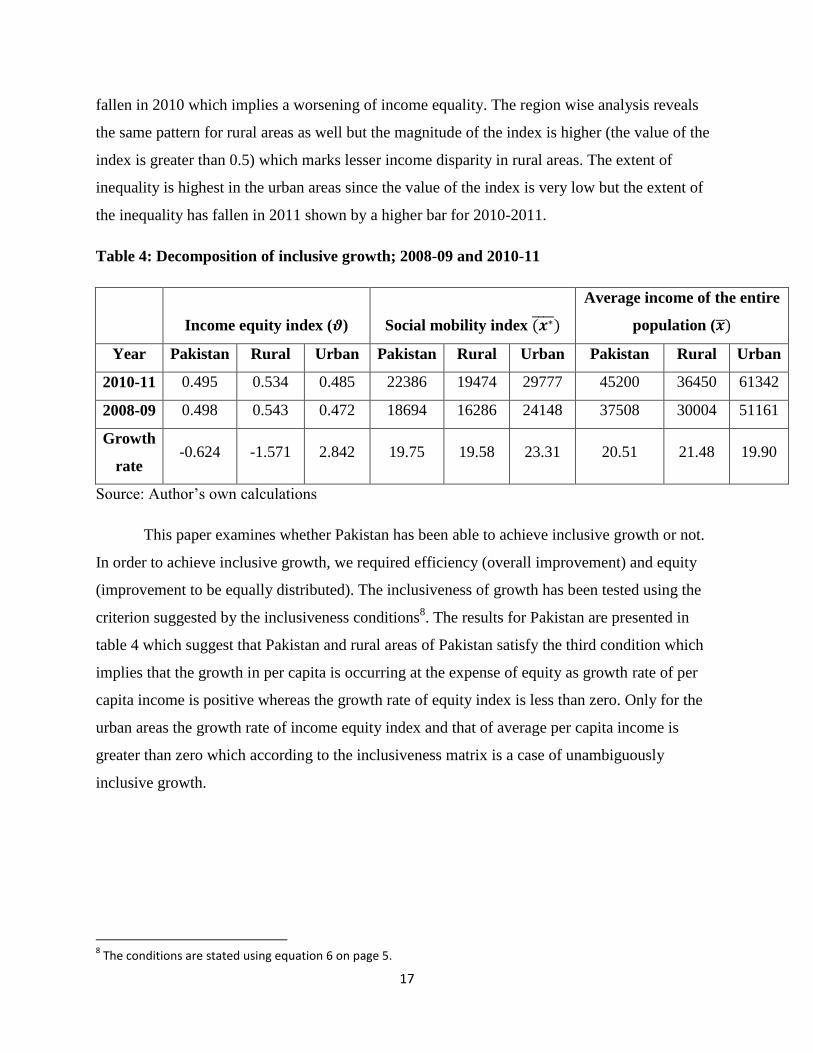
fallen in 2010 which implies a worsening of income equality. The region wise analysis reveals
the same pattern for rural areas as well but the magnitude of the index is higher (the value of the
index is greater than 0.5) which marks lesser income disparity in rural areas. The extent of
inequality is highest in the urban areas since the value of the index is very low but the extent of
the inequality has fallen in 2011 shown by a higher bar for 2010-2011.
Table 4: Decomposition of inclusive growth; 2008-09 and 2010-11
Income equity index ( ) Social mobility index ( )
Average income of the entire
population ( )
Year Pakistan Rural Urban Pakistan Rural Urban Pakistan Rural Urban
2010-11 0.495 0.534 0.485 22386 19474 29777 45200 36450 61342
2008-09 0.498 0.543 0.472 18694 16286 24148 37508 30004 51161
Growth
rate -0.624 -1.571 2.842 19.75 19.58 23.31 20.51 21.48 19.90
Source: Author’s own calculations
This paper examines whether Pakistan has been able to achieve inclusive growth or not.
In order to achieve inclusive growth, we required efficiency (overall improvement) and equity
(improvement to be equally distributed). The inclusiveness of growth has been tested using the
criterion suggested by the inclusiveness conditions8. The results for Pakistan are presented in
table 4 which suggest that Pakistan and rural areas of Pakistan satisfy the third condition which
implies that the growth in per capita is occurring at the expense of equity as growth rate of per
capita income is positive whereas the growth rate of equity index is less than zero. Only for the
urban areas the growth rate of income equity index and that of average per capita income is
greater than zero which according to the inclusiveness matrix is a case of unambiguously
inclusive growth.
8 The conditions are stated using equation 6 on page 5.

18
Conclusion
Pakistan has experienced tremendous economic growth rate over the last decade.
However, whether this growth is inclusive or not, it is imperative to also examine the distribution
of growth as growth by itself is not a sufficient condition for reduction in poverty and inequality.
The growth can be categorized as inclusive in nature if it simultaneously leads to reduction in
poverty.
The paper examines inclusive growth for Pakistan using the microeconomic concept of
social welfare function (social concentration curve) at the macroeconomic level. The social
concentration curve is plotted for two time period in order to see the improvement in social
welfare over time. The methodology adopted is developed by Anand et al.(2013) which analyzed
inclusive growth by decomposing it into two components equity and efficiency. Efficiency
requires the overall improvement in the country and equity requires the improvement to be
equally distributed across various segments of the population. The population is segmented using
personal distribution of welfare by deciles across all households in the sample. Our measures of
welfare include; income per capita and a household asset index. The social mobility curve is
plotted for Pakistan in time periods 2008-09 and 2010-11 using the household level data from
Pakistan Social and Living Measurements (PSLM).
Our findings reveal that there has been an overall improvement in the country due to the
upward shift of the concentration curve but the concentration curves got steeper over time which
is indicative of efficiency without equity. We further tested this proposition using the social
mobility index and the income equity index. The comparison of average per capita income and
social mobility index depicted that the average per capita income is higher than social mobility
index implying that the distribution of income is inequitable whereas the income equity index is
less than 1 across all regions for both the years which depicts high level of inequality. However,
the magnitude of inequality varies across regions. The condition of inclusiveness of growth
suggests that Pakistan and rural areas of Pakistan satisfied the third condition that the growth in
per capita is achieved at the expense of equity. Only for the urban areas the growth rate of
income equity index and that of average per capita income is greater than zero which according
to the inclusiveness matrix is a case of unambiguously inclusive growth.
One of the important finding of our analysis is a fall in concentration curves of wealth
index from 2008-09 to 2010-11 exhibits a contradiction to concentration curves of income per

19
capita. Income per capita which represents temporary income has shown signs of improvement
whereas the wealth which is a measure of permanent income has declined between 2008-09 and
2010-11. This can be due to the possibility that increasing income is being channeled towards
higher expenditures and is not facilitating savings.
Given these findings, we can see that the growth in Pakistan is not inclusive since growth
has been achieved at the expense of equity. The benefits of growth are unevenly distributed
where the poor benefit less as compared to the rich. Thus, there is a need for the government to
play its role by formulating policies that distributes the benefits of growth equally and reduces
inequality.

20
References
Anand, R., Mishra, S., & Peiris, S,J. (2013). Inclusive Growth: Measurement and Determinants.
IMF Working Paper No: 13/135.
Asghar, S., & Javed, S. A. (2011). On Measuring Inclusiveness of Growth in Pakistan. The
Pakistan Development Review, 50(4-II), pp-879.
Asian Development Bank. 2006. Asian Development Outlook 2006. Manila.
Arif, G. M., & Farooq, S. (2011). Poverty, Inequality and Unemployment in Pakistan. Pakistan
Institue of Development Economics, Islamabad.
GoP (2009). Government of Pakistan, Pakistan Economic Survey 2009-10, Economic Advisor‘s
Wing, Finance Division, Government of Pakistan, Islamabad.
Ifzal, A. & Son, H. (2007). Measuring Inclusive Growth. Asian Development Review. 24 (1),11
31.
Newman, J. (2012). Human Opportunity Index – National Equality of Children’s Opportunities
in Pakistan World Bank Policy Paper Series on Pakistan. World Bank Policy Paper.
Ravallion, M., & Chen, S. (2003). Measuring Pro-Poor Growth. Economics Letters. 78,93−99.
Taskin, T. (2014). GDP Growth in Turkey: Inclusive or not?. Central Bank Review, 14(2), 31-64.