Embed Size (px)
Citation preview
In Search of Excellence in Public Procurement
Comparison of the States of Uttar Pradesh, Delhi and West Bengal
Deliberations on Key Performance Indicators with the Stakeholders
Submitted to:
The World Bank Group
India
70, Lodhi Estate
New Delhi - 110 003
Prepared by:
Public Procurement Observatory for the State of Uttar Pradesh
(A World Bank Funded Observatory based at the Indian Institute of Management, Lucknow)
October 13, 2014
Second Report Public Procurement Observatory for the State of Uttar Pradesh
1
Introduction
To monitor procurement and supply chain practices in the state of Uttar Pradesh, the
World Bank has established a procurement observatory at the Indian Institute of
Management, Lucknow in July 2013. This report documents 12 Key Performance
Indicators (KPIs) of this observatory to monitor tendering process performance in the state
of Uttar Pradesh. The primary focus is to summarise the deliberations with the
stakeholders on these KPIs for the three states, namely U.P., Delhi and West Bengal for
comparison and benchmarking purposes. Main reference documents to arrive at these
KPIs on process efficiency, economy and transparency; fair and equitable treatment of
bidders and promotion of competition are based on August 2013 Report of the
Observatory and the following sources:
1. General Financial Regulations (GFR) 2005 of Govt of India
2. U.P. Financial Handbook (Vol. 5 and 6: Public Work Account Rules)
3. Central Vigilance Commission (CVC) Guidelines on public procurement
As per the TOR with the World Bank Group, the public procurement observatory for the
state of Uttar Pradesh disseminates knowledge using website and meetings with the U.P.
Government officers on a continuous basis. This report documents deliberations on select
KPIs with the stakeholders during observatory’s second workshop.
Data source for tendering process analysis
e-Procurement is being adopted in India on a mission mode. Its usage is mandatory in
several states and central government organizations. Although e-Procurement covers
entire end- to-end procurement process, presently it is confined to only the tendering
process in India. In the state of Uttar Pradesh e-Procurement was introduced in 2008. The
system had its own teething troubles and moved in fits and starts. Further, there is no
Government Order (GO) notification so far making it mandatory for various state
departments and organizations to share procurement related information either through
NIC e-procurement system or on their own websites. Therefore, as of now, the data
sharing is voluntary. All these led to little/ incomplete information in initial years till 2010.
However, the process is gradually picking up and seems to be more or less 'in place' at
least for a few state government departments since 2011. Therefore, the observatory has
taken the year 2011 as the base year to develop base line statistics and use it to measure
and compare procurement performance in the coming years.
NIC has implemented e-Procurement systems in the state of Uttar Pradesh, West Bengal
and Delhi among others. These systems provide tender wise detailed e-tendering process
information. This data is not easily amenable to analysis and comparison. We have
designed a web crawler tool that converts the available data in these web pages to a
format that allows easy analysis and comparison within and across states. We have also
designed a tool that allows our website visitors to easily visualize various KPIs (Key
Performance Indicators) using simple drop down menus. This tool is available at the
observatory's web site on www.procurementobservatoryup.com.
Second Report Public Procurement Observatory for the State of Uttar Pradesh
2
Insights from experience sharing session
The public procurement observatory for the state of U.P. conducted its second workshop
on public procurement practices at IIM Lucknow campus on 23rd August 2014. Participants
were drawn from various Uttar Pradesh Govt. departments, IIM Lucknow and the World
Bank (Participants list is appended at the end of the document). World Bank's procurement
and FM specialists and IIM Lucknow faculty members shared their findings and
observations on public procurement in India and particularly in the state of Uttar Pradesh.
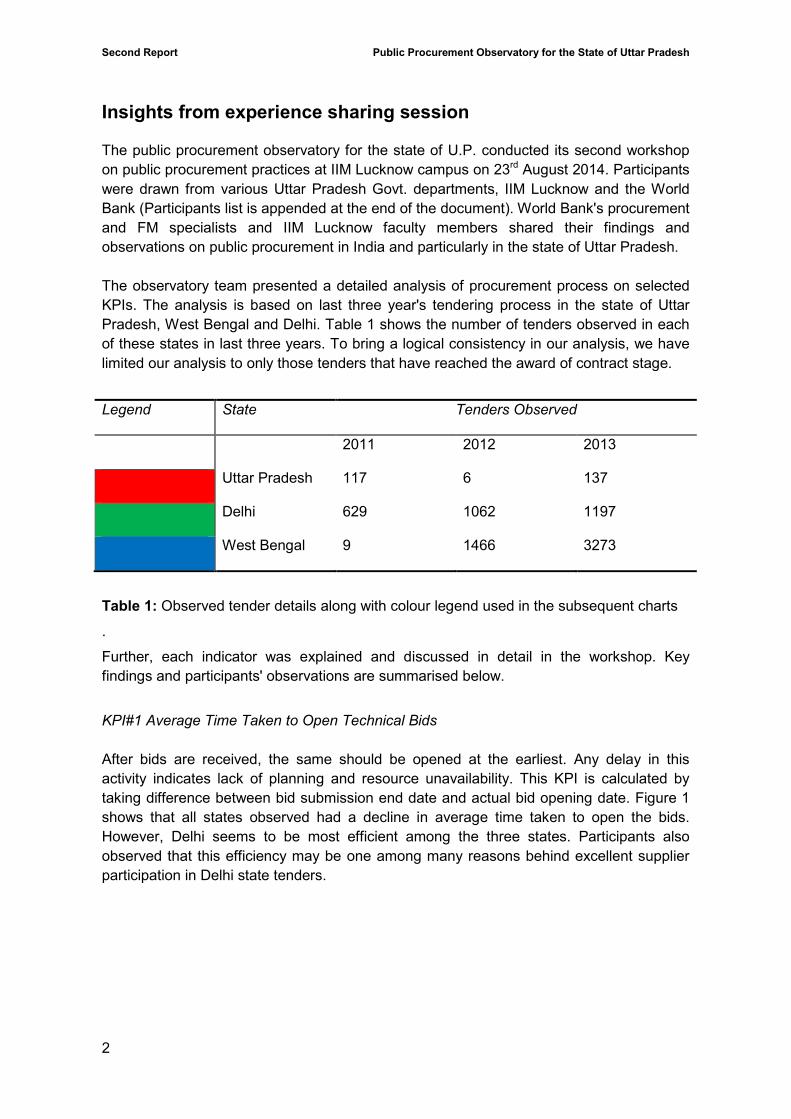
The observatory team presented a detailed analysis of procurement process on selected
KPIs. The analysis is based on last three year's tendering process in the state of Uttar
Pradesh, West Bengal and Delhi. Table 1 shows the number of tenders observed in each
of these states in last three years. To bring a logical consistency in our analysis, we have
limited our analysis to only those tenders that have reached the award of contract stage.
Legend State Tenders Observed
2011 2012 2013
Uttar Pradesh 117 6 137
Delhi 629 1062 1197
West Bengal 9 1466 3273
Table 1: Observed tender details along with colour legend used in the subsequent charts
.
Further, each indicator was explained and discussed in detail in the workshop. Key
findings and participants' observations are summarised below.
KPI#1 Average Time Taken to Open Technical Bids
After bids are received, the same should be opened at the earliest. Any delay in this
activity indicates lack of planning and resource unavailability. This KPI is calculated by
taking difference between bid submission end date and actual bid opening date. Figure 1
shows that all states observed had a decline in average time taken to open the bids.
However, Delhi seems to be most efficient among the three states. Participants also
observed that this efficiency may be one among many reasons behind excellent supplier
participation in Delhi state tenders.
Second Report Public Procurement Observatory for the State of Uttar Pradesh
3
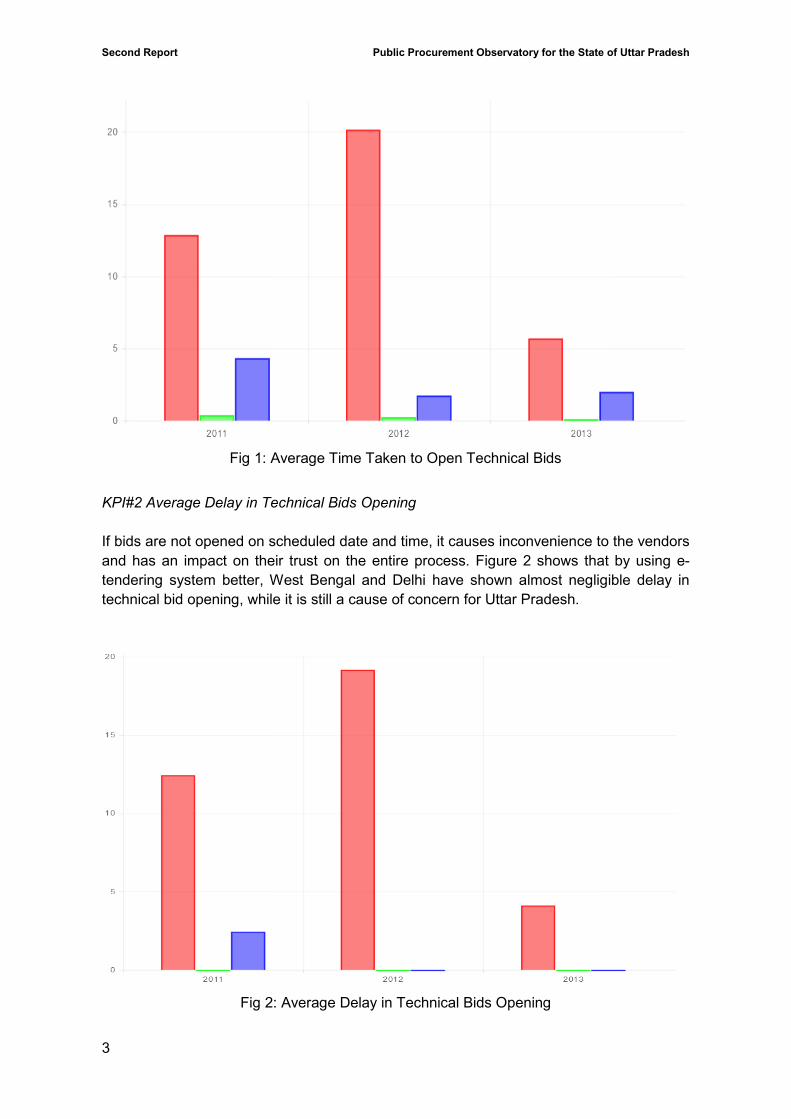
Fig 1: Average Time Taken to Open Technical Bids
KPI#2 Average Delay in Technical Bids Opening
If bids are not opened on scheduled date and time, it causes inconvenience to the vendors
and has an impact on their trust on the entire process. Figure 2 shows that by using e-
tendering system better, West Bengal and Delhi have shown almost negligible delay in
technical bid opening, while it is still a cause of concern for Uttar Pradesh.
Fig 2: Average Delay in Technical Bids Opening
Second Report Public Procurement Observatory for the State of Uttar Pradesh
4
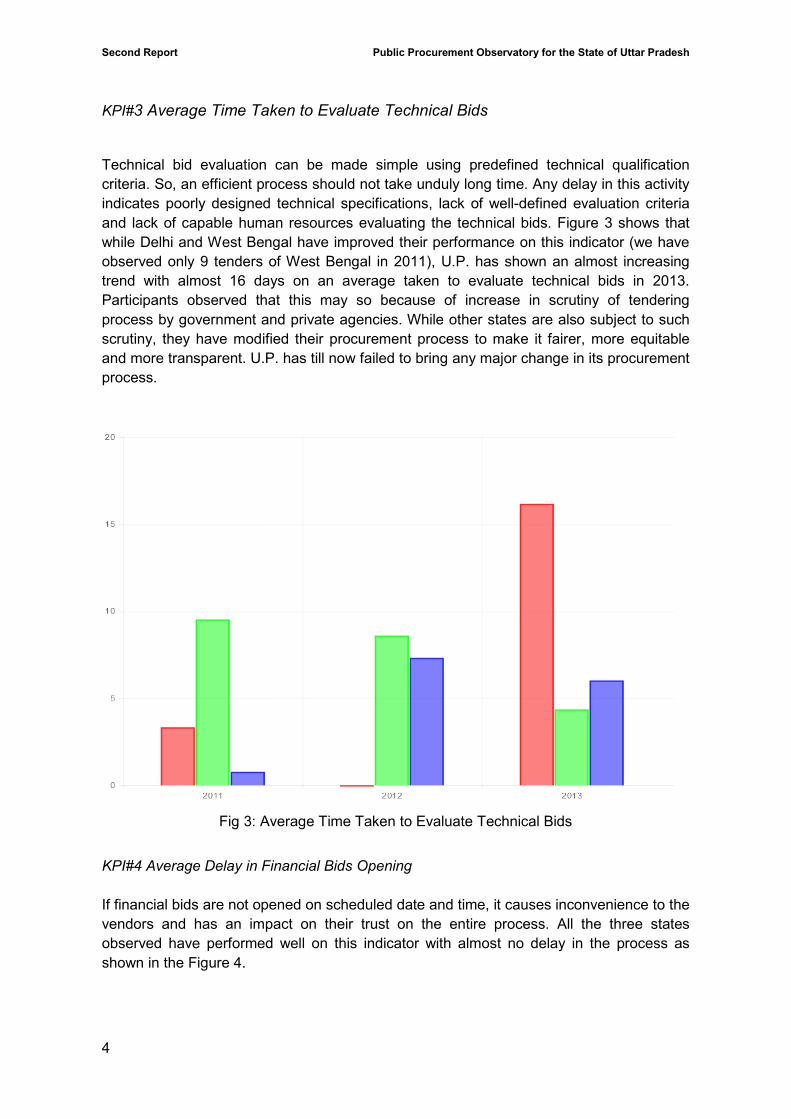
KPI#3 Average Time Taken to Evaluate Technical Bids
Technical bid evaluation can be made simple using predefined technical qualification
criteria. So, an efficient process should not take unduly long time. Any delay in this activity
indicates poorly designed technical specifications, lack of well-defined evaluation criteria
and lack of capable human resources evaluating the technical bids. Figure 3 shows that
while Delhi and West Bengal have improved their performance on this indicator (we have
observed only 9 tenders of West Bengal in 2011), U.P. has shown an almost increasing
trend with almost 16 days on an average taken to evaluate technical bids in 2013.
Participants observed that this may so because of increase in scrutiny of tendering
process by government and private agencies. While other states are also subject to such
scrutiny, they have modified their procurement process to make it fairer, more equitable
and more transparent. U.P. has till now failed to bring any major change in its procurement
process.
Fig 3: Average Time Taken to Evaluate Technical Bids
KPI#4 Average Delay in Financial Bids Opening
If financial bids are not opened on scheduled date and time, it causes inconvenience to the
vendors and has an impact on their trust on the entire process. All the three states
observed have performed well on this indicator with almost no delay in the process as
shown in the Figure 4.
Second Report Public Procurement Observatory for the State of Uttar Pradesh
5
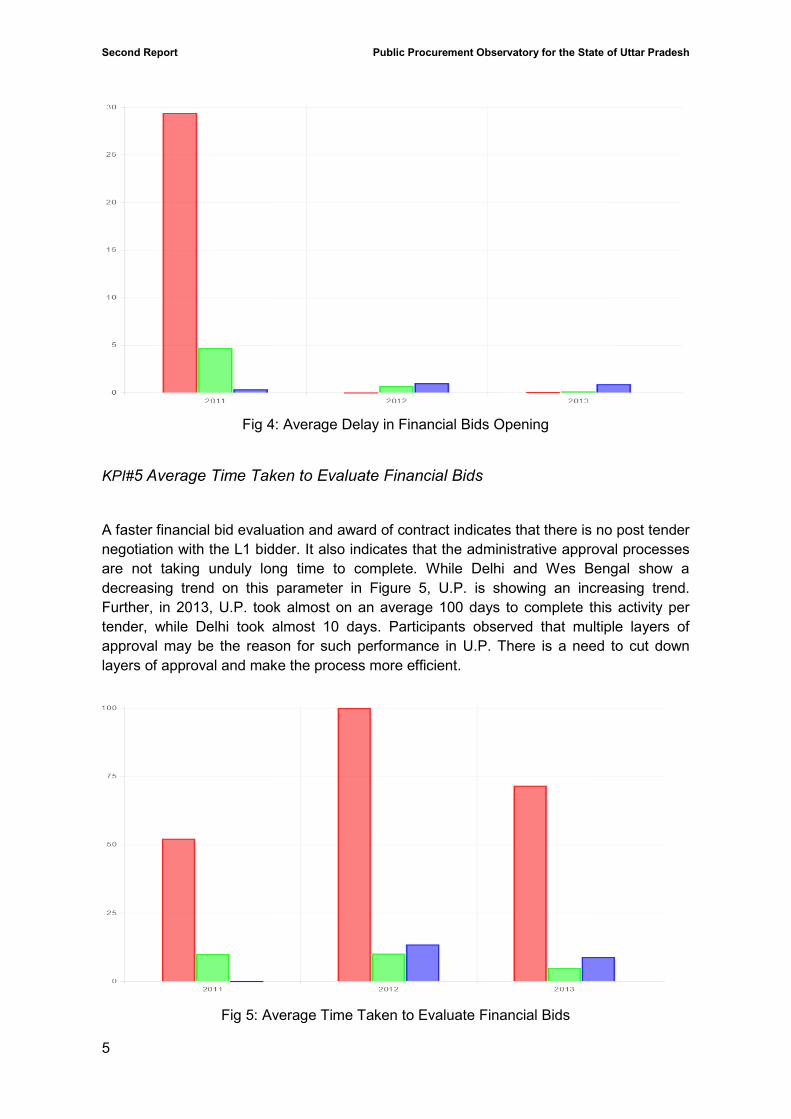
Fig 4: Average Delay in Financial Bids Opening
KPI#5 Average Time Taken to Evaluate Financial Bids
A faster financial bid evaluation and award of contract indicates that there is no post tender
negotiation with the L1 bidder. It also indicates that the administrative approval processes
are not taking unduly long time to complete. While Delhi and Wes Bengal show a
decreasing trend on this parameter in Figure 5, U.P. is showing an increasing trend.
Further, in 2013, U.P. took almost on an average 100 days to complete this activity per
tender, while Delhi took almost 10 days. Participants observed that multiple layers of
approval may be the reason for such performance in U.P. There is a need to cut down
layers of approval and make the process more efficient.
Fig 5: Average Time Taken to Evaluate Financial Bids
Second Report Public Procurement Observatory for the State of Uttar Pradesh
6
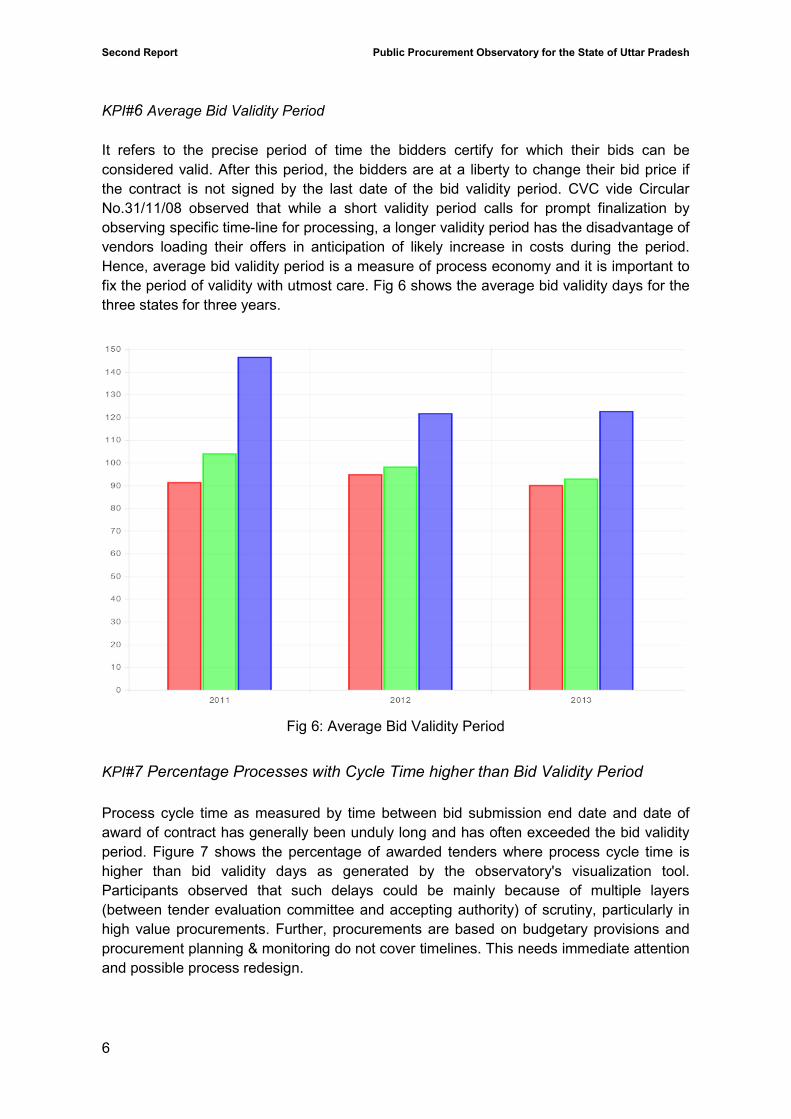
KPI#6 Average Bid Validity Period
It refers to the precise period of time the bidders certify for which their bids can be
considered valid. After this period, the bidders are at a liberty to change their bid price if
the contract is not signed by the last date of the bid validity period. CVC vide Circular
No.31/11/08 observed that while a short validity period calls for prompt finalization by
observing specific time-line for processing, a longer validity period has the disadvantage of
vendors loading their offers in anticipation of likely increase in costs during the period.
Hence, average bid validity period is a measure of process economy and it is important to
fix the period of validity with utmost care. Fig 6 shows the average bid validity days for the
three states for three years.
Fig 6: Average Bid Validity Period
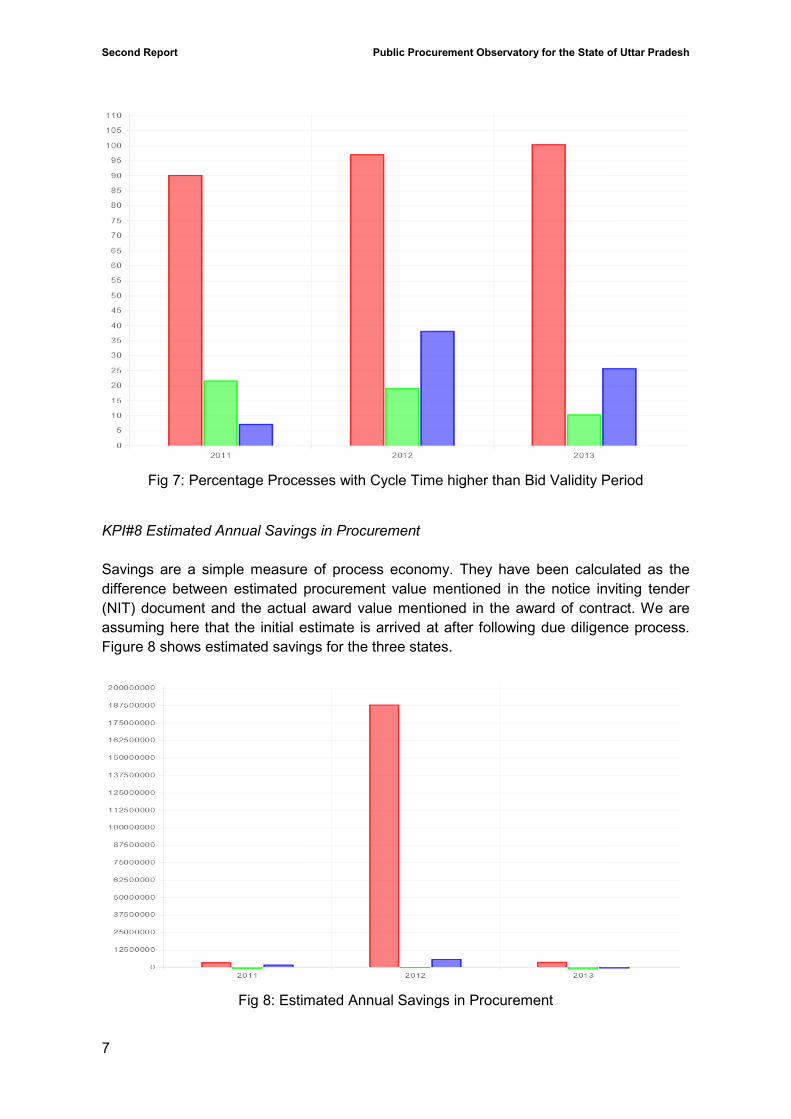
KPI#7 Percentage Processes with Cycle Time higher than Bid Validity Period
Process cycle time as measured by time between bid submission end date and date of
award of contract has generally been unduly long and has often exceeded the bid validity
period. Figure 7 shows the percentage of awarded tenders where process cycle time is
higher than bid validity days as generated by the observatory's visualization tool.
Participants observed that such delays could be mainly because of multiple layers
(between tender evaluation committee and accepting authority) of scrutiny, particularly in
high value procurements. Further, procurements are based on budgetary provisions and
procurement planning & monitoring do not cover timelines. This needs immediate attention
and possible process redesign.
Second Report Public Procurement Observatory for the State of Uttar Pradesh
7
Fig 7: Percentage Processes with Cycle Time higher than Bid Validity Period
KPI#8 Estimated Annual Savings in Procurement
Savings are a simple measure of process economy. They have been calculated as the
difference between estimated procurement value mentioned in the notice inviting tender
(NIT) document and the actual award value mentioned in the award of contract. We are
assuming here that the initial estimate is arrived at after following due diligence process.
Figure 8 shows estimated savings for the three states.
Fig 8: Estimated Annual Savings in Procurement
Second Report Public Procurement Observatory for the State of Uttar Pradesh
8
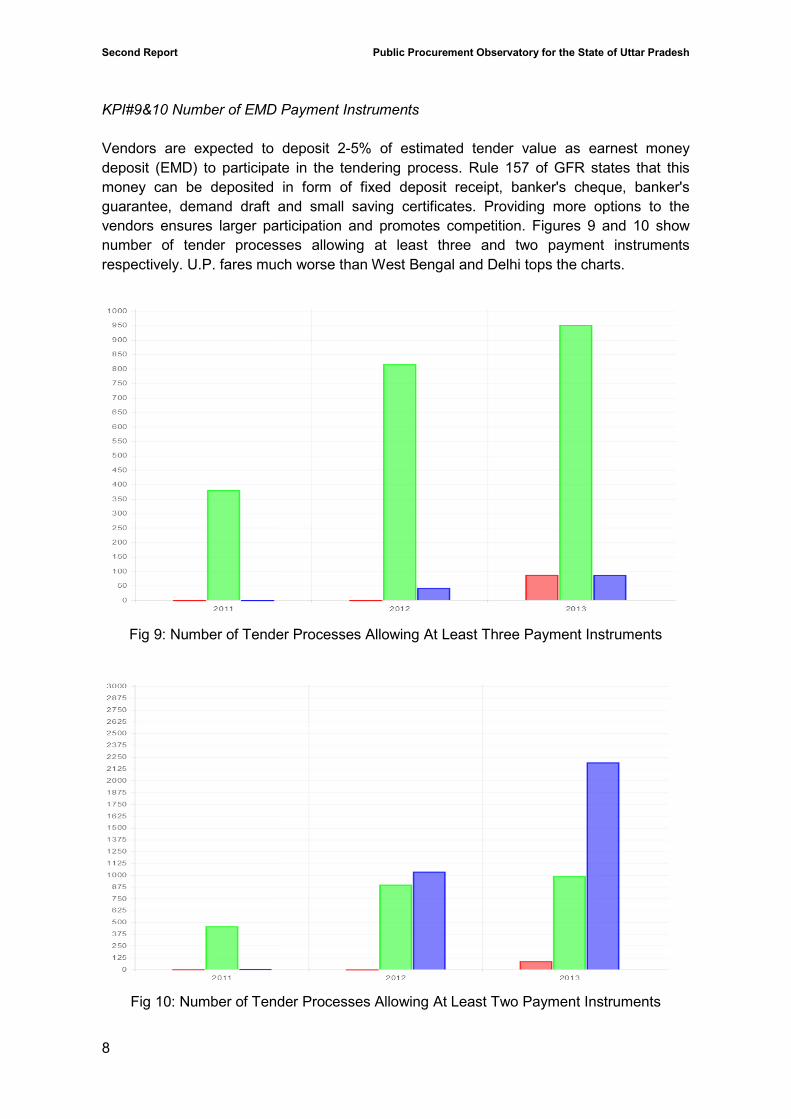
KPI#9&10 Number of EMD Payment Instruments
Vendors are expected to deposit 2-5% of estimated tender value as earnest money
deposit (EMD) to participate in the tendering process. Rule 157 of GFR states that this
money can be deposited in form of fixed deposit receipt, banker's cheque, banker's
guarantee, demand draft and small saving certificates. Providing more options to the
vendors ensures larger participation and promotes competition. Figures 9 and 10 show
number of tender processes allowing at least three and two payment instruments
respectively. U.P. fares much worse than West Bengal and Delhi tops the charts.
Fig 9: Number of Tender Processes Allowing At Least Three Payment Instruments
Fig 10: Number of Tender Processes Allowing At Least Two Payment Instruments
Second Report Public Procurement Observatory for the State of Uttar Pradesh
9
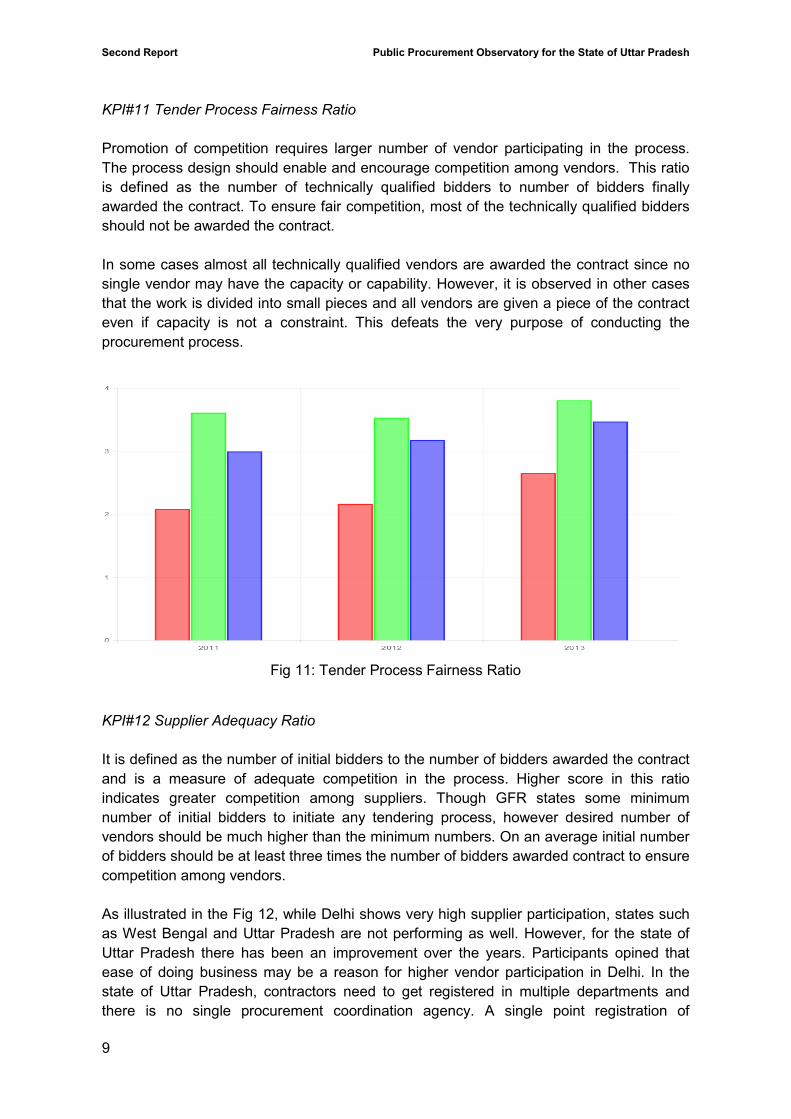
KPI#11 Tender Process Fairness Ratio
Promotion of competition requires larger number of vendor participating in the process.
The process design should enable and encourage competition among vendors. This ratio
is defined as the number of technically qualified bidders to number of bidders finally
awarded the contract. To ensure fair competition, most of the technically qualified bidders
should not be awarded the contract.
In some cases almost all technically qualified vendors are awarded the contract since no
single vendor may have the capacity or capability. However, it is observed in other cases
that the work is divided into small pieces and all vendors are given a piece of the contract
even if capacity is not a constraint. This defeats the very purpose of conducting the
procurement process.
Fig 11: Tender Process Fairness Ratio
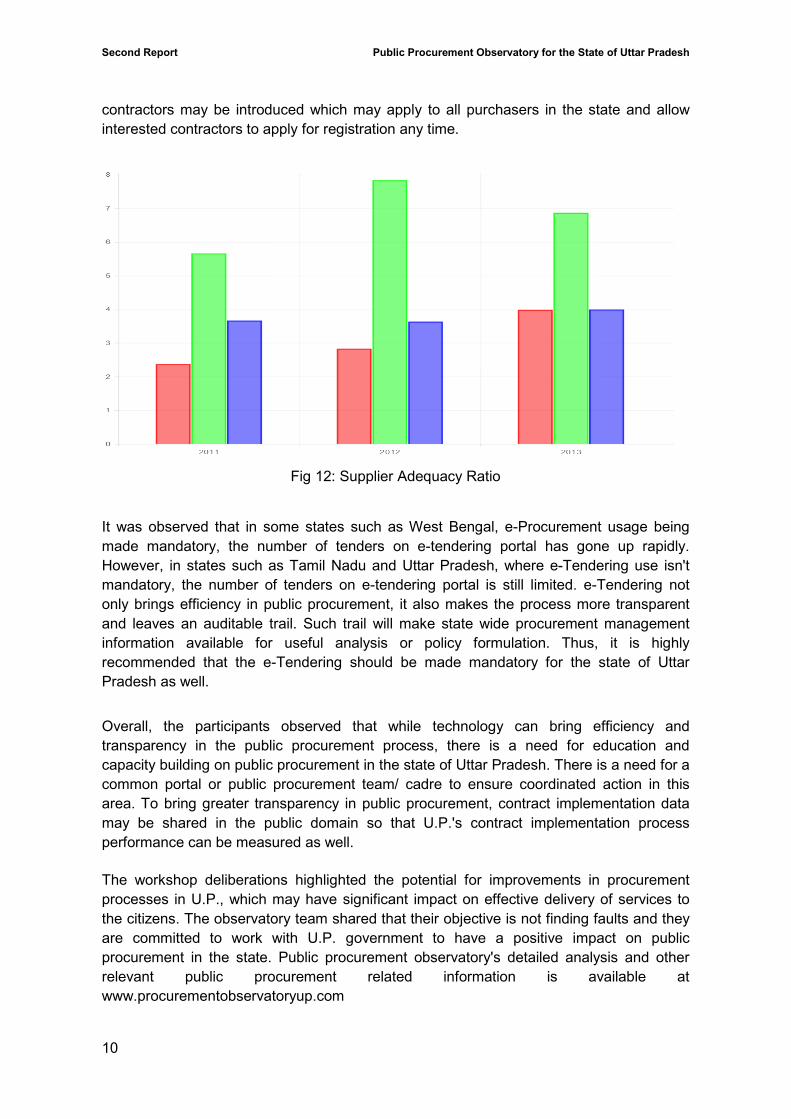
KPI#12 Supplier Adequacy Ratio
It is defined as the number of initial bidders to the number of bidders awarded the contract
and is a measure of adequate competition in the process. Higher score in this ratio
indicates greater competition among suppliers. Though GFR states some minimum
number of initial bidders to initiate any tendering process, however desired number of
vendors should be much higher than the minimum numbers. On an average initial number
of bidders should be at least three times the number of bidders awarded contract to ensure
competition among vendors.
As illustrated in the Fig 12, while Delhi shows very high supplier participation, states such
as West Bengal and Uttar Pradesh are not performing as well. However, for the state of
Uttar Pradesh there has been an improvement over the years. Participants opined that
ease of doing business may be a reason for higher vendor participation in Delhi. In the
state of Uttar Pradesh, contractors need to get registered in multiple departments and
there is no single procurement coordination agency. A single point registration of
Second Report Public Procurement Observatory for the State of Uttar Pradesh
10
contractors may be introduced which may apply to all purchasers in the state and allow
interested contractors to apply for registration any time.
Fig 12: Supplier Adequacy Ratio
It was observed that in some states such as West Bengal, e-Procurement usage being
made mandatory, the number of tenders on e-tendering portal has gone up rapidly.
However, in states such as Tamil Nadu and Uttar Pradesh, where e-Tendering use isn't
mandatory, the number of tenders on e-tendering portal is still limited. e-Tendering not
only brings efficiency in public procurement, it also makes the process more transparent
and leaves an auditable trail. Such trail will make state wide procurement management
information available for useful analysis or policy formulation. Thus, it is highly
recommended that the e-Tendering should be made mandatory for the state of Uttar
Pradesh as well.
Overall, the participants observed that while technology can bring efficiency and
transparency in the public procurement process, there is a need for education and
capacity building on public procurement in the state of Uttar Pradesh. There is a need for a
common portal or public procurement team/ cadre to ensure coordinated action in this
area. To bring greater transparency in public procurement, contract implementation data
may be shared in the public domain so that U.P.'s contract implementation process
performance can be measured as well.
The workshop deliberations highlighted the potential for improvements in procurement
processes in U.P., which may have significant impact on effective delivery of services to
the citizens. The observatory team shared that their objective is not finding faults and they
are committed to work with U.P. government to have a positive impact on public
procurement in the state. Public procurement observatory's detailed analysis and other
relevant public procurement related information is available at
www.procurementobservatoryup.com