Embed Size (px)
Citation preview

Implications of Biofouling on Cross-flow Turbine Performance
Carl Campbell Stringer
A thesis
submitted in partial fulfillment of the
requirements for the degree of
Master of Science in Mechanical Engineering
University of Washington
2019
Committee:
Brian Polagye, Chair
Benjamin Maurer
Andrew Stewart
Program Authorized to Offer Degree:
Mechanical Engineering

©Copyright 2019
Carl Campbell Stringer

University of Washington
Abstract
Implications of Biofouling on Cross-flow Turbine Performance
Carl Campbell Stringer
Chair of the Supervisory Committee:
Brian Polagye
Department of Mechanical Engineering
While biofouling is known to degrade the performance of marine energy conversion systems, prior
experimental work has not explored this topic for cross-flow turbines. Here, we present experiments
that investigate the impact of biofouling on turbine power output and structural loads. Using additive
manufacturing, a three-dimensional scan of a barnacle was patterned onto the surface of turbine blades
at three sizes and number densities, representing the progression from initial colonization to maturity.
The impact of barnacles on turbine power output was found to be substantial and, for the most severe
cases of fouling, the turbine does not produce power at any rotation rate. Conversely, barnacle fouling
was found to have minimal impact on structural loading. To maintain generation capacity over extended
periods, these results highlight the importance of antifouling coatings and proactive blade cleaning.

1
TABLE OF CONTENTS
Acknowledgements ....................................................................................................................................... 4
Foreword ....................................................................................................................................................... 5
1 Introduction .......................................................................................................................................... 6
2 Background ......................................................................................................................................... 10
2.1 Cross-Flow Turbine Hydrodynamics ........................................................................................... 10
2.2 Effects of Fouling on Blade Hydrodynamics ............................................................................... 11
3 Methods .............................................................................................................................................. 13
3.1 Turbine and Test Facility ............................................................................................................. 13
3.2 Fabrication of Fouled Turbines ................................................................................................... 15
4 Results ................................................................................................................................................. 18
5 Discussion ............................................................................................................................................ 20
5.1 Performance ............................................................................................................................... 20
5.2 Scaling of Results......................................................................................................................... 21
5.3 Maintenance and Operation ....................................................................................................... 24
5.4 Effect of Fouling on Support Struts ............................................................................................. 25
6 Conclusion ........................................................................................................................................... 26
Future Work ................................................................................................................................................ 27
References .................................................................................................................................................. 28
Appendix ..................................................................................................................................................... 31

2
LIST OF FIGURES
Figure 1. Water temperature measured at the MSL. ................................................................................... 5
Figure 2. Example of biofouling on a marine current turbine. ..................................................................... 7
Figure 3. Definition of turbine azimuthal position, forces, and torque. ..................................................... 13
Figure 4. Cross-flow turbine experimental testing apparatus. ................................................................... 15
Figure 5. Illustration of method for producing fouled turbines.................................................................. 16
Figure 6. Summary of time-average biofouling performance effects ........................................................ 19
Figure 7. Summary of phase-average biofouling performance effects. ..................................................... 20
Figure 8. Trends in maximum CP with barnacle height and density. .......................................................... 21
Figure 9. Support structure fouling performance effects. .......................................................................... 26
Figure A1. Estimate of ratio between barnacle height and blade boundary layer thickness…………………..32

3
LIST OF TABLES
Table 1. Comparison of Reynolds number between MSL turbine and experiments. ................................... 6
Table 2. Experimental Test Matrix .............................................................................................................. 18

4
ACKNOWLEDGEMENTS
Funding: This work was supported by the US Department of Defense Naval Facilities Engineering
Command. The author wishes to acknowledge Dr. Polagye for his support and guidance throughout the
work of this thesis. Additional appreciation goes out to Dr. Ben Strom and Ms. Hannah Ross for their
help in configuring the data acquisition for these experiments, as well as their input on turbine design.

5
FOREWORD
The work of this thesis was based on an upcoming cross-flow turbine deployment in Sequim Bay at
the Pacific Northwest National Laboratory’s (PNNL) Marine Sciences Laboratory (MSL). This deployment
is intended to test aspects of cross-flow turbine operation and design over long durations in the marine
environment. During these extended deployments, the potential for biofouling of the turbine rotor
becomes a possibility. The objective of this thesis was to investigate the performance effects of barnacle
fouling at subscale with the goal of simulating the hydrodynamics of real-world fouling on the MSL
turbine as accurately as possible. Though the MSL turbine could be colonized by a variety of fouling
species, we chose to focus on barnacles due to their estimated likelihood of occurrence, and to make
experimental design more tractable.
The MSL turbine was considered as a field-scale model for the experiments in this thesis.
Experimental turbine geometry was derived from the MSL turbine, and selection of fouling parameters
considered available data in the literature for sites near Sequim Bay. To provide context on the
scalability of experimental results to a field-scale tidal energy site (discussed in Section 5.2) Reynolds
number was estimated for the MSL turbine. Water temperature was determined using data taken at the
MSL pier provided by PNNL (Figure 1), and salinity was estimated as 30 g/kg (Elwha-Dungeness Planning
Unit 2005). Peak tidal current velocities around 2 m/s are estimated for the MSL turbine site.
Figure 1. Water temperature measured at the MSL pier in Sequim Bay, WA. Probability distribution shown on left and average monthly temperature shown on right.1
1 Due to discontinuous sampling of the data, estimates could not be calculated for the month of May.

6
Chord-based Reynolds number and blade chord length are compared for the experimental turbine
and the MSL turbine in Table 1. The Reynolds number of these subscale experiments is approximately
16-20 % that of the MSL turbine, and the geometric ratio between turbines is 1:5. Given these
differences, variations in turbine hydrodynamics between scales are likely.
Table 1. Comparison of geometric scale and chord-based Reynolds number between laboratory experiments and the MSL turbine. MSL turbine Reynolds number is shown for the minimum and maximum temperature of Sequim Bay and a current speed of 2 m/s.
Turbine Experiments MSL (7 °C) MSL (15 °C)
Blade Chord (cm) 2.0 10 10
Reynolds Number 2.71 x 10⁴ 1.36 x 10⁵ 1.70 x 10⁵
The remainder of this thesis, with the exception of the future work section, has been submitted to
the Journal of Ocean Engineering and Marine Energy.
1 INTRODUCTION
Current turbines convert the kinetic energy of moving water, such as rivers or tidal currents, to
mechanical power. These turbines have the potential to generate renewable electricity at scales ranging
from distributed sensing to grid-scale electricity (Copping et al. 2018; LiVecchi et al. 2019). While the
working fluid varies between wind and water, the fundamental fluid dynamics behind the conversion
processes are the same. For these reasons, current turbines have borrowed heavily from developments
in the more mature wind energy sector, though some considerations, such as cavitation and biofouling,
are unique to current turbines (Batten et al. 2006).
Two main types of current turbines are being developed for commercial applications: axial-flow
turbines have an axis of rotation parallel to the direction of fluid flow, while cross-flow turbines have an
axis perpendicular to the flow. While axial-flow turbines have achieved greater commercialization in the

7
wind industry, recent efforts have demonstrated improvements to cross-flow turbine individual device
efficiency (e.g., Strom et al. (2017)) and array efficiency (e.g., Dabiri (2011)). Further, cross-flow turbines
have a number of desirable attributes such as vertical orientation, which allows generator placement at
ground level and obviates the need for a yaw drive (Paraschivoiu 2002). In water, their rectangular
cross-section allows them to achieve higher blockage in confined flows, thus boosting overall efficiency
(Garrett and Cummins 2007). For these reasons, the present work focuses primarily on cross-flow
turbines.
Biofouling poses a performance risk for current turbine deployments, as for any long-term marine
application where performance depends on boundary layer hydrodynamics (e.g., vessel drag). Any
surface that is submersed in the ocean undergoes this colonization process by which marine organisms
can accumulate substantially on the surface over time (Titah-Benbouzid and Benbouzid 2015).
Figure 2. Ducted axial-flow tidal current turbine showing substantial biofouling after three years of deployment in the Race Rocks Ecological Reserve, British Columbia Canada.2
2 Photo from: http://www.racerocks.ca/tidal-energy-turbine-removal/. Lester B. Pearson College. Garry Fletcher photographer, racerocks.ca

8
While significant biofouling has been observed on long-term marine turbine deployments (e.g. Figure 2),
there has been limited quantification of performance consequences, particularly for cross-flow turbines.
It is well-known that antifouling coatings can be used to minimize biofouling, but trade-offs in their cost,
effectiveness, and toxicity mean that not all turbines or surfaces are likely to be treated, and presently
available solutions may be sub-optimal for marine current turbine applications (Loxton et al. 2017). To
quantify the cost-benefit trade-off of antifouling measures, further knowledge of turbine performance
and load changes as a consequence of biofouling, and better quantification of fouling growth rates and
species composition would be beneficial (this is an active area of research (Want and Porter 2018)). This
is particularly relevant for long-term and autonomous deployments (Copping et al. 2018) where some
degree of biofouling is probable between maintenance interventions.
For the purposes of this study, we consider representative biofouling for a hypothetical current
turbine deployed in Puget Sound, an estuary with multiple sites suitable for tidal energy development
(Polagye and Thomson 2013; Yang et al. 2014). Biofouling in Puget Sound is dominated by barnacles,
algae, and mussels, with species composition and abundance varying across water depth, location, and
season. Barnacles, such as Balanus Crenatus, are found over a wide range of depths (e.g., 6-15 meters in
(Depalma 1976; Hanson and Bell 1976), 55-75 meters (Polagye and Thompson 2010)). Evidence of
barnacle fouling at depths suited to tidal current generation, combined with their relatively large mature
size and growth rate (Sanford and Menge 2001), suggest that barnacles have the potential to
significantly impact turbine operation. Barnacle settlement is most probable when water temperatures
exceed 10 °C (Depalma 1976) and the primary barnacle settlement period in the Pacific Northwest is
from April to November (Hanson and Bell 1976) with peak growth occurring in summer and early fall
(Sanford and Menge 2001).
Relatively few studies have quantified current turbine power degradation due to fouling and most
of those have focused on axial-flow current turbines. Orme et al. (2001) experimentally investigated the

9
effect of fouling on the lift and drag of an airfoil at constant angles of attack using extruded plastic cones
to resemble barnacles. Significant declines in the peak lift to drag ratio were observed for both an
increase in fouling height and density. Using blade element momentum theory, these changes in airfoil
performance were estimated to reduce the maximum power coefficient (Eq. 1) between 20 % and 70 %.
Another experimental study by Walker et al. (2013) investigated the effect of increased blade surface
roughness on axial-flow turbine performance by applying contact cement to the blades as a proxy for
calcareous fouling. This reduced turbine power and thrust by 20 %. Concurrent numerical investigations
also revealed that roughness along the leading 10 % of the blade chord had a similar effect on lift and
drag as roughness across the entire chord.
The most similar prior work to our study is a numerical investigation of cross-flow turbine fouling
performed by Rivier et al. (2018). Two-dimensional simulations showed that barnacle colonization of the
blades significantly altered the vorticity field, with attendant implications for performance. As for
Walker et al., the proximity of fouling to the leading edge of the foil was shown to be significant. Both a
realistic and a triangular barnacle profile were considered, with each profile producing different velocity
fields around the blades. This suggests that the roughness profile is important, and a realistic fouling
shape should be used for accurate experimental testing. Rivier et al. also noted the need for higher
fidelity modeling at a lower computational cost, as results were sensitive to the choice of turbulence
model and three-dimensional simulations were unsatisfactory due to the coarse mesh required for
tractable computation. Little could be concluded regarding sensitivity to three-dimensional effects and
no estimations of turbine power or thrust coefficients were made. Rivier et al. highlights the difficulty of
accurately modeling cross-flow turbine response to biofouling and motivates our experimental study.
The only experimental investigation of cross-flow turbine surface roughness was by Howell et al.
(2010) who evaluated cross-flow turbine performance at multiple Reynolds numbers for smooth and
rough blade surfaces. That study revealed that the maximum torque for the rough blades was achieved

10
at lower tip-speed ratios than for the smooth blades. It was also found that turbine power output was
enhanced by the roughened blade surface below a critical Reynolds number, but degraded above that
value. This is indicative of the general sensitivity of cross-flow turbine performance to Reynolds number
(Bachant and Wosnik 2016; Miller et al. 2018).
Here, we evaluate the changes in turbine power output and structural loads as barnacle fouling
progresses from initial colonization to maturity. Further, we seek to understand when fouling would
likely become observable in performance data (i.e., for condition health monitoring of a turbine) and
how these performance changes are related to the size and concentration of fouling on blade surfaces.
Our efforts build on prior computational work by Rivier et al. for barnacle fouling and experimental work
by Howell et al. on uniform surface roughness.
2 BACKGROUND
2.1 Cross-Flow Turbine Hydrodynamics
The most efficient cross-flow turbines are driven by lift and produce net positive power when the
tangential speed at the rotor edge is greater than the free stream velocity. Unlike axial-flow turbines,
where the angle of attack between the free stream and blade is constant in time, the relative velocity
and angle of attack encountered by the blades on a cross-flow turbine vary substantially with the blade’s
azimuthal position. Consequently, instantaneous torque varies periodically, and blades can experience
deep dynamic stall and interact with their own wake (Buchner et al 2018; Ferrer and Willden 2015;
Somoano and Huera-Huarte 2017). As observed by Rivier et al. (2018), resolving these unsteady
boundary layer interactions in simulation often comes at high computational cost.

11
Cross-flow turbine performance is characterized by the relationship between non-dimensional
power and rotational speed. The power coefficient (CP), represents the efficiency with which the turbine
converts the kinetic power incident over its projected area to mechanical power, as
𝐶𝑃 =𝑄ℎ𝜔
1
2𝜌𝐴𝑈0
3 ( 1 )
where Qh is the hydrodynamic torque produced by the turbine, ω is the rotation rate of the turbine, ρ is
the density of the fluid, 𝑈0 is the free stream velocity, and A is the projected area of the turbine rotor.
The tip-speed ratio, λ, represents how fast the turbine rotor moves compared to the free stream as
𝜆 =𝑅𝜔
𝑈0 ( 2 )
where R is the turbine radius. Additionally, the non-dimensional thrust coefficient, CT, is given by
𝐶𝑇 =𝑇
1
2𝜌𝐴𝑈0
2 ( 3 )
where T is the thrust force acting on the turbine.
2.2 Effects of Fouling on Blade Hydrodynamics
Biofouling of turbine rotor blades increases the surface roughness, altering the flow field near the
blade surface (i.e., the boundary layer). At moderate to high Reynolds numbers, elevated surface
roughness decreases lift and increases drag (Sagol et al. 2013), which decreases time-average
hydrodynamic torque, Qh on the rotor. The magnitude of this decrease depends on the roughness
height, chord-wise location, fouling density, and foil shape. Surface roughness increases boundary layer
mixing and can lead to earlier and longer turbulent transitions along an airfoil (Kerho and Bragg 1997).
Further, as roughness height increases, so does the viscous drag due to a higher local velocity shear rate
at the blade surface (Sagol et al. 2013)

12
The effect of roughness on airfoil performance depends on the roughness height, k, relative to the
undisturbed boundary layer thickness, δ. Roughness elements that extend beyond the boundary layer
thickness (i.e., k/δ > 1), such as a mature barnacle, produce separated flow in their wake, which alters
the pressure distribution that develops along the blade surface. This local separation increases the
pressure drag and decreases the lift developed by the foil, as well as causing static stall at lower angles
of attack (Lee and Bragg 2003; Kerho and Bragg 1997). Surface roughness has also been shown to affect
dynamic stall, as demonstrated by Huebsch and Rothmayer (2002) for icing on an aircraft wing.
The chord-wise location of roughness elements also has a significant effect on airfoil performance,
with roughness near the leading edge having a larger effect than roughness near the trailing edge,
though the location of maximum performance loss varies with the roughness height (Lee and Bragg
2003). This effect is due to reductions in peak suction pressure at the leading edge and the higher local
velocity at this location which elevates drag from skin friction. Foil profiles and angles of attack that yield
relatively large leading edge suction peaks are, therefore, more affected by surface roughness.
Consequently, wind turbine design emphasizes foil profiles less sensitive to leading-edge surface
roughness (Burton et al. 2001). Finally, as the density of roughness elements on an airfoil increases,
performance decreases (Orme et al. 2001). This effect is coupled to the chordwise location, as the
combination of these parameters determines the spatial extent of disruption to the boundary layer.
The effect of biofouling on turbine hydrodynamics depends on species composition and maturity.
While biofilms as thin as 0.1 mm have been shown to increase skin friction on a flat plate (Schultz and
Swain 2000), barnacle heights can exceed 10 mm (Barnes and Powell 1950). At this size, barnacles would
cause local flow separation on a turbine blade and thus can be expected to affect viscous drag, pressure
drag, lift, and dynamic stall.

13
3 METHODS
The effects of barnacle growth on a cross-flow turbine were investigated at laboratory scale. An
interpretation of results in the context of a larger turbine is presented in Section 5.2. “Clean” and
“fouled” turbine blades and blade support attachments were fabricated using additive manufacturing.
Turbine performance was assessed over a range of tip-speed ratios at a single Reynolds number.
Experimental data is available at http://hdl.handle.net/1773/43775 (Stringer and Polagye 2019).
3.1 Turbine and Test Facility
The experimental turbine measured 17.2 cm in diameter and 25.3 cm in height. The turbine rotor
consisted of two straight blades with a NACA 0018 profile, a chord length of 2 cm, and a preset pitch
angle of 6° relative to a quarter-chord mount point. Blades were connected to the center shaft at each
end by two foil-shaped struts (NACA 0030 profile). Definitions of turbine azimuthal position, forces, and
torque are shown in Figure 3. Turbine geometry represented a 1:5 scale model of a turbine capable of
producing power outputs in the kilowatt range, which would be relevant for powering persistent sensing
or recharging underwater vehicles (Copping et al. 2018; LiVecchi et al. 2019).
Figure 3. Definition of turbine azimuthal position, forces, and torque.

14
Experiments were conducted in the Alice C. Tyler recirculating water flume in the Harris Hydraulics
Laboratory at the University of Washington. The test section of this flume measured 75 cm in the cross-
stream direction and tests were run at a dynamic water depth of 56 cm. During experiments, a constant
inflow velocity of 1 m/s and temperature of 34 °C were maintained. Turbulence intensity was
approximately 4 % and the turbine blockage ratio was 9.8 %. The experimental set up is shown in Figure
4. For the upper load cell, a 6-axis Mini45 (ATI Industrial Automation) was used, and for the lower load
cell a 6-axis Nano25 (ATI Industrial automation) was used. A Yaskawa servomotor (SGMCS-05B3C41)
equipped with a 218 count encoder was used to control the turbine’s rotation at a constant angular
velocity (Polagye et al. 2019). Turbine performance data was acquired using a National Instruments
6351 DAQ at a sampling rate of 1000 Hz with each tip-speed ratio maintained for 60 seconds. Inflow
velocity was measured five turbine diameters upstream of the turbine at the vertical and cross-stream
midpoint of the flow using an Acoustic Doppler Velocimeter (Nortek Vector) sampling at 64 Hz.
Turbine performance metrics (Eq. 1 – 3) were calculated on an instantaneous, time-average, and
phase-average basis. Time-averages were taken across an integer number of turbine rotations. Phase-
averages were calculated as a function of azimuthal blade position. Because it is difficult to temporally
correlate free stream turbulence and its interaction with the turbine rotor, the denominator in all the
performance metrics is a time average over an integer number of turbine rotations. The variability in
time-average and phase-average performance coefficients was quantified by the inter-quartile range
(IQR). Phase-average performance coefficients were computed in 6° azimuthal bins.

15
Figure 4. Schematic of cross-flow turbine experimental testing apparatus with measured and applied torques indicated.
The Reynolds number for these experiments is defined in terms of the blade chord length, c, as
𝑅𝑒𝑐 = 𝑈0𝑐
𝜈 ( 4 )
where ν is the kinematic viscosity of water. For all experiments, Rec was 2.7 x 10⁴, which is likely in a
transitional regime (Bachant and Wosnik 2016; Miller et al. 2018).
3.2 Fabrication of Fouled Turbines
Clean and fouled turbine blades were fabricated from Somos WaterShed XC 11122 using
stereolithography with a resolution of 0.05 mm. Blades were structurally reinforced by key stock (3/32"
x 3/32" x 12" Grade 18-8 Stainless Steel) and bonded to the end plates using epoxy. Even with
reinforcement, blades deflected substantially during testing, which may have altered performance.
However, this deflection was consistent across all turbines tested and should not affect relative
16
comparisons. Additionally, the extent of testing was limited by structural failures in the 3D printed
plastic at the joint connecting blade to strut (e.g., tests at multiple Reynolds numbers were originally
planned). Finally, the as-printed barnacle heights on fouled blades were markedly smaller than the CAD
models used for production, and the aspect ratio of the barnacles was, therefore, greater than intended.
This is to say that additive manufacturing is a powerful technique, but not without its limitations.
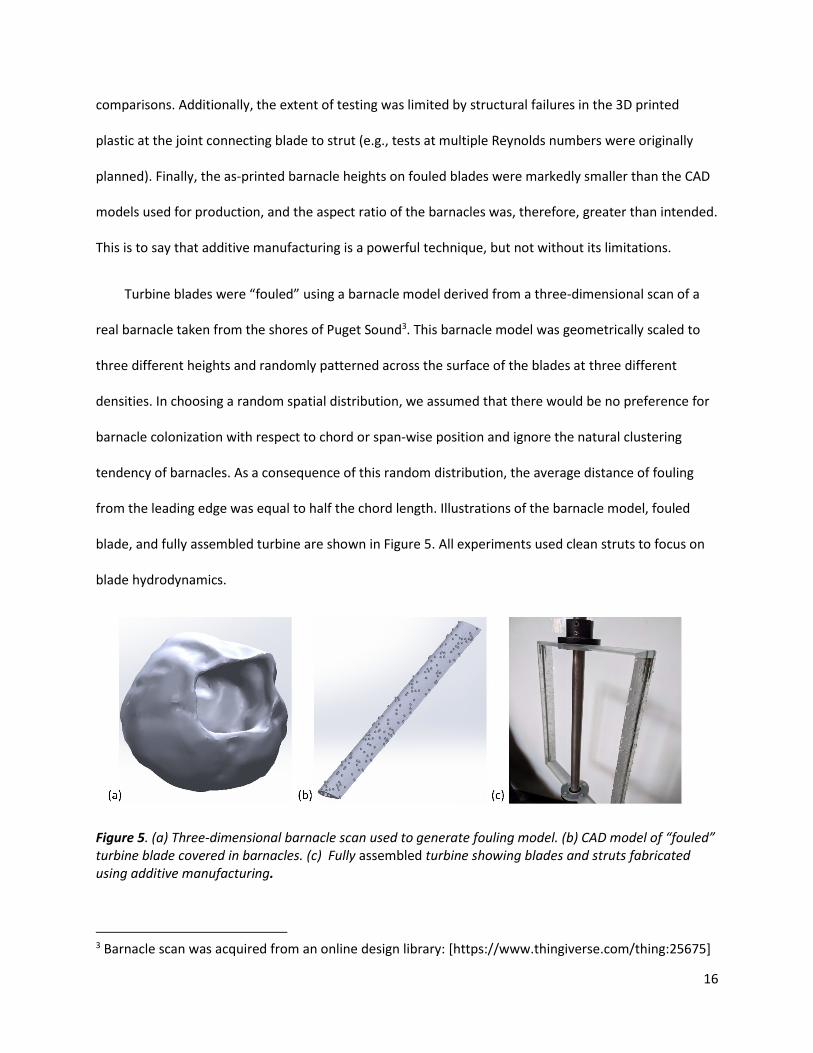
Turbine blades were “fouled” using a barnacle model derived from a three-dimensional scan of a
real barnacle taken from the shores of Puget Sound3. This barnacle model was geometrically scaled to
three different heights and randomly patterned across the surface of the blades at three different
densities. In choosing a random spatial distribution, we assumed that there would be no preference for
barnacle colonization with respect to chord or span-wise position and ignore the natural clustering
tendency of barnacles. As a consequence of this random distribution, the average distance of fouling
from the leading edge was equal to half the chord length. Illustrations of the barnacle model, fouled
blade, and fully assembled turbine are shown in Figure 5. All experiments used clean struts to focus on
blade hydrodynamics.
Figure 5. (a) Three-dimensional barnacle scan used to generate fouling model. (b) CAD model of “fouled” turbine blade covered in barnacles. (c) Fully assembled turbine showing blades and struts fabricated using additive manufacturing.
3 Barnacle scan was acquired from an online design library: [https://www.thingiverse.com/thing:25675]

17
Barnacle size was quantified by the non-dimensional roughness height k/c, where k was the
measured barnacle height. Barnacle density was quantified by the number of barnacles per blade,
though researchers have employed various density metrics to quantify the extent of barnacle fouling.
For example, Orme et al. (2001) represented the density as the number of barnacles per chord length-
squared area, while Demirel et al. (2017) used the percent of blade surface area covered by barnacles.
Some biofouling surveys (e.g., Hanson and Bell, 1976) have employed the dimensional barnacles per
square centimeter. Because our results are only quantitatively suited for comparison with a
geometrically-scaled turbine, the total number of barnacles per blade is the most relevant density
metric.
As-manufactured barnacle heights and densities are shown in Table 2. Values were selected based
on biofouling composition surveys conducted in Puget Sound (Depalma 1976; Hanson and Bell 1976)
and prior investigation of barnacle fouling of vessel hulls (Schultz 2004; Schultz 2007; Demirel et al.
2017). This range in fouling severity approximated turbine performance degradation at different stages
of barnacle maturity for a given initial colonization pattern. Barnacle dimensions were geometrically
scaled 1:5 to be consistent with the turbine model. Roughness scaling is discussed further in Section 5.2.

18
Table 2. Experimental test matrix of barnacle heights and densities, showing the percent of the surface area covered for each combination. Note: density illustrations are for large barnacles, and height illustrations do not represent the experimental densities.
Clean
Low (62)
Medium (306)
High (608)
Small (S) (0.006)
0 %
- 0.6 % 1.2 %
Medium (M) (0.014)
- 2.5 % 5.0 %
Large (L) (0.035)
2.0 % 10 % 20 %
4 RESULTS
Time-average turbine performance is summarized in Figure 6. Without exception, an increase in
either barnacle height or density decreases the maximum power coefficient (Figure 6a,b). The
magnitude of this performance loss becomes substantial as barnacle size increases, and with large
barnacles at medium and high densities, the turbines do not produce net power at any tip-speed ratio.
Additionally, barnacle size alters the optimal tip-speed ratio (tip-speed that maximizes the power
coefficient). As an exception to the overall trend, we note that the power coefficient for the small
barnacles increases compared to the clean blade at lower tip-speed ratios.
Barnacle fouling also slightly decreases the thrust coefficient (Figure 6c,d). Trends are less
consistent than for the power coefficient, as an increase in barnacle density yields a general, but modest
decrease in turbine thrust across tip-speed ratios. However, barnacle height does not have a consistent
Height (k/c)
Density (barnacles/
blade)

19
effect on the thrust coefficient, particularly at tip-speed ratios corresponding to peak power coefficient
and many of the median trends fall within the inter-quartile range of cycle-to-cycle variation (Figure 5d).
Figure 6. Time-average power coefficient (a) and thrust coefficient (c) as a function of tip-speed ratio for different barnacle heights and densities. Insets (c,d) show the region of interest for power generation in greater detail.
The effects of barnacle height on phase-average turbine performance is shown in Figure 7. When
barnacle height increases, the effect is nearly an offset in power coefficient, with the turbine producing
less power at all azimuthal positions. The magnitude of this offset varies with barnacle size (Figure 7a).
In contrast, barnacle fouling decreases the amplitude of the oscillation in phase-average thrust
coefficient (Figure 7b). Barnacle fouling does not appear to cause significant phase shifts in power or
thrust. This may be a consequence of speed-regulated control, which maintains blade kinematics across

20
the cases (Polagye et al. 2019). Phase shifts might occur under other control strategies (e.g., torque-
regulated control).
Figure 7. Effect of increasing barnacle height on phase-average turbine performance coefficients. Results are shown for medium density at λ=2.88, near the peak of the power performance curve.
5 DISCUSSION
5.1 Performance
The presence of barnacles on the blades and mounting structure of a cross-flow turbine can
dramatically reduce power production. Although this result is intuitive, the present work suggests that
beyond a relatively limited threshold of barnacle height and density, a cross-flow turbine can be
rendered incapable of producing power. Fortunately, barnacle fouling on blades does not increase
structural loads, such that blade fouling is primarily a performance, not a survival, concern. This is
consistent with prior experimental results for axial-flow turbines (Walker et al. 2013).
As illustrated in Figure 8, reductions in maximum CP are a function of both barnacle height and
density. As barnacle density increases, the marginal change in CP with density varies with barnacle size
(Figure 8a). For small barnacles, the performance degradation is nearly invariant with density (i.e. a few

21
barnacles are almost as detrimental as many). This is likely because once barnacles are distributed
spanwise along the blade, the aggregate disruption to the boundary layer is substantial. For medium and
large barnacles (i.e., barnacles closer to mature size), the marginal change in CP with density also
decreases, but is still substantial in absolute terms. Conversely, as barnacle height increases (Figure 8b),
the marginal reduction in CP increases with height. In other words, once barnacles colonize the surface
of a cross-flow turbine blade in any substantive density, the performance degradation will accelerate as
they mature.
Figure 8. Trends in maximum power coefficient with increasing barnacle height and density. Results are shown for λ=2.88, near the peak of the power performance curve.
5.2 Scaling of Results
While these results suggest that biofouling poses a significant performance risk to marine current
turbines, they correspond to a single turbine geometry and Reynolds number. Here we discuss the
relevance and limitations of quantitatively extending these experimental results to turbines with a
similar geometry operating at different Reynolds numbers.
In general, cross-flow turbine performance has been shown to increase with blade-chord Reynolds
number up to a critical value, beyond which performance is independent of Reynolds number. Bachant

22
and Wosnik (2016) found that for their three-bladed turbine, this critical value was around Rec = 2 X 10⁵.
While turbine geometry varies between our study and Bachant and Wosnik, this strongly suggests that
our experiments (Rec = 2.7 X 10⁴) take place at a transitional Reynolds number, and clean turbine
performance would likely increase with Reynolds number. Miller et al. (2018) suggests that Reynolds
independence is not achieved for some cross-turbines until Rec = 1.5 X10⁶, such that even a kW-scale
turbine could still be operating in a transitional regime. Regardless, as the Reynolds number increases,
foil stall occurs at higher angles of attack due more efficient momentum transfer within the boundary
layer, and the maximum lift to drag ratio is thus increased. Due to the angle of attack variation
experienced by a cross-flow turbine blade, this increases lift at some azimuthal positions and increases
cycle-average power output.
The effect of blade roughness on cross-flow turbine performance also depends on Reynolds
number. For example, Howell et al. (2010) reported that, at lower Reynolds numbers, rough blades (k/c
= 0.005) outperformed smooth blades, but, at higher Reynolds numbers, smooth blades had superior
performance. A similar effect can be seen in Figure 6 when comparing the performance of clean blades
to blades with small barnacles (k/c = 0.006). At lower tip-speeds, turbine performance increases with
fouling. Because the roughness of the fouled blade trips the boundary layer into turbulence at a lower
Reynolds number, this likely causes the flow to stay attached longer and delays the onset of stall to a
higher angle of attack, thus increasing the performance for some rotation rates. Although the viscous
drag is increased by the small barnacles, the pressure drag and thus overall drag is reduced. At higher
tip-speed ratios, the azimuthal range in angle of attack is reduced and the increase in viscous drag likely
dominates. For the larger barnacle sizes, the increase in pressure drag caused by the expansion of the
boundary layer is sufficient to outweigh the benefit of delayed stall. In summary, beyond Reynolds
independence, we would expect performance at all tip-speed ratios to decrease due to fouling, but
below Reynolds independence, the onset of fouling may increase performance at some tip-speeds.

23
The effect of surface roughness on airfoil performance has been investigated in the airfoil icing
literature and this analogue provides insight into experimental scaling of surface roughness. Airfoil
performance is sensitive to Reynolds number, k/δ (roughness height normalized by boundary layer
thickness), and the location of roughness with respect to the leading edge. As discussed in Section 2.2,
different roughness heights affect airfoil performance in different ways. Small roughness (k/δ < 1),
primarily increases the skin friction along the blade, and performance changes are relatively sensitive to
Reynolds number (Lee et al. 2005). Conversely, large roughness (k/δ > 1), causes local flow separation,
but the performance changes are relatively insensitive to Reynolds number (Lee and Bragg 2003).
As a consequence, numerous studies have found that geometric scaling of the roughness height
(i.e., maintaining k/c across geometric scale) provides accurate airfoil performance during subscale
testing (Lee and Bragg, 2003; Lee et al. 2005; Whalen et al. 2008). However, for small ice profiles with
k/δ ≤ 1, geometric scaling has been found to be generally less accurate at representing full scale
performance effects (Whalen et al. 2008). Broeren et al. (2010) found that geometric scaling for
simulated runback-ridge ice, for which k/δ ~ 1 (Whalen et al. 2008), amplified the performance losses
measured at full-scale. This suggests that hyper-scaling of roughness may be more appropriate, but the
optimal approach is likely to vary with model scale and application.
To evaluate the appropriateness of geometric scaling for our experiments, k/δ, was estimated for
the experimental turbine (details provided in Appendix). k/δ was found to range from near zero
(Reynolds-dependent regime) in regions close to the trailing edge of the blade, to greater than 10
(Reynolds-independent regime) for the large barnacles along the leading edge. For the small barnacles,
k/δ < 1 across most of the blade. This suggests geometric scaling of this roughness would likely lead to
an over-prediction of effects at larger scale. Conversely, because the large barnacles exceed the
estimated boundary layer thickness for most azimuthal positions, geometric scaling is likely to yield
accurate results. The medium barnacles are likely in a transitional k/δ regime.

24
Our performance results are only quantitatively valid for turbines that are geometrically similar to
the experimental turbine due to the strong influence of turbine geometry on power output (Strom
2019). As the number of blades, solidity, foil profile, aspect ratio etc. are changed, the absolute effect of
fouling will likely also change. These results are, however, likely qualitatively representative, with
barnacle fouling likely to reduce maximum CP and associated CT.
5.3 Maintenance and Operation
Experimental turbine geometry and barnacle size represent a 1:5 scale model of a kW-scale turbine.
If geometric scaling is accepted as valid, this suggests that maximum CP declines by 15 % when low-
density barnacles are only 0.5 mm tall. This would be barely perceptible by touch and marginally visible
by eye but would be detectable in turbine power output and would likely be detected by a condition
monitoring system. Once barnacle height reaches 1.5 mm, CP declines by 30-50 %, and by a height of 4
mm, the turbine would cease to produce power. The pace of these performance declines would also
depend on the colonization density. Barnacle growth rates can vary between 0.02 and 0.10 mm per day
depending on factors such as species, location, and season (Sanford and Menge 2001; Berger et al.
2006). At these growth rates, barnacle height would increase from 0.5 mm to 1.5 mm in 10-50 days and
to 4 mm in 25-125 days. This is a relatively limited window for reactive maintenance and emphasizes the
benefits of durable antifouling coatings.
The shift in the shape of the power performance curve seen in the data suggest that biofouling
could also have implications for the control of cross-flow turbines. For example, λoptimal shifts by 5 %
between clean blades and blades with small barnacles. A change of this magnitude could lead to
additional power losses of 1–3 % (Johnson et al. 2004) if a non-linear controller (e.g., kω2) is used to
maximize power (Forbush et al. 2017). This suggests that there may be marginal benefits to
implementing adaptive control schemes.

25
5.4 Effect of Fouling on Support Struts
While not the focus of this study, it is informative to consider how fouling of other components,
such as the blade support struts, would affect turbine power performance. To this end, an experiment
was conducted with fouled blades and struts. Fouled struts were fabricated with large barnacles at a
medium density. Specifically, the density was 216 barnacles per strut which corresponded to the 10 %
surface coverage of the large barnacle, medium density fouled blades. We note that this fouling case is
one where the turbine does not produce power at any tip-speed ratio, even with clean struts (Figure 6a),
but is still informative.
To estimate the relative contribution to performance loss caused by fouling of the blades versus
fouling of the mounting structure, measured turbine performance was decomposed as for Strom, et al.
(2018) as
𝐶𝑃 = 𝐶𝑃,𝑏𝑙𝑎𝑑𝑒𝑠 + 𝐶𝑃,𝑚𝑜𝑢𝑛𝑡 + 𝐶𝑃,𝑠𝑒𝑐𝑜𝑛𝑑𝑎𝑟𝑦 (5)
where CP,blades represents the net non-dimensional power produced by the blades, CP,mount represents the
non-dimensional performance loss from the struts structure, and CP,secondary encompasses the effect of
the mounting structure on the blades (e.g., reduction in tip loss, span-wise flow), as well as the effect of
the blades on the mounting structure (e.g., induction). Based on Strom et al. (2018), the secondary
effects are likely negligible, such that the blade performance can be estimated from measurements of CP
and measurements of CP,mount (taken by rotating the support structure without blades).
As illustrated in Figure 9, turbine power loss is substantially greater when fouling occurs on the
blades compared to an equivalent fouling size and density on the support structure. This difference may
be less significant for a turbine with higher support structure losses (e.g., disc end plates).

26
Figure 9. Comparison of degradation in CP for blade fouling vs. fouling of the struts shown for large barnacles at medium density.
6 CONCLUSION
The performance effects of biofouling on a cross-flow turbine were measured for three different
sizes and densities of barnacle fouling. The presence of barnacles on a turbine rotor affects both power
and thrust. Experiments demonstrated a significant decrease in maximum CP, with declines ranging from
15 % for the small barnacles (k/c = 0.006) to greater than 100 % for the large barnacles (k/c = 0.035).
This indicates that barnacle fouling can render a cross-flow turbine incapable of producing power.
Measurements of power loss for fouled struts demonstrate that performance reductions are likely to be
dominated by blade fouling, but that strut fouling is significant. Due to the likelihood of substantial loss
in power production, antifouling coatings should be applied to all cross-flow turbine components. In
contrast, relatively small declines in CT of 2-5 % were measured, demonstrating that while biofouling
severely degrades turbine power output, it does not greatly affect structural loading. Quantitative
extrapolation of these results to larger-scale turbines is challenging, as the boundary layer changes
associated with fouling may scale differently with Reynolds number than the blade kinematics that give

27
rise to turbine power and thrust. This could be an interesting line of future research, as could the effect
of barnacle location and clustering relative to the random colonization pattern used in this study.
FUTURE WORK
Fabrication of the turbines used in these experiments was enabled by recent advances in additive
manufacturing technology, namely improvements in printing resolution, feature size, and maximum part
size. However, this fabrication technique also presented several experimental limitations. The high
monetary cost of the stereolithography printing (chosen for its high resolution) dictated that a limited
number of fouled turbines could be printed. Results are consequently sparse and much of the
parameter space remains to be investigated. Performance data for a greater number of barnacle heights
and densities, particularly in the region where the turbine produces power, would provide more
detailed estimates of trends in performance loss with fouling severity. Additionally, consideration of
barnacle preference for chord/span-wise location, and clustering would be topics worthy of
investigation. Finally, experimental investigations of colonization by other common fouling species such
as muscles, algal slimes, and sea grass would provide a more complete picture of the performance risks
posed by biofouling.
Experiments were run at the flume’s maximum free-stream velocity of 1 m/s to maximize the
Reynolds number. At this speed, blades are subjected to a significant oscillating loads, and large blade
deflections were observed. After a few experimental repetitions, consistent failure in the Watershed 3D
printing plastic at the joints connecting blades and struts were observed. Testing was consequently
limited to a handful of trials for each turbine, and experiments to investigate trends in fouling
performance loss with Reynolds number were not satisfactorily repeatable. Therefore, Reynolds effects
remain an open question. This would be an obvious, and important topic for future exploration. Based

28
on my experience, a stiffer 3D printed material, or more robust design of the blade-strut joint could
improve turbine durability.
As mentioned in the Foreword, turbine geometry was based upon the upcoming MSL cross-flow
turbine deployment. This deployment presents the potential for field-scale comparison with the present
results. If biofouling is observed at MSL, roughness height and density measurements could be taken,
and trends in turbine CP and CT could be compared to the results presented in this thesis. This
comparison might also allow for the direct evaluation of scaling procedures for blade surface roughness
during subscale cross-flow turbine testing.
The present work has implications for the maintenance and operation of marine current turbines.
Condition Monitoring Systems (CMS) address issues such as autonomous operation and maintenance
costs by optimizing scheduling of maintenance. Given the magnitude of the measured turbine
performance loss, the present work indicates that CMS-based detection of biofouling at field-scale from
turbine Supervisory Control and Data Acquisition (SCADA) data might be possible. This ability would
eliminate the need for biofouling related inspection, allow for proactive blade cleaning, and would be an
exciting extension of this thesis.
REFERENCES
Bachant P, Wosnik M (2016) Effects of Reynolds Number on the Energy Conversion and Near-Wake Dynamics of a High Solidity Vertical-Axis Cross-Flow Turbine. Energies 9(2).
Barnes H, Powell H (1950) The Development, General Morphology and Subsequent Elimination of Barnacle Populations, Balanus crenatus and B. Balanoides, After a Heavy Initial Settlement. Journal of Animal Ecology 19(2):175-179.
Batten W, Bahaj A, Molland A, Chaplin J (2006) Hydrodynamics of marine current turbines. Renewable Energy 31(2):249-256.
Berger M, Darrah A, Emlet R (2006) Spatial and temporal variability of early post-settlement survivorship and growth in the barnacle Balanus glandula along an estuarine gradient. Journal of Experimental Marine Biology and Ecology 336:74-87.
Broeren A, Whalen E, Busch G, Bragg M (2010) Aerodynamic Simulation of Runback Ice Accretion. Journal of Aircraft 47(3).

29
Buchner A, Soria J, Honnery D, Smits A (2018) Dynamic stall in vertical axis wind turbines: scaling and topological considerations. Journal of Fluid Mechanics 841:746-766.
Burton T, Sharpe D, Jenkins N (2001) Handbook of wind energy. John Wiley & Sons.
Copping A, LiVecchi A, Spence H, Gorton A, Jenne S, Preus R, Gill G, Robichaud R, Gore S (2018) Maritime Renewable Energy Markets: Power From the Sea. Marine Technology Society Journal 52(5):99-109.
Dabiri J (2011) Potential order-of-magnitude enhancement of wind farm power density via counter-rotating vertical-axis wind turbine arrays. Journal of Renewable and Sustainable Energy 3(4).
Demirel Y, Dogancan U, Zhang Y, Fang H, Day A, Turan O (2017) Effect of barnacle fouling on ship resistance and powering. Biofouling 33(10):819-834.
Depalma J (1976) Final Report on Marine Biofouling Studies at Admiralty Inlet, Washington, Washington D.C.: Naval Oceanographic Office.
Ferrer E, Willden R (2015) Blade–wake interactions in cross-flow turbines. Internation Journal of Marine Energy 11:71-83.
Forbush D, Cavagnaro R, Donegan J, McEntee J, Polagye B (2017) Multi-mode evaluation of power-maximizing cross-flow turbine controllers. IJOME 20:80-96.
Garrett C, Cummins P (2007) The efficiency of a turbine in a tidal channel. Journal of Fluid Mechanics 588:243-251.
Hanson C, Bell J (1976) Subtidal and Intertidal Marine Fouling on Artificial Substrata in Northern Puget Sound, Seattle: National Oceanographic and Atmospheric Administration.
Howell R, Qin N, Edwards J, Durrani N (2010) Wind tunnel and numerical study of a small vertical axis wind turbine. Renewable Energy 35:412-422.
Huebsch W, Rothmayer A (2002) Effects of Surface Ice Roughness on Dynamic Stall. Journal of Aircraft 39(6).
Johnson K, Fingersh L, Balas M, Pao L (2004) Methods for Increasing Region 2 Power Capture on a Variable-Speed Wind Turbine. ASME Journal of Solar Energy Engineering 126.
Kerho M, Bragg M (1997) Airfoil Boundary-Layer Development and Transition with Large Leading-Edge Roughness. American Institute of Aeronautics and Astronautics 35(1).
Lee S, Bragg M (2003) Investigation of Factors Affecting Iced-Airfoil Aerodynamics. Journal of Aircraft 40(3).
Lee S, Ratvasky T, Thacker M, Barnhart B (2005) Geometry and Reynolds-Number Scaling on an Iced Business-Jet Wing. American Institute of Aeronautics and Astronautics 1066.
LiVecchi A, Copping A, Jenne D, Gorton A, Preus R, Gill G, Robichaud R, Green R, Geerlofs A, Gore A, Hume D, McShane W, Schmaus C, Spence H (2019) Powering the Blue Economy; Exploring Opportunities for Marine Renewable Energy in Maritime Markets, Washington, D.C. : U.S. Department of Energy, Office of Energy Efficiency and Renewable Energy.
Loxton J, Macleod A, Nall C, McCollin T, Machado I, Simas T, Vance T, Kenny C, Want A, Miller R (2017) Setting an agenda for biofouling research for the marine renewable energy industry. International Journal of Marine Energy 19:292-303.

30
Miller M, Duvvuri S, Brownstein I, Lee M, Dabiri J, Hultmark M (2018) Vertical-axis wind turbine experiments at full dynamic similarity. Journal of Fluid Mechanics 844:707-720.
Orme J, Masters I, Griffiths R (2001) Investigation of the Effect of Biofouling on the Efficiency of Marine Current Turbines. The Institute of Marine Engineers.
Paraschivoiu I (2002) Wind turbine design: with emphasis on Darrieus concept. Presses inter Polytechnique.
Polagye B, Thompson J (2010) Screening for Biofouling and Corrosion of Tidal Energy Device Materials: In-situ results for Admiralty Inlet, Puget Sound, Washington , Seattle: NNMREC: Northwest National Marine Renewable Energy Center Report no. 1.
Polagye B, Strom B, Forbush D, Ross H, Cavagnaro R (2019) Comparison of Cross-flow Turbine Performance under Torque-Regulated and Speed-Regulated Control. JRSE (In Review).
Polagye B, Thomson J (2013) Tidal energy resource characterization: methodology and field study in Admiralty Inlet, Puget Sound, WA (USA). Journal of Power and Energy 227(3):352-367.
Rivier A, Bennis A-C, Jean G, Dauvin J-C (2018) Numerical simulations of biofouling effects on the tidal turbine hydrodynamic. International Marine Energy Journal 1(2):101-109.
Sagol E, Reggio M, Ilinca A (2013) Issues Concerning Roughness on Wind Turbine Blades. Renewable and Sustainable Energy Reviews 23:514-525.
Sanford E, Menge B (2001) Spatial and Temporal Variation in Barnacle Growth in a Coastal Upwelling System. Marine Ecology Progress Series 209:143-157.
Schultz M (2004) Frictional Resistance of Antifouling Coating Systems. Journal of Fluids Engineering 126:1039-1047.
Schultz M (2007) Effects of Coating Roughness and Biofouling on Ship Resistance and Powering. Biofouling 23:331-341.
Schultz M, Swain G (2000) The Influence of Biofilms on Skin Friction Drag. Biofouling 15:129-139.
Somoano M, Huera-Huarte F (2017) Flow dynamics inside the rotor of a three straight bladed cross-flow turbine. Applied Ocean Research 69:138-147.
Stringer C, Polagye B (2019) Supplementary Data for "Implications of Biofouling on Cross-flow Turbine Performance". Available at: http://hdl.handle.net/1773/43775
Strom B (2019) Cross-Flow Turbine Fluid Mechanics: Experimental Optimization and Analysis. Dissertation, University of Washington.
Strom B, Polagye B, Brunton S (2017) Intracycle Control of Cross-Flow Turbines. Nature Energy 2(17103).
Strom B, Polagye B, Johnson N (2018) Impact of Blade Mounting Structures on Cross-Flow Turbine Performance. Journal of Renewable and Sustainable Energy 10(3).
Titah-Benbouzid H, Benbouzid M (2015) Marine Renewable Energy Converters and Biofouling: A Review on Impacts and Prevention. Nantes, France, EWTEC.
Walker J, Flack K, Lust E, Schultz M, Luznik L (2013) Experimental and Numerical Studies of Blade Roughness and Fouling on Marine Current Turbine Performance. Renewable Energy 66:257-267.

31
Want A, Porter J (2018) BioFREE: an international study of biofouling impacts on the marine renewable energy industry. Kobe, Japan, IEEE.
Whalen E, Broeren A, Bragg M (2008) Aerodynamics of Scaled Runback Ice Accretions. Journal of Aircraft 45(2).
Yang Z, Wang T, Copping A, Geerlofs S (2014) Modeling of in-stream tidal energy development and its potential effects in Tacoma Narrows, Washington, USA. Ocean & coastal management 99:55-62.
APPENDIX
The boundary layer thickness, δ, was calculated for the experimental turbines to compare to the
roughness height, k. Due to nonlinear effects (e.g., dynamic stall, wake interaction), significant
simplifications are necessary to estimate boundary layer thickness in the chordwise direction for a cross
flow turbine blade. Further, the boundary layer thickness varies with azimuthal position. Order of
magnitude approximations were obtained using the software Xfoil4 for static angles of attack and
nominal velocity (speed encountered by the blade) estimated as a function of azimuthal position
assuming negligible induction (Polagye et al. 2019). Nominal angle of attack (αn) and velocity (Un) are
calculated as functions of azimuthal position (ϴ) as
𝛼𝑛(𝜃) = −𝑡𝑎𝑛−1 sin (𝜃)
𝜆+cos (𝜃)+ 𝛼𝑝 (A1)
𝑈𝑛(𝜃) = 𝑈0√𝜆 + 2𝜆 cos(𝜃) + 1 (A2)
where αP is the preset pitch angle. Because Xfoil only outputs integral boundary-layer parameters, δ was
estimated from the displacement thickness (δ*) based upon the Blasius solution for a flat plate
(assuming the foil curvature is “small” relative to δ) as
𝛿 = 2.91𝛿∗ . (A3)
4 Drela, M., XFOIL Subsonic Airfoil Development System, https://web.mit.edu/drela/Public/web/xfoil/.

32
Figure A1 shows estimated azimuthal variation in k/δ in comparison to phase average performance from
experiments.
Figure A1. Estimated roughness height, k, over boundary layer thickness, δ, as a function of azimuth and chordwise location for each barnacle height. Upper Row: clean turbine phase average power coefficient. Middle row: Outside of the blade. Lower row: Inside of the blade.