Embed Size (px)
Citation preview

An assessment of marine biofouling introductions to the Puget Sound region of Washington State
Final Report May 2014
Aquatic Bioinvasion Research & Policy Institute

Puget Sound biofouling introductions and vectors
2
An assessment of marine biofouling introductions to the Puget Sound region of Washington State
Final Report May 2014 By
Ian Davidson, Chela Zabin, Gail Ashton and Greg Ruiz
Aquatic Bioinvasion Research & Policy Institute Portland State University, Department of Environmental Science & Management Smithsonian Environmental Research Center, Marine Invasions Laboratory Submitted to the
Washington Department of Fish & Wildlife Citation: Davidson I, Zabin C, Ashton G, Ruiz G (2014) An assessment of the biofouling introductions to the Puget Sound region of Washington State. Report to the Washington Department of Fish & Wildlife and Washington Department of Natural Resources, Olympia, Washington. 111pp.

EXECUTIVE SUMMARY The Puget Sound region has a long history of marine and estuarine species invasions that have contributed to ecological alterations of the region’s ecosystem over centuries of human influence. The patterns of invasion and subsequent effects of those species are initiated by transport vectors that operate throughout the world and transfer biota to Washington. Chief among those vectors is biofouling, which is the accumulation of algae and invertebrates that settle onto submerged surfaces. This report examines the issue of marine and estuarine invasions by biofouling-mediated nonindigenous species (NIS) in Puget Sound. Biofouling species often comprise the largest portion of species richness for NIS inventories highlighting the diversity of organisms that comprise this community and their ability to colonize and survive vector transport. The primary vectors of biofouling organisms are the submerged portions of ships and boats (vessels), but biofouling species can also be conveyed by any maritime infrastructure as well as intentional and unintentional release through aquaculture activities, live bait and other vectors. Biofouling NIS self-dispersal also plays a role in their spread after initial introductions to one part of a coastline. This report consists of four parts: (1) We examined the invertebrate and algal invasion history of the region and estimated the
contribution of the biofouling vector to this history. We found that Washington’s NIS introductions have increased dramatically through time and there are at least 94 NIS recorded in the state, 74 of which occur in Puget Sound. Crustaceans, bivalves, gastropods, bryozoans, annelids, and tunicates are the dominant groups of NIS. Vessel biofouling may be responsible for introducing 58% of all NIS, and its strength (numbers of species attributed to this vector) has increased over time. Prior to 1950, vessel biofouling was considered a possible vector for 37% of initial NIS introductions to Puget Sound. After 1950, biofouling was a sole or possible vector of initial incursion for 64% of newly established NIS. We also conducted standardized searches of the scientific literature to evaluate reported impacts of the NIS that have been recorded as established in Puget Sound. The number of reports examining species’ impacts is quite low; only 28 of the 74 NIS had impact data in the literature. Prominent among the impacts for these 28 species were competition for space and over-growth of native and commercially important species, effects on ecosystem functions (e.g. nutrient cycling), parasite transmission, as well as effects on ecological communities that increase diversity through habitat creation.
(2) Section 2 examined maritime traffic patterns for commercial, recreational and fishing vessels in
Puget Sound, the patterns of vessel maintenance by commercial shippers, the biofouling data for commercial vessels, and a potential approach for identifying risky vessels without biological sampling. Puget Sound is an important hub of vessel activity and our estimates of vessel traffic to the region approaches 50,000 vessels per year comprising 3,200 commercial vessel arrivals (overseas and coastwise), over 26,000 fishing vessel arrivals, and at least 20,000 overseas arrivals of recreational boat arrivals. The recreational data are likely an underestimate of the total number of arrivals each year (in terms of transient boat visits within the state and from neighboring states). Commercial vessel maintenance and operational patterns highlighted differences among ship types

Puget Sound biofouling introductions and vectors
4
that may help identify biofouling risks, especially for outlier vessels within certain types (e.g. especially slow ships within a class or those with excessive lay-ups). However, analyses of our data sets and literature data on vessel biofouling suggested that high levels of variability and the difficulty in identifying clear-cut risk factors is an impediment to simple pre-arrival risk assessment. A basic model, using data from California’s hull husbandry reporting form, duration since dry-docking, and extended lay-up periods (10 days or more) suggests that between 2% and 21% of Puget Sound commercial vessels would trigger an inspection or action depending on 4-year or 400-day thresholds for dry-docking duration, respectively. Overall, the volume of traffic by all vessel types suggests that prudent vector management options should be sought to reduce biofouling introductions and NIS spread within the system.
(3) We assessed biofouling policies worldwide in Section 3 of the report, as well as in-water cleaning technology, and a suggested approach to policy-making for Washington, including potential stakeholder participation. Biofouling policies have been created or are emerging in several parts of the world, including New Zealand, Australia, California, and Hawaii, as well as at the global scale through the International Maritime Organization. The apparent floor and ceiling for potential policies for Washington range between the current status quo (do nothing different) to the most protective approaches adopted for the extraction industry in Western Australia and vessel visitors to the NW Hawaiian Islands. It is likely that any proposal for Washington will fall between these scenarios because the latter, biologically explicit approach is impractical for regular commercial shipping in the US. There are several options for in-water cleaning technology in the US and throughout the world, although few that are effective at cleaning and collecting debris and toxins are commercially available. This is especially true in Puget Sound where a prohibition on in-water cleaning of anti-fouling (toxin-based) paints is a deterrent for development and use of technology in the region.
(4) In the final section, we examined non-vessel vectors of biofouling and their management, as well as
research and monitoring priorities for Puget Sound. Management of non-vessel biofouling vectors varies widely, from little to no knowledge of stochastic movements of maritime infrastructure, to stringent control of aquaculture imports (although gaps exists, e.g. for pathogens) and the well-managed response to the biofouling vector threat posed by Japanese tsunami marine debris. Multi-vector management is preferable to single-species and single-vector management, although practical considerations must also be accounted for and vessel vectors should be considered a priority for reducing NIS translocations in the absence of a multi-vector approach. Vessel biofouling appears to be the largest gap in policy for managing marine NIS in Puget Sound. Finally, monitoring NIS throughout Puget Sound and sampling biofouling vectors are priorities for managing NIS introductions in the region. A lack of standardized longer-term data on NIS in the region and on vectors prevents a better understanding of invasion rates, vector strength, vector management, NIS population status, impacts, and resource allocation for pre-and post- arrival management. Standardized NIS monitoring and vector analyses with sampling provide the pivotal data to underpin science-based vector management policy and a method for evaluating vector management efficacy.

Puget Sound biofouling introductions and vectors
5
GLOSSARY OF TERMS
Biofouling refers to the community of marine organisms that adhere to surfaces, including the surfaces
of vessels. Biofouling species include sessile species that attach directly to surfaces and mobile species that can inhabit a matrix of sessile biofouling
Biofouling vector- mediated introduction refers to NIS that become established as a result of transfer by a biofouling vector.
Bioinvasion or biological invasion refers to the phenomenon of NIS becoming established. For example, marine bioinvasions of Puget Sound refers to the community of NIS that are established in Puget Sound.
In this report, we use the term vessels to refer to ships, barges, boats, and other watercraft (as a group). We also refer to commercial vessels, recreational boats, and fishing vessels when describing different components of the vessel fleet operating in Washington.
Initial introduction refers to the first occurrence of a NIS within a region (e.g. Puget Sound) and
subsequent introduction refers to the cases where an already regionally established NIS is recorded in a new location within that region.
Introduction generally refers to specific nonindigenous species that become established in areas outside of their native range or NIS introduced by a specific vector. Introductions occur after transport and delivery of NIS to a recipient area.
Niche areas refer to the non-hull submerged parts of vessels which are known to be hotspots for biofouling accumulation. Examples of niche areas include rudders, propellers, propeller shafts, gratings, thrusters and other heterogeneous non-hull surfaces of vessels.
NIS or nonindigenous species is a species that has been introduced intentionally or unintentionally to an area outside of its historical native range and includes all stages of development and body parts. This report deals with marine and estuarine NIS established in Puget Sound. NIS are also known as introduced species, non-native species, adventive species and exotic species but we use the term NIS consistently throughout.
Risk in this report refers to the unwanted possibility that biofouling or biofouling NIS will be transferred to Puget Sound and have an opportunity to become established. Thus, high-risk vessels are those vessels that can be identified as carrying or likely to carry biofouling NIS into or within the Puget Sound system.
Species x site records refers to the combination of two pieces of information in invasion history analyses – the NIS (species identity) and the location (e.g. a bay or Puget Sound) in which that NIS has been recorded.
A vector is the transfer mechanism that transports NIS from one location to another. Biofouling vectors include vessels (ship, boats and watercraft), maritime structures, and shipments of live bait and aquaculture species.

Puget Sound biofouling introductions and vectors
6
Contents
EXECUTIVE SUMMARY .................................................................................................................................. 3
GENERAL INTRODUCTION ............................................................................................................................. 8
SECTION 1: Puget Sound’s invasion history with a focus on biofouling species ......................................... 10
METHODS ............................................................................................................................................... 10
Invasion History................................................................................................................................... 10
Impacts of nonindigenous species ...................................................................................................... 12
RESULTS .................................................................................................................................................. 12
Invasion History................................................................................................................................... 12
Impacts of nonindigenous species ...................................................................................................... 17
DISCUSSION ............................................................................................................................................ 22
SECTION 2: Biofouling Vector Traffic Patterns, Maintenance, and Risks ................................................... 24
METHODS ............................................................................................................................................... 24
Commercial shipping traffic ................................................................................................................ 24
Fishing vessel traffic ............................................................................................................................ 25
Recreational boating traffic ................................................................................................................ 25
Hull Husbandry reporting by Commercial vessels arriving to Washington ........................................ 27
Factors affecting commercial vessel biofouling – ABRPI sampling ..................................................... 27
Factors affecting commercial vessel biofouling – literature information ........................................... 28
RESULTS .................................................................................................................................................. 28
Commercial vessel Traffic ................................................................................................................... 28
Fishing Vessel Traffic ........................................................................................................................... 33
Recreational Boat Traffic..................................................................................................................... 38
Hull Husbandry by Commercial vessels arriving to Washington ........................................................ 45
Factors affecting commercial vessel biofouling – ABRPI sampling ..................................................... 50
Factors affecting commercial vessel biofouling – literature information ........................................... 52
DISCUSSION ............................................................................................................................................ 56
SECTION 3: Biofouling Policy and In-Water Cleaning Technology Review ................................................. 58
METHODS ............................................................................................................................................... 58
RESULTS .................................................................................................................................................. 59
Biofouling Policy Review ..................................................................................................................... 59
In-Water Cleaning Review and Capacity in Puget Sound .................................................................... 69
Developing biofouling policy in Washington ...................................................................................... 77
DISCUSSION ............................................................................................................................................ 80
SECTION 4: Non-vessel biofouling risks in Puget Sound ............................................................................. 82

Puget Sound biofouling introductions and vectors
7
METHODS ............................................................................................................................................... 82
RESULTS & DISCUSSION ......................................................................................................................... 82
Non-vessel biofouling vectors ............................................................................................................. 82
Research & Management of non-vessel biofouling vectors ............................................................... 86
Japanese tsunami debris as a biofouling vector ................................................................................. 91
Biofouling research and monitoring ................................................................................................... 94
List of biofouling and NIS sampling programs for Puget Sound ......................................................... 95
REFERENCES ................................................................................................................................................ 98
APPENDICES. ............................................................................................................................................. 110

Puget Sound biofouling introductions and vectors
8
GENERAL INTRODUCTION
The Puget Sound region within the State of Washington is a major population and maritime center in Western North America and the concentration of human activity around the region has extensively altered its marine and estuarine ecosystem. An important aspect of human-driven changes to the region’s ecology involves the transfer, introduction, and subsequent establishment of marine non-indigenous species (NIS). The process of intentional and unintentional NIS introductions (or bioinvasions) is a relatively modern feature of the region’s marine and estuarine ecology that began with European colonization of the Pacific Coast and intensified over time. Earlier human populations of the Pacific Northwest and the distinctive coastal tribes that became established prior to European discovery were largely sedentary or moved in concert with the natural rhythms of biota, following a hunter-gatherer culture, rather than translocating species across biogeographic boundaries (Kruckeberg, 1991). After European rediscovery and eventual colonization, beginning in 1775 with Heceta and Bodega y Quadra’s landing on the Olympic peninsula, a new regime of species over-exploitation and transfers into- and out of- the region began. By the time Captain George Vancouver’s naturalist, Archibald Menzies, surveyed the region’s botany in 1792 to bring live specimens back to England, as well as determine the region’s suitability for English crops (Kruckeberg, 1991), the ships that brought them and prior explorers to Puget Sound likely transferred dozens of NIS on their hulls into the region. Since the time of these explorations, the growth of the world’s population and its globalized connectivity have driven the rate of bioinvasions upwards throughout the world (Hulme, 2009). Puget Sound is one example of the global trend; it hosts major shipping ports that are connected to other ports around the world via vessel arrivals as well as fishing and recreational boat harbors, aquaculture installations, and other hubs of maritime activity that have intentionally and unintentionally introduced and spread NIS to the region over centuries. This has caused changes in the species composition of the ecosystem, some of which have been documented and others that have not. Some NIS detrimentally alter the ecological functioning or economic interests of the system, which provokes action to prevent new incursions and control the effects of existing NIS. The primary focus of this report is on marine NIS considered part of an ecological biofouling community, which are a major component of the marine and estuarine NIS found in many regions of the world, including Puget Sound. The biofouling community, in general, consists of sessile species that adhere to surfaces of solid substrata, as well as associated sedentary and mobile organisms that inhabit the matrix of sessile biofouling. Because NIS biofouling is prevalent on all untreated surfaces people place in the sea, it is a prolific component of the biota that attaches to human transfer mechanisms (vectors). The primary vectors of biofouling species include vessel hulls (e.g. submerged surfaces of ships, boats, watercraft, etc.), but other intentional and unintentional vectors include shellfish aquaculture, aquarium releases, and discarded live bait packaging materials like seaweeds. Vessel hulls are the most prevalent vectors of biofouling species because of their number, frequency of movement, and constant contact with the environment, which provides species with an opportunity to release from the vector. This is not the case for other vectors that are concealed from the environment for part or all of a transfer (e.g. ballast water). In addition, vector management for biofouling has not progressed as far as for some other vectors, notably ballast water. This is a cause of concern for managers because the potential gains made through regional and international management of ballast water may be undermined by continued biofouling-mediated introductions over time (i.e. introductions that result from a vector that transfers a biofouling NIS).

Puget Sound biofouling introductions and vectors
9
The goal of this study was to assess the NIS biofouling threats to the Puget Sound region. Puget Sound was treated broadly to include all of the coastal waters of Washington State between Cape Flattery and the border with British Columbia. Our approach was to synthesize information from the primary literature, gray literature, databases, and surveys as follows by report sections: Section 1: “Puget Sound’s marine and estuarine NIS history with a focus on the biofouling community” provides a review of the region’s marine invasion history and impact status of biofouling-mediated species; Section 2: "Biofouling vector traffic patterns, maintenance, and risks" examines vessel traffic patterns, factors that contribute to vector risk (the risk of transferring NIS to the region), and ways to identify high-risk vessels for NIS biofouling transfers into and within Puget Sound; Section 3: "Biofouling policy and in-water cleaning technology review" includes a review of management policies for vessel biofouling worldwide, an evaluation of in-water cleaning technology, and an outline of potential NIS biofouling management policymaking options for the Puget Sound region; and Section 4: "Non-vessel biofouling risks in Puget Sound" characterizes non-vessel NIS biofouling vectors in Puget Sound and strategies for their management, and recommend future NIS biofouling research and monitoring.

Puget Sound biofouling introductions and vectors
10
SECTION 1: Puget Sound’s marine and estuarine non-indigenous species (NIS) history with a
focus on the biofouling community
This first component of our assessment provides an overview of the recorded marine and estuarine NIS introductions to the Puget Sound region throughout history, with a focus on the role of vessel biofouling as a vector of NIS. We included Washington’s Pacific coastline as part of this assessment to provide a comparison between Puget Sound and the rest of the state’s marine waters, which could inform statewide versus Puget Sound-only evaluations and potential programs. Assessments of the taxonomic, spatial, temporal, and vector patterns of established NIS offer an invaluable baseline of information on the invasion history of bays, coastlines, and bioregions. Without such assessments, it can be difficult to understand marine invasion patterns and the processes that contribute to creating those patterns. This need is especially acute if management options are being considered to curtail a regional NIS introduction rate or directly affect the trajectory (spread) of any harmful NIS.
METHODS
Invasion history We analyzed the invasion history of Puget Sound and the Pacific Coast of Washington using a relevant portion of the National Exotic Marine and Estuarine Species Information System (Fofonoff et al., 2013). NEMESIS has been compiled over the past decade at the Smithsonian Environmental Research Center using the Marine Invasions Laboratory’s own sampling records and exhaustive searches of primary and gray literature. The database contains information on the identity, locations, population status (whether a NIS is considered to have an established population or not), date of first detection, data source(s), salinity tolerance, and life-history information for NIS throughout the coastal waters of the United States. While there were many sources of information that contributed to Puget Sound data in the database, the NIS surveys of Carlton (1979) and Cohen et al. (2001) were the main baseline studies for the region. NEMESIS also ascribes vectors that were considered responsible for mediating initial incursions of NIS into bays where they later became established. Importantly, vectors are assigned to NIS at the level of each detection location (usually bay or estuary) in North America (per invasion event, in a species-by-bay metric) because the same NIS may be transferred by a different set of vectors in different regions, reflecting geographic differences in the operation of vectors. Vectors are assigned to NIS in NEMESIS based on their life-history characteristics, the timing of the introduction, and the history of vector activity within bays and estuaries. This approach is a broadly accepted one that underpins several important analyses of invasion histories from different regions around the world (Carlton 1979; Cohen and Carlton 1995; Ruiz et al., 2000; Hewitt et al, 2004; Ruiz et al., 2011). NIS are either assigned to one vector (sole-vector species) or more than one vector (multi-vector species) based on their ecology and the timing and location of their detection. A single vector is assigned to NIS in circumstances where it is highly likely that just one transfer mechanism played a role in its arrival to a bay. Multi-vector NIS are those for which two or more possible vectors may have played a role in the initial arrival of NIS and no current evidence can separate (or remove as possibilities) these potential vectors. The list of vectors ascribed in the NEMESIS NIS dataset as applied to Washington State included:
1) Vessel biofouling – organisms that attach to the submerged portions of vessels can be unintentionally introduced (this is a major source of biofouling NIS)

Puget Sound biofouling introductions and vectors
11
2) Aquaculture - organisms introduced on purpose for beneficial aquaculture purposes (‘shellfish intentional’ vector) can have unintentional impacts or spread beyond their intended release range, or can unintentionally introduce associated non-aquaculture organisms (‘shellfish accidental’ vector).
3) Ballast water – organisms can be introduced unintentionally via ballast water from ships. Ballast water is not considered a biofouling vector, but the larval stages of biofouling species are included in this vector.
4) Dry ballast – this historical unintentional vector operated when species associated with sand and rocks used as ballast for ships were discarded in ports or on the shoreline. The dry ballast was kept in holds that kept the material and associated species in wet enough conditions for species to survive. This vector’s biota includes mobile and sessile species that are part of the biofouling community.
5) Live bait – this vector includes species that are introduced for use as bait or species associated with the packaging of bait (e.g. algae and their epibiota). The intentional bait shipments are not considered biofouling vectors, but those species and the unintentional species can be part of the biofouling community (e.g. polychaete worms, seaweed, bryozoans, amphipods).
6) Aquatic plant shipments – these are species introduced intentionally for shallow water vegetation or unintentional introductions of species in the shipment of those plants. The plants may not be part of the biofouling community, but the unintentional ‘hitchhiking’ species can be (e.g. hydroids).
7) Cargo – these are aquatic species introduced (usually unintentionally) by association with cargo of ships. These may include biofouling species associated with cargo materials that fall into the sea.
8) Biocontrol – these are intentionally introduced species imported to act as control agents of other (pest) species. These are usually mobile herbivores or predators, which may be components of the biofouling community.
9) Natural dispersal – this type of transfer is included to account for the possibility that a species was introduced to WA waters via self-dispersal from a source location in nearby waters. An example would be if a species was introduced via ballast water to British Columbia but then spread by natural means to WA. This is not a solely biofouling transfer mechanism, but many biofouling species (especially those with long larval durations) are included in it.
We downloaded records from NEMESIS relevant to Puget Sound into a project database. For this project, Puget Sound was broadly defined (as above) as Washington’s coasts of (1) the Strait of Juan de Fuca, (2) ‘Inner’ Puget Sound, (3) the northern Washington Coast (to the border with Canada), and (4) the San Juan Islands (see right panel). This entire region includes Washington’s coastline east of Cape Flattery. We also included some invasion history analyses of Washington’s Pacific coastline south of Cape Flattery to the north jetty of the Columbia River (i.e. excluding the Columbia River). We made amendments to the NEMESIS format of spatial designations by converting watershed areas (NEMESIS uses NOAA’s drainage areas) into named bays or estuaries and analyzed spatial patterns for Puget Sound as a whole, as well as the four sub-regions of Puget Sound listed above. We analyzed the taxonomic, temporal and spatial trends of marine and estuarine invasions. We used the vector designations within NEMESIS to

Puget Sound biofouling introductions and vectors
12
differentiate between species transferred by biofouling and non-biofouling mediated species. This included evaluations of vectors of initial introductions (first records of NIS) and whether biofouling was a sole vector for that incursion, or one of several vector possibilities for that incursion. We also looked at subsequent records of spread and the vectors associated with those range expansions. This provided a proportional measure of the role of biofouling in creating Puget Sound’s invasion history.
Impacts of nonindigenous species We conducted a review of the scientific literature of reported impacts of NIS considered established in Puget Sound. The protocol for this review is one we have used in previous invasion projects (e.g. Davidson et al., 2012). It involves a standardized stepwise search using the BIOSIS academic search engine. Briefly, the protocol is as follows: 1. We used the following search terms in BIOSIS to provide the ‘first cut’ of impact literature:
Topic=(Adventive OR Alien* OR Bioinvasi* OR Biosecur* OR Exotic* OR Foreign OR Introduc* OR Incursion* OR Invad* OR Invasi* OR Nonendemic* OR Nonendemic* OR Non indigenous OR Nonindigenous OR Nonnative* OR Nuisance* OR Pest* OR Pest) AND Topic=(species name in quotes, e.g. "Botrylloides violaceus") AND Timespan=1926-2011 This timespan corresponded to the earliest records in BIOSIS to the last full year of data at the outset of this project. Searches for species synonyms were also conducted and the number of papers returned for each species was recorded.
2. The titles of papers were examined for relevance to impacts and all irrelevant papers were removed.
3. For the remaining studies that were retained, abstracts were examined for relevance and those deemed to contain impacts data were downloaded or paper copies were obtained through libraries.
4. Finally, data for papers that were accessible to us with impact information were entered into a formatted spreadsheet. Data included reference information, the NIS name, the name of the impacted entity (species, habitat, process involved), the type of impact, and the way impacts were measured (field studies, experiments, monitoring data etc).
These data were used to summarize existing reports of impacts for NIS known to be established in the Puget Sound region, although for each species impacts were reported from all over the world and not just for Puget Sound. We also summarized the extent to which impacts of species have been recorded among taxa (e.g. the extent to which data are absent for species).
RESULTS
Invasion history There were 94 established algae and invertebrate NIS recorded for Puget Sound and Washington’s Pacific Coast (Appendix 1), represented by 231 species-by-bay records (i.e. the 94 species are distributed among bays such that there are 231 locational introductions by these species). An additional 54 species-by-bay records for the state were not considered further for this interim report because their population

Puget Sound biofouling introductions and vectors
13
status was categorized as failed (34), unknown (18), extinct (1), or possibly eradicated (1). The broader Puget Sound region (hereafter Puget Sound) had 74 distinct NIS with 155 species-by-bay records and the WA Pacific Coast had 59 NIS with 76 species-by-bay records. Willapa Bay and Grays Harbor were important sites for Pacific Coast NIS. Within broader Puget Sound, there were 12 NIS recorded for the Strait of Juan de Fuca, 57 for ‘inner’ Puget Sound, 35 for the Northern Coast, and 20 for the San Juan Islands. The community of nonindigenous invertebrates and algae in Puget Sound (and the WA Pacific Coast) is diverse with representatives from a broad spectrum of marine taxonomic groups (Fig. 1.1). Crustaceans and molluscs are the dominant groups of established marine NIS in Washington, with 25 and 24 NIS respectively (52% of the NIS richness). Eleven of the 16 nonindigenous crustaceans in Puget Sound were first documented after 1990, but the amphipods Monocorophium acherusicum and M. insidiosum were recorded in 1915, the earliest detection date for that group. Introduced crustaceans in Puget Sound and the WA Pacific Coast include 11 amphipods, five copepods, four isopods, and one each for cumaceans, shrimp, tanaids, ostracods, and barnacles (Appendix 1). Among the 12 bivalve NIS in the state are long-established species associated with intentional importations for shellfish aquaculture, including Mya arenaria, Crassostrea virginica and C. gigas first recorded in 1884, 1895, and 1902, respectively.
Figure 1.1. The taxonomic breakdown of marine and estuarine invasions in Puget Sound (black bars) and Washington’s Pacific Coast (gray bars). There were 74 established NIS in Puget Sound and 59 NIS on the Pacific Coast of WA.
There are seven introduced tunicates considered established in Puget Sound, not including Ciona intestinalis whose population status is not yet established, although isolated individuals of the species have been recorded (Puget Sound Action Team, 2007). Two of the established tunicates, Diplosoma listerianum, Botryllus schlosseri and Botrylloides violaceus, were recorded in Puget Sound prior to (or around) 1980, but the other five have only been recorded as established since 1998 (Ciona savignyi, Molgula manhattensis, Styela clava and Didemnum vexillum). All of theseNIS occur at several locations throughout Puget Sound and several were previously subjected to management efforts to control their distributions (Puget Sound Action Team, 2007; Pleus et al., 2008).

Puget Sound biofouling introductions and vectors
14
The earliest marine invasion recorded for the state (in NEMESIS) is the Atlantic oyster, Crassostrea virginica, an intentional importation to Willapa Bay in 1874. This species is no longer considered established in Willapa Bay, having died out in the 1970s (Carlton 1979), but more-than-century-old populations still persist in Puget Sound (the Strait of Georgia coast of WA). There are only three NIS that persist today in Puget Sound that were recorded prior to 1910 (the aquaculture bivalves noted above). Over time, the number of newly recorded NIS has grown dramatically (Fig. 1.2). In the most recent 20-year period, there were 35 and 32 NIS newly recorded in Puget Sound and on the WA Pacific Coast, respectively. This is at least three times as many records of ‘new’ introductions for any 20-year period prior to 1990 (Fig. 1.2).
Figure 1.2. Temporal trends of NIS first records (triangles) and accumulation (squares) in Puget Sound and WA Pacific Coast. The power functions for accumulated NIS on each coast are shown next to the curves (Puget Sound -- black, solid line; Pacific Coast - gray, dashed line). N=74 for Puget Sound and n=59 for the Pacific Coast. For some time periods, the number of new detections in Puget Sound matched that of the outer Pacific Coast, and those points are obscured in the plot.
Vector associations Vessel biofouling is likely responsible for introducing 58% of the established marine invertebrate and algae NIS in Puget Sound (Fig. 1.3). Among the sole-vector species, vessel biofouling is considered responsible for introducing six of 23 NIS. For comparison, the other 17 sole-vector NIS were linked to oyster farming (intentional and accidental). A majority of all NIS (69%) introduced to Puget Sound are considered multi-vector NIS – having more than one possible vector of initial introduction – making it impossible to compare the absolute strength of different vectors. For these 51 multi-vector NIS, vessel biofouling is associated with 37 (72%) of them. Vector associations varied widely among taxonomic groups (Fig. 1.3). Vessel biofouling was an important contributor to initial incursions of algae, annelids, crustaceans, bryozoans and tunicates. It was considered a sole vector for some tunicates and bryozoans only (not for species in other taxonomic

Puget Sound biofouling introductions and vectors
15
groups). Vessel biofouling played a minor role for initial incursions of molluscs (bivalves and gastropods). Among the 43% of NIS that were not associated with biofouling as a possible vector, accidental and intentional introductions associated with shellfish transfers were a dominant vector (27 of 32 species). Furthermore, for the 37 multi-vector NIS considered to include vessel biofouling among possible vectors, shellfish aquaculture was included as a vector with biofouling for 32 of those initial introductions to Puget Sound.
Figure 1.3. Vessel biofouling (VB) associations with initial invasions of NIS into Puget Sound. Biofouling was associated with 57% of initial introductions of 74 NIS in Puget Sound, including as the sole vector (black bars) and as a possible vector for multi-vector species (gray bars; VB multi-vector) among a variety of taxa.
The role of biofouling as a vector of initial NIS introductions in Puget Sound has increased over time (Fig. 1.4) and it appears that vessel biofouling is one of the drivers of the increasing invasion rate in the region. Prior to 1950, vessel biofouling was considered a possible vector for 37% of initial NIS introductions to Puget Sound (n=19 NIS). After 1950, 64% of newly established NIS included biofouling as a sole or possible vector of initial incursion.
Puget Sound biofouling introductions and vectors
16
Figure 1.4. The role of biofouling as a vector of initial introduction of NIS to Puget Sound over time (n=74 NIS).
In addition to initial incursions of NIS, the number of new subsequent records of introductions (spread or additional invasions of different bays by NIS already present in Puget Sound) has grown dramatically over time (Fig. 1.5). More than 45% of 77 records of spread throughout Puget Sound have occurred since 1990. The vessel biofouling vector has also increased in importance for these subsequent records of NIS spread throughout Puget Sound.
Figure 1.5. Vector associations with subsequent introductions (spread) of NIS in Puget Sound through time. N=77 species-by-bay records. A further four records were not included in this plot because of uncertainty about the detection date for the species x location records.
The NIS with the most species-by-bay records in the State are three bivalves; Venerupis philippinarum, Nuttalia obscurata, and Crassostrea gigas. V. philippinarum is at 11 different sites, including bays on the Pacific Coast, Strait of Juan de Fuca, Inner Puget Sound, the northern WA coast ad the San Juan Islands (all five sub-regions). The bryozoan Schioporella japonica and the algae Sargassum muticum were the

Puget Sound biofouling introductions and vectors
17
next most widespread species at nine and eight bays, respectively. By contrast, 44 of the state’s 94 NIS are reported from one site (bay) in this data set.
Impacts of nonindigenous species Of the 74 NIS established in Puget Sound, we found impact literature on 28 and the remaining 46 were found to have no data on impacts (approximately 75% of the total; Table 1.1). The numbers of papers found in standardized BIOSIS searches varies substantially among species, and the number of papers retained because they report actual data on impacts is very low. Notable NIS with impacts data include the alga Sargassum muticum, the bivalves Crassostrea gigas and Mytilus galloprovincialis, and the gastropod Crepidula fornicata. Overall, there were 138 studies that reported impact data for the 28 NIS whose impacts had been studied. Thirteen studies were conducted in -- or included data from -- Washington on several species including C. gigas, Batillaria attramentaria, Venerupis philippinarum, Orthione griffenis, Sargassum muticum, Aedes togoi and Clymenella torquata. The impacts of the alga S. muticum, a biofouling-associated NIS, are the most numerous in our data set, with 132 impacts recorded from 30 different papers (studies done at sites worldwide). Not all of these impacts are considered negative for the impacted entity, however, because the seaweed can provide habitat and food source for native species (including for native snails in Puget Sound). The negative impacts of this NIS include reductions in understory algae because of reduced light intensity under S. muticum canopies and reductions in native faunal diversity and food quality for grazers. Impacts of B. attramentaria included decreases in eelgrass cover (in Padilla Bay, WA) and reduced abundance and growth of the native snail Cerithidea californica elsewhere on the West Coast. The recorded impacts of the biofouling-associated crustacean Caprella mutica are surprisingly limited when we consider the spatial extent over which it has invaded, but the one study with documented impacts recorded displacement of native species. Among the economic impacts reported were (a) the closure of oyster culture grounds in Samish Bay, WA because of an infestation of the polychaete worm Clymenella torquata and (b) the costs to industry from fouling by the hydroid Cordylophora caspia. These results for impact studies serve to highlight a lack of detailed information on NIS impacts for most species, the difficulty of comparing the magnitude of impacts among NIS, and the challenges of predicting the potential consequences of new invasions. Table 1.1. Literature-based impact information on NIS established in Puget Sound. The table shows the numbers of papers returned from standardized searches (see Methods) and papers from which impact data were available. A brief summary of recorded impacts is also provided.
Species Number of papers found using search terms
Papers with impact data
Impact summary
Caulacanthus ustulatus
8 0 n/a
Ceramium kondoi 1 0 n/a

Puget Sound biofouling introductions and vectors
18
Species Number of papers found using search terms
Papers with impact data
Impact summary
Gelidium vagum 2 0 n/a
Lomentaria hakodatensis
5 0 n/a
Sargassum muticum 132 30 Positive, neutral, and negative effects on biodiversity and abundance of other algae and grazers. Two studies conducted in Puget Sound Region
Limnodriloides monothecus
1 0 n/a
Tubificoides diazi 0 0 n/a
Alitta succinea 17 0 n/a
Clymenella torquata 4 0 n/a
Hobsonia florida 3 0 n/a
Pseudopolydora kempi 4 0 n/a
Pseudopolydora paucibranchiata
7 1 This is a dominant NIS in southern California estuaries but appears to have a neutral or positive effect on native species richness
Streblospio benedicti 9 1 Persistence in mud flats promotes invader dominance of the habitat.
Aedes togoi 137 5 Vector of human and animal disease, including Brugian filariasis, Japanese encephalitis. Note- direct impacts on native communities not yet reported or quantified. Also a predator of native species' larvae.
Chilacis typhae 2 0 n/a
Diadumene lineata 5 1 Predation on oyster larvae under experimental conditions
Nematostella vectensis
20 0 n/a

Puget Sound biofouling introductions and vectors
19
Species Number of papers found using search terms
Papers with impact data
Impact summary
Cladonema radiatum 0 0 n/a
Cordylophora caspia 17 0 n/a
Ampithoe valida 3 0 n/a
Caprella mutica 42 1 Displacement of competitors
Eochelidium sp. A 0 0 n/a
Grandidierella japonica
8 0 n/a
Incisocalliope derzhavini
0 0 n/a
Jassa marmorata 7 0 n/a
Melita nitida 9 0 n/a
Monocorophium acherusicum
5 0 n/a
Monocorophium insidiosum
5 0 n/a
Harpacticella paradoxa
3 0 n/a
Mytilicola orientalis 10 5 Infestation of commercially important bivalves leading to loss of fitness and yield
Nippoleucon hinumensis
1 0 n/a
Caecidotea racovitzai 2 0 n/a
Limnoria tripunctata 10 0 n/a
Orthione griffenis 6 2 Infestation and reduction of native mud shrimp populations
Sinelobus cf. stanfordi 4 0 n/a

Puget Sound biofouling introductions and vectors
20
Species Number of papers found using search terms
Papers with impact data
Impact summary
Bowerbankia gracilis 12 0 n/a
Bugula sp. 1 0 0 n/a
Bugula sp. 2 0 0 n/a
Bugula stolonifera 10 0 n/a
Cryptosula pallasiana 5 0 n/a
Schizoporella japonica 1 0 n/a
Watersipora subtorquata
25 1 Neutral or facilitating effect on native benthic organisms through habitat engineering
Barentsia benedeni 0 0 n/a
Crassostrea gigas 415 12 Impacts on native species communities and populations (reducing numbers), parasite dynamics, and biogeochemistry (organic matter cycling)
Crassostrea virginica 265 0 n/a
Musculista senhousia 56 8 Positive and neutral effects on native populations and nutrient cycling
Mya arenaria 104 0 n/a
Mytilus galloprovincialis
278 17 Positive, neutral and negative effects on species populations, mainly other bivalves (positive effect on community abundance through habitat engineering)
Neotrapezium liratum 0 0 n/a
Nuttallia obscurata 18 0 n/a
Venerupis philippinarum
150 8 Neutral and negative effects on species populations, positive effect on processes such as filtration and nutrient flux

Puget Sound biofouling introductions and vectors
21
Species Number of papers found using search terms
Papers with impact data
Impact summary
Batillaria attramentaria
14 4 Negative effect on eelgrass and native snail populations; positive and neutral effects community richness
Cecina manchurica 0 0 n/a
Crepidula convexa 5 0 n/a
Crepidula fornicata 74 13 Negative effects on native species; positive effects on ecosystem processes
Crepidula plana 1 0 n/a
Haminoea japonica 4 1 Effect on human health (swimmers itch)
Ilyanassa obsoleta 24 1 Reduction of native species range within a bay
Myosotella myosotis 3 1 Neutral effect on native species growth
Nassarius fraterculus 2 0 n/a
Potamopyrgus antipodarum
136 2 Neutral or positive effect on native species feeding and foraging
Pteropurpura inornata 1 0 n/a
Urosalpinx cinerea 26 0 n/a
Cercaria batillariae 3 1 Parasitism of west coast snails, with the possible replacement of native parasites by the invader
Pseudostylochus ostreophagus
2 1 The introduced flatworm is a predator of oysters, causing "extremely heavy losses" on native oyster Ostrea lurida spat, and attacks Crassostea virginica and C. gigas.
Trochammina hadai 4 3 The introduced foraminifera invaded Puget Sound in 1971 and San Francisco Bay in the 1980s and has come to dominate benthic protist samples since then. It represents a major shift in composition between fossil and modern communities of SF Bay.

Puget Sound biofouling introductions and vectors
22
Species Number of papers found using search terms
Papers with impact data
Impact summary
Cliona sp. 4 2 The introduced sponge bores into coral and shells of snails, reducing snail fitness (including defense against predators and reallocation of snail energy to combat sponge effects).
Botrylloides violaceus 46 4 Two main effects documented: (1) a pest of aquaculture by growing on culture bivalves and gear and (2) a dominant competitor in benthic systems, contributing to shifts in invader dominance in certain locations.
Botryllus schlosseri 58 2 Two main effects documented: (1) a pest of aquaculture by growing on culture bivalves and gear and (2) a dominant competitor in benthic systems, contributing to shifts in invader dominance in certain locations
Ciona savignyi 16 0 n/a
Didemnum vexillum 63 4 The main effects of this invader are spatial dominance, at the km scale in Georges Bank, and at local scales associated with aquaculture, sea grass, and artificial and natural solid substrata. It also impacts mobility in scallops.
Diplosoma listerianum 31 0 n/a
Molgula manhattensis 19 1 Competitive dominance of space that precludes native species colonization
Styela clava 60 6 Impacts for this species are mostly recorded on aquaculture farms, mainly in Eastern Canada; it was also reported to have negligible impact of soft sediment communities in Australia.
DISCUSSION Puget Sound has a diverse community of at least 74 established NIS with crustaceans and molluscs among the dominant taxa. This places Puget Sound among the more highly invaded West Coast estuaries, albeit with significantly fewer NIS than San Francisco Bay (Ruiz & Hewitt, 2009). A list of these NIS and their vector associations is provided in Appendix 1. NIS have arrived predominantly from the NW Pacific and Atlantic Oceans, although many have been recorded elsewhere on the West Coast prior to being recorded in Puget Sound (Cohen et al., 2001; Ruiz et al., 2011). It is important to note, however, that these data are a lower bound on the true numbers of NIS in Puget Sound. We cannot estimate what proportion of the total NIS present in the region are represented by the 74 NIS on this
Puget Sound biofouling introductions and vectors
23
regional list. There has been a lack of repeated consistent monitoring for NIS in the region at both the macro-species and micro-organism level. These analyses are conservative and based on uneven and non-standardized search effort for NIS in Puget Sound. The predominance of molluscs in Puget Sound’s (and Washington’s) invasion history results from a strong historical role of shellfish aquaculture in the state. The earliest recorded introductions in Puget Sound stem from intentional and accidental releases of NIS for culture and 18 out of 20 molluscs can be associated with shellfish farming vectors (as sole or multi-vector NIS). However, vessel biofouling has also played an important role in creating the invasion history patterns of the Sound and may be a leading source of modern introductions (since 1990). Vessel biofouling was associated with 58% of initial incursions of NIS in Puget Sound, but other vectors were also possible for a majority of these introductions (multi-vector species). There is a strong overlap between biofouling and the shellfish aquaculture vector; 62% of 51 multi-vector NIS in Puget Sound included both vectors. This inhibits our ability to separate or rank strength across vectors for initial introductions. Since 1990, vessel biofouling is associated as a sole or possible vector with 68% of new introductions of NIS. As in California (Davidson et al., 2012), records of new marine invasions in Puget Sound have increased substantially over time (Fig. 1.2). Just under half (47%) of all established NIS in Puget Sound were first recorded after 1990. Despite the potential bias of increased monitoring and other factors (Ruiz et al., 2000), the relatively recent incursions of non-cryptic NIS suggests a real increase in the invasion rate in the region. There has also been an uptick in new records of expansions for NIS (spread of already established species) in recent years (Fig. 1.5). Vessel biofouling is a particular concern for secondary spread because a vector ratchet effect can occur whereby a sole vector (e.g. international shipping) can bring a NIS into the system initially, but other vectors (e.g. recreational and fishing vessels) interact with the species and provide it with many new routes and destinations for transfer. There is a generally acknowledged lack of information on impacts of marine NIS, which is an important gap in risk analyses for management. For the 74 NIS in Puget Sound, we found very few species with multiple studies of their ecological or economic effects on recipient systems. Nonetheless, there are examples of documented impacts for several NIS on our list, including studies conducted within Washington. Some of the notable NIS with records of impacts are associated with vessel biofouling vectors, including the alga Sargassum muticum, the mussel Mytilus galloprovincialis, and the tunicate Styela clava. Not all recorded impacts for NIS in Puget Sound are negative, but there is clear potential for NIS to negatively interact with native species populations, ecosystem processes and economic interests in the region (particularly aquaculture). Overall, the data suggest that the biofouling community of NIS has been an important contributor to Puget Sound’s overall invasion history and there appears to be an emergence of vessel biofouling as the strongest vector of NIS in recent years. This is an important consideration because this vector is largely unmanaged in the region at present (Section 3 below) and failure to manage this and other biofouling vectors may undercut management of other NIS vectors. For example, ballast water management in the region is overseen by the Washington Department of Fish and Wildlife (WDFW) and federal partners and if new biofouling-mediated introductions continue in the region, including many NIS that can be transported via ballast and biofouling, then the overall goal of reducing the NIS invasion rate will be undermined.

Puget Sound biofouling introductions and vectors
24
SECTION 2: Vessel biofouling vector traffic patterns, maintenance, and risks
The factors that affect biofouling accumulation and transfers on vessels are numerous and interactive. Two distinct processes - (a) biofouling colonization in space and time and (b) ‘behavior’ of large fleets of vessels - are complex in their own right. When superimposed on each other, these complexities multiply and render risk assessment even more challenging (Inglis et al., 2010). Nonetheless, assessments of vessel movement and maintenance patterns are integral to determine the magnitude of arrivals to a region, the source regions for potential introductions, and management steps that are taken by vessel owners and operators to prevent biofouling transfers. The goal of this section was to perform an analysis of Puget Sound vessel traffic patterns and maintenance to develop an understanding of vector characteristics from a range of data sets that can inform risk analyses and vector management. For this analysis, risk was defined as risk of transfer of viable NIS organisms (i.e. the vector risk of transferring NIS plants or animals on the submerged surfaces of vessels to or within Puget Sound). The specific aims of this component of the report were to (1) provide an analysis of commercial vessel traffic patterns to Puget Sound, (2) assess fishing vessel traffic patterns in Washington State, (3) evaluate recreational vessel traffic in the region, (4) evaluate hull husbandry practices of commercial vessels in Puget Sound, and (5) compare factors that contribute to vessel biofouling accumulation and transfer. Throughout each data section, we provide results and discussion together for ease of interpretation. We also provide an overall discussion that focuses mainly on how these different data streams can be used to develop a risk matrix that may be useful for identifying relatively high risk vessels (i.e. assess risk of NIS transfer without visual assessments of biofouling on submerged surfaces).
METHODS We conducted a series of analyses of vessel traffic, vessel maintenance practices, and risk in relation to Puget Sound biofouling introductions. We assessed traffic patterns for three classes of vessels; commercial, fishing and recreational vessels. Our hull husbandry analysis was performed on a subset of commercial vessels that have visited Puget Sound and also California; the data source was the California State Lands Commission hull husbandry reporting forms. Reviews of literature and our research group’s data sets informed the risk factor analysis. Finally, we developed a rationale for a straightforward risk matrix that focuses on age of antifouling coating and lay-up durations as key risk factors that may prove useful for identifying biofouling invasion threats.
Commercial shipping traffic Records of commercial vessel arrivals to ports in Puget Sound during 2008-2011 were extracted from the National Ballast Information Clearinghouse (NBIC, invasions.si.edu/nbic). Data from NBIC reporting included the date of arrival, a vessel identifier (IMO#), vessel type, last port of call (LPOC), next port of call (NPOC) and the source and volume of any ballast water discharged in Puget Sound. Data were used to assess the spatial and temporal pattern of annual arrivals to Puget Sound. Ports were designated as overseas, coastal (including BC, Canada) or within Washington state (WA) to assess the relative importance of these voyage types among vessel arrivals to the Sound. The contribution of different vessel types to arrivals from coastal and overseas ports was compared. We also included a very brief analysis of ballast water patterns in Puget Sound to provide some context for comparing ballast and biofouling vectors from commercial shipping.

Puget Sound biofouling introductions and vectors
25
Fishing vessel traffic A four-year data set of fishing vessel landings in Washington State was used to analyze traffic patterns of the commercial fishing fleet. The data were provided by the Pacific Fisheries Information Network (PacFIN) and were inclusive of the years 2005 to 2008. The data were compiled from fish tickets, which are the required documentation from each vessel arrival to report the type and number (or weight) of fish landed after every arrival. Therefore, each entry in the data set represents a vessel arrival that landed fish; it should be noted that additional arrivals by vessels when they did not land fish would not be captured in these data, so the complete movements of vessels are not available from this data set. Nonetheless, this is the most complete data set of maritime fishing vessel travel history for the state and it provides a conservative (or minimum) estimate of transits and connectivity among bays. Each entry in the data set included the location, date, and an anonymous vessel identifier for each arrival. The anonymous identifier was consistent across locations and times such that vessel flux -arrivals among different ports by the same vessel - could be evaluated (e.g. Vessel 1 that arrived in Seattle in 2005 was the same Vessel 1 that arrived in Friday Harbor in 2008). There was an exception to this vessel identifier code: PacFIN uses one identifier for certain arrivals, termed ‘zzz’ vessels, which result in many different boats being assigned the same vessel identifier. The code-numbers in this data set assigned to ‘zzz’ vessel arrivals were not included in analyses beyond the initial summary statistics of statewide spatial and temporal arrival trends because they could not be isolated down to individual vessels. These ‘zzz’ arrivals accounted for 23% of the total arrivals in the data set. Our analyses of these data focused on characterizing the spatial and temporal patterns of fishing vessel arrivals across the state. First, we examined the statewide distribution of arrivals per port across the four year time period. Next, we evaluated the temporal (monthly) pattern of arrivals to ports among four regions of the state: (1) Pacific coastline, south of Cape Flattery to the north jetty of the Columbia River (i.e. excluding the Columbia River), (2) the Strait of Juan de Fuca, (3) Inner Puget Sound, and (4) the northern coastline including the San Juan Islands. Then, we separated the vessels that reported more than one location of arrival (transient boats) from those that reported only one location of arrival for the entire four years (solely resident boats). The solely resident boats do not carry a vector risk, at least in the context of this data set, because they have not reported a possibility of transferring biota from one harbor to another. The transient boats, however, had the potential to deliver organisms among different ports. We examined the numbers of ports visited by transient vessels, the proportion of sole- and transient- boats per harbor, and the transit history of the most transient boat in the data set (the vessel that visited the most harbors).
Recreational boating traffic Recreational vessels are increasingly recognized as a potent vector for the transfer of species between ports. Large ocean-going yachts can move species across ocean basins, but most recreational boat travel is limited in range and thus is likely to play a stronger role in the subsequent (secondary) spread of NIS along coasts or within regions than between regions. Since recreational vessels generally do not carry ballast water, species spread by these boats are most likely to be from biofouling communities. Understanding travel patterns of recreational boats – particularly the degree to which ports are connected by boating – is key to assessing the risk posed by this vector. Recreational boat traffic differs from that of commercial vessels in several ways. First, the total number of recreational vessels in most locations is greater than the number of commercial vessels. Small-boat traffic patterns are more diffuse and cover a finer spatial scale in a given region, with boaters traveling between many locations, including many small harbors and bays to which large commercial vessels do not go. In contrast to the

Puget Sound biofouling introductions and vectors
26
regular year-round shipping schedules followed by commercial vessels in most locations, including the state of Washington, recreational boat traffic is highly seasonal. Commercial vessels report information on their arrivals into US ports, submit data on travel history, and communicate on their ballast water and (in some cases) biofouling management to various agencies. Data on commercial vessels can be obtained from international ships registries like Lloyd’s Registry, the federal National Ballast Water Clearinghouse, and from entities regulating commercial shipping at the state level. Recreational vessels have few such reporting requirements, making it more challenging to quantify travel patterns. The United States Customs and Border Patrol (CBP) collects limited data on foreign vessels entering the United States, but no comparable travel data are collected between states or within regions. Individual marinas may keep data on visiting boaters, in connection with collecting berth or moorage fees, but this varies widely among marinas and there is often little or no record keeping. In previous work, we have combined data obtained from CBP, individual marinas and individual boaters via surveys to carry out initial assessments of small-vessel connectivity within regions. These data, coupled with surveys of recreational boat hulls, have helped to evaluate the risk posed by the recreational boat vector. For this report, we collected travel data using CBP and marina or boater questionnaires and gathered some questionnaire-derived maintenance practice data for Puget Sound boaters. These traffic and maintenance records provide an initial characterization of travel and hull husbandry patterns, which can be key elements for identifying risk and policy steps for reducing the spread of NIS. Recreational boat foreign arrivals to Washington State: Boats entering the US must file paperwork with CBP. Data collected include homeport, date of entry, port of entry, last port of call, and some vessel details, such as type and length. Boat type and length may affect biofouling transfers by indicating vessel speed (e.g. slower moving yachts versus power boats) and size of the submerged area of vessels available for colonization by biofouling organisms. We made a request through the Freedom of Information Act to CBP for all arrivals to the Puget Sound region for the period June 2011 to July 2012. From prior interactions with data requests of this nature, it is likely that records after this time may be incomplete or as yet unavailable, so we requested a full year of data up to mid-2012. We asked for date of arrival, port of arrival, location of arrival (marina or dock location), port origin, last port of call, vessel type, and vessel length for the Port Angeles office, which is the CBP handling office location for the western Puget Sound region (Neah Bay to Port Ludlow) and the Blaine Area Port which covers the remainder of the Puget Sound Region (Strait of Juan de Fuca harbors and harbors from Point Roberts to Gig Harbor). Recreational boater questionnaire surveys: To obtain information on local travel (non-foreign) patterns and hull maintenance, we developed a questionnaire, based on a version of ones we have successfully used in previous work (Davidson et al. 2010, Zabin et al. 2011, Ashton et al. 2012). The questionnaire was modified for Puget Sound and focused on the data relevant to this project. The questionnaire asks for information on the antifouling regime and previous year’s travel (frequency of travel, locations and duration of overnight stays; Appendix 2). The questionnaire was administered as an online survey and through in-person interviews with boaters at six marinas in September 2013. We informed boaters of the online survey through a variety of means, including fliers posted at marinas, announcements in marina newsletters, and in person during marina visits.

Puget Sound biofouling introductions and vectors
27
Recreational boat travel data collected by marinas: To collect additional data on recreational boat traffic patterns, we requested data from Puget Sound marinas on visiting boaters for the past two years. Most marinas collect information from transient visiting boaters that pay for temporary berths or moorage, but the type of information collected varies by marina, as well as the methods of data collection and record-keeping. While this approach has worked to provide some useful data for previous projects (e.g. Zabin et al. 2011), we had no success with several marinas in Puget Sound. The responses to our requests for data included (a) that marinas did not collect or retain records of this nature, (b) that marinas were unwilling to share the limited information they did collect on transient boaters, and (c) that marinas preferred not to provide data or allow us to approach their boaters to disseminate the questionnaire. We therefore did not gather marina data on transient boaters and all of our information comes from our questionnaires of boaters.
Hull Husbandry reporting by Commercial vessels arriving to Washington We conducted an analysis of hull husbandry practices by a subset of Washington’s commercial vessel traffic using data provided by the California State Lands Commission (CSLC) Hull Husbandry reporting forms. We requested and received two-years’ of data for ships that met two criteria: (a) the vessel arrived to a port in California and Puget Sound in the same year (2010 or 2011) and (b) the vessel provided a hull husbandry reporting form to CSLC. A once-per-year submission of a hull husbandry reporting form per vessel is a requirement for California’s commercial shipping traffic. For each ship that met the criteria, the following data were included unless the submitting vessel did not complete certain parts of the form (a minority of cases): - Vessel identifying information (name, IMO number, vessel type) - Date of last dry-docking or delivery - Antifouling paint applied - Sea-chest biofouling management system - Typical speed and port duration - In-water cleaning - Stationary periods (lay-ups) - Transits of freshwater locations (ports or canals) We assessed the data for patterns and outliers for maintenance activity and factors that affect biofouling accumulation (e.g. speed, lay-ups, freshwater transits). We had no means to determine whether vessels exposed to California’s requirement to complete a hull husbandry reporting form behaved differently to other Washington arrivals that do not, but the goal of our analyses was to present information on a substantial subset of ships that voyage to Puget Sound for which data were available.
Factors affecting commercial vessel biofouling – ABRPI sampling We reviewed our data sets of commercial vessel sampling to analyze the role of different factors in biofouling accumulation and transfer (risk of transferring biofouling or NIS to a destination). Our research group conducted 93 ship sampling events using in-water dive sampling, remotely operated vehicle (ROV) sampling, and dry-dock sampling between 2005 and 2012. In-service commercial vessels contributed 78% of that total and the other 20 vessels consisted of stochastic ships, such as decommissioned military vessels and other vessels of unusual itinerary (e.g. military supply vessels [Davidson et al., 2008; Zabin et al., 2012]).

Puget Sound biofouling introductions and vectors
28
While there are missing data for some vessels, such as taxonomic (species) richness for ROV-sampled ships, there are common response variables across a majority of ships that allow for comparisons of abundance, percent cover and richness. We also have vessel characteristic and behavior (e.g. maintenance) data for these vessels. We assessed these data on commercial vessels to determine if there were any strong trends (quantitative or qualitative) that highlight certain factors as particularly useful for identifying biofouling risks. We did not include stochastic vessels in this analysis because their risk factors, usually far outside the bounds of in-service commercial vessels, are largely known (e.g. several years’ duration of lay-ups).
Factors affecting commercial vessel biofouling – literature information We evaluated the recent literature on biofouling of commercial vessels to determine the factors important for biofouling transfers. We considered studies since 2000 because prior to this timeframe, tributyl tin (TBT) was a common antifouling paint that has subsequently been banned. Thus, one of the primary influences on biofouling accumulation and control is no longer available. Studies that sampled five or more commercial vessels were included in this evaluation because there are several studies of just one or two ships that could not attempt even qualitative distinctions between ships. For those studies that met these criteria, we tabulated the sample size, aim and main findings, and described common themes and differences that have emerged among these studies. We paid particular attention to treatment of risk factors, highlighting those for which thresholds could be determined to differentiate vessels into high and low risk categories.
RESULTS
Commercial vessel traffic Puget Sound is an important port of call for vessels transiting the west coast of North America. Using arrivals data reported to the National Ballast Information Clearinghouse, arrival frequency during 2008-2011 fluctuated from a winter low of ≈220 arrivals per month, to a summer high of ≈320 arrivals per month1. For comparison, this is about one third as many arrivals as California which has the most arrivals on the west coast (Takata et al. 2011). On average, 920 vessels made 3,200 arrivals to the Sound each year. Over the four years, 2,383 different vessels made arrivals and 50% of these vessels (1,185) only arrived once. Within the Puget Sound region, Seattle and Tacoma ports received the most arrivals of commercial vessels each year (Fig. 2.1), each getting 41% and 33% of arrivals to the region, respectively. Bellingham (8%) and Anacortes (7%) were the next most visited ports. Several ports received less than 10 arrivals during the four-year period (Bremerton, Edmonds, Fox Island, Friday Harbor, Indian Island, Port Hadlock and Vendovi Anchorage) suggesting there are several infrequently visited docks for commercial vessels throughout the Sound.
1 NBIC data may be different from that collected by individual states and results should be considered in
general terms

Puget Sound biofouling introductions and vectors
29
Figure 2.1. Arrival ports of commercial vessels to Puget Sound during 2008-2011 (n=12,898). Most arrivals were to the ports of Seattle and Tacoma and four other major ports are labeled in the figure. Most vessels were either on coastwise voyages (65%), or arriving from overseas to continue on coastwise transits (25%, Fig. 2.2). Only 7.5% of vessels reported arrivals from overseas ports followed by departures from the Sound to an overseas destination; these vessels were largely bulkers traveling to and from Asia. Only 8% of vessels reported arriving from a WA port, but 21% reported WA as their future destination. This discrepancy highlights the exemption of repeat arrivals to the same captain-of-the-port-zone from the reporting requirement (thus vessels would report on their first arrival to Puget Sound and describe their intent to travel within the Sound, but would not report subsequent arrivals). This differs from the reporting requirements for Washington State, but we have not included a comparison of federal- and state-level vessel reporting.

Puget Sound biofouling introductions and vectors
30
Future→ Previous↓
Coastwise Overseas WA Unknown (US)
Unknown Total
Coastwise 4237 1625 1428 22 140 7452 Overseas 2690 964 586 21 191 4452 WA 650 128 193 7 13 991 Unknown 2 1 3
Total 7579 2717 2208 50 344 12898
Figure 2.2. Source and destination of vessels arriving to Puget Sound during 2008-2011. Proportions of vessels are shown arriving (incoming or previous voyage) from coastwise, overseas and Washington last ports of call, and transiting to their described destination (outgoing voyage after reporting an arrival). Coastwise traffic dominated, with a smaller portion of vessels traveling to/from Washington State. A large number of vessels were also on transits to/from overseas destinations. Bar thickness is proportional to traffic volume. British Columbia, Alaska and California were important for both source and destination ports of coastwise transits (Fig. 2.3). British Columbia is the nearest neighbor to Puget Sound and 10% of vessels had a LPOC in Vancouver while a further 6% traveled from Victoria. Oakland and Long Beach were important donor ports in California; Anchorage and Valdez were dominant among Alaskan ports. 370 vessels also arrived from Oregon during the four-year period; 97% of these arrivals were from ports on the Columbia River (including Astoria).
Coastwise
Overseas
WA
Unknown
Coastwise
Overseas
WA
Unknown (US)
Unknown
Puget SoundPrevious transit Future transit
Coastwise
Overseas
WA
Unknown
Coastwise
Overseas
WA
Unknown (US)
Unknown
Puget SoundPrevious transit Future transit

Puget Sound biofouling introductions and vectors
31
Figure 2.3. Last (left) and next (right) port of call for commercial vessel arrivals to Puget Sound during 2008-2011. Only countries with 8 or more arrivals/departures to Puget Sound are shown. Insets show the last/next state of call for arrivals from ports in the US. Most vessels traveled to/from US and Canadian ports, with the bulk of US arrivals being from Alaska and California. The large majority of Canadian last/next ports of call were in British Columbia, apart from a small number of arrivals from Tuktoyaktuk in the Northern Territories, Bayside in New Brunswick, and Port Alfred in Quebec. Arrivals included those from 89 different ports in Japan, 25 ports in South Korea and 42 ports in China. Of those vessels traveling between Puget Sound and overseas ports of call, ports in Hawaii and Asia were most important LPOCs and NPOCs (Figs 2.4a & 2.4b). Busan (8%) and Tokyo (6%) were the most important Asian LPOCs, Honolulu was the most frequent Hawaiian LPOC (4%). Commercial vessels connected Puget Sound to all continents except Antarctica. Vessels recorded 364 different LPOCs in 41 countries and 219 NPOCs in 39 countries (Fig. 2.4).
USA
Canada
Japan
South Korea
China, Peoples Republic of
Taiwan
Mexico
Russian Federation
Australia
Panama
Chile
Singapore
Peru
Guatemala
Indonesia
Philippines
Thailand
0 1000 2000 3000 40004000 3000 2000 1000 0
n=6816n=6439
0 1000 2000
AK
CA
WA
HI
OR
LA
GA
MS
SC
TX
FL
AK
CA
WA
HI
OR
LA
GA
MS
SC
TX
FL
2000 1000 0
DeparturesArrivals
LPOC NPOC

Puget Sound biofouling introductions and vectors
32
Figure 2.4. Last (A) and next (B) port of call for commercial vessel arrivals to Puget Sound during 2008-2011. Circles indicate sites of LPOC/NPOC connected to Puget Sound by vessel traffic and frequency of arrivals and departures is color-coded, with a key at bottom of each figure. Containerships are the dominant vessel type arriving to Puget Sound (≈40% of all arrivals; Fig. 2.5). Over 40% of containership arrivals are from distant LPOCs, making them also the most common vessel arrival from overseas (excluding Canada). Tankers are also responsible for a large number of arrivals (19%), although bulkers arrive more frequently from overseas LPOCs.
Commercial Arrivals LPOC: 1501-3100 401-1500 101-400 11-100 2-10 11501-3100 401-1500 101-400 11-100 2-10 1
1501-3100 401-1500 101-400 11-100 2-10 11501-3100 401-1500 101-400 11-100 2-10 1Commercial Arrivals NPOC:
A
B

Puget Sound biofouling introductions and vectors
33
Figure 2.5. Type of vessels arriving to Puget Sound during 2008-2011. Arrivals from the US and Canada are shown in dark blue while arrivals from all other countries are in black.
Fishing vessel traffic There were 105,494 arrivals of fishing vessels recorded over four years by the PacFIN data set. There were at least 1584 different vessels that contributed to these traffic data. Additional ‘zzz’-labeled boats, which contributed 24,547 arrivals, indicate that the number of distinct vessels was much higher than 1584, but we do not know how many boats were included in this designation. Westport had the highest number of arrivals over four years with 14,709 (Fig. 2.6). Willapa Bay was also an important Pacific Coast location for arrivals with 9,211 arrivals reported. Bellingham, Anacortes and Blaine on the north coast had a combined total of 31,595 arrivals, making this the most heavily visited area (landing sites) within the boundary of the broader Puget Sound region (Fig. 2.6).
0 1000 2000 3000 4000 5000 6000
Other
Reefer
General Cargo
Passenger
Barge/Tug
RoRo
Bulker
Tanker
Container
All Other LPOC
US & Canada

Puget Sound biofouling introductions and vectors
34
Figure 2.6. The distribution of fishing vessel arrivals among Washington harbors. Bubble sizes are scaled to reflect arrival numbers over four years (2005-2008) and the scale is provided in the bottom right (n=105,494 arrivals). Westport, with 14,709 arrivals, received the highest number of arrivals. The data set revealed that Washington receives an average of 1,912 arrivals per month. The regional pattern (Fig. 2.7) showed that arrivals to Pacific Coast sites (e.g. Westport and Willapa Bay) were higher than to other regions from January to September each year, with an average of 670 arrivals per month. However, the most notable feature of the monthly analysis is the spike in arrivals to the northern coast (e.g. Bellingham, Blaine) and inner Puget Sound (e.g. Seattle) in October. The average number of September arrivals to north coast harbors was 508 over four years, but increased to an average of 2,396 in October. Similarly, inner Puget Sound had average September arrivals of 541 that spiked to 1,196 for

Puget Sound biofouling introductions and vectors
35
October. While there may be several reasons for this pattern, the Dungeness crab fishery in the state reported a coinciding spike in landings during the same four-year period; landings of Dungeness crab in the state averaged 530,145 pounds for September (2005-2008) but increased to 2,325,137 pounds for October over the same time period (Source: NOAA National Marine Fisheries Service http://www.st.nmfs.noaa.gov/commercial-fisheries/index).
Figure 2.7. Monthly pattern of fishing vessel arrivals to harbors in four regions of Washington’s coast. The average number of arrivals per month (and SD) over four-years is plotted for the Outer Coast, Strait of Juan de Fuca, Inner Puget Sound, and the North Coast. Just over 40% of the fishing fleet in Washington consisted of resident boats that did not report arrivals to any other bay outside of their home harbor in four years (Fig. 2.8). The remaining 939 vessels visited two or more harbors over the same time period. There were only 14 vessels that reported visits to nine or more different harbors and the maximum number reported was for 12 different harbors visited by one vessel (see below). Westport received the highest number of arrivals over four years and had the largest fleet of sole-port boats with 116 vessels that recorded landings only in Westport. Bellingham had the second-highest number of arrivals and received the highest number of different boats (529; Fig. 2.9). There was a high number of sole-port boats statewide but the effect of transiency meant that the number of transient boats exceeded the number of resident boats for every port in the state (because transient boats count more than once among bays; Fig. 2.9). Inner Puget Sound harbors tended to have very few sole-port vessels, with only 56 vessels for the combined ports within that region reporting arrivals to just one port for four years.

Puget Sound biofouling introductions and vectors
36
Figure 2.8. The frequency of fishing boats per the number of different ports they visited in Washington over four years. The plot shows that 40.7% of Washington’s fishing fleet (n=1584 boats) reported arrivals to just one bay between Jan 2005 and Dec 2008. The remaining vessels were transient, having reported arrivals to between 2 and 12 different harbors.
Figure 2.9. Numbers of different transient and resident boats per bay. This plot shows the total number of different vessels that arrived to each bay over four years, with the black portion of each bar representing transient boats and the gray portion representing sole-port (resident) boats. Transient boats outnumbered sole-port boats state wide, but it should be noted that transient boats are counted several times in this plot (between 2 and 12 depending on the number of bays visited by each boat). Although Westport had the highest number of arrivals, Bellingham received slightly higher numbers of boats. The horizontal bars on the left of the plot show the division among regions of Washington’s coastline; from bottom to top the groups of harbors are from the Outer (Pacific) Coast, Strait of Juan de Fuca, Inner Puget Sound, and North Coast.

Puget Sound biofouling introductions and vectors
37
The most transient vessel in the Washington PacFin dataset visited 12 different ports during 74 separate landings between 2005 and 2008. The network of ports connected by this vessel ranged from Blaine in the north, Columbia River ports in the south, and many ports throughout inner Puget Sound (Fig. 2.10). Nearly all of the vessel’s landings were recorded in September, October and November in each of the four years, suggesting this vessel did not fish at other times of the year or moved to sites out of state for a majority of the year. There was no discernible home port in the pattern of landings for this vessel; it reported arrivals to Bellingham on 17 occasions but also 13 visits to Willapa Bay and 14 to Tacoma. Overall, 39% of the arrivals for this vessel involved distinct transits from one port to another (29 out of 74 arrivals records). Most of the travel record occurred in 2008, with 35 landings reported and at least 14 transits from one port to another (the remainder were out-and-back returns to the same port). It traveled to eight of the 12 ports on its recorded itinerary during 2008. In 2005, the vessel only visited Grays Harbor and then transited to Blaine sometime prior to August 2006. This pattern of connecting Puget Sound ports with ports in the southwest outer coast of the state was the dominant pattern for this vessel, with an additional set of linkages for ports within Puget Sound (Fig. 2.10). The vessel did not call on ports on the Strait of Juan de Fuca coastline. The consequence of this vessel’s movements for introductions is difficult to ascertain without knowing the status of the vessel’s submerged surfaces throughout this four year operational window. The strong connections between outer Pacific Coast sites and Puget Sound sites provided a means for biofouling organisms to be intermixed among those bays. Most NIS do not have the self-dispersal capacity to spread naturally among such disparate sites. There are NIS established in one or other region (not both) for which this vessel’s voyage history could provide a vector to range expansion. By providing a large network of ports, this vessel demonstrates the type of vector potential that can exist for fishing vessel movements because organisms can be transported throughout the network and be provided a range of opportunities (environmental match, transit survival, breeding times) that can provide risks of successful transfers across a range of species.

Puget Sound biofouling introductions and vectors
38
Figure 2.10. Voyage patterns of the most transient fishing vessel in Washington. This map shows the connections between 12 different Washington ports visited by a single vessel over four years. Annual transits between 2005-2008 (inclusive) are shown in the legend. This vessel recorded the highest number of visits to different ports within the state data set. The bubble sizes and locations are those shown in the map in Fig. 6. Not represented in this plot are the numbers of uninterrupted return (out-and-back) transits by this vessel to the same port; for example, this vessel reported 6 repeated returns to Bellingham in November 2007. Arrivals to ports when fish were not landed are also not captured by the data set.
Recreational boat traffic Foreign vessel arrivals We received two sets of data from the CBP Port Angeles office. The first included a spreadsheet with data on number of arrivals, arrival locations, and ports of departure for six marinas: Neah Bay, Port Angeles, Sequim, Port Townsend, Port Hadlock, and Port Ludlow. These data included monthly information from June 2011 to July 2012, for a total of 760 arrivals. We did not receive information on homeports or other ports of call before arrival to the Puget Sound region; we were told that these data were not available. A second data set was provided on a map, which indicated the number of arrivals to an additional nine marinas on the eastern side of Puget Sound from Point Roberts south to Gig Harbor. These arrivals totaled 19,117, representing a substantial amount of traffic into Puget Sound, and fall

Puget Sound biofouling introductions and vectors
39
under the jurisdiction of the Blaine Area Port control. Late in this project timeline, the CBP estimated the cost of gathering further data (breakdown of arrivals by month, vessel size, port of departure, home port, and previous ports of call) for Blaine Area Port at $13,286, and in September 2013 denied our FOIA request as unreasonably burdensome to the agency. Given the time frame of this project and this expense (not included in the project budget), we decided not to appeal their determination. Within the greater Puget Sound region, the most-visited port was Friday Harbor, with more than 58% of the total foreign arrivals at 11,592 (Fig. 2.11). As far as we were able to determine, Bellingham was the second most frequently visited port, with ≈28% or “5,500+” arrivals reported. Port Roberts was the third-most visited port, with 1,326 arrivals or 7% of the total. The remaining 7% of arrivals were split among 11 ports, with hundreds of arrivals in Anacortes, Port Angeles, and Port Townsend.
Figure 2.11. Number of recreational boat arrivals from foreign sources at ports in the greater Puget Sound region. Data from CBP. For the 760 arrivals for which we received additional details, we were able to determine the following travel patterns: - Arrivals were highest in the late summer and fall months for the time period for which we have data,
with little travel between October and March (Fig. 2.12) - Nearly all of the travelers (98%) arrived from a Pacific Canadian port. Only five of the 760 arrived
directly from other locales (three from Japan, one from New Zealand, and one from Tahiti). Nine additional arrivals were foreign vessels that had received cruising permits from CPB in Hawaii, California and Oregon.
- Visitors arriving directly to the region from overseas (outside of BC) came to Port Angeles (four visitors) and Port Townsend (one visitor). All nine of the foreign vessels that had first entered the US in Hawaii, California or Oregon arrived into Port Angeles (Table 2.1).
- Visitors arrived from 12 ports in British Columbia, with Victoria accounting for 63% of these, at 473 visitors. The Gulf Islands were the second most common point of departure with 83 visitors, and

Puget Sound biofouling introductions and vectors
40
Sidney the third most common at 36; the rest of the visitors were spread fairly evenly across the remaining ports (Fig. 2.13).
- Linkages between departure and arrival harbors were strongest between Victoria and Port Angeles (250 arrivals) and between Victoria and Port Townsend (205 arrivals). Other linkages between pairs of British Columbian and Washington ports appear strongest between nearby ports (i.e. travelers arriving at the Washington port closest to their departure port, Table 2.1).
- Boats in the 30-40 foot range represented the single-largest size class (41%); with 20-30 foot vessels and 40-50 foot vessels nearly equal at 23% and 22% respectively (Fig. 2.14).
Figure 2.12. Number of foreign recreational boat arrivals to Neah Bay, Port Angeles, Sequim, Port Townsend, Port Hadlock, and Port Ludlow from June 2011 to July 2012. Data from CBP.
Figure 2.13. The ports of departure for boats arriving to Port Angeles. Port of departure may or may not be a boat’s home port. Data from CBP.

Puget Sound biofouling introductions and vectors
41
Figure 2.14. The frequency of vessel sizes among arriving vessels from foreign sources to Neah Bay, Port Angeles, Sequim, Port Townsend, Port Hadlock, and Port Ludlow. Data from CBP (n=760). Table 2.1. Connections between a subset of ports in Puget Sound and Canada. Cells highlighted in red indicate strong connectivity (highest number of arrivals); cells highlighted in yellow indicate moderate connectivity and those in green low connectivity. Data represent arrivals to WA ports (column headers) from Canadian sources (row headers).
Boater questionnaire data Sixty-two boaters took our online survey and provided at least partial information on their boat use, travel patterns and hull cleaning practices. In addition, we interviewed 91 boaters from six marinas in-person in September 2013. Combined, these surveys were from 93 recreational sailboat owners, 52 recreational motorboat owners, and five owners of fishing boats (three responders checked “other” or
NeahBay PortAngeles SequimBay PortTownsendPortHadlock PortLudlow
Tofino 8
Ucluelet 6 11
Bamfield 9 17 5
PtRenfrew 6
Sooke 30 1 5
Victoria 250 12 205 5 1
OakBay 10 8
Sidney 22 2 25 2
GulfIslands 25 6 43 9
Nanaimo 7 1
Vancouver 8 1 9
Richmond 3
Overseas 4 1
HI-CA-OR 9

Puget Sound biofouling introductions and vectors
42
did not give a boat type) from 16 home ports (Appendix 3). Most boats (64%) were less than 40 feet in length (Fig. 2.15).
Fig 2.15. The frequency of vessel sizes for respondents to an online questionnaires. (n=56 online respondents only). Most boaters (88%) reported using some type of antifouling paint. Copper-based paint was used by 90% of boaters who gave details on their paint type; only a few specifically mentioned using foul-release or non-copper paints. Nearly twice as many boaters reported using ablative paint compared to ‘hard’ paint. Average paint age was 26 months (+/-2 months SE), and 30% of boaters had painted within the previous year (Fig. 2.16). However, 30% of boaters had paint older than 3 years (Fig 2.16). Only 54% of boat owners reported having cleaned their boats since last haul out. Despite the state’s ban on in-water cleaning for vessels with biocidal paints, 55% of the boaters (44/80) who reported cleaning their boats did so in-water. Nearly of all of these boaters cleaned in their home harbors, with only one reporting having cleaned outside of the state, at a harbor in Canada. Several of the boaters interviewed in-person acknowledged that they were aware of being in violation of the state’s regulations. The remainder of boaters reported that their boats were cleaned out of water; most of those who provided additional details said this was done in dry-dock at a boatyard or at home. Boaters who reported having washed their boats since last paint application tended to have older paint (average 33 months, +/-SE 3.7 months) than those who did not wash (average 20 months, +/-SE 2.9 months). In online questionnaires, boaters were asked typical cleaning frequencies for spring and summer months vs. fall and winter months. Most boaters cleaned slightly more frequently in the spring and summer (2 times on average), when boats are more active, than in the fall and winter (1.3 times on average). For in-person and online surveys, we asked boat owners how frequently they washed their boats between applications of new paint. Forty-one percent of those who reported cleaning did so on a yearly basis. Many boaters (29%) cleaned at 3-month intervals or more frequently (Fig. 2.17). On average, boaters reported that their most recent cleaning had been seven months prior to the survey data. These

Puget Sound biofouling introductions and vectors
43
cleanings may reduce fouling, and when combined with paint age data (taking either the last washing date OR the last painting date, whichever is more recent), more than 70% of boat owners had taken steps to reduce fouling within the past year, and 86% within the last two years (Fig. 2.18).
Fig 2.16. The frequency of antifouling paint ages for boaters responding to the questionnaire.
Fig 2.17. Vessel cleaning frequency reported by respondents to a boater questionnaire.
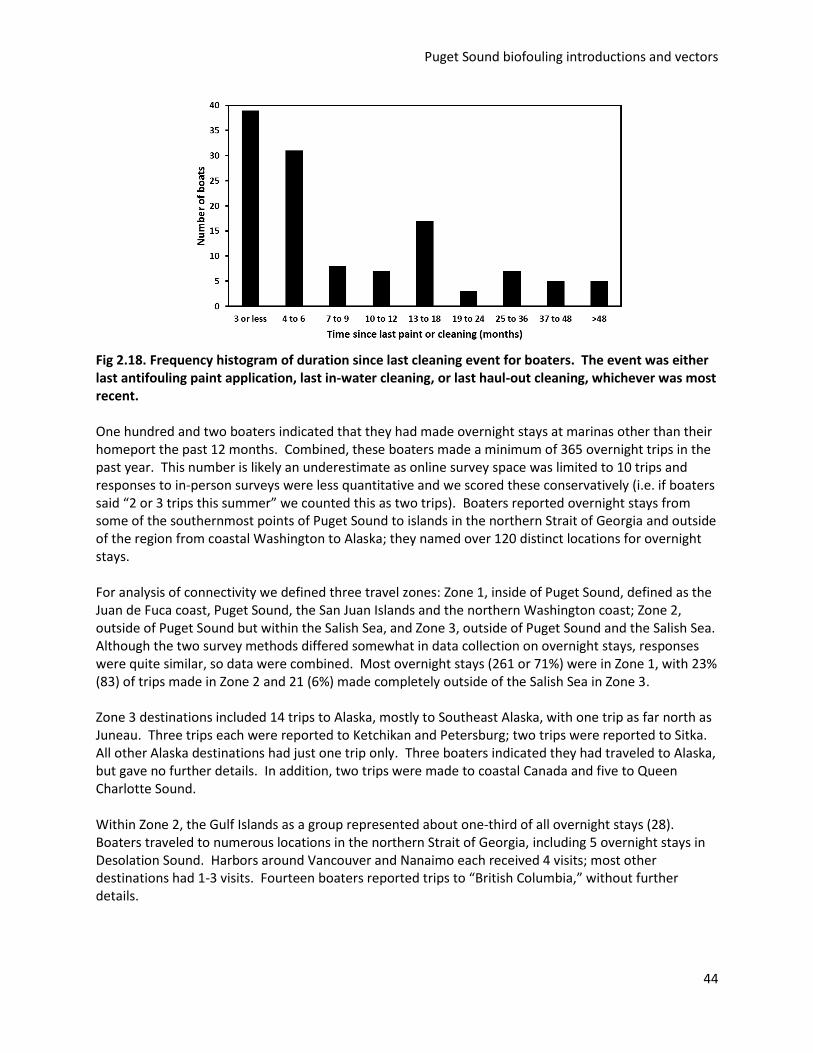
Puget Sound biofouling introductions and vectors
44
Fig 2.18. Frequency histogram of duration since last cleaning event for boaters. The event was either last antifouling paint application, last in-water cleaning, or last haul-out cleaning, whichever was most recent. One hundred and two boaters indicated that they had made overnight stays at marinas other than their homeport the past 12 months. Combined, these boaters made a minimum of 365 overnight trips in the past year. This number is likely an underestimate as online survey space was limited to 10 trips and responses to in-person surveys were less quantitative and we scored these conservatively (i.e. if boaters said “2 or 3 trips this summer” we counted this as two trips). Boaters reported overnight stays from some of the southernmost points of Puget Sound to islands in the northern Strait of Georgia and outside of the region from coastal Washington to Alaska; they named over 120 distinct locations for overnight stays. For analysis of connectivity we defined three travel zones: Zone 1, inside of Puget Sound, defined as the Juan de Fuca coast, Puget Sound, the San Juan Islands and the northern Washington coast; Zone 2, outside of Puget Sound but within the Salish Sea, and Zone 3, outside of Puget Sound and the Salish Sea. Although the two survey methods differed somewhat in data collection on overnight stays, responses were quite similar, so data were combined. Most overnight stays (261 or 71%) were in Zone 1, with 23% (83) of trips made in Zone 2 and 21 (6%) made completely outside of the Salish Sea in Zone 3. Zone 3 destinations included 14 trips to Alaska, mostly to Southeast Alaska, with one trip as far north as Juneau. Three trips each were reported to Ketchikan and Petersburg; two trips were reported to Sitka. All other Alaska destinations had just one trip only. Three boaters indicated they had traveled to Alaska, but gave no further details. In addition, two trips were made to coastal Canada and five to Queen Charlotte Sound. Within Zone 2, the Gulf Islands as a group represented about one-third of all overnight stays (28). Boaters traveled to numerous locations in the northern Strait of Georgia, including 5 overnight stays in Desolation Sound. Harbors around Vancouver and Nanaimo each received 4 visits; most other destinations had 1-3 visits. Fourteen boaters reported trips to “British Columbia,” without further details.

Puget Sound biofouling introductions and vectors
45
Within Zone 1, we further distinguished between four regions: Juan de Fuca coast, the San Juan Islands, Puget Sound proper, and the northern Washington coast (Fig 2.19). Not surprisingly, given that most of the boaters surveyed are home ported within the Sound, Puget Sound destinations were the most frequently reported (64% or 168 trips). Poulsbo Harbor was the most-frequently visited marina within this region (19 overnight stays). The San Juan Islands were a major destination with 69 trips overnight stays (27% of total Zone 1). San Juan Island was the most-visited of the islands with 34 visits; Friday Harbor was the second-most visited harbor in the entire data set, with 15 visits reported. Fourteen visits were reported to Orcas Island. There were 14 overnight visits to marinas on the Juan de Fuca coast and two to coastal harbors.
Fig 2.19. Breakdown of reported overnight visits away from homeports for the Puget Sound region.
Hull husbandry and identifying risk for biofouling transfers
Hull husbandry by commercial vessels arriving to Washington There were 404 vessels that met the criteria of having arrived to Washington and California in 2010 or 2011 and having submitted a hull husbandry reporting form to the California State Lands Commission (n=404 hull husbandry forms). Containerships were the most numerous (44% of the total; Fig. 2.20) among vessel types in this data set, followed by tankers and auto-carriers. There were only 12 vessels in total among bulkers and general cargo vessels in the data set. The proportional breakdown of vessels with HHRF data had some similarities with the general pattern of arrivals to the region (Figs. 2.5 and 2.20). Containerships account for about 40% of arrivals to Puget Sound, and HHRFs from containerships were of a similar proportion. However, bulkers appeared under-represented in HHRF data.

Puget Sound biofouling introductions and vectors
46
Figure 2.20. Numbers of vessels reporting hull husbandry information to CLSC that also arrived in Washington. The plot shows the number of ships per vessel type that visited California and Washington in either 2010 or 2011 and provided a hull husbandry form to CSLC (n=404 ships). Biocide-based antifouling coatings were used exclusively to coat submerged portions of ships for more than 80% of reports submitted across the two-year time span (same paint on hull and niche surfaces – niches defined as heterogeneous non-hull surfaces like rudders, propellers, and thrusters). Only 6.5% of vessel reports noted the use of biocide-free antifouling coatings alone on ships, but a further 9% used antifouling paints on certain surfaces and foul-release coatings on others (two coating types on the same ship, with some niche areas coated differently to the hull). A majority of ships (56%) reported applications of antifouling or foul-release paint within two years prior to submitting their hull husbandry forms (Fig. 2.21a). Only one vessel reported an antifouling paint application that had surpassed the typical five-year maximum period that occurs between dry-dockings. Because the majority of vessels had applied anti-fouling (or foul-release) coatings within the last three years, it was unsurprising that most vessels had not conducted in-water cleaning since dry-docking or delivery (Fig. 2.21b). Just 12% of reports revealed that in-water cleaning had been conducted since last dry-docking or since delivery, although 20% reported in-water propeller polishing.

Puget Sound biofouling introductions and vectors
47
Figure 2.21. Reported time since application of antifouling paint and adoption of in-water cleaning. Plot (a) shows the number of vessels that reported their duration since most recent dry-docking or vessel delivery during which antifouling paint was applied (i.e. anti-fouling paint age). More than half of the vessels (56%) in this data set reported antifouling paint of less than two years old while 5% reported paint older than four years (n=404). Plot (b) shows the use of in-water cleaning among ship types in this data set (n=402 because two vessels did not respond to this question on the hull husbandry reporting forms). The typical speed and port residence time of vessels is considered an important risk factor in biofouling accumulation and transfer. They can contribute to the extent of fouling on ships by affecting adherence capacity of organisms (speed) and colonization opportunities available to them (port residence time). In general, lower speeds and higher port residence times are thought to increase the risks of biofouling accumulation. Speed and port residence times varied significantly among ship types for the subset of Washington vessel arrivals in the hull husbandry data set (ANOVA; all F > 39.36, all p < 0.001). On average, containerships traveled faster than other ship types (average 19.5 knots). Tankers had the longest port residence times, although this varied substantially among tankers (average 48.7 hrs, S.D. 25 hrs; Fig. 2.22). Bulkers also varied substantially for port residence time (average 41 hrs, S.D. 27 hrs), but this was probably a function of a small sample size (n=5) in this data set and more bulker data would be required to determine if this factor varies substantially for this vessel class in Washington. There were notable outliers for speed and port residence time for some vessel types that may be considered risk factors for increased biofouling accumulation (Fig. 2.22). One tanker reported a typical

Puget Sound biofouling introductions and vectors
48
speed of 7.5 knots which was six knots slower than the average for that class. Two auto carriers reported a typical port duration of 96 hours which was more than four times longer than the average for that class (auto average = 20.1hrs) and twice as long a time period as the next highest duration for auto carriers.
Figure 2.22. Average reported speed and port residence time of vessel types. The typical vessel speed (a) and typical port residence time (b) is plotted as averages and SD per vessel type (black circles). Minimum reported speed and maximum port residence time are also shown (gray squares for (a) and (b), respectively. Finally, periods of time at a single location (usually a period of inactivity) are considered important risk factors for biofouling accumulation. Colonization of ships’ submerged surfaces tends to only occur during stationary periods or slow transits rather than during typical voyages, while antifouling and foul-release paints function under movement scenarios, therefore extended periods in one location can allow excessive biofouling colonization to occur. Reports of lay-ups for this data set extended to 40% of the fleet with barges and tankers reporting lay-ups at the highest proportions (Fig. 2.23). Among the 298 lay-up events reported throughout the data set of 404 ships, 41% were of 11-15 days duration (Fig. 2.23) and 4% lasted longer than 61 days. The highest portions of these lay-up events occurred in bays on the US west coast (40%), Asia (32%), and Europe (5%), although extended stationary periods (>10 days) occurred throughout the world within the combined 6,465 days of lay-ups reported (Fig. 2.23).
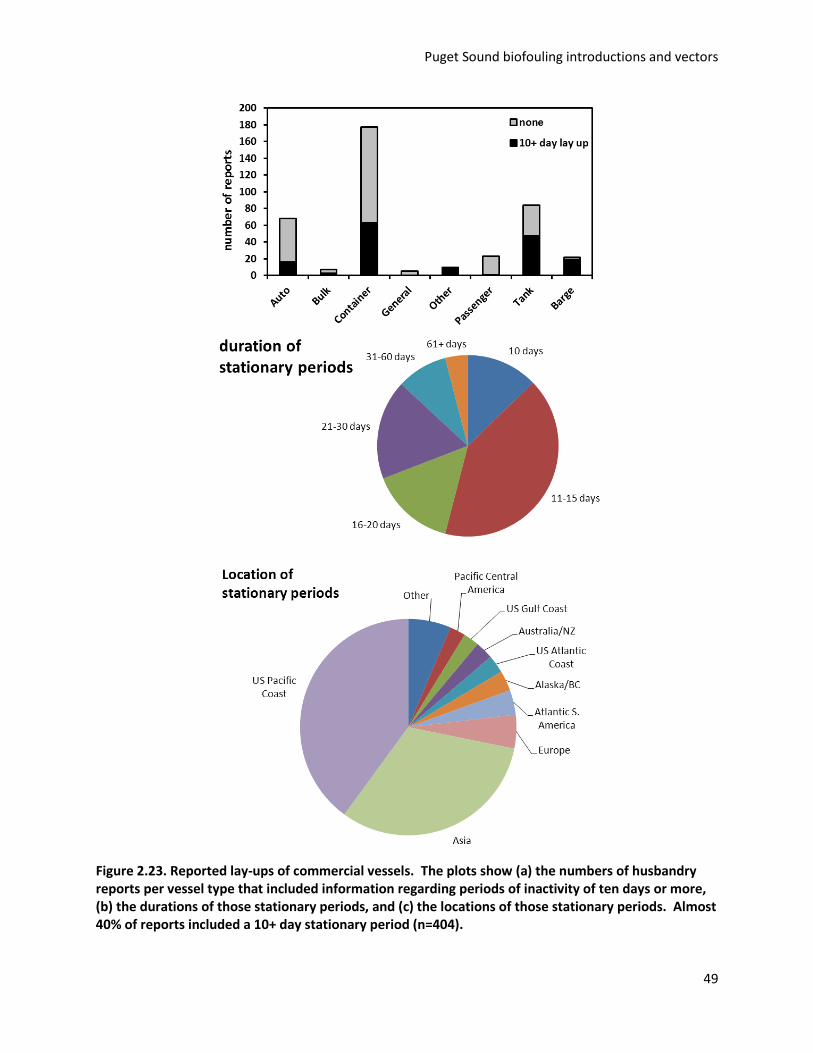
Puget Sound biofouling introductions and vectors
49
Figure 2.23. Reported lay-ups of commercial vessels. The plots show (a) the numbers of husbandry reports per vessel type that included information regarding periods of inactivity of ten days or more, (b) the durations of those stationary periods, and (c) the locations of those stationary periods. Almost 40% of reports included a 10+ day stationary period (n=404).

Puget Sound biofouling introductions and vectors
50
Factors affecting commercial vessel biofouling – Authors’ data collection (ABRPI sampling) Using data from 73 commercial vessels we have sampled since 2005, we examined correlations between biofouling metrics (richness, % cover, or categorical abundance) and various vessel factors to determine if there were relationships or dichotomies in the data that may be useful for identifying risk. Biofouling species richness (defined in this case as morphologically different species) per ship had a positive relationship with abundance, as would be expected (Fig. 2.24, Pearson correlation r= 0.729, p<0.001). There were similar relationships between richness and percent cover, although the correlation was weaker (r=0.455, p<0.001) because percent cover estimates per ship included algal cover while richness estimates pertained to fauna only.
Figure 2.24. The relationships between categorical abundance categories of biofouling and (morpho) species richness per ship. (n=61) We did not find significant relationships between most biofouling metrics and vessel behaviors. Ship speeds vary among ship types, (Fig. 2.25) but there was no correlation between speed and biofouling abundance or richness (r=0.122, p>0.05). Species richness across all vessel types did not differ significantly (p>0.05), with the range of richness for vessel types overlapping substantially (Fig. 2.25) with the exception of ‘other’ vessels which included a bulker, a ferry and tugs.

Puget Sound biofouling introductions and vectors
51
Figure 2.25. The relationship between typical speed and species richness per ship. Ship types are included in the legend. There was no significant relationship between speed and all ships (see text, n=61). Similarly, we did not find significant correlations between biofouling and duration since dry-docking (Fig. 2.26). Typically, we might expect biofouling richness to increase as docking duration increases, but the data did not show such a relationship in this case (r=0.223, p>0.05), possibly because there are many other interacting factors, such a voyage type (Fig. 2.26). We also found weak or no relationships between stationary periods and biofouling, although our data set did not include many ships that reported lay-ups. The data were heavily unbalanced toward ships that did not report lay-ups longer than ten days (only 11 of 65 ships had reported lay-ups). Typical port duration and biofouling richness had a significant negative correlation (r=-0.319, p<0.05), which is counter to expectations that biofouling increases as port residence time increases.
Figure 2.26. The relationship between duration since last dry-docking (in months) and biofouling species richness. Different categories of voyage type are shown in the legend. There was no significant relationship between dry docking duration and biofouling (n=52).

Puget Sound biofouling introductions and vectors
52
Factors affecting commercial vessel biofouling – literature information There has been a resurgence of research on biofouling over the past 12 years, but the numbers of studies with sampling of multiple vessels remains relatively low. We identified 11 studies that sampled more than five commercial vessels that had voyage histories extending beyond the region of the study site (Table 2.2). The treatment of data ranged from qualitative comparisons of biofouling among vessels to complex quantitative modeling of biofouling and vessel characteristics. Table 2.2. Literature studies since 2000 that include treatment of factors that affect biofouling.
Study Risk factors examined
Vessels sampled
Main outcome
James & Hayden (2000) New Zealand National Institute of Water & Atmospheric Research (NIWA) Report
Extended port residence time; voyage route; hull location
12 vessels (>500 tons)
Qualitative comparisons of factors with one outlier vessel highlighting an important element of risk (extended port residence time)
Gollasch (2002) Biofouling. 18: 105-121
Environmental match of origin to destination
“131 samples from 186 ships”
Qualitative comparison of biofouling species native ranges with those of the North Sea (environmental match likely for some taxa)
Godwin (2003) Biofouling. 19: 123-131
poor maintenance; inactive periods
7 commercial barges, 1 transferred dry dock
Qualitative comparisons of factors with one outlier vessel highlighting an important element of risk (poor maintenance and lay-up)
Coutts & Taylor (2004) NZ J Mar & FW Res. 38: 215-229
Hull location; inactive periods
30 vessels Quantitative comparisons of hull location highlighting hotspots for fouling accumulation; qualitative comparisons of inactive periods (two outlier vessels)
Godwin et al. (2004) Bishop Museum Technical Report #28 (Hawaii)
Vessel type; hull location
35 vessels Qualitative comparisons demonstrated species transfers from out-of-state and within state.
Davidson et al. (2006) US Coast Guard Report
Frequency of freshwater visits; duration since maintenance
10 vessels Qualitative comparisons; low biofouling explained by frequent freshwater visits and recent maintenance. The factors did not occur for vessels with high biofouling abundance.
Farrapeira et al. (2007) Brazilian Journal of Oceanography. 55: 207-221
Voyage route/residency
32 vessels Qualitative comparisons of local, regional and international vessels - biota decreased with increasing voyage range

Puget Sound biofouling introductions and vectors
53
Study Risk factors examined
Vessels sampled
Main outcome
Davidson et al. (2009) Biofouling. 25: 645-655.
Voyage routes; surface area; duration since dry docking
22 containerships
Significant (but weak) correlation between fouling and dry docking duration; no significant effect of voyage route or surface area on biofouling
Sylvester & MacIsaac (2010) Diversity & Distributions. 16: 132-143.
Voyage routes; cumulative time in port in prior 12 months; typical speed; duration since dry docking/painting
20 ships Regression analyses; biofouling abundance best explained by cumulative dock time and typical speed; species richness best explained by cumulative time in port; no significant relationship between biofouling and time since dry docking
Sylvester et al. (2011) Journal of Applied Ecology
Time since last dry docking/painting; cumulative time in port in prior 12 months; typical speed;, regions visited
40 ships Positive significant relationships between biofouling abundance and richness with cumulative time in port and duration since painting
Inglis et al., 2010 (report)
12 factors 270 merchant vessels
Time since dry docking, vessel speed, vessel age, and cumulative time underway were important predictors of biofouling richness and presence/absence of certain taxa
The main findings of the literature review of factors that affect biofouling risk are as follows:
Each study in Table 2.2 highlighted vessel niche areas as an important part of risk for biofouling accumulation and transfer. These biofouling hotspots are now widely acknowledged as areas to focus management attention to reduce propagule delivery and invasions. While the numbers of niche areas and their complexity varies within and among vessel classes, ‘niche area’ per se is probably not a useful factor for identifying risky vessels in regards to biofouling. It is an important interacting factor simply because biofouling is concentrated at these submerged locations, but this is true of all vessels rather than a potential indicator for discriminating among vessels. (Though a case could be made that barges do not have many complex surfaces, their tugs generally do).
Samples sizes in most studies are too low compared to the high variation that is typical in biofouling data sets and the number of factors that influence biofouling (Inglis et al., 2010). In many studies, the presence of an outlier vessel among the sampled vessels highlighted an important risk factor, but not thresholds for that factor.
Freshwater immersion likely plays an important role in biofouling colonization and mortality, but this factor is not well sampled in the literature. Because of a lack of data, only broad qualitative determinations can be made regarding freshwater as a risk-reducing factor; (a) for vessels that transit regularly between marine and freshwater systems, biofouling tends to be reduced, and (b)

Puget Sound biofouling introductions and vectors
54
the risk of biofouling incursions to freshwater systems appears to be low (Davidson et al., 2006; Sylvester & MacIsaac, 2010). Thus freshwater immersion would most likely be used in a risk matrix as a mitigating factor (low risk) rather than a threshold factor to identify higher risk vessels.
Temporal components of biofouling risk (e.g. season) are also largely understudied in the biofouling literature. In cases where they have been examined quantitatively, they have not proven to be significant factors in explaining biofouling response variables (Inglis et al., 2010). Season is a biologically significant driver of many biological processes related to biofouling transfers (such as reproduction, colonization etc), so there is a sound rationale to consider it as a risk factor. To a certain degree, recreational boating is more seasonal in pattern and maintenance practices of boaters reflect this seasonality. It is unclear that season plays any role in maintenance decisions of shippers.
Ship characteristics such as vessel age and vessel size have not been found to explain large portions of variation in biofouling data. Vessel type is considered important, however, particularly at the coarse scale of commercial vessels versus boats (recreational and fishing boats). Within these coarse categories, vessel type can also be considered important but co-varies with a number of other factors (such as speed and port residence time). Sylvester et al (2011) found that speed had a negative effect on biofouling abundance but a positive effect on biofouling species richness.
Biogeographic factors, including source regions, voyage routes, and voyage durations only rarely provide critical thresholds or distinguish between sets of vessels for quantitative evaluation of biofouling risk (Inglis et al., 2010; Sylvester et al., 2011). While ships that frequent the tropics may be exposed to a higher colonization pressure, the environmental match for those species with temperate environments (Washington) is quite low. Biogeographic factors can also interact in complex ways such that the same factor can increase and decrease risk depending on the species involved (as with speed in the Sylvester et al., 2011 example above). For example, long voyage durations from a distant source port across latitudes can be viewed as both beneficial to species (in terms of reducing abrupt transitions among temperature zones) but also detrimental to their survivorship (with long periods of restricted feeding in open ocean conditions).
Sylvester et al (2011) examined 40 ships on the Atlantic and Pacific coasts of Canada and assessed whether maintenance and voyage histories were useful explanatory factors of the biofouling abundance and richness sampled. They found variation between the coasts in these response variables; notably there was a higher richness of species arriving on vessels in Vancouver (West Coast) compared to Halifax (East Coast). Cumulative time in port (in the previous 12 months) and time since last painting were significant covariates for richness and abundance of biofouling on ships. From their data, they identified thresholds of 375 and 427 days’ duration since antifouling application for Halifax and Vancouver, respectively. Ships below these thresholds had relatively little biofouling while those above these thresholds had large accumulations. However, it appears that the sample sizes either side of these thresholds were very uneven (low numbers of ships below these thresholds) which may provide some additional caution for over-interpreting these thresholds.
Inglis et al (2010) provided the most comprehensive account of biofouling factors available to date. They assessed data from 270 commercial vessels and 186 recreational vessels sampled in New Zealand. They conducted several types of analyses, including boosted regression tree modeling, using many response variables to evaluate the explanatory and predictive power of several factors for biofouling risk. While the overall conclusion was that no model/factor was a good predictor of biofouling risk, they did find some interesting explanatory variables that made biological sense. There were differences between commercial and recreational vessels in the suite of factors that best explained the data; factors related to vessel maintenance and design were more important for commercial vessels, while voyage characteristics were more important for recreational vessels. Among the many findings, a 400-day threshold of anti-fouling paint age (duration since docking) was

Puget Sound biofouling introductions and vectors
55
identified for determining the presence or absence of bivalves and polychaetes on commercial vessels. Vessel speeds of 18-20 knots appeared an important threshold for biofouling.
Identifying high-risk commercial vessels
Below (Table 2.3), we examined two initial scenarios for identifying vessel biofouling risk in Puget Sound. Scenario 1 uses a 400-day threshold indicated by Inglis et al. (2010) and Sylvester et al. (2010) as Step 1, followed by an evaluation of lay-up durations for those ships. The second scenario uses a 4-year threshold for paint age (paints will either be overdue for replacement or within one year of replacement using this threshold), with the lay-up factor included as Step 2. We tested these factors against the 2011 data for commercial vessel husbandry for Washington State (n=142 ships). This should be viewed as an evaluation rather than a recommendation of a simple risk-identifying approach. Using the 2011 hull husbandry data from CSLC, we examined the return rate of risky vessels for ships that reported a duration since dry docking (n=142). The outcome of Scenario 1 was that 21% of ships would be considered relatively risky because of a paint age (time since docking) older than 400 days and a stationary period within the past 12 months (>10 days). Over a third of the vessels (37%) failed the paint age threshold but did not have a lay-up. A further 11% of vessels passed the paint age threshold but did have a lay-up. For Scenario 2, only 2% of vessels had both risk characteristics of >4 year duration since docking and a lay-up in the prior 12 months. These three vessels had between 4.3 and 4.7 years’ duration since dry docking and a cumulative 146 days of lay-up time reported. However, much of the stationary duration occurred in Puget Sound, which may reduce the risk of NIS transfer for this region, but lead to increased risk for other regions on these vessels itineraries. It is important to note that any risk model developed with the intention of adoption would require validation in the field, ideally in Puget Sound, to first identify the appropriate thresholds and then test those as predictors on another set of ships.
Table 2.3. Risk matrix scenarios to identify relative biofouling risk.
Scenario 1 (n=142 ships) Go Stop Vessels with paint age older than 400 days
42% of total 58% of total
AND vessels that reported lay-up durations of more than 10 days in the past 12 months
37% of total 21% of total
Outcome 21% of ships would be considered relatively high risk based on paint age and experiencing a stationary period of >10 days in the prior 12 months
Scenario 2 Go Stop
Vessels with paint age older than 4 years
96% of total 4% of total
AND vessels that reported lay-up durations of more than 10 days in the past 12 months
2% of total 2% of total

Puget Sound biofouling introductions and vectors
56
DISCUSSION
Puget Sound is an important hub of vessel activity and our initial estimate of vessel traffic to the region approaches 50,000 vessels per year comprising 3,200 commercial vessel arrivals, over 26,000 fishing vessel arrivals (from within state and within Puget Sound), and at least 20,000 recreational boat arrivals from overseas. The recreational data are likely to provide a very substantial underestimate (in terms of transient boat visits within the state and from neighboring states). Such a volume of traffic suggests that prudent vector management options be considered for biofouling in addition to current effective efforts that focus on keeping hull surfaces clean (e.g. for fuel efficiency reasons on commercial vessels). It is unlikely that another largely unmanaged maritime vector approaches this magnitude of flux in terms of units entering and moving within the state. Given that current ballast water management practices appear to have been well-adopted in Puget Sound, it is important to assess the contribution that biofouling makes to propagules entering the region simply because biofouling incursions may undermine progress made on ballast water (because both vectors overlap in species composition for many taxa).
Data sets for commercial and fishing vessel traffic are relatively complete because both of these maritime sectors have a central reporting standard and data are available. The same is not true of recreational vessel movements and even in cases where data could be available (e.g. international arrivals reporting to CBP), the data are either patchy or not forthcoming. We were unable to obtain detailed data from the CBP office responsible for collecting data on foreign arrivals to the busiest recreational marinas in the region. We were also not able to obtain data on visiting boaters from individual marinas, some of the busiest of which told us that they do not collect or keep such data. It is unlikely that a complete picture of recreational vessel traffic could be provided unless a larger study was conducted with significant assistance from marinas, or unless a standardized reporting system was set up among marinas.
Data from surveys of 153 boaters indicated that recreational boaters in the region are very active, traveling mostly to multiple marinas within Puget Sound proper, but also making numerous trips to the San Juan Islands and into the Canadian Salish Sea. In addition, a smaller subset of boaters travel north to Queen Charlotte Sound and into Southeast Alaska. Combined with arrivals from Canada (mainly) and other sites outside of the region, the recreational boat fouling risk for spreading NIS can be considered high. In contrast to previous work in San Francisco Bay and Southern California, we found that Puget Sound boaters made fewer overnight trips to more destinations. While these comparisons are preliminary, it appears more places are connected by boating traffic in Puget Sound (large network of nodes), but the frequency of transits between most nodes is low. A study combining boater data and in-water sampling of boats’ submerged surfaces would be needed to further evaluate propagule transfers within the system.
A simple threshold for identifying biofouling risks, supported by data, would be highly desirable for biofouling management, but it is unlikely to materialize. Of course, a single-factor threshold could be adopted to manage risk and could be highly protective. Proxy thresholds (using behavior data) can also be ignored and direct biological thresholds adopted, as in Western Australia and the Northwestern Hawaiian Islands (section 3 of this report). However, it is unlikely that such approaches could be adopted to tackle regular in-service shipping, recreational boating, and fishing traffic in the US.
Furthermore, the predictive power of maintenance or behavior factors related to biofouling accumulation appears to be weak and identifying a subset of thresholds from a relatively limited number of factors has proven elusive thus far, even among recent studies with large sample sizes.

Puget Sound biofouling introductions and vectors
57
Inglis et al (2010) examined at least 12 different factors that contribute to biofouling on ships and boats and highlighted the complexity involved in such a multi-factorial phenomenon. While some patterns emerged that ranked certain factors higher than others, the predictive power of models was low. It was not surprising, therefore, that analyses of our ship sampling data from recent years (n=73) did not yield clear thresholds that could be unarguably adopted for identifying risk.
Despite the variability in the data, there are sound biological reasons to examine semi-quantitative approaches to risk analysis for biofouling. Inglis et al (2010) noted in particular how suites of factors appeared to be effective for evaluating risk for different vessel categories; namely maintenance factors were more useful for commercial vessels, while voyage histories appeared more important for recreational boats. Certainly, the case for retaining a separation of vessel sectors (commercial vs recreational/fishing) for risk analyses and management proposals appears to make intuitive, as well as science-based, sense.
The thresholds for duration since dry docking (or antifouling paint age) in the Inglis et al. (2010) study showed remarkable consistency with those of Sylvester et al (2011); two different studies with a combined sample size of 310 ships recognized 400 days, 375 days, and 427 days as dry dock duration thresholds for New Zealand, Halifax, and Vancouver, respectively. However, the timelines suggested by these studies are also notable for how short they appear to be (on average just 1.1 years) relative to the typical recommended life span of antifouling paints (3-5 years). It is likely that the effect of niche areas as biofouling hotspots is responsible for this discrepancy (i.e. antifouling and foul-release paints probably work well on hull surfaces under normal conditions after 1.1 years, but niche area fouling begins to accumulate after this duration).
About half of recreational boat owners we surveyed indicated that they clean their boats between applications of anti-fouling paint; half of these reported doing so in-water in violation of state regulations. The average time since last cleaning was seven months, significantly longer than the 2.2 months reported by California boaters in similar surveys (Ashton et al. 2012); however, average paint age was very similar between Puget Sound (26 months) and California boaters (23 months). When both paint age and manual cleaning are considered (using whichever was most recent) boaters in Puget Sound had undertaken steps to reduce antifouling within the previous 12 months (on average) compared to within the previous 6 months in California.
We have previously found that there is a correlation between biofouling and duration-since-dry-docking for certain ship types (Davidson et al., 2009), but in this study our combined data set (several ship types) did not reveal such a relationship. Also, the effect of outlier behavior (e.g. long stationary periods, unusually slow typical speeds within a vessel type) often explains individual cases of biofouling accumulation that was not expected based on dry-docking duration. Such an outlier identifying approach could be used to identify biofouling risk.
The cost of using a biologically-based risk approach, requiring the taxonomic identification of species collected from vessels, is likely to be prohibitive for cost and practicality reasons. For this reason, behavioral thresholds are attractive management tools and measures of biofouling extent (abundance or percent cover) are adopted to evaluate biofouling because these measurements can be taken relatively quickly (compared to species identities).
Given the issues of vessel biofouling variability and the difficulty in identifying clear-cut risk factors, the consensus view that appears to be emerging from the scientific and policy literature is that niche areas, maintenance schedules (duration since antifouling applications and in-water cleaning), and stationary periods are the most useful factors to evaluate vessel biofouling risk or to trigger in-water surveys if direct evaluations of biofouling (i.e. biological thresholds) are not going to be used as the basis of policy frameworks.

Puget Sound biofouling introductions and vectors
58
SECTION 3: Biofouling policy, management, and in-water cleaning technology review
An increasing awareness of environmental, economic, social, and cultural values derived from the sea has prompted policy developments in the arena of marine biosecurity to prevent the transfer of NIS (Hewitt & Campbell, 2007). This emergence of ocean governance to prevent NIS introductions lags behind its terrestrial equivalents, but has accelerated in recent years such that ballast water management is now a prominent marine vector policy with global reach, enforced by countries and states and adopted (though not yet ratified) by the International Maritime Organization (IMO). The vessel biofouling vector is just starting to receive similar attention due to its growing acceptance in the scientific literature as a significant contributor to NIS invasions around the world (Ruiz et al., 2000; Gollasch, 2006; Hewitt & Campbell, 2010). The result is that vessel biofouling has received increased research and management attention over the last decade, and science-based biofouling management development is a priority for several regions, including Puget Sound (Pleus, 2012). This section of the report provides reviews and evaluations of biofouling policies and management programs around the world, in-water cleaning technology, and potential policy and management steps that could be undertaken for Puget Sound. We briefly outline the methods and goals for each section and provide the bulk of the evaluations in the Results section. The discussion summarizes the main findings and their context for Puget Sound biofouling policies and management.
METHODS We conducted a series of reviews and evaluations of (a) biofouling policies around the world, (b) in-water cleaning technologies and methods, (c) the extent of in-water cleaning services in Puget Sound, and (d) the approach that Washington may consider for policymaking, including an initial stakeholder list that could populate an advisory meeting.
Biofouling policy review: We evaluated and tabulated the major developments in biofouling policymaking by international, national, state, and regional entities. The major entities involved in biofouling policy are the International Maritime Organization (IMO), the US Federal Government, Australia, New Zealand, Pacific Coast states in the US (California, Oregon, Hawaii, and Washington), Western Australia, Northern Territory (particularly Darwin, Australia), and the Papahānaumokuākea Marine National Monument (NW Hawaiian Islands). Policy in British Columbia is governed by Transport Canada (federal) and their policy approach is pursued through the IMO. Therefore, the current IMO status is a reflection of BC’s current approach and BC does not have biofouling vector regulations at present.
In-water cleaning review and capacity in Puget Sound: We evaluated in-water cleaning technology by synthesizing the main findings in a recent report on the topic for the Australian Department of Agriculture, Fisheries & Forestry (DAFF) by Floerl et al. (2010). We also searched for new information or any updates that may have occurred since this review, including discussions with the authors (Oliver Floerl). We examined the availability of in-water cleaning operations in Puget Sound using reports, website searches, and email and phone interviews with marine service providers in Puget Sound.
Options and stakeholders for Washington biofouling policymaking: We evaluated the process of policymaking adopted by California, Hawaii, and elsewhere as a potential template for Washington State to follow should it decide to pursue biofouling management guidelines or regulations. This included creating an initial list of stakeholders that could populate a stakeholder meeting at the outset of such a process.

Puget Sound biofouling introductions and vectors
59
RESULTS
Biofouling policy review National and international Biofouling policies to reduce transfers of species on submerged vessel surfaces have been adopted or are under development at international, national, state, and regional levels. At national and international levels, New Zealand, Australia, and the International Maritime Organization have developed explicit biofouling policies (Table 3.1). In the United States, the Coast Guard has incorporated biofouling measures into its ballast water regulations. New Zealand and Australia have been global leaders in developing and establishing biofouling policies to minimize hull-mediated introductions within broader biosecurity mandates. New Zealand, in particular, may have the most comprehensive legislative and agency biosecurity infrastructure in the world with specific legislation that focuses on the prevention of intentional and unintentional introductions of marine species (Hewitt & Campbell, 2007). The drivers of this comprehensive approach in New Zealand include the large size of that country’s EEZ (surrounding ocean exclusive economic zone), high levels of species endemicity within the EEZ, the economic value of the EEZ, the reliance on international shipping for trade, and the threat that non-native species pose to the economic, environmental, social, and cultural values of native species and marine ecosystems to New Zealanders (Hewitt et al., 2004). Their approach to biofouling management has included significant international outreach in the policy realm because the small size of their country relative to the international scale of shipping requires greater awareness and action outside of New Zealand to have the desired (and a broader) effect. The current policy for biofouling in New Zealand include directives to keep submerged surfaces “free of excessive growth” of marine organisms and that inspectors have the authority to demand action in cases of “severe biosecurity risks” (Ministry for Primary Industries, 2010). Neither “excessive growth” nor “severe risks” are defined, but Biosecurity New Zealand has a broad remit to manage biofouling that they consider unacceptable. Their current rules also require vessels to maintain antifouling coatings in good condition and have them renewed prior to their expiration dates (Table 3.1). As of late 2013, New Zealand Biosecurity is intending to release an import health standard (IHS) for biofouling, which will provide more detailed requirements for vessels to manage biofouling prior to entry into New Zealand waters. It is anticipated that these new rules will be voluntary for an initial four-year period during which evaluations will occur, with the possibility of mandatory regulations thereafter. In Australia, biofouling management authority is derived from the Quarantine Act (1906) and the Biological Control Act (1984) to manage invasion risks. Australia’s approach is species-based and risk-based, and the invasion of Darwin by the black-striped mussel (Mytilopsis sallei; Field, 1999) prompted the creation of the National System for the Prevention and Management of Marine Pest Incursions. However, since species-based risk analyses revealed that source locations of unwanted pests in Australia included every bioregion in the world, the development of biofouling policies has looked more akin to vector-based management underpinned by species-based policy.

Table 3.1. National and international policies on biofouling management
Territory United States Australia New Zealand Global
Governing body US Coast Guard & US Environmental Protection Agency
Department of Agriculture, Fisheries & Forestry (DAFF)
Biosecurity New Zealand (Ministry of Primary Industries; Ministry of Agriculture & Fisheries)
International Maritime Organization
Governing documents or regulations pertaining to marine invasions, biosecurity & biofouling
Code of Federal Regulations, Title 33, Part 151.2050 Additional Requirements – nonindigenous species reduction practices (revision entered into force in 2012) EPA Vessel General Permit
Quarantine Act, 1906
Biological Control Act, 1984
National Biofouling Management Guidelines, 2009
Proposed Australian Biofouling Management Requirements, 2011
Biosecurity Act 1993 & subsequent amendments
Hazardous Substances and New Organisms Act 1996
Requirements for vessels arriving in New Zealand (2010; revised 2013)
Proposed biofouling regulations (not yet released)
International Convention on the Control of Harmful Anti-fouling Systems on Ships 2001, 2008
Marine Environmental Protection Committee (MEPC) 62 Annex 26, 2011
Biofouling-related programs
US Coast Guard Environmental Standards Division EPA Vessel General Permit Program
National System for the Prevention and Management of Marine Pest Incursions; Australian and New Zealand Environment & Conservation Council (ANZECC) Codes of Practice
New Zealand Marine Biosecurity Program; Australian and New Zealand Environment & Conservation Council (ANZECC) Codes of Practice
Marine Environmental Protection Committee (MEPC); Sub-committee on Bulk Liquids and Gases (BLG)
Biofouling guidelines or requirements
Upon retrieval, rinse anchors and anchor chains to remove organisms and sediment
Remove fouling organisms from the vessel's hull, piping, and tanks on a regular basis and dispose of any removed substances in accordance with local, state and Federal regulations.
Maintain a management plan that includes “detailed fouling maintenance and sediment removal procedures”
Ships’ submerged surfaces should be coated appropriately (antifouling)
Sea chests should be coated and have operational MGPS
Pipes and grates should be rounded and coated
Niches should be coated appropriately
Unpainted niches should be regularly inspected and maintained
Internal sea-water systems should have MGPS
Vessel hulls, including recesses around rudders and water intake/outlets (sea-chests), should be kept free from excessive growth of seaweed, barnacles, shellfish and other encrusting marine life.
Antifouling coatings should be in good condition and renewed before the expiration of the paint manufacturers’ recommended replacement period.
An inspector may direct specific action be taken for a vessel that is considered to pose a severe biosecurity risk due to
Ships should retain a biofouling management plan and record book
Ships should use appropriate anti-fouling systems on submerged surfaces, including niche areas
Ships should undergo periodic underwater inspections, with cleaning and maintenance as appropriate
The design and construction of ships should consider the most

Puget Sound biofouling introductions and vectors
61
Territory United States Australia New Zealand Global
Submit a VGP, including information on last dry dock, anti-fouling paints, and intent to in-water clean
the marine life carried on its hull. appropriate configurations to minimize biofouling and allow access for maintenance
Current status of biofouling regulations
Mandatory The first three items (above) referring to biofouling in the code of federal regulation are mandatory but are largely undefined and there is no information on enforcement. The VGP is also mandatory
Voluntary The current approach (items listed above) follows the Voluntary National Biofouling Management Guidelines (2009) Proposed Mandatory regulations (2011) await ratification at political levels and these recommended regulations include a risk-based management scheme with management action and associated costs imposed on high/extreme risk vessels
Proposed New Zealand Biosecurity is working on new rule-making documents, with an expected release date in early 2014. The regulations are likely to be voluntary for at least a four-year period, during which evaluations of efficacy will be conducted*
Mandatory Application or re-application of organotin-based coatings is prohibited (Note: this is not a biofouling measure - it refers more directly to marine pollution from toxic paints – but it has implications for biofouling transfers) Voluntary 2011 Guidelines for the control and management of ships’ biofouling to minimize the transfer of invasive aquatic species
In-water cleaning
There is no specific reference to in-water cleaning in the Code of Federal Regulations, but this requirement probably encompasses in-water cleaning: Remove fouling organisms from the vessel's hull, piping, and tanks on a regular basis and dispose of any removed substances in accordance with local, State and Federal regulations
1. The ANZECC code on in-water cleaning has been updated during a recent review of the policy.
2. There are 9 guidelines for in-water cleaning in the new ‘Antifouling and in-water cleaning guidelines’ adopted by Australia and New Zealand.
3. Included among the guidelines are an acknowledgment that in-water cleaning is a useful tool for biosecurity but should not be adopted in lieu of earlier antifouling application and maintenance
5. The ANZECC code on in-water cleaning has been updated during a recent review of the policy.
6. There are 9 guidelines for in-water cleaning in the new ‘Antifouling and in-water cleaning guidelines’ adopted by Australia and New Zealand.
7. Included among the guidelines are an acknowledgment that in-water cleaning is a useful tool for biosecurity but should not be adopted in lieu of earlier antifouling application and
N/A

Puget Sound biofouling introductions and vectors
62
Territory United States Australia New Zealand Global The VGP program does incorporate in-water cleaning issues through the National Pollutant Discharge Elimination System (NPDES) General Permits for Discharges Incidental to the Normal Operation of a Vessel
4. Also included are issues related to local/regional regulations governing pollution discharge and the use of capture technology, and the cessation of activities if NIS are recognized on a vessel being cleaned.
maintenance Also included are issues related to local/regional regulations governing pollution discharge and the use of capture technology, and the cessation of activities if NIS are recognized on a vessel being cleaned.
MGPS = Marine Growth Protection System

Puget Sound biofouling introductions and vectors
63
Currently, Australia has voluntary national biofouling guidelines (Table 3.1) for ships and boats. These include provisions for appropriate antifouling coatings on hull surfaces and management of niche areas. As in the case of New Zealand, Australia’s Department of Agriculture, Fisheries & Forestry (DAFF) has developed new proposals for biofouling management but these are currently awaiting adoption by political leaders in Australia’s government and there is uncertainty about the fate of these proposals. In the United States, the Code of Federal Regulations (33 CFR Part 151.2050), issued and updated by the Coast Guard for managing ballast water, includes some provisions for biofouling on commercials vessels. There are three basic components to biofouling management in the mandatory regulations: 1) cleaning and rinsing anchors and chains upon retrieval; 2) remove biofouling from hulls, pipes and tanks on a regular basis; and 3) include detailed fouling maintenance and sediment removal procedures in the ship’s ballast water management plan. This third item is the most recent addition to the Coast Guard’s federal regulations, having been added to the Code revisions in 2012. Although the regulations are mandatory, items such as “regular basis” for cleaning are not defined. Nonetheless, this provision still provided the Coast Guard with authority to manage excessive biofouling transfers associated with obsolete ship movements throughout the US (Takata et al., 2006; Davidson et al., 2008). The IMO adopted voluntary guidelines for biofouling management in 2011, while the international convention on the control of harmful antifouling systems (the ban on tributyl-tin based paints) has been in place since 2008. The biofouling guidelines recommend that each ship maintain a biofouling management plan and record book on board, that appropriate antifouling coatings be used on hulls and niche areas, and that ships undertake periodic in-water inspections and take action to reduce biofouling as necessary (Table 3.1). It also included provisions that exist in Australia’s biofouling guidelines that best practices for new ship construction or modification use designs that promote biofouling minimization such as rounded grates and niche areas that are accessible to cleaning. Pacific states California, Oregon, Washington, and Hawaii have been the most active states in the US with regard to biofouling management. There are other states that have adopted hull fouling language modeled after federal regulations (above), including Maryland and Virginia (Showalter & Savarese, 2005). In addition, some states have biofouling-related rules to manage overland boating to prevent the spread of pest species like zebra and quagga mussels and aquatic plants (e.g. Minnesota, Wisconsin, Utah). However, to our knowledge, only the Pacific Coast states have been engaged in independent biofouling policymaking efforts regarding ocean-going ships. California, in particular, has been a national leader on the issue through the California State Lands Commission Marine Invasive Species Program (CSLC MISP). California has mandatory regulations in place at present, requiring vessels to remove biofouling at regular defined intervals (Table 3.2) and requiring the submission of a hull husbandry reporting form. The CSLC is pursuing new mandatory regulations in 2013/14 and the draft language of those requirements may be released for public comment in the coming months. The other Pacific states are monitoring biofouling management and in the process of data gathering and information sharing, with the possibility of policy development in 2014 (Table 3.2). Hawaii’s Department of Land and Natural Resources (DLNR) is issuing questionnaires to shippers and boaters to better understand traffic patterns and hull husbandry. This effort will continue throughout 2013 and early 2014 with the goal of reporting results and proposing policies for public comment in 2014. Oregon’s Department of Environmental Quality is proposing an update to existing ballast water

Puget Sound biofouling introductions and vectors
64
authority to encompass biofouling management of ships. The present report is a component of the Washington Department of Fish & Wildlife’s exploration of biofouling policy. Biofouling policy in other regions Other notable biofouling policy making has occurred in Australia’s Northern Territory, Western Australia, and the Papahānaumokuākea Marine National Monument (PMNM) of the NW Hawaiian Islands (Table 3.3). The rules in the Northern Territory pertain to recreational boaters planning to arrive in Darwin; they must submit a completed questionnaire and their vessel may be inspected or treated depending on the risk assessment from the questionnaire. In addition, internal sea-water systems must be treated with bleach solution for 14 hours prior to entry (or upon entry). The most stringent (protective) biofouling regulations in the world, at present, appear to be in place in Western Australia and the PNMN (Table 3.3). The Department of Fisheries in Western Australia has developed biofouling policies that require (a) logs of vessel activities since the most recent dry-docking, (b) copies of in-water or dry-docking reports and Introduced Marine Pest Inspection (IMP) reports (c) IMP inspections should be carried out within 7 days of departure for Western Australia, (d) evidence of Marine Growth Protection System installation and use, and (e) copies of the most recent antifouling certificates. One effect of this policy has been that ships have borne the cost of IMP inspections outside of Australia that are conducted by licensed Australian service providers (Coutts, 2012). Similarly, the NW Hawaiian Islands (PMNM) have an entry permit system in place that requires evidence or inspection to certify that a vessel has no detectable macro algae or macro fauna on its submerged surfaces (PMNM, 2009).

Table 3.2. US state policies on biofouling management
Territory Washington California Oregon Hawaii
Governing body Washington Department of Fish & Wildlife (WDFW) and Department of Ecology (ECY)
California State Lands Commission (CSLC)
Department of Environmental Quality (DEQ)
Department of Land & Natural Resources (DLNR)
Governing document or regulation
Revised Code of Washington (RCW) 77.15.253 Unlawful use of prohibited aquatic animal species, which also prohibits the release of aquatic animal species classified as “regulated” and “unlisted”
California Code of Regulations, Title 2, Division 3, Chapter 1, Article 4.8
None, DEQ has authority to regulate ballast water and the biofouling issue is monitored by the Ballast Water Program
Act 134, Session of Laws 2000, Chapter 187A Part III, Hawaii Revised Statutes (Alien Aquatic Organisms)
Related programs
WDFW Aquatic Invasive Species Program; WDFW Ballast Water Program; ECY Vessel General Permit program; WDFW Ballast Water Work Group; and Washington State Invasive Species Council
Marine Invasive Species Program; Biofouling Technical Advisory Group (TAG)
Ballast Water Management Program; Oregon Task Force on Shipping Transport of Aquatic Invasive Species (STAIS)
Ballast Water and Hull Fouling Program; Alien Aquatic Organism Task Force (AAOTF)
Biofouling requirements
Case-by-case interpretation of RCW 77.15.253
Regulations pertain to vessels >300 gross registered tons capable of carrying ballast water.
Biofouling must be removed regularly, defined as: No longer than the expiration or extension date of the ship’s safety construction certificate OR No longer than the expiration date of the ship’s US Coast Guard certificate of inspection OR No longer than 60 months
None at present.
DLNR is the designated agency to prevent alien aquatic organisms through regulation of ballast water and hull fouling
DLNR has the authority to adopt rules, including penalties for ballast and hull fouling
No specific biofouling requirements exist at present
Questionnaires have been developed and approved to gather data throughout 2013 on vessel biofouling for

Puget Sound biofouling introductions and vectors
66
Territory Washington California Oregon Hawaii
since the ship’s most recent dry docking
Vessels must submit a Hull Husbandry Reporting Form each calendar year if they operate in California during that year
commercial and recreational vessels.
Current status
Proposed This project and report ‘Assessment of Biofouling Threats to Puget Sound’ (this project) is underway and will report on invasion history and current status of biofouling and provide insight on biofouling management strategies.
Mandatory The existing biofouling requirements are mandatory Proposed The CSLC is working on new rule-making documents, with an expected release date in 2013 for public comment. These mandatory regulations include presumed compliance for hull surfaces and niche areas with appropriate and ‘in-date’ coatings and MGPS with biofouling standards for vessels that fall outside of these presumptions. There are also proposed requirements for vessels with extended residency periods and record keeping and reporting.
Proposed Update the existing DEQ authority on ballast water (OR 783.620) to include management of biofouling of commercial vessels Amend existing reporting requirements to include mandatory annual reporting of hull maintenance and biofouling-related activities. Establish regulations that enable DEQ to target high-risk vessels for management action.
Proposed Hawaii is conducting a data gathering exercise to determine the status quo for vessel biofouling in the state and to identify risky behavior/vessels (commercial vessels and recreational boats). The results of fact finding and proposed regulations will follow (document release in 2014).
In-water cleaning
In-water cleaning of hulls coated with anti-fouling paint is prohibited in the state by ECY
In-water cleaning of foul-release and other ‘hard’
In-water cleaning of propellers is permitted in California
In-water cleaning of non-toxic foul-release coatings is permitted in California
In-water cleaning of hulls coated with anti-fouling paint is prohibited in the state
In-water cleaning governed by the Hawaii Department of Health for toxicity/biocide concerns. Hawaii is conducting a data gathering exercise to establish the

Puget Sound biofouling introductions and vectors
67
Territory Washington California Oregon Hawaii
non-toxic coatings is permitted on case-by-case basis
In-water cleaning of surfaces coated with anti-fouling paint (toxic) is allowed only in areas that are not designated as pollution impaired
status quo for in-water cleaning in state waters.
Table 3.3. Biofouling management policies in other regions of the world.
Territory Western Australia Northern Territory
(Australia)
Papahānaumokuākea Marine National Monument
(PMNM; Northwestern Hawaiian Islands)
Governing body
Department of Fisheries Department of Primary Industry & Fisheries (DPIF)
National Oceanic & Atmospheric Administration (NOAA); US Fish & Wildlife Service (USFWS); State of Hawaii DLNR
Governing document or regulation
Environmental Protection Act 1986; Fish Resource Management Act 1994 (FRMA) Fish Resources Management Regulations 1995 (FRMR) r176(1) Western Australia marine pest management guidelines
Fisheries Act 2011 Fisheries Regulations 2012
Presidential Proclamation 8031 2006; Code of Federal Regulations, Title 50, Part 404; PNMN BMP-001 Marine Alien Species Inspection Standards for Maritime Vessels 2009
Related Programs Port Authorities Act 1999; Port Authorities regulations 2001
DPIF Aquatic Biosecurity Unit
Biofouling Requirements
Ships must provide the following prior to arrival in Western Australia to be considered ‘clean’:
Log of operational history since last antifouling coating
All yachts seeking entry to Darwin marinas must:
complete a questionnaire before or upon arrival
allow in-water inspections if deemed necessary
It is unlawful to introduce or otherwise release an introduced species from within or into the Monument
All vessels wishing to enter the Monument must obtain

Puget Sound biofouling introductions and vectors
68
Territory Western Australia Northern Territory
(Australia)
Papahānaumokuākea Marine National Monument
(PMNM; Northwestern Hawaiian Islands)
application or Introduced Marine Pest (IMP) inspection
The most recent in-water cleaning or dry docking report, and the most recent IMP inspection report (vessels should depart for WA within seven days of the most recent antifouling coating application or IMP inspection)
Evidence of active MGPS or suitable manual treatments of seawater intakes, pipe-works, sea chests and sea strainers.
The most recent antifouling coating certificate or receipts stating the coating type, volume purchased, vessel name, and date of application
undergo immediate treatment (in slipways) if deemed necessary
have internal sea-water systems treated using 1% detergent for 14 hours
an entry permit; part of the permitting process includes inspection for marine alien species (including vessel hull, tender, gear, ballast water, and rat surveys).
There is strict control over entry to the monument and strict standards for biofouling (no macro-algae and no macro-invertebrate biofouling)
Vessel hull, tenders, gear, and ballast water must be certified free of alien and invasive species prior to departure for the Monument
Current status
The requirements listed above are mandatory. The Department of Fisheries has authority to manage biofouling for international, interstate, and intrastate vessel movements in Western Australia
The requirements listed above are mandatory for boats wishing to enter Darwin marinas. Only vessels that require inspection or cleaning outside of normal hours (and outside of one location) may incur a fee
The requirements for entry to the Monument are mandatory and strictly enforced
In-water cleaning
8. In-water cleaning is governed by Australian rules (table above) that has replaced the ANZECC code.
In-water cleaning is governed by Australian rules (table above) that has replaced the ANZECC code.
In-water cleaning of vessels is prohibited in the Monument

Puget Sound biofouling introductions & vectors
69
In-water cleaning review and capacity in Puget Sound In-water cleaning and regulations in Washington Most vessels have coatings (paints) applied to their submerged surfaces, which are used to reduce the growth of marine organisms on in-water surfaces. The most widely used coatings contain chemicals, such as copper, which are toxic to many marine species and discourage settlement and growth of biofouling. Antifouling (soft or ablative) paints are designed to slowly wear away, revealing fresh top layers of anti-fouling compounds (usually copper alone or in combination with other chemicals) to the surface. The continual renewal of the toxic surface layer prolongs the efficacy of the coating and prevents biofouling accumulation if used appropriately. There is a wide variety of toxin-containing coatings that are classed as ablative but deliver biocides in different ways, including contact leaching, soluble matrix, controlled depletion polymer (CDP), and self-polishing copolymer (SPC). The newer generations of SPC and hybrid coatings release toxins (often copper) at appropriate speeds, which is more efficient than older versions because there is little need to in-water clean to maintain the coating. Foul-release (hard) coatings, which include among them silicon-based polymer paints, operate by creating a smooth surface on vessels that allows organisms to adhere but does not provide sufficient surface tension for them to remain on the vessel once it moves. This discourages biofouling accumulation by causing species to slough off when the boat is underway. A third broad category of coating includes hard paints with no antifouling or foul-release properties that require regular in-water cleaning for biofouling maintenance. In an ideal scenario, coatings would prevent attachment of biofouling organisms to submerged surfaces and not release toxins into the environment. However, no coating currently available performs to this ideal and a balance is required to determine an acceptable level of toxicity or acceptable level of intervention (in-water cleaning) with sufficient deterrence of biofouling accumulation. The IMO treaty on harmful antifouling systems, for instance, prohibits the use of tin-based paints (see section above, Table 3.1) such that international agreement is in place that prohibits certain levels of toxicity. For the tin-free coatings that remain on the market, their effectiveness varies with a number of factors, including the age of the paint, frequency of boat use, and typical travel speed. Most paint types perform optimally soon after application until approximately 18 months after application, although the effective lifespan of paints (provided by manufacturers) generally ranges from three to five years if vessels are used appropriately. The longevity of coating efficacy can be supplemented if accumulated fouling is removed between painting intervals, although care must be taken that excessive damage to coatings does not occur during cleaning. As the cost of haul-out or dry docking is high, and dry dock and haul-out facility availability can be limiting, boaters and shippers avail of in-water cleaning to optimize their paint’s antifouling properties and prolong its effective duration. Washington State manages in-water cleaning through the Department of Ecology (WDOE) and the Department of Fish and Wildlife (WDFW). WDOE addresses state water quality issues and WDFW addresses species possession, transport and release issues. The state does not allow in-water cleaning of boat hulls painted with toxic, soft paint (ablative) due to water quality concerns. Although anti-fouling paint is not specifically addressed, release of toxins such as copper into a watershed is prohibited under state codes and rules enforced by the state’s Department of Ecology (i.e., RCW 90.48.080, WAC 173-201A, http://apps.leg.wa.gov/wac/default.aspx?cite=173-201A). Cleaning of boats with hard or non-toxic paints is not prohibited, however, though it is estimated that most vessels, both recreational and commercial, use copper-based ablative paints. The state requires that boats in the region with

Puget Sound biofouling introductions & vectors
70
these paint-types must be hauled out of water for cleaning. Commercial boat-cleaning facilities must have approved collection and disposal systems for any debris or run-off generated by cleaning. Boat owners who work on their own boats out of the water must also have a method to collect and properly dispose of materials. The state has been active, along with boating groups and environmental organizations, in educating the boating public on this rule (Fig. 3.1, flyer). A website maintained by the state (http://www.ecy.wa.gov/programs/wq/nonpoint/CleanBoating/hull.html) suggests -boaters use hard or epoxy coatings -haul out and use catchment basins at marinas -haul out and work at home, use tarps and vacuum sanders to catch debris -use nontoxic, biodegradable cleaning products In addition, Washington State law does not allow the possession, transport, or release of NIS classified as prohibited aquatic animal species, or the release of NIS classified as regulated or unlisted aquatic animals species (RCW 77.15.253, apps.leg.was.gov/rcw/default.aspx?cite=77.15.253). Therefore, in-water cleaning may be limited on a case-by-case basis to where the vessel can demonstrate that biofouling: are local species (vessel did not come from out of state or another state port with prohibited species); does not exceed micro-fouling NIS (e.g. “slime” and “sea grass”); that macro-fouling NIS are dead; or that any live macro-fouling NIS cannot be released to the environment.
Figure 3.1. Washington State’s flyer on hull cleaning.

Puget Sound biofouling introductions & vectors
71
An estimated 50,000 boats are permanently moored in Puget Sound (Washington State, 2009), but data are lacking to estimate how many of these may engage in either legal or illegal in-water cleaning. Many of the sources with whom we spoke (Appendix 4) indicated that very little in-water cleaning is currently being done in the state because of the clean-water regulations. Some marinas do not allow in-water cleaning of any type. Several sources we interviewed indicated that many commercial agencies avoid doing any in-water cleaning because the rules about what can and can’t be cleaned are not clear to them. This cautious approach is likely due to the strict regulations on discharges from boatyards engaged in cleaning out-of-water, which can lead to substantial fines if violated. Others we interviewed indicated that recreational boat owners or small, independent commercial divers, may do some in-water cleaning “under the radar,” especially in cases where fouling is light enough that it can be removed with soft brushes and does not release of large visible plume. This appeared to be confirmed in our boater questionnaires (Section 2, above). The commercial dive operators we talked with do not conduct in-water cleaning of painted surfaces in Puget Sound (some provide propeller cleaning, but propellers are typically unpainted). Fishing vessels and other locally operating vessels such as ferries tend to clean only once a year and do so at dry docks or haul-out facilities. The only evidence of in-water cleaning of large commercial vessels, such as cargo ships was derived from California’s hull husbandry reporting program. In addition to the WDFW-sanctioned cleaning of cruise ships using the Hydrex Ecospeed hard paint system (A. Pleus, pers. Comm.), hull husbandry reporting in California suggested seven other instances of in-water cleaning have occurred in Puget Sound between 2007 and 2013 in Seattle (x3), Port Angeles (x3), and Tacoma (x1). Several of these instances involved propeller polishing or the cleaning of non-toxic foul-release coatings, both of which appear to fall within the state regulatory framework. However, some reports indicated niche area (e.g. thruster) cleaning which may have involved in-water cleaning of toxin-containing anti-fouling coatings. State legislation passed in 2011 will ban the use of copper anti-fouling paints on recreational boats under 65 feet by 2020. Boater groups like the Clean Boating Foundation are engaged in educating boaters about the new law and providing information on alternative paint types. The percentage of vessels currently using non-copper paint types is likely quite low. In the case of the Hydrex Ecospeed coating, at least one commercial vessel, a cruise ship owned by the Disney Cruise Line that operates in Puget Sound, has been permitted to in-water clean in the Port of Seattle (during the 2013 cruise season). WDFW allowed in-water cleaning in this one-time situation provided that the vessel was cleaned at least four weeks prior to entry into state waters so that only micro-fouling species would be likely, that cleaning occurred on an agreed-upon schedule, and that the cruise line document the effectiveness of frequent cleaning for maintaining a biofouling-free vessel. The outcome of this 2013 test-case is unknown at present. It appears that Hydrex (the paint manufacturers) also conducted the in-water cleaning. Review of current systems for in-water cleaning and risks In-water cleaning can prolong the life of antifouling paint and optimize vessel performance. It can also reduce the transfer of non-native species if locally sourced biofouling is removed into the water bodies from which it came, or is disposed of on land, before a vessel begins a voyage. However, in-water cleaning has the potential to introduce or spread NIS in cases where vessels arrive from elsewhere: while some organisms may die in the cleaning progress, others may survive removal, some may release propagules during cleaning, and some species can survive release from a hull or re-grow from small fragments. Thus, improperly managed in-water cleaning can increase the risk of invasion by assisting in the propagule release from vessels into surrounding habitats. In addition, many cleaning methods release some amount of biocides from biocidal coatings into the water. Here, we review in-water

Puget Sound biofouling introductions & vectors
72
cleaning methods that are either currently in commercial use or in development, and the risk of release of both NIS and toxic compounds associated with each. Floerl et al. (2010) provided an excellent review of existing technologies for in-water cleaning for Australia’s Department of Agriculture, Fisheries and Forestry (DAFF). Among the methods they detailed were several small-scale new technologies which showed some promise for meeting the Australian government’s goals of reducing both the release of toxic compounds and the spread of NIS. We summarize and update their report below. Floerl and colleagues recognized two broad categories of in-water cleaning technologies; (a) those that remove accumulated biofouling and (b) those that kill biofouling, leaving it to drop off naturally (or not) when the vessel is underway. Technologies that remove biofouling include: 1. Scrubbing by diver(s) using hand tools 2. Scrubbing by rotating brush systems, supplemented in some cases by pressure cleaning, operated by
divers or ROVs. 3. Underwater cutting and vacuum devices, operated by divers 4. Underwater pressure cleaning, operated by divers or ROV The first two have the longest history of use and are the most widely available technologies. Cleaning by hand is appropriate for small vessels, and can be relatively inexpensive as it can be done by the boat owners themselves or by a single commercial diver with minimal gear. Mechanical brushing is appropriate for larger, commercial vessels and costs will vary with vessel size and the complexity of the deployment. There are several systems employing mechanical brushing that are in use or under development. Many of these are supplemented with hand brushing or cleaning using water jets operated by divers for hard-to-reach areas. These systems do not have the built-in capacity to contain and/or process debris, but there are several technologies that integrate biofouling removal and containment into their cleaning systems. Examples reviewed by Floerl et al. are the US Navy’s Automated Hull Maintenance Vehicle (AHMV) and Advanced Hull Cleaning System (AHCS), the latter of which includes a water-treatment system to remove toxins released by cleaning; submersible cleaning and maintenance platforms (SCAMPs, such as those developed by Seaward Marine Services); Hull Identification System for Marine Autonomous Robotics (HISMAR, being developed under government contract in the UK), and the Mini-Pamper (developed by UMC International), which has containment ability on its diver-held single brush unit. Small-scale trials of underwater cutting and vacuum devices were also reviewed by Floerl et al. These methods were developed specifically to remove an invasive tunicate from a barge and the seafloor below and would not be effective on hard fouling. There is an in-water cleaning and removal technology being tested in California for its biofouling and toxin removal capability (C. Scianni pers. comm.). The system uses a conventional rotating brush system with a series of filters that capture heavy-metals and biofouling organisms. The report of that trial may be released sometime in early 2014. Underwater pressure cleaning using water jets is another method in use. Floerl et al. noted that one such company, the Italian Cavi-Jet, was developing a capture method for solid debris removed by its high-pressure system. A second company, the Norwegian CleanHull Ltd., makes a remotely operated

Puget Sound biofouling introductions & vectors
73
vehicle called CleanROV, which uses high-pressure water blasts to clean hulls. It is specifically designed to remove light fouling and captures removed debris. Bohlander (2009) and Floerl et al. (2010), and references contained therein provide further details on the above four types of cleaning methods. In summary, they found:
These methods range in their effectiveness in removing biofouling, being most effective on soft fouling and on flat surfaces, and least effective in heterogeneous “niche” areas. Mechanical brushing usually needs to be supplemented by hand brushing and/or water-pressure cleaning in these areas.
With the exception of vacuum tools, the cleaning methods tend to damage paint surfaces, particularly soft paint (ablative or sloughing) types, thus releasing toxins to the environment. Paint damage can be minimized by adjusting brush type (or water pressure), using the least abrasive possible for a given level of fouling (i.e., USN recommendations, http://www.supsalv.org/webApp/AppBrush/AppBrushes.asp)
The methods range in their ability to capture biofouling and paint residue, although technologies are improving
Methods that capture and remove debris are not widely available for commercial use The second major classification of in-water cleaning methods reviewed by Floerl et al. (2010) includes those that are designed to kill but not remove biofouling. These methods can be grouped into two major categories: 1. Various methods for applying heat or hot water to kill organisms
Hot water boxes: Two examples are described by Floerl et al., one a specific application to remove a non-native kelp from a sunken vessel, and the other a test of a mechanized method for hull cleaning designed for commercial use. In both cases, boxes that can be sealed tightly to the submerged surface to be treated were used to contain and heat water to a level lethal to marine organisms. The boxes are moved along the submerged surface after a sufficient dose time on the treated area, until the whole surface has been treated. Divers can use cutting torches and other handheld devices to heat water around areas with more three-dimensional relief that cannot effectively be sealed by the box.
Steam: Steam sterilization generated by a land-based industrial steam cleaner and delivered via a silicon cone was used to kill a non-native kelp species on the seafloor in New Zealand.
Hot water treatment for sea chests: Laboratory investigations and prototypes of a device that would flood a ship’s sea chest with hot water, effectively sterilizing it, are being tested and refined.
2. Encapsulation or wrapping of ships to kill organisms via anoxia or in combination with a chemical treatment
Floerl et al. highlighted the work of an Australian company, Biofouling Solutions Pty Ltd, which is developing technology to encapsulate a variety of vessel types. The company’s IMProtector mobile encapsulation unit can be used with or without chemicals added to enclosed space. Prototypes for use on recreational and fishing vessels have been built and tested; the company is continuing to develop units for larger vessels and for oil rigs. Other work has indicated that wrappings can be used to kill biofouling on small vessels, maritime structures, and on the seafloor, provided that the wrapped area can be properly sealed for a sufficient period of time.

Puget Sound biofouling introductions & vectors
74
The above technologies and methods:
Range in their efficacy for killing biofouling, and may not be effective for well-developed fouling communities on vessels, but some perform well in niche areas and on flat surfaces.
Are all experimental, have been tried in only limited settings, and are not widely available.
May be effective in killing but not removing biofouling, therefore don’t meet performance goals for boaters and shippers (i.e. barnacles die, but their tests remain attached, resulting in higher fuel costs due to friction)
Are less damaging to paint surfaces than scrubbing approaches. This may reduce the risk of releasing toxic compounds and retaining anti-fouling or foul-release properties for a longer duration after application, although it is not clear that the approaches have been sufficiently tested for toxin release.
Developments since 2010 Most of the in-water cleaning methods reviewed by Floerl and colleagues were still in development or had only been tested on small scales or in limited applications at the time of their report (2010). To determine whether any of these methods have advanced significantly or whether new ones have emerged, we conducted a search of the scientific literature, did internet searches on the various technologies by name and broadly on the search terms “in-water cleaning” “hull cleaning” “ship/boat/vessel cleaning,” reviewed websites, and sent email inquiries to relevant companies and agencies for whom we could find contact information. We also spoke to numerous shipping and boating interests in the Puget Sound region (see Appendix 4). As far as we could determine at the time of this writing, with two exceptions, there have been no major developments since the Floerl et al. report in terms of effective, commercially available in-water cleaning methods. A ROV system, called the Whale Shark ROV, which cleans using rotating brushes and contains and treats the debris was developed in Vancouver, B.C. by All-Sea Enterprises. The system’s brushes are enclosed, and all debris generated by the cleaning action is pumped to the surface through flexible hoses. A propeller cleaning ROV, the Beluga Environmental Propeller cleaning system, is specialized for this function and also captures and pumps debris to the surface. At the surface, the system removes organic debris and treats the effluent through a filter system, returning the treated water to the ocean. The effectiveness of the Whale Shark in treating the effluent generated in cleaning a container vessel in Algeciras Bay, Spain was evaluated by the University of Cadiz in 2010. The vessel’s antifouling coating was silicon-based and it had only a biofilm layer (no macrofouling). It is notable that this test was conducted on a foul-release paint, rather than an antifouling coating, and that no-macrofouling was involved in this demonstration. Researchers found no statistically significant differences in a variety of water quality parameters, including pH, temperature, conductivity, salinity, dissolved oxygen, turbidity, zinc, copper, chlorophyll a, phytoplankton mass, and zooplankton mass and diversity. The researchers recommended the use of 50 micron filters “for complete effectiveness”; the test employed 100 micron filters. They also reported that the technology performed well in terms of capturing and filtering larger particles of fouling in previous tests of more heavily fouled vessels. The company is moving from prototype to building a commercial-grade machine, with the goal of completion and further testing through 2013 in the Port of Vancouver, which has granted the company an exemption to its current ban on in-water cleaning. While the company’s initial focus was on cleaning without releasing biofouling into the water, it is now focused on capture and filtration to prevent the release of copper and other heavy metals.
Puget Sound biofouling introductions & vectors
75
ECOStation ECOStation is a system that combines ROV-driven high pressure cleaning with suction technology to capture debris. The system was designed to minimize paint wear by using lower water pressure than other technologies (150 to 250 bars), and has been tested in-water on PVC panels coated with a range of different anti-fouling paint types provided by a Norwegian antifouling paint manufacturer. According to a letter provided to us by ECOStation, follow-up laboratory examination by the paint company indicated that there was no damage of any of the paint types. The efficiency of debris capture was evaluated in a laboratory by the Norwegian Institute of Water Research using steel plates painted with latex paint mixed with wood particles to simulate fouling. In four test runs, average capture efficiency was found to be >97% using filters with mesh openings of 150 um (NIVA 2012). The report recommended using finer mesh screen to increase capture ability. The prototype is now being tested and refined in Gothenburg, Sweden and is expected to be fully functional soon. The company estimates the cost of cleaning to commercial vessels to be $6 to $10 USD per square meter. Envirocart In 2011, an Australian firm FranMarine responded to a request for solutions to in-water cleaning from the Western Australia Department of Fisheries. The system has been tested in Western Australia and includes a ‘full containment mode to eliminate the risk of NIS release into the sea’ using a multi-stage filtration system (http://www.gageroadsdiving.com.au/projects/envirocart/). The manufacturers have also developed patented tools to clean niche areas and tools for use on foul-release (silicon-basd) coatings that do not damage the coating. Since its trial period in 2012, the system has been used under a real-world emergency cleaning situation involving invasive green mussels near Perth. Range of options for each vessel category by cost and biofouling release risk The state of Washington has two major concerns with regards to in-water cleaning of vessels: the spread of NIS and the release of toxic compounds to the environment. The latter of these concerns has been addressed by Washington regulations and this will be reinforced with the 2020 ban on copper-based anti-fouling paints. In the tables and narrative below, we summarize the in-water cleaning technologies reviewed by Floerl et al. 2010, the risk each presents in terms of these two environmental concerns, and their availability in Puget Sound.
Table 3.4. In-water cleaning technologies appropriate for recreational or small boats. The methods are ranked from estimated lowest cost to highest cost.
In-water cleaning method
Risk of biofouling release
Risk of toxin release
Availability in Puget Sound
divers with hand tools
high high for paints with biocides; depends on tools used and paint condition
-in-water cleaning not allowed for soft coatings -presumably allowed for non-toxic coatings, but unable to find vendors in area
divers with power brushes
high high for paints with biocides;
-in-water cleaning not allowed for

Puget Sound biofouling introductions & vectors
76
In-water cleaning method
Risk of biofouling release
Risk of toxin release
Availability in Puget Sound
depends on tools used and paint condition
soft coatings -presumably allowed for non-toxic coatings, but unable to find vendors in area
underwater suctioning or cutting/suctioning devices
moderate, depending on system
likely lower than scrubbing
developing technology not currently available in PS
underwater pressure cleaning
high, tech to capture debris being developed, effectiveness unknown
potentially high without capacity to capture/filter debris
developing technology not currently available in PS
hot-water box with cutting torch for niche areas
low not evaluated developing technology not currently available in PS
hot freshwater and/or steam
low not evaluated developing technology not currently available in PS
Encapsulation (with or without chemicals added)
low likely low developing technology not currently available in PS
Table 3.5. In-water cleaning technologies appropriate for large commercial vessels In-water cleaning method
risk of biofouling release
risk of toxin release
availability in Puget Sound
divers and/or ROVs with power brushes
high, unless methods for containment are used; these vary in % of organisms and size of particles captured
high for paints with biocides; depends on tools used and paint condition, and whether technology to capture and filter toxins is present
-in-water cleaning not allowed for soft coatings -presumably allowed for non-toxic coatings, but unable to find vendors in area
underwater suctioning or cutting/suctioning devices
moderate, depending on system
likely lower than scrubbing
developing technology not currently available in PS
underwater pressure cleaning
high, tech to capture debris being developed, effectiveness unknown
potentially high without capacity to capture/filter debris
developing technology not currently available in PS
mechanized hot- low not evaluated developing

Puget Sound biofouling introductions & vectors
77
water box, followed by device for treating niche areas
technology not currently available in PS
heat treatment for sea chests
low not evaluated developing technology not currently available in PS
Encapsulation (with or without chemicals added)
low likely low developing technology not currently available in PS
In-water cleaning and the risk of NIS spread The risk of biofouling release by the cleaning methods described above is only one aspect that needs to be considered in a risk evaluation. Risk is a function of a number of factors, including the vessel type, origin, travel history, fouling extent, and paint type and age. For example, the risk of biofouling release resulting in the introduction and spread of unestablished NIS from strictly local vessels is lower than release from wider-ranging vessels, which might result in new introductions to Puget Sound. Thus from a risk-management standpoint, the travel history of a vessel and its origin need to be considered along with any proposed cleaning method.
A different set of options might be considered for strictly local vs. inter-regional boats, in which technologies that have a higher risk of biofouling release could be considered for local boat cleaning in their home marinas, but prohibited for foreign or out-of-state arrivals. However, it might be challenging to define what is meant by “local.” Even within a single bay or estuary, not all invasive species will spread unaided to all locations. Clearly the least risky method is to always clean on land, with mechanisms in place to contain and properly dispose of biofouling. However, hauling out is costly and prohibiting cleaning in-water will likely result in boaters cleaning less frequently, increasing the amount of accumulated fouling, and thus increasing the risk of spread to the places in which they travel.
Developing biofouling policy in Washington Biofouling policy development, at a minimum, requires the input of state and federal agencies, tribes, commercial and recreational vessel stakeholders, researchers, and environmental community stakeholders. The process currently underway in California and Hawaii, which involves advisory group meetings, followed by information evaluations and policy proposals, is a useful model and one that Washington already employs on a suite of environmental issues such as WDFW’s Ballast Water Work Group and the state Invasive Species Council. The goal is to create an open and transparent process that provides broad input that can then be evaluated to find and establish prudent and effective measures to prevent and control biofouling vector and introduction threats. An outline for an advisory group process is shown in Figure 3.2.

Puget Sound biofouling introductions & vectors
78
Figure 3.2. A suggested sequence of topics for evaluating biofouling policymaking in Washington, including (a) identifying the problem, (b) evaluating the solutions and (c) developing the policy, with subsequent stakeholder feedback and revision. The Advisory Group process serves as a forum through which information and ideas can be exchanged and to ensure that rulemaking decisions consider the best available science, the best available feasibility and economic considerations, and the best available implementation information (including legal issues, procedural protocols and barriers, and overlapping agency authority). The stakeholder list (below) for advisory group meetings is extensive and includes sectors of government, shipping industry, boating, fishing, environmental groups, managers from other jurisdictions, researchers, and community partners. It is unlikely that all groups will participate or remain engaged, but an open forum is suggested at the outset so as to prevent reasonable objection later in the process because of uninformed or unaware stakeholders. In many cases, representatives of umbrella organizations help to maintain a workable forum without the need to engage with every possible stakeholder (e.g. umbrella groups for shipping companies). Advisory group meetings and feedback are continuous, with leadership provided by state managers (WDFW), and include a reasonable timeline for public comment and progress to an end-goal (policy proposal to be put forward for legislative action). Stakeholder list for a Washington State Biofouling Advisory Group Government and related programs Washington Department of Fish & Wildlife Washington Department of Natural Resources Washington State Department of Ecology Western Washington Treaty Tribes Puget Sound Partnership US Coast Guard (Environmental Standards Division) US Fish and Wildlife Service US Environmental Protection Agency (Vessel general permit program) US Customs & Border Protection (Puget Sound region)
InformationSharing
Feasibility Present Plan
Introductions
Presentation
Biofouling invasions in Puget Sound
Discussion
Key considerations/ concerns
Presentation
Management options being implemented elsewhere
Discussion
Options for Puget Sound
Presentation
Management plan for Puget Sound
Discussion
Review
Considerations/ Concerns

Puget Sound biofouling introductions & vectors
79
Commercial vessel groups World Ocean Council Pacific Merchant Shipping Association Cruise Lines International Association North-West & Canada Cruise Association Port of Edmonds Port of Olympia Port of Seattle Port of Tacoma Vigor Industrial (Dry Dock facilities) World Shipping Council Port of Vancouver (BC) Individual shipping companies with berths or repeated business in Puget Sound
Fishing vessel groups Fishing Vessel Owners Association Northwest Fisheries Association Pacific States Marine Fisheries Council Puget Sound Anglers Puget Sound Crab Association
Environmental groups Ocean Conservancy Padilla Bay National Estuarine Research Reserve Puget Sound Keeper Alliance The Nature Conservancy Recreational vessel groups Washington Boating Alliance (NW Marine Trade Association, Recreational Boating Assoc. of
Washington, etc) Port of Port Townsend Puget Sound harbormasters City of Des Moines Marina Clean Boating & Water Foundation Research/Other California State Lands Commission, Marine Invasive Species Program California Fish & Wildlife Oregon Department of Environmental Quality (AIS and shipping vector coordinator) Hawaii Department of Land & Natural Resources Alaska Department of Fish and Game (AIS coordinator) NOAA, USFWS and Hawaii DLNR managers of the Papahānaumokuākea Marine National Monument British Columbia Ministry of Environment (AIS coordinator) Canada Department of Fisheries & Oceans New Zealand Biosecurity Australia Department of Agriculture, Fisheries and Forestry Western Australia Department of Fisheries Northern Territory Department of Primary Industries & Fisheries

Puget Sound biofouling introductions & vectors
80
University of Washington Researchers Washington State University Researchers Puget Sound Institute Washington Sea Grant Portland State University Researchers Smithsonian Environmental Research Center (Marine Invasions Lab) US Navy (Naval Surface Warfare Center, Carderock Division –hull maintenance applied research) Through this report and other work, Washington is already engaged in a process of evaluating the biofouling problem and identifying solutions that have been developed elsewhere. Therefore, our preliminary recommendation is that Washington continues to evaluate the status quo for biofouling management (or lack thereof) in Washington, including the possible effect of regulations implemented in nearby jurisdictions. This can be compared to a scenario of establishing comparable biofouling policies in the state to those being developed in California and Hawaii, both of which are likely to overlap substantially with IMO guidelines. Coordinated policy requirements across jurisdictions are valued highly by industry and broader coordination has strong merits as long as the individual risks and values of each territory are accounted for. Much of this evaluation is covered by this project report, but the state’s managerial evaluation of ‘status quo’ versus policy options will be an important post-submission component of policy development. The state will also have to determine whether biofouling policymaking combines commercial, fishing, and recreational vessels under one umbrella, or separates these sectors into two or more distinct frameworks. Based on other locations and our work on boating vectors in California (Ashton et al., 2012; Davidson et al., 2012), our preliminary recommendation would be to develop separate but parallel policymaking efforts for commercial vessels, fishing vessels, and recreational vessels. This could begin with a joint advisory group meeting that branches off for subsequent meetings for the distinct groups. However, it would be important that each sectors’ policy process remain on matching schedules because any attrition for one may provide an argument for ‘no action’ for the other, leading to overall stagnation and retention of the status quo. Introductions that result from biofouling vectors have the potential to undermine existing NIS management efforts in the state (including ballast water, eradication efforts, and restoration actions) and protecting existing investment in NIS management should be part of the evaluation for biofouling policy development.
DISCUSSION The development of biofouling policies - let alone implementation of regulatory authorities, in the United States and internationally - to prevent species transfers by vessels remains in its infancy. For the most part, existing biofouling regulations that affect regular in-service shipping and boating are either voluntary, loosely defined, or codify existing standards for maintenance of vessels’ submerged surfaces (e.g. state law reflecting federal law or industry norms). It is important to note that vessels expend much effort and expense to minimize biofouling on exposed hull surfaces in order to reduce the effect of drag and fuel consumption. However, vessel-mediated NIS introductions remain an important issue, probably because of niche area biofouling transfers and a proportion of vessels that do not have adequate maintenance strategies for their hulls. With the exception of jurisdictions that require in-water surveys of vessels prior to entry or upon entry, there has been no explicit monitoring of the effects of biofouling policies and no comparison of biofouling transfers among territories with policies versus those without. However, it is possible that existing approaches serve to highlight the issue of

Puget Sound biofouling introductions & vectors
81
biofouling vectors among the maritime sector which promotes diligence in hull husbandry and biofouling minimization that would not otherwise exist. Exceptions to voluntary biofouling management policies exist in the approaches adopted by Western Australia, Northern Territory (for recreational boats), and the Papāhanaumokuākea Marine National Monument. These locations have implemented the most stringent strategies for biofouling management developed thus far, requiring pre-border (or upon arrival) certification that vessels are free of macro-algae and macro-invertebrates in most cases. A variety of unique circumstances provided the impetus for their adoption and enforcement. Western Australia has experienced an accelerated economic development based on mineral extraction in recent years and commercial shipping companies associated with extraction in high-value (for conservation) locations have supported biofouling management efforts by conducting underwater inspections and cleaning as necessary within seven-days of departure for Western Australia (Coutts, 2012). The Northern Territory had a significant outbreak of a marine pest (the black-striped mussel) that required quarantine of vessels and eradication of the pest in Darwin marinas, which prompted efforts to stem the incoming delivery of invasive species. The establishment of the Marine National Monument in the NW Hawaiian Islands allowed the agencies that manage the Monument to develop strict requirements for boats and research vessels to prevent biofouling transfers into the Monument – requirements similar to those of Western Australia for zero detectable macro-fouling. While it may be impractical to manage biofouling of in-service ships and boats throughout Puget Sound to the extent that exists in Western Australia, Northern Territory, and the NW Hawaiian Islands, their policies help to define the likely upper level for the type of standard that can be implemented or the potential application for sensitive areas within the Puget Sound region. In terms of evaluating policymaking and developing policy in Washington, it is useful for managers and stakeholders to know the upper limits for biofouling management, which appear to be these stringent regulations and the lower limits, which would be a no change (“do nothing” or “status quo”) option. This report, which includes evaluations of invasion history (Section 1), shipping and boating patterns in the state (Section 2), and existing policies and technological developments (Section 3), provides the state with a sound baseline for convening advisory group sessions to discuss the problem, the range of options available for reducing invasion risks, and possible implementation (and subsequent monitoring) of policies for vessel biofouling vector management.

Puget Sound biofouling introductions & vectors
82
SECTION 4: Non-vessel biofouling risks in Puget Sound
While vessel biofouling is the largest and most active vector for introducing biofouling NIS in Puget Sound, there are other non-vessel biofouling vectors to consider. At the present time, these other vectors are apparently smaller in scale and magnitude of operations (units or shipment with biofouling in transit) than ships and boats or involve rare (stochastic) events that do not receive the attention usually afforded to vessels in vector science. Determining a standardized metric for comparison across vectors is itself a challenge, and in most cases data are not available across vectors to make like-for-like comparisons (Williams et al., 2013). Non-vessel biofouling vectors include maritime structures (e.g. buoys and floating docks), live bait, live species trade, live seafood trade, marine debris, and aquaculture. In some cases, these vectors or stochastic events can be very risky NIS transfer mechanisms, because they are designed to successfully transfer species (e.g. bait and aquarium trade) or include very large transfers of biota (e.g. marina dock movements). While they remain a lower priority for research and management compared to vessels, because the data suggests shipping and boating require prioritized attention, a multi-vector strategy is preferable to single-vector or single-species approaches (Williams et al., 2013). The aim of this fourth and final section of the report was to characterize non-vessel biofouling vectors in the Puget Sound region, discuss options relevant to their management, and provide a list of research and monitoring priorities for the region in relation to biofouling NIS.
METHODS We conducted a series of desk-based reviews of information and management of non-vessel vectors in Puget Sound, with a focus on biofouling species. Reviews included information from the primary and gray literature, as well as discussions with agency personnel in Washington. This section is structured in four parts: (a) a review of non-vessel vectors with reference to past studies or vector contributions to invasion history; (b) a discussion of research and management options for these vectors; (c) a review of the Japanese tsunami debris issue as it relates to the West Coast and Washington State in particular; and (d) a list of research and monitoring recommendations for biofouling NIS in Puget Sound. The fourth component includes monitoring priorities for evaluating established NIS in Puget Sound as well as priorities for vector research, focused on vessels.
RESULTS & DISCUSSION
Non-vessel biofouling vectors Commercial, fishing, and recreational vessels are likely the most important biofouling vectors, given the high volume of shipping and boating activities in Puget Sound. However, other vectors may also pose risks for NIS introductions. Marine biofouling can form on any surface that has been in the water: docks, boat ramps, navigational buoys and other maritime structures, species imported for live bait and their packing materials, species imported for the ornamental (aquarium) trade and for educational purposes such as teaching and public aquaria, live seafood, floating marine debris, such as that generated by the recent tsunami in Japan, and aquaculture species, gear, and equipment. Below, we briefly consider each of these in turn. In-water structures. Maritime structures, including pilings, floating bridges and docks, ramps, buoys, and channel markers will become fouled over time. Because these structures are typically stationary, they have the potential for heavy fouling to accumulate, and can pose a significant risk if they are moved to a

Puget Sound biofouling introductions & vectors
83
new location without cleaning prior to transfer. These structures also have the potential to act as propagule sources to boats and moveable equipment moored nearby, which then can spread NIS to other locations. It is difficult to measure the frequency with which these types of structures (which may be owned by public and private marinas, the military, government agencies, and individual landowners) are moved within Puget Sound, but we believe these are fairly rare events. We also know of no studies that identify NIS introduced to Washington from non-vessel maritime structures, but as species fouling these structures are likely to be the same as those fouling vessels, it is difficult to distinguish among these vectors as a potential source of introduction. A notable recent example of biofouling concerns for maritime structures entering the Sound is the construction of pontoons for the replacement of the floating bridge in Lake Washington (State Route 520 in Seattle) by Washington State Department of Transportation (WSDOT; Novak, 2011). The pontoons are being constructed in batches in Grays Harbor on the outer Washington Coastline and when finished, are being towed to Puget Sound through Seattle’s Lake Union Shipping Canal for final deployment in Lake Washington (a freshwater lake). They may have a residence time in Puget Sound for final outfitting prior to transfer into freshwater (Novak, 2011). The pontoons have an estimated 17 acres of cumulative submerged surface area. Concerns over biofouling introductions generally, and transfers of nonindigenous European green crab (Carcinus maenus) in particular, prompted WSDOT to conduct research into potential transfers of biofouling and associated species. The report concluded that colonization on the pontoons by biofouling and associated species can be very substantial when the pontoons require staging for long periods in Grays Harbor (2-12 months) prior to transport due to either construction or weather-window transit delays along the outer coast. In these situations, studies show that a large biomass is likely to be transported, and the presence of pygmy rock crabs (Glebocarcinus oregonensis) on research fouling structures from pontoon sites in Grays Harbor suggests a potential for NIS crab species may be part of the transferred community (Novak, 2011). In most situations, transit from Grays Harbor to Lake Washington is expected to be done in a single event, reducing the opportunity for spread of associated NIS. Alternative options for reducing NIS risks under this and other potential scenarios are under discussion. Live bait. Live marine organisms imported for use as fishing bait are potentially problematic themselves, but dozens of species have been documented living in or on bait species and on packing material, which is typically seaweed (e.g. Carlton & Cohen 2007, Yarish et al. 2009, Haska et al. 2011, Fowler et al. 2013). These unintentionally transferred species increase the biofouling risk posed by the live-bait vector. A number of invertebrate species are used in the live bait trade in the US, mainly the Atlantic pileworm Alitta virens and bloodworm Glycera dibranchiata (typically packed in the knotweed Ascophyllum nodosum) and more recently the nereid polychaete Namalycastis rhodochorde (imported from Vietnam as “nuclear worms”). The native ghost shrimp Neotrypaea californiensis is harvested in Washington State and shipped to Oregon and California. Organisms found in association with packaged live bait span a wide range of phyla, including multiple species of Vibrio bacteria, other microorganisms, seaweeds, snails, and crustaceans. Notably, the European green crab, Carcinus maenas, has been recorded from bait boxes shipped from Maine to Maryland (W Miller [SERC] pers. comm.). Olson (1999) carried out an exhaustive telephone survey of bait shops in the Seattle area and visited several of them. Seven shops sold live bait, but none was of marine origin. She also called 41 of 110 shops located in Washington’s coastal counties, using a stratified random sample design to ensure at least two shops were called per county. All of the shops she surveyed were focused on marine (as opposed to freshwater) fishing. Most did not carry live bait, and those that did had obtained it from a local source, with the exception of a few shops that purchased earthworms from Oregon. Similarly, calls

Puget Sound biofouling introductions & vectors
84
to distributors indicated that live bait was not being imported into the state, even by those who were supplying live bait to California, and discussions with bait-shop owners indicated that there is a tradition in the region of fishers gathering their own bait. Olson concluded that the live bait vector is essentially “closed” in Washington State, although she cautioned that this may not be the case in the future, and that educational campaigns targeting the fishing public were important to prevent it from becoming so. Additionally, although she identified internet sales and the transport of bait into the state by private individuals as potential ways live bait might enter Washington, she did not attempt to quantify these vectors in her study. Of the 74 marine NIS known from Puget Sound, two may have been the result of discarded bait, the pile worm Alitta succinea and the isopod Orthione giffenis. In both cases, bait was only one of a few possible vectors, so the signal from this vector is unclear (NEMESIS 2012). Live species trade for pets, display and education. Species imported for home aquaria may themselves pose a threat to Puget Sound if released into the environment. Most marine species sold for this purpose are tropical and not likely to survive in the region’s cooler waters. However, recent research from California indicated that a subset of invertebrate and fish species imported to that state’s two major ports originate from temperate locations (Williams et al. 2012) and 5-21 fish available in local pet stores could survive in San Francisco Bay based on temperature and salinity tolerances (Chang et al. 2009). In terms of biofouling, the risk posed by marine ornamental species (i.e., potential parasites and other species living in or on the target organism) is poorly known, but aquatic plants are perhaps especially likely to contain hitchhiking species. Keller and Lodge (2007) found non-target species living on 90% of the freshwater ornamental plants purchased for a study in the Great Lakes region. Three NIS in Puget Sound were possibly imported with aquatic plants, the hydroid Cordylophora caspia, the isopod Caecidotea racovitzai, and the bulrush or cattail bug Chilacis typhae. Another potential concern in the marine environment is the importation of “live rock,” to which macroalgae, cnidarians, diatoms and other organisms are frequently attached, which is imported without quarantine restrictions (Bolton and Graham 2006, Walters et al 2011). The risk posed by releases of freshwater fish and plants in the Puget Sound region was evaluated by Strecker and colleagues (2011), who surveyed 30 pet stores in Snohomish, King, and Pierce counties, tracked monthly sales by a single large store and interviewed 92 aquarium owners to learn about frequency of release into the wild. Using these data, they estimated that at least 2500 aquarium fish are released annually into rivers and lakes in the region, and that many of these could survive local water temperatures. Slightly more than 6% of aquarists reported having released fish. In addition, several species listed by the USGS as nonindigenous and on the state’s Aquatic Nuisance Species list were for sale in the stores. Although several freshwater species linked to the ornamental species trade have become established in Oregon and Washington, only three such marine species have been reported. We know of no study that attempted to quantify the invasion risk for marine aquarium species for Puget Sound. Marine species are less commonly kept than freshwater species, so although release rate (estimated as 6% of owners of freshwater aquaria species) might be similar for marine taxa, it is likely that fewer such individuals are released into marine waters. We assume live rock is less likely than fish or free-living invertebrates to be placed into the environment by aquarists who want to dispose of unwanted pets. Public aquaria are another potential source of NIS invasions via the ornamental species vector, if water from tanks containing imported species circulates into local waters. The invasive seaweed Caulerpa taxifolia, which now carpets extensive areas of the Mediterranean Sea, is a famous example of an accidental release of an organism from a public aquarium (Meinesz et al., 1993). Today, import permits

Puget Sound biofouling introductions & vectors
85
are required for display organisms brought in to Washington State that will come in contact with state waters. Such permits require documentation of the health of the imported species, which presumably helps reduce accidental transfers of parasites and pathogens, but the degree to which organisms are screened for fouling species is not clear. Olson (1999) also considered biological specimens for teaching as a potential source of invasions. She ordered a shipment of the rockweed Fucus sp., which is typically used for teaching developmental biology, and a shipment of mixed macroalgae, which is used for teaching algae identifications, and had them delivered to her university address in Washington. More than 20 non-target organisms were found in each shipment. However, scientific specimens such as those only pose a potential risk if they are placed in suitable environments. It seems likely that specimens of marine algae would more commonly be collected locally for use in institutions bordering marine waters in Washington state, and fairly unlikely that imported specimens would be disposed of in ocean waters. None of the marine NIS known from Washington have been attributed to this vector. Live seafood trade. A number of live organisms, such as lobsters, mussels, and oysters are imported into the state for the live food trade, both through traditional venues such as grocery stores and restaurants, and increasingly to private individuals who can order them online. A premium is placed on these species being able to be shipped rapidly and arriving in good condition. Food species are generally unlikely to be released into the environment (although there are anecdotal accounts of people releasing these as unofficial aquaculture attempts or as part of a cultural practice in San Francisco Bay, Cohen & Carlton 1995, CJZ personal observation, and in Puget Sound, Brady Blake, WDFW, personal communication). As with live bait, from a biofouling perspective, the packing material food in which species arrive, typically seaweed, also presents a risk, as it tends to have numerous species living in it. This material may end up being dumped in the marine environment, particularly in cases where the venue is located near the water, such as a wharf-side seafood restaurant and target and non-target species could potentially escape from holding pens in marine waters. While this would appear to be a relatively rare event, invasions have been attributed to the live seafood trade in other locations (see review in Cohen 2012). None of the marine NIS known from Puget Sound are associated with the live food trade. However, an emerging, but possibly controlled, introduction of the snail Littorina littorea in Vancouver BC may have been the result of release linked to the food trade (Harley et al., 2013). Marine debris. Floating marine debris, especially debris from coastal origins, such as that from the 2011 Japanese tsunami, is evolving as a potentially significant source of biofouling NIS. This issue is dealt with in detail below. Aquaculture. Historically, aquaculture biofouling has been among the largest contributors of NIS in the Puget Sound region. Intentional importation of desirable species promoted the food diversity and spurred economic activity in the region, but unwanted hitchhiker species were also transferred unintentionally. The NEMESIS dataset of Puget Sound NIS attributes aquaculture as the sole vector for 13 non-indigenous marine species, and lists aquaculture as a possible vector for another 27 species. Among the species introduced accidentally with imported oysters were the oyster drills Ocinebrellus inornatus and Urosalpinx cinerea, both of which prey on oysters and other bivalves and are a nuisance to the aquaculture industry. Within Puget Sound, this problem is so significant that certain locations have been identified as drill-infested, and movement of aquaculture species and equipment from these locations to non-infested areas is prohibited (WDFW pers. comm.).

Puget Sound biofouling introductions & vectors
86
Using the year of first record for Puget Sound as a proxy for date of introduction, it appears that nearly all of the NIS that had aquaculture as a sole vector were introduced prior to 1960 (Fig. 4.1; Section 1). This temporal pattern likely reflects changes made in aquaculture practices to reduce the transmission of pests and diseases, such as the use of commercially raised larvae and spat for stock rather than the transfer of wild-caught (and biofouled) adults. In addition to these changes in industry practices, aquaculture is highly regulated in Washington State with both human health and invasive species concerns in mind (see below). Restrictions on the importation of aquaculture species from out of state and transfers between bays of aquaculture animals and equipment have undoubtedly helped to reduce both new introductions and spread within the region. However, additional species potentially associated with aquaculture continued to be reported through 2000 and we do not have information on possible illegal imports that are not captured by the regulatory framework. It is possible that this vector may still be transmitting some NIS, and negative impacts from feral populations of the target species such as the Pacific oyster, Crassostrea gigas, cannot be overlooked (see Padilla 2011 for a review).
Figure 4.1. The number of NIS reported from Puget Sound over time that were attributed to aquaculture, either solely or as one of several possible vectors. The main species currently in use for aquaculture in the state are C. gigas, which accounts for ≈ 75% of all aquaculture abundance, C. gigas kumamoto, the Manila clam Venerupis philippinarum, the Mediterranean mussel Mytilus galloprovincialis, and the geoduck Panopea generosa. The oyster species are imported as adults, settled juveniles (“seed”) or larvae; most of the other bivalve organisms are imported as seed or larvae. Nearly all of the aquaculture species are imported from the US West Coast and British Columbia, although there are imports from WDFW-approved quarantine facilities in Hawaii. In addition to bivalve aquaculture, net pen aquaculture is increasingly being practiced in Puget Sound. At the moment, one operator owns eight pens covering 21 acres in the Sound, which are being used to raise the Atlantic salmon, Salmo salar. It is possible that as wild stocks are depleted in the future, net pen aquaculture operations will increase. As with shellfish aquaculture, parasites on imported aquaculture species, and fouling on pen aquaculture gear and equipment moved between locations could present a risk of NIS transfer.
Research and management of non-vessel biofouling vectors In-water structures. To our knowledge, there is very little research on maritime structures (non-vessel structures) as a vector for the spread of NIS. Artificial structures do tend to promote the growth of NIS

Puget Sound biofouling introductions & vectors
87
over natives and undoubtedly act as seed banks for boats moored nearby, especially for those species with short dispersal time. An understanding of the frequency, source, and associated biota for moved structures is key to estimating the risk posed by this vector. The transfer of the State Route 520 pontoons from Gray’s Harbor to Puget Sound (above) is a good example of the type of translocations that can occur and the steps that can be taken to mitigate some risk (Novak, 2011). In addition, it’s likely that not all structures will pose the same invasion risk (i.e. coastal navigation buoys anchored in areas with swift currents are likely to be less fouled with NIS than are floating docks in wave-protected harbors), but such comparative data are lacking. Complicating potential management of these surfaces is that they are widely distributed and under the responsibility of a wide variety of individuals and organizations, including owners of private docks, ferry operators, private marinas, harbor districts, cities, counties, park districts, and state and federal agencies (such as the US Coast Guard, which maintains navigation buoys). While several agencies are involved in permitting these structures, depending on the circumstances, such as the Army Corps of Engineers, DFW, and DNR, it appears that regulations are focused on navigation hazards and potential conflicts with wildlife and natural resources, but not on the prevention of NIS introductions. An analysis and survey of moveable structures in Puget Sound could help identify the type, number, spatial distribution, ownership and degree to which these structures are fouled. However, the key concern for NIS management is whether structures are moved with biota on them to another location. Such movements are considered stochastic events and a survey may reveal very little (if any) movements. If movements were reported, an investigation could also help to form a stakeholder list for the consideration of appropriate management strategies, which may be as simple as the requirement that all structures going into the water are new or cleaned before deployment. Live bait. Research from locations outside of Washington indicates that a number of species can be transferred with live bait, and there are several instances of NIS likely linked to this vector. Based on earlier work (Olson 1999), imported live bait doesn’t seem to feature heavily in Washington, but a resurvey of bait shops or mechanism to track industry changes would help to determine if this is still the case, as well a survey of the fishing public to determine what types of bait are being used and how unused bait is being disposed of. An import permit through WDFW is required for the importation of invertebrates into the state for use as live bait. No such permits have been applied for, although the department has had some inquiries about nereid worm culture for bait. Department staff is aware that sand shrimp (Crangon spp.) are being used for live bait extensively throughout the state; such activities should trigger permit applications but have not. In addition, bait is likely purchased via the internet, which the state is unable currently to evaluate or regulate. A complete ban on imported live bait is one potential management strategy that has been considered in several states, however a less-stringent regulatory solution might be to require health certifications for bait species and to ban the use of seaweed as packing material for shipments of both live bait and live seafood (see below). Information on the risks of using and releasing imported bait is currently available on the Washington Invasive Species Education (WISE) website, but it is not Washington-specific. Making this page more locally relevant could be done with relative ease and might deliver a stronger message to fishers.

Puget Sound biofouling introductions & vectors
88
Ultimately the behavior of the fishing public is the key to reducing the threat of this vector. The inclusion of fishing associations, bait shop owners, and others involved in recreational fishing is critical in considering any new management actions, including the development of new public education tools and partnerships. Live species trade for pets, display and education. The live species trade has resulted in the invasions of detrimental species in other regions, such as the Indo-Pacific lionfish Pterois voltans, a voracious predator that is altering fish assemblages in Florida and the Caribbean. Biofouling associated with live species trade (other than aquaculture species, see below) doesn’t seem to have been important historically in Puget Sound, but further research into its potential in the region is needed before this vector is dismissed. In terms of the pet trade, a survey of which species are available for sale in the area both through retail outlets and through hobbyist groups, coupled with climate matching to determine whether these organisms (and their parasites and pathogens) could survive in local waters could be used to assess risk, and guide future management actions. Surveys of public aquaria and science teachers could be used to help determine what other live species are being imported into the state and what practices are in place for preventing their release or release of associated fouling species. Currently there are no import permits at the state level required for the home aquarium trade. Imports from foreign sources are subject to US Fish and Wildlife Service (USFWS) restrictions and inspections. USFWS inspectors mostly focus on potential violations of the Convention on International Trade in Endangered Species (CITES) and Lacey Act species, although they may be aware of and enforce other US federal or state regulations in cooperation with local entities (Williams et al. 2012). The importation of marine and freshwater invertebrate species for public (display) aquaria, scientific research and teaching requires a state Import Permit (see Aquaculture section below). Requirements of the permit include health certificates from the importer and compliance with quarantine regulations for the prevention of disease, parasites, and hitchhiking species. Regulatory approaches that could be taken include requiring state import permits for species in the home aquarium trade, the creation of black lists (which ban certain taxa) or white lists (which allow certain taxa determined not to be invasive) for live species imports or mandatory rules about disposal of species and packing/holding material. Voluntary guidelines and best management practices could also be developed, working with stakeholders such as pet stores, pet owners groups, science teachers and school administrations, public aquariums and cultural organizations. Additional non-punitive steps such as buyback or amnesty programs for unwanted or illegal pets could also be taken to decrease the risk of this vector (See Keller & Lodge 2007 for a further discussion of various approaches and http://www.ridnis.ucdavis.edu/ and Williams et al. 2012 for more detailed management recommendations that might be applicable for Washington State.) Public education would appear to be crucial to changing behavior that results in release of these organisms to the environment. Currently, there is a small amount of information about this vector on DFW’s Aquatic Nuisance Species website. More detail can be found on the WISE website, but is not Washington-specific, and could be expanded to include links to buyback programs and the like. Live seafood trade. Similar to the other live trade vectors, the live seafood trade has resulted in invasions in other regions, including through individuals releasing food organisms in attempts to establish populations for later consumption. To our knowledge, no NIS have become established in Puget Sound through this vector, although such releases have occurred.

Puget Sound biofouling introductions & vectors
89
Currently, the only regulations that apply to the importation of live species for seafood deal with human health issues, or in the case of foreign imports, CITES violations. As a result, the identity, source, and volume of both target and non-target species entering the state through this vector is not known to managers dealing with NIS. As an initial step, research could be done to determine what species are being sold in the region and what non-target species are associated with them. We are aware that not all live seafood for sale is openly displayed and interceptions of mitten crab in Washington serve to underscore this point; survey work would need to include members of different ethnic groups who would have better knowledge of and access to some of the smaller retail outlets that cater to these communities. In addition, research into whether there are local cultural practices that involve the release of live aquarium or seafood species needs to be carried out. As with the pet trade, a determination of which species of those available for food (and their hitchhikers) could survive in Puget Sound would also need to be made to assess the potential risk of this vector. These results could be used to determine whether the state should consider requiring import permits, similar to those used for the aquaculture trade (see below) for live food imports. The state may want to consider a public education/outreach program aimed at retailers, consumers and community groups or organizations (such as religious practitioners who do ceremonial releases of animals). Aquaculture. Clearly aquaculture has been an important vector for biofouling species invasions historically. To our knowledge, the efficacy of current practices and regulations for preventing transfers of fouling species has not been thoroughly investigated. Most of the research and regulation of the aquaculture industry in the region, particularly on shellfish, has focused on the human health aspects of this industry. While current industry practices reduce the likelihood of hitchhiking species, some associated taxa, such shellfish disease organisms, may still be circulating. It may also be useful to incorporate current practices into regulations, which could involve little opposition from industry and prevent any return to historical practices. Washington State has several sets of regulations and permit requirements in place to reduce the likelihood of NIS spread through shellfish aquaculture. Import permits from WDFW are required to bring live marine or freshwater invertebrates (not including insects) into the state. These annual permits apply to anyone wishing to import these species for aquaculture, research, or display. The permit application requires details on the species, number, life stages, and source of proposed imports, including documents on shellfish health history for the source region, and the proposed source location. All importers must produce a health certification from the source. The permits are geared toward reducing the importation and spread of disease and pests, but conditions and requirements of the permits also address other hitchhiking species. A key question, however, is the extent to which testing is aimed at particular known species or pathogens and not the full diversity of associated organisms that may be in transit. Imports coming from outside the Western Commerce Region (defined as California, Oregon, Washington, British Columbia and Alaska) must meet further quarantine restrictions and importations are typically not allowed out of quarantine conditions at all (i.e., kept in closed containers with treatment protocols for waste water). Any organism not already established in the state must also undergo a state EPA permit process. DFW can add additional conditions, such as the requirement that all oyster seed coming from California and Oregon undergo a chlorine dip and fresh water rinse and be visually free of other organisms. The importer typically does these treatments and inspections; WDFW inspectors can make inspections and reject imports, but do so only when they have cause to suspect that there is a problem. Quarterly reports of what was imported are a requirement of the permits. The

Puget Sound biofouling introductions & vectors
90
state typically receives 35 import permit applications per year; in 2013, 30 permit applications were approved and five applicants withdrew at least in part due to the costs of disease testing. In addition, WDFW requires permits for the transfer within and into the state of shellfish species, their products (such as oyster shell), aquaculture equipment, vessels and vehicles. Specifically, the state greatly restricts any transfer between locations known to have non-native oyster drills and/or European green crabs. Generally speaking, all gear and live organisms need to be free of fouling and undergo a chlorine dip and freshwater rinse before being moved. Oyster shell must have air-dried for at least 90 days above the high tide line before it can be moved. Vessels used for aquaculture need to be visually free of debris, although no requirements exist for cleaning hulls before they are moved between bays. No shell from out of state has been permitted for use in the state, and WDFW has not received permit applications for gear to be transferred from out of state. Aquaculture vessels from out of state are not covered under the import permits. One potential source for NIS transfers from bivalve shells are discarded shells from restaurants, private citizens, and shell fish processors. Such shells have been used in oyster-restoration efforts elsewhere, but would not be permitted by WDFW because they likely would not have met the above requirements. Permits are also required for the importation into (and movement within) the state of fish for commercial aquaculture, public aquariums, fish researchers and retailers, although aquarists and aquarium fish are exempt from this permit. The Department of Ecology prohibits the cleaning of net pens over water, and industry practice is to clean and dry pens before moving them to new locations. However, there do not appear to be any regulations dealing with the movement or transfer of net pens or aquaculture equipment related to fish. There are also no permit requirements for marine algae similar to those required for invertebrates or fish. The WDFW considers compliance with permit requirements among the aquaculture industry to be high; the industry has a stake in not importing or spreading aquaculture pests and diseases. A bigger potential problem may come from individuals doing smaller scale aquaculture, who either don’t know or don’t care about the regulations. Purchases of aquaculture animals through the internet are particularly hard to track; there is no vehicle for the department to become alerted to these imports. It isn’t possible to estimate the degree to which this occurs, but department staff finds out about these types of operations a few times a year and believe that many similar imports go undetected. Shellfish aquaculture has the longest history in the state and makes up the bulk of the aquaculture industry. In terms of the prevention of invasions due to biofouling species, shellfish aquaculture appears to be more carefully managed than does finfish or algal aquaculture (if this is practiced). One approach would be to standardize import permits for all marine species and expand the transfer permits to include all aquaculture species and gear, which would be overseen by a single entity (likely WDFW). This would both streamline the process for importers and allow the state to more easily assess the species, number, and source regions for imported marine species and the movement of these species and associated gear within the state. To further assess the potential of aquaculture to spread non-native species, the state could consider a survey of aquaculture facilities and net pen operators, sampling target species in culture, shipments of species for culture, and aquaculture equipment for hitchhiking species.

Puget Sound biofouling introductions & vectors
91
As with the trade in all live species, internet sales for aquaculture species are difficult to track and regulate. The state may want to consider the use of a web crawler similar to that used by the USDA to find internet retailers who ship to Washington State.
Japanese tsunami debris as a biofouling vector The vector risk from tsunami debris In March 2011, the fifth largest earthquake ever recorded occurred off the eastern coast of Japan. It triggered a massive tsunami resulting in more than 15,000 deaths and devastation of coastal areas in Japan. It also released millions of tons of debris – of both terrestrial and marine origin – into the ocean. The majority of this debris (70% according to the Japanese Government) is thought to have sunk soon after release into the ocean. The remaining debris field that resulted from this tsunami dispersed over thousands of kilometers of the north Pacific (Fig. 4.2) and will continue to do so for the foreseeable future. It differs from typical marine debris because of the nature of the release; it includes a single large pulse of material rather than a continuous background level of debris that circulates in the oceans. There is no scientific literature on dispersal rafting vectors to support the likelihood of Japanese coastal species on tsunami debris surviving across ~4,500 mi. of open-ocean and over one year of time before the first debris was expected to start hitting the US West Coast. Typical background debris that washes up on shore tends to be primarily of terrestrial origin (garbage and plastics) or derelict fishing gear, cargo lost during storms, or garbage/broken equipment discharged by vessels while at sea. This debris usually accumulates open ocean biofouling biota such as pelagic gooseneck barnacles and neustonic biota. The Japanese tsunami debris has a large component that is marine-derived with the potential to disperse a large abundance and diversity of coastal organisms on individual items and cumulatively. Once material began arriving on the west coast of the US and Canada (and Hawaii), it demonstrated that these organisms could survive ‘passive’ transit across the ocean, representing an introduction risk to Washington and neighboring states and provinces. The first large item to land was a large dock heavily laden with thriving Japanese coastal species that came ashore on the Oregon coast in June of 2012, over a year after the tsunami event. This event has had a significant impact on dispersal/rafting science and every new piece of debris that comes ashore continues to advance our knowledge of NIS risk from this vector. It also highlights how large storm events that may occur more frequently in climate change scenarios can contribute to debris vectors in the future. The debris is considered an anthropogenic vector of NIS, despite the natural cause of its release, because the rafting material is man-made, persistent, and designed to float (in many cases) or is made of material that readily floats (plastic, styrofoam, wood, etc.). A National Science Foundation (NSF)-funded project on Japanese tsunami marine debris, led by Dr. James Carlton, has been collecting data on species arriving on debris and will report on this in due course. As a result, this report will only include summary information generated by the NSF project because it would be inappropriate to release their data prior to their reports. Some information on species recorded has already been made public, however, and we refer to these in this account.

Puget Sound biofouling introductions & vectors
92
Figure 4.2. NOAA model of Japanese tsunami debris field movement. NOAA’s GNOME model uses ocean current data and a 1-5% windage value to determine (hindcast) the extent of the debris field over time and the likely location of the highest concentrations of debris. This figure represents the model output as of July 7th, 2013. The highest concentration of debris is predicted (from this model) to be located approximately 1000 miles northeast of Hawaii. Image from http://marinedebris.noaa.gov/tsunamidebris/debris_model.html Marine debris and species landings in Washington and Pacific states As of September 2013, 96 large and small debris items with Japanese marine biofouling have been recorded by Dr. Carlton’s group on the US West Coast and Hawaii through 2012 and 2013. Recording of additional debris is pending and this does not include numerous other debris that have likely landed in more remote parts of the NE Pacific Coast and countless smaller items that have washed ashore. The large debris material that has been recorded onshore has garnered significant media, scientific, and management interest because of the size of some items and the extent and origin of biota attached to it. The most notable landings of Japanese tsunami marine debris (JTMD) include two floating docks that beached in Oregon (Agate beach, June 2012) and Washington (Mosquito Creek, Olympic National Park, December 2012). A further eleven small boats have landed in Oregon, Washington and Hawaii (Hawaii has received the highest number of intercepted items). The other items on the JTMD register and as reported by Washington State (Pleus pers. communication) include buoys, pallets, rope as well as refrigerators, tires, personal items, and significant amounts of wood construction materials that may have been colonized by Japanese species shortly after the tsunami. Twelve percent of all 96 recorded items have landed in Washington and all of these items have been intercepted on the outer coast (e.g. state park, Olympic National Park, and tribal reservation areas) or embayments near the outer coast (e.g. Neah Bay and Grays Harbor areas). As far as we are aware, no JTMD have been intercepted in Puget Sound. The docks sourced from the Port of Misawa in the Aomori Prefecture (Misawa docks) that landed in Agate Beach (OR) and Mosquito Creek beach (WA) showcase the realized vector potential for JTMD. There were 128 species (identification still ongoing) encountered by investigators on the Agate beach dock and 117 were recorded as living Japanese non-pelagic species (i.e. species from Japan’s coastal environment that were alive). The dock that landed near Mosquito Creek had 63 Japanese coastal
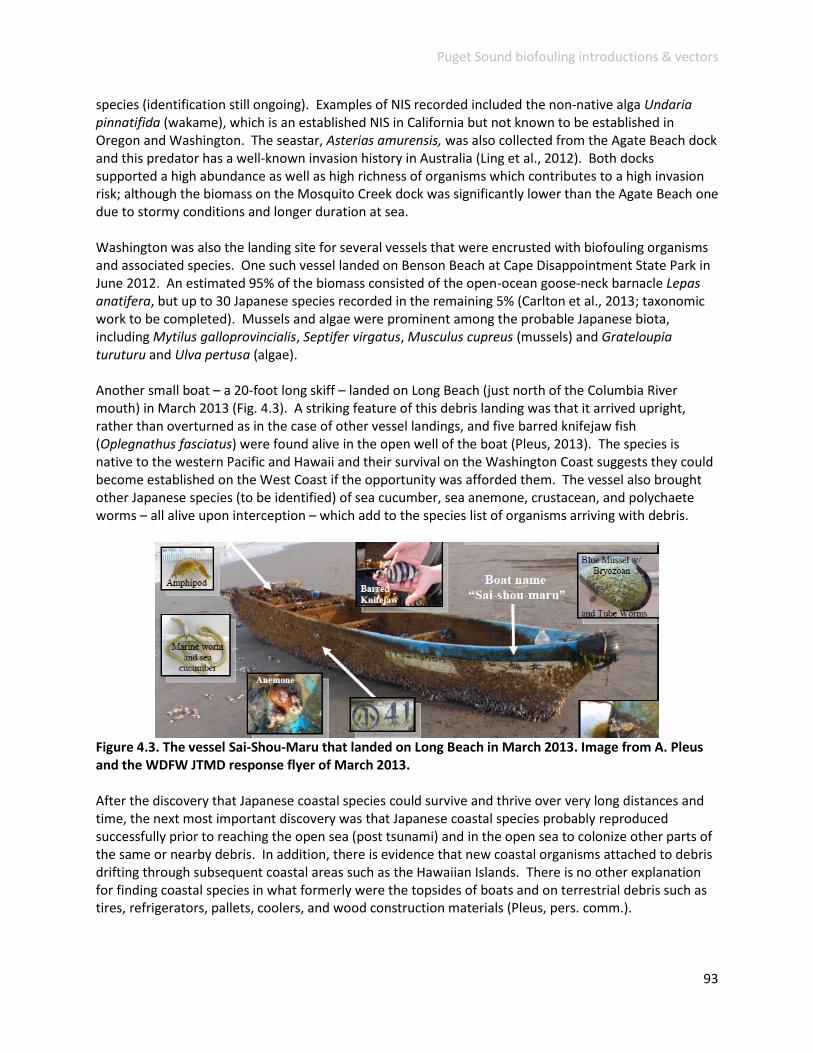
Puget Sound biofouling introductions & vectors
93
species (identification still ongoing). Examples of NIS recorded included the non-native alga Undaria pinnatifida (wakame), which is an established NIS in California but not known to be established in Oregon and Washington. The seastar, Asterias amurensis, was also collected from the Agate Beach dock and this predator has a well-known invasion history in Australia (Ling et al., 2012). Both docks supported a high abundance as well as high richness of organisms which contributes to a high invasion risk; although the biomass on the Mosquito Creek dock was significantly lower than the Agate Beach one due to stormy conditions and longer duration at sea. Washington was also the landing site for several vessels that were encrusted with biofouling organisms and associated species. One such vessel landed on Benson Beach at Cape Disappointment State Park in June 2012. An estimated 95% of the biomass consisted of the open-ocean goose-neck barnacle Lepas anatifera, but up to 30 Japanese species recorded in the remaining 5% (Carlton et al., 2013; taxonomic work to be completed). Mussels and algae were prominent among the probable Japanese biota, including Mytilus galloprovincialis, Septifer virgatus, Musculus cupreus (mussels) and Grateloupia turuturu and Ulva pertusa (algae). Another small boat – a 20-foot long skiff – landed on Long Beach (just north of the Columbia River mouth) in March 2013 (Fig. 4.3). A striking feature of this debris landing was that it arrived upright, rather than overturned as in the case of other vessel landings, and five barred knifejaw fish (Oplegnathus fasciatus) were found alive in the open well of the boat (Pleus, 2013). The species is native to the western Pacific and Hawaii and their survival on the Washington Coast suggests they could become established on the West Coast if the opportunity was afforded them. The vessel also brought other Japanese species (to be identified) of sea cucumber, sea anemone, crustacean, and polychaete worms – all alive upon interception – which add to the species list of organisms arriving with debris.
Figure 4.3. The vessel Sai-Shou-Maru that landed on Long Beach in March 2013. Image from A. Pleus and the WDFW JTMD response flyer of March 2013. After the discovery that Japanese coastal species could survive and thrive over very long distances and time, the next most important discovery was that Japanese coastal species probably reproduced successfully prior to reaching the open sea (post tsunami) and in the open sea to colonize other parts of the same or nearby debris. In addition, there is evidence that new coastal organisms attached to debris drifting through subsequent coastal areas such as the Hawaiian Islands. There is no other explanation for finding coastal species in what formerly were the topsides of boats and on terrestrial debris such as tires, refrigerators, pallets, coolers, and wood construction materials (Pleus, pers. comm.).

Puget Sound biofouling introductions & vectors
94
Response to invasion risks posed by tsunami marine debris After the disaster of the earthquake and tsunami in March of 2011, JTMD has provided a novel and interesting challenge to agencies in Hawaii and Western North America. The debris field has undoubtedly posed an invasion threat to Washington, and possibly to Puget Sound, but the response to the threat has been timely for reducing risks. The science and management response to the debris (from a pollution and invasion perspective) has included funding or action from US federal agencies (e.g. NOAA, NSF, Olympic National Park), the Japanese government, all of the US Pacific States (e.g. WDFW), British Columbia, universities and marine laboratories, local agencies, and citizens. While there may be issues related to funding, coordination, or longer term monitoring, the response has been an interesting case-study that is likely to provide a strong understanding of the vector risk from tsunami debris and effective intervention to manage invasion risks. The scientific component involves taxonomists, invasion ecologists, geneticists, and parasitologists who will provide insight on the extent and consequence of debris dispersal, including the survivorship of marine organisms in open ocean conditions for extended periods. The management component includes field crews intercepting debris landings to collect samples and eradicate species from structures, as well as policy-level discussions on coordinating responses among states and agencies. The WDFW has a marine debris response plan (WDFW, 2012) that covers the invasion risk from debris as well as public safety, HAZMAT concerns, habitat protection, outreach, and monitoring. The agency has been very proactive in coordinating with federal and local groups to provide adaptive responses to a somewhat unpredictable vector. While there is no guarantee that arrivals of debris will not lead to successful introductions of non-native species, it is likely that the action taken by WDFW has substantially reduced the risk of invasions by reducing the residence time of non-native biota after arrival. The issue of monitoring landing sites in the coming months and years is an important one to address, but this is also true of monitoring for marine NIS in general. If possible, the example of tsunami debris in Washington should be used to demonstrate the value of vector management to promote a broader framework of monitoring (next section) that allows us to evaluate not only debris landing sites, but for invasion rates and efficacy of management efforts more generally. The experience with JTMD also provides an impetus to start looking at storm generated marine debris as a potential NIS risk. With the potential for more frequent climate-driven pulses of both marine- and terrestrial-origin debris through storms, floods, and a rise in sea levels, agencies should anticipate the debris vector to remain a concern (Pleus, pers. comm.).
Biofouling research and monitoring Monitoring for marine bioinvasions is an important but underappreciated component of invasion science. Much of the information on spatial and temporal patterns of invasions is collated from literature accounts and observations rather than standardized repeated measures. There is much value in collated information from independent sources over time and space, but there are also limitations and biases to consider (e.g. determining species absence from sites, timing of detection, and taxonomic groups evaluated; Ruiz et al., 2000). A repeated and quantitative or semi-quantitative approach is not without issues as well – especially regarding cost and detection rates – but its adoption over time will provide a more reliable estimate of invasion rates and vector strength than post hoc comparisons of literature studies and disparate sampling events. In Puget Sound, the main source of data for marine invasions comes from databases of information from the literature (e.g. NEMESIS data was the source of information for Section 1 of this report) and two

Puget Sound biofouling introductions & vectors
95
rapid assessment surveys conducted in 1998 and 2001 (Cohen et al., 1998; 2001, both of which are accounted for in NEMESIS). Furthermore, a report by Cohen (2004) described many considerations for an Exotic Species Detection Program (ESDP) for Puget Sound. Among the considerations were taxonomic expertise for species identification, determining invasion and population status, vector associations, and taxonomic focus of sampling programs. Cohen recommended four types of sampling regime: (1) utilize existing sampling efforts, (2) develop new sampling programs (aimed at areas not covered by existing ones), (3) targeted taxonomic collections, and (4) volunteer monitoring. Here, we list a series of sampling programs that could be done independently or simultaneously depending on funding availability and WDFW priorities. All of the considerations described by Cohen (2004) and others regarding taxonomic expertise and species status apply, but we do not cover these topics in detail. Our priorities for creating the list were based on filling data needs that will help to assess invasion rates into the future and determine vector strength for assessing the efficacy of vector management programs. The scope of work (spatial, temporal and taxonomic) can be scaled to funding levels, and examples of existing programs elsewhere are cited where appropriate.
List of biofouling and NIS sampling programs for Puget Sound 1. Marine species sampling at vector nodes (ports, marinas and aquaculture sites)
The most commonly sampled sites for assessing marine invasions are ports and marinas because these areas have high associations with maritime vectors. Ports and marinas can be viewed as sentinel sites for bioinvasions, especially for introductions resulting from biofouling vectors. The approaches to surveying shipping and boating harbors include a variety of methods that maximize detection rates among habitats. It has been argued that qualitative methods that maximize species collections are superior to more quantitative approaches (Cohen, 2004), but quantitative approaches that generate species accumulation curves are probably most suitable for detection of diversity and assessments of survey completeness (Ruiz & Hewitt, 2002). This is especially true if habitats are partitioned and sampled independently. The appropriate sampling design would include distinct methods to sample artificial hard-substratum, including dock walls, break-walls, floating docks, and pilings; fouling plate surveys; soft-sediment habitats such as intertidal and subtidal mudflats; and plankton sampling. Port surveys in Australia and New Zealand have been implemented relatively recently, in the last 15 years, contributing significantly to these regions’ understanding of invasion patterns and management efficacy. Similarly, some major ports in the US and a range of bays in California are being surveyed comprehensively at present (Smithsonian Environmental Research Center programs). Such surveys are comprehensive but costly; the required funding, time, and expertise makes this approach the most costly of all monitoring/research suggestions here. Sites in Puget Sound that would be appropriate for vector node sampling include the following lists, a subset of which could be chosen based on vector activity and spatial distribution of sites: Ports and marinas: Bellingham Bay, Budd Inlet (Olympia), Commencement Bay (Tacoma), Elliott Bay (Seattle), Port Angeles, Possession Sound (Everett) Marinas: Anacortes, Des Moines, Eagle Harbor (Bainbridge, includes ferry terminal), Edmonds, Friday Harbor (includes a ferry terminal), Neah Bay, Pleasant Harbor, Port Townsend, Shilshole. Aquaculture: Totten Inlet, Hammersley Inlet, Hood Canal, Samish Bay

Puget Sound biofouling introductions & vectors
96
2. Marine species sampling in natural habitats and areas of conservation value The spread of NIS and infiltration of natural habitats by them plays an important role in increasing the impact of NIS. There is very little NIS sampling effort expended in non-artificial habitat, however, with the exception of some notable mobile and algal species (e.g. green crabs and Sargassum algae). This results in poor understanding of spread of NIS and their interactions with native species. Sampling in natural habitats could be focused on two scenarios: (a) habitats near artificial structures (e.g. biofouling surveys of rocky reefs near ports and marinas) and (b) habitats of conservation or resource value (e.g. seagrass beds, fish spawning grounds). While there are prior examples of port and marina sampling programs to base a monitoring program on, examples of broader scale monitoring of natural habitats are few (e.g. deep water monitoring of Didemnum vexillum on Georges Bank). Nonetheless, sampling design can be tailored to particular habitats to survey their benthic communities.
3. Engaging the public in biofouling/NIS monitoring through citizen science projects A potential cost-effective method for increasing the spatial extent of survey efforts is to engage in citizen science monitoring for NIS. An example of such a program has been running in Alaska for the past three years (http://platewatch.nisbase.org/) whereby volunteers monitor fouling plates or floating docks for a target list of species and ‘bioblitz’ events are held to survey particular locations quickly. Relatively modest funding is required to have a logistical and website monitor to engage with volunteers and organize data submission and proofing. Surveys can then be carried out across a large spatial scale for a pre-determined list of NIS at a fraction of the cost of conducting comprehensive NIS surveys (such as items 1 and 2 above). Such citizen science monitoring efforts are most appropriate for conspicuous taxa that are easily recognized without a high level of taxonomic knowledge. Because of that, it is perhaps necessary to have a comprehensive survey occur prior to citizen-based programs in order to identify the best use of citizen engagement. Digital photographs, internet applications (apps), and web tools increase the opportunity for rapid identification and these are being developed (e.g. as part of the plate-watch program). The outreach and public awareness of NIS issues is also a major benefit of citizen science (in addition to data collection).
4. Japanese tsunami and other marine debris landing-site monitoring There has been a commendable and timely response to the threat of Japanese tsunami debris in Washington and throughout the northwest Pacific region. This response has been exclusively aimed at intercepting debris landings when they are initially observed and an important follow-up aspect of managing NIS risk from debris is landing-site monitoring. Ultimately, the NIS consequence of debris landings can only be assessed using surveys to determine if NIS populations have become established near debris landing sites. In most cases, this will pose a logistical challenge given that much of the debris material has landed on exposed rocky or sandy shores. However, beach seining, low-tide monitoring, and subtidal surveys could be carried out on a once-off basis to quickly assess if previously undetected NIS populations are present at any of the debris landing sites.
5. Vector sampling With the exception of ballast water and JTMD, the major vectors of NIS arriving to Puget Sound have not been sampled adequately or at all. This includes ship and boat biofouling, in particular, but also other vectors such as bait, aquaculture, and aquarium trade. Sampling vector biota helps to (a) determine the risk of NIS incursion from different vectors, (b) predict which NIS are likely to become

Puget Sound biofouling introductions & vectors
97
newly established, and (c) analyze the effect of vector management approaches at the individual vector and policy levels. For biofouling, a program of vessel sampling in ports and marinas is most appropriate. Vessel sampling generally involves scientific diving to collect images and biological samples to estimate the extent and composition of biofouling communities on vessels’ submerged surfaces. Specific protocols are designed for ships and boats, but both approaches sample hull and niche areas and attempt to compare biofouling across vessel types, maintenance practices, and voyage histories. Non-vessel vectors can also be evaluated by sampling vector units (e.g. bait boxes, aquarium trade shipments) across the region. While a program of sampling each vector over one or two years is preferable, another approach to consider is the novel ‘vector blitz’ method (Williams et al., 2013), which is designed to sample as many maritime vectors in one place (e.g. Puget Sound) within a specified short time frame (e.g. three weeks). The vector blitz approach can provide a quick overall impression and reduce some costs by constraining the timeframe for sampling, but the cost-benefit analysis of multi-vector sampling programs versus a blitz is required to better understand the trade-offs.
6. Recreational boat traffic monitoring There is a limited understanding of the recreational vessel traffic network in Washington and elsewhere. While commercial vessels and fishing vessels provide a full or partial record of their movements, recreational boats do not report their movements in a standardized way. One biofouling NIS research priority for Washington is to conduct a large-scale marina traffic study that provides data on the connectivity strength between marinas, such that NIS spread risks can be evaluated. This desk-based study (no in-water sampling) would engage with marinas to gather standardized transient arrival records for at least a one-year period, leading to a network model of boat traffic. Our initial results of CBP and boater questionnaires suggest such a study would reveal connectivity strength between Washington and BC marinas which could inform coordinated responses between both jurisdictions.
7. Rapid Assessment Surveys of understudied locations The rapid assessment approach to NIS monitoring is well established; biological samples are collected in a haphazard manner in a certain location without using standardized sampling units. The benefits of the approach are the relative speed at which collections can be made, which reduces the costs and logistical challenges that more quantitative approaches require. However, drawbacks include limitations on formal analyses and difficulty understanding the completeness of each survey. There are also no savings in terms of time or cost on sample processing – specifically taxonomic work – although some time and cost savings can be made by only sampling richness and ignoring abundance of organisms.
8. Population monitoring and incursion response research Detecting marine and estuarine invasions is often focused at the community level to determine the species composition of communities and the non-native portion of that composition. It is also valuable to examine the population extent of invasions, directed toward a ‘hitlist’ of known species of concern, to develop an understanding of spread, impact and possible management responses. In particular, there is s dearth of information on impacts for many NIS and such studies are amenable to graduate student projects of one to two years.

Puget Sound biofouling introductions & vectors
98
Furthermore, desk-based and field research into incursion response following NIS detections would serve to (a) provide a formal decision support system and tools that identifies triggers, timing and actions for responses, and (b) in situ trials for control and eradication of potential pest species to help remove or reduce populations
Acknowledgements
We wish to thank Maggie McKeown and Patricia Jatczak for their management, oversight, and advice on this project. We also thank Allen Pleus for interactions and advice throughout the project. We are grateful to the following reviewers for providing suggestions and revisions on an earlier draft of this report: Allen Pleus, Richard Osman, Scott Godwin, Chris Scianni, Sonia Gorgula, Rian Hooff, Mike Moore, Blain Reeves, Helen Berry, Kevin Anderson, and Maggie McKeown. This project has been funded wholly or in part by the United States Environmental Protection Agency under assistance agreement PC 00J29801 to Washington Department of Fish and Wildlife. The contents of this document do not necessarily reflect the views and policies of the Environmental Protection Agency, nor does mention of trade names or commercial products constitute endorsement or recommendation for use
REFERENCES
Ashton G, Zabin C, Davidson I, Ruiz G (2012) Aquatic invasive species risk assessments: recreational
vessels as vectors for non-native marine species in California. Report to the California Ocean Science Trust, Oakland, California. 57pp.
Bohlander J (2009) Review of options for in-water cleaning of ships. Report prepared for MAF Biosecurity New Zealand.
Bolton, T.F. and W.M. Graham. 2006. Jellyfish on the rocks: bioinvasion threat of the international trade in aquarium live rock. Biological Invasions 8: 651-653.
Carlton JT (1979) History, biogeography and ecology of the introduced marine and estuarine invertebrates of the Pacific Coast of North America. Ph.D. thesis. University of California, Davis, CA. 904pp.
Carlton JT, Cordell JR, Hansen GI, Pleus A (2013) Report on the First Tsunami Vessel, the Sou-you, washed ashore in North America with living Japanese Species. NSF RAPID report on Japanese Tsunami Debris.
Carlton JT, Cohen AN (2007) Introduced marine and estuarine invertebrates. Pages 28-31 in: The Light and Smith Manual: Intertidal Invertebrates from Central California to Oregon, Fourth Edition, J.T. Carlton (ed.), University of California Press, Berkeley, CA.
Chang AL, Grossman JD, Spezio TS, Weiskel HW, Blum JC, Burt JW, Muir AA, Plovia-Scott J, Veblen KE, Grosholz ED. (2009) Tackling aquarium invasions: risk and opportunities for the aquarium fish industry. Biological Invasions 11:773-785.

Puget Sound biofouling introductions & vectors
99
Cohen AN, Berry HD, Mills CE, Milne D, Britton-Simmons K, Wonham MJ, Secord DL, Barkas JA, Bingham B, Bookheim BE, Byers JE, Chapman JW, Cordell JR, Dumbauld B, Fukuyama A, Harris LH, Kohn AJ, Li K, Mumford TF, Radashevsky V, Sewell AT, Welch K (2001) Washington State exotics expedition 2000: A rapid survey of exotic species in the shallow waters of Elliott Bay, Totten and Eld Ilets, and Willapa Bay. Report to the Washington State Department of Natural Resources. Olympia, Washington. 52pp.
Cohen AN, Carlton JT (1995). Biological Report. Nonindigenous Aquatic Species in a United States Estuary: A Case Study of the Biological Invasions of the San Francisco Bay and Delta. A Report for the U.S. Fish and Wildlife Service, Washington, DC and The National Sea Grant College Program, Connecticut Sea Grant, NTIS Report Number PB96-166525. 272pp.
Cohen, A.N. 2012 Aquatic invasive species vector risk assessments: Live marine seafood and the introduction of non-native marines species into California. Final report to the California Ocean Sciences Trust, July 2012.
Coutts A (2012) Australia’s biofouling management requirements: lessons learnt from undertaking vessel inspections for invasive marine species. Presentation at the Prevention First Symposium, Long Beach California, October 2012.
Davidson I, Ashton G, Zabin C, Ruiz G (2012) Aquatic invasive species vector risk assessments: The role of fishing vessels as vectors for marine and estuarine species in California. Report to the California Ocean Science Trust. Oakland, California. 70pp.
Davidson I, Sytsma M, Ruiz G (2006) Preliminary investigations of biofouling of ships’ hulls: ANS investigations in the Columbia River. United States Coast Guard Research and Development Center, Groton, CT. 65pp
Davidson IC, McCann LD, Fofonoff PW, Sytsma MD, Ruiz GM (2008) The potential for hull-mediated species transfers by obsolete ships on their final voyages. Diversity &Distributions. 14: 518-529.
Field D (1999) Disaster averted? Black striped mussel outbreak in northern Australia. Fish Farming International. 26: 30-31.
Floerl O, Peacock L, Seaward K, Inglis G (2010) Review of biosecurity and contaminant risks associated with in-water cleaning. Report to the Australian Department of Agriculture, Fisheries & Forestry. 136pp.
Fofonoff PW, Ruiz GM, Steves B, Carlton JT (2012) National Exotic Marine and Estuarine Species Information System (NEMESIS). http://invasions.si.edu/nemesis/
Fowler AE, A.M.H. Blakeslee AMH, Miller AW, Moser F, Canning-Clode J, Ruiz G (2013) Importation of baitworms and live algal packing materials to the Mid-Atlantic: vector characterization. International Marine Bioinvasions Conference, Vancouver, August 20-22, 2013 B.C. Canada.
Gollasch S (2006) Overview on introduced aquatic species in European navigational and adjacent waters. Helgoland Marine Research. 60: 84-89.
Hargreaves JA (2011) Molluscan shellfish aquaculture and best management practices. In Shumway, S.E., ed, Shellfish Aquaculture and the Environment, John Wiley & Sons, Inc. pp. 51-80.
Harley C, Anderson KM, Lebreton CAM, MacKay A, Ayala-Diaz M, Chong SL, Pond LM, Amerongen-Maddison JH, Hung BHC, Iversen SL, Wong DCM (2013) The introduction of Littorina littorea to British Columbia, Canada: potential impacts and the important of biotic resistence by native predators. Marine Biology. 160:1529-1541.
Haska, C.L., C. Yarish, G. Kraemer, N. Blaschik, R. Whitlatch, H. Zhang and S. Lin. 2011. Baitworm packaging as a potential vector of invasive species. Biological Invasions 14: 481-493.
Hewitt C, Campbell M, Thresher R, Martin R, Boyd S, Cohen B, Currie D, Gomon M, Keough M, Lewis J, Lockett M, Mays N, McArthur M, O’Hara T, Poore G, Ross J, Storey M, Watson J, Wilson R (2004) Introduced and cryptogenic and species in Port Phillip Bay, Victoria, Australia. Marine Biology. 144: 183–202.

Puget Sound biofouling introductions & vectors
100
Hewitt CL, Campbell ML (2007) Mechanisms for the prevention of marine bioinvasions for better biosecurity. Marine Pollution Bulletin. 55: 395-401.
Hewitt CL, Campbell M (2010) The relative contribution of vectors to the introduction and translocation of marine invasive species. Report to the Australian Department of Agriculture, Fisheries & Forestry. 56pp.
Hewitt CL, Willing J, Bauckham A, Cassidy AM, Cox CMS, Jones L, Wotton DM (2004) New Zealand marine biosecurity: delivering outcomes in a fluid environment. New Zealand Journal of Marine and Freshwater Research. 38: 429-438.
Hulme PE (2009) Trade, transport and trouble: managing invasive species pathways in an era of globalization. Journal of Applied Ecology. 46: 10-18.
ICES (International Council on the Exploration of the Seas) 2006. Report of the Working Group on Environmental Interactions of Mariculture (WGEIM), 24-28 April 2006, Narragansett, Rhode Island, USA. ICES CM 2006/MCC:03.
Inglis GJ, Floerl O, Ahyong S, Cox S, Unwin M, Ponder-Sutton A, Seaward K, Kospartov M, Read G, Gordon D, Hosie A, Nelson W, d’Archino R, Bell A, Kluza D (2010) The biosecurity risks associated with biofouling on international vessels arriving in New Zealand: Summary of the patterns and predictors of fouling. Report to MAF Biosecurity New Zealand, Policy & Risk Directorate Project. 182pp.
Keller RP, Lodge DM (2007) Species invasions from commerce in live aquatic organisms: problems and possible solutions. BioScience 57:428-436. doi:10.1641/B570509
Kruckeberg AR (1991) The natural history of Puget Sound country. University of Washington Press. Seattle and London. 468pp.
Ling SD, Johnson CR, Mundy CN, Morris A, Ross DJ (2012) Hotspots of exotic free-spawning sex: man-made environment facilitates success of an invasive seastar. Journal of Applied Ecology. 49: 733-741.
Meinesz A, Vaugelas J, Hesse B, Mari X (1993) Spread of the introduced tropical green alga Caulerpa
taxifolia in northern Mediterranean waters. Journal of Applied Phycology. 5: 141-147. Ministry for Primary Industries (New Zealand) (2010) Requirements for vessels arriving in New Zealand.
16pp. Novak (2011) Gray’s Harbor biofouling test plate study technical memorandum: Pontoon moorage site.
Report to the Washington State Department of Transportation, Seattle, Washington. 70pp. NRC (National Research Council). 2010. Ecosystem concepts for sustainable bivalve culture. The National
Academies Press, Washington, D.C. NIVA 2012. Collection efficiency of the ECOsubsea prototype hull cleaner. A preliminary study.
Norwegian Institute of Water Research report, SNO 6426-2012. 10 pp. Olson AM (1999) Do live marine products serve as pathways for the introduction of nonindigenous
species? Marketing and shipping live aquatic products, pp. 243-247. Padilla DK, McCann MJ and Shumway SE (2011) Marine invaders and bivalve aquaculture: sources,
impacts, and consequences. In Shumway, S.E. (ed) Shellfish Aquaculture and the Environment, John Wiley & Sons, Inc. pp. 51-80.
Pleus A (2012) Washington State aquatic nuisance species committee: Report to the 2012 legislature. Wahsington Department of Fish and Wildlife. 26pp.
Pleus A (2013) Short report on the Japanese tsunami debris landing of a skiff on Long Beach, Washington on March 22 2013. WDFW short report (March 26, 2013)
Pleus A, LeClair L, Schultz J, Lambert G (2008) 2007-09 tunicate management plan. Washington State Department of Fish & Wildlife. Aquatic Invasive Species Unit. In coordination with the tunicate response advisory committee. 64pp.

Puget Sound biofouling introductions & vectors
101
PMNM (2009) BMP-001. Alien Species Inspection Standards for Maritime Vessels. http://www.papahanaumokuakea.gov/permit/pdf/001_marinealien.pdf
Puget Sound Action Team (2007) Washington State’s response to an invasion of non-native tunicates. Report to the Washington State Legislature. Olympia, Washington. 38pp.
Ruiz G, Fofonoff P, Carlton J, Wonham M, Hines A (2000) Invasion of coastal marine communities in North America: apparent patterns, processes, and biases. Annual Review of Ecology and Systematics. 31: 481–531.
Ruiz G, Hewitt C (2002) Toward understanding patters of coastal marine invasions: A prospectus. In: Invasive aquatic species of Europe, Leppakoski E, Olenin S, Gollasch S (eds), Kluwer Academic Publishers, Dordrect. p 529-547.
Ruiz G, Hewitt C (2009) Latitudinal patterns of biological invasions in marine ecosystems: a polar perspective. In: Smithsonian at the poles: contributions to international polar year science. Krupnik I, M.A. Lang MA, MillerSE (eds). Smithsonian Institution Scholarly Press, Washington. pp 347–358.
Ruiz GM, Fofonoff PW, Steves B, Foss SF, Shiba SN (2011) Marine invasion history and vector analysis of California: a hotspot for western North America. Diversity and Distributions. 17: 362-373.
Showalter S, Savarese J (2005) The existing US legal regime to prevent the hull transport of aquatic invasive species. Report to the California Sea grant Extension Program. 10pp.
Strecker AL, Campbell PM, and Olden JD. (2011) The aquarium trade as an invasion pathway in the Pacific Northwest. Fisheries 36: 74-85.
Sylvester F, Kalaci O, Leung B, Lacoursiere-Roussel A, Clarke-Murray C, Choi FM, Bravo MA, Therriault TW, MacIsaac HJ (2011) Hull fouling as an invasion vector: can simple models explain a complex problem? Journal of Applied Ecology. 48: 415-423.
Sylvester F, MacIsaac HJ (2010) Is vessel hull fouling an invasion threat to the Great Lakes. Diversity & Distributions. 16:132-143.
Takata L, Dobroski N, Scianni C, Falkner M (2011) 2011 biennial report on the California marine invasive species program. California State Lands Commission, Marine Facilities Division. Sacramento, California. 136pp.
Takata L, Falkner M, Gilmore S (2006) Commercial vessel fouling in California: analysis, evaluation, and recommendations to reduce nonindigenous species release from the non-ballast water vector. Report to the California State Legislature. 83pp.
Walters L, Odom R, Zaleski S (2011) The aquarium hobby industry and invasive species: has anything changed. Peer-reviewed letter. Frontiers in Ecology and the Environment. doi:10.1890/11.WB.007
WDFW [Washington Department of Fish & Wildlife] (2012) Marine debris response annex to Washington State response plan. 14pp
Williams S, Davidson I, Pasari J, Ashton G, Carlton J, Crafton E, Fontana R, Grosholz E, Miller AW, Ruiz G, Zabin C (2013, in press) Managing multiple vectors for marine invasions in an increasingly connected world. BioScience.
Williams SL, Crafton RE, Fontana RE, Grosholz ED, Pasari J, Zabin CJ. A vector analysis of the aquarium and aquascape (‘Ornamental’ Species) Trades in California. Final report to the California Ocean Sciences Trust, July 2012.
Yarish C., Whitlatch R, Kraemer G, Lin S. (2009) Multi-component evaluation to minimize the spread of aquatic invasive seaweeds, harmful algal bloom microalgae, and invertebrates via the live bait vector in Long Island Sound. Publications of the Department of Ecology & Evolutionary Biology, University of Connecticut, Stamford, CT.

Puget Sound biofouling introductions & vectors
102
Zabin C, Ruiz G, Ashton G, Davidson I (2012) Overview of Current Regulations, Guidelines, and Practices Related to Ship-Mediated Marine Bioinvasions. In: Micronesia Biosecurity Report to US Department of Defence.

Puget Sound biofouling introductions & vectors
103
Appendix 1. Nonindigenous marine and estuarine invertebrates and algae in Puget Sound and the WA Pacific Coast. These data were extracted from the
NEMESIS database (http://invasions.si.edu/nemesis/index.html), which is updated regularly and recent records are subject to change. The information in this table should be considered provisional and remains under review for the final report of this project. The table includes species names, their taxonomic group, their recorded occurrence () or absence (-) in Puget Sound and the Pacific Coast of WA, the year of first record for WA, and the vectors associated with their introductions in the state (for initial and subsequent records [spread]). Vector attributions reflect the current data in NEMESIS and may be changed for the final report pending review and updating. Vector codes are as follows: VB Vessel Biofouling; SA Shellfish Accidental; SI Shellfish Intentional; BW Ballast Water; DB Dry Ballast; BV Bait Vector; APS Aquatic Plant Shipments; ND Natural Dispersal; cargo and biocontrol. There are 94 species listed in this table, 74 of which have been recorded in Puget Sound and 59 recorded from the Pacific Coast of WA.
Species Taxonomic Group Puget Sound
Pacific Coast
1st Record in WA
Vectors
Sargassum muticum Algae 1948 SA, VB, ND
Attheya armata Algae - 1950 BW, DB
Lomentaria hakodatensis Algae - 1968 SA, VB, BW
Caulacanthus ustulatus Algae - 1995 SA, BW, VB
Gelidium vagum Algae - 1996 SA
Ceramium kondoi Algae 2007 SA, BW, VB
Limnodriloides monothecus Annelids-Oligochaetes - 1981 BW, VB, DB, SA
Tubificoides diazi Annelids-Oligochaetes - 1984 BW, DB, SA
Hobsonia florida Annelids-Polychaetes 1940 BW, VB, SA
Pseudopolydora kempi Annelids-Polychaetes 1968 VB, SA, BW
Streblospio benedicti Annelids-Polychaetes 1974 BW, VB, SA
Heteromastus filiformis Annelids-Polychaetes - 1977 BW, VB, SA
Pseudopolydora paucibranchiata Annelids-Polychaetes - 1993 VB, SA, BW
Alitta succinea Annelids-Polychaetes - 1998 VB, BW, BV
Pseudopolydora bassarginensis Annelids-Polychaetes - 2000 VB, SA, BW
Clymenella torquata Annelids-Polychaetes - 2006 SA, BW
Aedes togoi Arthropoda-Insects - 1980 BW, Cargo, ND
Chilacis typhae Arthropoda-Insects 1997 Cargo, APS, DB
Prokelisia marginata Van Duzee Arthropoda-Insects - 2000 Biocontrol
Diadumene lineata Coelenterates-Anthozoan 1939 VB, SA, SI,
Nematostella vectensis Coelenterates-Anthozoan 1973 VB, SA, BW

Puget Sound biofouling introductions & vectors
104
Species Taxonomic Group Puget Sound
Pacific Coast
1st Record in WA
Vectors
Cordylophora caspia Coelenterates-Hydrozoans 1920 VB, APS, SA
Cladonema radiatum Coelenterates-Hydrozoans - 1988 VB, BW, SA
Monocorophium acherusicum Crustaceans-Amphipods 1915 BW, VB, SI
Monocorophium insidiosum Crustaceans-Amphipods 1915 BW, VB, SA, VB, BW, SA
Chelura terebrans Crustaceans-Amphipods - 1960 VB
Melita nitida Crustaceans-Amphipods 1966 BW, VB, SA
Grandidierella japonica Crustaceans-Amphipods 1977 SA, BW, VB, ND
Eochelidium sp. A Crustaceans-Amphipods - 1995 BW, VB
Caprella drepanochir Crustaceans-Amphipods - 1996 VB, BW, SA
Ampithoe valida Crustaceans-Amphipods 1998 BW, VB, SA
Caprella mutica Crustaceans-Amphipods - 1998 BW, VB, SA
Incisocalliope derzhavini Crustaceans-Amphipods - 1998 VB, BW
Jassa marmorata Crustaceans-Amphipods 1998 BW, VB, SA
Amphibalanus improvisus Crustaceans-Barnacles - 1955 SI, BW, VB
Mytilicola orientalis Crustaceans-Copepods 1938 SA, VB
Sinocalanus doerrii Crustaceans-Copepods - 1990 BW
Pseudodiaptomus inopinus Crustaceans-Copepods - 1991 BW, ND, BW
Eurytemora carolleeae Crustaceans-Copepods - 1998 BW, SA
Harpacticella paradoxa Crustaceans-Copepods - 2000 BW, SA, APS
Nippoleucon hinumensis Crustaceans-Cumaceans 1998 BW, SA
Limnoria tripunctata Crustaceans-Isopods 1964 VB, SA
Synidotea laevidorsalis Crustaceans-Isopods - 1987 VB, BW, SA
Orthione griffenis Crustaceans-Isopods 1995 BW, BV, ND, SA
Caecidotea racovitzai Crustaceans-Isopods - 1997 BW, APS
Eusarsiella zostericola Crustaceans-Ostracods - 2000 SA
Palaemon macrodactylus Crustaceans-Shrimp - 1995 BV
Sinelobus cf. stanfordi Crustaceans-Tanaids - 2000 BW, VB
Schizoporella japonica Ectoprocts 1927 SA, VB
Bowerbankia gracilis Ectoprocts 1953 VB, SA, BW
Cryptosula pallasiana Ectoprocts 1972 VB, SA
Bugula sp. 1 Ectoprocts - 1993 VB
Bugula sp. 2 Ectoprocts - 1998 VB
Bugula stolonifera Ectoprocts - 1998 VB
Watersipora subtorquata Ectoprocts - 2002 VB

Puget Sound biofouling introductions & vectors
105
Species Taxonomic Group Puget Sound
Pacific Coast
1st Record in WA
Vectors
Barentsia benedeni Entoprocts - 1998 VB, SA
Claviceps purpurea var. spartinae Fungi - 2001 DB, SA
Mya arenaria Mollusks-Bivalves 1884 SI, SA
Crassostrea virginica Mollusks-Bivalves - 1895 SI
Crassostrea gigas Mollusks-Bivalves 1902 SI, ND
Venerupis philippinarum Mollusks-Bivalves 1924 SA, SI, ND
Petricolaria pholadiformis Mollusks-Bivalves - 1943 SA
Neotrapezium liratum Mollusks-Bivalves 1947 SA
Teredo navalis Mollusks-Bivalves - 1957 VB
Musculista senhousia Mollusks-Bivalves - 1959 SA
Nuttallia obscurata Mollusks-Bivalves 1991 BW, ND
Mytilus galloprovincialis Mollusks-Bivalves - 1994 BW, VB, SI, SA
Macoma petalum Mollusks-Bivalves - 1996 SA, BW
Laternula gracilis Mollusks-Bivalves - 1998 SA
Batillaria attramentaria Mollusks-Gastropods 1924 SA
Pteropurpura inornata Mollusks-Gastropods 1924 SA
Urosalpinx cinerea Mollusks-Gastropods 1929 SA
Crepidula fornicata Mollusks-Gastropods 1931 SA
Myosotella myosotis Mollusks-Gastropods 1936 DB, SA, Cargo
Ilyanassa obsoleta Mollusks-Gastropods 1945 SA
Crepidula plana Mollusks-Gastropods - 1949 SA
Nassarius fraterculus Mollusks-Gastropods - 1960 SA
Cecina manchurica Mollusks-Gastropods 1961 SA
Crepidula convexa Mollusks-Gastropods - 1970 SA
Haminoea japonica Mollusks-Gastropods - 1986 BW, VB, SA
Potamopyrgus antipodarum Mollusks-Gastropods 2002 SA
Pseudostylochus ostreophagus Platyhelminthes - 1953 SA
Cercaria batillariae Platyhelminthes - 2000 SA
Trochammina hadai Protozoans 1971 BW, SA, Unknown Vector
Cliona sp. Sponges - 1932 SA
Clathria prolifera Sponges - 1967 SA, VB
Chalinula loosanoffi Sponges - 2000 VB, SA
Diplosoma listerianum Tunicates - 1966 VB
Botrylloides violaceus Tunicates 1979 VB, SA, VB

Puget Sound biofouling introductions & vectors
106
Species Taxonomic Group Puget Sound
Pacific Coast
1st Record in WA
Vectors
Botryllus schlosseri Tunicates 1998 VB, SA
Ciona savignyi Tunicates - 1998 VB, BW, VB
Molgula manhattensis Tunicates 1998 VB, VB, SA
Styela clava Tunicates - 1998 VB
Didemnum vexillum Tunicates - 2004 VB, SA, SA
Puget Sound biofouling introductions & vectors
107
Appendix 2. The boater questionnaire for Puget Sound
Puget Sound Boater Survey A Questionnaire for Boaters regarding the Maintenance, Voyages, and Marine Biology of Boating Dear boater,
Portland State University (PSU) and the Smithsonian Environmental Research Center (SERC) are conducting a survey of boat owners regarding recreational boat movements and hull maintenance. We are interested in the marine biology of animals and seaweeds that can attach to and live on the bottoms of boats (biofouling). Our questions are aimed at gathering information from Puget Sound boaters on hull maintenance and voyages to better understand factors that contribute to biofouling on boats. We have prepared four sets of questions on the front and back of the attached page and would greatly appreciate your time in answering them. We estimate it will take less than 5 minutes to answer these questions. Please return your answered questionnaire to us via mail, email, to your marina office, or online (before October 14th, 2013 - Columbus Day). Your participation is voluntary and you may remain anonymous if you choose. The purpose of this questionnaire is for research only and there is no risk attached to your participation. We do not require your name or contact details, however, you may provide them if you wish to be entered into a drawing for a $200 gift certificate toward West Marine. Any personal information provided will be destroyed at the completion of the project. If you have any questions regarding the questionnaire, please contact Ian Davidson ([email protected]; 503-725-2923), Chela Zabin ([email protected]; 415-435-3528) or Gail Ashton ([email protected]; 415-435-7128). The questionnaire has been reviewed by the Human Subjects Research Review Committee at PSU (who can be contacted 1-877-480-4400) and the Institutional Review Board at SERC (202-633-7110). All reports or correspondence will be kept confidential. By completing the survey, you are granting the investigators permission to use your responses in the aggregate data collected for this study. Any personal information provided will be seen only by the researchers and destroyed at the completion of the project. We very much appreciate your assistance in this research. Yours sincerely,
Ian Davidson (Portland State University) Chela Zabin (Smithsonian Environmental Research Center) Gail Ashton (Smithsonian Environmental Research Center)

Puget Sound biofouling introductions & vectors
108
Puget Sound Boater Survey
Vessel Information & Particulars
Today’s Date (Day/Month/Year):
Type of boat (check the appropriate box)
Sailboat/Yacht ☐ Recreational motorboat ☐
Fishing boat ☐
Other ☐ Specify ________________________
Boat length (feet)
Where is the boat’s home harbor? Check not applicable if stored on land when not in use.
Home harbor marina name: Home harbor town/city: Home harbor state/country:
Not applicable ☐
Maintenance & Anti-Fouling Paint
When was the boat last hauled out for anti-fouling paint application?
Date (Month/Year):
Don’t know ☐ Not applicable ☐
What antifouling paint are you using? If you don’t know the brand of paint, check don’t know and provide a description if possible (e.g. copper ablative, foul-release, etc) If the boat has no anti-fouling paint, check the appropriate box.
Manufacturer/Company: Product name:
Don’t know ☐
Generic description (if possible):
This boat does not have anti-fouling paint ☐
Since the last application of anti-fouling paint, has the boat been manually cleaned (scrubbed or brushed)? If yes, how many times has it been cleaned?
Yes ☐
Number of cleanings:_____ Date of most recent cleaning(M/Y):
No ☐
Don’t know ☐
If it has been manually cleaned, what method was used? And where did cleaning occur? (check all that apply)
☐ In-water by a diver at my home marina
☐ In-water by a diver at another marina
Location (city/country):
☐ Out-of-water / On land
☐ Other (specify)____________________
During a typical year, how many times is the hull of your boat cleaned? Please indicate if there is a difference between Summer and Winter periods.
Number of Spring/Summer cleanings: Number of Fall/Winter cleanings:

Puget Sound biofouling introductions & vectors
109
Storage / Stationary Periods
Since it was last cleaned or painted, what is the longest time that the boat has been stationary in-water? (i.e. moored with no voyages) Where was this location? Check home port if this was the case.
Duration in one place: End Date (Month/Year):
Harbor Name: City: State/Country: Or
Home Port ☐
Recent Voyage Information Since the boat was last removed from the water (for paint application or storage), how many boat trips has it been on? (a rough estimate is fine).
Number of boat trips:
Which of these options best describes the types of boat trips this boat has been on over the last 12 months? Check multiple boxes if appropriate. Indicate how many of each trip-type was taken in the last year (a rough estimate is fine).
Check this box if no trips were taken in the last year ☐
☐ I made local trips with no overnight stays outside of
my home marina. # of trips:_____
☐ I made trips that included overnight stays at other
marinas in Puget Sound. # of trips:_____
☐ I made trips that included overnight stays at other
marinas outside of Puget Sound. # of trips:_____
For trips in the past 12 months that involved overnight stays at other marinas (not your home marina), please provide some information on the locations and timing of those trips. We have included space here for eight of your most recent visits to locations away from your home marina. If there are more, or if these places were all part of a voyage route to a certain destination, please tick this
box ☐ and use empty space to describe the ultimate
destination or additional marinas/cities visited during the overall trip.
Harbor Name: City: State/Country: Date (D/M/Y):
Harbor Name: City: State/Country: Date (D/M/Y):
Harbor Name: City: State/Country: Date (D/M/Y):
Harbor Name: City: State/Country: Date (D/M/Y):
Harbor Name: City: State/Country: Date (D/M/Y):
Harbor Name: City: State/Country: Date (D/M/Y):
Harbor Name: City: State/Country: Date (D/M/Y):
Harbor Name: City: State/Country:

Puget Sound biofouling introductions & vectors
110
Appendix 3.
Home harbors of boater respondents to the questionnaire surveys
Marina and town # of respondents Anacortes 11 Bellingham 24 Breakwater Marina, Tacoma 1 Cap Sante Marina, Anacortes 1 Des Moines Marina 19 Elliott Bay Marina, Seattle 5 Olympia Yacht Club 2 Port of Edmonds 6 Port of Everett Marina 28 Port of Poulsbo Marina 2 Shelter Bay, La Conner 1 Shilshole Bay Marina, Seattle 42 Squalicum Harbor, Bellingham 2 Swantown Marina, Olympia 3 Tacoma Yacht Club 1 Tyee, Tacoma 2
Appendix 4. Sources contacted for in-water cleaning review Puget Sound Port of Everett Vigor Industrial Northwest Marine Trade Association Clean Boating Foundation Pacific Fisherman Shipyard Ballard Diving and Salvage Whidbey Global Diving and Salvage Northwest Underwater Construction, Portland Washington Sea Grant All-Sea Enterprises, Vancover, Canada Fred Devine Diving and Salvage Hydrex, Florida *In addition, web searches on shipyards and commercial divers in the region, turned up ~20 companies, none of which indicated that they do any kind of in-water cleaning

Puget Sound biofouling introductions & vectors
111
In-water cleaning technology companies SCAMP Armada Hull (manufacturer of u/w cleaning equipment) Mini Pamper Hull Cleaning UMC International Cavi-Jet US Navy (Eric Holm) Biofouling Solutions, Australia