Embed Size (px)
Citation preview

IDENTIFYING KEYS FOR SUCCESSFUL
DEVELOPMENT AND THEIR
IMPLICATIONS FOR GREENHOUSE GAS
EMISSIONS
A Thesis
Presented to the Faculty of
The Fletcher School
by
SHOTARO SASAKI
In Partial Fulfillment of the Requirements for the
Degree of Doctor of Philosophy
August 2018
DISSERTATION COMMITTEE
Professor Emeritus William Moomaw, Chair
Lecturer Ann B. Rappaport, Reader
Assistant Professor Shinsuke Tanaka, Reader

i
CURRICULUM VITAE
SHOTARO SASAKI (Japanese, Date of Birth 30 July 1965);
24A Tampingco Street, San Lorenzo Village, Makati City, Metro Manila 1223 The Philippines [email protected], [email protected]; +63-917-888-0730 or +81-803-484-3783
SUMMARY OF QUALIFICATIONS
• International energy/environment/climate change problem mitigation professional with twelve years’ experience as an electric power engineer specializing in climate change mitigation through renewable energy promotion, cleaner and more environmentally sound technologies, and energy development in both the public and private sectors • Achieving successful processing and implementation of TAs and Loans in the Asian Development Bank for environmental safeguards, cleaner production, energy efficiency improvement, and renewable energy promotion in developing countries • Technical expertise with actual experiences and skills in (i) cleaner technologies such as waste-to-power plant management, waste water management plant constructions, compound fertilizer production from wastes, gas turbine power plant construction, heat supply system upgrades and fossil fuel power plant rehabilitation; (ii) renewable energies such as hydroelectric, solar, biomass power, and power generation using methane fermentation; and (iii) energy efficiency improvement such as power transmission and distribution system constructions • Excellent project management skills from design to implementation, supervision and evaluation in the power industry • Extensive technical support experience in biomass power projects • Outstanding academic knowledge with three master’s degrees covering a broad range of environmental issues; currently enrolled in a PhD program at the Fletcher School of Law and Diplomacy, USA • Publication of papers regarding climate change mitigation and renewable energy application from Harvard Law School • Developed multiple innovative patented waste-to-power management technologies • Extensive work in developing countries such as Afghanistan, Pakistan, Uzbekistan, Kazakhstan, India, Sri Lanka, Nepal, Bhutan, Maldives, Bangladesh, Thailand, Myanmar, Indonesia, and China (PRC); proven ability to manage cross-cultural teams • Skills in coordinating workshops and organizing presentations
EDUCATION
The Fletcher School of Law and Diplomacy, Tufts University, U.S.A. PhD Candidate (Doctor of Philosophy in International Relations), completion expected in 2018 The Fletcher School of Law and Diplomacy/Department of Urban and Environmental Policy and Planning (UEP), Tufts University, U.S.A. Dual Master’s Degree (Master of Arts in Law & Diplomacy from Fletcher and Master of Arts from UEP), 2005 Fields of Study: International Environment and Resource Policy; Development Economics Certificate: Sustainable Development; Organized an awareness-raising event on the environment sponsored by the City of Medford, Massachusetts (The Medford Energy Task Force): Faith & Environmental Stewardship: What Is the Link? Sophia University Graduate School, Department of Science and Engineering, Japan Master’s in Engineering. Concentration in Mechanical Engineering, 1991 Thesis: A Consideration About Global Environmental Problems Sophia University, Japan

ii
Bachelor’s in Engineering. Concentration in Mechanical Engineering, 1989
PROFESSIONAL EXPERIENCE
ASIAN DEVELOPMENT BANK (2005-Present), PHILIPPINES Senior Environment Specialist (Level 5), Urban and Social Sectors Division, East Asia Department, 2016-Present Quality and timely technical advice to project teams for project processing and monitoring as well as quality inputs for project documents related to environment safeguards and climate change mitigations and adaptations. The following projects are examples: 1) Hunan Xianjiang River Watershed Existing Solid Waste Comprehensive Treatment, 2) Hebei Elderly Care Service System Development, 3) Xinjiang Changji Integrated Urban-Rural Infrastructure Demonstration, 4) Heilongjiang Coal Rich Cities Redevelopment, 5) Xinjiang Hetian Comprehensive Urban Development and Environmental Improvement, 6) Guangxi Modern TVET Development Demonstration Program China (PRC) 7) UB Urban Services and Ger Areas Development Program Tranche 2, 8) Affordable Housing Project Mongolia Senior Safeguard Specialist (Environment) (Level 5), Private Sector Transaction Support Division, Private Sector Operations Department, 2014-2016 • Quality and timely technical advice to operation divisions and clients for project processing and monitoring as well as quality inputs for project documents related to environment safeguards and climate change mitigations and adaptations. The following projects are examples: 1)150 MW Burgos Wind Farm Philippines 2) Connectivity Infrastructure Development Project Myanmar 3) Toll Roads Upgrade and Climate Change Adaptation Indonesia Environment Specialist (Level 4), Energy Division, South Asia Department, 2008-2014 • Sector and environmental analysis to support loan processing, evaluation and design of potential energy efficiency components for climate change mitigation, evaluation of potential for carbon financing. The following projects are examples: 1) Himachal Pradesh Clean Energy Development Investment, 2) Assam Energy Efficiency Enhancement Project, 3) Integrated Renewable Energy Development India 4) Tanahu Hydroelectric Project, 5) Power Sector Development Project, 6) West Seti Hydro Power project Nepal 7) Clean Fuel Development Bangladesh 8) Preparing the Rural Renewable Energy Development Project Bhutan • Prepare TA papers and inception report; initiate consultant recruitment for Energy Efficiency Sri Lanka • Division representative for renewable energy, energy efficiency and climate change working groups and environment community of practice Energy Specialist (Level 4), Infrastructure Division, Central and West Asia Department, 2006- 2008 • Responsible for implementation of the following TAs as the project officer: identify needs of the government, manage schedules and scopes of the TAs in detail, supervise consultants, and review and appraise reports and achievements. The following projects are examples: 1) Small to Medium-Sized Hydro, 2) Natural Gas Development, 3) Establishing a Gas Regulatory Framework, 4) Institutional Strengthening for the Gas Sector, 5) Improving Capacity of Afghanistan Electricity Authority, 6) Capability Building for Reconstruction and Development (Energy Sector), and responsible for implementation of the following loans as the project officer-support the government in implementing the projects appropriately by instructing contractors and consultants: 1) Emergency Infrastructure Rehabilitation & Reconstruction (power transmission line constructions, and gas well and pipeline rehabilitations), 2) Power Transmission & Distribution Project Afghanistan • Responsible for processing the following TA as the project officer- identify needs of the government at the design stage: Rural Renewable Energy Development Project using run-of-the-river hydro Uzbekistan

iii
• Processed a loan as a team member (engineering aspects)-identify needs of the government, and manage procurement, schedule and scope of the loan at the fact-finding and appraisal stage: Power Transmission Enhancement (transmission system efficiency upgrades) Pakistan Energy Specialist (Level 4), Energy Division, East and Central Asia Department, 2005-2006 • Processed a loan as a team member (engineering aspects)-identify needs of the government, and manage procurement, schedule and scope of the loan at the fact-finding and appraisal stage: Inner Mongolia Autonomous Region Environmental Improvement (heat supply system, gas transmission, and waste water management plant construction) China (PRC) • Provided technical support to private sector financing projects-identify needs of the government and assess the project feasibilities: 1) Coal Thermal Power Plant Rehabilitations, 2)Power Transmission System Upgrades Kazakhstan • Feasibility assessment of an investment proposal in a private energy market fund in its technical aspects: Investment for Biomass Power Projects Thailand • Evaluated the status of technology development for underground coal gasification project proposal Kazakhstan GEF/UNDP/DOE CBRED PROJECT (July-September, 2004) PHILIPPINES Philippines: Capacity Building to Remove Barriers to Renewable Energy Development Consultant/Intern • Responsible for making recommendations of biomass power promotion strategy in the Philippines for the government with the Department of Energy THE CLIMATE GROUP (June-July, 2004) ENGLAND Business Associate/NGO for Climate Change Mitigation Consultant/Intern • Responsible for disseminating and marketing climate change mitigation work in the Japanese donor community and the private sector J-POWER ― former ELECTRIC POWER DEVELOPMENT CO. LTD., (1991-2002)
JAPAN Special public corporation of the Japanese Ministry of Economy, Trade and Industry. Deputy Manager of International Power Development Office, International Activities Department, 2001-2002 • Provided engineering support for a waste-to-power project Singapore • Managed Independent Power Producer (IPP) projects, including construction (rice husk incineration) and planning (rubber wood incineration) of bio-mass power projects, construction of a gas turbine power project, and planning of a coal thermal power plant-provide technical advisory to the project and instruct contractor Bangkok, Roi-et, Rayong, Thailand Deputy Manager of Thermal Recycle Business Group, New Business Department, 1999-2001 • Created the Waste-to-Power Promotion Manual with a grant from the Japanese government • Organized presentations to educate government officials at various municipalities in Japan for waste-to-power promotion • Developed and successfully tested a pioneering waste incineration method using petroleum coke • Surveyed and simulated systems for promoting power generation using methane fermentation from livestock • Started development of compound fertilizer by mixing coal ashes and residue produced by methane fermentation • Investigated technology and institutional arrangement of waste-to-power plants
England, Germany, Netherlands, and Denmark Member of Maintenance Group, Isogo Coal Thermal Power Station, 1996-1999
Yokohama, Japan • Managed ash treatment systems, removed blockages in underground pipes that had been problematic for 20 years • Commended for improving safety of ash treatment crane, ash settling pond and central operation room

iv
• Selected as a trainee in the 6-month Coal Engineer Training Course by New Energy and Industrial Technology Development Organization (NEDO) that included a survey of coal industries
Indonesia, Australia and Japan Member of Operation Group, Isogo Coal Thermal Power Station, 1991-1996
Yokohama, Japan • Operated 2×265MW coal thermal power stations as a boiler, turbine, and electricity operator • Remote monitoring of the operation of Onikoube geothermal power plant
LICENSES, PATENTS AND PUBLICATIONS
• IDEAS (International Development, Environment And Sustainability) Online Journal, Issue 1 Alternative Energy, Rice Husk Power in Thailand with Japanese Investment,2007 http://fletcher.tufts.edu/ierp/ideas/pdfs/issue1/ShotaroSasakiFullpaper.pdf, http://fletcher.tufts.edu/ierp/ideas/pdfs/issue1/SasakiShotaroformat.pdf • PON (Program on Negotiation at Harvard Law School) Books, Papers on International Environmental Negotiation Volume 14, Post Kyoto Protocol: Global Consensus Building toward Setting a Long-Term CO2 Emissions Target, 2005 http://www.pon.org/downloads/ien14_8Sasaki.pdf, http://www.pon.org/downloads/ien14_1introduction.pdf • Asian Development Bank, Handbook on Construction Techniques: A Practical Field Review of Environmental Impacts in Power Transmission / Distribution, Run-of-River Hydropower and Solar Photovoltaic Power Generation Projects, 2015 https://www.adb.org/sites/default/files/institutional-document/179895/handbook-construction-techniques.pdf • The 12th Japan Society of Waste Management Experts Research Presentation: Recycling Investigation of the Melted Slag in a Generating Electricity from Waste-to-Power Project, 2001 • New Energy and Industrial Technology Development Organization (NEDO), Waste-to-Power Promotion Manual, 2000 • Applied Patent: The Incineration Method of Waste, 1999 • Certificate of First Class Boiler and Turbine Chief Engineer, 1999 • Handling License of Dangerous Objects, 1995 • Professional Teaching License for Technical High School, 1991
LANGUAGES
• Japanese (native); English (proficient)

v
ABSTRACT In recent decades, international environmental policy and development scholars argue that (i) countries act by following their near-term national interests in this physically limited earth, (ii) population and stresses on environment accompanying development are increasing globally, (iii) development is the most prioritized issue over environmental problem mitigations for both developed and developing countries, and (iv) development and environment need to both be sustainable for developing countries to succeed. Those arguments became the motivation of this dissertation, which is “To learn from successful developing countries that achieved both lower GHG emissions per capita (GHGpc) and improved development 1990-2010.” Therefore this dissertation asks “What factors determine whether developing countries achieve lower GHG emissions while meeting their development goals?” Hypotheses that were tested were (i) National policy initiatives, strategies and changes in practices were effective in the successful countries; (ii) Responses to external factors were effective in the successful countries; (iii) Financing by development agencies was effective in the successful countries; and (iv) The mix of economic activities at different stages of development lead to success in the successful countries. Development was measured by the three components of the Human Development Index (HDI). GHG emissions were analyzed using a modified Kaya identity. The findings were compared with insights from 83 in-country development experts. The quantitative data analysis found that many poor countries in the world were successful in increasing their HDI and decreasing GHGpc during 1990-2010. Among them in Asia, Myanmar and Nepal were recognized as very successful countries, and Mongolia and Bangladesh as successful countries. From the qualitative data analysis, this dissertation finds that Myanmar was very successful because of its effective forestry policy regulations that reduced GHGs from land use, change and forestry (LUCF), and its shift away from agriculture and forestry into other natural resources and tertiary industries. Nepal was very successful because its policy regulations effectively improved HDI health and income parameters and reduced GHGs from LUCF, while it transitioned out of
vi
forestry and gained remittances from overseas workers and the service sector. The dissertation also finds that Mongolia was a successful country because donors’ support during the economic crisis had the positive consequence of reducing GHG emissions through technical modernization, and that Bangladesh was successful because its policy regulations effectively improved its HDI parameters while domestic natural gas replaced higher emitting coal. The findings suggest a positive possibility that if a developing country can find alternative ways to generate income, it can encourage a shift out of agriculture and forestry sectors, from which many developing countries release the majority of GHGs. There is also a negative outcome if their reliance on exports of natural resources or their reliance on remittances from overseas workers increase, then GHGs in other countries may increase where those natural resources are consumed, or in the countries where the overseas workers work. It is also demonstrated that development of the four successful countries were consistent with many of the Sustainable Development Goals (SDGs) even though they were created five years after the study period. The following countries, however, did not move forward on (i) GHG related goals for Bangladesh, (ii) health and education related goals for Myanmar, and (iii) health and education related goals for Mongolia. Nepal was the only country to meet all those goals in Asia. Therefore, to achieve SDGs it is recommended that Bangladesh should improve GHG emission reduction, Myanmar should improve health and education, Mongolia also should improve health and education, and Nepal should continue its current practices in the upcoming decade.

vii
ACKNOWLEDGMENTS First and foremost, I would like to thank my dissertation committee. Professor Emeritus William Moomaw has been the superb committee chair and advisor, and I am thankful for his tireless mentoring, encouragements without saying any negative things, and supports since I met him in 2002 when I visited Boston to consider joining into Fletcher School for my dual masters degree program with Urban and Environmental Policy and Planning(UEP), Tufts University. I cannot expect better person than him as the chair, and it was one of my best lucks in my life when I had chances to learn from him. My profound gratitude goes to Professor Rappaport for encouraging me and inspiring me throughout the process, particularly for the qualitative analysis . Since I took her course at UEP in 2003, she always kindly provided me constructive advices respecting my opinions by her gentle and noble way. I am greatly indebted to Professor Tanaka for helping me to organize my immature quantitative data analysis even during his precious sabbatical leave period. His kind participation into my Ph.D. committee providing me advices from his academic experiences gave me enormous comforts to move forward through the process. Dr. Jenifer Burckett-Picker played a crucial role in facilitating my Ph.D. progress through her excellent management of the Ph.D. program, and in continuing to provide kind encouragements in her very patient way all through my 8 years since I started my Ph.D. study since 2010. Without her supports and cares, I could not reach to this point. I am thankful for the financial support from the Fletcher School, which made my Ph.D. study possible. I also want to show my appreciations to my professors, belated Professor Emeritus Hidetaro Nakayama, and Professor Emeritus Kunio Hayashi in Sophia University, Japan for giving me opportunities to be interested into environmental problem mitigations as my lifework even though the problem was not getting much attention at that time around 1990 when I was studying there for my bachelor and master of engineering. I also want to express my appreciations to J-Power (EPDC) where I was working
viii
for giving me the chance to study away from my work for my dual masters degree program when I was still a young engineer who could not return much benefits to the company. Asian Development Bank also kindly gave me the opportunity to go for the Ph.D. program having a special leave from my work, for which I really appreciate. If I were not able to get the friendly participations by those professional experts in the field of environment and development into my survey consuming their valuable time to write me their precious experiences and knowledges, this dissertation could not be much meaningful, for those I really want to tell my thank you. Thank you to my parents, my deceased father Masaya and my beloved mother Yoshiko. Without their guidance, I was not able to even start heading to this achievement. Thank you to Dr. Kiyoshi Taniguchi, Ms. Maribeth Frondoza, Mr. Henry Custodio, and Mr. Zandro Racoma for helping me while I have been continuing my study in the Philippine to finalize my dissertation. Finally, this dissertation is dedicated to my son, Seiryo, hoping that the world can be a better one where countries will be able to collaborate together combatting various difficult issues including environmental problem mitigations for his generation and his next generations.
ix
Table of Contents
CURRICULUM VITAE .............................................................................. i
ABSTRACT ................................................................................................ v
ACKNOWLEDGMENTS ........................................................................ vii
List of Tables (page numbers show the pages in Appendix A) .............. xii
List of Figures (page numbers show the pages in Appendix A) ............ xv
List of Acronyms ...................................................................................... xx
CHAPTER 1. PROBLEM STATEMENT .................................................. 1 1.1. Motivation of this Dissertation: To Contribute to Mitigating the Problems Faced by the World Today ................................................................................................... 1 1.2. Problem 1: A Perennial Problem on our Limited Earth ....................................... 3 1.3. Problem 2: Pressures from Population Increase ................................................. 5 1.4. Problem 3: Increasing Environmental Pressures from Developing Countries ....... 6 1.5. Problem 4: Linkages Between Development and the Environment ..................... 8 1.6. Problem 5: The Logic of Developing Countries .............................................. 13 1.7. Problem 6: Economic Growth as a Necessary Part of Development .................. 14 1.8. Problem 7: Growing Contributions of Developing Countries ............................ 16 1.9. Problem 8: The Environmental Problem as a Global Agenda ............................ 17 1.10. Problems to Be Addressed .......................................................................... 19
CHAPTER 2. RESEARCH QUESTION AND HYPOTHESIS .............. 24 2.1. Research Questions ...................................................................................... 24 2.2. Hypotheses .................................................................................................. 25
CHAPTER 3. METHODOLOGY (STRATEGY FOR ANALYSIS) ........ 27
CHAPTER 4. EMPIRICAL FINDINGS FROM HISTORICAL DEVELOPMENT AND EMISSION PATTERNS .................................. 32
4.1. General Findings from the Historical Trajectories ........................................... 36 4.2. CO2 Was Not the Main Source of GHG Emissions from Developing Countries . 44 4.3. Evaluation of Success by Rate (Steepness), Improvement in HDI, and Improvement in GHGpc ..................................................................................... 45 4.4. Identifying Successful Countries: Trajectories of Asian Countries .................... 51 4.5. Trajectories of Asian Countries During the Period ........................................... 58 4.6. Defining Success Among Asian Countries ...................................................... 66

x
4.7. Evaluation of the HDI Increase Standard Deviation Score ............................... 69 4.8. Evaluation of the GHGpc Absolute Value Increase .......................................... 81 4.9. Evaluation of the Ratio of GHGpc Increase .................................................... 82 4.10. Total Evaluation of GHGpc Parameters ........................................................ 82
CHAPTER 5. IDENTIFYING SUCCESSFUL COUNTRIES ............... 85 5.1. Identifying Asian Countries in the EKC group ................................................ 91 5.2. Significant Contribution of Technology in the I=PAT Formula and KAYA Identity ........................................................................................................................ 117 5.3. Technology Transfer/Adoption vis-à-vis Environmental Innovation ............ 120 5.4. Modified KAYA Identity Analysis to Classify Asian Countries ....................... 128
CHAPTER 6. PROFILE REVIEW OF THE SUCCESSFUL COUNTRIES ......................................................................................... 140
6.1. Overview of Countries ............................................................................... 140 6.1.1. Myanmar ............................................................................................ 140 6.1.2. Nepal .................................................................................................. 142 6.1.3. Mongolia ............................................................................................ 146 6.1.4. Bangladesh ......................................................................................... 148
6.2. Findings from Comparisons ........................................................................ 151 6.3. What Happened in the Successful Countries During the 1990-2010 Period? .... 159
6.3.1. Myanmar ............................................................................................ 159 6.3.2. Nepal .................................................................................................. 163 6.3.3. Mongolia ............................................................................................ 165 6.3.4. Bangladesh ......................................................................................... 169
CHAPTER 7. EXPERTS’ VIEWS TO SUPPLEMENT THE DATA ANALYSIS ............................................................................................. 173
7.1. Background ............................................................................................... 173 7.2. Objective .................................................................................................. 175 7.3. Subject Population ..................................................................................... 175 7.4. Recruitment Process ................................................................................... 176 7.5. Consent Process ......................................................................................... 177 7.6 A Description of How the Research Was Conducted ....................................... 177 7.7 Analysis of Responses from Experts ............................................................. 178
7.7.1. Experts’ Responses to the Question Related to Myanmar ......................... 182 7.7.2. Experts’ Responses to the Question Related to Nepal .............................. 189 7.7.3. Experts’ Responses to the Questions Related to Mongolia ....................... 197

xi
7.7.4. Experts’ Responses to the Questions Related to Bangladesh ..................... 205 7.7.5. Factors Cited as Reasons for Their Success ............................................ 212 7.7.6. Consistency with SDGs ........................................................................ 215
CHAPTER 8. CONCLUSIONS ............................................................. 222 8.1 Validity of the Original Four Hypotheses for the Successful Four Countries .. 222 8.2 Answering to the Research Question ......................................................... 230
REFERENCE LIST ............................................................................... 244
APPENDIX A: FIGURES AND TABLES ............................................. 253 Appendix 1. GHG Emissions Per Capita by HDI for 10 Group Countries, 1990-2010. ....................................................................................................................... 256 Appendix 2. GHG Emissions Per Capita by HDI for 10 Group Countries, 1990-2010. ....................................................................................................................... 263 Appendix 3. GHG Emission per capita and HDI of Countries (these figures are to compare their shapes, so no values are indicated on each axis) ............................. 272 Appendix 4. Regression Lines of Each Country, Groups 1 to 10. .......................... 286 Appendix 5. Parameters for evaluating success. .................................................. 292 Appendix 6. Parameter (i) slope of the HDI vs GHGpc. ....................................... 317 Appendix 7. Orders of HDI Component Improvement ......................................... 323 Appendix 8. Revised Orders of HDI Components by Standard Deviation Scores .... 338 Appendix 9. Sum of 3 Standard Deviation Scores ............................................... 355 Appendix 10. GHGpc Absolute Value Increase and Ratio of GHGpc Increase ........ 359 Appendix 11. Trajectory of HDI, KAYA Components and GHG (Myanmar) .......... 387 Appendix 12. Trajectory of HDI, KAYA Components and GHG (Nepal) ............... 391 Appendix 13. Trajectory of KAYA Components and GHG (Mongolia) .................. 399 Appendix 14. Trajectory of HDI, KAYA Components and GHG (Bangladesh) ....... 406 Appendix 15. Trajectory of KAYA Components and GHG (China (PRC)) ............. 412 Appendix 16. Myanmar Timeline ...................................................................... 419 Appendix 17. Nepal Timeline ............................................................................ 427 Appendix 18. Mongolia Timeline ...................................................................... 436 Appendix 19. Bangladesh Timeline .................................................................... 443
APPENDIX B: QUESTIONNAIRE ...................................................... 512
APPENDIX C: EXPERTS LIST ........................................................... 522

xii
List of Tables (page numbers show the pages in Appendix A) Table 1. Regression lines of each country in Country Group 1 ........................................ 286 Table 2. Regression lines of each country in Country Group 2. ....................................... 286 Table 3. Regression lines of each country in Country Group 3. ....................................... 287 Table 4. Regression lines of each country in Country Group 4. ....................................... 287 Table 5. Regression lines of each country in Country Group 5 ........................................ 288 Table 6. Regression lines of each country in Country Group 6 ........................................ 288 Table 7. Regression lines of each country in Country Group 7 ........................................ 289 Table 8. Regression lines of each country in Country Group 8 ........................................ 289 Table 9. Regression lines of each country in Country Group 9 ........................................ 290 Table 10. Regression lines of each country in Country Group 10 .................................... 290 Table 11. Frequency Count of Successful and Unsuccessful Countries ............................ 291 Table 12. Parameters for evaluating successfulness (ordered by the slope of △GHGpc/△HDI)
......................................................................................................................... 292 Table 13. Parameters for evaluating successfulness (ordering by the slope of △HDI absolute
value) ................................................................................................................ 295 Table 14. Parameters for evaluating successfulness (ordering by the △HDI ratio) ............. 298 Table 15. Parameters for evaluating successfulness (ordering by the △GHGpc absolute value)
......................................................................................................................... 301 Table 16. Parameters for evaluating successfulness (ordering by the △GHGpc ratio) ........ 304 Table 17. Parameters for evaluating successfulness (ordering by the slope of
△GHGpc/△GNIpc) ............................................................................................. 307 Table 18. Parameters for evaluating successfulness (ordering by the △GNIpc absolute value)
......................................................................................................................... 310 Table 19. Parameters for evaluating successfulness (ordering by the △GNIpc ratio) ......... 313 Table 20. Parameter Orders of Developing Countries in Asia ........................................ 315 Table 21(a). Evaluation of Parameter Orders of Developing Countries in Asia; (b). Revised
Evaluation of Parameter Orders of Developing Countries in Asia (adjusting paramenters
(vii) and (viii)) .................................................................................................... 315 Table 22. Evaluation of the parameter (i) slope of the HDI vs GHGpc trend line .............. 316 Table 23. Orders of HDI component for each Asian country ........................................... 321 Table 24. Orders of HDI component improvement for each Asian country ....................... 323 Table 25. Orders of HDI component improvement for each African country .................... 325 Table 26. Orders of HDI component improvement for each OECD country ..................... 329 Table 27. Orders of HDI component improvement for each Latin American country ......... 332 Table 28. Orders of HDI component improvement for other countries ............................. 335

xiii
Table 29. Summary of HDI component improvement (from Tables 24-28) ...................... 337 Table 30. Revised orders of HDI components by standard deviation scores (Asian Countries)
......................................................................................................................... 338 Table 31. Revised orders of HDI components by standard deviation scores (African Countries)
......................................................................................................................... 340 Table 32. Revised orders of HDI components by standard deviation scores (OECD Countries)
......................................................................................................................... 343 Table 33. Revised orders of HDI components by standard deviation scores (Latin American
Countries) .......................................................................................................... 346 Table 34. Revised orders of HDI components by standard deviation scores (Other areas) .. 349 Table 35. Summary of revised largest HDI component improvement (from Table 30-34) .. 352 Table 36. Revised order of the HDI components and the sum of the 3 components ........... 353 Table 37. Scoring on HDI parameters ........................................................................... 357 Table 38. Total evaluation of GHGpc parameters ........................................................... 363 Table 39. Final total scores to identify successful countries. ........................................... 364 Table 40. Identifying successful countries ..................................................................... 365 Table 41. Summary of Authors’ EKC Arguments .......................................................... 368 Table 42. Summary of Identifying DLHE Countries ...................................................... 376 Table 43. Major Arguments about Technology Transfer /Adaptation ............................... 381 Table 44. Results of the modified KAYA components .................................................... 383 Table 45. Summary of the groups and their orders ......................................................... 385 Table 46. Each country’s result of modified KAYA components ...................................... 385 Table 47. Myanmar, Mongolia, Pakistan and Philippines’ Successfulness ........................ 416 Table 48. Myanmar, Bangladesh, Sri Lanka and Thailand’s Successfulness ..................... 417 Table 49. Myanmar Timeline ....................................................................................... 424 Table 50. Net ODA received per capita (current US$) during each period being compared with
the total received during the period of 1986-90 ...................................................... 425 Table 51. Nepal Timeline ............................................................................................ 433 Table 52. Mongolia Timeline ....................................................................................... 441 Table 53. Bangladesh Timeline .................................................................................... 450 Table 54. Experts’ responses for the question related to Myanmar ................................... 450 Table 55. Experts’ responses for the question related to Nepal ........................................ 456 Table 56. Experts responses for the question #1 related to Mongolia ............................... 466 Table 57. Experts’ responses for the question #2 related to Mongolia .............................. 472 Table 58. Experts’ responses for the question #3 related to Mongolia .............................. 475 Table 59. Experts’ responses for the question #1 related to Bangladesh ........................... 477
xiv
Table 60. Experts’ responses for the question #2 related to Bangladesh ........................... 481 Table 61. Experts’ responses for the question #3 related to Bangladesh ........................... 483 Table 62. Issues Raised as the Factors That Became Reasons of Their Success. .............. 486 Table 63. Evaluation of expert responses for Myanmar .................................................. 489 Table 64. Evaluation of expert responses for Nepal ....................................................... 493 Table 65. Evaluation of expert responses for Mongolia .................................................. 498 Table 66. Evaluation of expert responses for Bangladesh ............................................... 502 Table 67. Evaluations of expert responses by degree of fit with HDI and GHGpc goals by the
four successful countries ...................................................................................... 505 Table 68. Relations between the Items raised by Experts and SDG Goals ........................ 507 Table 69. Relations between the Successes and SDG Goals ............................................ 509 Table 70. Validity of the Original Four Hypotheses for the Successful Four Countries ...... 510

xv
List of Figures (page numbers show the pages in Appendix A) Figure 1. Summary of the Motivation of this Dissertation .............................................. 253 Figure 2. GHG Emissions per capita and HDI of 180 countries in 2010. .......................... 254 Figure 3. Trajectory of CO2 ratio among GHG .............................................................. 255 Figure 4. GHG Emissions Per Capita by HDI, 1st Group Countries, 1990–2010. .............. 256 Figure 5. GHG Emissions Per Capita by HDI, 2nd Group Countries, 1990–2010. ............ 256 Figure 6. GHG Emissions Per Capita by HDI, 3rd Group Countries, 1990–2010. .............. 257 Figure 7. GHG Emissions Per Capita by HDI, 4th Group Countries, 1990–2010. ............. 257 Figure 8. GHG Emissions Per Capita by HDI, 5th Group Countries, 1990–2010. ............. 258 Figure 9. GHG Emissions Per Capita by HDI, 6th Group Countries, 1990–2010. ............. 258 Figure 10. GHG Emissions Per Capita by HDI, 7th Group Countries, 1990–2010. ............ 259 Figure 11. GHG Emissions Per Capita by HDI, 8th Group Countries, 1990–2010. ............ 259 Figure 12. GHG Emissions Per Capita by HDI, 9th Group Countries, 1990–2010. ............ 260 Figure 13. GHG Emissions Per Capita by HDI, 10th Group Countries, 1990–2010. .......... 260 Figure 14. Greenhouse Gas Emissions Per Capita by Human Development Index, 1990–2010
(by individual countries). ..................................................................................... 261 Figure 15. Greenhouse Gas Emissions Per Capita by Human Development Index (by income
groups), 1990–2010. ............................................................................................ 262 Figure 16. GHG Emissions Per Capita by HDI, 1st Group Countries, 1990–2010 (enlarged).
......................................................................................................................... 263 Figure 17. GHG Emissions Per Capita by HDI, 2nd Group Countries, 1990–2010 (enlarged).
......................................................................................................................... 264 Figure 18. GHG Emissions Per Capita by HDI, 3rd Group Countries, 1990–2010. ............ 265 Figure 19. GHG Emissions Per Capita by HDI, 4th Group Countries, 1990–2010 (enlarged).
......................................................................................................................... 265 Figure 20. GHG Emissions Per Capita by HDI, 5th Group Countries, 1990–2010 (enlarged).
......................................................................................................................... 266 Figure 21. GHG Emissions Per Capita by HDI, 6th Group Countries, 1990–2010 (enlarged).
......................................................................................................................... 267 Figure 22. GHG Emissions Per Capita by HDI, 7th Group Countries, 1990–2010 (enlarged).
......................................................................................................................... 268 Figure 23. GHG Emissions Per Capita by HDI, 8th Group Countries, 1990–2010 (enlarged).
......................................................................................................................... 269 Figure 24. GHG Emissions Per Capita by HDI, 9th Group Countries, 1990–2010 (enlarged).
......................................................................................................................... 270 Figure 25. GHG Emissions Per Capita by HDI, 10th Group Countries, 1990–2010 (enlarged).

xvi
......................................................................................................................... 271 Figure 26. Trajectory Group - Downward Slope to the Right: Continuous Improvement of HDI
and Slight Decrease of GHGpc ............................................................................. 272 Figure 27. Trajectory Group - Steep Downward Slope to the Right: Continuous Improvement
of HDI and Significant Decrease of GHGpc .......................................................... 273 Figure 28. Trajectory Group - Upward Slope to the Right: Continuous Improvement of HDI
and Significant Increase of GHGpc ....................................................................... 274 Figure 29. Trajectory Group - Sloping to the Right: Continuous Improvement of HDI and Slight
Increase or No Change in GHGpc ......................................................................... 275 Figure 30. Trajectory Group - U-Shaped: Continuous Improvement in HDI, while GHGpc
Initially Decreases then Eventually Increases ......................................................... 276 Figure 31. Trajectory Group - Inverted U: Continuous Improvement in HDI, while GHGpc
Initially Increases then Eventually Decreases ......................................................... 277 Figure 32. Trajectory Group - U-Shaped Curved to the Right: HDI Declines and GHGpc
initially Decreases, then HDI Improves while GHGpc Continuously Decrease .......... 278 Figure 33. Trajectory Group - Steep Downward Slope then to the Right: HDI is Unchanged
while GHGpc Significantly Decreases, then Improvement in HDI while GHGpc is
Unchanged ......................................................................................................... 279 Figure 34. Trajectory Group - Sloping to the Right then Steep Upward Slope: Improvement in
HDI while GHGpc Unchanged, then Significant Increase in GHGpc with Slight HDI
Improvement ...................................................................................................... 280 Figure 35. Trajectory Group - Former Soviet Union ...................................................... 281 Figure 36. Trajectory Group - G8 Countries .................................................................. 282 Figure 37. Number of Successful Countries per Country Group, 1990–2010. ................... 283 Figure 38. Trajectories of Asian Countries .................................................................... 284 Figure 39. Relative Trajectories of Asian Countries (starting from 1990 as zero) .............. 285 Figure 40. Parameter (i) slope of the HDI vs GHGpc trend line ...................................... 317 Figure 41. Parameter (i) slope of the HDI vs GHGpc trend line (zoomed up) ................... 317 Figure 42. Parameter (i) slope of the HDI vs GHGpc trend line (Grouping) ..................... 318 Figure 43. Parameter (ii) absolute value of HDI increase ................................................ 319 Figure 44. Parameter (ii) absolute value of HDI increase (zoomed up) ............................ 319 Figure 45. Parameter (ii) absolute value of HDI increase (grouping) ............................... 320 Figure 46. Sum of the 3 standard deviation scores for Asian countries ............................. 355 Figure 47. Sum of the 3 standard deviation scores for Asian countries (enlarged) ............. 355 Figure 48. Sum of the 3 standard deviation scores for Asian countries (grouping) ............. 356 Figure 49. GHGpc absolute value increased .................................................................. 359

xvii
Figure 50. GHGpc absolute value increased (enlarged) .................................................. 359 Figure 51. GHGpc absolute value increased (grouping) ................................................. 360 Figure 52. Ratio of GHGpc increase ............................................................................ 361 Figure 53. Ratio of GHGpc increase (enlarged) ............................................................. 361 Figure 54. Ratio of GHGpc increase (grouping) ............................................................ 362 Figure 55. Trajectories of Very Successful and Successful Asian Countries ...................... 367 Figure 56. Trajectories of Very Successful and Successful Asian Countries (starting from 0).
......................................................................................................................... 368 Figure 57. Trajectories of GHGs (China (PRC)) ............................................................ 371 Figure 58. Trajectories of GHGs (India) ....................................................................... 371 Figure 59. Trajectories of GHGs (Republic of Korea) .................................................... 372 Figure 60. Trajectories of GHGs (Pakistan) .................................................................. 372 Figure 61. Trajectories of GHGs (Philippines) .............................................................. 373 Figure 62. Trajectories of GHGs (Thailand) .................................................................. 373 Figure 63. Trajectories of GHGs (Malaysia) ................................................................. 374 Figure 64. Trajectories of GHGs (Indonesia) ................................................................. 374 Figure 65. Trajectories of GHGs (Sri Lanka) ................................................................. 375 Figure 66. Trajectories of GHGs (Bangladesh) .............................................................. 375 Figure 67. Trajectories of GHGs (Vietnam) .................................................................. 376 Figure 68. Grouping EC/P/HDI of each Asian country ................................................... 384 Figure 69. Grouping GHG/EC of each Asian country .................................................... 384 Figure 70. Final Results of Evaluation of Each Asian Country ........................................ 386 Figure 71. Trajectory of HDI components (Myanmar) ................................................... 387 Figure 72. Trajectory of Increased ratio of HDI components (Myanmar) ......................... 387 Figure 73. Trajectory of Modified KAYA components for Myanmar ............................... 388 Figure 74. Trajectory of Modified KAYA components per capita (equation #7) for Myanmar
......................................................................................................................... 388 Figure 75. Trajectory of GHGs (Myanmar) ................................................................... 389 Figure 76. Trajectory of each GHG ratio (Myanmar) ..................................................... 389 Figure 77. Trajectory of GHG emissions by sources (Myanmar) ..................................... 390 Figure 78. Trajectory of Ratio of GHG emissions by sources (Myanmar) ........................ 390 Figure 79. Trajectory of HDI components (Nepal) ......................................................... 391 Figure 80. Trajectory of Increased ratio of HDI components (Nepal) ................... 391 Figure 81. Trajectory of Modified KAYA components for Nepal ..................................... 392 Figure 82. Trajectory of Modified KAYA components per capita (equation #7) for Nepal . 392 Figure 83. Trajectory of Modified KAYA components for Nepal (excluding LUCF) ......... 393

xviii
Figure 84. Trajectory of Modified KAYA components per capita (equation #7) for Nepal
(excluding LUCF) ............................................................................................... 393 Figure 85. Trajectory of GHGs (Nepal) ........................................................................ 394 Figure 86. Trajectory of each GHG ratio (Nepal) ........................................................... 395 Figure 87. Trajectory of GHG emissions by sources (Nepal) .......................................... 396 Figure 88. Trajectory of Ratio of GHG emissions by sources (Nepal) .......................... 397 Figure 89. Trajectory of GHG emissions from energy sector by sources (Nepal) .............. 398 Figure 90. Trajectory of GHGs (Mongolia) ................................................................... 399 Figure 91. Trajectory of each GHG ratio (Mongolia) ..................................................... 400 Figure 92. Trajectory of GHG emissions by sources (Mongolia) ..................................... 401 Figure 93. Trajectory of Ratio of GHG emissions by sources (Mongolia) ..................... 402 Figure 94. Trajectory of GHG emissions from energy sector by sources (Mongolia) ....... 403 Figure 95. Trajectory of Ratio of GHG emissions from energy sector by sources (Mongolia)
......................................................................................................................... 404 Figure 96. Trajectory of Modified KAYA components for Mongolia ............................... 405 Figure 97. Trajectory of Modified KAYA components per capita (equation #7) for Mongolia
......................................................................................................................... 405 Figure 98. Trajectory of HDI components (Bangladesh) ................................................. 406 Figure 99. Trajectory of Increased ratio of HDI components (Bangladesh) ...................... 406 Figure 100. Trajectory of Modified KAYA components for Bangladesh ......................... 407 Figure 101. Trajectory of Modified KAYA components per capita (equation #7) for Bangladesh
......................................................................................................................... 407 Figure 102. Trajectory of GHGs (Bangladesh) ............................................................ 408 Figure 103. Trajectory of each GHG ratio (Bangladesh) ................................................. 409 Figure 104. Trajectory of GHG emissions by sources (Bangladesh) ...................... 410 Figure 105. Trajectory of Ratio of GHG emissions from energy sector by sources (Bangladesh)
......................................................................................................................... 411 Figure 106. Trajectory of Modified KAYA components for China (PRC) ......................... 412 Figure 107. Trajectory of Modified KAYA components per capita (equation #7) for China
(PRC) ................................................................................................................ 412 Figure 108. Trajectory of GHGs (China (PRC)) ........................................................... 413 Figure 109. Trajectory of each GHG ratio (China (PRC)) ............................................... 413 Figure 110. Trajectory of GHG emissions by sources (China (PRC)) ............................... 414 Figure 111. Trajectory of Ratio of GHG emissions by sources (China (PRC)) .................. 415 Figure 112. Trajectory of GHG emissions from energy sector by sources (China (PRC)) ... 415 Figure 113. Trajectory of Ratio of GHG emissions from energy sector by sources (China (PRC))

xix
......................................................................................................................... 416 Figure 114. Myanmar’s trajectory divided into 6 periods ................................................ 418 Figure 115. Nepal’s trajectory divided into 6 periods ..................................................... 426 Figure 116. Mongolia’s trajectory divided into 6 periods ................................................ 435 Figure 117. Bangladesh’s trajectory divided into 6 periods ............................................. 442 Figure 118. Summary of factors influencing successful development for Myanmar. ......... 492 Figure 119. Summary of factors influencing successful development for Nepal ................ 497 Figure 120. Summary of factors influencing successful development for Mongolia .......... 501 Figure 121. Summary of factors influencing successful development for Bangladesh ....... 504
xx
List of Acronyms ASEAN Association of Southeast Asian Nations BNP Bangladesh Nationalist Party CA Constituent Assembly CAIT Climate Analysis Indicators Tool CAR Central African Republic CCMT Climate change mitigation technology CH4 Methane CO2 Carbon Dioxide EKC Environmental Kuznets Curve ESI Environmental Sustainability Index FDI Foreign Direct Investment GDP Gross Domestic Product GHG Greenhouse Gas GHGpc Greenhouse Gas Per Capita GNI Gross National Income GNIpc Gross National Income Per Capita HFC Hydrofluorocarbons HDI Human Development Index IEA International Energy Agency IPAT Impact = Population*Affluence*Technology IPCC Intergovernmental Panel on Climate Change LUCF Land-use change and forestry LULUCF Land-use, land-use change, and forestry MPRP Mongolian People’s Revolutionary Party N2O Nitrous Oxide ODA Official Development Assistance OECD Organisation for Economic Cooperation and Development PFCs Perfluorocarbons SF6 Sulphur Hexafluoride UNCED United Nations Conference on Environment and Development UNDP United Nations Development Programme UNFCCC United Nations Framework Convention on Climate Change

1
CHAPTER 1. PROBLEM STATEMENT 1.1. Motivation of this Dissertation: To Contribute to Mitigating the Problems Faced by the World Today
When US President Trump said, “In order to fulfill my solemn duty to
protect America and its citizens, the United States will withdraw from the Paris
Climate Accord” (Conca 2017), he was not expressing a new idea. Countries in
general tend to prioritize their own short-term benefit over the environment.
Although the US is one of the richest countries on earth, it does the same. Poorer
countries cannot be blamed, therefore, for prioritizing their development over
protecting the environment. Even in other rich countries in which economic gaps
are widening, the frustrations of poorer people make politicians hesitant to propose
policies that prioritize the environment over development, which includes
economic growth. They need to attract votes by promising short-term rather than
long-term achievements, since elections occur every several years, while the
benefits from environmental improvements take longer than several decades to
materialize. When the whole world is considered, current human activities are
extensive enough to put great pressure on the environment; if they continue
unabated, the limited capacity of the earth to support life will be exceeded. This
situation is all the more critical because the pressure is increasing: developing
2
countries find it difficult to pursue environmental sustainability and development
as they seek to provide better and more comfortable lives for their citizens. At the
same time, their population is increasing at an uncontrolled rate. This clearly
illustrates that the world situation has changed from the time when development
activities were conducted by only a small part of the world’s population. Thus, the
development models that were used in industrialized and developed countries in the
past cannot be used by developing countries today. To illustrate this situation more
clearly, Figure 1 summarizes the relationship among the problems that have
motivated this dissertation. In sections 1.2-1.9, these problems are further clarified,
and explain and justify the motivation of this dissertation.

3
Figure 1. Summary of the Motivation of this Dissertation.1
1.2. Problem 1: A Perennial Problem on our Limited Earth
In the past, when the world’s population was smaller, collective human
actions had relatively little impact on the environment. Using fossil fuels as a major
1 Only selected figures are in the main document for readers’ conveniences. All figures are in appendix.
Growing Population (1.03)
Growing significance of Developing Countries (1.08)
Limited Earth (1.02) and World of National Interest (1.09)
Development as the prioritized issue (1.04, 1.09) Economic growth is a part of development (1.07)
Environment as a secondary issue, though still significant (1.09)
Link 2 agendas (1.05)
Logic of Developing Countries (1.06)
Motivation of this dissertation: Learn from successful developing countries that both achieved lower GHG emissions per capita and improved development 1990-2010 (1.01)
Finding ways to improve both development and environment at the same time (1.10)

4
energy source was once considered ideal because their advantages, such as easy
handling and efficiency in transforming carbon into heat, were greater than their
disadvantages, such as the damaging and harmful by-product emissions. When the
collective human actions were very small on the big earth, these emissions were
diluted to negligible levels. However, at present, the magnitude and scale of the use
of fossil fuels and of the other GHG-emitting activities conducted by humans are
great enough to alter the global climate, as described in the Intergovernmental Panel
on Climate Change (IPCC) reports.
To give an example, in the past, the practice of using nitrogen fertilizers
was considered acceptable and even beneficial. However, nitrogen fertilizer inputs
now exceed natural flows, and the capacity of the soil to absorb residuals thereby
altering the natural flows of nutrients in the soil, air and water. After consumption
activities, including the consumption of energy produced by nuclear power, there
are fewer places to dump waste or dispose of unwanted by-products so as not to
affect people or damage the environment.
If the consumption pattern of developed countries is used in developing
countries, the results can be disastrous (Goldemberg 1998). Some studies even
suggest that human activities are already consuming 25-40% of the global natural

5
carrying capacity (Daly and Kenneth 1993). The ecological footprint was one
hectare per capita in 1900, but by 1991, it had increased to 4.6 hectares per capita
(von Weizsäcker, Lovins and Lovins 1997). The non-renewable resources of oil and
gas made up 63% of primary energy sources in 2016, and these reserves are likely
to be depleted in the not so distant future. The world was consuming 7.3 billion
tons of coal per year by 2016, up from 3.1 billion tons in 1973. While this is more
than a doubling in 43 years, it is a decline form the peak that occurred in 2013
(International Energy Agency 2017).
It is undoubtedly true that it is impossible to achieve unlimited growth in
a limited space (Hardin 1968). Technology can improve efficiency and lower
emissions, but since it is not magic, it cannot transform limited entities into
unlimited ones.
1.3. Problem 2: Pressures from Population Increase
The human population is growing, and the bulk of this growth is located
in poor countries. The absolute number of people in developing countries is huge,
and in many of these developing countries, the population is increasing steeply
(Goodland 1992). Increasing amounts of energy and natural resources are needed
to sustain this growth (Reddy 2000). Some propose that the steep curve of the

6
population increase must be reduced to curb this growth. However, in many
countries, cultural, ideological, religious and political factors oppose population
control, management or reduction. In fact, population control is taboo in many
countries (Stockholm 1972). Many developing countries in particular are not ready
to accept the population control concept, which seems to threaten basic sovereignty
and cultural values. The question is whether the limited natural ecosystem and the
current production and consumption methods and systems used by developed
countries can feed the growing world population (Cohen 2005). To satisfy these
needs using current assumptions, global economic activity must increase to 5 to 10
times larger (Goodland 1992).
1.4. Problem 3: Increasing Environmental Pressures from Developing Countries
For developing countries, the appropriate approach initially seemed to be
to follow the development trajectories of developed countries. It is now apparent,
however, that the methods used by developed countries in the past cannot be
imitated by developing countries without exceeding the earth’s limitations.
The limited capacity of the earth to sustain life, the increasing human
population and the need for development in developing countries put great pressure
7
on the environment. According to Rockstrom et al. (2009), the world is approaching,
if not already exceeding, its limits in multiple ecosystem services. The recent report
from the Intergovernmental Panel on Biodiversity and Ecosystem Services finds
that three-quarters of land area is degraded, reducing the economic production
globally by 10 per cent, and along with climate change is adversely affecting 3.2
billion people. They project that if current trends continue, degradation could reach
95% of land by 2050 (IPBES 2018).
Environmental problems spread beyond political and national borders,
regardless of the sources of the pollution. Moreover, the goals and policies of
developing countries are different from those of developed countries (World
Development Report 2010). Nowadays, in developed countries, environmental
protection and sustainability receives high priority in most economic activities,
while economic development comes first in developing countries (Najam 2004).
Differences in environmental protection create distortions in competition through
international trade. Growth and development is the primary objective of the 70%
of the world’s population that lives in developing countries (Goldemberg 1998, 26).
To illustrate, South Africa clearly states, as a matter of policy, that it prioritizes
development over the environment (Sachs 2002). In China (PRC), the government

8
considers economic growth necessary for domestic political reasons (Lewis and
Gallagher 2011). It is apparent that the top priorities of these countries are to
increase their own national power and to improve their level of development (Jaffe
2004). Therefore, it is reasonable to conclude that the pressure imposed by
developing countries, with their increasing population, is becoming a critical factor
in determining the sustainability of the planet in the near future.
1.5. Problem 4: Linkages Between Development and the Environment
It is predicted that in the future, it will be very difficult, if not impossible,
for countries, including currently developing countries, to consume and use
resources at the same rate that developed countries have done in the past. At the
same time, the need for development in developing countries is no longer negligible.
Poor people need national economic development to bring them out of poverty,
with the assumption that the benefits of growth will directly accrue to them, or at
least trickle down to them. In this regard, both environmental sustainability and
pursuing development are important (Stockholm 1972). This statement has two
implications. One is that poverty reduction cannot be expected without concern for
ecological systems and biological diversity (Sachs 2002) because the earth has
9
limitations, as mentioned above. The other is that development can help improve
environmental quality (Stockholm 1972). The latter, a belief held by many
developing countries (Our Common Future 1987), supports the Environmental
Kuznets Curve (EKC) theory. A modification of the “development-leading-to-
higher-emissions” model is the EKC, which argues that human activities performed
in the pursuit of growth and development result in increases in certain pollutants at
low-income levels (Grossman and Krueger 1991, 1995). The EKC is the theoretical
basis for proceeding on this assumption, because development policies in
developing countries are strongly influenced or trapped by the EKC theory. As a
result, planners, politicians and policy makers are discouraged from making efforts
to stabilize or reduce GHG emissions. The validity of this proposition will be tested
in this dissertation. The linkage between economic development and environment
can mean that the environment gets lost in the shuffle. This linkage, however, also
offers an opportunity, because issue linkages can be “crucial to the success of
negotiations” (Susskind and Najam 2004).
Among many environmental issues, when it comes to climate change, it is
also usually considered normal when countries hesitate to take climate change
mitigation actions for fear of losing or reducing their development opportunities,

10
since emissions of GHG are often related to economic activities. After all, it has
recently been recognized that the climate change agenda cannot be discussed
without concern for development (Stern 2006). This means that when the climate
change agenda is related to the development agenda, it becomes more important to
the world, and particularly to developing countries. It is therefore difficult to make
climate a direct driver of policy strategic planning for many countries (Mertz,
Halsnæs and Olesen 2009) because, for developing countries, climate change is not
a priority issue. It is not usually considered to be among individual countries’
environmental problems (Gallagher 2006 and World Development Report 2010).
However, is it also recognized that development and climate change must be
discussed together (Sachs 2002) because development will never be successfully
achieved unless countries work together to develop climate change mitigation
measures (World Development Report 2010). The World Bank has recently made
addressing climate change a priority for development. If the issue is not addressed,
the climate of the future will undo much of the development work to date and cause
major suffering in many countries (World Bank 2012).
The question remains: how should the climate change agenda be related to
the development agenda? Low-emission systems, which mean high-efficiency
11
systems and new technologies, are required for development in developing
countries because they ensure the effective use of resources. It has been pointed out
that it is essential for development to be resilient to climate change, and
development (including growth and prosperity) cannot be achieved in cases in
which climate change levels are dangerously high (World Development Report
2010). According to Stern (2006), if climate change mitigation measures are not
considered, there will be a higher risk of disadvantaging development in the future.
Some climate change measures, particularly adaptations like infrastructure
improvements, urban planning, insurance for natural disasters, social benefit
packages, and the like, are thought to be beneficial for development even if climate
change does not occur.
It is also noteworthy that for governments, climate change is not the only
agenda that involves uncertainty in the decision-making process. Military spending
and investments are also decided in spite of major uncertainties (World
Development Report 2010). In this sense, incorporating climate change into current
development planning may be the best option (Dasgupta 2007).
Moreover, an effective environmental regime is one that cares about
development and removes the opposition between the environment and equity

12
(World Development Report 2010). Internationally organized actions for climate
change mitigation are also needed for development (World Development Report
2010). The implementation of such international cooperation depends on actions
taken by individual nations (World Development Report 2010). It is critical to make
development resilient to climate change and to seek growth and prosperity without
causing dangerous climate change (World Development Report 2010). In this
regard, to involve developing countries in environment conservation efforts,
regional poverty reduction must be linked to natural resource conservation (Chester
and Moomaw 2008). Adaptation measures to mitigate climate change can be
included in development projects (World Development Report 2010) that address
regional poverty reduction because development efforts generally improve the
capacity for adaptation (Mertz, Halsnæs and Olesen 2009). Many issues in
developing countries can be mitigated by existing technologies (Holdren 2008),
although the costs of some technologies may be burdensome for developing
countries (although the cost of zero carbon technologies is falling rapidly);
international development supports can therefore be expected to make a
contribution. In any case, it is impossible to discuss environmental problem
mitigation without linking it to the development agenda. Environmental policy will

13
never be able to move forward as long as development is not linked to the
environment (Najam 2004).
1.6. Problem 5: The Logic of Developing Countries
Following the second view expressed in 1.5, that development will
improve environmental quality (a view that is strongly influenced by EKC theory),
it is believed that development in developing countries cannot be neglected because
development itself will eventually mitigate environmental problems in developing
countries (Stockholm 1972, Principle 117). The logic of EKC is that when incomes
are low, consumption will never be sacrificed; instead, the reduction of
environmental degradation will be sacrificed. Therefore, since environmental
protection is assumed to be a “luxury good,” it is only when there is high income
that consumption can be deprioritized in favor of protecting environmental goods
and services. The EKC claims that policies that promote economic growth will
eventually bring environmental improvement (Moomaw 1997). Developing
countries take every opportunity to espouse the need for development in
international environmental meetings (Sachs 2002). In Stockholm in 1972,
developing countries united for the first time as a collective power and argued that
environmental protection should not be used to stall economic development. Rio,

14
in 1992, was held at the end of the Cold War. It also coincided with North-South
tension over development and the environment, with the North arguing for the
urgency of environmental protection and the South advocating poverty reduction.
Nonetheless, at Rio ‘92, environment and development were complementary, rather
than contradictory, categories. In fact, the official name of the UN Conference on
Environment and Development (UNCED) was chosen after it had been decided that
environment and development complemented each other. Rio’s most important
legacy was the global agreements that defines sustainable development as
“development that meets the needs of the present without compromising the ability
of future generations to meet their own needs” (Brundtland et al. 1987). These
agreements emphasized the strong connection between environmental quality and
a sustainable economy and society and were seen as a major step in resolving the
conflict between the environment and development. Even though the direct
achievements of UNCED Rio were disappointing, its fruits are the indirect outputs:
the increase in interest in the environment and development because of UNCED
and the enhanced importance attributed to the views of developing countries in
setting global environmental policy (Najam 2004).
1.7. Problem 6: Economic Growth as a Necessary Part of Development

15
At UNCED, governments agreed on a broad concept of development as
sustainable development, which means the improvement of conditions for both
present and future generations that include not only the economy, but also society
and the environment (Holdren 2008). However, in practice many development
agencies assume that human well-being is connected to economic development and
that development has the same meaning as economic growth (Najam et al. 2011).
The recognition that economic growth is needed for environmental improvement is
now at the center of sustainable development (Stern 1997). In this regard, economic
development is a necessary condition for quality of life in the present and future,
particularly for developing countries. Both social and economic development are
needed (Stockholm 1972). In the past, continuous development by the North was
not linked to environmental policy, since development was also the highest priority
for developed countries (Sachs 2002). In 1992, then-U.S. President George H. W.
Bush claimed that the American lifestyle was not negotiable. Even though the U.S.
is one of the most developed countries in the world, Bush’s claim is similar to those
made by developing countries that prioritize human wellbeing over the
environment (Moomaw and Papa 2012). This logically justifies the claim by
developing countries that their right to economic growth is not negotiable (Najam
16
et al. 2011). In this regard, the degree of development should be evaluated using
both social and economic factors.
1.8. Problem 7: Growing Contributions of Developing Countries
The developed countries’ share in the accumulated responsibility for
emissions is two-thirds of the total, and their energy consumption per capita is five
times higher than that of developing countries. Developing countries, however,
produce more than half of energy-related emissions and will bear a projected 90%
of the responsibility in the next 20 years. The responsibility of developing countries
for emissions is increasing, not only for CO2 but also for total GHGs (World
Development Report). Seventy-four percent of the primary energy increases from
now on will come from developing countries (IEA 2007). Coal and oil consumption
in China (PRC) and increases in GHGs per capita and GHGs per GDP will be the
main concerns of the future (Lewis and Gallagher 2011). It is estimated that CO2
emissions per capita in China (PRC) will catch up with those of developed countries,
while emissions from Russia will also increase (IEA 2007). It is also estimated that
even if emissions from developed countries were zero, emission reductions from
developing countries would also be needed to avoid an unsustainable climate

17
system (World Development Report 2010). However, the rapid population
increases forecast in developing countries will make it very difficult to achieve this.
If the world fails to involve developing countries in actions aimed at emission
reductions, developed countries will be justified in fearing that the problem may
become one of unfair competition (Meckling and Gu 2009).
Many developing countries prefer to build a coalition of winners rather
than to be separated because of their differences that place them at a disadvantage
in the international order. Therefore, the developing countries of the Global South
will play an important role in future global environmental policy, as the coalition
claims that development is its priority. Environmental mitigation measures cannot
succeed without the support of developing countries.
1.9. Problem 8: The Environmental Problem as a Global Agenda
Compared to the need for increasing national power and development,
measures to mitigate environmental problems are seldom prioritized because
governments think they can adapt to environmental problems later, after increasing
their national power and level of development. They do not want to argue about
what is not yet certain to happen. It is assumed that mitigating environmental

18
problems now might disturb the acquisition of national power and the development
process. Moreover, countries assume that increasing national power and
development will be necessary to achieve the economic potential to adapt to climate
change.
Climate change is an example of an environmental problem that involves
uncertainties. In this regard, it will be difficult to prioritize the mitigation of climate
change in this world of national interests where each country seeks to improve its
national power and development and expects to bring improved economic and
social conditions and political stability. Ethics can contribute little to motivating
climate change mitigation actions insofar as (i) climate change is seen as a crisis of
the long-term future and (ii) climate change mitigation actions are not believed to
bring economic advantages.
However, this does not mean that climate change issues are an insignificant
agenda for the world. Klare (2001) stated that races to obtain resources such as oil,
water, and minerals will cause conflicts, as well as result in environmental problems.
Therefore, such races have a strong connection to national security. Klare added
that international conflicts will be aggravated by population increase and climate
change. When the damages caused by population increase and climate change

19
become greater, it will be very difficult for policy makers to avoid social problems,
reductions in development potential and conflicts. The conflicts may originate in
developing countries (Homer-Dixon 1991), which constitute a majority that is
broadly spread out across the world. For this reason, climate change mitigation
must be addressed by the world as an agenda related to national security. CO2
control in particular will not happen immediately in developing countries, since
controls of more toxic emissions are prioritized as a local issue in these countries
(Moomaw 1997). Traditional development depended on energy from combusting
fossil fuels, which leads to climate change. If fossil fuels cannot be utilized because
they cause climate change, developing countries cannot follow the development
path of developed countries.
1.10. Problems to Be Addressed
The problems presented in Sections 1.2 to 1.9, which serve as the
motivations of this dissertation, are illustrated in Figure 1. It would be useful to
present a case of successful mitigation of these problems that simultaneously
sustains the environment and improves the development level of a developing
country, especially because a majority of the world population is expected to live

20
in developing countries in the coming decades. It is now recognized that (i) human
activities are causing environmental pressures on the limited carrying capacity of
the earth, but (ii) the need for development in developing countries (iii) with
increasing populations is also growing. This means, as explained above, that the
needs of developing countries cannot be met by following the development path
used by currently developed countries. Therefore, it is important to identify
successful developing countries in recent history to identify ways to improve the
living standards of the world’s poorest without sacrificing the environment. Here,
“successful developing countries” are countries that have improved both their level
of development and their environmental performance. In this dissertation,
improvements in the level of development will be indicated by the Human
Development Index (HDI), and improvements in environmental performance will
be indicated by greenhouse gas emissions per capita (GHGpc). These indicators
have been chosen because HDI is currently a globally recognized parameter that
quantifies countries’ levels of development and living standards. Most policy
makers all over the world believe that it is necessary to sacrifice climate change
mitigation to achieve economic development. It may be because development is
believed to bring well-being and happiness to people particularly in poor countries.

21
As of now, there is no globally and academically trusted indicator to show level of
well-being and happiness other than HDI. For example, there are 17 Sustainable
Development Goals (SDGs), but there is no comprehensive indicator that measures
levels of achievement toward the goals. HDI considers only 3 measures, education,
health, and income, which is a limitation of HDI as an indicator to show the level
of well-being and happiness. However, still this is the best measure available. The
climate change impact produced by emissions from each country’s GHGs, not only
from CO2, is also one of the clearest parameters that show risk to the environment.
Total GHG emissions differ according to the size of the country; therefore, GHGpc
emissions are an appropriate parameter for use in discussing multiple countries.
Moreover, considering that the population of developing countries is increasing,
when the goal is to reduce the total emissions produced by a country, reducing
GHGpc is generally a step taken before reducing the country’s total GHG emissions.
It is often assumed that developing countries facing uncontrollable
population increases and huge pressures from their citizens’ desire to achieve higher
levels of development will find it almost impossible to improve their environmental
performance. Improving climate change indicators seems especially difficult, since
these indicators are connected to many economic activities. However, as shown in

22
Chapter 4, when the trajectories of relations between the indicator of development
and GHGpc are observed, it is found that significant numbers of developing
countries improved both their development and environmental indicators between
1990 and 2010. Therefore, it is important to analyze these successful developing
countries to identify ways to improve the living standards of the poor while
minimizing environmental damage.
This dissertation investigates the relationship between GHGpc and HDI
using trajectory data from 1990-2010. These data are used to test the EKC, and it
is found that the EKC was not applicable to the actual historical trajectory, as
Moomaw and others have shown. In this study, the relationship between GHGpc
and HDI in developing countries over time is examined in light of the theoretical
EKC, and it is concluded that the EKC is not valid as a general theory. The
environment does not always have to be victimized when development is prioritized,
and thus there is no magical income that will stop environmental degradation, as is
assumed by the EKC theory. This dissertation then goes on to analyze, as its original
contribution, what happened in the “successful development” accomplished by
some of the Asian developing countries in the period. To gain insight into the
underlying factors that account for their trajectories of development, multiple

23
methods are used: (i) designating successful developing countries in Asia, (ii)
examining GHG components and emitter industries, (iii) examining HDI
components, (iv) examining the contribution of technology using the modified
KAYA Identity, and (v) examining the development of aid effectiveness. In order to
determine why specific patterns are observed, experts in these countries have been
consulted about these explanations to confirm or question the insights.

24
CHAPTER 2. RESEARCH QUESTION AND HYPOTHESIS
2.1. Research Questions
To begin to improve the living standards of poor countries, which is one
of the most significant challenges for humanity’s future, it is important to identify
successful developing countries that have improved both their level of development
and their environmental performance. In this dissertation, “successful developing
countries” are defined as countries that showed improvements in development
indicators, namely HDI, while also increasing their population and decreasing their
GHGpc. As will be discussed later in detail, during the period 1990-2010, more
low-income countries exhibited this pattern of “successful development” than did
middle-income countries, as shown in Figure 37. This raises the interesting question
of what factors determine the path of GHG emissions during the development
process.
Based on this observation, this dissertation’s central question is: What
factors determine whether developing countries achieve lower GHG emissions
while meeting their development goals?

25
2.2. Hypotheses
Four factors are used to build hypotheses in response to this question,
because it can be assumed that such success may be affected by (i) internal driving
forces such as policy initiatives, (ii) external driving forces that cannot be controlled
by the country, (iii) help from others, such as donor support, and/or (iv)
fundamental changes at the domestic level. Accordingly, the four hypotheses are as
follows:
(i) National policy initiatives, strategies and changes in practices were
effective in the successful countries;
(ii) Responses to external factors were effective in the successful countries;
(iii) Financing by development agencies was effective in the successful
countries;
(iv) The mix of economic activities at different stages of development worked
effectively in the successful countries. The type of economic activity
(service industry, heavy industry, agriculture etc.) and the technologies used.
The type of economic activity and the technologies used and adopted
determines the type of GHG emitted (CO2, methane etc.). Emissions depend
upon the mix of economic activities and the type of GHG emitted by

26
different sectors in each country. Changing economic activities as
development proceeds may alter the amount and type of GHG emissions.

27
CHAPTER 3. METHODOLOGY (STRATEGY FOR ANALYSIS)
The strong message from Moomaw and Unruh (1997) for policy makers
is that environmental improvement can be achieved without sacrificing economic
growth, as politics assumes, even though it will not be achieved automatically. This
means that there are opportunities to increase both development and environmental
protections. In this dissertation, we will examine the trajectories of Asian countries
between 1990 and 2010 to identify successful developing countries that have
achieved both development and environmental improvements. We will examine
whether or not these earlier accomplishments are consistent with specific
Sustainable Development Goals (SDGs) that are to be achieved between 2015 and
2030.
In this regard, this dissertation does the following strategy for analysis:
(i) Analyzes empirical findings from historical development and emission
patterns for 130 countries in the world from 1990-2010 (analysis based on
past historical trajectories);
(ii) Analyzes quantitative data from countries that showed “successful
development” in their historical trajectories;

28
(iii) Analyzes in detail the successful countries in Asia;
(iv) Analyzes responses by experts to questionnaires (a qualitative approach);
and
(v) Tests hypotheses generated by the quantitative and the qualitative
approaches.
These steps are explained below in detail.
(i) Analyzes empirical findings from historical development and
emission patterns for 130 countries in the world from 1990-2010 (analysis based
on facts shown in historical trajectories): An initial examination of data from 130
countries showed that many low-income countries with population increases
exhibited improvements in their environmental indicator (GHGpc), while also
improving their development indicator (HDI). Chapter 4, which is devoted to step
(i), shows historical proof of this finding. Chapter 4 will also provide the new
historical evidence that a significant number of developing countries achieved
improvement in development (HDI) while they also experienced an improved
environmental indicator (GHGpc).
(ii) Analyzes quantitative data from countries that showed
“successful development” in their historical trajectories: In step (ii), specific
29
countries that showed “successful development” are identified along with the
specific factors that may have contributed to the observed outcome. Four types of
countries are observed: (a) countries that were successful in improving both the
environmental indicator and the development indicator (GHGpc reduced and HDI
increased); (b) countries whose HDI improved but failed to improve the
environmental indicator (GHGpc), (c) countries whose environmental indicator
(GHGpc) improved but failed to improve the development indicator, and (d)
countries that were unsuccessful in improving both the environmental indicator
(GHGpc) and the development indicator (HDI).
If a developing country merely followed the path that developed countries
followed in the past, countries that achieved higher development increased their
GHGpc. It is expected that the trajectories of countries of type (a) will reveal
interesting insights into a more sustainable development process, since a significant
number of developing countries decreased their GHGpc while their HDI increased,
as shown later. The GHGpc can be decreased by a rapid population increase, which
is common in developing countries (this looks like a “dilution” of GHGs caused by
the population increase). If during this period, however, such developing countries
simply followed the path that developed countries followed in the past, the per

30
capita wellbeing should have declined also; thus, HDI should not have improved.
A mediating factor may be found that differentiates the country types.
(iii) Analyzes in detail the successful countries in Asia: An
examination of the successful countries through steps (iii), (iv) and (v) produces
insight into the factors behind successful development. In this step, efficient-
energy-consumption technology is the focus because developing countries that
achieved an improvement in HDI or GDPpc with a decrease of GHGpc may have
done so through technological improvements: without efficiency improvements or
low-emission technologies, the successes may not have taken place. Moreover,
some efficient-energy-consumption technology improvements may be caused
intentionally by policies, while others may be caused unintentionally by policies
that are not aimed at reducing GHG emissions, or by structural changes in society.
Technology is analyzed taking into consideration EKC, IPAT, and Kaya Identity.
The dissertation determines whether other factors play a role, considering, for
instance whether the observed reductions in GHGs result from increased foreign
aid, or changes in the types of gases that make up total GHG are caused by changes
in economic activities or technologies as a country develops. The relative
importance of foreign aid, economic structure (and hence which GHGs are emitted

31
in what amounts) and policy-induced emission trajectories are different for each
country.
(iv) Analyzes responses by experts to questionnaires (a qualitative
approach): After the data analysis in steps (i)–(iii), the results are examined in light
of professional insights from experts. The experts have varied expertise and
experience in the field of development and the environment. The questionnaires
have been carefully designed for the countries that showed successful development,
based on the results of the data analysis.
(v) Tests hypotheses generated by the quantitative and the qualitative
approaches: The final part of the dissertation tests the hypotheses generated by the
findings achieved in the steps up to (iv). This will show what happened in 1990-
2010 to produce successful development in Asia. The conclusion suggests ways to
achieve the success that appears difficult to achieve in poor countries if the EKC
theory is assumed to be valid.
Details of methods in each step are embedded in each of upcoming
chapters.
32
CHAPTER 4. EMPIRICAL FINDINGS FROM HISTORICAL DEVELOPMENT AND EMISSION PATTERNS
This chapter is devoted to an analysis of data on the historical trajectory of
the relationship between development indicator (the HDI in this dissertation) and
the environmental indicator (the climate change indicator, which is GHG emissions
per capita in this dissertation). Figure 2 provides a snapshot of GHG emissions per
capita (GHGpc)2 and the HDI of 180 countries for 2010. It demonstrates that
countries emit various levels of GHGpc, even though they may have similar levels
of HDI.3 The data include land use change4 and GHGs (heat trapping GHGs:
carbon dioxide (CO2), methane (CH4), nitrous oxide (N2O), and industrial gases
(PFC, HFC, SF6) ).
2 GHG per capita data are available at the CAIT provided by the World Resources Institute, even though the data UNDP’s International Human Development Indicators do not provide useful data for 1990-2000 for most countries. (http://hdrstats.undp.org/en/indicators/96606.html) 3 The Human Development Index (HDI) is a composite statistic of life expectancy, education, and income indices used to rank countries into four tiers of human development. It is a tool developed by the United Nations to measure and rank countries’ levels of social and economic development based on four criteria: life expectancy at birth, mean years of schooling, expected years of schooling and gross national income per capita. The HDI makes it possible to track changes in development levels over time and to compare development levels in different countries. (SOURCE: UNDP) 4 Land use, land-use change, and forestry (LULUCF) means “A greenhouse gas inventory sector that covers emissions and removals of greenhouse gases resulting from direct human-induced land use, land-use change and forestry activities.” (2017/08/05, UNFCCC, Glossary of climate change acronyms and terms, http://unfccc.int/essential_background/glossary/items/3666.php#L)

33
Figure 2. GHG Emissions per capita and HDI of 180 countries in 2010.
SOURCE: Climate Analysis Indicators Tool (GHGpc) and United Nations Development
Programme (HDI)
HDI is a composite statistic of the health, education, and income indices
used to rank countries on the basis of three characteristics of human development
(UNDP 2012). When the relationship between development and environment is
examined, HDI can be used as the most general indicator accepted internationally.
In fact, these four indicators (health, education, income and GHGpc) are linked to
almost half of the 17 sustainable development goals (SDGs) for transforming our
world (UN DSPD 2018). The health indicator is related to GOAL 2: Zero Hunger,
0
10
20
30
40
50
60
70
80
0.000 0.200 0.400 0.600 0.800 1.000
GH
Gpc
in 2
010
(with
land
use
cha
nge)
Met
ric t
onne
s CO
2
Human Development Index in 2010
34
GOAL 3: Good Health and Well-being, and GOAL 6: Clean Water and Sanitation.
The education indicator is related to GOAL 4: Quality Education. The income
indicator is related to GOAL 1: No Poverty, and GOAL 8: Decent Work and
Economic Growth. The GHGpc indicator is related to GOAL 7: Affordable and
Clean Energy, and GOAL 13: Climate Action.
There are 130 countries for which data for both HDI and GHGpc are
available for the period of 1990-2010. The countries were divided into ten groups5
based on their incomes in the starting year, i.e., the Gross National Income per
capita (GNIpc) in 1990 (Climate Analysis Indicators Tool (GHGpc) and United
Nations Development Programme (HDI)). Those ten groups were defined from 1st
Group as the highest GNIpc group to 10th Group as the lowest GNIpc group.6 As
mentioned in section 1.8, developing countries emit more than half of energy-
related emissions in the world and will bear a projected 90% of the responsibility
for additional emissions in the next 20 years. Emissions and the responsibility of
developing countries for emissions are increasing, not only of CO2 but also of total
GHGs (World Development Report 2010).
5 Dividing 130 countries into 10 groups was chosen as a convenient option that will provide advantages to find out how trajectories were in such as Figure 3, Figure 15, and Figure 37. 6 GNIpc averages of each group in 1990 are; (1st group) $25,700, (2nd group) $$15,519, (3rd group) $6,589, (4th group) $2,974, (5th group) $2,132, (6th group) $1,348, (7th group) $823, (8th group) $616, (9th group) $391, and (10th group) $215.

35
It is found that CO2 emissions do not constitute a significant portion of the
total GHGs in poorer developing countries, in contrast to emissions in developed
countries, where CO2 is the major climate change contributor. While CO2
constitutes more than 70-80% of the GHG emissions from the rich country groups,
CO2 constitutes less than 20-40% of the GHG emissions from the poor country
groups as shown in Figure 3. The percentages are the 100-year global warming
potential percentage for the total GHGs. Therefore, it is important to analyze trends
of GHG emissions that include gases other than CO2.
Figure 3. Trajectory of CO2 ratio among GHGs7
SOURCE: Climate Analysis Indicators Tool (CAIT) 2.0. ©2014. Washington, DC: World Resources Institute)
7 The grouping has been done from the richest to the poorest at the year of 2010 where each group has 13 countries.
Year Perc
enta
ge o
f CO
2 Em
issi
on to
tota
l GH
G E
mis
sion
36
An initial analysis of the cross-country data of the 130 countries for 1990-
2010 showed various trajectory of the GHGpc relative to HDI (Figure 4– Figure
13) (Appendix 1) from the group of countries with the highest GNIpc to the lowest
GNIpc. Unlike snapshots from a particular year, changes over time can show how
countries dealt with development and GHGpc in successful or unsuccessful ways.
Some countries were successful in drastically improving HDIs while they
decreased GHGpc. Others were unsuccessful in that they did little to improve HDIs
but drastically increased GHGpc.
The period 1990-2010 is of particular interest because the world became
conscious of GHG emissions and climate change during this era, beginning in 1990,
when the IPCC’s first report was issued, and continuing through 1992, when the
UNFCCC was adopted; 1997, when the Kyoto Protocol was agreed upon; and 2005,
when it entered into force. The first commitment period of the Kyoto Protocol was
from 2008 to 2012.
4.1. General Findings from the Historical Trajectories
Figure 14 shows an overview of the trajectories of the 130 countries

37
divided into 10 income groups (GNI), along the HDI and GHGpc dimensions
between 1990-2010.
Figure 14. Greenhouse Gas Emissions Per Capita b Human Development Index, 1990-2010 (by individual countries)8
SOURCE: Climate Analysis Indicators Tool (GHGpc) and United Nations Development
Programme (HDI)
As expected, country groups with high GNIpc occupy the “high HDI–high
GHGpc” areas, while country groups with low GNIpc occupy the “low HDI–low
8 This table is difficult to understand in details, therefore enlarged figures for each of 10 groups are given in Appendix 2 (Figure 16-25)
Human Development Index, 1990, 1995, 2000, 2005, 2010.
Gre
enho
use
Gas
Em
issi
on P
er C
apita
(in
tons
per
yea
r, CO
2 equ
ival
ent),
199
0, 1
995,
200
0, 2
005,
201
0.

38
GHGpc” areas. However, there are a few outlier countries within specific groups.
The Central African Republic (CAR), which belongs to the 9th group (light gray),
for example, has an average HDI level that is similar to that of the other 9th group
countries, but its average GHGpc emissions are higher. Another outlier, this time
belonging to the 5th group (dark blue), is Belize. Like CAR, Belize’s average HDI
is similar to that of the other 5th group countries, but its average GHGpc emissions
level is also higher than that of the other countries in the group. Interestingly, the
2nd group of countries (yellow) displays a distinct pattern. As illustrated in the chart,
the countries’ average HDIs are all between 0.80 and 0.88, but the average GHGpc
emission levels are widely dispersed. Italy and Spain produce less than 10 tons of
GHGpc per year, while Qatar, Brunei Darussalam and Kuwait, which also belong
to the 2nd group, produce much higher GHGpc per year as industrial producers of
oil and gas. The other countries in the group have varying levels of GHGpc
emissions per year.
As can be observed in Figure 15, the areas enclosed by each group of
trajectories in Figure 14 line up from left to right, with richer country groups
occupying higher HDI regions and poorer country groups occupy lower HDI
regions. There seems to be no such grouping or trends for GHGpc, some groups

39
exhibit wide variability, spreading their GHGpc from low to high, while other
groups have a narrower range in their GHGpc.
Figure 15. Greenhouse Gas Emissions Per Capita by Human Development Index (by income groups), 1990–2010.
Figure 16 - Figure 25 (Appendix 2) are expanded versions of Figure 4
through Figure 13. (Appendix 1) from the highest GNIpc country group to the
lowest GNIpc country group. These figures show more clearly each country’s
trajectory. Most of the countries showed an improvement in HDI from 1990 to
2010, while only a few showed a decrease in HDI during certain periods. Some of
these changes seem to have been caused by civil wars and conflicts. However,
regardless of the GNIpc values used for the grouping, some countries experienced
a decrease in GHGpc from 1990 to 2010.
(tons
per
yea
r, CO
2 eq
uiva
lent
)

40
Detailed analysis revealed that many different trajectories are found. They
are (i) Figure 26 and Figure 27 show, continuous improvement of HDI with a slight
and significant decrease of GHGpc, (ii) Figure 28 and Figure 29 show, continuous
improvement of HDI with a significant and slight increase or no change of GHGpc,
(iii) Figure 30, 31 and Figure 32 show, U-shaped slopes, (iv) Figure 33 and 34 show,
L-shaped slopes, (v) Figure 35 shows, the slopes of former USSR-member
countries, and (vi) Figure 36 shows, the slopes of the G8 countries. The countries
corresponding to each shape are listed with the figures (Figure 26-36) (Appendix
3).
Countries showed different types of trajectories during the period.
Therefore, it is necessary to analyze individual countries to determine the factors
that account for each trajectory. Throughout this dissertation, “successful countries”
are defined as the countries that successfully improved GHGpc while also
improving HDI. Similarly, “successful development” is defined as development
that happened with improved HDI and GHGpc.
Table 1 in Appendix 4 shows the regression lines of each country in
country group 1 in Figure 4 (and Figure 16), which are the trajectories of the relation
between HDI and GHGpc in 1990-2010. As the table shows, the regression line of

41
Switzerland has a slope of -8.9497, which means that Switzerland reduced
8.9497kg of GHGpc while it increased 1 unit of HDI throughout this period. The
table shows that eleven countries (Switzerland, Luxembourg, Sweden, Norway,
Denmark, Japan, Iceland, United States, Germany, France and Belgium) were
successful in group 1.
Similarly, Table 2 to Table 10 (Appendix 4) shows the regression lines of
each country for each income group. As shown in Table 11 (Appendix 4), Group 1
had 11 successful countries, and groups 2 to 10 had 5, 3, 7, 9, 5, 8, 9, 7 and 9
successful countries, respectively. So, 73 of the 130 countries, or 56% were
successful in increasing their HDI and decreasing their GHGpc. This U-shaped
trend of the number of successful countries in each income group is shown in Figure
37. The fit to a quadratic regression line is not very strong.

42
Figure 37. Number of Successful Countries per Country Income Group, 1990–2010.9
This means that approximately as many low-income countries as high-
income countries showed “successful development.” This is counter to expectations
of traditional development economics and the Environmental Kuznets curve that
rich countries can successfully reduce their GHGpc while they improved HDI while
poor countries faced difficulty in reducing their GHGpc while improving HDI.
However, the actual trajectory from 1990 to 2010 shows that many poor
9 The standard error is 0.76, and it means statistically insignificant. This might be because there are only 10 samples.
Regression liney = 0.1174x2 - 1.1402x + 9.05
R² = 0.17610123456789
10111213
0 1 2 3 4 5 6 7 8 9 10
Num
ber o
f Suc
cess
ful C
ount
ries
Country Group

43
countries reduced GHGpc while improving HDI. One possible explanation is that
GHGpc reduction was caused by rapid population increases in developing countries,
since GHGpc goes down when the rate of population growth is faster than the rate
of increase in GHG emissions, which looks like a dilution by population increase.
However, if this were happening in poor countries, it is unlikely that HDI would
also improve, because a rapid increase in the population would slow the increase in
the country’s per person share of wealth, which would also slow HDI improvement,
since GHG emissions can represent increased human activity and energy use that
contribute to a country’s wealth per person. Meaning to say, when the regression is
analyzed, it shows that dilution by population increase is not a fundamental reason,
because if it were, then the dilution by population increase would also have
diminished HDI improvement.
It is therefore important to understand what happened in the developing
countries that showed “successful development.” In the end, a country’s total GHG
emissions might increase. However, with the rapid population increases that are
occurring in developing countries, it will be impossible to reduce the total emissions
of poor countries without finding a way to decrease GHGpc. In this regard, it is
essential to identify the reasons for this trajectory, focusing on GHGpc.

44
4.2. CO2 Was Not the Main Source of GHG Emissions from Developing Countries
Figure 3 showed the trajectory of CO2 out of the total GHG emissions of
the 10 groups. Many past analyses have focused on CO2, and this focus has
produced conflict in international negotiations, since CO2 is a by-product of fossil
fuel, the major source of energy, which is a backbone of economic activity. Because
it is generally assumed that energy production is the most important ingredient for
development, it is difficult for countries (especially developing countries) to
commit to reducing CO2 emissions, which they equate with reducing energy
production and hence slowing down their economic development therefore fail to
expand the percent of the population having access to infrastructure. However, the
trajectory in Figure 3 shows that in developing countries, even though CO2 was
more significant in 2010 than in 1990, CO2 has never been a main component of
GHGs. CO2 ratios in the four groups of lower-income countries never reached 50%
of GHGs in the period under study, and the ratios of the 7 groups of lower-income
countries never reached 70% of GHGs. In this regard, it is supposed that reducing
GHGs other than CO2 in developing countries can be an effective means of future
climate change mitigation. Such reductions may occur by efficiency gains in

45
activities that emit these gases or by transitions to a different industry that releases
different GHGs. The fact that CO2 was not the main source of GHG emissions from
developing countries is another important issue to investigate.
4.3. Evaluation of Success by Rate (Steepness), Improvement in HDI, and Improvement in GHGpc
The findings in Figure 37 offered a good starting point: there were as many
low-income countries that showed “successful development” as high-income
countries. However, the graph in the figure shows only a bimodal evaluation of
countries as “successful” or “unsuccessful” and thus gives no details about what
happened in these countries.
Increasing HDIs and decreasing GHGpcs are counted as aspects of success.
For example, the slope of △GHGpc/△HDI shows success because the slope of
△GHGpc/△HDI indicates efficiency, which is the value of the decreasing GHGpc
while increasing one unit of HDI. However, a question emerges: even if the slope
is very steep (meaning that this parameter indicates that the country was effective
at reducing GHGpc while increasing HDI), if the absolute value of the increase in
HDI is very small, we do not know whether the country did a better job than another
country that increased HDI significantly with a less steep slope. Therefore, to
46
provide various ways of evaluating success, five parameters were used: (i) the
regression line’s slope of △GHGpc/△HDI throughout the period of 1990-2010,
(ii) the absolute value of △HDI through the period of 1990-2010, (iii) the ratio of
the increased HDI value from 1990-2010 compared to the HDI value in 1990, (iv)
the absolute value of △GHGpc through the period of 1990-2010, and (v) the ratio
of the decreased GHGpc value from 1990-2010 to the GHGpc value in 1990. These
parameters were picked up as preliminary parameters to evaluate the success of
these countries. Table 12 shows the results of using these parameters. Blue means
that the countries are in groups 7-10 (low-income), green means that the countries
are in groups 3-6 (middle-income), and white means that countries are in groups 1
and 2 (High income).
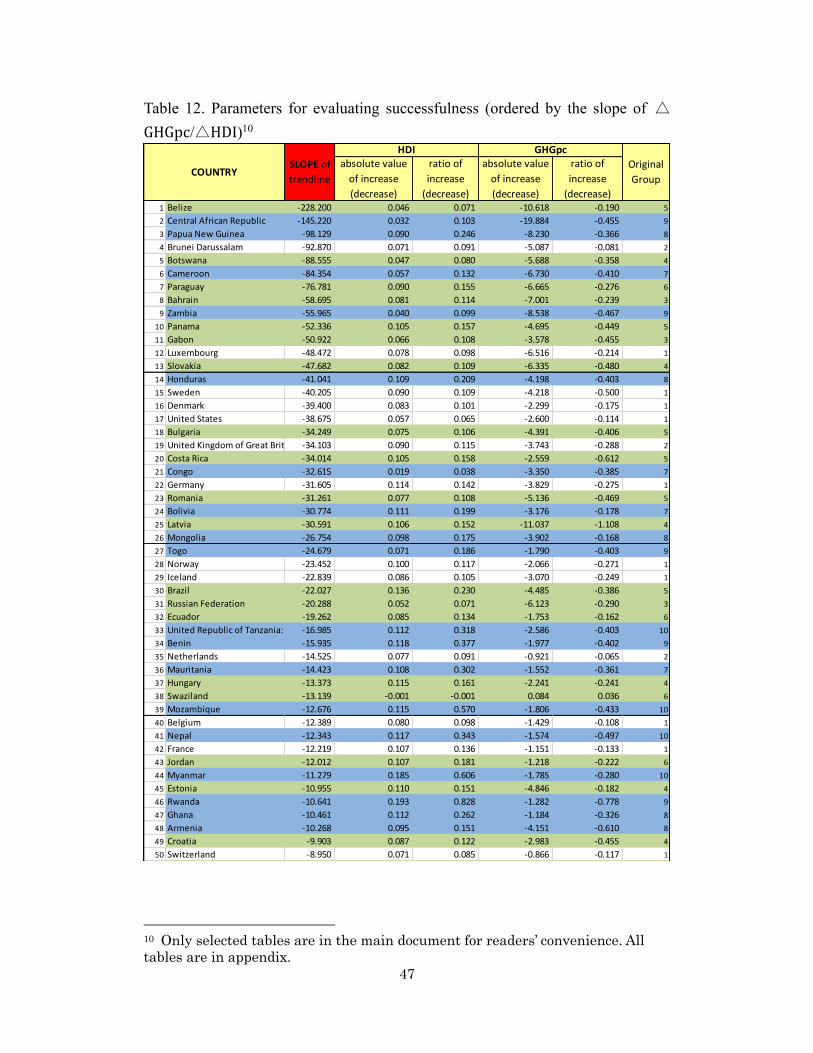
47
Table 12. Parameters for evaluating successfulness (ordered by the slope of △GHGpc/△HDI)10
10 Only selected tables are in the main document for readers’ convenience. All tables are in appendix.
1 Belize -228.200 0.046 0.071 -10.618 -0.190 52 Central African Republic -145.220 0.032 0.103 -19.884 -0.455 93 Papua New Guinea -98.129 0.090 0.246 -8.230 -0.366 84 Brunei Darussalam -92.870 0.071 0.091 -5.087 -0.081 25 Botswana -88.555 0.047 0.080 -5.688 -0.358 46 Cameroon -84.354 0.057 0.132 -6.730 -0.410 77 Paraguay -76.781 0.090 0.155 -6.665 -0.276 68 Bahrain -58.695 0.081 0.114 -7.001 -0.239 39 Zambia -55.965 0.040 0.099 -8.538 -0.467 9
10 Panama -52.336 0.105 0.157 -4.695 -0.449 511 Gabon -50.922 0.066 0.108 -3.578 -0.455 312 Luxembourg -48.472 0.078 0.098 -6.516 -0.214 113 Slovakia -47.682 0.082 0.109 -6.335 -0.480 414 Honduras -41.041 0.109 0.209 -4.198 -0.403 815 Sweden -40.205 0.090 0.109 -4.218 -0.500 116 Denmark -39.400 0.083 0.101 -2.299 -0.175 117 United States -38.675 0.057 0.065 -2.600 -0.114 118 Bulgaria -34.249 0.075 0.106 -4.391 -0.406 519 United Kingdom of Great Britain and Northern Ireland-34.103 0.090 0.115 -3.743 -0.288 220 Costa Rica -34.014 0.105 0.158 -2.559 -0.612 521 Congo -32.615 0.019 0.038 -3.350 -0.385 722 Germany -31.605 0.114 0.142 -3.829 -0.275 123 Romania -31.261 0.077 0.108 -5.136 -0.469 524 Bolivia -30.774 0.111 0.199 -3.176 -0.178 725 Latvia -30.591 0.106 0.152 -11.037 -1.108 426 Mongolia -26.754 0.098 0.175 -3.902 -0.168 827 Togo -24.679 0.071 0.186 -1.790 -0.403 928 Norway -23.452 0.100 0.117 -2.066 -0.271 129 Iceland -22.839 0.086 0.105 -3.070 -0.249 130 Brazil -22.027 0.136 0.230 -4.485 -0.386 531 Russian Federation -20.288 0.052 0.071 -6.123 -0.290 332 Ecuador -19.262 0.085 0.134 -1.753 -0.162 633 United Republic of Tanzania: Mainland-16.985 0.112 0.318 -2.586 -0.403 1034 Benin -15.935 0.118 0.377 -1.977 -0.402 935 Netherlands -14.525 0.077 0.091 -0.921 -0.065 236 Mauritania -14.423 0.108 0.302 -1.552 -0.361 737 Hungary -13.373 0.115 0.161 -2.241 -0.241 438 Swaziland -13.139 -0.001 -0.001 0.084 0.036 639 Mozambique -12.676 0.115 0.570 -1.806 -0.433 1040 Belgium -12.389 0.080 0.098 -1.429 -0.108 141 Nepal -12.343 0.117 0.343 -1.574 -0.497 1042 France -12.219 0.107 0.136 -1.151 -0.133 143 Jordan -12.012 0.107 0.181 -1.218 -0.222 644 Myanmar -11.279 0.185 0.606 -1.785 -0.280 1045 Estonia -10.955 0.110 0.151 -4.846 -0.182 446 Rwanda -10.641 0.193 0.828 -1.282 -0.778 947 Ghana -10.461 0.112 0.262 -1.184 -0.326 848 Armenia -10.268 0.095 0.151 -4.151 -0.610 849 Croatia -9.903 0.087 0.122 -2.983 -0.455 450 Switzerland -8.950 0.071 0.085 -0.866 -0.117 1
COUNTRYSLOPE of trendline
HDI GHGpcOriginal Group
absolute value of increase (decrease)
ratio of increase
(decrease)
absolute value of increase (decrease)
ratio of increase
(decrease)

48
51 Venezuela (Bolivarian Republic of)-7.431 0.108 0.170 -0.996 -0.068 552 Côte d'Ivoire -7.039 0.067 0.186 -0.447 -0.120 753 Sierra Leone -6.553 0.099 0.399 -0.736 -0.283 1054 Guyana -5.676 0.125 0.250 -0.756 -0.074 855 Colombia -5.585 0.114 0.191 -0.522 -0.101 656 Niger -5.182 0.100 0.506 -0.374 -0.227 957 Ireland -4.875 0.124 0.156 -2.045 -0.134 258 Nicaragua -4.606 0.115 0.239 -0.870 -0.098 859 Lao People's Democratic Republic -4.448 0.155 0.409 -0.870 -0.110 1060 Uganda -4.232 0.144 0.473 -0.712 -0.347 1061 Mali -3.389 0.141 0.689 -0.533 -0.188 962 Senegal -3.144 0.102 0.278 -0.405 -0.156 763 Kenya -2.366 0.048 0.105 -0.456 -0.247 864 Lithuania -2.079 0.077 0.106 -4.176 -0.326 465 Lesotho -1.743 -0.022 -0.046 0.180 0.155 866 Japan -1.681 0.072 0.086 -0.302 -0.033 167 Albania -1.359 0.084 0.127 -1.152 -0.345 768 Malawi -1.279 0.118 0.399 -0.188 -0.108 1069 Jamaica -1.009 0.085 0.133 -0.215 -0.046 570 Namibia -0.755 0.034 0.060 0.990 0.101 571 Afghanistan -0.533 0.122 0.495 -0.344 -0.269 1072 Italy -0.355 0.110 0.143 -0.632 -0.076 273 Gambia -0.295 0.114 0.353 -0.017 -0.004 774 Fiji 0.986 0.085 0.138 -0.144 -0.085 575 Bangladesh 1.008 0.147 0.406 0.159 0.180 1076 Syrian Arab Republic 1.177 0.088 0.158 0.032 0.007 777 Sri Lanka 2.215 0.098 0.161 0.126 0.057 978 Pakistan 2.400 0.129 0.335 0.333 0.214 979 Haiti 2.864 0.051 0.127 0.105 0.151 980 Yemen 2.968 0.180 0.629 0.517 0.526 981 Philippines 3.501 0.068 0.116 0.302 0.240 782 Guatemala 3.578 0.115 0.247 0.249 0.076 783 Algeria 4.088 0.148 0.262 0.565 0.144 584 Peru 4.309 0.114 0.185 0.713 0.161 685 El Salvador 4.522 0.150 0.285 0.671 0.419 786 Greece 4.542 0.094 0.122 -0.116 -0.012 387 India 4.656 0.137 0.334 0.719 0.604 988 Malta 5.297 0.087 0.115 0.212 0.030 389 South Africa 5.911 0.000 0.000 -0.403 -0.043 490 Tunisia 6.114 0.157 0.285 0.911 0.390 691 Egypt 8.746 0.158 0.315 1.302 0.582 892 Turkey 8.917 0.146 0.257 1.516 0.448 393 Mexico 9.166 0.117 0.178 0.950 0.189 494 Argentina 10.895 0.104 0.148 1.077 0.114 395 Morocco 12.031 0.146 0.332 1.871 1.805 696 Tajikistan 12.618 -0.003 -0.005 -1.957 -0.580 897 Dominican Republic 12.942 0.113 0.193 1.447 0.856 698 Cuba 13.864 0.094 0.139 -0.069 -0.017 499 Vietnam 14.603 0.172 0.393 2.487 6.390 10
100 Portugal 16.720 0.103 0.144 1.096 0.185 3101 Thailand 17.425 0.116 0.205 2.103 0.682 6102 Indonesia 17.460 0.141 0.294 2.419 0.401 8103 Spain 18.043 0.128 0.170 0.950 0.153 2104 New Zealand 18.876 0.082 0.098 0.771 0.068 2105 Tonga 18.897 0.052 0.080 0.929 0.347 6106 Israel 19.538 0.087 0.107 2.151 0.233 2107 Cyprus 19.629 0.070 0.090 1.377 0.210 3108 Kyrgyzstan 19.807 0.005 0.009 -7.661 -1.126 8109 Chile 20.980 0.110 0.157 2.371 0.881 4110 Singapore 22.039 0.136 0.180 3.455 0.334 2

49
Table 13 to Table 16 (Appendix 5) show the same values used in Table 12,
but while Table 12 is ordered by parameter (i), the regression line’s slope of △
GHGpc/△HDI from 1990-2010; Table 13 is ordered by parameter (ii), the absolute
value of △HDI through the period of 1990-2010; Table 14 is ordered by parameter
(iii), the ratio of increased HDI values from 1990-2010 compared to the HDI value
in 1990; Table 15 is ordered by parameter (iv), the absolute value of △GHGpc
through the period of 1990-2010; and Table 16 is ordered by parameter (v), the ratio
of change in GHGpc values from 1990-2010 to the GHGpc value in 1990.
An additional set of three parameters, similar to those used for HDI in (i),
(ii) and (iii) above, were added that are related to GNIpc: (vi) the regression line’s
slope of △GHGpc/△GNIpc throughout the period 1990-2010, (vii) the absolute
value of △GNIpc from 1990-2010, and (viii) the ratio of increased GNIpc values
111 China, People's Republic of 22.346 0.194 0.392 4.333 1.614 9112 Mauritius 23.531 0.106 0.170 2.369 1.039 5113 Zimbabwe 23.975 -0.052 -0.123 -1.963 -0.307 6114 Austria 24.798 0.095 0.119 2.600 0.321 1115 Democratic Republic of the Congo25.035 -0.001 -0.005 -5.958 -0.539 10116 Iran, Islamic Republic of 25.855 0.201 0.372 4.999 1.152 6117 Ukraine 29.552 0.019 0.026 -9.777 -0.557 5118 Uruguay 33.890 0.093 0.134 2.802 2.542 4119 Barbados 34.722 0.063 0.083 1.734 0.159 3120 Burundi 38.499 0.077 0.282 3.237 2.662 10121 Republic of Korea (South) 39.978 0.156 0.208 6.614 1.079 3122 Republic of Moldova 42.301 0.002 0.003 -7.139 -0.683 7123 Finland 42.848 0.089 0.111 5.475 0.544 1124 Saudi Arabia 44.341 0.123 0.189 6.370 0.516 3125 Australia 50.171 0.055 0.062 1.249 0.049 2126 Canada 143.850 0.043 0.050 3.287 0.153 2127 Malaysia 195.330 0.128 0.201 21.982 -3.226 4128 Qatar 199.190 0.084 0.114 9.410 0.280 2129 Trinidad and Tobago 267.170 0.073 0.107 19.256 1.249 3130 Kuwait 356.630 0.073 0.103 25.656 0.667 2

50
from 1990-2010 to the GNIpc value in 1990. This choice was made because GNIpc
is one of three components that build HDI, along with education and health
parameters. Therefore, if a country has a totally different ranking when evaluated
by HDI as compared to when it is evaluated by GNIpc, we can conclude that the
country’s improved HDI was influenced by education and/or health, and not
primarily by economic development. Table 17 to Table 19 (also in Appendix 5)
show the results of the GNIpc parameters (vi), (vii) and (viii).
Table 20 shows the results of the parameter rankings of the middle- and
low-income Asian countries, summarizing Table 12 to Table 19. As can be seen
here, the rankings of many countries in parameters (i), (ii) and (iii) are significantly
different from the rankings in parameters (vi), (vii) and (viii). For example, the
ranking of Bangladesh in parameter (ii) was 13th. Its ranking in parameter (iii) was
10th in the world, while its ranking in parameter (vii) was 105th, and its ranking in
parameter (viii) was 56th in the world. This means that during the period under study,
Bangladesh’s GNI did not improve markedly, but its residents’ lives became
significantly better because of improvements in other factors such as education and
health. Therefore, it is necessary to evaluate countries’ development by considering
not only economic aspects, but also other factors (education and health) that enrich

51
people’s lives.
Table 20. Parameter Orders of Developing Countries in Asia
4.4. Identifying Successful Countries: Trajectories of Asian Countries
From this section onward, this dissertation focuses on discussions about
and comparisons of Asian countries, as most of the developing countries that have
achieved “successful development” are either in Asia or Africa. Much more data
are available for the Asian countries from 1990 through 2010 than for the African
countries.
The trajectories of the Asian countries are shown in Figure 38 and Figure
39. In Figure 39, for convenience in comparison, all of the trajectories were set to
start from 0 as shown in the X- and Y-axes.
Parameter (i) Parameter (ii) Parameter (iii) Parameter (iv) Parameter (v) Parameter (vi) Parameter (vii) Parameter (viii)
Afghanistan 10 71 28 7 73 44 120 120 114Bangladesh 10 75 13 10 85 98 110 105 56China, People's Republic of 9 111 2 14 122 126 124 59 1India 9 87 19 20 95 117 118 94 29Indonesia 8 102 17 25 115 110 122 74 12Kyrgyzstan 8 108 123 123 7 2 28 115 117Lao People's Democratic Republic 10 59 10 9 60 65 45 97 9Malaysia 4 127 24 41 129 1 128 48 39Mongolia 8 26 64 52 27 57 19 88 38Myanmar 10 44 4 4 47 40 17 98 3Nepal 10 41 31 18 49 12 7 108 51Pakistan 9 78 22 19 90 102 115 103 75Philippines 7 81 104 84 89 104 84 79 40Republic of Korea (South) 3 121 9 39 126 123 104 27 37Sri Lanka 9 77 65 57 84 86 79 83 7Tajikistan 8 96 128 127 44 8 108 104 97Thailand 6 101 33 40 111 119 116 65 43Vietnam 10 99 6 13 116 130 126 93 2
GNIpcvsGHGpc SLOPE of trendline
GNIpc
absolute value of increase (decrease)
ratio of increase
(decrease)
COUNTRY Original Group
HDIvsGHGpc SLOPE of trendline
HDI GHGpc
absolute value of increase (decrease)
ratio of increase
(decrease)
absolute value of increase (decrease)
ratio of increase
(decrease)

52
Figure 38. Trajectories of Asian Countries.
Figure 39. Relative Trajectories of Asian Countries (starting from 1990 as zero).
Vietnam
(PRC)
GH
Gpc
, 199
0 to
201
0 (in
clud
es la
nd u
se ch
ange
)
Human Development Index, 1990 to 2010
(PRC)
Vietnam
GH
Gpc
, 199
0 to
201
0 (in
clud
es la
nd u
se ch
ange
)
Human Development Index, 1990 to 2010
(tons
per
yea
r, CO
2 eq
uiva
lent
) (to
ns p
er y
ear,
CO2
equi
vale
nt)

53
Table 20 shows the results of the parameters’ rankings of the middle- and
low-income Asian countries found in Appendix 5 (Table 12 through Table 19).
Table 21(a) shows the evaluation of the results from Table 20.
For all of the five preliminary parameters ((i) the regression line’s slope of
△GHGpc/△HDI through the period 1990-2010, (ii) the absolute value of △HDI
from 1990-2010, (iii) the ratio of increased HDI value from 1990-2010 to the HDI
value in 1990, (iv) the absolute value of △GHGpc from 1990-2010, and (v) the
ratio of the decreased GHGpc value from 1990-2010 to the GHGpc value in 1990)
and the three secondary parameters ((vi) the regression line’s slope of △GHGpc/
△GNIpc from 1990-2010, (vii) the absolute value of △GNIpc from 1990-2010,
and (viii) the ratio of increased GNIpc value from 1990-2010 to the GNIpc value
in 1990), the top 30 successful countries are marked by ○. (The top 10 countries
are marked by ◎.) For parameter (i), the countries ranked #31 to #73 are marked
by △ because the slope of these countries was negative, which means they
decreased GHGpc and increased HDI.11 The countries ranked #74 to #130 are
11 There are a few exceptional countries that did not improve HDI between 1990 and 2010: South Africa, Zimbabwe, Swaziland and the Democratic Republic of the Congo. South Africa’s HDI gradually improved between 1990 and 1995, declined significantly up to 2005, then improved slightly in 2010 but was still lower than its 1990 levels. Zimbabwe experienced a steady decline in HDI from 1990 up to 2005, then gradually improved until 2010, but is still lower than its 2005 levels. Swaziland’s HDI declined from 1990 to 2005, then slightly improved in 2010 but is still lower than its 1990 levels. The Democratic Republic of the Congo experienced a decline in HDI from 1990 to 2000 and then gradually increased
54
marked by × because the slopes of these countries were positive, which means they
increased GHGpc and increased HDI. For parameter (ii), the countries ranked #31
to #61 are marked by △ because the absolute increase of HDI was greater than
0.1 from the top country down to #61, which means they showed comparatively
large HDI improvements among the 130 countries. The countries ranked #62 to
#130 are marked by × because they showed comparatively small HDI
improvements among the total 130 countries. For parameter (iii), the countries
ranked #31 to #51 are marked by △ because the ratio of the increased HDI value
was greater than 15% from the top country down to #51 meaning that they showed
comparatively large HDI improvements among the total 130 countries. The
countries ranked #52 to #130 are marked by × because the ratio of the increased
HDI value was less than 15%, which means they showed comparatively small HDI
improvements among the total 130 countries. For parameter (iv), the countries
ranked #31 to #80 are marked by △ because the slope from the top country to
country #80 was negative, which means these countries did a very good job of
reducing GHGpc. The countries ranked #81 to #130 are marked by × because they
increased GHGpc during that period. For parameter (v), the countries ranked #31
from 2000 to 2010, but its HDI is still lower than its 1990 levels.

55
to #78 are marked by △ because the slope from the top country to country #80
was negative, which means these countries showed comparatively large GHGpc
improvements among the total 130 countries. For parameter (vi), the countries
ranked #31 to #67 are marked by △ because the slope of these countries was
negative from the top country down to #67, which means they decreased GHGpc
and increased GNIpc. The countries ranked #68 to #130 are marked by × because
the slopes of these countries were positive, which means they increased GHGpc
and increased GNIpc. For parameter (vii), the countries ranked #31 to #93 are
marked by △ because the absolute increase in GNIpc was greater than $1000
from the top country down to #93, which means they showed comparatively large
GNIpc improvements among the total 130 countries. The countries ranked #94 to
#130 are marked by × because they showed comparatively small GNIpc
improvements among the total 130 countries. For parameter (viii), the countries
ranked #31 to #62 are marked by △ because the ratio of increased GNIpc value
was greater than 60% from the top country down to #62, which means they showed
comparatively large GNIpc improvements among the total 130 countries. The
countries ranked #63 to #130 are marked by × because the ratio of increased GNIpc
value was less than 60%, which means they showed comparatively small GNIpc
56
improvements among the total 130 countries.
Since it was very difficult to understand the data shown by the original
rakings, this evaluation classified the original rankings into 4 groups to more readily
compare performances of each country. However, in this case, it is unclear whether
these evaluations are entirely appropriate. While some evaluations are based on
observable facts (whether the slope is positive or negative, such as in parameters
(i) and (vi), and increases or decreases, such as in parameters (iv) and (v) and thus
can be deemed objective and fair, it seems arbitrary to set thresholds of 0.1 for
parameter (ii), 15% for parameter (iii), $1000 for parameter (vii), and 60% for
parameter (viii). In this way, for example, Afghanistan can be evaluated both as a
successful HDI country (improving very well) and as unsuccessful GNIpc country
(not improving well), which means the increased HDI in Afghanistan can be
attributed to the other two HDI social parameters, health and education. However,
when the countries marked × under parameters (ii) and (iii) are counted, they
number only 5, while 9 countries are marked × under parameter (vii) and 4 countries
are marked × under parameter (viii). In these circumstances, the status of
Afghanistan is unclear.
Because of this concern, a revised evaluation table is shown as the table
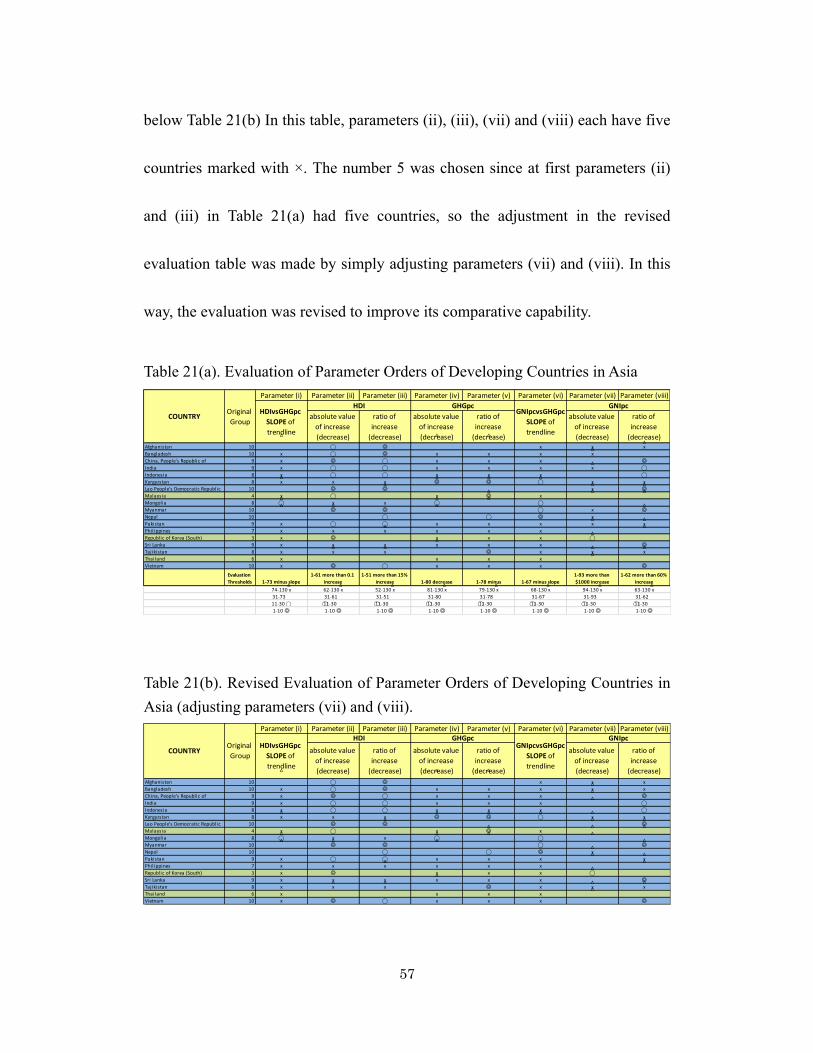
57
below Table 21(b) In this table, parameters (ii), (iii), (vii) and (viii) each have five
countries marked with ×. The number 5 was chosen since at first parameters (ii)
and (iii) in Table 21(a) had five countries, so the adjustment in the revised
evaluation table was made by simply adjusting parameters (vii) and (viii). In this
way, the evaluation was revised to improve its comparative capability.
Table 21(a). Evaluation of Parameter Orders of Developing Countries in Asia
Table 21(b). Revised Evaluation of Parameter Orders of Developing Countries in Asia (adjusting parameters (vii) and (viii).
Parameter (i) Parameter (ii) Parameter (iii) Parameter (iv) Parameter (v) Parameter (vi) Parameter (vii) Parameter (viii)
Afghanistan 10
△
⃝ ◎
△ △
x x xBangladesh 10 x ⃝ ◎ x x x x
△
China, People's Republic of 9 x ◎ ⃝ x x x
△
◎
India 9 x ⃝ ⃝ x x x x ⃝Indonesia 8 x ⃝ ⃝ x x x
△
⃝Kyrgyzstan 8 x x x ◎ ◎ ⃝ x xLao People's Democratic Republic 10
△
◎ ◎
△ △ △
x ◎
Malaysia 4 x ⃝
△
x ◎ x
△ △
Mongolia 8 ⃝ x x ⃝
△
⃝
△ △
Myanmar 10
△
◎ ◎
△ △
⃝ x ◎
Nepal 10
△ △
⃝
△
⃝ ◎ x
△
Pakistan 9 x ⃝ ⃝ x x x x xPhilippines 7 x x x x x x
△ △
Republic of Korea (South) 3 x ◎
△
x x x ⃝
△
Sri Lanka 9 x x x x x x
△
◎
Tajikistan 8 x x x
△
◎ x x xThailand 6 x
△ △
x x x
△ △
Vietnam 10 x ◎ ⃝ x x x
△
◎
Evaluation Thresholds 1-73 minus slope
1-61 more than 0.1 increase
1-51 more than 15% increase 1-80 decrease 1-78 minus 1-67 minus slope
1-93 more than $1000 increase
1-62 more than 60% increase
74-130 x 62-130 x 52-130 x 81-130 x 79-130 x 68-130 x 94-130 x 63-130 x31-73
△
31-61
△
31-51
△
31-80
△
31-78
△
31-67
△
31-93
△
31-62
△
11-30 ⃝ 11-30 ⃝ 11-30 ⃝ 11-30 ⃝ 11-30 ⃝ 11-30 ⃝ 11-30 ⃝ 11-30 ⃝1-10 ◎ 1-10 ◎ 1-10 ◎ 1-10 ◎ 1-10 ◎ 1-10 ◎ 1-10 ◎ 1-10 ◎
GNIpcvsGHGpc SLOPE of trendline
GNIpcabsolute value
of increase (decrease)
ratio of increase
(decrease)
absolute value of increase (decrease)
ratio of increase
(decrease)
absolute value of increase (decrease)
ratio of increase
(decrease)
COUNTRY Original Group
HDIvsGHGpc SLOPE of trendline
HDI GHGpc
Parameter (i) Parameter (ii) Parameter (iii) Parameter (iv) Parameter (v) Parameter (vi) Parameter (vii) Parameter (viii)
Afghanistan 10
△
⃝ ◎
△ △
x x xBangladesh 10 x ⃝ ◎ x x x x xChina, People's Republic of 9 x ◎ ⃝ x x x
△
◎
India 9 x ⃝ ⃝ x x x
△
⃝Indonesia 8 x ⃝ ⃝ x x x
△
⃝Kyrgyzstan 8 x x x ◎ ◎ ⃝ x xLao People's Democratic Republic 10
△
◎ ◎
△ △ △ △
◎
Malaysia 4 x ⃝
△
x ◎ x
△ △
Mongolia 8 ⃝ x x ⃝
△
⃝
△ △
Myanmar 10
△
◎ ◎
△ △
⃝
△
◎
Nepal 10
△ △
⃝
△
⃝ ◎ x
△
Pakistan 9 x ⃝ ⃝ x x x
△
xPhilippines 7 x x x x x x
△ △
Republic of Korea (South) 3 x ◎
△
x x x ⃝
△
Sri Lanka 9 x x x x x x
△
◎
Tajikistan 8 x x x
△
◎ x x xThailand 6 x
△ △
x x x
△ △
Vietnam 10 x ◎ ⃝ x x x
△
◎
COUNTRYOriginal Group
HDIvsGHGpc SLOPE of trendline
absolute value of increase (decrease)
ratio of increase
(decrease)
HDI GHGpcGNIpcvsGHGpc
SLOPE of trendline
GNIpcabsolute value
of increase (decrease)
ratio of increase
(decrease)
absolute value of increase (decrease)
ratio of increase
(decrease)
58
4.5. Trajectories of Asian Countries During the Period
Following these revised evaluations in Table 21(b), the countries in the
table were compared and observations were recorded.
Afghanistan: This country was in the poorest group. The country did not
show successful performances in parameters (i) or (vi), and it performed worse than
others in parameters (vii) and (viii). It showed better performances in parameters
(ii) and (iii), particularly in the parameter (iii). The country reduced its GHGpc, as
shown in parameters (iv) and (v). The regression line’s slope (i) was negative and
GHGpc went down, but HDI went up, indicating an inconsistency. In actuality,
during this period, GHGpc showed neither a significant increase nor a significant
decrease after the period 1990 to 1994.
These observations imply that Afghanistan improved its development
level significantly during this period, but the improvement was caused not by
economic development, but by social factors.
Bangladesh: This country was in the poorest group. The country did not
show successful performances in parameters (i), (vi), (vii), or (viii). It performed
better than others in parameters (ii) and (iii), particularly in parameter (iii). The
country increased its GHGpc, as shown in parameters (iv) and (v).

59
These observations imply that Bangladesh, like Afghanistan, improved its
development level significantly during the period, but mainly through
improvements in social aspects. During the period under study, GHGpc did not
show an improvement.
China (PRC): This country was in the second-poorest group. It did not
show successful performances in parameters (i) and (vi). It performed better than
others in parameter (vii) and especially in parameter (viii). It also performed better
than others in parameters (ii) and (iii), particularly in parameter (ii). The country
increased its GHGpc, as shown in parameters (iv) and (v).
These observations imply that China (PRC) improved its development
level significantly during this period, and that economic development was a strong
force behind this improvement. During this period, GHGpc did not show
improvement. In this regard, the observations indicate that the country followed the
traditional model that is explained by EKC logic (developing countries sacrifice the
environment while they seek economic development).
India: This country was in the second-poorest group. The evaluations of
its parameters are very similar to those of China (PRC) (worse than China (PRC)
in parameters (ii) and (viii); the other parameters show same results as those of

60
China (PRC)). Therefore, the observations indicate that India also followed the
traditional EKC model.
Indonesia: This country was in the third-poorest group. The country did
not show successful performances in parameters (i) and (vi). It also performed
better than others in parameters (ii), (iii), (vii) and (viii). Indonesia decreased its
GHGpc, as shown in parameters (iv) and (v).
These observations imply that Indonesia improved its development level
during this period, including its economic development. During this period, GHGpc
did not show an improvement.
Kyrgyzstan: This country came from the third-poorest group. It did not
show a successful performance in parameters (i), (ii), (iii), (v), (vii) or (viii), while
it reduced its GHGpc, as shown in parameters (iv).
This observation implies that Kyrgyzstan experienced a setback in
development during this period, with weakened economic activity. This decline in
economic activity may explain its reduced GHGpc.
Lao People's Democratic Republic (PDR): This country was in the poorest
group. The evaluations of the parameters are very similar to those of Indonesia
(most of the parameters were better than Indonesia’s). Therefore, this implies that
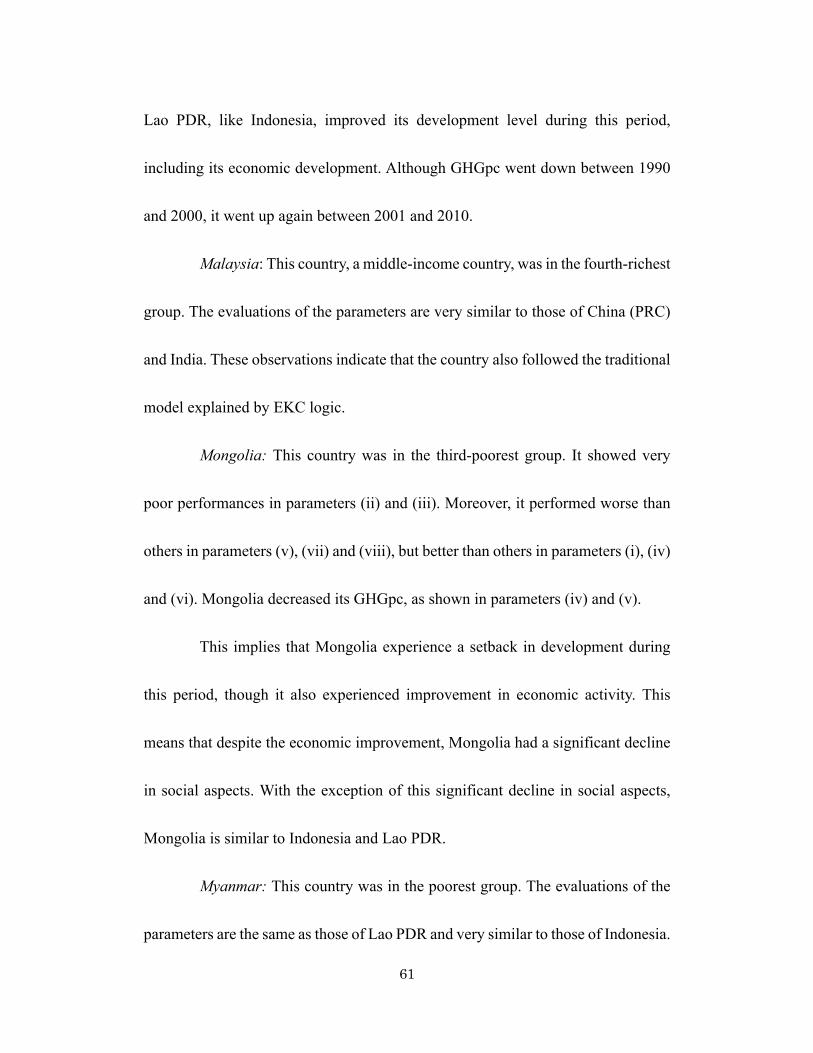
61
Lao PDR, like Indonesia, improved its development level during this period,
including its economic development. Although GHGpc went down between 1990
and 2000, it went up again between 2001 and 2010.
Malaysia: This country, a middle-income country, was in the fourth-richest
group. The evaluations of the parameters are very similar to those of China (PRC)
and India. These observations indicate that the country also followed the traditional
model explained by EKC logic.
Mongolia: This country was in the third-poorest group. It showed very
poor performances in parameters (ii) and (iii). Moreover, it performed worse than
others in parameters (v), (vii) and (viii), but better than others in parameters (i), (iv)
and (vi). Mongolia decreased its GHGpc, as shown in parameters (iv) and (v).
This implies that Mongolia experience a setback in development during
this period, though it also experienced improvement in economic activity. This
means that despite the economic improvement, Mongolia had a significant decline
in social aspects. With the exception of this significant decline in social aspects,
Mongolia is similar to Indonesia and Lao PDR.
Myanmar: This country was in the poorest group. The evaluations of the
parameters are the same as those of Lao PDR and very similar to those of Indonesia.

62
This implies that Myanmar, like Indonesia and Lao PDR, improved its development
level, including its economic development. During this period, GHGpc also showed
an improvement.
Nepal: This country was in the poorest group. The evaluations of the
parameters are very similar to those of Indonesia, Lao PDR and Myanmar. (Nepal
showed comparative weakness in its economic development in parameter (vii).)
This implies that Nepal, similar to Indonesia, Lao PDR and Myanmar, improved its
development level during this period. During this period, GHGpc also showed an
improvement.
Pakistan: The country was in the second-poorest group. The evaluations
of the parameters are very similar to those of China (PRC), India, and Malaysia.
The observations indicate that the country also followed the traditional model
explained by EKC logic.
Philippines: This country was in the fourth-poorest group. It did not show
a successful performance in parameter (i), (ii), (iii), (iv), (v) or (vi). It performed
better than others in parameters (vii) and (viii).
This implies that the country did not improve its development level during
this period, even though a certain level of economic development occurred. This

63
indicates that the country experienced a decline in social aspects. During the period,
GHGpc did not show an improvement, which may be caused by the increased
economic development activities. The observation indicates that the country
followed the traditional model explained by EKC logic.
Republic of Korea (South): This country, a middle-income country, was in
the third-richest group. The evaluations on the parameters are very similar to those
of China (PRC), India, and Malaysia. The observation indicates that the country
also followed the traditional model explained by EKC logic.
Sri Lanka: This country was in the second-poorest group. The evaluations
of the parameters are very similar to those of the Philippines. The observation
indicates that the country also followed the traditional model explained by EKC
logic.
Tajikistan: This country was in the third-poorest group. The evaluations of
the parameters are very similar to those of Kyrgyzstan. The country showed poor
performances in parameters (i), (ii), (iii), (vi), (vii) and (viii), while it reduced its
GHGpc, as shown in parameters (iv) and (v).
This implies that the country experienced a setback in its development
during this period, including weakened economic activity. This may account for its

64
reduced GHGpc.
Thailand: This country, a middle-income country, was in the sixth-richest
group (fifth-poorest group). The evaluations on the parameters are very similar to
those of China (PRC), India, and Malaysia. The observation indicates that this
country also followed the traditional model explained by EKC logic.
Vietnam: This country was in the poorest group. The evaluation of the
parameters is very similar to those of China (PRC), India, Malaysia, and the
Republic of Korea (South). This observation indicates that this country also
followed the traditional model explained by EKC logic.
Based on these observations, these Asian countries can be divided into 6
groups. Bangladesh and Thailand are similar and thus are in the same group.
(i) Group A (Afghanistan): This country improved HDI not through
income improvement while decreasing emissions.
(ii) Group B (Bangladesh): This country improved HDI not through
income improvement while increasing emissions.
(iii) Group C (China (PRC), India, Malaysia, Pakistan, Republic of Korea
(South), Thailand, Vietnam): These countries follow the traditional model of
development explained by EKC logic: countries sacrifice the environment while

65
they seek economic development.
(iv) Group D (Indonesia, Lao PDR, Myanmar, Nepal): These countries did
not follow the traditional model, because they simultaneously improved both the
environment parameters and the development parameters.
(v) Group E (Kyrgyzstan, Tajikistan): These countries experienced a
setback in development during this period, with weakened economic activity that
may have related to reduced GHGpc.
(vi) Group F (Mongolia): This country experienced a setback in the
development during this period characterized by improvements in economic
activity and a significant decline in social aspects. It also reduced its GHGpc. If the
country did not have a significant decline in social aspects, it would belong in
Group C.
(vii) Group G (the Philippines, Sri Lanka): These countries did not
improve their development level during this period, even though a certain level of
economic development occurred. During this period, GHGpc did not show an
improvement. These observations indicate that the countries followed the
traditional model explained by EKC logic.
This grouping shows that some of the countries such as the ones in the

66
Group C and D had similar trajectories with other countries in the same group,
while some countries in other groups (Group A, B, E, F, and G) had different
specific trajectories. Observing multiple parameters allowed for various ways of
evaluating success. However, as mentioned at the beginning of this chapter, a
question still remains. Even if the slope is very steep (meaning that the country
efficiently reduced GHGpc while increasing HDI), if the absolute value of the
increase in HDI is very small, we do not know whether the country did a better job
than another country that significantly increased HDI with a mildly negative slope
or even with a positive slope. Consequently, the next section compares the success
of these Asian countries’ development.
4.6. Defining Success Among Asian Countries
Table 21(b) shows the success of each Asian country by global parameters.
However, when the parameters of these Asian countries are evaluated against those
of other countries across the world, it is still difficult to compare them. For example,
considering parameters (i) and (vi), 13 of the 18 Asian countries are categorized as
unsuccessful countries. Using parameter (v), 12 of the 18 Asian countries are
categorized as unsuccessful countries. Few differences are found among the

67
countries categorized in the same group. Therefore, an attempt is made here to
classify Asian countries by analyzing the parameters in detail.
Evaluation of parameter (i): slope of the HDI vs. GHGpc trend line:
Figure 40 visualizes the values of parameter (i) (slope of the HDI vs. GHGpc trend
line). When the graph is enlarged, it becomes as shown in Figure 41. There are
four groups, as shown in Figure 42. Figures 40-42 are in Appendix 6. The group in
green is defined as ◎VERY SUCCESSFUL; the group in blue is defined as ○
SUCCESSFUL; the group in yellow is defined as △MARGINAL; and the group
in red is defined as ×UNSUCCESSFUL. This is summarized in Table 22. In this
way, those evaluations for Asian countries had been revised, and now they are
distinguishable. (Only the evaluations for Malaysia and Republic of Korea stayed
as they were).
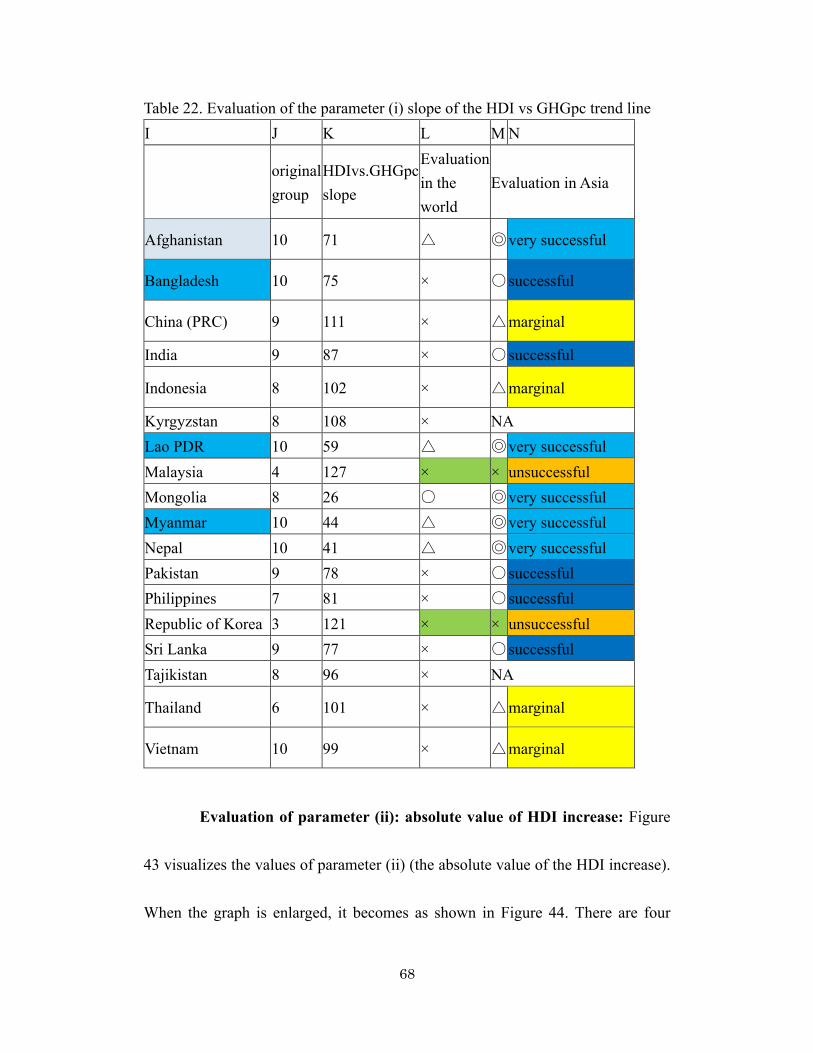
68
Table 22. Evaluation of the parameter (i) slope of the HDI vs GHGpc trend line I J K L M N
original group
HDIvs.GHGpc slope
Evaluation in the world
Evaluation in Asia
Afghanistan 10 71 △ ◎ very successful
Bangladesh 10 75 × ○ successful
China (PRC) 9 111 × △ marginal
India 9 87 × ○ successful
Indonesia 8 102 × △ marginal
Kyrgyzstan 8 108 × NA Lao PDR 10 59 △ ◎ very successful Malaysia 4 127 × × unsuccessful Mongolia 8 26 ○ ◎ very successful Myanmar 10 44 △ ◎ very successful Nepal 10 41 △ ◎ very successful Pakistan 9 78 × ○ successful Philippines 7 81 × ○ successful Republic of Korea 3 121 × × unsuccessful Sri Lanka 9 77 × ○ successful Tajikistan 8 96 × NA
Thailand 6 101 × △ marginal
Vietnam 10 99 × △ marginal
Evaluation of parameter (ii): absolute value of HDI increase: Figure
43 visualizes the values of parameter (ii) (the absolute value of the HDI increase).
When the graph is enlarged, it becomes as shown in Figure 44. There are four
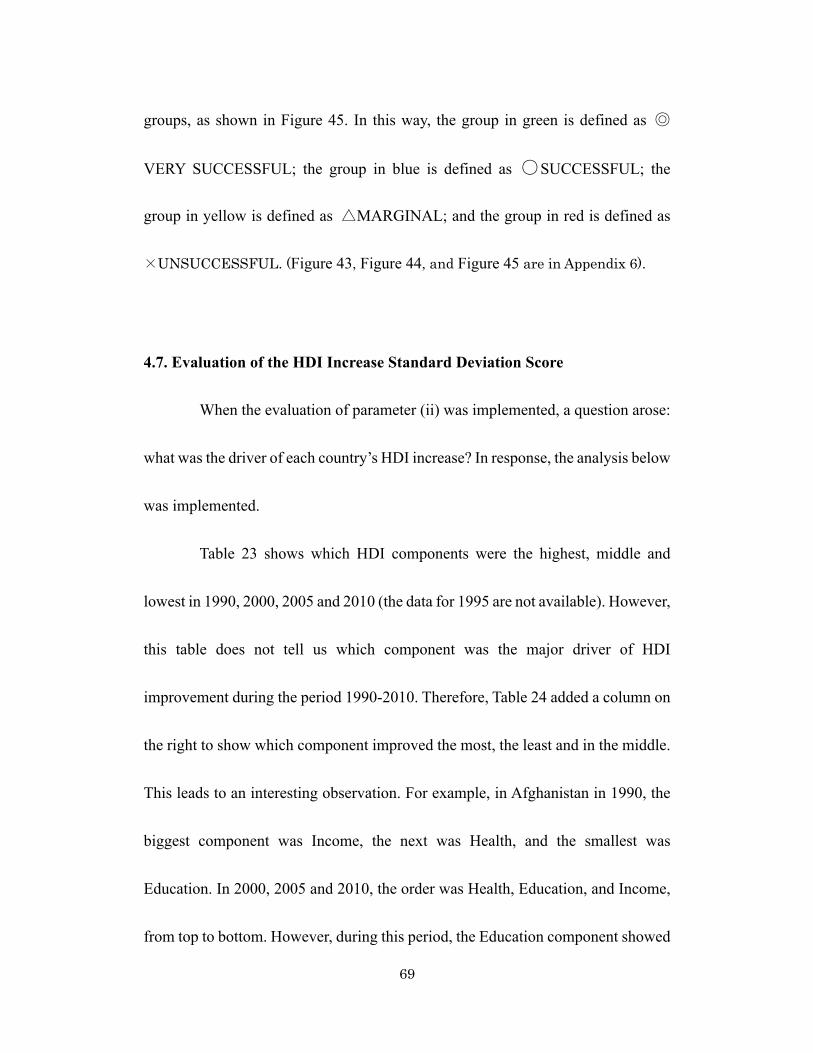
69
groups, as shown in Figure 45. In this way, the group in green is defined as ◎
VERY SUCCESSFUL; the group in blue is defined as ○SUCCESSFUL; the
group in yellow is defined as △MARGINAL; and the group in red is defined as
×UNSUCCESSFUL. (Figure 43, Figure 44, and Figure 45 are in Appendix 6).
4.7. Evaluation of the HDI Increase Standard Deviation Score
When the evaluation of parameter (ii) was implemented, a question arose:
what was the driver of each country’s HDI increase? In response, the analysis below
was implemented.
Table 23 shows which HDI components were the highest, middle and
lowest in 1990, 2000, 2005 and 2010 (the data for 1995 are not available). However,
this table does not tell us which component was the major driver of HDI
improvement during the period 1990-2010. Therefore, Table 24 added a column on
the right to show which component improved the most, the least and in the middle.
This leads to an interesting observation. For example, in Afghanistan in 1990, the
biggest component was Income, the next was Health, and the smallest was
Education. In 2000, 2005 and 2010, the order was Health, Education, and Income,
from top to bottom. However, during this period, the Education component showed

70
the biggest increase, while the Income component showed the smallest increase.
This means that that Afghanistan’s HDI improvement was driven by Education.
However, here another question emerges. Thirteen Asian countries out of 18 had
Education at the top. Does this mean that Education was the major component of
HDI improvement in Asia? To answer this question, other countries in the world
were checked in the same way (the color green on the right-hand column shows
countries that had Education at the top).
Table 24. Orders of HDI component improvement for each Asian country
Index Value Order Order of
Improvement 1990 2000 2005 2010 1990-2010
ASIAN
COUNTRIES
Afghanistan 1 Income Health Health Health Education
2 Health Income Education Education Health
3 Education Education Income Income Income
Bangladesh 1 Health Health Health Health Education
2 Income Education Education Education Health
3 Education Income Income Income Income
China (PRC) 1 Health Health Health Health Income
2 Education Income Income Education Education
3 Income Education Education Income Health
India 1 Health Health Health Health Education
2 Income Income Education Education Income
3 Education Education Income Income Health
Indonesia 1 Health Health Health Health Education
2 Education Income Income Education Health
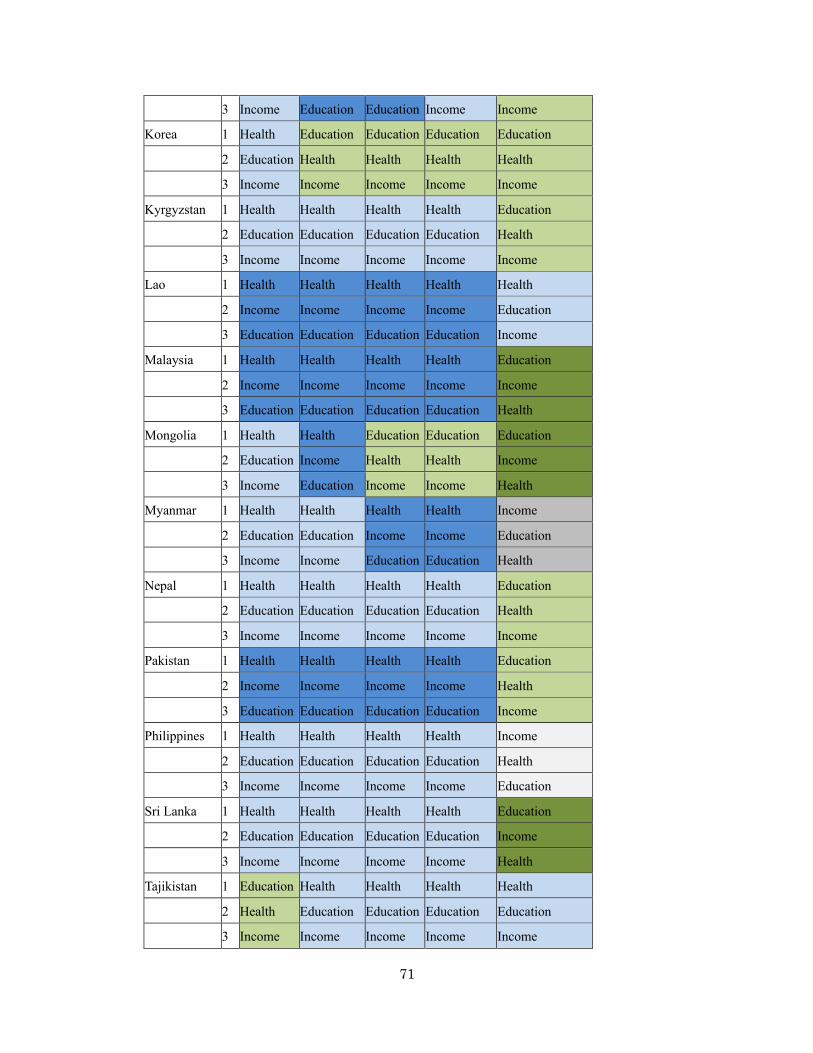
71
3 Income Education Education Income Income
Korea 1 Health Education Education Education Education
2 Education Health Health Health Health
3 Income Income Income Income Income
Kyrgyzstan 1 Health Health Health Health Education
2 Education Education Education Education Health
3 Income Income Income Income Income
Lao 1 Health Health Health Health Health
2 Income Income Income Income Education
3 Education Education Education Education Income
Malaysia 1 Health Health Health Health Education
2 Income Income Income Income Income
3 Education Education Education Education Health
Mongolia 1 Health Health Education Education Education
2 Education Income Health Health Income
3 Income Education Income Income Health
Myanmar 1 Health Health Health Health Income
2 Education Education Income Income Education
3 Income Income Education Education Health
Nepal 1 Health Health Health Health Education
2 Education Education Education Education Health
3 Income Income Income Income Income
Pakistan 1 Health Health Health Health Education
2 Income Income Income Income Health
3 Education Education Education Education Income
Philippines 1 Health Health Health Health Income
2 Education Education Education Education Health
3 Income Income Income Income Education
Sri Lanka 1 Health Health Health Health Education
2 Education Education Education Education Income
3 Income Income Income Income Health
Tajikistan 1 Education Health Health Health Health
2 Health Education Education Education Education
3 Income Income Income Income Income

72
Thailand 1 Health Health Health Health Education
2 Income Income Income Education Income
3 Education Education Education Income Health
Vietnam 1 Health Health Health Health Education
2 Education Education Education Education Income
3 Income Income Income Income Health
Table 25, Table 26, Table 27, and Table 28 in Appendix 7 show the results
for African countries, OECD countries, Latin American countries, and other
countries, respectively. These results show that regardless of area and wealth, the
majority of countries have Education at the top (deep and pale green). The summary
is shown in Table 29. This may be caused by one of two reasons: (1) during this
period, all over the world, Education was the real driver of HDI improvement, or
(2) the current HDI emphasizes the impact of Education too much. However, there
is no tool that can prove that either (1) or (2) is the case. Moreover, it is beyond the
scope of this dissertation to examine whether the current calculation of HDI is too
biased toward the Education component.
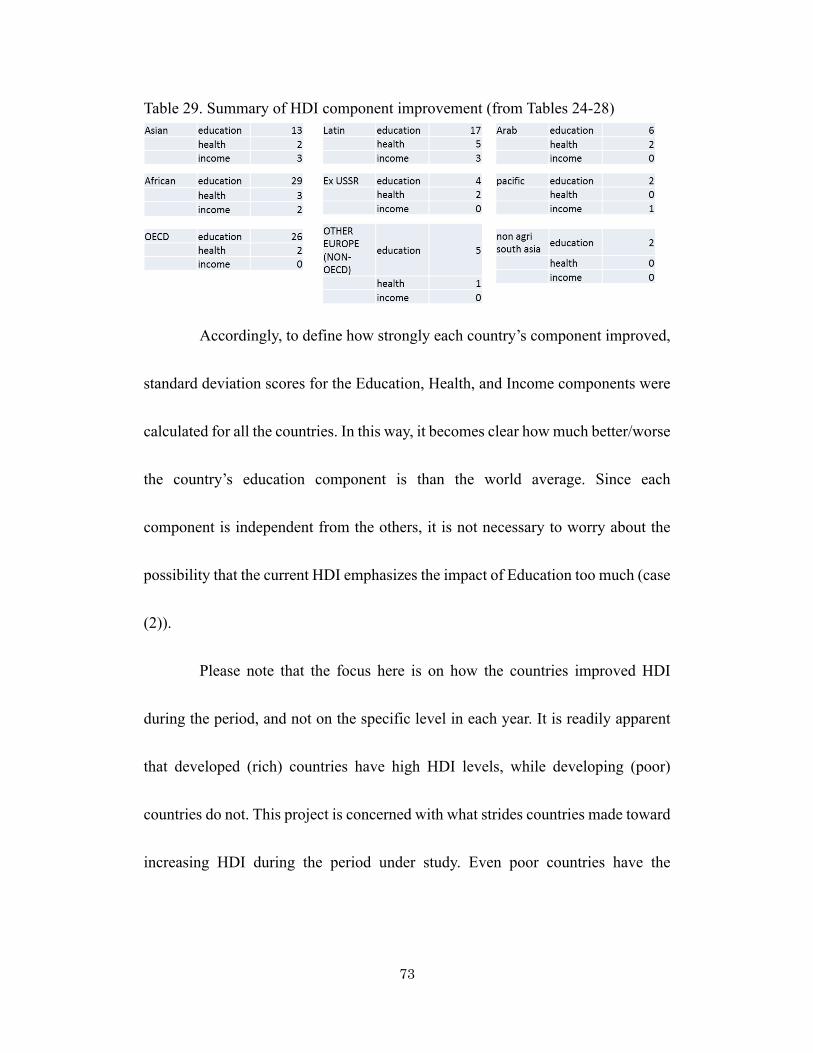
73
Table 29. Summary of HDI component improvement (from Tables 24-28)
Accordingly, to define how strongly each country’s component improved,
standard deviation scores for the Education, Health, and Income components were
calculated for all the countries. In this way, it becomes clear how much better/worse
the country’s education component is than the world average. Since each
component is independent from the others, it is not necessary to worry about the
possibility that the current HDI emphasizes the impact of Education too much (case
(2)).
Please note that the focus here is on how the countries improved HDI
during the period, and not on the specific level in each year. It is readily apparent
that developed (rich) countries have high HDI levels, while developing (poor)
countries do not. This project is concerned with what strides countries made toward
increasing HDI during the period under study. Even poor countries have the

74
potential to make significant improvements. The standard deviation score is defined
as follows:
𝑆𝑡𝑎𝑛𝑑𝑎𝑟𝑑𝑑𝑒𝑣𝑖𝑎𝑡𝑖𝑜𝑛𝑠𝑐𝑜𝑟𝑒𝑜𝑓𝑡ℎ𝑒𝐸𝑑𝑢𝑐𝑎𝑡𝑖𝑜𝑛𝑐𝑜𝑚𝑝𝑜𝑛𝑒𝑛𝑡𝑖𝑛𝑐𝑟𝑒𝑎𝑠𝑒𝑓𝑜𝑟𝑒𝑎𝑐ℎ𝑐𝑜𝑢𝑛𝑡𝑦
= =(𝐸𝑑𝑢𝑐𝑎𝑡𝑖𝑜𝑛𝑐𝑜𝑚𝑝𝑜𝑛𝑒𝑛𝑡𝑖𝑛𝑐𝑟𝑒𝑎𝑠𝑒𝑜𝑓𝑡ℎ𝑒𝑐𝑜𝑢𝑛𝑡𝑟𝑦 − 𝑎𝑣𝑒𝑟𝑎𝑔𝑒𝑜𝑓𝐸𝑑𝑢𝑐𝑎𝑡𝑖𝑜𝑛𝑐𝑜𝑚𝑝𝑜𝑛𝑒𝑛𝑡𝑖𝑛𝑐𝑟𝑒𝑎𝑠𝑒)
𝑠𝑡𝑎𝑛𝑑𝑎𝑟𝑑𝑣𝑎𝑟𝑖𝑎𝑡𝑖𝑜𝑛𝑜𝑓𝐸𝑑𝑢𝑐𝑎𝑡𝑖𝑜𝑛𝑐𝑜𝑚𝑝𝑜𝑛𝑒𝑛𝑡𝑖𝑛𝑐𝑟𝑒𝑎𝑠𝑒B ∗
(Equation 1)
World average of Education component increase = 0.152 World average of Health component increase = 0.069 World average of Income component increase = 0.052 Standard variation of Education component increase in the world = 0.087 Standard variation of Health component increase in the world = 0.065 Standard variation of Income component increase in the world = 0.058
Thus, for example, (standard deviation score of Education component increase for
Afghanistan) = ((0.356-0.152)/0.087)*10+50 = 73.44.
After calculating all of the standard deviation scores, the order of the
components for each country in Asia, Africa, OECD, Latin America, and other
areas was revised as shown in Table 30, Table 31, Table 32, Table 33, and Table 34,
respectively (Appendix 8).
While the original bare HDI had education as the driver of improvement
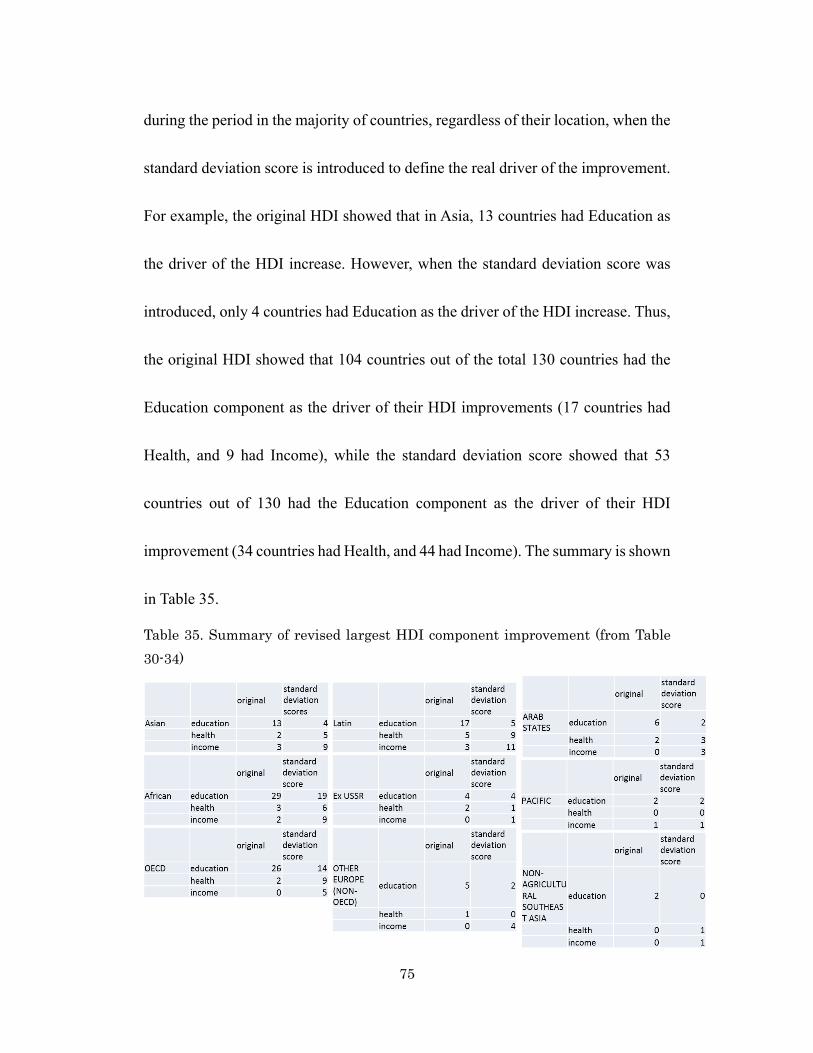
75
during the period in the majority of countries, regardless of their location, when the
standard deviation score is introduced to define the real driver of the improvement.
For example, the original HDI showed that in Asia, 13 countries had Education as
the driver of the HDI increase. However, when the standard deviation score was
introduced, only 4 countries had Education as the driver of the HDI increase. Thus,
the original HDI showed that 104 countries out of the total 130 countries had the
Education component as the driver of their HDI improvements (17 countries had
Health, and 9 had Income), while the standard deviation score showed that 53
countries out of 130 had the Education component as the driver of their HDI
improvement (34 countries had Health, and 44 had Income). The summary is shown
in Table 35.
Table 35. Summary of revised largest HDI component improvement (from Table 30-34)

76
If we rely upon the original HDI component improvement, then Asia
appears to be driven by (1) education, then (2) income and (3) health; Latin America
appears to be driven by (1) education, then (2) health and (3) income; Africa also
appears to be driven by (1) education, (2) health and (3) income; and OECD
countries’ group appears to be driven by (1) education and (2) health.
However, when we look at the standard deviation score of HDI component
improvements, we find that Asia was strongly driven by (1) income, (2) health, then
(3) education; Latin America was driven by (1) income, (2) health, then (3)
education; Africa was driven strongly by (1) education, (2) income, then (3) health,
and OECD countries’ group was driven by (1) education, (2) health, then (3) income.
The revised order of the HDI components and the sum of the three standard
deviation scores for the Asian countries are shown in Table 36 and the sums of the
three scores of each country are visualized in Figure 46. When the graph is enlarged,
it becomes as shown in Figure 47. Four groups are identified, as shown in Figure
48. Figures 46–48 are in Appendix 9. In this way, the group in green is defined as
◎VERY SUCCESSFUL, the group in blue is defined as ○SUCCESSFUL, the
group in yellow is defined as △MARGINAL, and the group in red is defined as
×UNSUCCESSFUL.

77
Table 36. Revised order of the HDI components and the sum of the 3 components
ASIAN
COUNTRIES
1990-2010 Order
of components Values
Value-
Average
Standard
Scores
Revised
order of
components
Sum of 3
components
Afghanistan Education 0.356 0.203 73.44837 Education 169.51
Afghanistan Health 0.169 0.100 65.33259 health
Afghanistan Income -0.060 -0.112 30.73269 income
Bangladesh Education 0.217 0.064 57.41612 Health 179.81
Bangladesh Health 0.145 0.076 61.658 Income
Bangladesh Income 0.114 0.062 60.74002 Education
China (PRC) Income 0.275 0.223 88.50543 income 196.80
China (PRC) Education 0.206 0.053 56.13354 education
China (PRC) Health 0.083 0.014 52.16531 health
India Education 0.193 0.040 54.6372 Income 176.35
India Income 0.142 0.090 65.56879 Health
India Health 0.109 0.040 56.14611 Education
Indonesia Education 0.128 -0.025 47.15549 Income 160.19
Indonesia Health 0.103 0.034 55.22747 Health
Indonesia Income 0.097 0.045 57.80827 Education
Republic of Korea Education 0.178 0.025 52.92709 Income 177.17
Republic of Korea Health 0.139 0.070 60.73935 Health
Republic of Korea Income 0.130 0.078 63.49932 Education
Kyrgyzstan Education 0.028 -0.125 35.61227 health 112.32
Kyrgyzstan Health 0.011 -0.058 41.14154 education
Kyrgyzstan Income -0.032 -0.084 35.56146 income
Lao PDR Health 0.196 0.127 69.4665 Health 185.82
Lao PDR Education 0.167 0.014 51.64451 Income
Lao PDR Income 0.137 0.085 64.70651 Education
Malaysia Education 0.167 0.014 51.64451 income 159.19
Malaysia Income 0.106 0.054 59.36038 education
Malaysia Health 0.057 -0.012 48.1845 health
Mongolia Education 0.244 0.092 60.62257 Education 175.27
Mongolia Income 0.109 0.057 59.87774 income
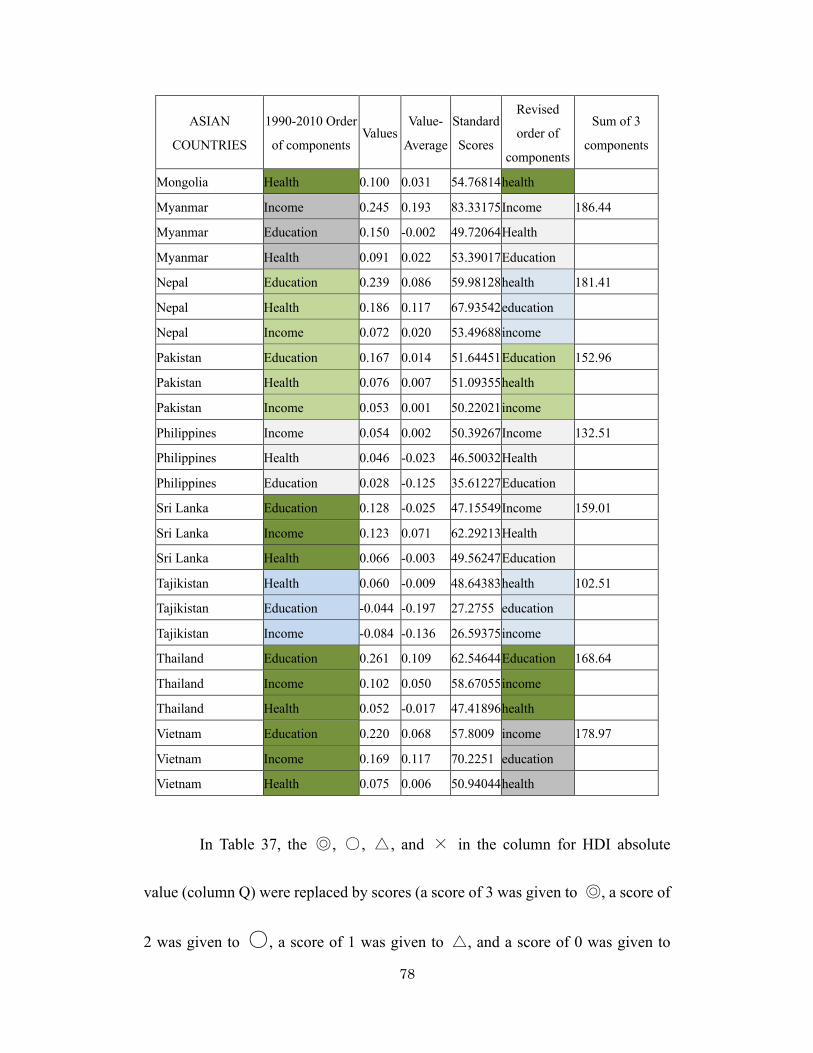
78
ASIAN
COUNTRIES
1990-2010 Order
of components Values
Value-
Average
Standard
Scores
Revised
order of
components
Sum of 3
components
Mongolia Health 0.100 0.031 54.76814 health
Myanmar Income 0.245 0.193 83.33175 Income 186.44
Myanmar Education 0.150 -0.002 49.72064 Health
Myanmar Health 0.091 0.022 53.39017 Education
Nepal Education 0.239 0.086 59.98128 health 181.41
Nepal Health 0.186 0.117 67.93542 education
Nepal Income 0.072 0.020 53.49688 income
Pakistan Education 0.167 0.014 51.64451 Education 152.96
Pakistan Health 0.076 0.007 51.09355 health
Pakistan Income 0.053 0.001 50.22021 income
Philippines Income 0.054 0.002 50.39267 Income 132.51
Philippines Health 0.046 -0.023 46.50032 Health
Philippines Education 0.028 -0.125 35.61227 Education
Sri Lanka Education 0.128 -0.025 47.15549 Income 159.01
Sri Lanka Income 0.123 0.071 62.29213 Health
Sri Lanka Health 0.066 -0.003 49.56247 Education
Tajikistan Health 0.060 -0.009 48.64383 health 102.51
Tajikistan Education -0.044 -0.197 27.2755 education
Tajikistan Income -0.084 -0.136 26.59375 income
Thailand Education 0.261 0.109 62.54644 Education 168.64
Thailand Income 0.102 0.050 58.67055 income
Thailand Health 0.052 -0.017 47.41896 health
Vietnam Education 0.220 0.068 57.8009 income 178.97
Vietnam Income 0.169 0.117 70.2251 education
Vietnam Health 0.075 0.006 50.94044 health
In Table 37, the ◎, ○, △, and × in the column for HDI absolute
value (column Q) were replaced by scores (a score of 3 was given to ◎, a score of
2 was given to ○, a score of 1 was given to △, and a score of 0 was given to

79
×). The column for HDI ratio increase (column U) was treated in the same way.
In the column showing HDI evaluation by absolute value and ratio of increase
(column V), the countries with the total score of 6 or 5 as the sum of column Q and
U were evaluated as “very successful,” those with a score of 4 or 3 were evaluated
as “successful,” those with a score of 2 or 1 were evaluated as “marginal,” and those
with a score of 0 were evaluated as “unsuccessful.” In this way, all of the groups
were balanced to contain 3 to 5 countries (4 countries were Very successful, 4
countries were Successful, 5 countries were Marginal, and 3 countries were
Unsuccessful; thus, 8 countries were in the top 2 categories of Very successful and
Successful, while the other 8 countries were in the bottom 2 categories of Marginal
and Unsuccessful). In the same way, in column W, the countries with a total score
of 6 or 5 as sum of column R and column U were evaluated as “very successful,”
those with a score of 4 or 3 were evaluated as “successful,” those with a score of 2
or 1 were evaluated as “marginal,” and those with a score of 0 were evaluated as
“unsuccessful”; the evaluations of the other 11 countries did not change. In this way,
all of the groups were balanced to contain 3 to 5 countries (3 countries were Very
successful, 5 countries were Successful, 5 countries were Marginal, and 3 countries
were Unsuccessful; thus, 8 countries were in the top 2 categories of Very successful

80
and Successful, while the other 8 countries were in the bottom 2 categories of
Marginal and Unsuccessful)
Table 37. Scoring on HDI parameters O P Q R S T U V W
HDI
absolute
value
World Asia
HDI
standard
deviation
HDI
ratio
of
incre
ase
Wo
rld Asia
HDI
evaluation
by absolute
value and
ratio of
increase
HDI
evaluation
considerin
g HDI
standard
deviation
and ratio
of
increase
Afghanistan 28 ○ △1 △1 7 ◎ ◎3 successful4 4 successful
Bangladesh 13 ○ ○2 ○2 10 ◎ ○2 successful4 4 successful
China (PRC) 2 ◎ ◎3 ◎3 14 ○ ○2 very
successful5 5
very
successful
India 19 ○ ○2 ○2 20 ○ △1 successful3 3 successful
Indonesia 17 ○ ○2 ×0 25 ○ △1 successful3 1 insufficien
t
Kyrgyzstan 123 × NA NA 123 × NA
Lao 10 ◎ ○2 ◎3 9 ◎ ○2 very
successful5 5
very
successful
Malaysia 24 ○ △1 ×0 41 △ ×0 marginal1 0 unsuccessf
ul
Mongolia 64 × ×0 ○2 52 × ×0 unsuccessf
ul0 2 marginal
Myanmar 4 ◎ ◎3 ◎3 4 ◎ ◎3 very
successful6 6
very
successful
Nepal 31 △ △1 ○2 18 ○ △1 marginal2 3 successful
Pakistan 22 ○ △1 ×0 19 ○ △1 marginal2 1 marginal
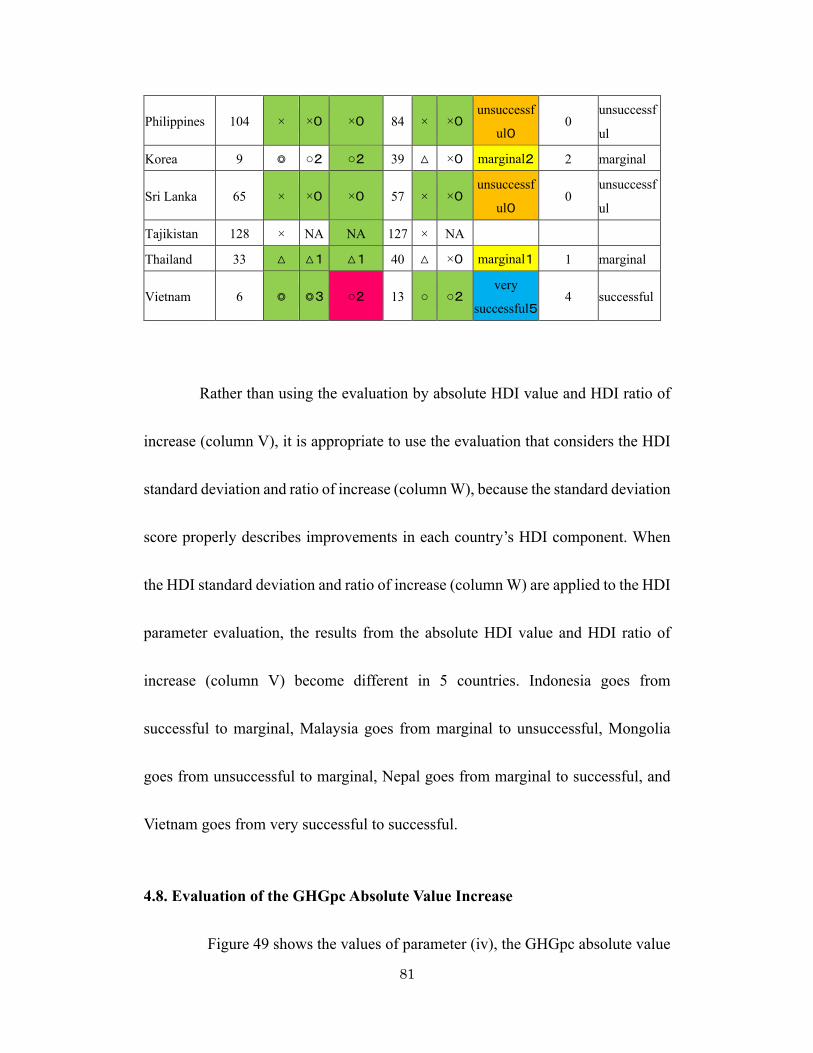
81
Philippines 104 × ×0 ×0 84 × ×0 unsuccessf
ul0 0
unsuccessf
ul
Korea 9 ◎ ○2 ○2 39 △ ×0 marginal2 2 marginal
Sri Lanka 65 × ×0 ×0 57 × ×0 unsuccessf
ul0 0
unsuccessf
ul
Tajikistan 128 × NA NA 127 × NA
Thailand 33 △ △1 △1 40 △ ×0 marginal1 1 marginal
Vietnam 6 ◎ ◎3 ○2 13 ○ ○2 very
successful5 4 successful
Rather than using the evaluation by absolute HDI value and HDI ratio of
increase (column V), it is appropriate to use the evaluation that considers the HDI
standard deviation and ratio of increase (column W), because the standard deviation
score properly describes improvements in each country’s HDI component. When
the HDI standard deviation and ratio of increase (column W) are applied to the HDI
parameter evaluation, the results from the absolute HDI value and HDI ratio of
increase (column V) become different in 5 countries. Indonesia goes from
successful to marginal, Malaysia goes from marginal to unsuccessful, Mongolia
goes from unsuccessful to marginal, Nepal goes from marginal to successful, and
Vietnam goes from very successful to successful.
4.8. Evaluation of the GHGpc Absolute Value Increase
Figure 49 shows the values of parameter (iv), the GHGpc absolute value
82
increase. When the graph is enlarged, it becomes as shown in Figure 50. Four
groups are identified, as shown in Figure 51. Figures 49-51 are in Appendix 10. In
this way, the group in green is defined as ◎VERY SUCCESSFUL, the group in
blue is defined as ○SUCCESSFUL, the group in yellow is defined as △
MARGINAL, and the group in red is defined as ×UNSUCCESSFUL.
4.9. Evaluation of the Ratio of GHGpc Increase
Figure 52 shows the values of parameter (v), the ratio of GHGpc increases.
When the graph is enlarged, it becomes as shown in Figure 53. Four groups are
identified, as shown in Figure 54. In this way, the group in green is defined as ◎
VERY SUCCESSFUL, the group in blue is defined as ○SUCCESSFUL, the
group in yellow is defined as △MARGINAL, and the group in red is defined as
UNSUCCESSFUL. (Malaysia went from negative emissions to positive emissions,
so it is in the UNSUCCESSFUL group.)
4.10. Total Evaluation of GHGpc Parameters
In Table 38, as done in columns V and W, the ◎, ○, △, and × in the
column for GHGpc absolute value increases (column Z) were replaced by scores (a
score of 3 was given to ◎, a score of 2 was given to ○, a score of 1 was given to

83
△, and a score of 0 was given to ×). The column for the GHG ratio of increase
(column AC) was treated in the same way. In column AD, the countries with a total
score of 6 (no country had the total score of 5) as the sum of columns Z and AC
were evaluated as “very successful,” those with a score of 4 were evaluated as
“successful,” those with a score of 3, 2 or 1 were evaluated as “marginal,” and those
with a score of 0 were evaluated as “unsuccessful.” In this way, all of the groups
were balanced to contain 3 to 5 countries (5 countries were Very successful, 4
countries were Successful, 4 countries were Marginal, and 3 countries were
Unsuccessful; thus, 9 countries were in the top 2 categories of Very successful and
Successful, while the other 7 countries were in the bottom 2 categories of Marginal
and Unsuccessful).

84
Table 38. Total evaluation of GHGpc parameters I X Y Z AA AB AC AD
GHGpc absolute value increase
World Asia GHG ratio of increase
World Asia Total evaluation of GHGpc parameters
Afghanistan 73 △ ◎ 44 △ ◎ very successful 6
Bangladesh 85 × ○ 98 × ○ successful 4
China (PRC)
122 × × 126 × × unsuccessful 0
India 95 × ○ 117 × △ marginal 3
Indonesia 115 × △ 110 × △ marginal 2
Kyrgyzstan 7 ◎ NA 2 ◎ NA Lao PDR 60 △ ◎ 65 △ ◎ very successful 6 Malaysia 129 × × 1 ◎ × unsuccessful 0 Mongolia 27 ○ ◎ 57 △ ◎ very successful 6 Myanmar 47 △ ◎ 40 △ ◎ very successful 6 Nepal 49 △ ◎ 12 ○ ◎ very successful 6
Pakistan 90 × ○ 102 × ○ successful 4
Philippines 89 × ○ 104 × ○ successful 4
Republic of Korea
126 × × 123 × × unsuccessful 0
Sri Lanka 84 × ○ 86 × ○ successful 4
Tajikistan 44 △ NA 8 ◎ NA
Thailand 111 × △ 119 × △ marginal 2
Vietnam 116 × △ 130 × × marginal 1
85
CHAPTER 5. IDENTIFYING SUCCESSFUL COUNTRIES
The results show that the slope of the HDI vs. GHGpc trend line (Table
22) and the total evaluation of GHGpc parameters (Table 38) are very similar, since
12 countries out of 15 effective countries had the same results. Moreover, out of
these countries, only India showed the opposite tendency positive (successful) HDI
in slope while GHGpc is negative (marginal)). Therefore, considering all 3
parameters (the trend line, the total evaluation of HDI parameters, and the total
evaluation of GHGpc parameters) will exaggerate these 2 similar results (the trend
line and the total GHGpc evaluation) in the final evaluation. Thus, after confirming
that the results of the evaluation of the slope and GHGpc showed almost the same
tendency, the final evaluation is done by considering only the results of the total
HDI evaluation and the total GHGpc evaluation. These 2 scores in column W and
column AD are added to obtain the final total scores shown in Table 39. Since no
country has a total score of 7, this number becomes the threshold dividing success
from failure. However, Afghanistan and Lao PDR are excluded from the evaluation
because of a lack of information (information related to the upcoming analysis
using KAYA identity was not available for these countries). The results are shown

86
in Table 40. Myanmar, with 12 points, and Nepal, with 9 points, are recognized as
very successful countries. Myanmar was very successful because of its very
successful HDI and GHGpc. Nepal was very successful because of its very
successful GHGpc. Bangladesh and Mongolia received 8 points, and thus are
recognized as successful countries. Bangladesh was successful because of its very
successful HDI and GHGpc. Mongolia was successful because of its very
successful GHGpc. The trajectories of these 2 very successful and 2 successful
countries are shown in Figure 55. In Figure 56, for convenience of comparison, all
of the trajectories are set to start from 0 on the X-axis and the Y-axis.
Table 39. Final total scores to identify successful countries12
Countries HDI score GHG score Total
Bangladesh 4 4 8
China (PRC) 5 0 5
India 3 3 6
Indonesia 1 2 3
Malaysia 0 0 0
Mongolia 2 6 8
Myanmar 6 6 12
Nepal 3 6 9
Pakistan 1 4 5
Philippines 0 4 4
12 Afghanistan, Kyrgyzstan, Lao PDR, and Tajikistan were excluded from the table because of insufficient data for the comparison.

87
Countries HDI score GHG score Total
Republic of Korea 2 0 2
Sri Lanka 0 4 4
Thailand 1 2 3
Vietnam 4 1 5
Table 40. Identifying successful countries
Countries HDI score
HDI evaluation
GHG score
GHG evaluation
Total Remarks (Regarding DLHE groups, please refer Section 5.1)
Bangladesh 4 successful 4 successful 4 8
Successful because of both of successful HDI and GHG (DLHE (new CO2); CO2 newly rising recently)
China (PRC)
5 very successful
0 unsuccessful 0
5
Unsuccessful because of unsuccessful GHG (DLHE (dom CO2); dominated by CO2)
India 3 successful 3 marginal 3 6
Unsuccessful because of marginal GHG (DLHE (dom CO2); dominated by CO2)
Indonesia 1 marginal 2 marginal 2 3
Unsuccessful because of marginal HDI and GHG (DLHE (LUCF); dominated by LUCF)
Malaysia 0 unsuccessful 0 unsuccessful 0
0
Unsuccessful because of unsuccessful HDI and GHG (DLHE (LUCF-+); LUCF drastic increased)
Mongolia 2 marginal 6 very 8 Successful because of

88
Countries HDI score
HDI evaluation
GHG score
GHG evaluation
Total Remarks (Regarding DLHE groups, please refer Section 5.1)
successful 6 very successful GHG even though HDI was marginal (Non DLHE (LUCF); dominated by LUCF)
Myanmar 6 very successful
6 very successful 6
12
Very Successful because of very successful HDI and GHG (Non DLHE (reform); emissions dropped because of the military era)
Nepal 3 successful 6 very successful 6
9
Very Successful because of very successful GHG (Non DLHE (Agri&LUCF); dominated by agriculture and LUCF
Pakistan 1 marginal 4 successful 4 5
Unsuccessful because of marginal HDI (DLHE (dom CO2); dominated by CO2)
Philippines 0 unsuccessful 4 successful 4 4
Unsuccessful because of unsuccessful HDI (DLHE (dom CO2); dominated by CO2)
Republic of Korea
2 marginal 0 unsuccessful 0
2
Unsuccessful because of both marginal HDI and unsuccessful GHG (DLHE (dom CO2); dominated by CO2)

89
Countries HDI score
HDI evaluation
GHG score
GHG evaluation
Total Remarks (Regarding DLHE groups, please refer Section 5.1)
Sri Lanka 0 unsuccessful 4 successful 4 4
Unsuccessful because of unsuccessful HDI (DLHE (yet CO2); CO2 increased but not much)
Thailand 1 marginal 2 marginal 2 3
Unsuccessful because of both marginal HDI and EKC (DLHE (dom CO2); dominated by CO2)
Vietnam 4 successful 1 marginal 1 5
Unsuccessful because of marginal GHG (DLHE (new CO2); CO2 rising recently)

90
Figure 55. Trajectories of Very Successful and Successful Asian Countries.
Figure 56. Relative trajectories of Very Successful and Successful Asian Countries (starting from 0).
GH
Gpc
, 199
0 to
201
0 (in
clud
es la
nd u
se ch
ange
)
Human Development Index, 1990 to 2010
Human Development Index, 1990 to 2010 GH
Gpc
, 199
0 to
201
0 (in
clud
es la
nd u
se ch
ange
) (to
ns p
er y
ear,
CO2
equi
vale
nt)
(tons
per
yea
r, CO
2 eq
uiva
lent
)
91
5.1. Identifying Asian Countries in the EKC group
A version of the “development-leading-to-higher-emissions” model fits
the first half of the EKC’s inverted U shape. EKC logic argues that human activities
performed in the pursuit of growth and development result in increases in certain
pollutants at low-income levels, but the pollutants eventually decrease as incomes
rise (Grossman and Krueger 1991, 1995) The EKC logic is the theoretical basis for
proceeding on this assumption, because development policies in developing
countries are strongly influenced by this logic. As a result, planners, politicians and
policy makers are discouraged from making efforts to stabilize or reduce CO2
emissions. However, there is some question whether this logic applies to carbon
dioxide at all (Moomaw and Unruh 1998).
In Moomaw and Unruh (1998), an example of the relationship between
historical events and CO2 emissions was presented. The key point made in the study
was that the EKC cannot and should not be generalized. It is important to recognize
that development is not a necessary or sufficient justification for CO2 emission
increases (Chandler, 2000). EKC does not explain CO2 emissions. Evidence shows
that CO2 can be reduced without disturbing or damaging economic growth, like any

92
other pollutant. It is not necessarily the case, as EKC implies, that economic growth
causes an increase in CO2. Rather, economic growth can eventually reduce
emissions (Moomaw and Unruh 1997). The relationship between GHGpc and
income was explored by Moomaw and Tullis (1994) who used a development plane
defined by these two variables to demonstrate that the trajectory of the development
path through time differed among countries. They also examined the relative
contribution of the three terms of the IPAT relationship (Ehrlich and Holdren 1971)
to GHGpc for many countries (1999). Not all countries show the same trajectory,
and it is not true that all countries must follow the process of increasing CO2
emissions as income increases (Anadon and Holdren 2009). Historical events may
be the driving force for the change, rather than income (Moomaw and Unruh 1998;
Unruh and Moomaw 1998). In some cases, energy intensity is lowered by oil shocks.
In cases in which historical events cause the change, decision-making and events
are more important than incomes. Rather than relying on generalizations like the
EKC model, it may be more useful to track the history of each country (America’s
Energy Future 2009; Moomaw and Tullis 1994 and 1999).
These historical events (and the decision-making processes that
accompany them) may promote technical improvements that bring greater
93
efficiency. Even when economic growth is found to be related to emission
improvement, it cannot be assumed that this improvement occurred automatically.
If it did happen automatically, then the reason may be that dirty technology was
replaced by clean technology (Orban 2008).
The EKC has its share of proponents and critics. As discussed earlier, the
EKC postulates that once a country achieves a certain level of national income, the
environment is expected to improve as well, and that the initial degradation of the
environment is not always the result of economic growth. While EKC supporters
argue that nations can prosper enough to solve environmental problems, critics of
EKC argue that as economic growth is achieved and sustained, improvement of the
environment becomes difficult. Kidd (2009) surmised that although having high
standards of living with a clean environment is possible, the opposite can also be
true: the environment may further degrade despite economic development until the
earth’s carrying capacity is reached.
However, some authors argue that the EKC has complications. Recent
studies have suggested the following: (i) the EKC’s inverted U-shaped curve can
be applied to only certain environmental problems (Stern 2004; Dasgupta et al.
2002); (ii) the total impact may increase at a certain range of incomes, but there are
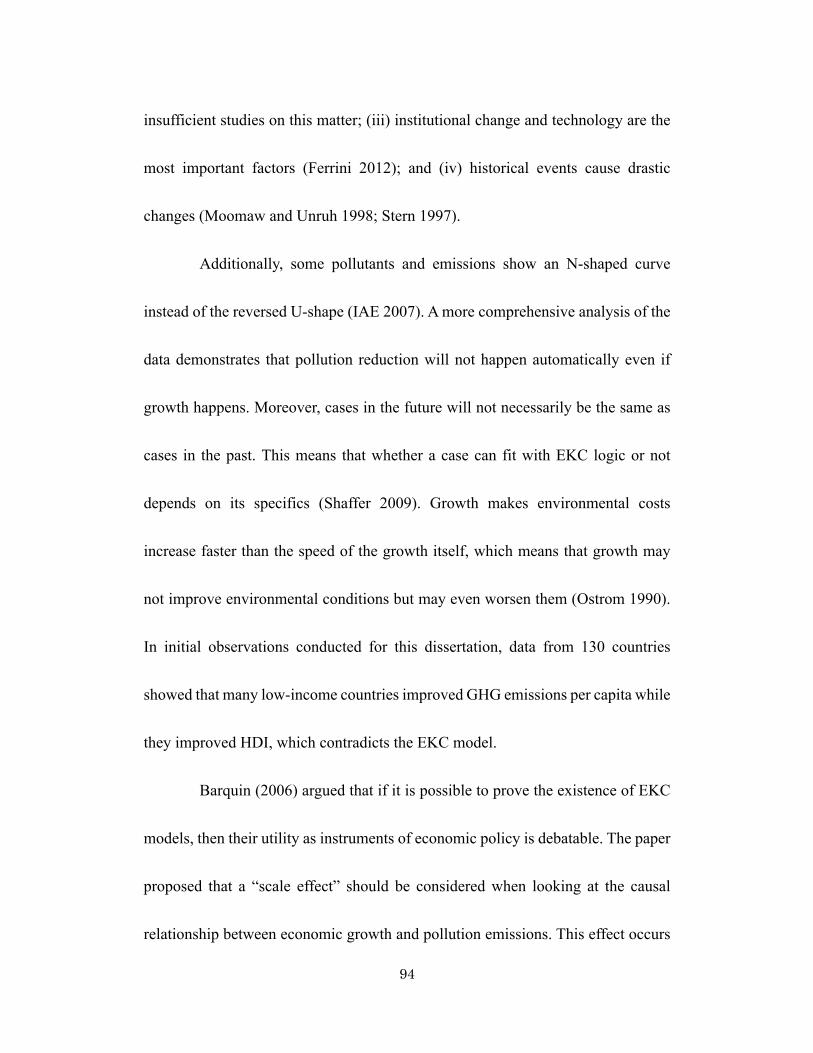
94
insufficient studies on this matter; (iii) institutional change and technology are the
most important factors (Ferrini 2012); and (iv) historical events cause drastic
changes (Moomaw and Unruh 1998; Stern 1997).
Additionally, some pollutants and emissions show an N-shaped curve
instead of the reversed U-shape (IAE 2007). A more comprehensive analysis of the
data demonstrates that pollution reduction will not happen automatically even if
growth happens. Moreover, cases in the future will not necessarily be the same as
cases in the past. This means that whether a case can fit with EKC logic or not
depends on its specifics (Shaffer 2009). Growth makes environmental costs
increase faster than the speed of the growth itself, which means that growth may
not improve environmental conditions but may even worsen them (Ostrom 1990).
In initial observations conducted for this dissertation, data from 130 countries
showed that many low-income countries improved GHG emissions per capita while
they improved HDI, which contradicts the EKC model.
Barquin (2006) argued that if it is possible to prove the existence of EKC
models, then their utility as instruments of economic policy is debatable. The paper
proposed that a “scale effect” should be considered when looking at the causal
relationship between economic growth and pollution emissions. This effect occurs
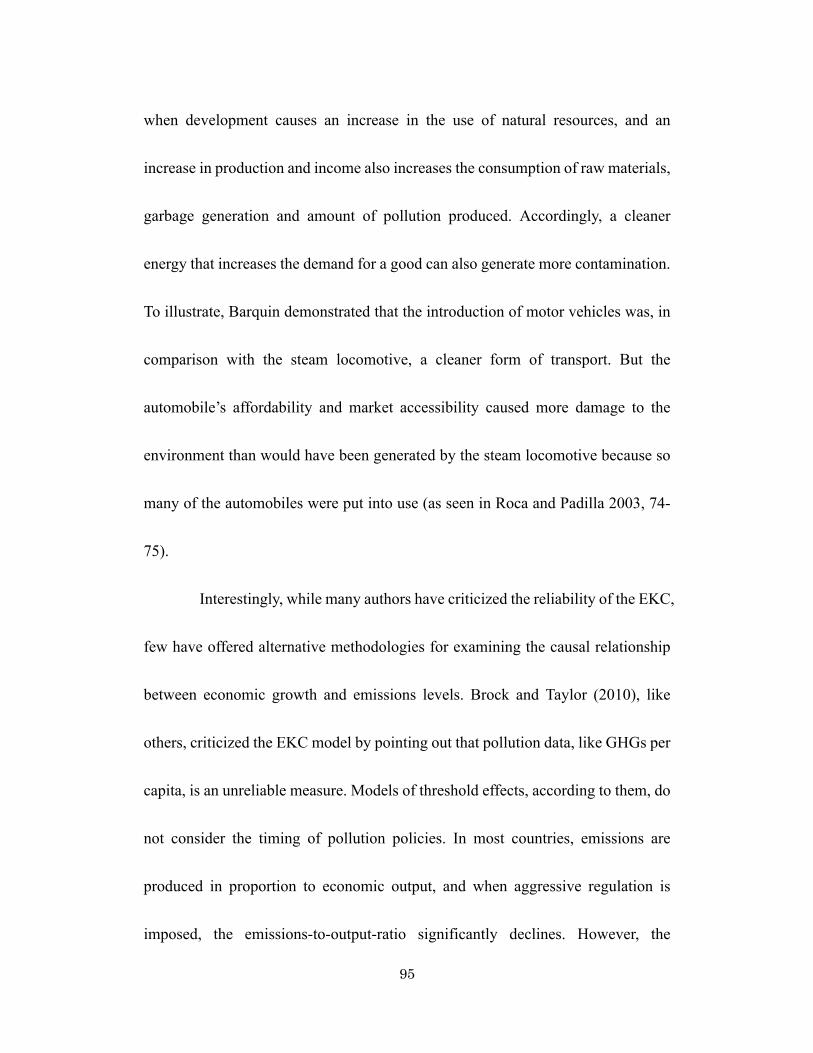
95
when development causes an increase in the use of natural resources, and an
increase in production and income also increases the consumption of raw materials,
garbage generation and amount of pollution produced. Accordingly, a cleaner
energy that increases the demand for a good can also generate more contamination.
To illustrate, Barquin demonstrated that the introduction of motor vehicles was, in
comparison with the steam locomotive, a cleaner form of transport. But the
automobile’s affordability and market accessibility caused more damage to the
environment than would have been generated by the steam locomotive because so
many of the automobiles were put into use (as seen in Roca and Padilla 2003, 74-
75).
Interestingly, while many authors have criticized the reliability of the EKC,
few have offered alternative methodologies for examining the causal relationship
between economic growth and emissions levels. Brock and Taylor (2010), like
others, criticized the EKC model by pointing out that pollution data, like GHGs per
capita, is an unreliable measure. Models of threshold effects, according to them, do
not consider the timing of pollution policies. In most countries, emissions are
produced in proportion to economic output, and when aggressive regulation is
imposed, the emissions-to-output-ratio significantly declines. However, the

96
available data on emissions are inconsistent with this assumption: the emissions per
unit output typically declines well before any reduction in aggregate emissions.
Also, while increasing returns to emission abatement may be important in some
industries, a large portion of emissions come from diffuse sources such as cars,
houses and individual consumptive activities.
To illustrate further, Brock and Taylor (2010) presented a simple growth
and pollution model to investigate the relationship between growth and emissions.
The model shows that although emissions rise with output growth, they eventually
go down with ongoing technological progress. If rapid growth overwhelms the
emission-reducing impact of technological progress, emission levels rise, but as
countries mature and approach their balanced growth path, economic growth slows
and the effect of emissions is now overwhelmed by the impact of technological
progress in abatement. The result is that emission levels decline. This interplay of
diminishing returns and technological progress, according to Brock, generates a
time series data of increasing and decreasing emissions as income per capita grows.
Finally, in a study conducted by Raymond (2004), the theoretical
arguments presented in Arrow (1995), which stated that EKC relationships are
unlikely to hold for intergenerational environmental problems, were confirmed.

97
Using the Environmental Sustainability Index (ESI), a comprehensive summary of
environmental quality and conditions in 140 countries was developed. This
provided new dependent variables showing causal relationships between sustained
growth and environmental impact. The results suggest that EKC may be an
inadequate guide for environmental policy.
It has been argued that while higher income is significantly associated with
improvements in welfare within national borders, evidence of an actual EKC trend
in country data is lacking. Moreover, per capita income shows a negative
relationship with indicators of international environmental impacts, such as GHG
emissions. Raymond argued that it is unlikely that growth and development will
improve temporal environmental impacts rather than spatial impacts, such as
biodiversity loss or growing stress on ecological systems. Table 41 presents a
summary of the major arguments presented by each author on the EKC.

98
Table 41. Summary of Authors’ EKC Arguments
Author Claims Against EKC Indicators
Stern (2006) and Dasgupta (2007)
• EKC can be applied to only some environmental problems.
Chandler (2000)
• Development is not a necessary or sufficient justification for CO2 emission-increases. CO2
Moomaw and Unruh (1997)
• EKC cannot and should not be generalized. • Historical events may be the driving force
for the change, but not income. • EKC does not fit with CO2 emissions. • Economic growth does not necessarily cause
an increase in CO2; rather, economic growth can eventually reduce emissions . CO2
IEA (2007) • Some pollutants and emissions show an N-
shaped curve. Emissions
Barquin (2006)
• A “scale effect” should be considered. • If it is possible to prove the existence of
EKC models, then their utility as instruments of economic policy is debatable.
Impacts by Motor Vehicles
America’s Energy Future (2009)
• Generalizations like the EKC model should not be relied upon.
• It is important to track the history of each country because development policies in developing countries are strongly influenced or “trapped” by the EKC theory.
Orban (2008)
• Even if a case in which economic growth is related to an emission improvement is found, there is no reason to believe that such improvement occurs automatically.
• If it can happen automatically, then it may be a case wherein dirty technology is
Dirty Technology

99
Author Claims Against EKC Indicators
replaced by clean technology.
Kidd (2009)
• Although having high standards of living with a clean environment is possible, the opposite is also true.
• The environment may further degrade, despite economic development, until the earth’s carrying capacity is reached.
Environmental Degradation
Ferrini (2012)
• Institutional change and technology are the most important items.
Shaffer (2009)
• Pollution reduction will not happen automatically even if growth happens.
• Cases in the future will not necessarily be the same as cases in the past.
• Whether a case can fit with EKC or not depends on the specifics of the case.
Ostrom (1990)
• Growth makes environmental costs increase faster than the speed of the growth itself.
• Growth may not improve environmental conditions but may even worsen it.
Worsening of Environmental Conditions
Brock and Taylor (2010)
• Pollution data, like GHG per capita, are unreliable measures.
• Models of threshold effects do not consider the timing of the pollution policies imposed.
• Emissions are produced in proportion to economic output; when aggressive regulation is imposed, emissions-to-output-ratio drastically decline.
Greenhouse Gas
Raymond (2004)
• While higher income is significantly associated with improvements in welfare, evidence of an actual EKC trend in country data is lacking.
• Per capita income shows a negative Greenhouse Gas

100
Author Claims Against EKC Indicators
relationship with indicators of international environmental impacts such as GHG emissions.
A version of the “development-leading-to-higher-emissions” model fits
with the first half of the EKC’s reversed U shape. EKC logic argues that human
activities performed in the pursuit of growth and development result in increases in
certain pollutants at low-income levels, but then result in decreases at some point
as incomes rise (Grossman and Krueger 1991, 1995). As a result, planners,
politicians and policy-makers are discouraged from making efforts to stabilize or
reduce CO2 emissions.
The “development-leading-to-higher-emissions” (DLHE) group is
composed of countries whose CO2 steadily increased during the period 1990–2010.
They will heretofore be called the “DLHE countries.” As recognized already, the
10 unsuccessful countries were:
(i) Pakistan, the Philippines, and Sri Lanka: unsuccessful DLHE countries
because of unsuccessful HDI.
(ii) Vietnam, India, and China (PRC): unsuccessful DLHE countries because
of unsuccessful GHG emissions.
(iii) Thailand, Indonesia, Malaysia and Republic of Korea: unsuccessful DLHE

101
countries because of both unsuccessful HDI and unsuccessful GHG
emissions.
In addition, Bangladesh, a successful country, also showed DLHE
trajectory (did not pause its CO2 increase during the period).
China (PRC). CO2 grew to make up 87% of GHG. In 2010, 80% of the
CO2 (since it came mostly from the fossil fuel energy sector) was produced by
electricity/heat and manufacturing/construction (See Figure 57).
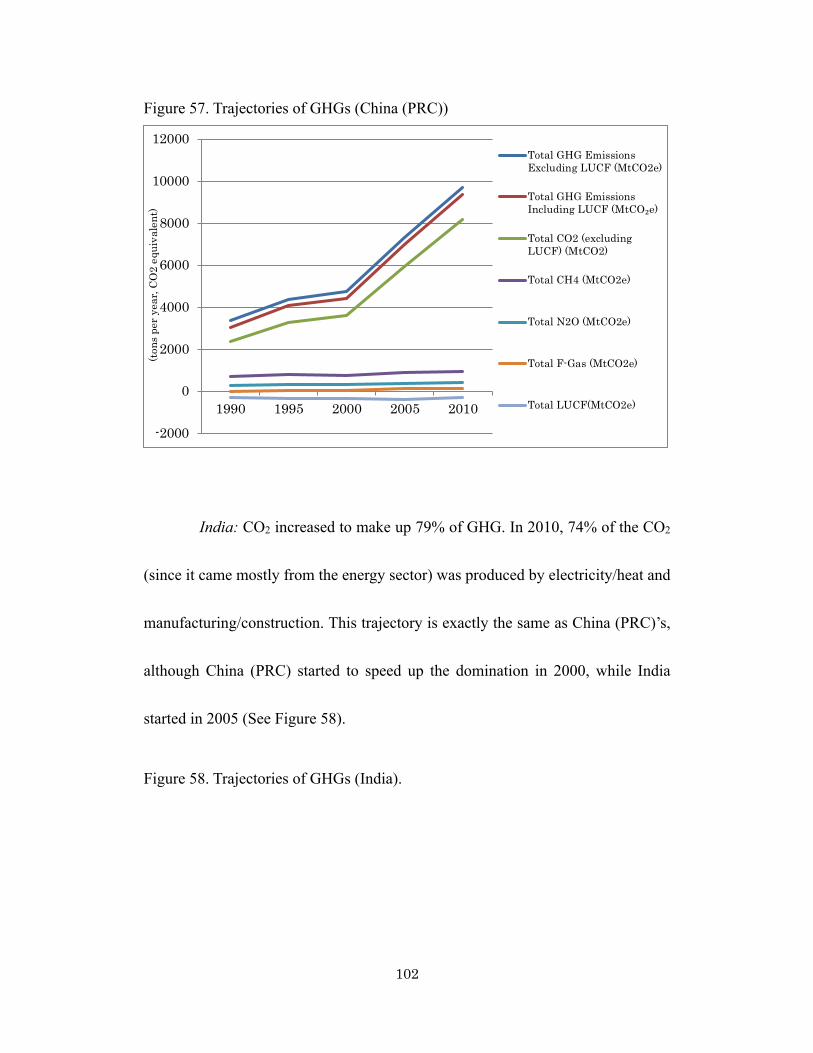
102
Figure 57. Trajectories of GHGs (China (PRC))
India: CO2 increased to make up 79% of GHG. In 2010, 74% of the CO2
(since it came mostly from the energy sector) was produced by electricity/heat and
manufacturing/construction. This trajectory is exactly the same as China (PRC)’s,
although China (PRC) started to speed up the domination in 2000, while India
started in 2005 (See Figure 58).
Figure 58. Trajectories of GHGs (India).
-2000
0
2000
4000
6000
8000
10000
12000
1990 1995 2000 2005 2010
Total GHG EmissionsExcluding LUCF (MtCO2e)
Total GHG Emissions Including LUCF (MtCO₂e )
Total CO2 (excludingLUCF) (MtCO2)
Total CH4 (MtCO2e)
Total N2O (MtCO2e)
Total F-Gas (MtCO2e)
Total LUCF(MtCO2e)
(tons
per
yea
r, CO
2 eq
uiva
lent
)
103
Republic of Korea: Throughout the period, CO2 increased to make up more
than 93% of GHG. In 2010, 87% of CO2 (since it was mostly from the energy
sector) was produced by electricity/heat (55%), manufacturing/construction (17%),
and transport (15%). This trajectory is very similar to those of China (PRC) and
India. However, China (PRC) started to speed up the domination in 2000 and India
started in 2005, but the Republic of Korea had already started before 1990. While
China (PRC) and India had the agriculture sector as the second contributor, in the
Republic of Korea, the agriculture sector was a very insignificant contributor (See
Figure 59).
Figure 59. Trajectories of GHGs (Republic of Korea).
-500
0
500
1000
1500
2000
2500
3000
1990 1995 2000 2005 2010
Total GHG EmissionsExcluding LUCF(MtCO2e)Total GHG Emissions Including LUCF (MtCO₂e )Total CO2 (excludingLUCF) (MtCO2)
Total CH4 (MtCO2e)
Total N2O (MtCO2e)
Total F-Gas (MtCO2e)
Total LUCF(MtCO2e)
(tons
per
yea
r, CO
2 eq
uiva
lent
)

104
Pakistan: Throughout the period, CO2 increased to make up 46% of GHG.
In 2010, 77% of the CO2 (since it came mostly from the energy sector) was
produced by electricity/heat, manufacturing/construction, and transport. This
trajectory is very similar to those of China (PRC), India, and the Republic of Korea.
In Pakistan, CH4 from agriculture is still a significant gas among GHG emissions
(See Figure 60).
Figure 60. Trajectories of GHGs (Pakistan).
-100
0
100
200
300
400
500
600
700
1990 1995 2000 2005 2010
Total GHG EmissionsExcluding LUCF (MtCO2e)
Total GHG Emissions Including LUCF (MtCO₂e )
Total CO2 (excludingLUCF) (MtCO2)
Total CH4 (MtCO2e)
Total N2O (MtCO2e)
Total F-Gas (MtCO2e)
Total LUCF (MtCO2e)
(tons
per
yea
r, CO
2 eq
uiva
lent
)

105
Philippines: Throughout the period, CO2 increased to make up around 50-
60% of GHG. In 2010, 86% of the CO2 (since it came mostly from the energy
sector) was produced by electricity/heat (42%), manufacturing/construction (29%),
and transport (16%). This trajectory is very similar to those of China (PRC), India,
the Republic of Korea, and Pakistan. In the Philippines, CH4 from agriculture is still
a significant gas among GHG emissions. CO2 emissions from transport are higher
than those from manufacturing/construction. This may result from geological
reasons: the Philippines is made up of many small islands that are not suitable for
trains (See Figure 61).
Figure 61. Trajectories of GHGs (Philippines).
0
50
100
150
200
250
300
350
1990 1995 2000 2005 2010
Total GHG EmissionsExcluding LUCF(MtCO2e)Total GHG Emissions Including LUCF (MtCO₂e )Total CO2 (excludingLUCF) (MtCO2)
Total CH4 (MtCO2e)
Total N2O (MtCO2e)
Total F-Gas (MtCO2e)
Total LUCF (MtCO2e)
(tons
per
yea
r, CO
2 eq
uiva
lent
)

106
Thailand: Throughout the period, CO2 increased to make up more than
50% of GHG. In 2010, 87% of the CO2 was produced by electricity/heat (39%),
manufacturing/construction (26%), and transport (22%). This trajectory is very
similar to those of China (PRC), India, the Republic of Korea, Pakistan, and the
Philippines. In Thailand, CH4 from agriculture is still a significant gas among GHG
emissions (See Figure 62).
Figure 62. Trajectories of GHGs (Thailand).
-20
0
20
40
60
80
100
120
140
160
1990 1995 2000 2005 2010
Total GHG EmissionsExcluding LUCF(MtCO2e)
Total GHG Emissions Including LUCF (MtCO₂e )
Total CO2 (excludingLUCF) (MtCO2)
Total CH4 (MtCO2e)
Total N2O (MtCO2e)
Total F-Gas (MtCO2e)
Total LUCF (MtCO2e)
(tons
per
yea
r, CO
2 eq
uiva
lent
)

107
Malaysia: Other than the drastic change in LUCF which is supposed to be the result
of massive deforestation and the planting of palm oil plantations, the emissions
showed the typical CO2-energy-led trajectory (See Figure 63).
-50
0
50
100
150
200
250
300
350
400
1990 1995 2000 2005 2010
Total GHG EmissionsExcluding LUCF(MtCO2e)
Total GHG Emissions Including LUCF (MtCO₂e )
Total CO2 (excludingLUCF) (MtCO2)
Total CH4 (MtCO2e)
Total N2O (MtCO2e)
Total F-Gas (MtCO2e)
Total LUCF (MtCO2e)
(tons
per
yea
r, CO
2 eq
uiva
lent
)

108
Figure 63. Trajectories of GHGs (Malaysia).
Indonesia: Total GHG emissions almost doubled during the period
because of increases in all GHG gases. The all-time main source was LUCF, which
made up more than half of the contributions, while CO2 from the energy sector and
CH4 from agriculture also increased. CH4 from agriculture and LUCF were the
main sources in 1990. The main emitter of CO2 from the energy sector was
electricity/heat (See Figure 64).
-300
-200
-100
0
100
200
300
400
500
1990 1995 2000 2005 2010
Total GHG EmissionsExcluding LUCF (MtCO2e)
Total GHG Emissions Including LUCF (MtCO₂e )
Total CO2 (excludingLUCF) (MtCO2)
Total CH4 (MtCO2e)
Total N2O (MtCO2e)
Total F-Gas (MtCO2e)
Total LUCF (MtCO2e)
(tons
per
yea
r, CO
2 eq
uiva
lent
)
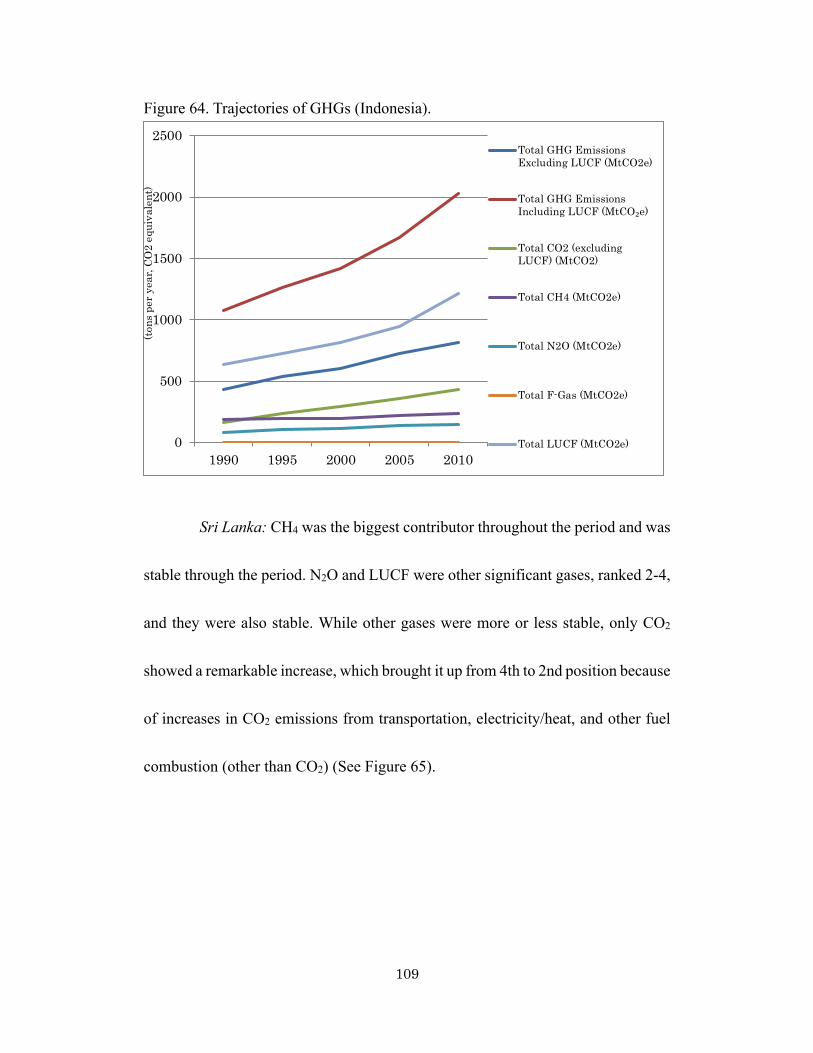
109
Figure 64. Trajectories of GHGs (Indonesia).
Sri Lanka: CH4 was the biggest contributor throughout the period and was
stable through the period. N2O and LUCF were other significant gases, ranked 2-4,
and they were also stable. While other gases were more or less stable, only CO2
showed a remarkable increase, which brought it up from 4th to 2nd position because
of increases in CO2 emissions from transportation, electricity/heat, and other fuel
combustion (other than CO2) (See Figure 65).
0
500
1000
1500
2000
2500
1990 1995 2000 2005 2010
Total GHG EmissionsExcluding LUCF (MtCO2e)
Total GHG Emissions Including LUCF (MtCO₂e )
Total CO2 (excludingLUCF) (MtCO2)
Total CH4 (MtCO2e)
Total N2O (MtCO2e)
Total F-Gas (MtCO2e)
Total LUCF (MtCO2e)
(tons
per
yea
r, CO
2 eq
uiva
lent
)

110
Figure 65. Trajectories of GHGs (Sri Lanka).
Bangladesh: The main source became CO2 from the energy sector,
including electricity/heat, manufacturing/construction, transportation and other fuel
combustion, even though CH4 from agriculture and LUCF were the main sources
in 1990. The main emitter of CO2 from the energy sector was electricity/heat (See
Figure 66).
0
10
20
30
40
50
60
1990 1995 2000 2005 2010
Total GHG EmissionsExcluding LUCF (MtCO2e)
Total GHG Emissions Including LUCF (MtCO₂e )
Total CO2 (excludingLUCF) (MtCO2)
Total CH4 (MtCO2e)
Total N2O (MtCO2e)
Total F-Gas (MtCO2e)
Total LUCF (MtCO2e)
(tons
per
yea
r, CO
2 eq
uiva
lent
)

111
Figure 66. Trajectories of GHGs (Bangladesh).
Vietnam: The main source was CO2 from the energy sector, including
manufacturing/construction, electricity/heat, transportation and other fuel
combustion, even though CH4 from agriculture was the main source until 2000. The
main emitters of CO2 from the energy sector were manufacturing/construction and
electricity/heat. LUCF was an absorber throughout the period, but the amount of
absorption drastically decreased in 2005 (from 40s to 10s Mt CO2e) (See Figure
67).
0
20
40
60
80
100
120
140
160
180
1990 1995 2000 2005 2010
Total GHG EmissionsExcluding LUCF (MtCO2e)
Total GHG Emissions Including LUCF (MtCO₂e )
Total CO2 (excludingLUCF) (MtCO2)
Total CH4 (MtCO2e)
Total N2O (MtCO2e)
Total F-Gas (MtCO2e)
Total LUCF(MtCO2e)
(tons
per
yea
r, CO
2 eq
uiva
lent
)
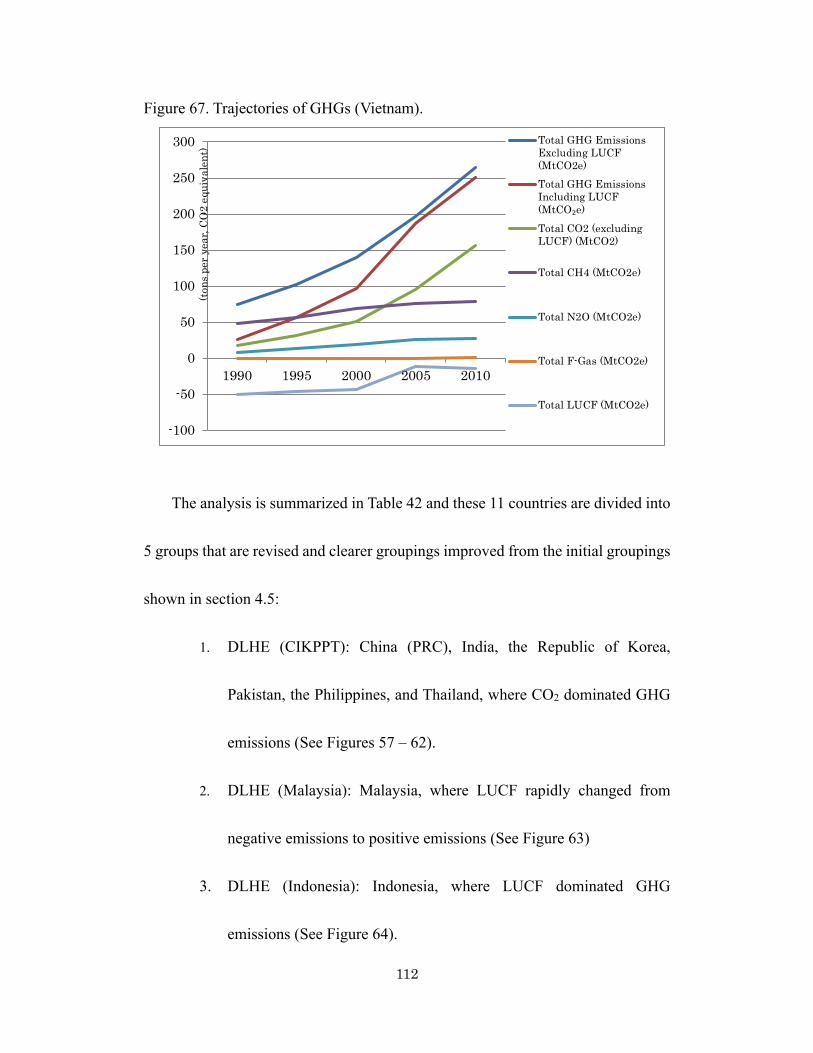
112
Figure 67. Trajectories of GHGs (Vietnam).
The analysis is summarized in Table 42 and these 11 countries are divided into
5 groups that are revised and clearer groupings improved from the initial groupings
shown in section 4.5:
1. DLHE (CIKPPT): China (PRC), India, the Republic of Korea,
Pakistan, the Philippines, and Thailand, where CO2 dominated GHG
emissions (See Figures 57 – 62).
2. DLHE (Malaysia): Malaysia, where LUCF rapidly changed from
negative emissions to positive emissions (See Figure 63)
3. DLHE (Indonesia): Indonesia, where LUCF dominated GHG
emissions (See Figure 64).
-100
-50
0
50
100
150
200
250
300
1990 1995 2000 2005 2010
Total GHG EmissionsExcluding LUCF(MtCO2e)Total GHG Emissions Including LUCF (MtCO₂e )Total CO2 (excludingLUCF) (MtCO2)
Total CH4 (MtCO2e)
Total N2O (MtCO2e)
Total F-Gas (MtCO2e)
Total LUCF (MtCO2e)
(tons
per
yea
r, CO
2 eq
uiva
lent
)

113
4. DLHE (Sri Lanka): Sri Lanka, where CO2 increased rapidly but did
not yet dominate GHG emissions (See Figure 65).
5. DLHE (BV): Bangladesh and Vietnam, where CO2 increased greatly
and became the leading GHGs (See Figure 66 and Figure 67).
Considering the characteristics of each group, they are renamed as follows to be
convenient for summarizing the results in Figure 70.
1. DLHE (CIKPPT) is renamed DLHE(domCO2)
2. DLHE (Malaysia) is renamed DLHE(LUCF-+)
3. DLHE (Indonesia) is renamed DLHE(LUCF)
4. DLHE (Sri Lanka) is renamed DLHE(not yetCO2)
5. DLHE (BV) is renamed DLHE (newCO2)
In addition, other successful countries are named as follows:
Mongolia: NonDLHE (LUCF) = emissions were dominated by LUCF
Myanmar: NonDLHE (reform) = emissions decreased during the reform
Nepal: NonDLHE (Agri&LUCF) = emissions were dominated by agriculture
and LUCF.
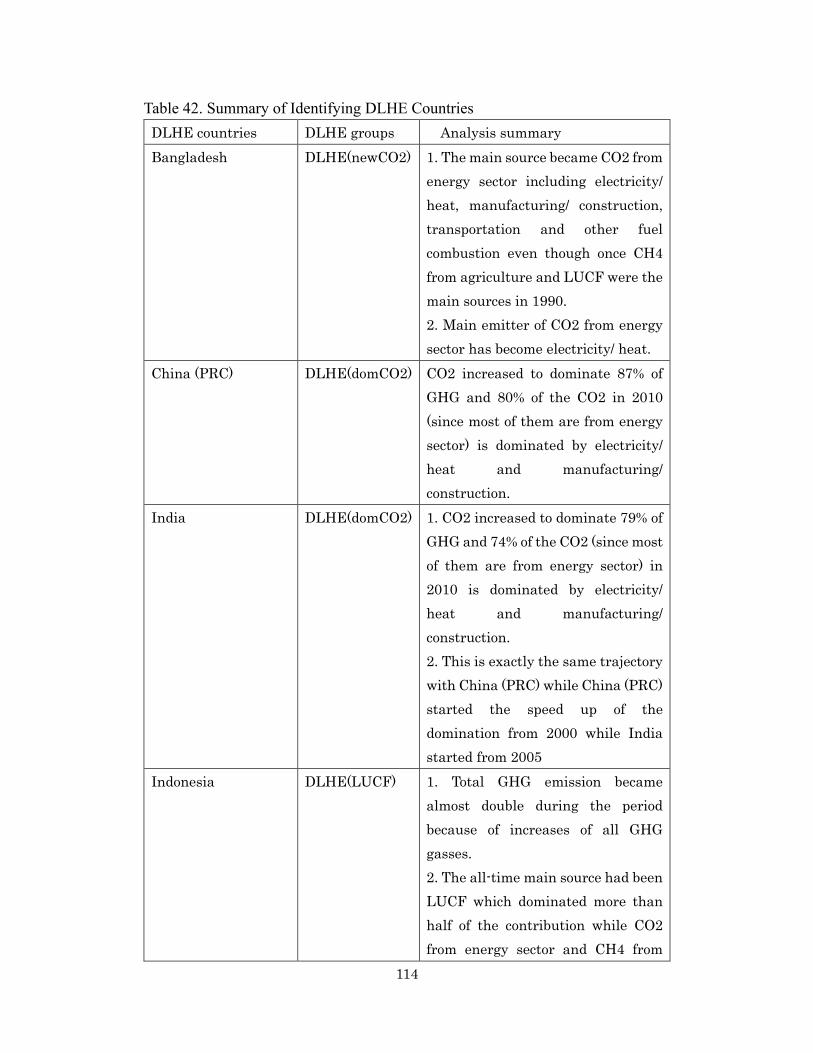
114
Table 42. Summary of Identifying DLHE Countries DLHE countries DLHE groups Analysis summary Bangladesh DLHE(newCO2) 1. The main source became CO2 from
energy sector including electricity/ heat, manufacturing/ construction, transportation and other fuel combustion even though once CH4 from agriculture and LUCF were the main sources in 1990. 2. Main emitter of CO2 from energy sector has become electricity/ heat.
China (PRC) DLHE(domCO2) CO2 increased to dominate 87% of GHG and 80% of the CO2 in 2010 (since most of them are from energy sector) is dominated by electricity/ heat and manufacturing/ construction.
India DLHE(domCO2) 1. CO2 increased to dominate 79% of GHG and 74% of the CO2 (since most of them are from energy sector) in 2010 is dominated by electricity/ heat and manufacturing/ construction. 2. This is exactly the same trajectory with China (PRC) while China (PRC) started the speed up of the domination from 2000 while India started from 2005
Indonesia DLHE(LUCF) 1. Total GHG emission became almost double during the period because of increases of all GHG gasses. 2. The all-time main source had been LUCF which dominated more than half of the contribution while CO2 from energy sector and CH4 from

115
DLHE countries DLHE groups Analysis summary agriculture also increased. 3. Once CH4 from agriculture and LUCF were the main sources in 1990.2. Main emitter of CO2 from energy sector has become electricity/ heat.
Malaysia DLHE(LUCF-+) Other than the drastic change of LUCF, the emission showed the typical CO2-energy lead trajectory.
Mongolia Successful as NonDLHE (LUCF)
LUFC had been the dominating gas through 1990-2005. All other GHG emissions had been stable or even decreased from 1990 till 2000, then they (CO2, CH4, and N2O) started increase from 2005 because of agriculture sector and electricity/ heat, manufacturing/ construction, and other fuel combustion.
Myanmar Very successful as NonDLHE (reform)
1. CO2 was not significant through the period (less than 5% all through the period). 2. LUCF, CH4, and N2O, and agriculture sector were significant contributors, but emission increases were not remarkable after drastic drop through 1995-2000. This period was in its military rule heading to the democratic reforms happened from 2011.
Nepal Very successful as NonDLHE (Agri&LUCF)
1. CO2 was not significant through the period (less than 10% all through the period). 2. LUCF, CH4, and agriculture sector were significant contributors.
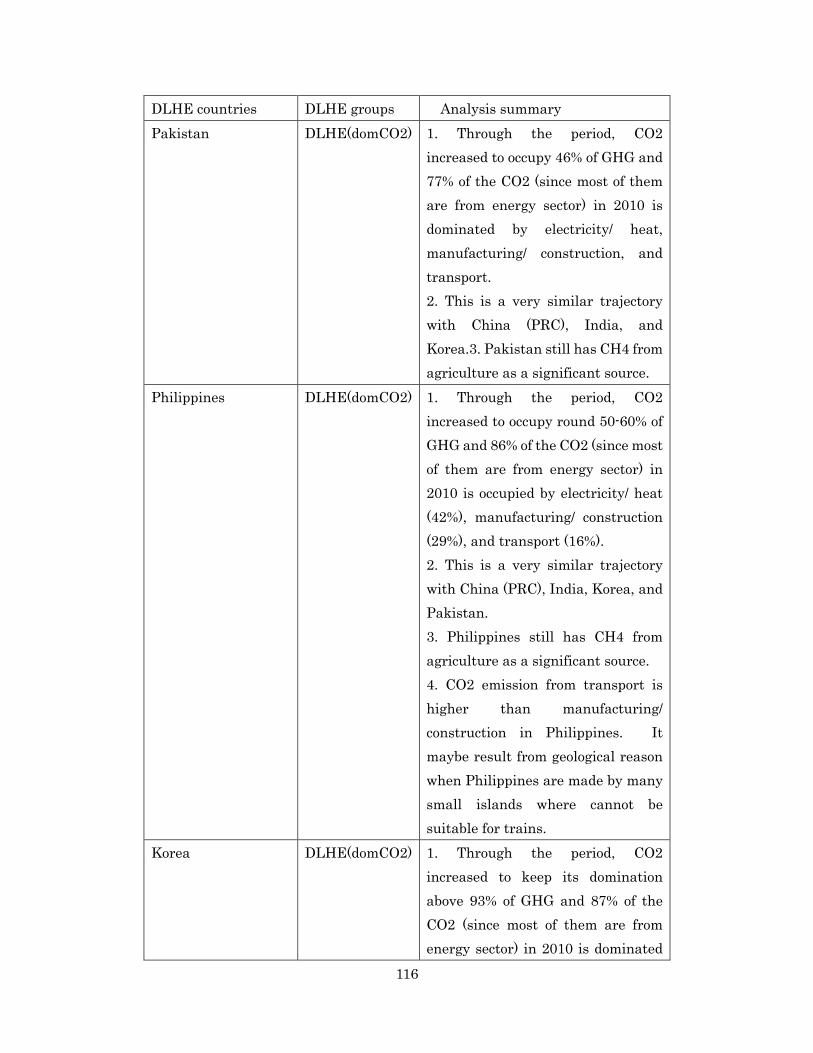
116
DLHE countries DLHE groups Analysis summary Pakistan DLHE(domCO2) 1. Through the period, CO2
increased to occupy 46% of GHG and 77% of the CO2 (since most of them are from energy sector) in 2010 is dominated by electricity/ heat, manufacturing/ construction, and transport. 2. This is a very similar trajectory with China (PRC), India, and Korea.3. Pakistan still has CH4 from agriculture as a significant source.
Philippines DLHE(domCO2) 1. Through the period, CO2 increased to occupy round 50-60% of GHG and 86% of the CO2 (since most of them are from energy sector) in 2010 is occupied by electricity/ heat (42%), manufacturing/ construction (29%), and transport (16%). 2. This is a very similar trajectory with China (PRC), India, Korea, and Pakistan. 3. Philippines still has CH4 from agriculture as a significant source. 4. CO2 emission from transport is higher than manufacturing/ construction in Philippines. It maybe result from geological reason when Philippines are made by many small islands where cannot be suitable for trains.
Korea DLHE(domCO2) 1. Through the period, CO2 increased to keep its domination above 93% of GHG and 87% of the CO2 (since most of them are from energy sector) in 2010 is dominated

117
DLHE countries DLHE groups Analysis summary by electricity/ heat (55%), manufacturing/ construction (17%), and transport (15%). 2. This is a very similar trajectory with China (PRC) and India while China (PRC) started the speed up of the domination from 2000 while India started from 2005, but Korea started already before 1990. 3. While China (PRC) and India had agriculture sector as the 2nd contributor, in Korea, agriculture sector was very insignificant.
Sri Lanka DLHE(not yetCO2)
1. CH4 had been the biggest contributor through the period while it was also stable through the period. N2O and LUCF hand been also other significant gases ranked 2-4 through the period, however they were also stable. 2. While other gasses were more or less stable, Only CO2 showed remarkable increase which bring it up from 4th position to 2nd position because of increases by CO2 emissions from transportation, electricity/ heat, and other fuel combustion (other than CO2).
Thailand DLHE(domCO2) 1. Through the period, CO2 increased to keep its domination above 50% of GHG and 87% of the CO2 in 2010 is dominated by electricity/ heat (39%), manufacturing/ construction (26%), and transport (22%).
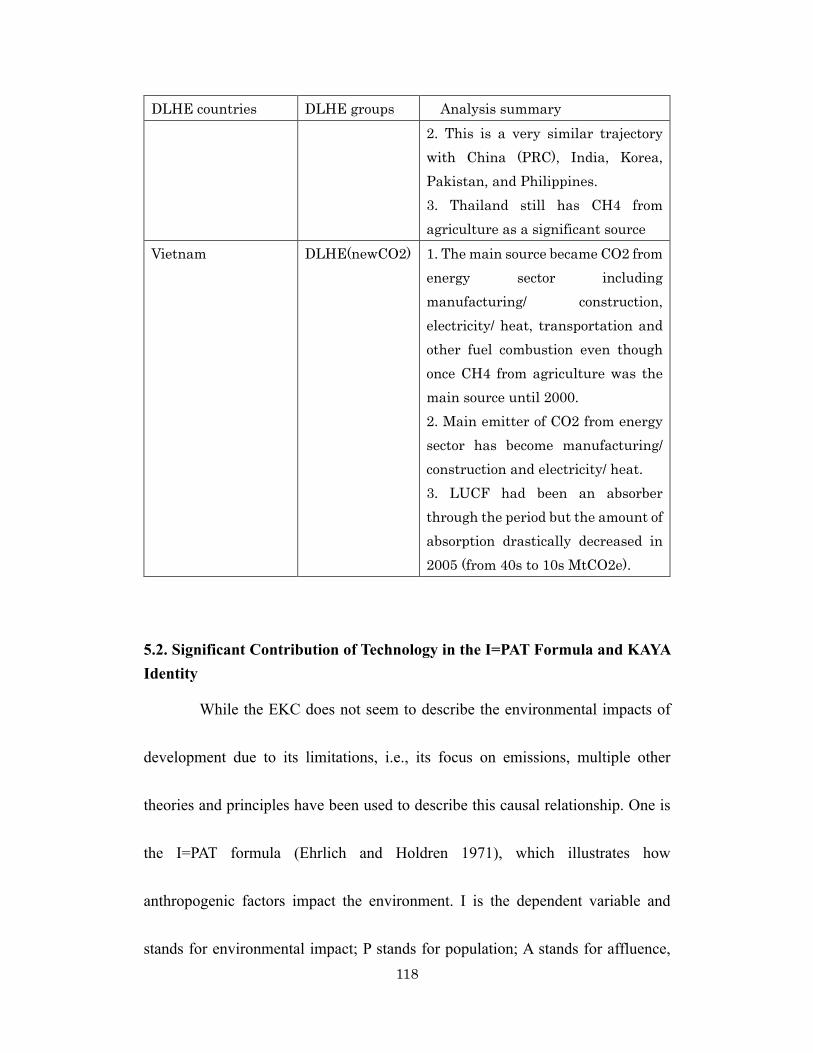
118
DLHE countries DLHE groups Analysis summary 2. This is a very similar trajectory with China (PRC), India, Korea, Pakistan, and Philippines. 3. Thailand still has CH4 from agriculture as a significant source
Vietnam DLHE(newCO2) 1. The main source became CO2 from energy sector including manufacturing/ construction, electricity/ heat, transportation and other fuel combustion even though once CH4 from agriculture was the main source until 2000. 2. Main emitter of CO2 from energy sector has become manufacturing/ construction and electricity/ heat. 3. LUCF had been an absorber through the period but the amount of absorption drastically decreased in 2005 (from 40s to 10s MtCO2e).
5.2. Significant Contribution of Technology in the I=PAT Formula and KAYA Identity
While the EKC does not seem to describe the environmental impacts of
development due to its limitations, i.e., its focus on emissions, multiple other
theories and principles have been used to describe this causal relationship. One is
the I=PAT formula (Ehrlich and Holdren 1971), which illustrates how
anthropogenic factors impact the environment. I is the dependent variable and
stands for environmental impact; P stands for population; A stands for affluence,

119
which represents the average per capita income of a population; and T stands for
technology, which represents the environmental impact intensity or environmental
impact per unit of goods and services. It is widely accepted that growth in
population, affluence, and technology are each responsible for environmental
problems (Kates 2000). Population and affluence usually increase over time and the
technology factor can lower impact intensity by increasing production or utility
efficiency, thereby reducing its multiplier effect on the equation.
Kates added that while the population factor can be easily understood and
is often predictable, consumption needs to be examined further, and technology is
even more complicated because it can be both a problem and a solution. The author
argued that technology can cause pollution problems but that the development of
new technologies can also abate them. This view is shared by the World Bank
(2003), which stated that while T has decreased its impact in recent years, P and A
have continuously increased, which offsets the balance, causing I to continue to
increase steadily.
In this regard, the I=PAT formula emphasizes how the effects of multiple
drivers of environmental change are multiplicative, but interactive—population
growth, for instance, depends on the level of affluence and choice of technology
120
(Rosa and Dietz 2012). This significant contribution of technology, as compared to
the other two factors, was further recognized in Holdren (2000), who stated that
technological improvements can reduce the impact per dollar of GDP more rapidly
than can population and affluence. As if supporting Kates, Holdren added that this
is due to technology’s potential to reduce the amount of energy needed and the level
of materials consumed for economic activities. In recent years, P and A have been
increasing in most developing countries. Thus, if I is ever to be reduced, only T can
make it possible. Moreover, the technology component in the I=PAT formula is
further divided into two components: a specific technology’s contribution to overall
GDP (T/GDP) and the amount of GHG emissions per unit of technology utilization
(GHG/T).
The Kaya Identity, developed by Yoichi Kaya in 1993, provides a look at
the GHG contribution of specific technologies and serves as a measure of the
relative contribution of that technology to the economy. In detail, the Kaya Identity
separates the Technology factor in the IPAT equation into energy use per unit of
GDP, and carbon emissions per unit of energy consumed. To date, the Kaya identity
has been applied only to energy and pollution or carbon dioxide emissions
(Sustainability Dictionary 2017).

121
5.3.Technology Transfer/Adoption vis-à-vis Environmental Innovation
While the I-PAT Formula and KAYA Identity showed the significant
contribution of technology to overall environmental impacts, this section discusses
how various technologies transferred/adopted into developing countries relate to
development and environmental innovations in these countries. The assumption is
that when a new technology is transferred/adopted into a developing country, new,
emerging and improved environmental policies are also adopted in response to the
new technology. Policy reforms and institutional innovations occur. However,
studies suggest that environmental innovations are sometimes challenged, both at
the level of the company that transferred/adopted the technology and at the policy
level, by the developing countries that receive the new technology.
The above premise is based on Everett Rogers’ 1962 book Diffusion of
Innovations, which stated that innovation, communication channels, time, and
social systems influence the spread of new ideas, including technology. Rogers
surmised that a specific innovation must be widely adopted in order to be
sustainable, and, as Orr (2003) put it, people will adopt an innovation if it will
enhance their utility. This premise holds true for technology adoption, wherein
122
people accept a new technology if they believe that it is far better than the previous
one, even if they are used to it.
Moreover, technology diffusion does not follow a single uniform pattern.
Grubler (2003) argued that diffusion happens taking over a longer period in the
areas where the technology originated, and faster in areas where diffusion was
introduced later. In the former, referred to as “innovation centers,” the level of
adoption is higher than in the latter, referred to as “catch-up regions,” where
diffusion times are shorter but adoption levels are also generally lower.
The question remains: if technology can be transferred/adopted and
diffused, can something that is not tangible yet equally important for developing
countries to achieve development also be adopted? This refers to environmental
innovations leading to policy. In Hallila (2007), the understanding of adoption and
the diffusion of environmental innovations were examined along with the processes
involved. The empirical results show that to address the less successful
environmental innovations, three factors must be considered: realism while
evaluating one’s own innovation, access to capital, and utilization of networks.
This finding was supported in Ugaglia (2013), which studied
environmental innovations by focusing on the case of pesticide reduction in the

123
wine sector. The study developed a model to analyze the determinants of
environmental innovations in grape production and observed that environment-
friendly agricultural and production practices did not spread as expected. After
using different models to address the problem, the results indicated that the would-
be adopters did not have an incentive to change crop protection methods because
they faced a technological lock-in toward pesticides; that is, they were so dependent
on pesticide use that they were unable to switch to new technologies without
incurring substantial costs. Pesticides also bring the benefits of increasing returns
to scale. Moreover, new knowledge and skills are needed to adopt the
environmental innovation being introduced. Therefore, the paper argued,
innovation processes can be a complex phenomenon wherein recipients need to
search for new resources that they do not normally have. However, situations can
be different for countries adopting new technologies for the first time, which is
often the case in developing countries.
There are, however, studies that show the successful adoption of an
environmental innovation after a new technology was introduced. In Hascic (2010),
some evidence on the diffusion of climate change mitigation technologies (CCMT)
and their positive links to policy innovations was presented. By simply examining

124
patent counts on a variety of technologies from various countries over a period of
30 to 35 years, it was discovered that the rate of innovation accelerated for many
CCMTs. Since the data also show that different countries exhibit different types of
CCMT innovations, the study concluded that one important determinant of
innovation is a country’s general innovative capacity. A country with a high rate of
innovation was also seen as more innovative in CCMTs. This finding was supported
in Johnson (2010), which examined diffusion mechanisms, market factors, social
characteristics and political elements that facilitate or complicate dissemination.
This study stated that many of the challenges to technology innovation and
dissemination are found in eco-innovations and argued that since environmental
issues tend to be local in nature, local knowledge and solutions are required.
Adoption is facilitated by environmental feasibility and by cultural and political
acceptance. Johnson added that like many new technologies, environmental
innovations usually require significant support, training and assistance, and
concluded that it is essential to consider the skills required for the continued use
and repair of new technologies at the very onset of adoption.
The barriers faced by developing countries in technology transfer/adoption
and environmental innovations were further discussed in Ockwell et al. (2010),

125
which outlined policy considerations and mechanisms for overcoming barriers. A
major finding is that the majority of existing policy mechanisms do not recognize
the importance of developing indigenous eco-innovation capabilities among
developing countries. According to the paper, such capabilities are essential to
facilitating the diffusion of existing eco-innovations and sustainable economic
development based on the adoption of environmentally sound technologies.
Moreover, policy improvement is needed to respond to context-specific
technological and cultural requirements. This role of policy in environmental
innovation was further explored in Iida and Takeuchi (2008), which investigated
how environmental and trade policies affect the transfer/adoption of environmental
technology in a two-country model that includes the transfer/adoption of global
pollution. After the trade policies were compared, the results indicated that although
free trade lowers environmental regulation, it is still preferable when the evaluation
of the environmental damage is high. Moreover, the paper argued that when a
country cares less about the environmental damage caused by technology
transfer/adoption, free trade is Pareto improving. However, if the developing
country’s concern is high enough to lead it to implement environmental protection,
free trade is not preferred.
126
In a related study, Johnstone (2010) focused on innovation and technology
transfer in air pollution abatement, wastewater effluent treatment, solid waste
management, and climate change mitigation. The paper described the trends in
innovative activity related to selected areas of pollution abatement and control
technologies and its transfer internationally. It was discovered that market-based
instruments, like environmental taxes and permits, can induce innovation and that
by encouraging potential innovators to allocate resources to identify the best way
of achieving a given environmental objective, policy flexibility can provide
incentives for innovation.
Despite the many challenges faced by developing countries in technology
transfer/adoption and diffusion, it is still not safe to conclude that technology, in
general, is difficult to transfer/adopt. Most of the above-mentioned cases involved
movement from north to south, and the barriers identified were concentrated along
that line. However, a recent study suggested that technology transfer now also
occurs in the north-to-south-to-north, south-to-south, and south-to-north directions,
and the ensuing innovation is no longer a local process, but rather happens on a
global scale (Gallagher 2013). To assess this premise, Gallagher examined the
dynamics of clean-energy technology transfer in selected countries that are
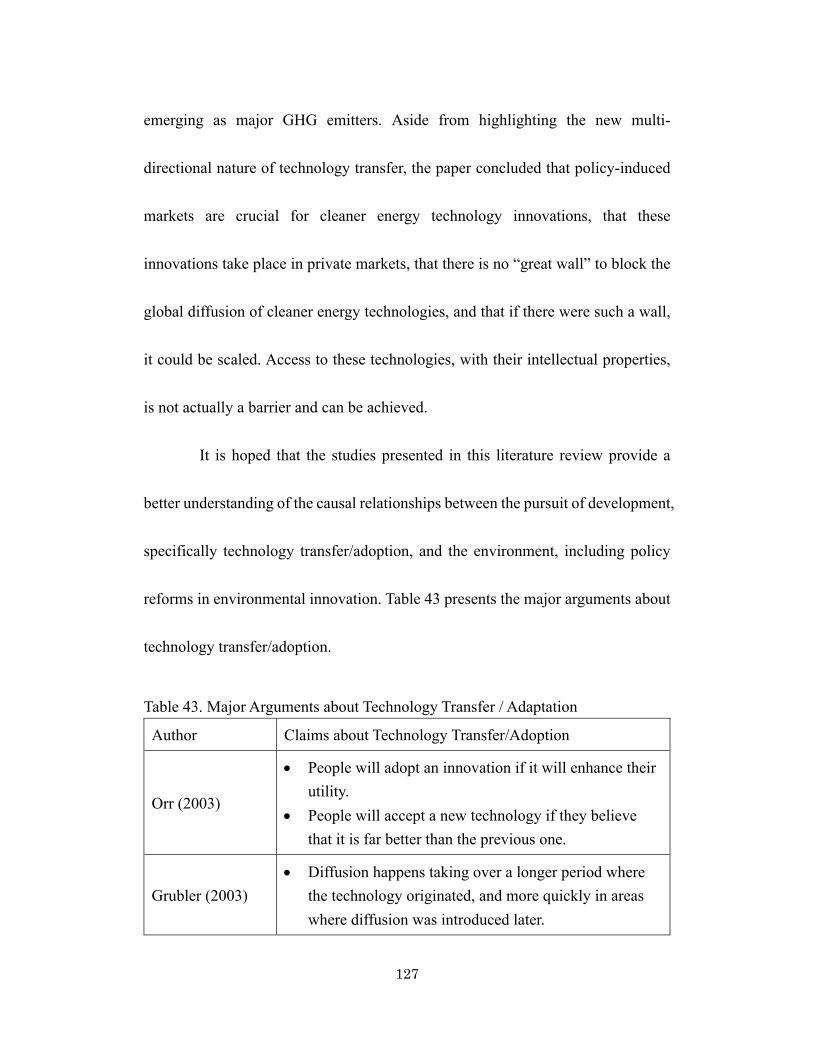
127
emerging as major GHG emitters. Aside from highlighting the new multi-
directional nature of technology transfer, the paper concluded that policy-induced
markets are crucial for cleaner energy technology innovations, that these
innovations take place in private markets, that there is no “great wall” to block the
global diffusion of cleaner energy technologies, and that if there were such a wall,
it could be scaled. Access to these technologies, with their intellectual properties,
is not actually a barrier and can be achieved.
It is hoped that the studies presented in this literature review provide a
better understanding of the causal relationships between the pursuit of development,
specifically technology transfer/adoption, and the environment, including policy
reforms in environmental innovation. Table 43 presents the major arguments about
technology transfer/adoption.
Table 43. Major Arguments about Technology Transfer / Adaptation
Author Claims about Technology Transfer/Adoption
Orr (2003)
• People will adopt an innovation if it will enhance their utility.
• People will accept a new technology if they believe that it is far better than the previous one.
Grubler (2003) • Diffusion happens taking over a longer period where
the technology originated, and more quickly in areas where diffusion was introduced later.
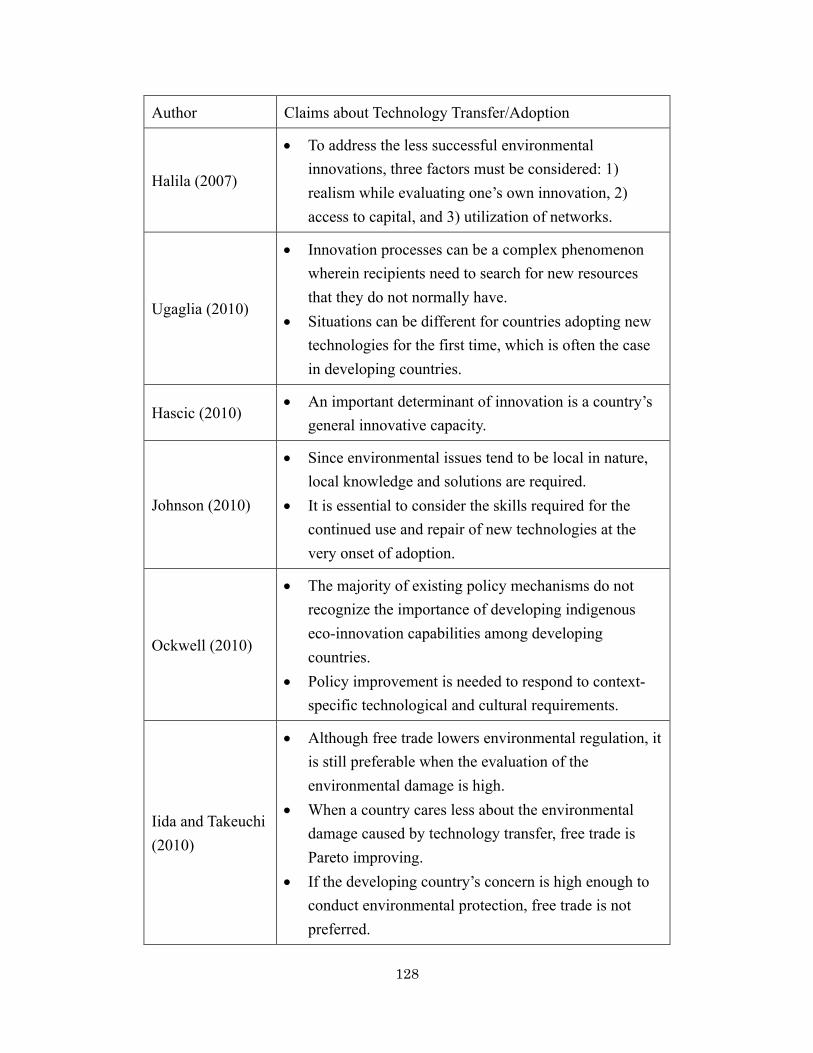
128
Author Claims about Technology Transfer/Adoption
Halila (2007)
• To address the less successful environmental innovations, three factors must be considered: 1) realism while evaluating one’s own innovation, 2) access to capital, and 3) utilization of networks.
Ugaglia (2010)
• Innovation processes can be a complex phenomenon wherein recipients need to search for new resources that they do not normally have.
• Situations can be different for countries adopting new technologies for the first time, which is often the case in developing countries.
Hascic (2010) • An important determinant of innovation is a country’s
general innovative capacity.
Johnson (2010)
• Since environmental issues tend to be local in nature, local knowledge and solutions are required.
• It is essential to consider the skills required for the continued use and repair of new technologies at the very onset of adoption.
Ockwell (2010)
• The majority of existing policy mechanisms do not recognize the importance of developing indigenous eco-innovation capabilities among developing countries.
• Policy improvement is needed to respond to context-specific technological and cultural requirements.
Iida and Takeuchi (2010)
• Although free trade lowers environmental regulation, it is still preferable when the evaluation of the environmental damage is high.
• When a country cares less about the environmental damage caused by technology transfer, free trade is Pareto improving.
• If the developing country’s concern is high enough to conduct environmental protection, free trade is not preferred.

129
Author Claims about Technology Transfer/Adoption
Johnstone (2010)
• Market-based instruments can induce innovation and by encouraging potential innovators to allocate resources to identify the best way of achieving a given environmental objective, and policy flexibility can provide incentives for innovation.
Gallagher (2013)
• Technology transfer also occurs in the north-to-south-to-north, south-to-south, and south-to-north directions, and the ensuing innovation is no longer a local process, but rather happens on a global scale.
5.4. Modified KAYA Identity Analysis to Classify Asian Countries
The original Kaya identity is expressed in the form:
𝐹 = 𝑃 ∗𝐺𝑃∗𝐸𝐺∗𝐹𝐸
Equation 2
where:
F is CO2 emissions from human sources P is population G is GDP E is energy consumption
Therefore,
𝐶𝑂2𝑒𝑚𝑖𝑠𝑠𝑖𝑜𝑛𝑠
= 𝑝𝑜𝑝𝑢𝑙𝑎𝑡𝑖𝑜𝑛 ∗ 𝐺𝐷𝑃𝑝𝑒𝑟𝑐𝑎𝑝𝑖𝑡𝑎 ∗ 𝑒𝑛𝑒𝑟𝑔𝑦𝑐𝑜𝑛𝑠𝑢𝑚𝑝𝑡𝑖𝑜𝑛
𝐺𝐷𝑃
∗𝐶𝑂2𝑒𝑚𝑖𝑠𝑠𝑖𝑜𝑛
𝑒𝑛𝑒𝑟𝑔𝑦𝑐𝑜𝑛𝑠𝑢𝑚𝑝𝑡𝑖𝑜𝑛
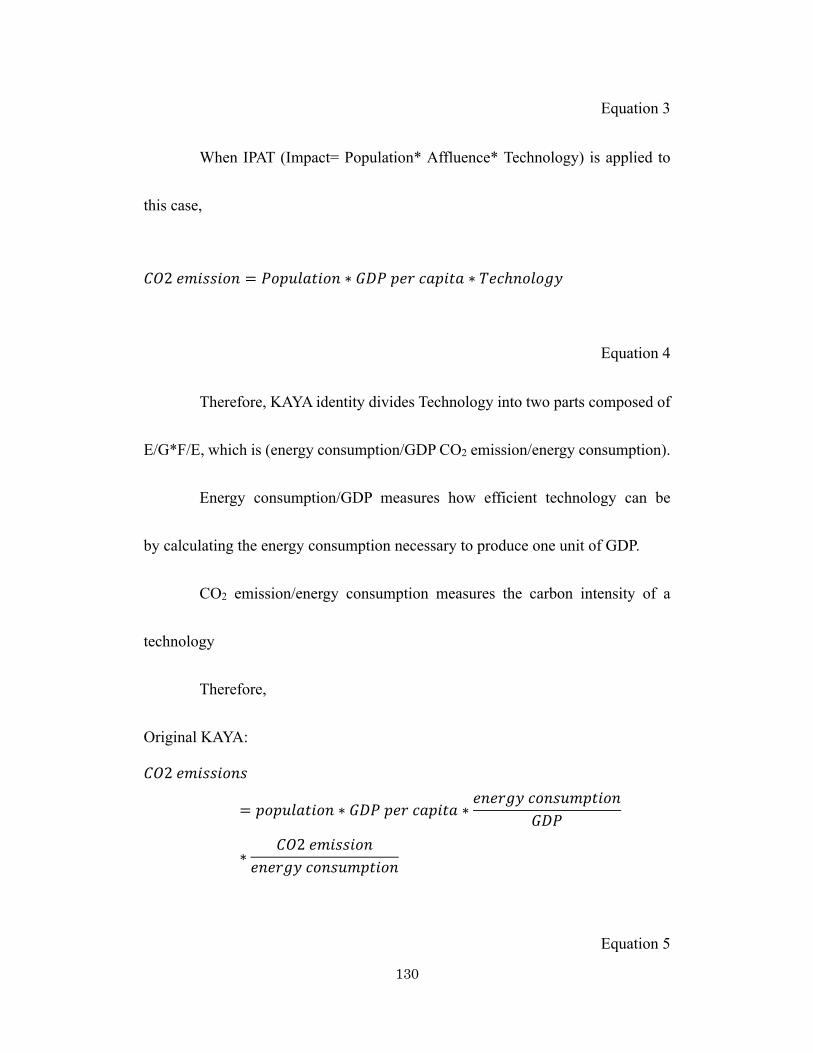
130
Equation 3
When IPAT (Impact= Population* Affluence* Technology) is applied to
this case,
𝐶𝑂2𝑒𝑚𝑖𝑠𝑠𝑖𝑜𝑛 = 𝑃𝑜𝑝𝑢𝑙𝑎𝑡𝑖𝑜𝑛 ∗ 𝐺𝐷𝑃𝑝𝑒𝑟𝑐𝑎𝑝𝑖𝑡𝑎 ∗ 𝑇𝑒𝑐ℎ𝑛𝑜𝑙𝑜𝑔𝑦
Equation 4
Therefore, KAYA identity divides Technology into two parts composed of
E/G*F/E, which is (energy consumption/GDP CO2 emission/energy consumption).
Energy consumption/GDP measures how efficient technology can be
by calculating the energy consumption necessary to produce one unit of GDP.
CO2 emission/energy consumption measures the carbon intensity of a
technology
Therefore,
Original KAYA:
𝐶𝑂2𝑒𝑚𝑖𝑠𝑠𝑖𝑜𝑛𝑠
= 𝑝𝑜𝑝𝑢𝑙𝑎𝑡𝑖𝑜𝑛 ∗ 𝐺𝐷𝑃𝑝𝑒𝑟𝑐𝑎𝑝𝑖𝑡𝑎 ∗𝑒𝑛𝑒𝑟𝑔𝑦𝑐𝑜𝑛𝑠𝑢𝑚𝑝𝑡𝑖𝑜𝑛
𝐺𝐷𝑃
∗𝐶𝑂2𝑒𝑚𝑖𝑠𝑠𝑖𝑜𝑛
𝑒𝑛𝑒𝑟𝑔𝑦𝑐𝑜𝑛𝑠𝑢𝑚𝑝𝑡𝑖𝑜𝑛
Equation 5

131
Modified KAYA to replace GDP with HDI:
𝐺𝐻𝐺 = 𝑝𝑜𝑝𝑢𝑙𝑎𝑡𝑖𝑜𝑛 ∗ 𝐻𝐷𝐼/∗𝐸𝑛𝑒𝑟𝑔𝑦𝑐𝑜𝑛𝑠𝑢𝑚𝑝𝑡𝑖𝑜𝑛
𝑃Q𝐻𝐷𝐼 ∗
𝐺𝐻𝐺𝐸𝑛𝑒𝑟𝑔𝑦𝑐𝑜𝑛𝑠𝑢𝑚𝑝𝑡𝑖𝑜𝑛
Equation 6
Since in the trajectory chapter, the variables focused upon were GHG per
capita and HDI, the equation can be
𝐺𝐻𝐺𝑃 = 𝐻𝐷𝐼 ∗
𝐸𝑛𝑒𝑟𝑔𝑦𝑐𝑜𝑛𝑠𝑢𝑚𝑝𝑡𝑖𝑜𝑛𝑃Q
𝐻𝐷𝐼 ∗𝐺𝐻𝐺
𝐸𝑛𝑒𝑟𝑔𝑦𝑐𝑜𝑛𝑠𝑢𝑚𝑝𝑡𝑖𝑜𝑛
Equation 7
Here, (i) (Energy consumption/P)/HDI is the per capita energy intensity
per HDI, which means the amount of energy per capita when a unit of HDI is
improved. The original KAYA identity used energy consumption/GDP, which
shows how technology can be efficient by calculating the energy consumption
necessary to produce one unit of GDP.
Therefore, this time the part shows how technology can be efficient by
calculating the energy consumption necessary to produce P*HDI (the country’s
sum of HDI).
(ii) GHG/Energy consumption is the GHG intensity, which means the amount of

132
GHG emissions when a unit of energy is consumed.
The original KAYA identity used CO2 emission/energy consumption
which shows the technology used to minimize CO2 emissions while the same
amount of energy is consumed.
Therefore, this time the part shows the technology used to minimize GHG
emissions while the same amount of energy is consumed.
The results of calculating the components are summarized in Table 44.
Three groups of EC/P/HDI are found, as shown in Figure 68 in Appendix 10. In
this way, the group in green is defined as EFFECTIVE; the group in yellow is
defined as MEDIOCRE; and the group in red is defined as INEFFECTIVE.

133
Table 44. Results of the modified KAYA components
Similarly, three groups of GHG/EC are found, as shown in Figure 69. In
this way, the group in green is defined as EFFECTIVE, the group in yellow is
defined as MEDIOCRE, and the group in red is defined as INEFFECTIVE. (In
Malaysia, GHG emissions changed from negative to positive, so it is in the
INEFFECTIVE group). A summary of the countries and their order is shown in
Table 45. Figure 68 and Figure 69 and Table 45 are included as Appendix 10.
Conversely, a summary of each country’s results is shown in Table 46.
Table 45. Summary of the groups and their orders
EC/P/HDI GHG/EC
EFFECTIVE
2 Mongolia
EFFECTIVE
3 Bangladesh
1 Myanmar 2 Myanmar
4 Nepal 1 Nepal
5 Pakistan 5 Sri Lanka
(PRC)
(PRC)
Vietnam
Vietnam

134
3 Philippines 4 Thailand
MEDIOCRE
6 Bangladesh
MEDIOCRE
11 China
(PRC)
8 India 9 India
7 Indonesia 6 Indonesia
9 Sri Lanka 7 Korea
INEFFECTIVE
10 China
(PRC)
10 Mongolia
13 Korea 8 Pakistan
12 Malaysia INEFFECTIVE 14 Malaysia
14 Thailand 12 Philippines
11 Vietnam 13 Vietnam
Table 46. Each country’s result of modified KAYA components
EC/P/HDI GHG/EC
Nepal EFFECTIVE 4 EFFECTIVE 1
Myanmar EFFECTIVE 1 EFFECTIVE 2
Bangladesh MEDIOCRE 6 EFFECTIVE 3
Mongolia EFFECTIVE 2 MEDIOCRE 10
Vietnam INEFFECTIVE 11 INEFFECTIVE 13
China (PRC) INEFFECTIVE 10 MEDIOCRE 11
India MEDIOCRE 8 MEDIOCRE 9
Korea INEFFECTIVE 13 MEDIOCRE 7
Malaysia INEFFECTIVE 12 INEFFECTIVE 14
Thailand INEFFECTIVE 14 EFFECTIVE 4
Indonesia MEDIOCRE 7 MEDIOCRE 6
Pakistan EFFECTIVE 5 MEDIOCRE 8
Philippines EFFECTIVE 3 INEFFECTIVE 12
Sri Lanka MEDIOCRE 9 EFFECTIVE 5
Finally, all the results of the data analysis can be gathered into one figure.
The results, including all of the above three observations on (i) success, (ii) the
identification of the EKC groups, and (iii) the evaluation by the modified KAYA

135
identity, are shown in Figure 70. In Figure 70, the parenthesis shows the three HDI
components (standard deviation) of education, health, and income and the modified
KAYA parameters (energy consumption per person per HDI (EC/P/HDI) and GHG
per energy consumption (GHG/EC)) with their evaluations and rankings.
For example, “Myanmar (50,53,83/186, EC/P/HDI Effective (#1),
GHG/EC Effective (#2))” shows that Myanmar’s HDI components indicated by
standard deviations among Asian countries were (i) education = 50, (ii) health = 53,
and (iii) income = 83. The total was 186. This means that Myanmar’s education
showed average improvement when compared to that of other Asian countries; its
health improved a little more than average; and its income showed a significant
improvement. Since income was the driver of its HDI improvement, Myanmar is
in the “income” box under “very successful” among the HDI categories. Moreover,
Myanmar showed an effective EC/P/HDI and was the best of the Asian countries;
GIG/EC was also effective and was the second best among the Asian countries.

136
Figure 70. Final Results of Evaluation of Each Asian Country
Very successful countries (Myanmar and Nepal): Myanmar was identified
as a very successful country because it showed (i) very successful improvement in
HDI and (ii) very successful improvement in GHG emissions, with (iii) the driver
of the HDI improvement being income improvement, and because (iv) GHG
emissions improved because of effective EC/P/HDI and effective GHG/EC. Nepal
was also identified as a very successful country because it showed (i) successful
improvement in HDI and (ii) very successful improvement in GHG emissions, with
Education Health Income Education Health Income Education Health Income Education Health Income
very successful
Myanmar (50,53,83/186, EC/P/HDI effective(#1), GHG/EC effective(#2)), NonDLHE(reform)
Nepal (60,68,53/181, EC/P/HDI effective(#4), GHG/EC effective(#1)), NonDLHE(Agri&LUCF)
Mongolia (61,55,60/175, EC/P/HDI effective(#2), GHG/EC mediocre(#10)), NonDLHE(LUCF)
successful
Bangladesh (57,62,61/180, EC/P/HDI mediocre(#6), GHG/EC effective(#3)), DLHE(newCO2)
Pakistan (52,51,50/153, EC/P/HDI effective(#5), GHG/EC mediocre(#8)), DLHE(domCO2)
Philippines (36,47,50/133, EC/P/HDI effective(#3), GHG/EC ineffective(#12)),DLHE(domCO2) Sri Lanka (47,50,62/159,EC/P/HDI mediocre(#9), GHG/EC effective(#5)), DLHE(yetCO2)
marginal
Vietnam(58,51,70/179, EC/P/HDI ineffective(#11), GHG/EC ineffective(#13)), DLHE(newCO2)India (55,56,66/176, EC/P/HDI mediocre(#8), GHG/EC mediocre(#9)), DLHE(domCO2)
Thailand (63,47,59/169, EC/P/HDI ineffective(#14), GHG/EC effective(#4)), DLHE(domCO2)
Indonesia (47,55,58/160, EC/P/HDI mediocre(#7), GHG/EC mediocre(#6)), DLHE(LUCF)
unsuccessful
China(PRC)(56,52,89/197, EC/P/HDI ineffective(#10), GHG/EC mediocre(#11)), DLHE(domCO2)
Korea(53,61,63/177, EC/P/HDI ineffective(#13), GHG/EC mediocre(#7)), DLHE(domCO2)
Malaysia (52,48,59/159, EC/P/HDI ineffective(#12), GHG/BC ineffective(#14)), DLHE(LUCF-+)
HDI (education, health, income)
GHG
very successful successful marginal unsuccessful
137
(iii) the driver of the HDI improvement being health improvement, and because (iv)
GHG emissions improved because of effective EC/P/HDI and effective GHG/EC.
Successful countries (Mongolia and Bangladesh): Mongolia was identified
as a successful country because it showed (i) marginal improvement in HDI but (ii)
very successful improvement in GHG emissions, with (iii) the driver of the HDI
improvement being education improvement, and because (iv) GHG emissions
improved because of effective EC/P/HDI, while GHG/EC was not impressive.
Bangladesh was identified as a successful country because it showed (i) successful
improvement in HDI and (ii) successful improvement in GHG emissions, with (iii)
the driver of the HDI improvement being health improvement, and because (iv)
GHG emissions improved because of effective GHG/EC, while EC/P/HDI was not
impressive.
Unsuccessful DLHE countries because of unsuccessful HDI (Pakistan, the
Philippines, and Sri Lanka): Pakistan was identified as an unsuccessful DLHE
country because of unsuccessful HDI since it showed (i) marginal improvement in
HDI with (ii) successful improvement in GHG emissions; (iii) the driver of the HDI
improvement was education improvement, and (iv) GHG emissions improved
because of effective EC/P/HDI, while GHG/EC was not impressive. The

138
Philippines was identified as an unsuccessful DLHE country because of
unsuccessful HDI since it showed (i) marginal improvement in HDI with (ii)
successful improvement in GHG emissions; (iii) the driver of the HDI improvement
was income improvement, and (iv) GHG emissions improved because of effective
EC/P/HDI, while GHG/EC was ineffective. Sri Lanka was identified as an
unsuccessful DLHE country because of unsuccessful HDI since it showed (i)
marginal improvement in HDI with (ii) successful improvement in GHG emissions;
(iii) the driver of the HDI improvement was income improvement, and (iv) GHG
emissions improved because of effective GHG/EC, while EC/P/HDI was not
impressive.
Unsuccessful DLHE countries because of unsuccessful GHG (Vietnam,
India, and China (PRC)): Vietnam was identified as an unsuccessful DLHE country
because of unsuccessful GHGs since it showed (i) successful improvement in HDI
with (ii) marginal improvement in GHG emissions; (iii) the driver of the HDI
improvement was income improvement, and (iv) GHG emissions improved
marginally because of ineffective EC/P/HDI and GHG/EC. India was identified as
an unsuccessful DLHE country because of unsuccessful GHGs since it showed (i)
successful improvement in HDI with (ii) marginal improvement in GHG emissions;
139
(iii) the driver of the HDI improvement was income improvement, and (iv) GHG
emissions improved marginally because of unimpressive EC/P/HDI and GHG/EC.
China (PRC) was identified as an unsuccessful DLHE country because of
unsuccessful GHGs since it showed (i) very successful improvement in HDI with
(ii) marginal improvement in GHG emissions; (iii) the driver of the HDI
improvement was income improvement, and (iv) GHG emissions did not improve
because of ineffective EC/P/HDI, while GHG/EC was not impressive.
Unsuccessful DLHE countries because of a lack of success in both HDI
and GHGs (Thailand, Indonesia, Malaysia, the Republic of Korea): Thailand was
identified as an unsuccessful DLHE country because of its lack of success in both
HDI and GHGs, since it showed (i) marginal improvement in HDI and (ii) marginal
improvement in GHG emissions. (iii) The driver of the HDI improvement was
education improvement, and (iv) GHG emissions improved marginally because of
ineffective EC/P/HDI, while GHG/EC was effective. Indonesia was identified as
an unsuccessful DLHE country because of its lack of success in both HDI and
GHGs, since it showed (i) marginal improvement in HDI and (ii) marginal
improvement in GHG emissions. (iii) The driver of the HDI improvement was
income improvement, and (iv) GHG emissions improved marginally because of
140
unimpressive EC/P/HDI and GHG/EC. Malaysia was identified as an unsuccessful
DLHE country because of its lack of success in both HDI and GHGs, since it
showed (i) marginal improvement in HDI and (ii) unsuccessful improvement in
GHG emissions. (iii) The driver of the HDI improvement was income improvement,
and (iv) GHG emissions did not improve because of ineffective EC/P/HDI and
GHG/EC. The Republic of Korea was identified as an unsuccessful DLHE country
because of unsuccessful GHGs, since it showed (i) marginal improvement in HDI
with (ii) marginal improvement in GHG emissions. (iii) The driver of the HDI
improvement was income improvement, and (iv) GHG emissions did not improve
because of ineffective EC/P/HDI, while GHG/EC.

141
CHAPTER 6. PROFILE REVIEW OF THE SUCCESSFUL COUNTRIES
This section gives more detailed observations regarding the very
successful countries (Myanmar and Nepal) and the successful countries (Mongolia
and Bangladesh). The discussion will cover what happened in these countries to
lead them to success during this period.
6.1. Overview of Countries
6.1.1. Myanmar
Myanmar’s overview, based on the data analysis, is as follows:
1. The HDI improvements by standard deviation scores were (i) education =
50, (ii) health = 53, and (iii) income = 83, for a total of 186.
2. The indicators given by the modified KAYA analysis were EC/(P*HDI)
Effective(#1), GHG/EC Effective(#2)).
3. The country was classified as Non-DLHE(reform), and GHG emissions
decreased during the period.
4. The country was classified as a very successful country because of both its
very successful HDI improvement and its GHGpc improvement.
5. CO2 was not significant in the period (less than 5% of GHG throughout the
period).

142
6. LUCF, CH4, N2O, and the agriculture sector were significant contributors,
but emission increases were not remarkable after a drastic drop in 1995-
2000. During these years, Myanmar was in a period of military rule;
democratic reforms occurred beginning in 2011.
Myanmar’s remarkable improvement in HDI during the period was
achieved mainly by an income increase (see Figure 71 and Figure 72 in Appendix
11).
When we look at Myanmar’s GHGpc achievement, its success appears to
come from the KAYA components (see Figure 73 and Figure 74 in Appendix 11).
Myanmar was categorized in the group of effective countries (in fact, it was the
best in Asia) for EC/(P*HDI) (0.66), and also in the group of effective countries (in
fact, it was the second best in Asia) for GHG/EC (0.68).
This information means that (i) Myanmar was very effective at increasing
HDI as a nation to consume less energy, and (ii) Myanmar was able to emit fewer
GHGs while consuming less energy because of technology choices.
Another observation is that Myanmar improved both of the parameters of
EC/(P*HDI) and GHG/EC; GHGpc also decreased at a similar rate.
The GHGpc decrease in Myanmar was essentially caused by the reduction

143
of GHGs in this period that occurred because of the reductions of LUCF and the
gases from agriculture (CH4 and N2O), while the population increased (see Figure
75, Figure 76, Figure 77 and Figure 78 in Appendix 11).
EC/(P*HDI) decreased since the energy consumption increased relatively
little during the period, while the population and the HDI both increased.
GHG/EC also became smaller since GHGs decreased during the period
while energy consumption increased, because GHG emissions in Myanmar during
the period were not linked to or strongly influenced by the energy sector. Figures
71–78 are included in Appendix 11.
6.1.2. Nepal
Nepal’s overview, based on the data analysis, is as follows:
1. The HDI improvements by standard deviation scores were (i) education =
60, (ii) health = 68, and (iii) income = 54, for a total of 181.
2. The indicators given by the modified KAYA analysis were EC/(P*HDI)
Effective(#4), GHG/EC Effective(#1)).
3. The country was classified as Non-DLHE(Agri&LUCF), and GHG
emissions were dominated by agriculture and LUCF during the period.
4. The country was classified as a very successful country because of its very

144
successful GHGpc improvement and its successful HDI improvement.
5. CO2 was not significant in this period (less than 10% of GHGs throughout
the period).
6. LUCF, CH4, and the agriculture sector were significant contributors.
Nepal’s remarkable HDI improvement during the period was achieved
mainly through an improvement in health (see Figure 79 and Figure 80 in Appendix
12). There were four other countries in which the social component (education or
health) was the driver of the development: Thailand (Income = 59, Education = 63,
Health = 47), Bangladesh (Income = 61, Education = 57, Health = 62), Mongolia
(Income = 60, Education = 61, Health = 55), and Pakistan (Income = 50, Education
= 52, Health = 51). Other than Nepal, one other country had Health as the driver
(Bangladesh), while the other countries had Education as the driver (Thailand,
Pakistan, Mongolia). Nepal, Bangladesh and Mongolia, however, were the only
successful countries. Bangladesh, Mongolia, and Pakistan, but not Thailand, did
not actually have an outstanding component, since the gaps between the top
component and the bottom component are equal to or less than 6, while Nepal’s
health component and Thailand’s education component were much bigger than the
other two components.(Nepal’s Health component was 68, which was 8 points
145
higher than its Education component and 15 points higher than its Income
component, and Thailand’s Education component was 63, which was 4 points
higher than its Income component and 16 points higher than its Health component).
This type of improvement put Nepal in a special position as a very successful
country, since Thailand was not categorized as a successful country. There was no
successful country in which the Education component was the driver of
development, but this does not mean that Education was not needed for success,
since Nepal, Mongolia and Bangladesh also recorded high Education component
improvements.
As seen in the final result map, a difference between Nepal’s development
and the other countries’ development came from the GHGpc or HDI trajectory,
since Nepal was categorized as a very successful country for GHGpc and as a
successful country for HDI, while some of the others scored as successful on HDI
but unsuccessful on GHGpc (Sri Lanka), or scored as successful on HDI but
marginal on GHGpc (India, Vietnam).
When we attempt to discover why Nepal had very successful GHGpc, the
reason turns out to lie in the KAYA components (see Figure 81 and Figure 82 in
Appendix 12). While Nepal was categorized in the group of effective countries
146
(fourth in Asia) for EC/(P*HDI) (0.89), and also in the group of effective countries
(in fact, it was the best in Asia) for GHG/EC (0.42) when they were calculated with
the total GHG emissions including LUCF (Mt CO2e), the categorization of Nepal’s
GHG/EC becomes different when they are calculated with the total GHG emissions
excluding LUCF (see Figure 83 and Figure 84 in Appendix 12). The value of
GHG/EC went down from 0.42 to 0.87 which was the best in Asia out of 14
countries (see Figure 46). This shows that Nepal’s very successful performance on
GHGpc was achieved by a GHG reduction caused by the reduction of GHGs from
LUCF, starting in 2000 (see Figures 85-88 in Appendix 12). In Myanmar, it was
also observed that the GHGs from LUCF dropped during the period, but not as
great an extend as did those in Nepal. No other country showed a similar trajectory.
The GHGpc decrease in Nepal was clearly caused by the reduction of
GHGs in this period that occurred because of the reductions of LUCF, while the
population increased. EC/(P*HDI) became smaller since energy consumption
increased little during the period, while its population and HDI both increased.
GHG/EC also became smaller since GHGs decreased during the period
because of the large decrease in GHGs from LUCF while energy consumption
increased. GHG emissions in Nepal during the period were not linked to or strongly

147
influenced by the energy sector because the GHG increase from the energy sector
was not influenced by emissions from electricity/heat, as was the case in China
(PRC) and other countries. As pointed out above in the observation for Myanmar
(see Figure 89 in Appendix 12), electricity in Nepal is mainly sourced from
hydropower. Figures 79-89 are included as Appendix 12.
6.1.3. Mongolia
Mongolia’s overview from the data analysis is as follows:
1. The HDI improvements by standard deviation scores were (i) education =
55, (ii) health = 61, and (iii) income = 60, for a total of 175.
2. The indicators given by the modified KAYA analysis were EC/(P*HDI)
Effective(#2), GHG/EC Mediocre(#10)).
3. The country was classified as Non-DLHE(LUCF), and GHG emissions
were dominated by LUCF.
4. The country was classified as a successful country because of its very
successful GHGpc improvement, even though its HDI improvement was
marginal.
5. LUFC was the dominant source of its GHG emissions from 1990-2005. All
other GHG emissions were stable or even decreased between 1990 and 2000.
148
6. CO2, CH4, and N2O started to increase in 2005 because of the agricultural
sector, electricity/heat, manufacturing/construction, and other fuel
combustion.
As seen in the final result map, Mongolia’s trajectories showed that it was in the
very successful group for GHGpc but in the marginal group for HDI improvement.
This means that Mongolia’s success came mainly from the very successful track
record of its GHGpc. Figure 90, Figure 91, Figure 92, Figure 93, Figure 94, Figure
95 in Appendix 13 show that during the period, little change related to GHG
emissions occurred in Mongolia. From 1990 to 2005, the GHG emissions actually
decreased because of the decrease in CO2 produced by the energy industry (because
of the decrease from manufacturing/heat), and starting in 2005, CO2, CH4, and N2O
increased because of the increases in the agriculture and energy sectors (because of
the increases from electricity/heat and manufacturing/construction). In the end, the
total emissions in 2010 were almost the same as the emissions in 1990. LUCF was
the dominant source of emissions and remained stable during the period. These
facts mean that while GHG emissions stayed the same, the population increased,
and therefore GHGpc went down (see Figure 96 and Figure 97 in Appendix 13).
HDI improved during the period, with the education and income components as its
149
drivers, but the country was categorized in the marginal HDI improvement group –
it did not show as significant an improvement as did Myanmar and Nepal. Figures
90-97 are in Appendix 13.
When it comes to the modified KAYA parameters, EC/(P*HDI) was
Effective (#2), which is reasonable since energy consumption did not increase
during the period, while the population increased and HDI increased mildly and
insignificantly. Its GHG/EC was in the Mediocre group (#10)). It went up
(worsened) from 1990 to 2000, and then went down to the same value in 2010. This
happened because of the decrease in energy consumption, as mentioned above, due
to a decrease in manufacturing/construction.
We can conclude that Mongolia’s success was caused by the lack of change
in emissions (they went down from 1990 to 2005 and recovered from 2005 to 2010),
while HDI slightly but marginally increased.
6.1.4. Bangladesh
Bangladesh’s overview, based on the data analysis, is as follows:
1. The HDI improvements by standard deviation scores were (i) education =
57, (ii) health = 62, and (iii) income = 61, for a total of 180.
2. The indicators given by the modified KAYA analysis were EC/(P*HDI)
150
Mediocre (#6), GHG/EC Effective (#3)).
3. The country was classified as DLHE(new CO2), and its CO2 emission had
recently been rising.
4. The country was classified as a successful country because of both its
successful HDI and GHG.
5. The main source of emissions was CO2 from the energy sector, including
electricity/heat, manufacturing/construction, transportation and other fuel
combustion, even though CH4 from agriculture and LUCF were the main
sources in 1990.
6. The main emitter of CO2 from the energy sector was electricity/heat.
Bangladesh was successful because it was in the successful improvement
group for both HDI and GHGpc. Bangladesh’s improvement in HDI during the
period was achieved mainly through income and health increases (see Figure 98
and Figure 99 in Appendix 14). This type of balanced improvement (the small gap
between the top and bottom HDI components is as small as 6) was only observed
in Bangladesh, Mongolia, and Pakistan, but Bangladesh’s HDI improvement was
bigger than those of Mongolia and Pakistan. (Bangladesh was in the successful
improvement group, while Mongolia and Pakistan were in the marginal

151
improvement group.) As seen in the final result map, Bangladesh’s HDI
improvement was the same as Nepal’s, but Bangladesh was worse than Nepal when
it came to GHGpc improvement. Compared with Mongolia, Nepal had better HDI
improvement but worse GHGpc improvement. Bangladesh showed better
improvements in Income and Health than Mongolia, and its income component was
even better than Nepal’s.
As for its GHGpc trajectory, Bangladesh had similar continuous increases
in GHGs and population until 2000, but starting in 2000, the speed of the increase
in GHGs became faster than the increase in the population, and therefore GHGpc
worsened (see Figure 100 and Figure 101 in Appendix 14).
Bangladesh’s EC/(P*HDI) was in the Mediocre group (#6) and its
GHG/EC was in the Effective group (#3). Its EC/(P*HDI) was mediocre, while its
GHG/EC showed an effective result. These facts mean that (i) the energy
consumption increase was not great enough to improve the country’s HDI
(Bangladesh needed more energy to improve its HDI), but (ii) the energy was
consumed in an efficient way as regards the emission of GHGs (Bangladesh was
efficient in emitting GHGs by consuming smaller amounts of energy).
Another observation is that while Bangladesh’s GHGpc and EC/(P*HDI)
152
stayed the same from 1990 to 2000, they went up from 2000 to 2010 in almost the
same ratio. This means that a change occurred that sped up GHG emissions and
energy consumption around 2000. In contrast, GHG/EC continuously improved
from 1990 to 2010.
Regarding the change around 2000, while the emissions from LUCF
slowly and mildly decreased through the period, those gases – CO2, CH4 and N2O
– increased. CO2 in particular increased at a faster pace starting in 2000 (see Figure
102 and Figure 103 in Appendix 14). The majority of this CO2 increase came from
the energy industry, while the increases in CH4 and N2O came from agriculture (see
Figure 104 in Appendix 14). The majority of the CO2 from the energy industry
came from electricity/heat, and the sudden increase in CO2/the energy industry in
2000 was linked to the sudden increase in GHGs from electricity/heat (see Figure
105 in Appendix 14). However, the parameters related to HDI did not respond to
this sudden increase around 2000. Figures 98-105 are included in Appendix 14.
6.2. Findings from Comparisons
In this section, we will compare countries with each other and with China
(PRC) by analyzing the components of HDI, GHGpc, and the Kaya identity to

153
clarify what were the keys of their differences.
Myanmar’s standard deviation scores of the HDI improvement for the
components were Income = 83, Education = 53, Health = 50. However, this type of
improvement was not enough to make Myanmar a very successful country, since
similar improvement was also observed in China (PRC) (Income = 89, Education
= 56, Health = 52). As seen in the final result map (Figure 70), the difference
between Myanmar’s development and China (PRC)’s came from the GHGpc
trajectory, since Myanmar was categorized as a very successful country for both
HDI and GHGpc, while China (PRC) was categorized as a very successful country
for HDI but unsuccessful country for GHGpc.
When we look at the difference in GHGpc, they can be attributed to the
range in the modified KAYA components (see Figure 73, and Figure 74 for
Myanmar, and Figure 106 and Figure 107 for China (PRC)). Myanmar was
categorized in the group of effective countries, with a score for EC/(P*HDI) of 0.66
was the best in Asia. In the group of effective countries with a score for GHG/EC
of 0.68 was the second best in Asia. China (PRC) was categorized in the group of
ineffective countries with a score for EC/(P*HDI of 1.76, it ranked 10th in Asia. In
the group of mediocre countries with a score for GHG/EC of 1.07, it ranked 11th

154
in Asia.
These facts mean that (i) while Myanmar was efficient at increasing HDI
as a nation while consuming relatively little energy, China (PRC) needed to
consume much more energy to increase its HDI; and (ii) Myanmar was efficient at
emitting relatively low amounts of GHGs by consuming energy while China (PRC)
emitted high levels of GHGs by consuming energy.
Another observation is that while Myanmar improved both the parameters
of EC/(P*HDI) and GHG/EC, and its GHGpc went down in almost the same ratio
(see Figure74), China (PRC) worsened for each of the parameters, particularly
EC/(P*HDI). EC/(P*HDI) was modestly effective through 1990-2000, but from
2000 to 2010, it worsened significantly. GHGpc seems to have worsened because
of this parameter (see Figure 107).
The GHGpc decrease in Myanmar was essentially caused by the reduction
of GHGs because of the reductions of LUCF and the gases from agriculture (CH4
and N2O) while the population increased (see Figure 73, Figure 75, and Figure 77).
EC/(P*HDI) became smaller, since energy consumption increased
relatively little during the period, while Myanmar’s population and HDI both
increased (see Figure 73 and Figure 77).
155
GHG/EC also became smaller, since GHGs decreased during the period
while energy consumption increased, since GHG emissions in Myanmar during the
period were not linked to or strongly influenced by the energy sector.
From these observations, three questions emerge:
(i) What differences in China (PRC) between 1990-2000 and 2000-2010
explain why the EC/(P*HDI) in China (PRC) suddenly worsened in the
second decade?
(ii) Why was Myanmar’s HDI, particularly its income component, able to
increase with decreasing agricultural emissions (CH4 and N2O) and
with decreasing LUCF, and with little increase from the energy and
industrial sectors?
(iii) Are any salient observations found when these two countries and others
are compared?
Mongolia, Pakistan, and Philippines were in the effective group with
Myanmar for EC/(P*HDI), but GHG/EC became worse in the countries in the
mediocre group (Mongolia, Pakistan and China (PRC)) and in the ineffective group
(the Philippines). Bangladesh, Sri Lanka, and Thailand were in the effective group
with Myanmar for GHG/EC, but EC/(P*HDI) became worse in the mediocre group

156
(Bangladesh and Sri Lanka) and in the ineffective group (Thailand, China (PRC)).
Regarding question (i), clear differences between 1990-2000 and 2000-
2010 are found in the trajectory of China (PRC) (see Figure 108, Figure 109, Figure
110, Figure 111, Figure 112, and Figure 113 in Appendix 15). From year 2000, CO2
drastically increased because of large increases in the emissions from the energy
and industrial process sectors. The increase in emissions from the energy sector was
caused by greater use of electricity/heat and manufacturing/construction. The same
trajectory was also observed in Bangladesh (from 2000), India (from 2005),
Indonesia (from 1990), the Republic of Korea (from 1990), Malaysia (from 1990),
Pakistan (from 1990), the Philippines (from 1990, from electricity/heat and
transport instead of manufacturing), Sri Lanka (from 1995, from electricity/heat
and transport instead of manufacturing), Thailand (from 1990), and Vietnam (from
2000). These are all DLHE countries, and all except Bangladesh showed
“unsuccessful development.”.
Regarding question (ii), it is necessary to do a deeper and more detailed
assessment of Myanmar’s development through the period. This assessment will be
done later in section 6.4.1.
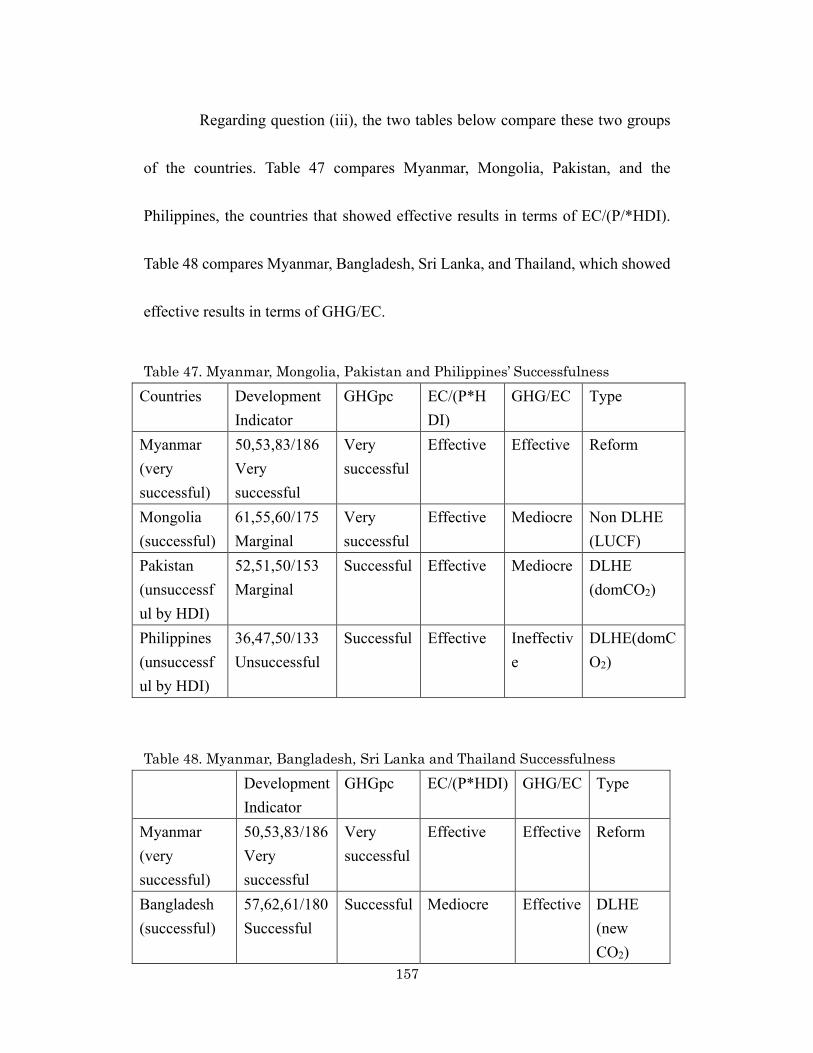
157
Regarding question (iii), the two tables below compare these two groups
of the countries. Table 47 compares Myanmar, Mongolia, Pakistan, and the
Philippines, the countries that showed effective results in terms of EC/(P/*HDI).
Table 48 compares Myanmar, Bangladesh, Sri Lanka, and Thailand, which showed
effective results in terms of GHG/EC.
Table 47. Myanmar, Mongolia, Pakistan and Philippines’ Successfulness
Countries Development Indicator
GHGpc EC/(P*HDI)
GHG/EC Type
Myanmar (very successful)
50,53,83/186 Very successful
Very successful
Effective Effective Reform
Mongolia (successful)
61,55,60/175 Marginal
Very successful
Effective Mediocre Non DLHE (LUCF)
Pakistan (unsuccessful by HDI)
52,51,50/153 Marginal
Successful Effective Mediocre DLHE (domCO2)
Philippines (unsuccessful by HDI)
36,47,50/133 Unsuccessful
Successful Effective Ineffective
DLHE(domCO2)
Table 48. Myanmar, Bangladesh, Sri Lanka and Thailand Successfulness
Development Indicator
GHGpc EC/(P*HDI) GHG/EC Type
Myanmar (very successful)
50,53,83/186 Very successful
Very successful
Effective Effective Reform
Bangladesh (successful)
57,62,61/180 Successful
Successful Mediocre Effective DLHE (new CO2)
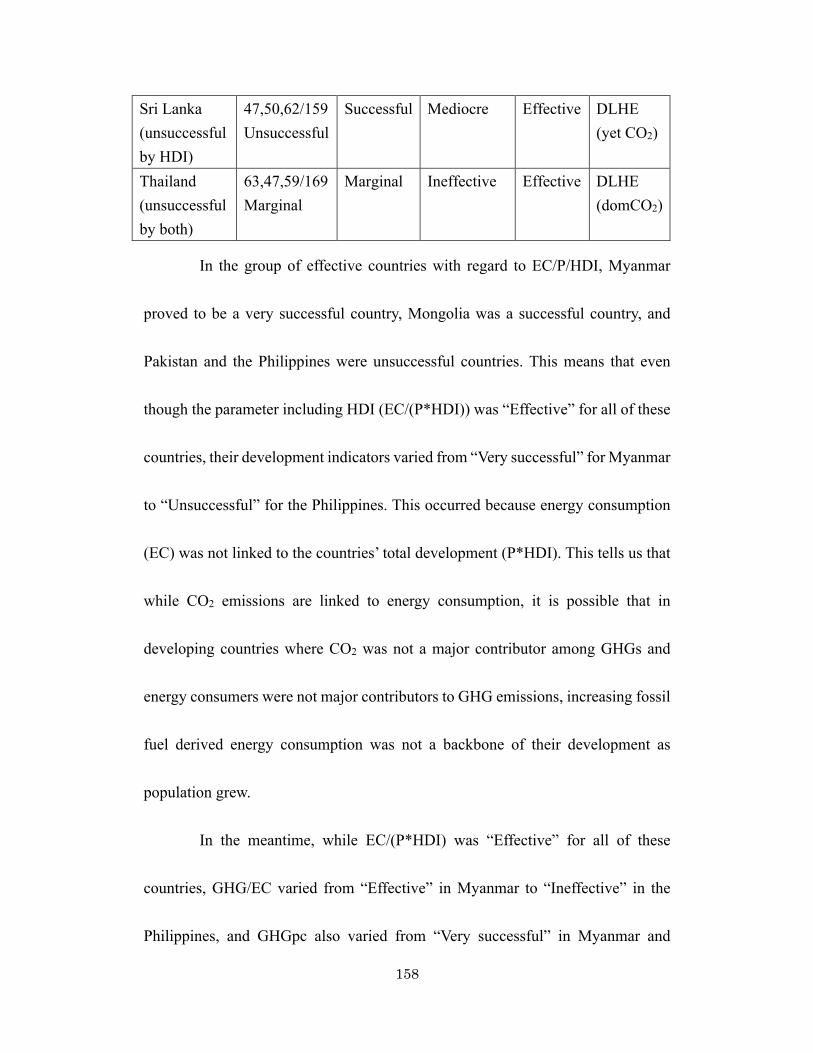
158
Sri Lanka (unsuccessful by HDI)
47,50,62/159 Unsuccessful
Successful Mediocre Effective DLHE (yet CO2)
Thailand (unsuccessful by both)
63,47,59/169 Marginal
Marginal Ineffective Effective DLHE (domCO2)
In the group of effective countries with regard to EC/P/HDI, Myanmar
proved to be a very successful country, Mongolia was a successful country, and
Pakistan and the Philippines were unsuccessful countries. This means that even
though the parameter including HDI (EC/(P*HDI)) was “Effective” for all of these
countries, their development indicators varied from “Very successful” for Myanmar
to “Unsuccessful” for the Philippines. This occurred because energy consumption
(EC) was not linked to the countries’ total development (P*HDI). This tells us that
while CO2 emissions are linked to energy consumption, it is possible that in
developing countries where CO2 was not a major contributor among GHGs and
energy consumers were not major contributors to GHG emissions, increasing fossil
fuel derived energy consumption was not a backbone of their development as
population grew.
In the meantime, while EC/(P*HDI) was “Effective” for all of these
countries, GHG/EC varied from “Effective” in Myanmar to “Ineffective” in the
Philippines, and GHGpc also varied from “Very successful” in Myanmar and
159
Mongolia to “Successful” in Pakistan and the Philippines. This seems to indicate
that the total energy consumption including fossil fuel consumptions increases
when the population increases.
In the group of effective countries on GHG/EC, Myanmar ended up a very
successful country, Bangladesh was a successful country, and Sri Lanka and
Thailand were unsuccessful countries. This means that even though the parameter
including GHG (GHG/EC) was “Effective” for all of these countries, the GHGpc
indicators for these four countries varied from “Very successful” in Myanmar to
“Marginal” for Thailand. This was because the total energy consumption including
fossil fuel consumptions was not linked to population growth. Even though it was
observed from a comparison of Myanmar, Mongolia, Pakistan, and the Philippines
that there seems to be a tendency for the total energy consumption including fossil
fuel consumptions to increase when the population increases, the comparison of
Myanmar, Bangladesh, Sri Lanka, and Thailand tells us that even though their
populations increased, some countries were able to maintain a favorable GHG/EC.
This tells us that while CO2 emissions are linked to energy consumption, it was
possible that in developing countries where CO2 was not a major contributor to

160
GHGs and energy consumers were not major contributors to GHG emissions,
increased fossil fuel consumption was not a backbone of their development.
In the meantime, while GHG/EC was “Effective” for all of these countries,
EC/(P*HDI) varied from “Effective” in Myanmar to “Ineffective” in Thailand. The
development indicator also varied from “Very successful” in Myanmar to
“Unsuccessful” in Sri Lanka, but it was not linked to EC/(P*HDI), since Sri Lanka
was “Unsuccessful” for the development indicator but “Mediocre” for EC/(P*HDI),
while Thailand was “Marginal” for the development indicator but “Ineffective” for
EC/(P*HDI). This demonstrated that when the population increased, the total
energy consumption including fossil fuel consumptions was not linked to its
development.
6.3. What Happened in the Successful Countries During the 1990-2010 Period?
In this section, efforts will be done to find out what kind of historical
events and policy changes happened corresponding to those trajectories found by
those data analysis to find out background stories of the successes.
6.3.1. Myanmar
According to the BBC News website (Myanmar profile – Timeline, 1942-
161
2016 2017), Myanmar’s history can be divided into 15 periods as follows:
(i) Japanese occupation (1942-1947)
(ii) Independence (1948-1960)
(iii) One-party, military-led state (1962-1982)
(iv) Riots and repression (1987-1989)
(v) Thwarted elections (1990-1997)
(vi) Release of pro-democracy supporters (1998-2001)
(vii) Conflicting signals (2002-2004 May)
(viii) New capital (2004 October-2007 June)
(ix) Public unrest (2007 August-2008 April)
(x) Cyclone (2008 May-2009 May)
(xi) Aung San Suu Kyi trial (2009 August-2011 January)
(xii) Junta retires to wings (2011 March-2012 January)
(xiii) Partly-free elections held (2012 April-2012 September)
(xiv) Foreign ties (2012 November-2015 February)
(xv) Peace hopes (2015 March–recent (2016 March))
The research period from 1990 to 2010 corresponds to the period (v)-(xi).
To explain in more detail, the research period is divided into four periods: Period

162
#1 (1990-1994), Period #2 (1995-1999), Period #3 (2000-2004), and Period #4
(2005-2010), in addition to Period #0 (before 1990) and Period #5 (after 2010), as
shown in Figure 114.
Appendix 16 details notable events in Myanmar during each period. As
summarized in the Table 49, before the start of the research period in 1990, the
country lacked political stability and peace. During Periods #1 and #2 (1990-1999),
some indications of political stability (movement in the direction of democracy)
were observed. Stability and peace were not completely achieved until 2010, when
this study focused. The ODA was also stagnant during the research period and never
returned to the level of ODA given during the period from 1986 to 1990, as the
table shows, even though the ODA given during Period #4 went up. This rise in
Period #4 is presumably linked to the cyclone that hit in 2008 (see Table 50).
This information shows that Myanmar’s (i) political instability, (ii)
slow movement toward democracy, and (iii) stagnant ODA during the research
period of 1990-2010 did not have a negative impact on “successful development”
in Myanmar. This means that Myanmar’s “successful development” was achieved
without (i) political stability, (ii) democracy, or (iii) leapfrogging toward a low-
carbon society made possible by drastic imports of state-of-the-art technologies
163
from developed countries.
During the research period (1990-2010), Myanmar’s remarkable
improvement in HDI was achieved mainly through an income increase. In the
meantime, the GHGpc decrease in Myanmar was largely caused by the reduction
of GHGs in this period that occurred because of the reductions of emissions from
LUCF and the gases from agriculture CH4 and N2O, even as the population
increased. The decreased emissions from LUCF may be a result of laws and rules
related to forestry through during the period 1992-95.13 These data showed that
sector activities in Myanmar shifted out of agriculture and forestry without
damaging its economy.
Questions
From these observations, a question emerges: Why was Myanmar’s HDI,
particularly its income component, able to increase while its sector activities shifted
away from agriculture and forestry (CH4 and N2O, and with decreasing LUCF) with
little increase in CO2 from the energy and industrial sectors, and also without
political stability, peace or increased ODA? This question will be addressed in
chapter 7.7.
13 The Forest Law (1992), Myanmar Forest Policy, Forest Rules, Community Forestry Instruction (1995)
164
6.3.2. Nepal
According to the BBC News website (Nepal profile – Timeline, 1950-2016
2017), Nepal’s history can be divided into 13 periods as follows:
(i) Absolute monarchy (1950-1972)
(ii) Multi-party politics (1980-1991)
(iii) Political instability (1994-2000)
(iv) Palace massacre (2001 June-2001 November)
(v) Emergency (2001 November-2003 January)
(vi) End of truce (2003 August-2004)
(vii) Absolute monarchy restored (2005-2006 May)
(viii) Peace deal (2006 november-2007 January)
(ix) Maoists join government (2007 April-2007 September)
(x) End of monarchy (2007 December-2008)
(xi) Maoists leave government (2009 May-2009 December)
(xii) Impasse over constitution (2010-2015 April)
(xiii) Landmark constitution (2015 September-recent (2016 August))
The research period from 1990 to 2010 corresponds to the period (ii)-(xii).

165
To explain in more detail, the research period is divided into four periods: Period
#1 (1990-1994), Period #2 (1995-1999), Period #3 (2000-2004), and Period #4
(2005-2010), with two additional periods: Period #0 (before 1990) and Period #5
(after 2010), as shown in Figure 115. Appendix 17 details notable events in Nepal
during each period.
As summarized in the Table 51, before the start of the research period in
1990, the country lacked political stability and peace. This instability continued
throughout the research period (1990-2010) and is ongoing today. The ODA was
also stagnant during the research period, and no significant increase was observed
during the period (see Table 50).
This information shows that Nepal’s (i) political instability, (ii) social
unrest, and (iii) stagnant ODA during the research period did not have a negative
impact on “successful development” in Nepal. This means that Nepal’s “successful
development” was achieved without (i) political stability, (ii) peace, or (iii)
leapfrogging toward a low carbon society made possible by imports of state-of-the-
art technologies from developed countries.
During the research period, Nepal’s remarkable improvement in HDI was
achieved mainly by a health improvement that started in 2005 and a modest income

166
component improvement. In the meantime, Nepal’s very successful performance
on GHGpc was caused by the reduction of GHG from LUCF starting in 2000, while
the population increased. The sudden decrease in emissions from LUFC may be a
result of the establishment of laws and rules related to forestry through the period
1976-2003. These data showed that sector activities in Nepal shifted out of forestry
around 2000 without damaging its economy.
Questions
From these observations, a question emerges: Why was Nepal’s HDI,
particularly its health and income components, able to improve while sector
activities shifted away from forestry without political stability, peace or increased
ODA? This question will be addressed in chapter 7.7.
6.3.3. Mongolia
According to the BBC News website (Mongolia profile – Timeline, 1267-
2016 2017), Mongolia’s history can be divided into 13 periods as follows:
(i) Mongol warrior: Genghis Khan (1267-1380)
(ii) Manchu rule (1636-1727)
(iii) First Soviet satellite state (1911-1920)

167
(iv) Religion (1921-1924)
(v) Purges (1928-1939)
(vi) Capital: Ulan Bator (1939)
(vii) International recognition (1945-1963)
(viii) Soviet buffer against China (PRC) (1966-1986)
(ix) Democracy (1990-1993)
(x) Ex-president Bagabandi (1996-2004 January)
(xi) Power-sharing (2004 June-2007)
(xii) State of emergency (2008-2010)
(xiii) Gobi Desert development (2011- recent (2016 June)
The research period from 1990 to 2010 corresponds to the periods (ix)-
(xii). To explain in more detail, the research period is divided into four periods:
Period #1 (1990-1994), Period #2 (1995-1999), Period #3 (2000-2004), and Period
#4 (2005-2010), with two additional periods: Period #0 (before 1990) and Period
#5 (after 2010), as shown in Figure 116.
Appendix 18 details notable events in Mongolia during each period.
As summarized in the Table 52, before the start of the research period in
1990, the country lacked political stability and peace. Throughout the research

168
period (1990-2010), some indications of political stability were observed. A
peaceful society was maintained during most of the research period, with the
exception of the riot that occurred in 2008. One remarkable issue observed was that
the ODA increased significantly during Period #1 compared with Period #0 and
maintained this high level through Period #4, shown in Table 50. This high level of
ODA is not presumed to be linked to the support for extreme weather in 2001 and
2010.
Mongolia’s (i) political instability and (ii) social unrest during 1990-2010
did not have a negative impact on “successful development” in Mongolia. This
means that Mongolia’s “successful development” was achieved without (i) political
stability or (ii) peace. It is possible that a leapfrog toward successful development
was caused by (i) a large increase in ODA that improved education through Periods
#3 and #4 and (ii) decreased GHG emissions from the energy sector through Periods
#1 and #2, particularly from manufacturing/construction, by the introduction of
state-of-the-art technologies.
Mongolia’s success was caused by the unchanged emissions (which went
down from 1990 to 2005 and recovered from 2005 to 2010), while its HDI slightly
but marginally increased. Between 2000-2005, HDI, particularly the income
169
component, did not improve significantly, but maintained a stable level. (Another
driver of HDI, the education component, decreased until 2000.)
During the research period, some improvements were observed: (i)
education improved throughout the period 2000-2010, and (ii) GHG emissions
from the energy sector decreased throughout the period 1990-2000, particularly
from manufacturing/construction, due to the introduction of state-of-the-art
technologies from developed countries through ODA.
Questions
From these observations, three questions emerge:
Question 1. Why was Mongolia’s HDI, particularly its income component,
able to maintain steady improvement with decreased GHG emissions from the
energy sector, particularly from manufacturing/construction, throughout the period
1990-2000, while the population increased and there was no political stability?
Question 2. Did the introduction of leapfrogging technology happen
because of a large increase in ODA since 1990?
Question 3. If manufacturing/construction through ODA was a salient
factor, did the donor place high priority on (i) education improvement, (ii)
decreased GHG emissions from the energy sector, and/or (iii) decreased GHG

170
emissions from manufacturing/construction innovations? These questions will be
addressed in chapter 7.7.
6.3.4. Bangladesh
According to the BBC News website (Bangladesh profile – Timeline, 1971-2016
2017), Bangladesh’s history can be divided into eight periods as follows:
(i) Independence (1971-1981)
(ii) Ershad era (1982-1991)
(iii) Awami League returns (1996-2001 July)
(iv) Coalition government (2001 September-2006 February)
(v) Political crisis (2006 October-2008 November)
(vi) Awami League win (2008 December-2009 February)
(vii) Bangladesh at 40 (2009 October-2013 May)
(viii) Jamaat-e-Islami trials (2013 July- recent (2016 March))
The research period from 1990 to 2010 corresponds to periods (ii)-(vii).
To explain in more detail, the research period is divided into four periods: Period
#1 (1990-1994), Period #2 (1995-1999), Period #3 (2000-2004), and Period #4
(2005-2010), with two additional periods: Period #0 (before 1990) and Period #5

171
(after 2010), as shown in Figure 117.
Appendix 19 details notable events in Bangladesh during each period.
As summarized in the Table 53, before the start of the research period in
1990, the country lacked political stability and peace. This instability continued
throughout the research period and is ongoing today. ODA was also stagnant during
the research period and never returned to the level of ODA given during the period
from 1986 to 1990, as the table shows (see Table 50).
This information shows that Bangladesh’s (i) political instability, (ii) peace,
and (iii) stagnant ODA during the research period (1990-2010) did not have a
negative impact on “successful development” in Bangladesh.
Bangladesh shows a very well-balanced improvement in HDI (the gap
between its top and bottom HDI components is as small as 5) with an improvement
in GHGpc. In the meantime, energy was consumed in an efficient way with regard
to the emission of GHGs. These accomplishments were achieved without damaging
the economy and without stability, peace or increased ODA.
In the meantime, Bangladesh had continuous increases in GHGs and
population until 2000, but starting in 2000, the rate of increase in GHGs was greater
than the rate of increase of the population; therefore, GHGpc worsened. This means

172
that a change occurred that increased both GHG emissions and energy consumption
around 2000.
Around 2000, emissions from LUCF slowly and modestly decreased, but
all other sources of CO2, CH4 and N2O increased, particularly CO2, at higher rate
starting in 2000. A majority of this CO2 increase came from the energy and industry
sectors, while the increases in CH4 and N2O came from agriculture. The abrupt
increase from the CO2/energy industry in 2000 was linked to growth in the
electricity/heat sector, but no changes in HDI took place during this time.
It was also observed that (i) the energy consumption increase did not
improve HDI, but (ii) Bangladesh became efficient in its emissions of GHG per
energy usage.
Questions
From these observations, three questions emerge:
Question 1. Was the balanced development that happened in Bangladesh
planned/intended/controlled, or simply a matter of good fortune without
plan/intention/control?
Question 2. If it was not planned/intended/controlled, did the development
that happened in Bangladesh beginning in 2005 follow the pattern of China (PRC)

173
and India, where prioritized development meant sacrificing the environment?
Question 3. If the development was planned/intended/controlled, what
policy goals were established and what policy measures were taken to achieve this
outcome in the absence of political stability, peace, and increased ODA? These
questions will be addressed in chapter 7.7.
174
CHAPTER 7. EXPERTS’ VIEWS TO SUPPLEMENT THE DATA ANALYSIS
7.1. Background
The above data analysis in Chapter 5 found that among the 14 Asian
countries studied, Myanmar and Nepal showed very successful development during
the research period (1990-2010). Myanmar’s performances in HDI and in GHGpc
were both categorized as very successful, and Nepal’s performance in HDI was
categorized as successful and in GHGpc was categorized as very successful.
Bangladesh and Mongolia also showed successful development during the research
period. Bangladesh’s performances in HDI and in GHGpc were categorized as
successful, and Mongolia’s performance in HDI was categorized as marginal but in
GHGpc was categorized as very successful.
The results of the data analysis have already shown substantial key issues,
as indicated by the bullet points on events in these countries that influenced their
success, as observed in the quantitative analysis. However, the quantitative metrics
do not fully explain how and why each country’s successful development occurred,
as the quantitative data analysis cannot show the mechanisms of the key issues, the
possible relationships among them, or whether they were fundamentally and

175
sustainably successful. For example, Myanmar’s HDI, particularly its income
component, increased while its sector activities shifted away from agriculture and
forestry with little increase in CO2 from the energy and industrial sectors, and
without political stability, peace or increased ODA. The data analysis, however,
could not clarify how Myanmar recovered from the loss of the income benefits from
agriculture and forestry it had once enjoyed. Without such a recovery, Myanmar
would not have been able to increase its HDI, particularly its income component.
Similarly, Nepal’s HDI, particularly its health and income components, improved
while its sector activities shifted away from forestry without political stability,
peace or increased ODA. The data analysis, however, could not clarify how Nepal
recovered from the loss of the income benefits from forestry; without such a
recovery, Nepal would not have been able to increase its HDI.
For this reason, it is important to use other methods to understand how and
why some countries achieved the successes observed in the data. Therefore, a
qualitative analysis was performed by posing questions to experts in the fields of
development and the environment. The questions were posed through a survey.

176
7.2. Objective
The objective of the survey was to obtain the insights from country experts
that could be helpful in answering the questions raised by the data analysis.
7.3. Subject Population
The present study obtained the views of 83 experts in the fields of the
environment and development. 14 While some of the participants were from
academia, the majority were officers currently working in intergovernmental
development support agencies, mainly the Asian Development Bank, former
officers of the Asian Development Bank, or its consultants. The Asian
Development Bank is a globally recognized organization working for
environmental improvement and development. It was established more than 50
years ago, and its work covers this study’s research period and the countries studied.
Therefore, it was one of the most appropriate available information sources for the
research.
14 More than 90 experts were initially contacted, then around 10 experts declined to provide their views. A total of 83 experts completed the survey including 20 experts who were requested to participate in the survey by the initial contacts.

177
7.4. Recruitment Process
All of the survey participants are/were working professionally or
academically in the fields of development and the environment, and/or are/were
working for projects conducted by intergovernmental development support
agencies. The recruitment process was as follows. (i) First, a list of potential
participants was established using the author’s personal connections gained through
his 11 years’ professional experiences at the Asian Development Bank. The author
intentionally did not use any prescreening criteria when preparing this list. This is
because experts’ experiences cannot be accurately judged by their current title or
status. (ii) The next step was to call or visit the potential participants whenever
possible, explaining the survey and asking if they could participate. Emails were
sent to potential participants who were difficult to visit or call. Moreover, it was
explained during the call, visit or email that anonymity would be offered in the
questionnaires and would be respected. (iii) After participants showed interest in
the questionnaire, emails containing more specific consent information and the
technical questionnaires were sent to them. Potential participants were allowed to
withdraw from the survey even after the technical questionnaires were sent if they
found that the questions were not relevant to them. More than 10 experts opted out
178
of the survey in this way after receiving the questionnaires. They made this choice
because they found they could not answer any of the questions posed, which is a
reasonable indication that the questions were sufficiently difficult to answer even
for globally recognized so-called experts in the development and environment
fields or that some of them do not take the opportunity to consider the meaning of
sustainable development through their actual practice.
7.5. Consent Process
As mentioned above, through visits, calls, and emails, the potential
participants were asked to join the survey. After they showed interest in the
questionnaire, emails containing more specific consent information and the
technical questionnaires were sent to them. The experts also were informed of their
right not to answer questions if they did not want to, as indicated in the
questionnaires attached. Their preferences as regards anonymity were fully
respected.
7.6 A Description of How the Research Was Conducted
The visits, calls, and emails to the experts were made in August–October

179
2017 after the Tufts IRB approval was given for this survey. Upon their acceptance,
the questionnaires were sent to them by email, also in August–October 2017. The
83 responses were provided in August–December 2017.
The questionnaires sent to the experts are attached as Appendix B. These
include the introduction, findings, data analysis, and questions. The summaries of
responses from experts are in Tables 54-61.
7.7 Analysis of Responses from Experts
83 experts provided valid responses to the questionnaire. The list of these
experts is attached (Appendix C). The responses are summarized and analyzed
below. Many of the responses provided multiple answers to the questions.
Therefore, even though the total number of the experts who responded was 83, the
sum of the responses to each question is not necessarily 83.
The analysis of the responses was not conducted following the number of
choices of possible answers to the questions, since a popular answer was not
necessarily the right answer to the question. Instead, the analysis was performed by
considering how well the answers matched the data analysis, the historical facts,
and the author’s professional experiences in these countries. This choice was made
180
because of some limitations discovered with the survey: some of the responses
indicated misinterpretations of the questions’ meanings, and other responses
discussed the countries outside the research period of 1990-2010.
As another limitation, the possibility that the data were unreliable was
pointed out when the analysis of the experts for Myanmar differed from the
analyses for other countries (Nepal, Bangladesh, and Mongolia). Five experts
indicated that they did not trust the data themselves. One expert wrote,
I think Myanmar is a case where indicators based on statistical data will be misleading. Data is untrustworthy because until recently the regime was secretive and what data was produced was to verify performance goals (where they existed) or to divert attention from areas of exploitation. Their purpose was rarely to give a true picture of the development parameter being reported on.
Others wrote,
We know that there are huge gaps between the official stats and what happened in the field” and “Myanmar is [a] late comer to accurate reporting on global indices. I personally wouldn’t judge any improvements in indices as an improvement on the ground per se.
Similarly, another opinion was,
The result is actually interesting since, I had an impression that Myanmar’s growth was slow during the period of international economic sanctions. If there was high-income growth notwithstanding low foreign direct investment FDI and ODA, this may be partially explained by the convergence theory, i.e. Myanmar’s growth was higher just because its starting income level was very low. Growth theories (generally speaking) predict low income economies to grow faster than middle/high income countries.

181
Since Myanmar was a closed country controlled by the military, it seemed
reasonable that more experts for Myanmar would feel this doubt compared to
experts for other countries. Since the experts’ on-the-ground experiences led them
to feel such doubt, it is important to note that the data cannot be assumed to be
trustworthy in the details. However, although the data might not be right in every
detail, and Myanmar, like many other countries, was subject to such doubt,
analyzing data obtained from authorities could be the first step that should be taken
since at least it can be expected to show a rough trajectory.
Moreover, it is important to mention here that some experts did not agree
when Mongolia was labeled a successful country. An expert stated, “I am not sure
if you can evaluate the Mongolian case as successful,” and another also wrote,
Successful development’ should also consider one criterion that is debt of
a country [sic]. Without this criterion, Mongolia seemed successful in terms of development. However, most of Mongolians very concern [sic] with regard to the det [sic] obtained by various governments that were changing during this period accumulated over time since 1990.
In fact, the data analysis categorized Mongolia in the insufficient group for
HDI improvement but in the good group for GHGpc performance. Therefore, these
negative views make sense that they do not agree Mongolia is one of successful

182
countries, but when Mongolia was compared with other Asian developing countries,
the data analysis also showed it still did better than many less successful countries.
What follows is the qualitative analysis of the responses provided by
experts in the questionnaires. Their insights will help explain the quantitative data
analysis and help to test the original four hypotheses for each of the four countries
and help answer the research question. The observations on the successful countries
indicate the possibilities and limitations that developing countries face in seeking
to improve HDI without increasing GHG emissions.
The types of information that was requested help to provide an explanation
of observed trends in GHG and HDI. In order to understand patterns of change in
GHGs, the following information was requested:
(i) Shift in economic activity during the period,
(ii) Change in financing by development agencies during the period,
(iii) Change in GHGs and their sources during the period, and
(iv) Any other changes that occurred during the period,
To understand patterns of change in HDI the following information was requested:
(i) Change in education indicator and reasons of the change,
(ii) Change in health indicator and reasons of the change,

183
(iii) Change in income indicator and reasons of the change,
(iv) Change in financing by development agencies during the period, and
(v) Any other changes that occurred during the period.
7.7.1. Experts’ Responses to the Question Related to Myanmar
From the data analysis, one question remains: “Why was Myanmar’s HDI,
particularly its income component, able to increase while sector activities shifted
out of agriculture and forestry with little increase in CO2 from the energy and
industrial sectors, and also without political stability, peace or increased ODA?”
This question is reasonable because if this shift out of agriculture and forestry
happened without a successful transfer to other profitable activities in Myanmar
that do not emit GHGs, income could not be increased. Therefore, this question was
posed to the experts. Comparing their twelve views (i)-(xii) with the quantitative
data analysis, provided insights as to what accounted for the observed trends that
are summarized in Table 63 with reasons for the analysis.
Empty circles mean the observations were not consistent (poor fit) with
the data analysis, the historical facts, and the author’s professional experiences in
Myanmar, half full circles mean they showed some consistency (partial fit), and full

184
circles mean they were very consistent (excellent fit) with the data analysis, the
historical facts, and the author’s professional experiences Myanmar.
Table 63. Evaluation of expert responses for Myanmar Items Raised by
Experts Fit Evaluation of expert responses
(i) Secondary and tertiary industries
This view does not precisely fit the data because (i) GHG emissions did not increase in CO2 from the energy and industrial sectors during the research period, and (ii) until the research period ended in 2010, there does not appear to have been sufficient political stability and peace to bolster the tourism industry. Moreover, some of the experts seemed to be confused about the research period (1990-2010) and discussed times outside the research period.
(ii) Foreign direct investment
Foreign direct investment in the private sector increased during the research period. This can also conceivably explain why some of the tertiary industries, including the service industries, became the receivers of labor that shifted out of primary industry and became income generators that replaced primary industry, since such investment supported labor-intensive sectors, the telecom sector, real estate, etc.
(iii) Agriculture production increased
one of these experts did not discuss the research period, and the view of the other expert does not fit the data analysis for this period
(iv) Military regime
Controlling by military regime can explain why Myanmar’s development was stable not much to be disturbed during the period, but this cannot provide a clear answer to the question itself.
(v) Trading (exports of natural
The experts wrote that “The export of natural resources increased (natural gas, mineral, and oil)” for “trading with neighboring countries, such as China (PRC) and Thailand.” This fact answered the
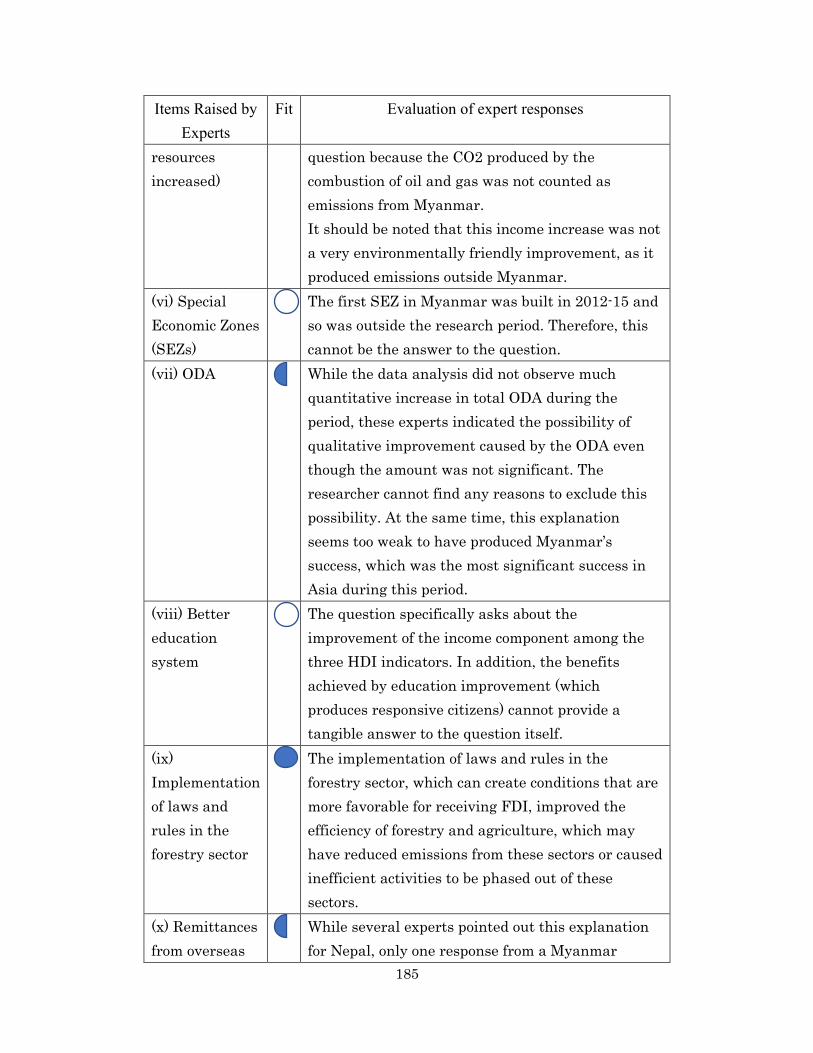
185
Items Raised by Experts
Fit Evaluation of expert responses
resources increased)
question because the CO2 produced by the combustion of oil and gas was not counted as emissions from Myanmar. It should be noted that this income increase was not a very environmentally friendly improvement, as it produced emissions outside Myanmar.
(vi) Special Economic Zones (SEZs)
The first SEZ in Myanmar was built in 2012-15 and so was outside the research period. Therefore, this cannot be the answer to the question.
(vii) ODA While the data analysis did not observe much quantitative increase in total ODA during the period, these experts indicated the possibility of qualitative improvement caused by the ODA even though the amount was not significant. The researcher cannot find any reasons to exclude this possibility. At the same time, this explanation seems too weak to have produced Myanmar’s success, which was the most significant success in Asia during this period.
(viii) Better education system
The question specifically asks about the improvement of the income component among the three HDI indicators. In addition, the benefits achieved by education improvement (which produces responsive citizens) cannot provide a tangible answer to the question itself.
(ix) Implementation of laws and rules in the forestry sector
The implementation of laws and rules in the forestry sector, which can create conditions that are more favorable for receiving FDI, improved the efficiency of forestry and agriculture, which may have reduced emissions from these sectors or caused inefficient activities to be phased out of these sectors.
(x) Remittances from overseas
While several experts pointed out this explanation for Nepal, only one response from a Myanmar

186
Items Raised by Experts
Fit Evaluation of expert responses
expert raised the issue of remittances from overseas workers. While remittances could have been one of the reasons the income component improved without increasing GHGs, their significance in Myanmar was not as great as in Nepal (More people gave this answer for Nepal).
(xi) Technology increases productivity
Two experts highly evaluated the benefits provided by technology improvements. These two experts indicate two different possibilities. One indicated that ODA and FDI expedited technology improvements in efficiency, while another indicated that the implementation of laws and rules in the forestry sector increased the efficiency of the forestry industry and, as a result, freed up additional labor that shifted to other industries.
(xii) Hydro-based energy with low GHG emissions
the additional energy needs produced by the shift out of the agriculture and forest industries were met by non-GHG-emitting sources, namely hydropower. But this cannot provide a clear answer to the question itself.
We now have a clearer view of what happened in Myanmar during the
research period of 1990-2010 to produce the successful development shown by the
data analysis. This clearer view is visually displayed in Figure 118 where thicker
solid arrows mean an excellent fit, thinner solid arrows mean partial fit, and the red
dash-dot arrow means no influence.
Myanmar’s HDI income component was able to increase partially because

187
of remittances from overseas workers, but mainly because exports of natural
resources (natural gas, minerals, and oil) to neighboring countries such as China
(PRC) and Thailand increased. Even without political stability, peace or increased
ODA, FDI in the private sector was steadily encouraged during the period. This can
also conceivably explain why some of tertiary industries, including the service
industries, became the receivers of labor shifting out of primary industry and
replaced primary industry as income generators, since such investment supported
the labor-intensive sectors, the telecom sector, real estate, etc. Sector activities
started to shift out of agriculture and forestry because of the implementation of laws
and rules in the forestry sector that may have created favorable conditions for
receiving FDI. The resulting improved efficiency of forestry and agriculture may
have reduced emissions from these sectors or caused inefficient activities to be
phased out of the sectors. Some of the tertiary industries, including service
industries, together with natural resource exporting activities, then became the
receivers of labor shifting out of primary industry and replaced primary industry as
income generators. Little increase in CO2 from energy and industrial sectors
occurred because (i) the additional energy needs produced by the shift out of
agriculture and forest industries were covered by non-GHG-emitting sources,
188
namely hydropower, (ii) ODA and FDI expedited technology improvements that
increased efficiency, and (iii) laws and rules in the forestry sector were
implemented that increased the efficiency of the forestry industry and as a result
freed up additional labor that shifted to other industries. In Myanmar’s case, the
increase of capital inflow could happen without political stability or peace because
“international sanctions were taken seriously by only a few donor countries, and
the sanction regime was not effective”.

189
Figure 118. Summary of factors influencing successful development for Myanmar.

190
7.7.2. Experts’ Responses to the Question Related to Nepal
After the data analysis, a question remains: “Why was Nepal’s HDI,
particularly its health and income components, able to improve while sector
activities shifted out of forestry without political stability, peace or increased ODA?”
This question is reasonable because if this shifting out of forestry happened without
successful transfers to other profitable activities in Nepal that do not emit GHGs,
income could not be increased. This question was therefore posed to the experts.
Considering all nineteen of the expert responses (i)-(xix) and the data analysis, all
of the responses were evaluated for fit with the data for Nepal as shown in Table 64
with reasons for the analysis.
Table 64. Evaluation of expert responses for Nepal
Items Raised by Experts
Fit Evaluation of expert responses
(i) Remittances from Nepalese working abroad
36 of them raised this possibility, including 17 Nepalese experts. While popular answers are not necessarily correct, among all the questions for the four successful countries, this answer was given by the greatest number of experts.
(ii) Increased migration
While (i) refers to Nepalese working abroad, this reason refers to migration within the country from rural to urban areas that simultaneously happened along the significant labor flaw moved abroad. Therefore, this reason is counted in addition to (i).

191
Items Raised by Experts
Fit Evaluation of expert responses
(iii) Service sector
According to eleven experts “Adventure tourism over the last 2-3 decades” “is the main source of revenue in the country, and foreign exchange.”
(iv) Increasing health facilities/ Increased or continuous government and donor funding for maternal health and female community health volunteers
Eighteen experts mentioned That donor and government funding and ODA, with technological innovations, improved/ increased health facilities including primary care and community health centers, government and private hospitals and doctors, and female community health volunteers.
(v) Increased access to health services due to improved transportation and communication services
Three experts mentioned improved rural roads, transportation and communication services as a reason for the improved health parameter.
(vi) Support from various development partners
While the data analysis showed that ODA did not increase during the research period, 11 experts highly evaluated the positive impacts provided by support from donors, regardless of the amount. “It is experienced that ODAs support was significant even when the state of political stability and peace was fragile in Nepal.”
(vii) Government investment and efforts
In addition to support from various development partners, nine experts (including one negative view) mentioned government investment as the reason for the success. Two experts focused particularly on the government’s efforts to achieve an inclusive growth. Government efforts

192
Items Raised by Experts
Fit Evaluation of expert responses
were beneficial for clean energy improvement, education through programs such as literacy improvement, for improving heath by better insurance policy, child mortality and clean water, and income poverty reduction. Education indirectly helped to improve health.
(viii) Awareness-raising campaigns/ activities
This can be treated as one of the government efforts mentioned above, designated by 11 experts as a remarkable issue. Those campaigns and activities became beneficial for improving health of rural people. In addition, one expert mentioned growing awareness of climate as one of the main reasons for the reduction of GHG.
(ix) Laws and rules related to forests in the legal sense
Their views supported the validity of the finding in the data analysis, clarifying one of the reasons activities shifted out of Nepal’s forestry business. Concern for flooding, landslides and earthquakes enhanced forest conservation and land regulation, then those helped GHG emission reductions and management of forest resources.
(x) Community forestry
As in (x), one of the findings from the data analysis was supported by 12 experts: “The sudden decrease in emissions from LUFC may have been a result of the establishment of laws and rules related to forestry throughout the period 1976-2003.” Ten experts focused particularly on the benefits derived from the establishment of community forestry as the core policy which contributed to forest conservation and income generation activities.
(xi) Alternative energy options
Ten experts mentioned the promotion of alternative energy options in Nepal. These experts, rather than answering the question directly, cited it as the reason for Nepal’s good
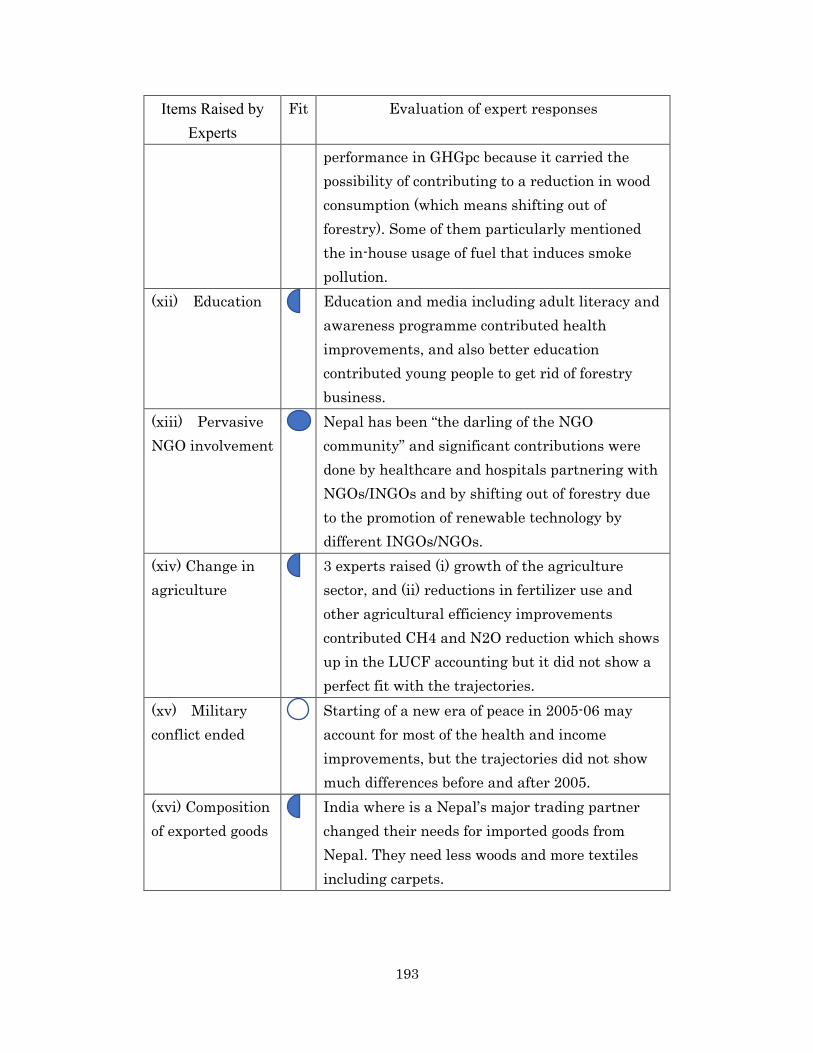
193
Items Raised by Experts
Fit Evaluation of expert responses
performance in GHGpc because it carried the possibility of contributing to a reduction in wood consumption (which means shifting out of forestry). Some of them particularly mentioned the in-house usage of fuel that induces smoke pollution.
(xii) Education Education and media including adult literacy and awareness programme contributed health improvements, and also better education contributed young people to get rid of forestry business.
(xiii) Pervasive NGO involvement
Nepal has been “the darling of the NGO community” and significant contributions were done by healthcare and hospitals partnering with NGOs/INGOs and by shifting out of forestry due to the promotion of renewable technology by different INGOs/NGOs.
(xiv) Change in agriculture
3 experts raised (i) growth of the agriculture sector, and (ii) reductions in fertilizer use and other agricultural efficiency improvements contributed CH4 and N2O reduction which shows up in the LUCF accounting but it did not show a perfect fit with the trajectories.
(xv) Military conflict ended
Starting of a new era of peace in 2005-06 may account for most of the health and income improvements, but the trajectories did not show much differences before and after 2005.
(xvi) Composition of exported goods
India where is a Nepal’s major trading partner changed their needs for imported goods from Nepal. They need less woods and more textiles including carpets.
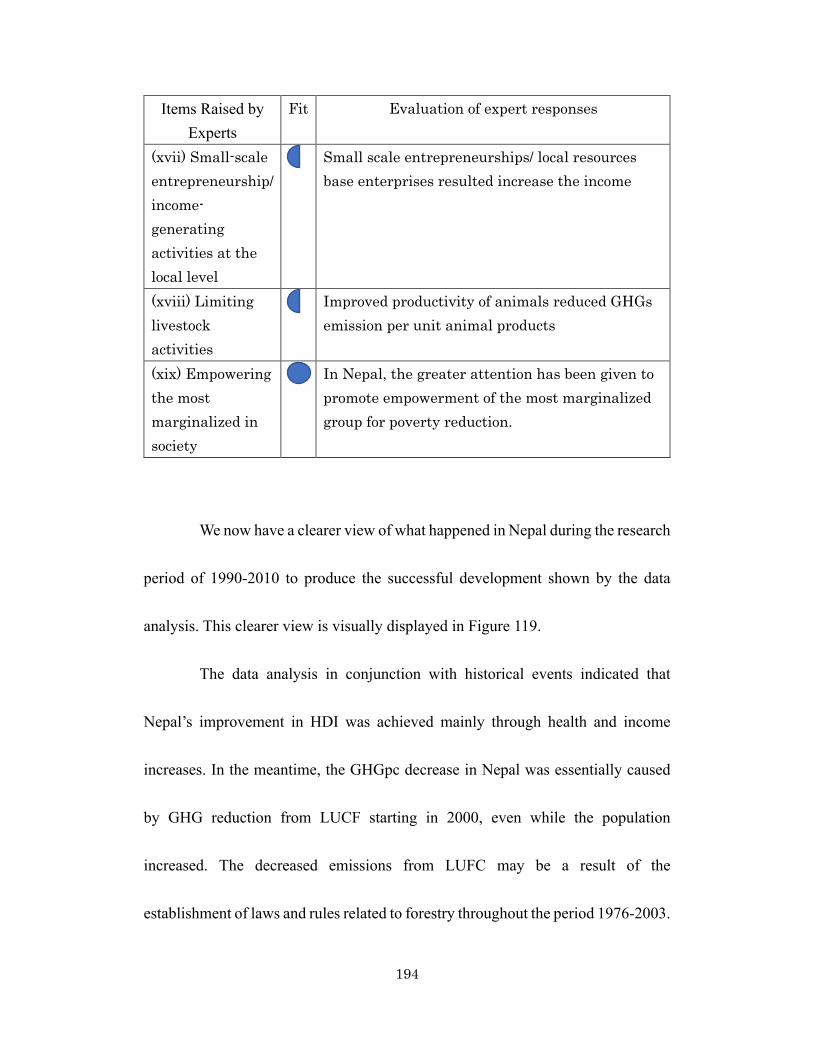
194
Items Raised by Experts
Fit Evaluation of expert responses
(xvii) Small-scale entrepreneurship/ income-generating activities at the local level
Small scale entrepreneurships/ local resources base enterprises resulted increase the income
(xviii) Limiting livestock activities
Improved productivity of animals reduced GHGs emission per unit animal products
(xix) Empowering the most marginalized in society
In Nepal, the greater attention has been given to promote empowerment of the most marginalized group for poverty reduction.
We now have a clearer view of what happened in Nepal during the research
period of 1990-2010 to produce the successful development shown by the data
analysis. This clearer view is visually displayed in Figure 119.
The data analysis in conjunction with historical events indicated that
Nepal’s improvement in HDI was achieved mainly through health and income
increases. In the meantime, the GHGpc decrease in Nepal was essentially caused
by GHG reduction from LUCF starting in 2000, even while the population
increased. The decreased emissions from LUFC may be a result of the
establishment of laws and rules related to forestry throughout the period 1976-2003.

195
These data showed that sector activities in Nepal shifted out of forestry around 2000
without damaging its economy. Moreover, Nepal’s successful development was
achieved without (i) political stability, (ii) peace, or (iii) increased ODA.
As the reasons for Nepal’s successful development, experts mentioned 22
issues and items. This result indicates that there was a broader background behind
Nepal’s success compared to other countries. Nepal’s HDI income component was
able to increase significantly because of remittances from overseas workers; this
explanation was given by 36 experts, including 17 Nepalese experts. The
remittances were accelerated by the domestic situation, which was characterized by
a lack of political stability and peace. At the same time, domestic migration from
rural areas to urban areas also occurred. The increased income generated by this
phenomenon contributed to improving health conditions and to decreasing the
workforce in rural areas that were once utilized for agriculture and forestry. While
the HDI income component improved because of the remittances from overseas
workers, domestically Nepal also had the advantage of being able to promote
income-generating activities at the local level/in the service sector, particularly
tourism, which absorbed workers who had once worked in agriculture and forestry.
At the same time, because of the Nepalese government’s efforts to enhance

196
inclusive growth and empower the most marginalized in society, and because of
direct and indirect support from various NGOs and multiple governmental
donors/development partners (such as the construction of rural roads to access
health facilities), health care services improved in both quality and quantity. For
example, community health volunteers were successfully introduced. (While the
data analysis did not show that the ODA amounts significantly increased, their
efficient qualitative contributions cannot be denied.) Moreover, awareness-raising
campaigns/activities as a part of a government-sponsored education program also
worked well to improve health conditions.
The GHG reduction from LUCF that was observed in the data can be
explained by the good functioning of the laws and rules related to forests in the
legal sense. The establishment of community forestry as a core policy of Nepalese
government was a particularly good match for the income needs of local
communities because it allowed them to sustain their forests. These movements
also made it difficult for those who wished to enter the industry to do business.
Health conditions also improved because of the decrease in fuel wood consumption
due to the introduction of alternative energy options, such as improved cooking
stoves, solar home systems and micro-hydro, which NGOs helped to provide. For

197
historical and geographical reasons, Nepal maintains significant trade connections
with India. India’s demand for wood from Nepal decreased, which helped to reduce
GHGs from LUCF. It was believed that India might want other goods from Nepal,
such as small agri-based products. (Agriculture improved its efficiency over the
course of the period and caused a reduction in livestock activities.) This is the
background of the sector activities that started to shift out of forestry. In the
meantime, CO2 from the energy and industrial sectors increased only slightly. All
these changes took place without political stability or peace.

198
Figure 119. Summary of factors influencing successful development for Nepal
7.7.3. Experts’ Responses to the Questions Related to Mongolia
After this data analysis, three questions remain: Question 1: “Why was
Mongolia’s HDI, particularly its income component, able to maintain steady
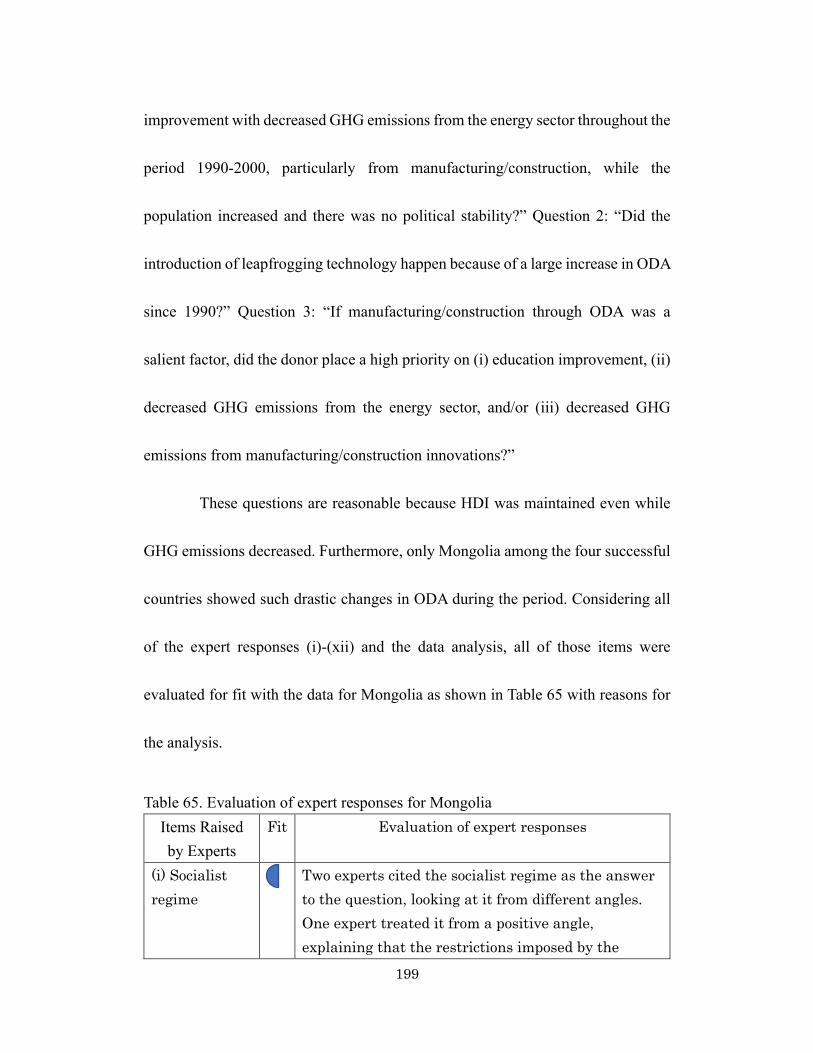
199
improvement with decreased GHG emissions from the energy sector throughout the
period 1990-2000, particularly from manufacturing/construction, while the
population increased and there was no political stability?” Question 2: “Did the
introduction of leapfrogging technology happen because of a large increase in ODA
since 1990?” Question 3: “If manufacturing/construction through ODA was a
salient factor, did the donor place a high priority on (i) education improvement, (ii)
decreased GHG emissions from the energy sector, and/or (iii) decreased GHG
emissions from manufacturing/construction innovations?”
These questions are reasonable because HDI was maintained even while
GHG emissions decreased. Furthermore, only Mongolia among the four successful
countries showed such drastic changes in ODA during the period. Considering all
of the expert responses (i)-(xii) and the data analysis, all of those items were
evaluated for fit with the data for Mongolia as shown in Table 65 with reasons for
the analysis.
Table 65. Evaluation of expert responses for Mongolia
Items Raised by Experts
Fit Evaluation of expert responses
(i) Socialist regime
Two experts cited the socialist regime as the answer to the question, looking at it from different angles. One expert treated it from a positive angle, explaining that the restrictions imposed by the

200
Items Raised by Experts
Fit Evaluation of expert responses
socialist regime produced “green development,” while the other treated it from a negative angle, saying that the withdrawal of Soviet support for the country had led to a slowdown in the economy and the industrial sector, and therefore a fall in related emissions. Considering that the withdrawal of Soviet support happened just before the research period began in 1990, the view that a slowdown in the economy and the industrial sector caused a fall in related emissions makes sense. However, this is not enough to explain why the HDI income component was able to maintain steady improvement with decreased GHG emissions.
(ii) Growth of the service sector and private- and public-sector trading
These responses by the experts are consistent with the findings: HDI’s income component was able to maintain steady improvement with decreased GHG emissions because mining and some service sectors were expanding with little increase in GHGs while revenue increased. However, the reason this transition happened is not clear.
(iii) Efficiency and technology
These views indicate that before the research period, the technology used in the energy and manufacturing sectors introduced to Mongolia by the USSR was less efficient, and it was improved by modernization. ODA seem to have been helpful in this modernization.
(iv) Opening up the economy
After the withdrawal of the socialist regime, the opening up of the economy to private sector participation can explain why HDI’s income component maintained steady improvement. It is necessary, however, to learn the details of what happened.

201
Items Raised by Experts
Fit Evaluation of expert responses
(v) Non-GHG-emitting production
Such production may have been happening at that time, but the question was about decreased GHG emissions from the energy sector but not from production, so this answer does not perfectly fit as the answer to the question.
(vi) Sparsely populated country so did not fit with large-scale manufacturing and the energy industry
It can modestly justify the finding of “decreased GHG emissions from the energy sector throughout the period 1990-2000,” since the centralization in Ulaanbaatar of the population along with the population increase is assumed to have started in this period.
(vii) Emergence of a democratic system
It is reasonable to think that the emergence of a democratic system created favorable conditions for investment in Mongolia that explain why HDI’s income component maintained steady improvement, but it does not show a clear justification for the decreased GHG emissions from the energy sector in 1990-2000.
(viii) Majority of industrial enterprises went bankrupt
This explanation points to the negative view of the socialist regime. While it explains the decreased GHG emissions as in (i), it cannot adequately explain why the HDI income component was able to maintain steady improvement.
(ix) International bilateral and multilateral donor organization
Observing the data that show that ODA amounts for Mongolia increased during the period, this high evaluation of ODA fits with the finding that the income component maintained steady improvement with decreased GHG emissions from the energy sector in 1990-2000.
(x) Exports of coal (and
This can reasonably explain why Mongolia’s HDI, particularly its income component, was able to
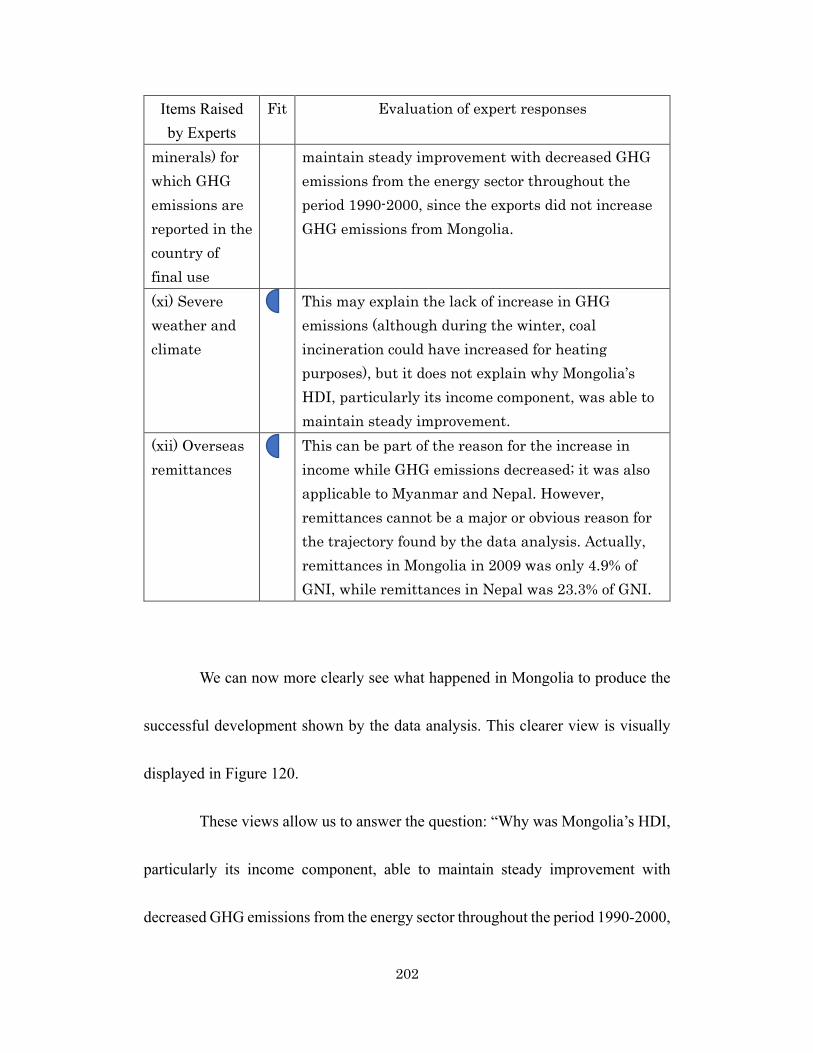
202
Items Raised by Experts
Fit Evaluation of expert responses
minerals) for which GHG emissions are reported in the country of final use
maintain steady improvement with decreased GHG emissions from the energy sector throughout the period 1990-2000, since the exports did not increase GHG emissions from Mongolia.
(xi) Severe weather and climate
This may explain the lack of increase in GHG emissions (although during the winter, coal incineration could have increased for heating purposes), but it does not explain why Mongolia’s HDI, particularly its income component, was able to maintain steady improvement.
(xii) Overseas remittances
This can be part of the reason for the increase in income while GHG emissions decreased; it was also applicable to Myanmar and Nepal. However, remittances cannot be a major or obvious reason for the trajectory found by the data analysis. Actually, remittances in Mongolia in 2009 was only 4.9% of GNI, while remittances in Nepal was 23.3% of GNI.
We can now more clearly see what happened in Mongolia to produce the
successful development shown by the data analysis. This clearer view is visually
displayed in Figure 120.
These views allow us to answer the question: “Why was Mongolia’s HDI,
particularly its income component, able to maintain steady improvement with
decreased GHG emissions from the energy sector throughout the period 1990-2000,

203
particularly from manufacturing/construction, while the population increased and
there was no political stability?” The data analysis showed that Mongolia’s HDI,
particularly its income component, was able to maintain steady improvement with
decreased GHG emissions from the energy sector throughout the period 1990-2000.
The experts’ inputs indicated that the GHGpc decrease in Mongolia through 1990-
2000 was essentially caused by the slowdown in the economy and the industrial
sector when the majority of industrial enterprises were bankrupted after the
withdrawal of the socialist regime. The income component was able to maintain
steady improvement thanks to (i) overseas remittances (partially), (ii) expansion in
mining and some service sectors, (iii) exports of coal and other minerals.
During the recovery period after the disintegration of the Soviet Union, the
democratic system that emerged set up favorable conditions for an increase in ODA
since 1990 observed in the data, and this increase improved the efficiency of the
technologies used in Mongolia’s energy and manufacturing sectors, replacing the
old and non-efficient technologies brought by the Soviets with more modern
technologies, even they incurred higher costs for achieving higher efficiencies and
improved environmental management that will be a part of project cost supported
or covered by the ODA. The introduction of advanced technologies was welcomed
204
by Mongolians, since “Mongolians place a high value on obtaining the latest
technologies and wish to keep up with global trends.” Therefore, private sector
investors during the process of recovery from the crisis in the 1990s also preferred
advanced technologies. With this support from ODA, the opening up of the
economy to private sector participation can explain why HDI’s income component
maintained steady improvement, since opening up also allowed for the expansion
of the export of mining resources and the service sector.
Additionally, as found in question 1, during the recovery period, the
democratic system that emerged set up favorable conditions for increases in ODA,
which improved the efficiency of the technology used in Mongolia’s energy and
manufacturing sectors by replacing old, non-efficient technology brought by the
Soviets with modern technology. Thus, donors did not place a high priority on
decreasing GHG emissions, but a decrease was a positive side effect of their support
for the country’s technological modernization.

205
Figure 120. Summary of factors influencing successful development for Mongolia.

206
7.7.4. Experts’ Responses to the Questions Related to Bangladesh
After the data analysis, three questions remain: (Question 1) “Was the
balanced development that happened in Bangladesh planned/intended/controlled,
or simply the result of good fortune without plan/intention/control?” (Question 2)
“If it was not planned/intended/controlled, is the development in Bangladesh that
began in 2005 likely to follow the pattern of China (PRC) and India, where
prioritized development sacrificed the environment?” and (Question 3) “If the
development was planned/intended/controlled, what policy goals were established
and what policy measures were taken to achieve this outcome while there was no
political stability, peace, or increased ODA?”
These questions are reasonable because, among the successful countries,
only Bangladesh achieved a well-balanced improvement in HDI (the gap between
its top and bottom HDI components was small). The abrupt increase in the
CO2/energy industry in 2000 was linked to growth in the electricity/heat sector,
which can be seen as the beginning of tracing the trajectories of China (PRC) and
India. Therefore, the questions were posed to the experts. Considering all of the
eight expert responses (i)-(viii) and the data analysis, all of those items were
evaluated for fit with the data for Bangladesh as shown in Table 66 with reasons for

207
the analysis.
Table 66. Evaluation of expert responses for Bangladesh Items Raised by Experts
Fit Evaluation of expert responses
(i) Local development
Local development was enhanced “through micro-credit, gramin development bank (sic), Mohammad Yunus, and Noble Laurette on Economics (sic).”
(ii) Foreign investments
Government successfully provided better condition for foreign firms and investments on the textile and garment subsector as well as oil and gas exploration, construction of natural gas pipelines and power stations that did not produce much GHG to accommodate needs by increased population.
(iii) Improvement in the standard of living and poverty reduction
It was during this period that a Poverty Reduction Strategy Paper (PRSP), which is a development strategy document, allowed market mechanism as a driving force of development in Bangladesh. Government prioritized to improve the minimum living standard from the areas of health care, quality of education, social security, and strong social safety programs targeting the poor.
(iv) Job generation and low labor costs/ Supporting export-oriented industry and the private sector
The policies of supporting export-oriented manufacturing and private sector such as textiles jobs (garments sector) that came along with job generation by low wages. Even without political stability, the economy generally still can be improved in a certain level.
(v) Support from development partners
The financial sector reform supported by development partners was one of the best in the region and supported proper capital allocation to which private

208
Items Raised by Experts
Fit Evaluation of expert responses
sector has responded positively then promoted foreign investments.
(vi) Planning and execution
“Despite political confusion, Bangladesh has maintained a reasonable level of planning and execution in all sectors, starting from proper planning in education/health, energy, transport sectors.”
(vii) Other One expert mentioned each of the following: capacity development and skills training, formal or informal laws and rules (community-based institutions and indigenous knowledge and practices), and proper planning.
We can now more clearly see what happened in Bangladesh to produce the
successful development shown by the data analysis. This clearer view is visually
displayed in Figure 121.
These views allow us to answer the question: “Was the balanced
development that happened in Bangladesh planned/intended/controlled, or simply
the result of good fortune without plan/intention/control?” The data analysis
showed that Bangladesh’s improvement in HDI was achieved by a well-balanced
improvement in HDI (the gap between its top and bottom HDI components was
small) throughout the period 1990-2000. The majority of the experts supported the
idea that the success was caused by numerous government programs that were

209
designed/planned/intended/controlled, since the country needed to cope with a
rapid population increase. Bangladesh also learned from the past and from
neighboring countries, and private sector businesses responded positively to the
programs designed. The experts’ view was that even the lack of political stability
and peace did not present a serious barrier to the sustainable and continuous
implementation of carefully designed policies. As reasons to explain why the
success was not the result of the government’s programs, (i) corruption, (ii) NGOs’
remarkable activities, and (iii) the natural gas exploitation boom that happened
during the period were cited.
We also now have a clearer answer to the question: “If it was not
planned/intended/controlled, is the development in Bangladesh that began in 2005
likely to follow the pattern of China (PRC) and India, where prioritized
development sacrificed the environment?” The pessimistic view expressed by eight
experts (that Bangladesh will follow the pattern of sacrificing the environment) is
based on the fact that Bangladesh’s domestic natural gas, which has been sustaining
its clean development, is almost depleted, and therefore it will start relying on large-
scale coal thermal power plants to meet the needs that will come along with its
ongoing population increase. In the meantime, another eight experts provided the

210
optimistic view that Bangladesh will not follow the pattern of sacrificing the
environment. Their views are based on the beliefs that (i) Bangladesh’s awareness
of the environment is high, (ii) Bangladesh’s income increase will not be energy-
driven, and (iii) development donors are environment-conscious. However, their
view seems outdated in the sense that it is based on their understanding that
Bangladesh can continue to use its domestic natural gas. Justification (iii) might be
true when it comes to avoiding air pollution, water contamination, and noise, and
to promoting safety management and protecting biodiversity, but it is questionable
how donors can help reduce the GHGs emitted by the newly planned coal thermal
plants.
We now have a clearer answer to the question: “If the development was
planned/intended/controlled, what policy goals were established and what policy
measures were taken to achieve this outcome while there was no political stability,
peace, or increased ODA?” These six items (except “(vii) others”) can be
fundamentally divided into two groups: development from the bottom up and
income generation. These groups can be regarded as the two main pillars of
Bangladesh’s policy measures to improve its HDI parameters. Regarding
development from the bottom up, (vi) planning and execution supported (i) local
211
development and (iii) improvement in the standard of living and poverty reduction.
(v) Support from development partners promoted this policy intention. In the
meantime, regarding income generation, (ii) favorable conditions for foreign
investment, (iv) efforts at job generation and low labor costs/ supporting export-
oriented industries and the private sector were effective for this pillar. (v) Support
from development partners also promoted this policy intention. Finally, (iv) job
generation and low labor costs/ supporting export-oriented industries and the
private sector worked as a binding for these two pillars.
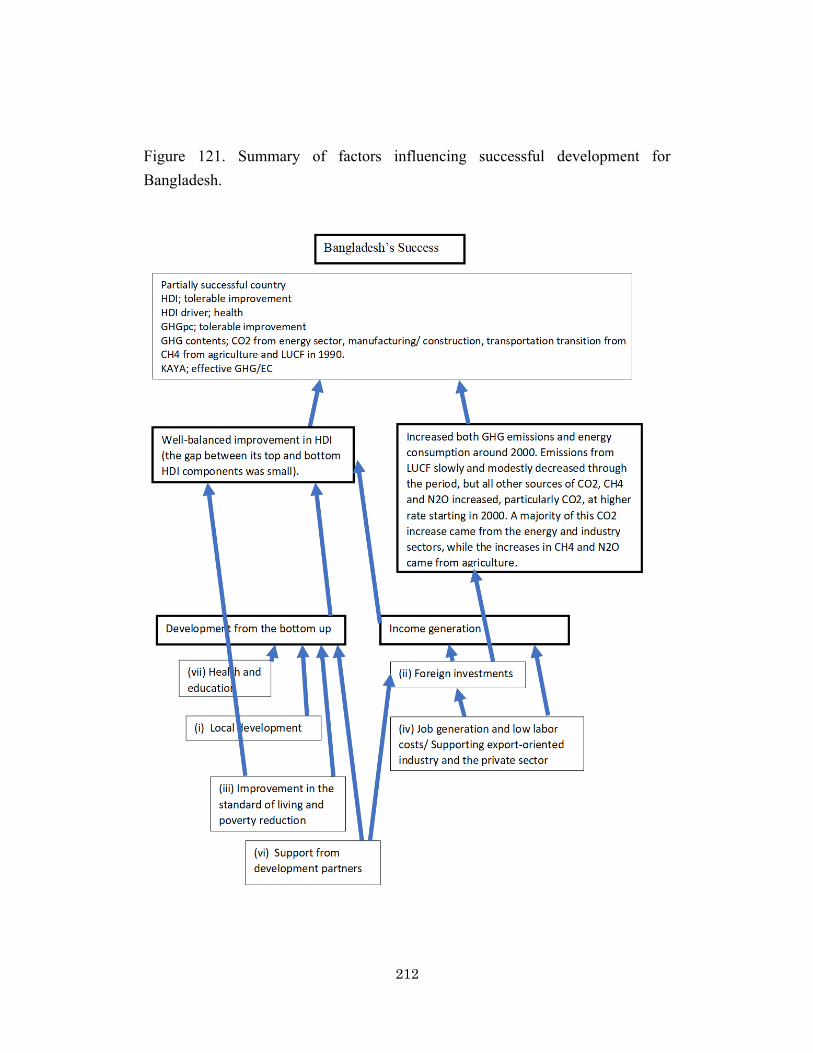
212
Figure 121. Summary of factors influencing successful development for Bangladesh.
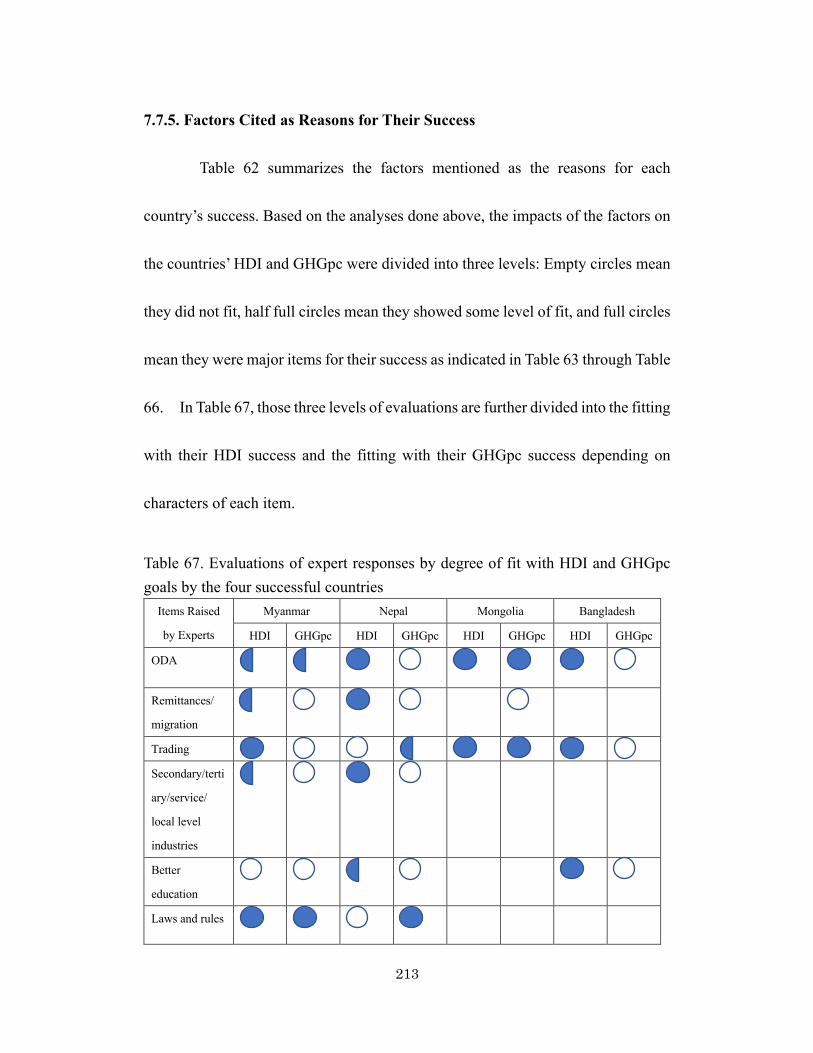
213
7.7.5. Factors Cited as Reasons for Their Success
Table 62 summarizes the factors mentioned as the reasons for each
country’s success. Based on the analyses done above, the impacts of the factors on
the countries’ HDI and GHGpc were divided into three levels: Empty circles mean
they did not fit, half full circles mean they showed some level of fit, and full circles
mean they were major items for their success as indicated in Table 63 through Table
66. In Table 67, those three levels of evaluations are further divided into the fitting
with their HDI success and the fitting with their GHGpc success depending on
characters of each item.
Table 67. Evaluations of expert responses by degree of fit with HDI and GHGpc goals by the four successful countries
Items Raised
by Experts
Myanmar Nepal Mongolia Bangladesh
HDI GHGpc HDI GHGpc HDI GHGpc HDI GHGpc
ODA
Remittances/
migration
Trading
Secondary/terti
ary/service/
local level
industries
Better
education
Laws and rules

214
Items Raised
by Experts
Myanmar Nepal Mongolia Bangladesh
HDI GHGpc HDI GHGpc HDI GHGpc HDI GHGpc
Renewable
energies/ Non-
GHG-emitting
productions
Technology/pr
oductivity
Foreign
investment
Empowerment
of the most
marginalized/
improvement
in the standard
of living/ Local
development
Agriculture
production/
Change in
agriculture/
Limiting
livestock
activities
Military
regime
Improving
access to
health services
Government
investment
Awareness-
raising
campaigns

215
Items Raised
by Experts
Myanmar Nepal Mongolia Bangladesh
HDI GHGpc HDI GHGpc HDI GHGpc HDI GHGpc
Community
forestry
Pervasive
NGO
involvement
End to military
conflict/
Opening up the
economy
Socialist
regime/
Enterprises
went bankrupt/
Emergence of
democracy
Geological
reasons
Job generation
As observed in the table, a single factor was common to all four countries:
ODA/international bilateral and multilateral donor organization/support from
development partners. Its impact on HDI and GHGpc ranged from None to Major.
Two other factors, (i) remittances and (ii) trading, were cited in the analysis of three
countries. Remittances had a particularly significant impact on Nepal’s HDI, while
trading had a particularly significant impact on Myanmar’s and Bangladesh’s HDI.
Another six factors were cited in the analysis of two countries: (i)

216
secondary/tertiary/service industries, (ii) better education, (iii) the implementation
of laws and rules, (iv) technology/productivity, (v) foreign investment, and (vi)
empowerment of the most marginalized/improvement in the standard of living. The
secondary/tertiary/service industries had a particularly significant impact on
Nepal’s HDI; the implementation of laws and rules had a particularly significant
impact on Myanmar’s HDI and GHGpc and on Nepal’s GHGpc;
technology/productivity had a particularly significant impact on Mongolia’s HDI
and GHGpc; foreign investment had a particularly significant impact on
Myanmar’s HDI and on Bangladesh’s HDI; empowerment of the most
marginalized/improvement in the living standard had a particularly significant
impact on Bangladesh’s HDI, and better education had no or only a minor impact
on Myanmar and Nepal. Another four factors appeared only in the Myanmar
analysis; 14 factors appeared only in the Nepal analysis; eight factors appeared only
in the Mongolia analysis; and three factors appeared only in the Bangladesh
analysis.
7.7.6. Consistency with SDGs
Table 63 to Table 66 in Section 7.7.1 and 7.7.2 examine whether or not

217
these earlier accomplishments by very successful and successful countries are
consistent with specific SDGs that are to be achieved between 2015 and 2030. The
four indicators that are health, education, income and GHGpc are linked to almost
half of the 17 SDGs because the health indicator is related to GOAL 2: Zero Hunger,
GOAL 3: Good Health and Well-being, and GOAL 6: Clean Water and Sanitation.
The education indicator is related to GOAL 4: Quality Education. The income
indicator is related to GOAL 1: No Poverty, and GOAL 8: Decent Work and
Economic Growth. The GHGpc indicator is related to GOAL 7: Affordable and
Clean Energy, and GOAL 13: Climate Action.
Table 68 shows SDG goals that are addressed by the items raised by
experts as keys to the successes observed in Myanmar, Nepal, Bangladesh, and
Mongolia as summarized in Table 62. This table shows that, among 22 items raised
by experts, 15 address SDG goals. The goals related to health were addressed by
two items, GOAL 2: Zero Hunger which was related to “Empowerment of the most
marginalized/ Improvement in the standard of living/local development” and
GOAL 3: Good Health and Well-being which was related to “Increasing health
facilities/ Increased or continuous government and donor funding for maternal
health and female community health volunteers / Government and donor funding
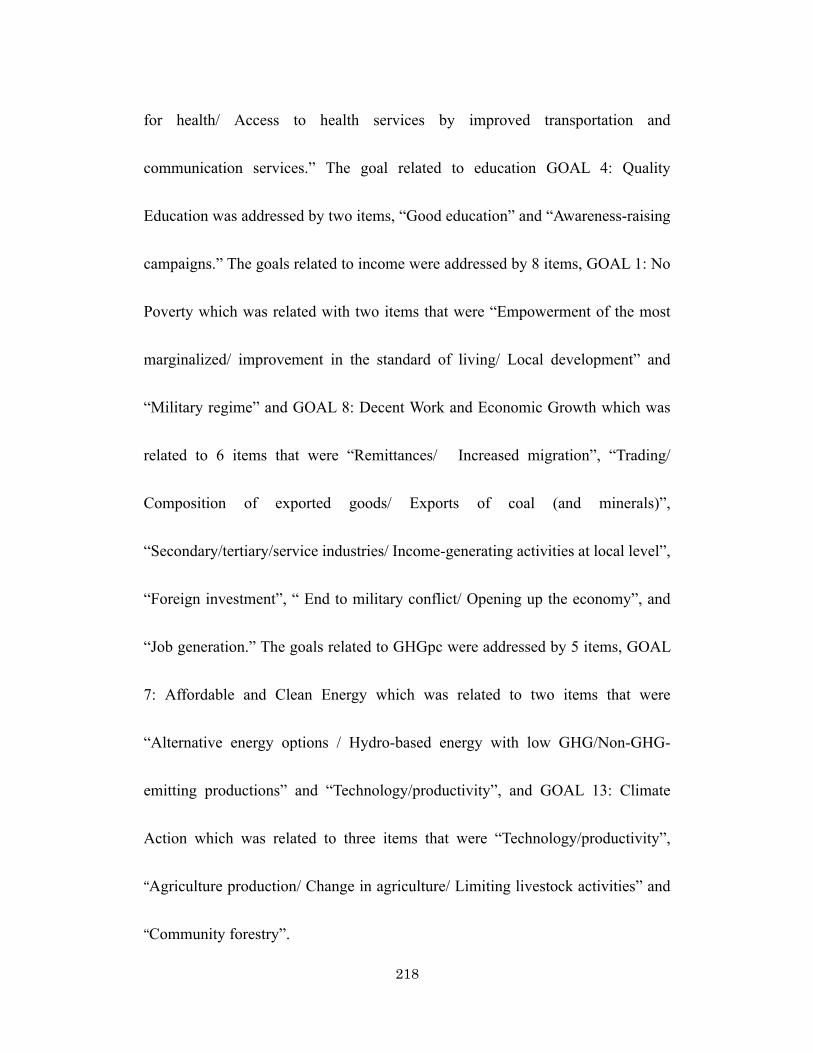
218
for health/ Access to health services by improved transportation and
communication services.” The goal related to education GOAL 4: Quality
Education was addressed by two items, “Good education” and “Awareness-raising
campaigns.” The goals related to income were addressed by 8 items, GOAL 1: No
Poverty which was related with two items that were “Empowerment of the most
marginalized/ improvement in the standard of living/ Local development” and
“Military regime” and GOAL 8: Decent Work and Economic Growth which was
related to 6 items that were “Remittances/ Increased migration”, “Trading/
Composition of exported goods/ Exports of coal (and minerals)”,
“Secondary/tertiary/service industries/ Income-generating activities at local level”,
“Foreign investment”, “ End to military conflict/ Opening up the economy”, and
“Job generation.” The goals related to GHGpc were addressed by 5 items, GOAL
7: Affordable and Clean Energy which was related to two items that were
“Alternative energy options / Hydro-based energy with low GHG/Non-GHG-
emitting productions” and “Technology/productivity”, and GOAL 13: Climate
Action which was related to three items that were “Technology/productivity”,
“Agriculture production/ Change in agriculture/ Limiting livestock activities” and
“Community forestry”.
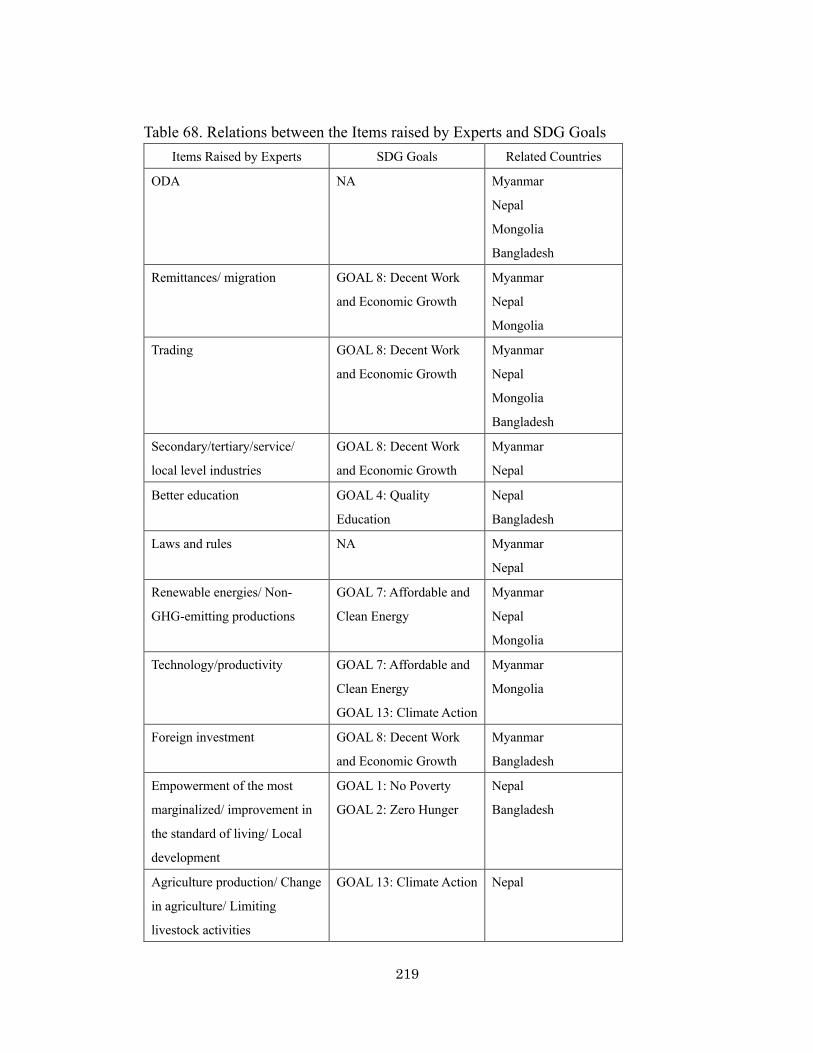
219
Table 68. Relations between the Items raised by Experts and SDG Goals
Items Raised by Experts SDG Goals Related Countries
ODA NA Myanmar
Nepal
Mongolia
Bangladesh
Remittances/ migration GOAL 8: Decent Work
and Economic Growth
Myanmar
Nepal
Mongolia
Trading GOAL 8: Decent Work
and Economic Growth
Myanmar
Nepal
Mongolia
Bangladesh
Secondary/tertiary/service/
local level industries
GOAL 8: Decent Work
and Economic Growth
Myanmar
Nepal
Better education GOAL 4: Quality
Education
Nepal
Bangladesh
Laws and rules NA Myanmar
Nepal
Renewable energies/ Non-
GHG-emitting productions
GOAL 7: Affordable and
Clean Energy
Myanmar
Nepal
Mongolia
Technology/productivity GOAL 7: Affordable and
Clean Energy
GOAL 13: Climate Action
Myanmar
Mongolia
Foreign investment GOAL 8: Decent Work
and Economic Growth
Myanmar
Bangladesh
Empowerment of the most
marginalized/ improvement in
the standard of living/ Local
development
GOAL 1: No Poverty
GOAL 2: Zero Hunger
Nepal
Bangladesh
Agriculture production/ Change
in agriculture/ Limiting
livestock activities
GOAL 13: Climate Action Nepal

220
Items Raised by Experts SDG Goals Related Countries
Military regime GOAL 1: No Poverty Myanmar
Improving access to health
services
GOAL 3: Good Health
and Well-being
Nepal
Government investment NA Nepal
Awareness-raising campaigns GOAL 4: Quality
Education
Nepal
Community forestry GOAL 13: Climate Action Nepal
Pervasive NGO involvement NA Nepal
End to military conflict/
Opening up the economy
GOAL 8: Decent Work
and Economic Growth
Mongolia
Socialist regime/ Enterprises
went bankrupt/ Emergence of
democracy
NA Mongolia
Geological reasons NA Mongolia
Job generation GOAL 8: Decent Work
and Economic Growth
Bangladesh
The countries’ performance in terms of relative success in meeting those
goals is visualized in Table 69 combining the analysis on Table 67 and Table 68.
Those empty, half full, and full circles in the table show evaluations based on the
information given by Figure 118 to Figure 121 in Section 7.7.1-4 that illustrated
outcomes in the four successful countries. They are moving in a direction that is
consistent with the SDGs even though the SDGs were not formulated until five
years after, the time period that was studied in this dissertation. These countries,
however, did not move forward on (i) GHG related goals for Bangladesh, (ii) health

221
and education related goals for Myanmar, and (iii) health and education related
goals for Mongolia. Nepal was the only one of the four that was meeting all of those
goals.
Table 69. Relations between the Successes and SDG Goals SDGs Bangladesh
(HDI; tolerable improvement driven by health GHGpc; tolerable improvement)
Myanmar (HDI; successful improvement driven by income GHGpc; successful improvement)
Mongolia (HDI; marginal improvement driven by education GHGpc; successful improvement)
Nepal (HDI; tolerable improvement driven by health GHGpc; successful improvement)
Goals related to Health
GOAL 2: Zero Hunger
GOAL 3: Good Health and Well-being
GOAL 6: Clean Water and Sanitation
NA NA NA NA
Goal related to Education

222
GOAL 4: Quality Education
Goals related to Income
GOAL 1: No Poverty
GOAL 8: Decent Work and Economic Growth
Goals related to GHGpc
GOAL 7: Affordable and Clean Energy
GOAL 13: Climate Action

223
CHAPTER 8. CONCLUSIONS
8.1 Validity of the Original Four Hypotheses for the Successful Four Countries
Each question and its answer are reviewed below.
(i) National policy initiatives, strategies and changing practices were effective
in the successful countries;
In Myanmar’s case, YES, (i) laws and rules related to forestry in 1992-95
decreased the emissions from LUCF, and (ii) the implementation of laws and rules
in the forestry sector created favorable conditions for receiving FDI and improved
the efficiency of forestry and agriculture, which may have reduced emissions from
these sectors or caused inefficient activities to be phased out of the sectors.
In Nepal’s case, YES, national policy initiatives, strategies and changing
practices worked well to improve HDI health and income indicators and the GHGpc
indicator. These initiatives, strategies and practices included (i) enhancing inclusive
growth, (ii) empowering the most marginalized in society, (iii) expanding health
care services, (iii) introducing community health volunteers, (iv) conducting
awareness-raising campaigns/activities, (v) implementing laws and regulations
related to forests practices, and (vi) establishing community forestry.
In Mongolia’s case, NO, in neither the data analysis nor the experts’ inputs
224
were proof observed that national policy initiatives, strategies or changing practices
worked effectively to produce success.
In Bangladesh’s case, YES, the success was caused by numerous
government programs that were designed/planned/intended/controlled since the
country needed to cope with its rapid population increase and because it had learned
from the past and from neighboring countries. Bangladesh’s policy measures to
improve its HDI parameters had two fundamental pillars. One was development
from the bottom up, and the other was income generation. Regarding development
from the bottom up, (vii) the strengthening of health and education supported (i)
local development and (iii) improvement in the standard of living and poverty
reduction. (vi) Support from development partners promoted this policy intention.
In the meantime, regarding income generation, (ii) favorable conditions for foreign
investment, (iv) efforts at job generation and low labor costs/ supporting export-
oriented industries and the private sector was effective for this pillar. (vi) Support
from development partners also promoted this policy intention. Finally, (iv) job
generation and low labor costs that supported export-oriented industries and the
private sector connected these two pillars. The lack of political stability and peace
indicated by the data analysis did not present a serious barrier to the sustainable and

225
continuous implementation of carefully designed policies.
(ii) Responses to external factors were efficient in the successful countries;
NO, in Myanmar’s case. There was no difference observed in the
emissions before and after its acceptance of the Kyoto Protocol, and the
international sanctions during the military era was not a significant barrier to
Myanmar’s development. In Myanmar’s case, the increase in capital inflow
occurred without political stability or peace, since “international sanctions were
taken seriously by only a few donor countries, and the sanction regime was not
effective” as an expert explained.
YES, to a certain extent in Nepal’s case. No difference was observed in the
emissions before and after Nepal’s acceptance of the Kyoto Protocol. The
establishment of laws and rules related to forests took place before this acceptance.
However, one of the reasons for Nepal’s diminishing forestry was India’s
decreasing demand for wood; therefore, Nepal responded to the external factor by
adjusting its sector activity, reducing GHGs from LUCF. Moreover, NGOs’
vigorous activities generated improvements in health and a reduction in wood
consumption that also contributed to GHG reductions from LUCF.
226
NO, in Mongolia’s case. After the disintegration of the Soviet Union, the
majority of industrial enterprises went bankrupt, which can be counted as an
external factor. It cannot be said, however, that Mongolia effectively responded to
this external factor.
NO, in Bangladesh’s case. Its natural gas usage and depletion can be
treated as an external factor. This is because Bangladesh’s energy supply, which
strongly influenced the GHGpc parameter, was affected by the availability of
natural gas. However, starting in 2000, the rate of increase in GHGs became faster,
particularly in CO2 from the energy and industry sectors. The abrupt increase in
CO2 from the energy industry in 2000 was linked to growth in the electricity/heat
sector. Thus, it cannot be said that Bangladesh effectively responded to this external
factor.
(iii) Financing by development agencies was effective in the successful
countries;
We can say this was “somewhat” true in Myanmar’s case, but the
phenomenon was not clearly observed. The quantity of the ODA did not show any
significant increase, although some qualitative benefits influenced by the ODA

227
cannot be denied, considering these experts’ inputs. ODA and FDI expedited
technology improvements in efficiency.
We can also say this was “somewhat” true in Nepal’s case, but the
phenomenon was not clearly observed. The quantity of the ODA did not show any
significant increase, although some qualitative benefits influenced by the ODA
cannot be denied, considering these experts’ inputs. Donors’ direct and indirect
support and the government’s efforts to promote health care services worked well
during the research period.
YES, in Mongolia’s case. At the very beginning of the research period, as
discussed above, Mongolia’s priority was recovery from its crisis after the
disintegration of the Soviet Union. In the data analysis, a large increase in ODA
was observed after 1990. Despite the lack of political stability, the democratic
system that emerged set up favorable conditions for an increase in ODA. This ODA
was originally intended to support Mongolia during the economic crisis, and the
projects supported by ODA involved energy-efficient advanced technologies,
although they came with higher costs. It is important to keep noting this because
ODA projects unintentionally brought such high efficiency which can contribute to
lower GHG emission technology that could not be introduced without ODA
228
projects since such environmentally better but higher cost cleaner energy
technologies are required to be applied but covered by donors’ supports. The donors
did not place a high priority on decreasing GHG emissions, but this decrease was a
positive side effect of their support for the country’s technical modernization.
We can say this was “somewhat” true in Bangladesh’s case, but the
phenomenon was not clearly observed because the quantity of ODA did not show
any significant increase, although the qualitative benefits of the ODA cannot be
denied, considering these experts’ inputs. Support from development partners was
helpful for realizing Bangladesh’s policy intentions: (i) development from the
bottom up and (ii) income generation.
(iv) The mix of economic activities at different stages of development worked
efficiently in the successful countries.
YES, in Myanmar’s case, since the data analysis showed that sector
activities shifted out of agriculture and forestry without damaging its economy.
Myanmar’s HDI income component was able to increase mainly because the
exports of natural resources to neighboring countries increased. Such activities
were made possible by FDI in the private sector, which was steadily encouraged

229
during the period. Some of the tertiary industries became the receivers of labor and
replaced primary industry as income generators. Little increase in CO2 from the
energy and industrial sectors occurred because (i) the additional energy needs
produced by the shift out of the agriculture and forest industries were met by non-
GHG-emitting sources, namely hydropower, (ii) ODA and FDI expedited
technology improvements in efficiency, and (iii) the implementation of laws and
rules in the forestry sector increased the efficiency of the forestry industry and as a
result freed up additional labor that shifted to other industries.
YES, in Nepal’s case, since the data analysis showed that sector activities
in Nepal shifted out of forestry without damaging its economy. Nepal’s HDI income
component was able to increase mainly because of remittances from overseas
workers. Activities at the local level and in the service sector, particularly tourism,
became the receiver of labor shifting out of forestry. CO2 from fuel wood
consumption increased little because of (i) the introduction of alternative energy
options such as improved cooking stoves, solar home systems and micro-hydro,
and (ii) the implementation of laws and rules in the forestry sector increased the
efficiency of the forestry industry and as a result freed up additional labor that
shifted to other industries.
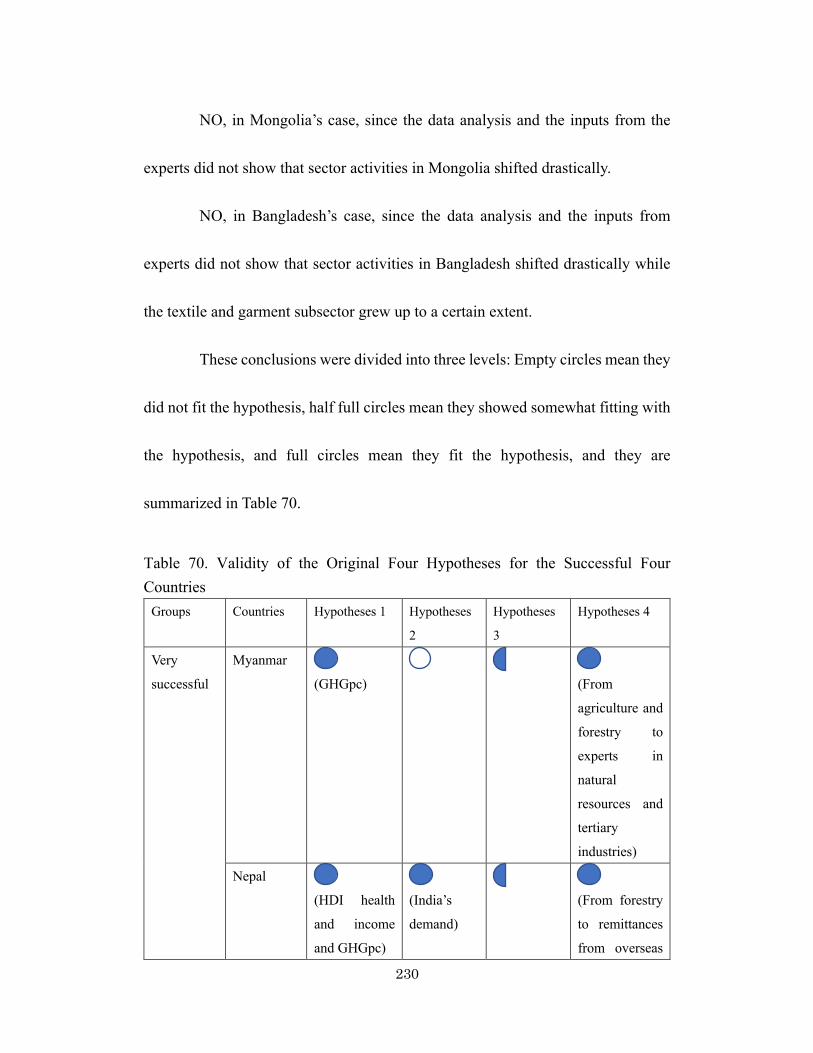
230
NO, in Mongolia’s case, since the data analysis and the inputs from the
experts did not show that sector activities in Mongolia shifted drastically.
NO, in Bangladesh’s case, since the data analysis and the inputs from
experts did not show that sector activities in Bangladesh shifted drastically while
the textile and garment subsector grew up to a certain extent.
These conclusions were divided into three levels: Empty circles mean they
did not fit the hypothesis, half full circles mean they showed somewhat fitting with
the hypothesis, and full circles mean they fit the hypothesis, and they are
summarized in Table 70.
Table 70. Validity of the Original Four Hypotheses for the Successful Four Countries
Groups Countries Hypotheses 1 Hypotheses
2
Hypotheses
3
Hypotheses 4
Very
successful
Myanmar
(GHGpc)
(From
agriculture and
forestry to
experts in
natural
resources and
tertiary
industries)
Nepal
(HDI health
and income
and GHGpc)
(India’s
demand)
(From forestry
to remittances
from overseas

231
workers and
the service
sector)
Successful Mongolia
(GHGpc)
Bangladesh
(Improve
HDI)
8.2 Answering to the Research Question
The original motivation of this dissertation was the following: if
“successful development” in poor countries (countries that simultaneously
improved both the development indicator (HDI) and the environmental indicator
(GHGpc)) is observed in the data, it is essential to learn about climate change
mitigation from such countries, because poor countries in general desire to develop
economically and socially even as they experience rapid population growth.
Consequently, the research question, “What factors determine whether developing
countries achieve lower GHG emissions while meeting their development goals?,”
was examined with four hypotheses. The answers obtained from data analysis and
experts’ views are:
(i) National policy initiatives, strategies and changing practices were
effective in Myanmar, Nepal and Bangladesh. In Myanmar, Implementation of laws

232
and rules in the forestry sector was effective at reducing GHGpc. In Nepal, these
new practices improved the HDI health and income indicators as well as reduced
GHGpc. These initiatives, strategies and practices included (i) enhancing inclusive
growth, (ii) empowering the most marginalized in society, (iii) expanding health
care services, (iii) introducing community health volunteers, (iv) conducting
awareness-raising campaigns/activities, (v) implementing laws and rules related to
forests in the legal sense, and (vi) establishing community forestry. In Bangladesh,
they were effective at improving Bangladesh’s policy measures to improve its HDI
parameters. These initiatives, strategies and practices included (i) Local
development, (ii) Providing a better condition for foreign investments, (iii)
Improvement in the standard of living and poverty reduction, (iv) Job generation
and low labor costs/ Supporting export-oriented industry and the private sector, and
(vi) Planning and execution.
(ii) The responses to external factors were effective only in Nepal. Nepal
successfully reduced GHG emissions from LUCF by responding to India’s needs
rather than looking for other buyers of its wood, which was also a timely move
linked to its national policy initiatives to sustain its forestry.
233
(iii) Financing by development agencies was clearly effective in Mongolia
and somewhat effective in the other three countries. The quantity of the ODA did
not show any significant increase in these three countries, although some qualitative
benefits of the ODA appear to be likely. In Mongolia, a large increase in ODA was
observed after 1990. This ODA was intended to support Mongolia during the
economic crisis after the disintegration of the Soviet Union. The donors did not
place a high priority on decreasing GHG emissions, but this decrease was a positive
side effect of their support for the country’s technical modernization.
(iv) The mix of economic activities at different stages of development worked
effectively in Myanmar and Nepal. Myanmar was successful at shifting away from
agriculture and forestry, moving to reliance on experts in natural resources and on
tertiary industries to maintain the increase in its HDI income parameter. Nepal was
successful at shifting away from forestry, moving to a reliance on remittances from
overseas workers and on the service sector to maintain the increase in its HDI
income and health parameters.
Myanmar, was one of the two very successful countries because of its
effective forestry policy regulations that reduced GHGs from LUCF, and its shift
away from agriculture and forestry into other natural resources and tertiary

234
industries. Nepal, the other very successful country, succeeded because its policy
regulations effectively improved HDI health and income parameters and reduced
GHGs from LUCF, while it transitioned out of forestry and gained remittances from
overseas workers and the service sector.
These observations on the two very successful countries indicate the
possibilities and limitations that developing countries face in seeking to improve
HDI without increasing GHG emissions. The possibility is that if a developing
country can find some other ways to generate income, it can regulate to shift out of
agriculture and forestry, which release GHGs. The limitation is that the stories
behind these cases might not reveal a reduction of GHGs. It cannot contribute to a
real climate change mitigation even if the reduction of GHGs domestically happens
if the emissions are transferred from one country’s ledger to another. For example,
Myanmar increased its reliance on exports of natural resources that might increase
GHGs in other countries where they are consumed, and Nepal increased its reliance
on remittances from overseas workers, who might be increasing GHGs in the
countries where they work. Mongolia was a successful country because donors’
support during the economic crisis had the positive side effect of reducing GHG
emissions through technical modernization. This effect could be duplicated in other

235
developing countries that use donor support to recover from crises. Bangladesh was
a successful country because it implemented policies that effectively improved its
HDI parameters. It may also be enjoying success in part because of the availability
of domestic natural gas.
In this regard, answers for the research question “What factors determine
whether developing countries achieve lower GHG emissions while meeting their
development goals?” are (i) National policy initiatives, strategies and changing
practices that were effective in three out of the four successful countries, (ii) The
responses to external factors was effective in one country, (iii) Financing by
development agencies was clearly effective in one country and also likely effective
in other three countries, and (iv) Change in the mix of economic activities was
effective in two out of the four successful countries.
8.3 Summary of findings and possible future research
• Finding #1: the surprising trajectory of the successful nations
This dissertation started from my finding that more than half of 130
countries (73) followed a trajectory from 1990-2010 which was successful in
increasing their HDI and decreasing GHGpc. The most interesting fact to be found
236
here was, while it can be readily assumed that rich countries were able to achieve
this success using their economic power and advanced technologies, a number of
poor countries also achieved this success. Twenty-six of the 52 richer countries
were successful, but also 33 of the 52 poorer countries showed a similar trajectory.
This actual trajectory proves that EKC theory does not universally apply to the
relationship between the development indicator (HDI) and the climate change
indicator (GHGpc). This is a very significant finding because most policy makers
all over the world trust that it is necessary to sacrifice climate change mitigation to
achieve development. This assumption causes them to give low priority to actions
that address climate change. Therefore, this finding can encourage those policy
makers to include addressing climate as part of their development agenda.
• Finding #2: Components of HDI
Thirteen Asian countries out of 18 had Education as their most improved
HDI component during 1990-2010. However, when all other country groups in the
world were examined, the results show that regardless of area and wealth, the
majority of countries have Education at the top. This may be attributed to one of
two reasons: (1) during this period, all over the world, Education was the real driver

237
of HDI improvement, or (2) the current HDI emphasizes the impact of Education
too much.
However, there is no available tool that can demonstrate whether (1) or (2)
is the case. Moreover, it is beyond the scope of this dissertation to examine if the
current calculation of HDI is too biased toward the Education component.
Therefore, in this dissertation, standard deviation score was introduced to find out
which HDI component became drivers of each country’s development. If one only
used the component values of HDI, 104 countries out of the total 130 countries had
the Education component as the driver of their HDI improvements (17 countries
had Health, and 9 had Income). Using the standard deviation score showed that 53
countries out of 130 had the Education component as the driver of their HDI
improvement (34 countries had Health, and 44 had Income). In Asia, out of 14
countries that were used for the evaluations, 3 countries had the Education
component as the driver of their HDI improvement (2 countries had Health, and 9
had Income).
These results demonstrate that improvements of Education component
were significant for all countries in the world, while improvements of the Income
component was important for Asian countries during the period of 1990-2010. The

238
situation among the four successful Asian countries differed. Myanmar’s driver was
strong improvement of the Income component but Nepal’s driver was very strong
improvement of the Health component, while neither Bangladesh nor Mongolia
showed any dominant component.
• Finding #3: Shift in GHGs as development progressed
Many past analyses have focused on CO2, and this has produced strong
disagreements in international negotiations since CO2 is a by-product of fossil fuel,
the major source of energy and the backbone of economic activity. Because it is
generally assumed that energy production is the most important ingredient for
development, it is difficult for countries (especially developing countries) to
commit to reducing CO2 emissions, since they equate that with reducing energy
production and slowing their economic development. However, the development
trajectories show that even though fossil fuel CO2 was more significant in 2010
than in 1990, in developing countries, it has never been the main GHG. This finding
suggests that reducing GHGs other than CO2 in developing countries can be an
effective means for future climate change mitigation. Such reductions may occur
239
by efficiency gains in activities that emit these gases or by transitions to a different
industry that releases different GHGs with lower Global Warming Potentials.
• Finding #4: The modified Kaya identity
The two very successful countries, Myanmar and Nepal, were both very
effective in reducing both EC/P/HDI and GHG/EC, and there was no other Asian
countries that achieved this. This means those two countries were the only countries
that consumed energy very efficiently as they improved HDI, and also the energy
used by them emitted relatively less GHG.
One of the two successful countries, Bangladesh was effectively reduced
GHG/EC while the country was mediocre for reducing EC/P/HDI. Other than
Bangladesh, only Sri Lanka accomplished this. Another of the two successful
countries, Mongolia was effective for reducing EC/P/HDI while the country was
mediocre for GHG/EC. Other than Mongolia, only Pakistan accomplished this. The
Philippines was the only other country that effectively reduced EC/P/HDI, but the
country was ineffective for lowering GHG/EC. Thailand was the only country to
lower GHG/EC effectively, but the country was ineffective in reducing EC/P/HDI.
240
The modified Kaya identity demonstrates the important factors that the very
successful and successful countries utilized.
• Finding #5: Path to a successful development outcome (The
answers to the research question)
The quantitative analysis and qualitative interviews with experts from
multiple countries demonstrates that there is no single way for a country to reach a
successful Sustainable development outcome. National policy guidance was highly
effective for Myanmar to improve GHGpc, for Nepal to improve HDI health and
income, and GHGpc and for Bangladesh to improve HDI. External factors
influenced Nepal to reduce GHGs from LUFC, but not because of a pressure from
the international community or taking on commitments to the Kyoto Protocol.
Instead, it successfully adjusted to the reduction in demand for its forest product in
India. Financing by development agencies was apparently effective for Mongolia’s
success. Actually, this single factor was the only one common to all four countries.
Its importance is less clear in the other three countries’ successes according to the
experts who evaluated the benefits from international aid. Changes in the mix of
economic activities were very effective for Myanmar to improve GHG and HDI

241
together with the shift from agriculture and forestry it shifted to exports of natural
resources and tertiary industries. Nepal shifted to a different development path
when it shifted from relying on forestry to an economy tied to remittances from
overseas workers and the service sector.
• Finding #6: Consistency with the SDGs
It was found that, during the research period of 1990-2010, the outcome of
the four successful countries was consistent with all of the health, education,
income and GHG related SDGs even though SDGs were introduced five years later
than the study period except
(i) Bangladesh’s GHG related goals,
(ii) Myanmar’s health and education related goals, and
(iii) Mongolia’s health and education related goals.
Hence, Nepal was the only country to meet all of those goals among those
four countries. Therefore, to achieve SDGs it is recommended that Bangladesh
should take actions that reduce its GHG emissions; Myanmar should improve both
health and education; Mongolia should work to improve human health and

242
education, and Nepal should maintain its current balanced effort during the fifteen-
year period of the SDGs.
• Findings by qualitative analysis on questionings to experts
The qualitative analysis brought some valuable insights that helped to
explain what the quantitative data analysis could not tell. For example, during the
military regime of Myanmar, the quantitative data cannot explain why such foreign
investments were possible. But one expert revealed that “international sanctions
were taken seriously by only a few donor countries, and the sanction regime was
not effective.” This statement tells the reality that cannot be revealed by the
quantitative data. Another expert also wrote “Bangladesh has been constantly
politically unstable, but this has been predictable, and in my experience, this has
not really shown up in daily life in Bangladesh. Despite recent events, Bangladesh
has been quite peaceful over the period 2002 – 2012.” This observation also
provides insight which cannot be found in literature reviews.
243
• Limitations of this study
One limitation of the quantitative data analysis is nobody knows if the data
can be reliable or accurate in some countries particularly during periods of military
regimes or dictatorships. There are also questions about the reliability of the
qualitative analysis based upon interviews with in-country development experts. A
number of professionals who are working in internationally recognized
organizations opted not to participate and stated that they had no idea why the
observed trends were occurring raises questions about how familiar experts as a
whole are with the issues of environment and development. Some who responded
gave information about what happened outside of the time frame, and some were
unfamiliar with aspects of the issue. Therefore, even the best practices done here in
this dissertation might not be capable of explaining the findings.
• Additional work that might be needed.
This dissertation was only for a specific 20-year period of 1990-2010
which was a crucial part of the history of international attempts to act on climate
change from the first IPCC report to near the end of the implementation of the
Kyoto Protocol period. It will be quite interesting to continue this work up to 2015
244
and into the future to see what happens as we enter the Paris Agreement phase. On
the other hand, detailed analysis on each of those unsuccessful countries may
provide some additional insights. Moreover, it will be also quite interesting to
expand this work to Africa and South America where many more developing
counties are located, and then to compare what happened in Asia to other
developing countries.
It was also observed that regardless of area and wealth, the majority of
countries have Education at the top among the HDI indicators. It will be interesting
to find out which is the true reason, (1) during this period, all over the world,
Education was the real driver of HDI improvement, or (2) the current HDI
emphasizes the impact of Education too much (the current calculation of HDI is too
biased toward the Education component.)

245
REFERENCE LIST Anadon, L.D. and J.P. Holdren. 2009. “Policy for Energy-Technology Innovation”
in Gallagher, K.S. (ed.) Acting in Time in Energy Policy. Brookings Institution Press: Washington, DC. 89-127.
Bangladesh profile – Timeline, 1971-2016 2017. Accessed February 27, 2017.
http://www.bbc.com/news/world-south-asia-12651483. Barquin, Rafa. 2006. A Skeptical Vision of the Environmental Kuznets Curve: The
Case of Sulfur Dioxide. International Journal of Sustainable Development and World Ecology 13. 6: 513-524.
Boutaud, Aurelien, Natacha Gondran and Christian Brodhag. 2006. (Local)
Environmental Quality versus (Global) Ecological Carrying Capacity: What Might Alternative Aggregated Indicators bring to the Debates about Environmental Kuznets Curves and Sustainable Development. International Journal of Sustainable Development. 9. 3: 297.
Brock, William and M. Scott Taylor. 2010. The Green Solow Model. J Econ Growth.
15:127–153. Chandler, William, 2000. Petroleum Geoeconomics in Energy and Environment in
the Transition Economies. Westview Press: Boulder. 93-138. Chester, C. and W. Moomaw. 2008. A Taxonomy of Collaborative Governance: A
Guide to Understanding the Diversity of International and Domestic Conservation Accords. International Environmental Agreements. Vol. 8. 187-206.
Climate Analysis Indicators Tool (CAIT) 2.0. ©2014. Washington, DC: World
Resources Institute. Available online at: http://cait2.wri.org (full citations are available at http://cait2.wri.org/faq.html#q07).
Cohen, Joel E. 2005. Human Population Grows Up. Scientific American, Vol. 293.
Nr.3. 48-56.

246
Conca, James. The Paris Agreement: As Trump Pulls Out, Governors Jump In.
Forbes. June 4, 2017. Accessed June 5, 2017. https://www.forbes.com/sites/jamesconca/2017/06/04/the-paris-agreement-as-trump-pulls-out-governors-jump-in/#5bb4701f5c57.
Costanini, Valeria and Chiara Martini. 2007. A Modified Environmental Kuznets
Curve for Sustainable Development Assessment Using Panel Data. FEEM Working Paper Series 148.06. https://papers.ssrn.com/sol3/papers.cfm?abstract_id=951457.
Dasgupta, Partha. 2007. “Commentary: The Stern Review’s Economics of Climate
Change.” National Institute Economic Review No. 199, January. http://ner.sagepub.com/cgi/reprint/199/1/4.pdf.
Dasgupta, S., Laplante, B., Wang, H., & Wheeler, D., 2002. Confronting the
Environmental Kuznets Curve. Journal of Economic Perspectives. 16. 147–168. Developing Countries make Strides to cut GHG Emissions. 2003. Oil & Gas
Journal 101. 2 (Jan 13, 2003): 26. Ehrlich, Paul R.; Holdren, John P. (1971). "Impact of Population Growth". Science.
American Association for the Advancement of Science. 171 (3977): 1212–1217. FAO, 2014. FAOSTAT Emissions database (LULUCF (net forest conversion) data). Ferrini, Luca, 2012. Assessing the Viability of a Complete Environmental Kuznets
Curve. University of Reading. http://www.e-ir.info/2012/10/19/assessing-the-viability-of-a-complete-environmental-kuznets-curve/
Focacci, Antonio. 2003. Empirical Evidence in the Analysis of the Environmental
and Energy Policies of a Series of Industrialised Nations, during the Period 1960–1997, Using Widely Employed Macroeconomic Indicators. University of Bologna, Piazza Scaravilli, 2-40126. Bologna, Italy.
Ministry of Forests and Soil Conservation. “Forestry Sector Policy 2000.”

247
Accessed April 16, 2017. http://theredddesk.org/sites/default/files/forestry_sector_policy_2000_0.pdf#search=%27nepal+forest+policy%27.
Gallagher, Kelly Sims. 2006. China Shifts Gears: Automakers, Oil, Pollution, and
Development. Cambridge: The MIT Press. Gallagher, Kelly Sims. 2013. Innovation and Technology Transfer Across Global
Value Chains: Evidence from China’s PV Industry. Climate Technology & Development Case Study. Climate & Development Knowledge Network.
Gallagher, Kelly Sims. 2014. Chapter 7: The Global Diffusion of Cleaner Energy
Technologies. Goldemberg, Jose. 1998. Leapfrog Energy Technologies. Energy Policy, Volume
26, Issue 10, pp. 729-741. Goodland, Robert J.A. 1992. The Case That the World Has Reached Limits.
Population, Technology and Lifestyle: The Transition to Sustainability. Ch 1, pp 15-27.
Grossman, G. M., and A. B. Krueger.1991. Environmental Impacts of a North
American Free Trade Agreement. National Bureau of Economic Research Working Paper 3914, NBER, Cambridge MA.
Grossman, G. M. and A. B Krueger. 1995. Economic growth and the environment.
Quarterly Journal of Economics. 110, 353–377. Grubler, Arnulf. 2003. Technology and Social Change. Cambridge University Press.
ISBN 0 521 59109 0. 464. Halila, Fawzi. 2007. “The Adoption and Diffusion of Environmental Innovations.”
PhD diss. Luleå University of Technology, Department of Business Administration and Social Sciences. ISSN: 1402-1544.
Hardin, Garrett. 1968. The Tragedy of the Commons. Science, Vol. 162, No.

248
3859, 13 December 1968. 1243-1248. Hascic, Ivan. 2010. Climate Policy and Technological Innovation and Transfer: An
Overview of Trends and Recent Empirical Results. OECD Environment Working Papers, No. 30, OECD Publishing.
Holdren, John P. 2000. Environmental Degradation: Population, Affluence,
Technology, and Sociopolitical Factors. Environment 42. 6 (Jul/Aug 2000): 4-5.
Holdren, John P. 2008. Science and Technology for Sustainable Well-Being.
Science 319: 424-434. IEA. 2007. Oil Supply Security: Emergency Response of IEA Countries. Chapter 1,
OECD/IEA: Paris. 15-30. Iida, Takeshi and Kenji Takeuchi. 2010. Does Free Trade Promote Environmental
Technology Transfer? Journal of Economics (2011) 104:159–190. Jaffe, Amy Myers. 2004. Geopolitics of Energy. Encyclopedia of Energy. Elselvier:
843-857. Johnson, Daniel Kent Neil. 2010. Challenges to Technology Transfer: A Literature
Review of the Constraints on Environmental Technology Dissemination. Colorado College Working Paper No. 2009-07. https://papers.ssrn.com/sol3/Data_Integrity_Notice.cfm?abid=1456222.
Johnstone, Nick, Ivan Hascic and Margarita Kalamova. 2010. Environmental
Policy Design Characteristics and Technological Innovation: Evidence from Patent Data. OECD Environment Working Papers, No. 16. OECD Publishing.
Kates, Robert W. 2000. Population and Consumption: What We Know, What We
Need to Know. Environment 42. 3 (Apr 2000): 10-19. Keshav Raj Kanel, Ph.D. “Current Status of Community Forestry in Nepal”.
Community Forestry Division Department of Forest Kathmandu, Nepal.

249
Submitted to Regional Community Forestry Training Center for Asia and the Pacific Bangkok, Thailand. January 2005.
Kidd, Jeremy Lynn. 2009. “Probing the Mechanics of Environmental Kuznets
Curve Theory.” Unpublished dissertation, Utah State University. Klare, Michael T. 2001. The New Geography of Conflict. Foreign Affairs. Vol. 80,
No. 3 (May - Jun., 2001). 49-61. Lewis, Joanna and Kelly Sims Gallagher. 2011. Energy and Environment in China
(PRC): Achievements and Enduring Challenges. The Global Environment: Institutions, Law, and Policy (Third Edition). CQ Press: Washington, DC. 259-284.
Meckling, Jonas O. and Gu Yoon Chung. 2009. Sectoral Approaches for a Post-
2012 Climate Regime: A Taxonomy. Climate Policy, volume 9, issue 6: 652-668. Mertz, O., Halsnæs, K., and JE Olesen. 2009. Adaptation to Climate Change in
Developing Countries. Environmental Management, Vol 43, No. 5, May, 743-752.
Moomaw, W.R. and G. Unruh. 1997. Are Environmental Kuznets Curves
Misleading Us? The Case of CO2 Emissions. Environment and Development Economics. Vol. 2. Cambridge.
Moomaw, W.R. and G. Unruh. 1998. Are Environmental Kuznets Curves
Misleading Us? The case of CO2 emissions. Environment and Development Economics, 2:451-463. (BB)
Moomaw, W.R. and D. M. Tullis. 1994 "Charting Development Paths: A Multi-
country Comparison of Carbon Dioxide Emissions." Industrial Ecology and Global Change. Cambridge University Press, pp. 157-172, 1994.
Moomaw, W. R. and D. M. Tullis. 1999. “Population, Affluence or Technology:
The Case of CO2.” In The People and Their Planet, edited by B. S. Baudot and W. R. Moomaw. St. Martin’s Press, New York, NY.
250
Mongolia profile – Timeline, 12671-2016 2017. Accessed February 27, 2017.
http://www.bbc.com/news/world-asia-pacific-15466133. Myanmar profile – Timeline, 1942-2016 2017. Accessed February 27, 2017.
http://www.bbc.com/news/world-asia-pacific-12992883. Najam, Adil. 2004. “The View from the South: Developing Countries in Global
Environmental Politics.” In The Global Environment: Institutions, Law and Policy, edited by Regina Axelrod, David Downie and Norman J. Vig. Pages 224-243.
National Academy of Sciences, National Academy of Engineering, and National
Research Council. 2009. America’s Energy Future: Technology and Transformation. Washington, DC. 27-30 and Chapter 3.
Nepal profile – Timeline, 1950-2016 2017. Accessed February 27, 2017.
http://www.bbc.com/news/world-south-asia-12499391. Ockwell, David et al. 2010. Enhancing Developing Country Access to Eco-
Innovation: The Case of Technology Transfer and Climate Change in a Post-2012 Policy Framework. OECD Environment Working Papers 12.
Orban, Anita. 2008. Power, Energy, and the New Russian Imperialism. Praeger
Security International: Westport, CT and London. Ostrom, Elinor. 1990. “Chapter 1” in Governing the Commons. Cambridge
University Press. Our Common Future: The World Commission on Environment and Development.
1987. Oxford University Press. “Policy, Act, Rules, Regulations and Guidelines related to the DoF”. Ministry of
Forests and Environment. Accessed April 16, 2017. http://dof.gov.np/about_us/policy.
251
Ratha, Dilip; Mohapatra, Sanket; and Silwal, Ani. “The Migration and Remittances Factbook 2011.” Migration and Remittances Unit, World Bank. Accessed June 10, 2018. http://siteresources.worldbank.org/INTPROSPECTS/Resources/334934-1199807908806/Mongolia.pdf.
Raymond, Leigh. 2004. Economic Growth as Environmental Policy?
Reconsidering the Environmental Kuznets Curve. Journal of Public Policy 24, 3, 327-348. Cambridge University Press.
“REDD Country Report”. REDD Research and Development Center. Accessed
April 16, 2017. https://www.ffpri.affrc.go.jp/reddrdc/ja/redd/_trends_2014/04_country_report_myanmar.pdf#search=%27%E3%83%9F%E3%83%A3%E3%83%B3%E3%83%9E%E3%83%BC+%E6%A3%AE%E6%9E%97%E6%94%BF%E7%AD%96%27.
Reddy, Amulya K.N. 2000. “Energy and Social Issues.” In World Energy
Assessment. UNEP and UNDP, pp. 39-53. Rogers, Everett. 1995. Diffusion of Innovations. Reviewed by Orr, Greg. 2003. Rosa, Eugene A. and Thomas Dietz. 2012. “Human Drivers of National
Greenhouse-Gas Emissions.” Nature Climate Change 2, 581–586 doi:10.1038/nclimate1506.
Rockstrom, Johan et al. 2009. “A Safe Operating Space for Humanity.” Nature Vol
461, 472-475 (24 September 2009). Rosa, Eugene A. and Thomas Dietz. 2012. “Human Drivers of National
Greenhouse-Gas Emissions.” Nature Climate Change 2, 581–586 doi:10.1038/nclimate1506.
Sachs, Wolfgang. 2002. The Jo’burg Memo: Fairness in a Fragile World. Heinrich
Böll Foundation, Memorandum for the World Summit on Sustainable Development.

252
Shaffer, Brenda. 2009. Energy Politics. University of Pennsylvania Press:
Philadelphia. Read Introduction and Chapters 1 -6, pp. 1-113. Stern, David I. 1997. “Progress on the Environmental Kuznets Curve?”
Environment and Development Economics. Vol. 3, pp. 173-196. Stern, David. 2004. The Rise and Fall of the Environmental Kuznets Curve. World
Development Vol. 32, No. 8, pp. 1419–1439, 2004. Stern, Nicholas. 2006. Executive Summary of the Stern Review on the Economics
of Climate Change. Report to the Prime Minister and the Chancellor of the Exchequer on the Economics of Climate Change. www.hm-treasury.gov.uk/sternreview_index.htm.
Stockholm Declaration on the Human Environment. 1972. Strategy on Climate Change for 2020 and Beyond. Europa: Summaries of EU
Legislation. August 31, 2011. http://europa.eu/legislation_summaries/energy/european_energy_policy/l28188_en.htm
The Dictionary of Sustainable Development.
www.sustainabilitydictionary.com/the-kaya-identity/. Ugaglia, Adeline. 2010. Diffusion of Environmental Innovations for Pesticides
Reduction in Grape Growing. Paper presented at the DRUID-DIME Academy Winter 2010 PhD Conference.
United Nations Development Programme. http://hdr.undp.org. Accessed on July
14, 2014. United Nations Division for Social Policy and Development Disability. Accessed
on January 27, 2018. https://www.un.org/development/desa/disabilities/envision2030.html.
253
Unruh, G.C. and W.R. Moomaw. 1998. “An Alternative Analysis of Apparent EKC-Type Transitions.” Ecological Economics 25 (2): 221-229.
Wolfram, C., Shelef, O. and Paul Gertler. 2012. “How Will Energy Demand
Develop in the Developing World?” The Journal of Economic Perspectives. 26. 1 (Winter 2012): 119-138.
“World Bank Indicator – Net ODA received per capita (current US$).” World Bank.
January 11, 2015. https://data.worldbank.org/indicator/DT.ODA.ODAT.PC.ZS?view=chart.
World Development Indicators. 2003. The International Bank for Reconstruction
and Development/THE WORLD BANK. World Development Report 2010. Development and Climate Change. 2009.
Energizing Development Without Compromising the Climate. Chapter 4. 10: World Bank: Washington, DC. 189-229.
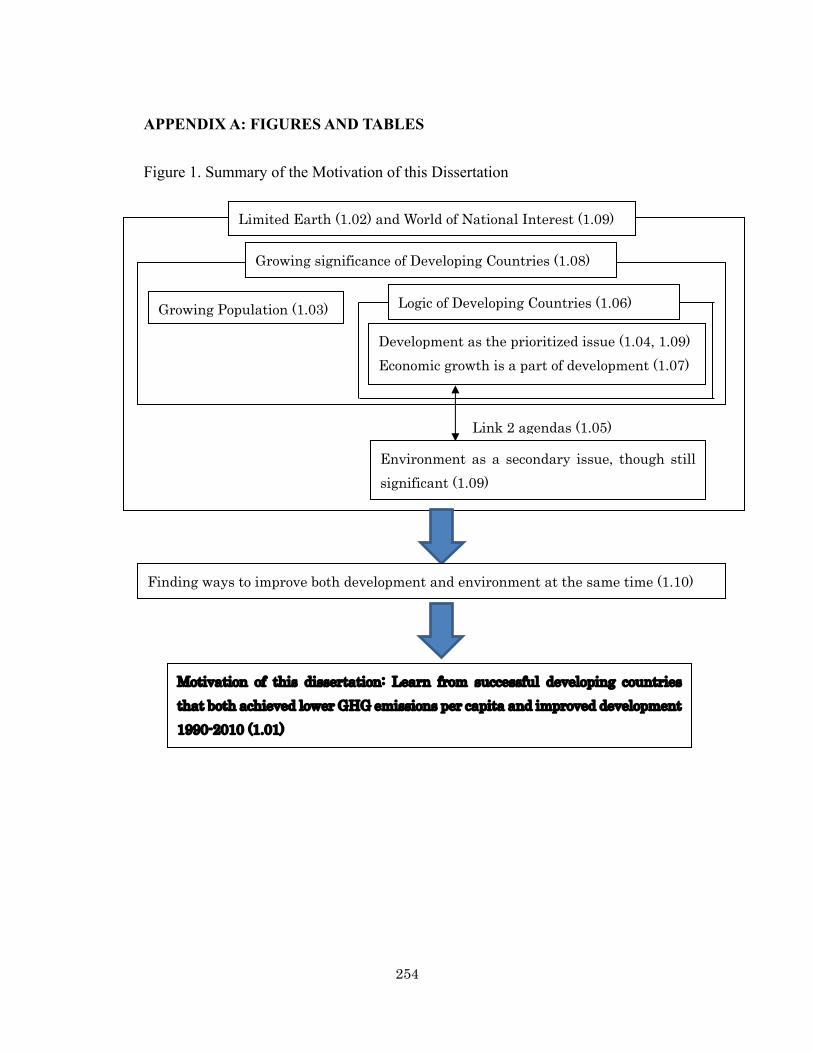
254
APPENDIX A: FIGURES AND TABLES Figure 1. Summary of the Motivation of this Dissertation
Growing Population (1.03)
Growing significance of Developing Countries (1.08)
Limited Earth (1.02) and World of National Interest (1.09)
Development as the prioritized issue (1.04, 1.09) Economic growth is a part of development (1.07)
Environment as a secondary issue, though still significant (1.09)
Link 2 agendas (1.05)
Logic of Developing Countries (1.06)
Motivation of this dissertation: Learn from successful developing countries that both achieved lower GHG emissions per capita and improved development 1990-2010 (1.01)
Finding ways to improve both development and environment at the same time (1.10)

255
Figure 2. GHG Emissions per capita and HDI of 180 countries in 2010.
SOURCE: Climate Analysis Indicators Tool (GHGpc) and United Nations Development Programme (HDI)
0
10
20
30
40
50
60
70
80
0.000 0.200 0.400 0.600 0.800 1.000
GH
Gpc
in 2
010
(incl
udes
land
use
chan
ge) M
etri
c ton
s CO
2
Human Development Index in 2010

256
Figure 3. Trajectory of CO2 ratio among GHG1
SOURCE: Climate Analysis Indicators Tool (GHG)
1 The grouping has been done from the richest to the poorest at the year of 2010 where each group has 13 countries.
Year
Perc
enta
ge o
f CO
2 Em
issi
on to
tota
l GH
G E
mis
sion

257
Appendix 1. GHG Emissions Per Capita by HDI for 10 Group Countries, 1990-2010.
Figure 4. GHG Emissions Per Capita by HDI, 1st Group Countries, 1990–2010.
SOURCE: Climate Analysis Indicators Tool (GHGpc) and United Nations Development Programme (HDI) Figure 5. GHG Emissions Per Capita by HDI, 2nd Group Countries, 1990–2010.
SOURCE: Climate Analysis Indicators Tool (GHGpc) and United Nations Development Programme (HDI)
-100
102030405060708090
100
0.0 0.2 0.4 0.6 0.8 1.0
SwitzerlandLuxembourgSwedenFinlandNorwayDenmarkJapanIcelandUnited StatesGermanyFranceAustriaBelgium
(ton
spe
rye
ar,C
O2
equi
vale
nt)
-10
0
10
20
30
40
50
60
70
80
90
100
0.0 0.2 0.4 0.6 0.8 1.0
CanadaNetherlandsItalyAustraliaUKQatarBruneiSpainIrelandSingaporeNew ZealandKuwaitIsrael
(ton
sper
year
,CO
2eq
uiva
lent
)
GHGpc Human Development Index, 1990, 1995, 2000, 2005 and 2010. 1990-2010
GHGpc Human Development Index, 1990, 1995, 2000, 2005 and 2010. 1990-2010
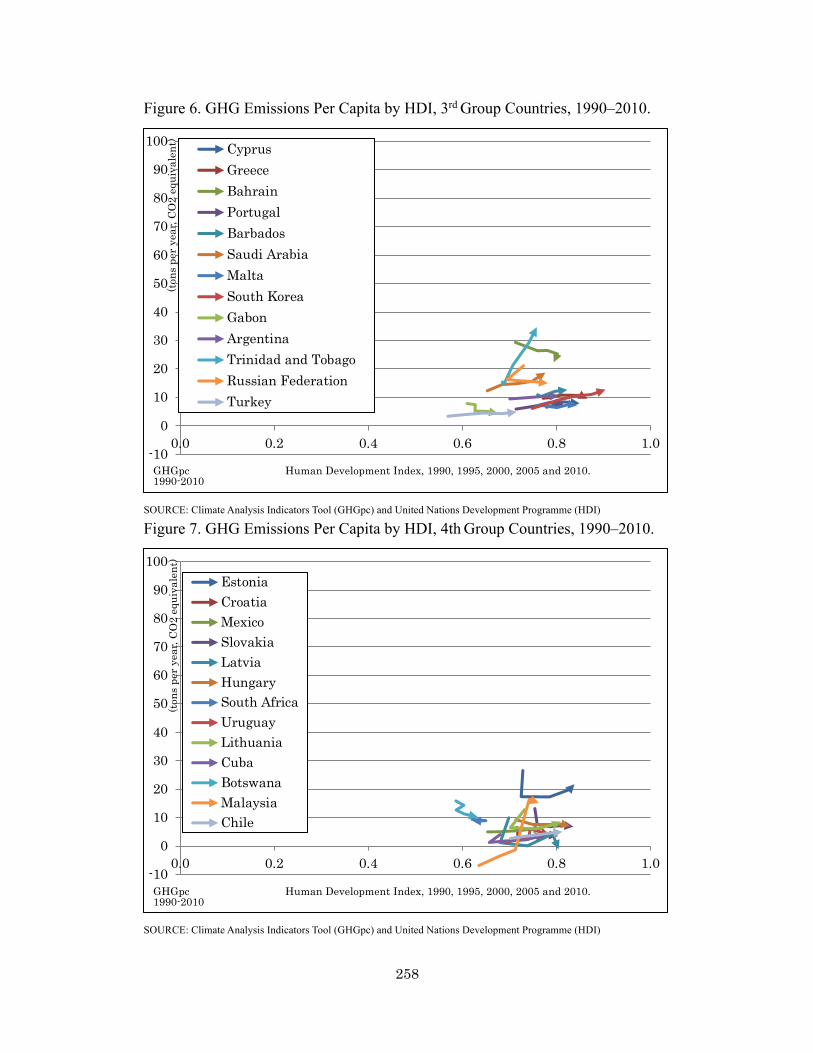
258
Figure 6. GHG Emissions Per Capita by HDI, 3rd Group Countries, 1990–2010.
SOURCE: Climate Analysis Indicators Tool (GHGpc) and United Nations Development Programme (HDI) Figure 7. GHG Emissions Per Capita by HDI, 4th Group Countries, 1990–2010.
SOURCE: Climate Analysis Indicators Tool (GHGpc) and United Nations Development Programme (HDI)
-10
0
10
20
30
40
50
60
70
80
90
100
0.0 0.2 0.4 0.6 0.8 1.0
CyprusGreeceBahrainPortugalBarbadosSaudi ArabiaMaltaSouth KoreaGabonArgentinaTrinidad and TobagoRussian FederationTurkey
(ton
sper
year
,CO
2eq
uiva
lent
)
-10
0
10
20
30
40
50
60
70
80
90
100
0.0 0.2 0.4 0.6 0.8 1.0
EstoniaCroatiaMexicoSlovakiaLatviaHungarySouth AfricaUruguayLithuaniaCubaBotswanaMalaysiaChile
(ton
spe
rye
ar,C
O2
equi
vale
nt)
GHGpc Human Development Index, 1990, 1995, 2000, 2005 and 2010. 1990-2010
GHGpc Human Development Index, 1990, 1995, 2000, 2005 and 2010. 1990-2010
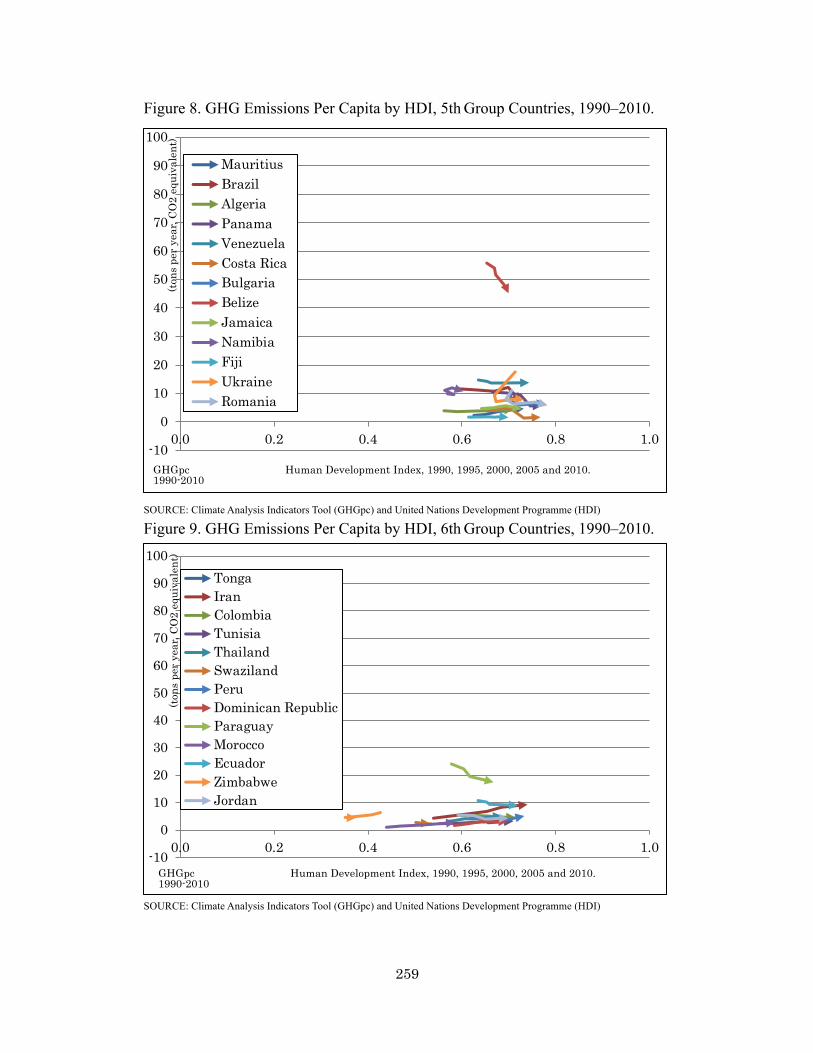
259
Figure 8. GHG Emissions Per Capita by HDI, 5th Group Countries, 1990–2010.
SOURCE: Climate Analysis Indicators Tool (GHGpc) and United Nations Development Programme (HDI) Figure 9. GHG Emissions Per Capita by HDI, 6th Group Countries, 1990–2010.
SOURCE: Climate Analysis Indicators Tool (GHGpc) and United Nations Development Programme (HDI)
-10
0
10
20
30
40
50
60
70
80
90
100
0.0 0.2 0.4 0.6 0.8 1.0
MauritiusBrazilAlgeriaPanamaVenezuelaCosta RicaBulgariaBelizeJamaicaNamibiaFijiUkraineRomania
(ton
sper
year
,CO
2eq
uiva
lent
)
-10
0
10
20
30
40
50
60
70
80
90
100
0.0 0.2 0.4 0.6 0.8 1.0
TongaIranColombiaTunisiaThailandSwazilandPeruDominican RepublicParaguayMoroccoEcuadorZimbabweJordan
(ton
spe
rye
ar,C
O2
equi
vale
nt)
GHGpc Human Development Index, 1990, 1995, 2000, 2005 and 2010. 1990-2010
GHGpc Human Development Index, 1990, 1995, 2000, 2005 and 2010. 1990-2010

260
Figure 10. GHG Emissions Per Capita by HDI, 7th Group Countries, 1990–2010.
SOURCE: Climate Analysis Indicators Tool (GHGpc) and United Nations Development Programme (HDI) Figure 11. GHG Emissions Per Capita by HDI, 8th Group Countries, 1990–2010.
SOURCE: Climate Analysis Indicators Tool (GHGpc) and United Nations Development Programme (HDI)
-10
0
10
20
30
40
50
60
70
80
90
100
0.0 0.2 0.4 0.6 0.8 1.0
CongoCameroonMoldovaEl SalvadorPhilippinesSyriaCôte d'IvoireSenegalMauritaniaGuatemalaGambiaBoliviaAlbania
(ton
sper
year
,CO
2eq
uiva
lent
)
-10
0
10
20
30
40
50
60
70
80
90
100
0.0 0.2 0.4 0.6 0.8 1.0
HondurasGhanaIndonesiaNicaraguaGuyanaPapua N GuineaEgyptMongoliaArmeniaLesothoKyrgyzstanTajikistanKenya
(ton
sper
year
,CO
2eq
uiva
lent
)
GHGpc Human Development Index, 1990, 1995, 2000, 2005 and 2010. 1990-2010
GHGpc Human Development Index, 1990, 1995, 2000, 2005 and 2010. 1990-2010
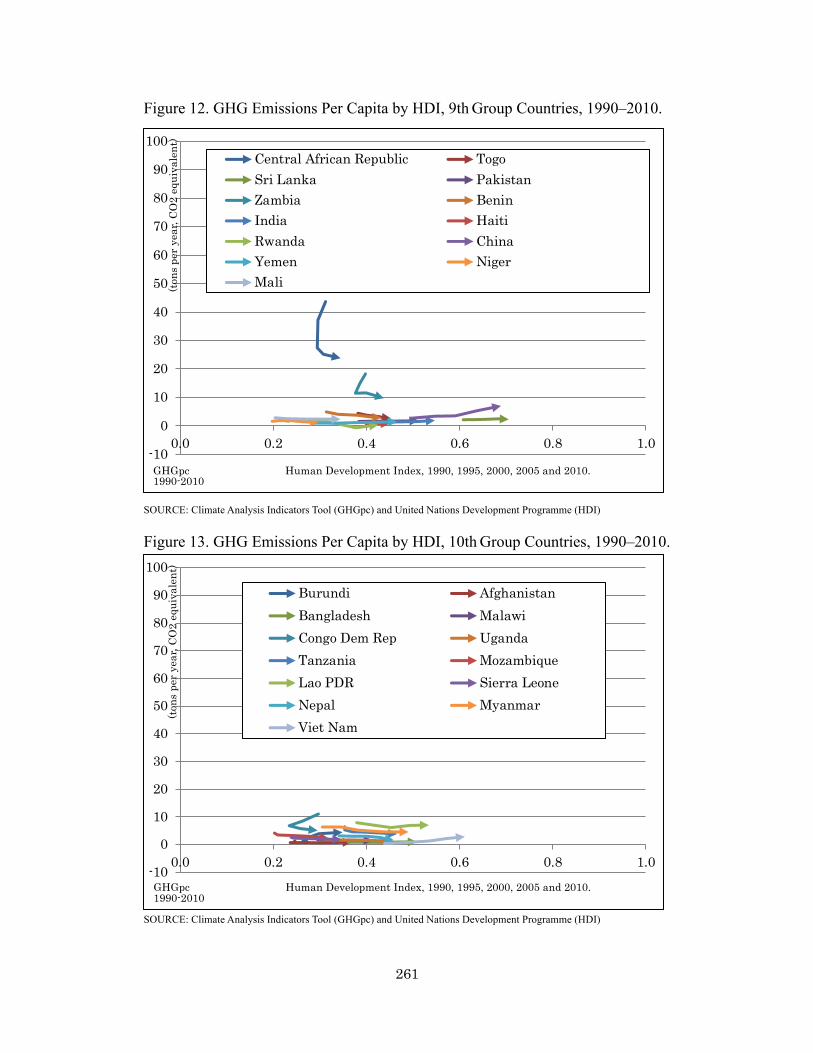
261
Figure 12. GHG Emissions Per Capita by HDI, 9th Group Countries, 1990–2010.
SOURCE: Climate Analysis Indicators Tool (GHGpc) and United Nations Development Programme (HDI) Figure 13. GHG Emissions Per Capita by HDI, 10th Group Countries, 1990–2010.
SOURCE: Climate Analysis Indicators Tool (GHGpc) and United Nations Development Programme (HDI)
-10
0
10
20
30
40
50
60
70
80
90
100
0.0 0.2 0.4 0.6 0.8 1.0
Central African Republic TogoSri Lanka PakistanZambia BeninIndia HaitiRwanda ChinaYemen NigerMali(t
onsp
erye
ar,C
O2
equi
vale
nt)
-10
0
10
20
30
40
50
60
70
80
90
100
0.0 0.2 0.4 0.6 0.8 1.0
Burundi AfghanistanBangladesh MalawiCongo Dem Rep UgandaTanzania MozambiqueLao PDR Sierra LeoneNepal MyanmarViet Nam
(ton
spe
rye
ar,C
O2
equi
vale
nt)
GHGpc Human Development Index, 1990, 1995, 2000, 2005 and 2010. 1990-2010
GHGpc Human Development Index, 1990, 1995, 2000, 2005 and 2010. 1990-2010

262
Figure 14. Greenhouse Gas Emissions Per Capita by Human Development Index, 1990–2010 (by individual countries).
SOURCE: Climate Analysis Indicators Tool (GHGpc) and United Nations Development Programme (HDI)
Human Development Index, 1990, 1995, 2000, 2005, 2010.
Gre
enho
use
Gas
Em
issi
on P
er C
apita
(in
tons
per
yea
r, CO
2 equ
ival
ent),
199
0, 1
995,
200
0, 2
005,
201
0.

263
Figure 15. Greenhouse Gas Emissions Per Capita by Human Development Index (by income groups), 1990–2010.
(in to
ns p
er y
ear,
CO2 e
quiv
alen
t)

264
Appendix 2. GHG Emissions Per Capita by HDI for 10 Group Countries, 1990-2010.
Figure 16. GHG Emissions Per Capita by HDI, 1st Group Countries, 1990–2010 (enlarged).
SOURCE: Climate Analysis Indicators Tool (GHGpc) and United Nations Development Programme (HDI)
0
5
10
15
20
25
30
35
0.75 0.80 0.85 0.90 0.95 1.00
SwitzerlandLuxembourgSwedenFinlandNorwayDenmarkJapanIcelandUnited StatesGermanyFranceAustriaBelgium
Human Development Index, 1990, 1995, 2000, 2005, 2010.
GH
G E
mis
sion
Per
Cap
ita
(tons
/yea
r, C
O2 e
quiv
alen
t), 1
990,
199
5, 2
000,
200
5, 2
010.
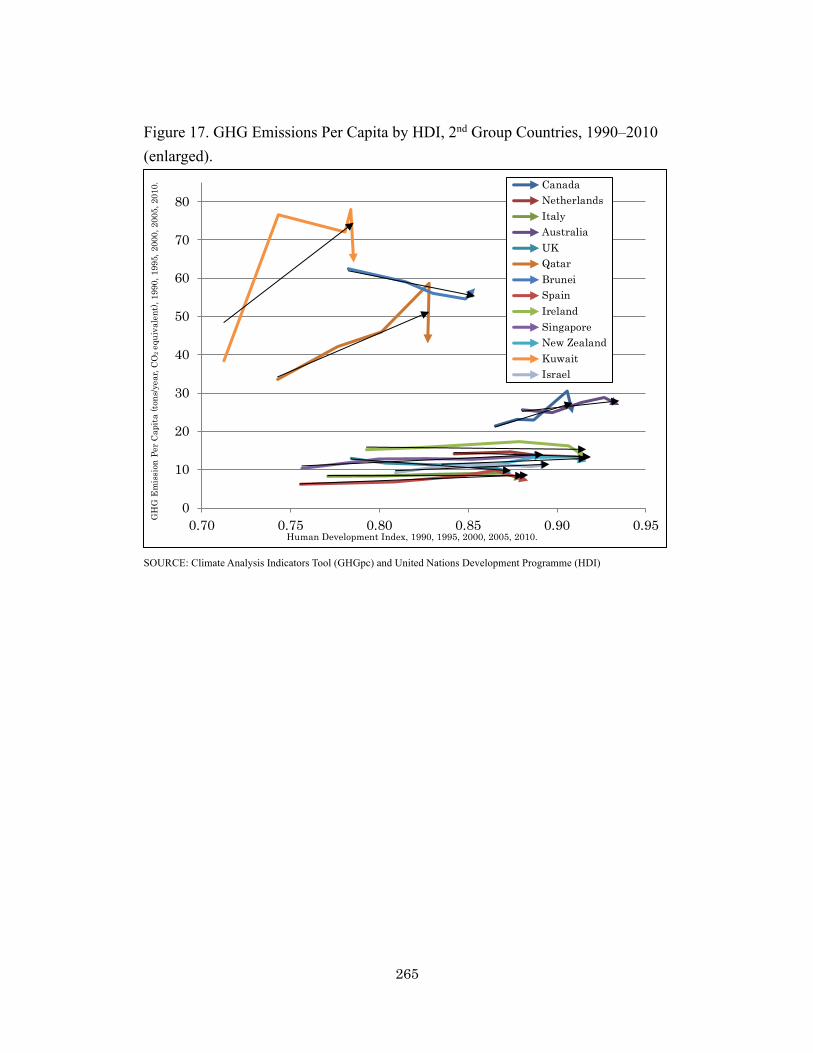
265
Figure 17. GHG Emissions Per Capita by HDI, 2nd Group Countries, 1990–2010 (enlarged).
SOURCE: Climate Analysis Indicators Tool (GHGpc) and United Nations Development Programme (HDI)
0
10
20
30
40
50
60
70
80
0.70 0.75 0.80 0.85 0.90 0.95
CanadaNetherlandsItalyAustraliaUKQatarBruneiSpainIrelandSingaporeNew ZealandKuwaitIsrael
Human Development Index, 1990, 1995, 2000, 2005, 2010.
GH
G E
mis
sion
Per
Cap
ita
(tons
/yea
r, C
O2 e
quiv
alen
t), 1
990,
199
5, 2
000,
200
5, 2
010.

266
Figure 18. GHG Emissions Per Capita by HDI, 3rd Group Countries, 1990–2010.
SOURCE: Climate Analysis Indicators Tool (GHGpc) and United Nations Development Programme (HDI)
Figure 19. GHG Emissions Per Capita by HDI, 4th Group Countries, 1990–2010 (enlarged).
SOURCE: Climate Analysis Indicators Tool (GHGpc) and United Nations Development Programme (HDI)
0
5
10
15
20
25
30
35
40
0.55 0.60 0.65 0.70 0.75 0.80 0.85 0.90 0.95
CyprusGreeceBahrainPortugalBarbadosSaudi ArabiaMaltaSouth KoreaGabonArgentinaTrinidad and TobagoRussian FederationTurkey
-10
-5
0
5
10
15
20
25
30
0.55 0.60 0.65 0.70 0.75 0.80 0.85
Estonia CroatiaMexico SlovakiaLatvia HungarySouth Africa UruguayLithuania CubaBotswana MalaysiaChile
Human Development Index, 1990, 1995, 2000, 2005, 2010.
GH
G E
mis
sion
Per
Cap
ita
(tons
/yea
r, C
O2 e
quiv
alen
t), 1
990,
199
5, 2
000,
200
5, 2
010.
Human Development Index, 1990, 1995, 2000, 2005, 2010.
GH
G E
mis
sion
Per
Cap
ita
(tons
/yea
r, C
O2 e
quiv
alen
t), 1
990,
199
5, 2
000,
200
5, 2
010.

267
Figure 20. GHG Emissions Per Capita by HDI, 5th Group Countries, 1990–2010 (enlarged).
SOURCE: Climate Analysis Indicators Tool (GHGpc) and United Nations Development Programme (HDI)
0
10
20
30
40
50
60
0.55 0.60 0.65 0.70 0.75 0.80
MauritiusBrazilAlgeriaPanamaVenezuelaCosta RicaBulgariaBelizeJamaicaNamibiaFijiUkraineRomania
GH
G E
mis
sion
Per
Cap
ita
(tons
/yea
r, C
O2 e
quiv
alen
t), 1
990,
199
5, 2
000,
200
5, 2
010.
Human Development Index, 1990, 1995, 2000, 2005, 2010.
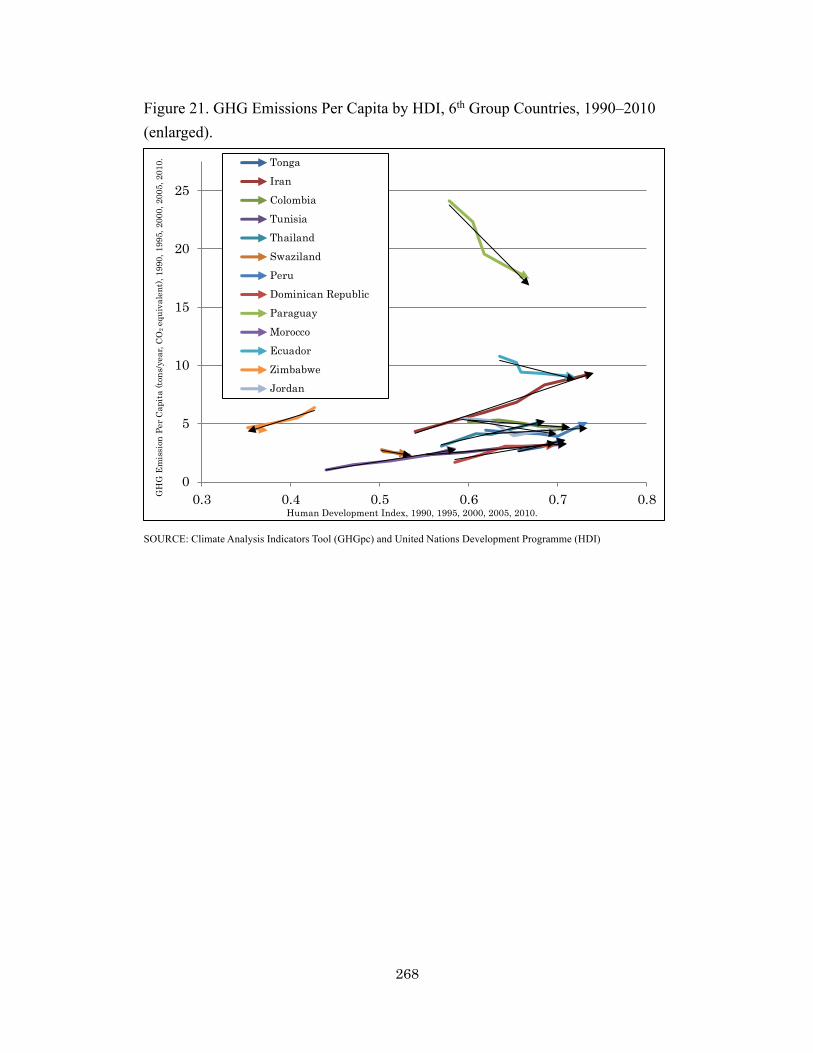
268
Figure 21. GHG Emissions Per Capita by HDI, 6th Group Countries, 1990–2010 (enlarged).
SOURCE: Climate Analysis Indicators Tool (GHGpc) and United Nations Development Programme (HDI)
0
5
10
15
20
25
0.3 0.4 0.5 0.6 0.7 0.8
TongaIranColombiaTunisiaThailandSwazilandPeruDominican RepublicParaguayMoroccoEcuadorZimbabweJordan
Human Development Index, 1990, 1995, 2000, 2005, 2010.
GH
G E
mis
sion
Per
Cap
ita
(tons
/yea
r, C
O2 e
quiv
alen
t), 1
990,
199
5, 2
000,
200
5, 2
010.
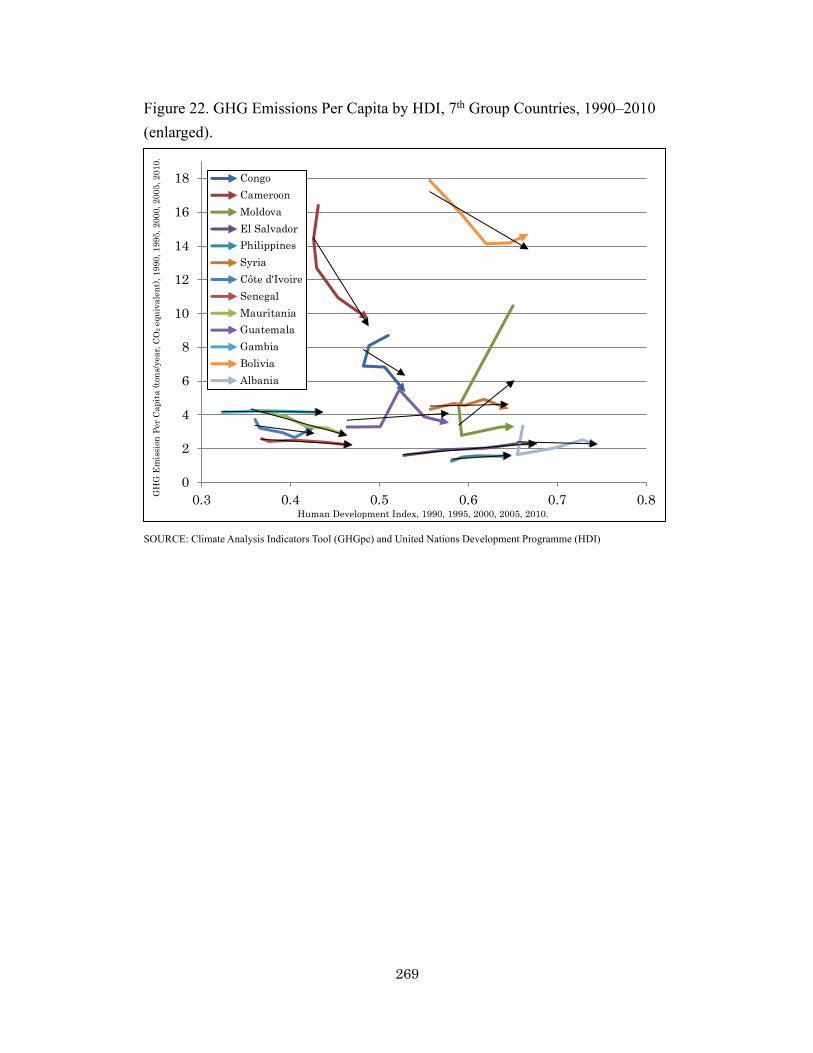
269
Figure 22. GHG Emissions Per Capita by HDI, 7th Group Countries, 1990–2010 (enlarged).
SOURCE: Climate Analysis Indicators Tool (GHGpc) and United Nations Development Programme (HDI)
0
2
4
6
8
10
12
14
16
18
0.3 0.4 0.5 0.6 0.7 0.8
CongoCameroonMoldovaEl SalvadorPhilippinesSyriaCôte d'IvoireSenegalMauritaniaGuatemalaGambiaBoliviaAlbania
Human Development Index, 1990, 1995, 2000, 2005, 2010.
GH
G E
mis
sion
Per
Cap
ita
(tons
/yea
r, C
O2 e
quiv
alen
t), 1
990,
199
5, 2
000,
200
5, 2
010.

270
Figure 23. GHG Emissions Per Capita by HDI, 8th Group Countries, 1990–2010 (enlarged).
SOURCE: Climate Analysis Indicators Tool (GHGpc) and United Nations Development Programme (HDI)
-5
0
5
10
15
20
25
0.30 0.40 0.50 0.60 0.70 0.80
HondurasGhanaIndonesiaNicaraguaGuyanaPapua N GuineaEgyptMongoliaArmeniaLesothoKyrgyzstanTajikistanKenya
Human Development Index, 1990, 1995, 2000, 2005, 2010.
GH
G E
mis
sion
Per
Cap
ita
(tons
/yea
r, C
O2 e
quiv
alen
t), 1
990,
199
5, 2
000,
200
5, 2
010.
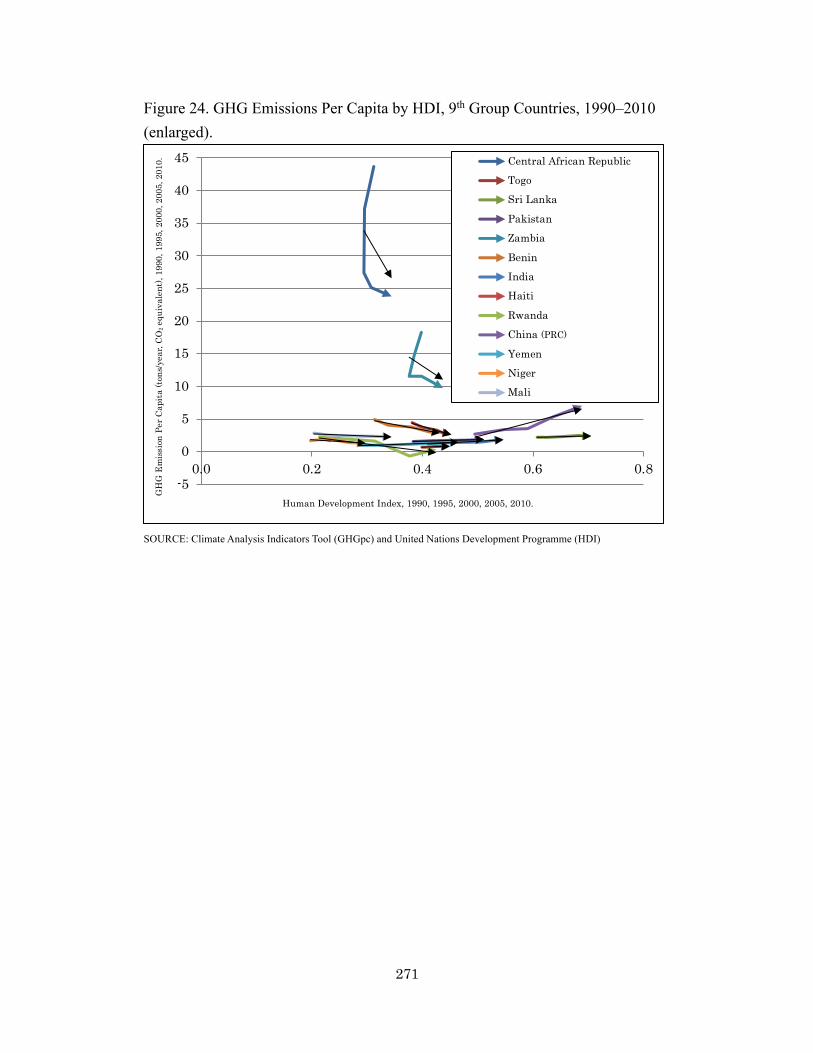
271
Figure 24. GHG Emissions Per Capita by HDI, 9th Group Countries, 1990–2010 (enlarged).
SOURCE: Climate Analysis Indicators Tool (GHGpc) and United Nations Development Programme (HDI)
-5
0
5
10
15
20
25
30
35
40
45
0.0 0.2 0.4 0.6 0.8
Central African RepublicTogoSri Lanka
PakistanZambia
BeninIndiaHaiti
RwandaChina
YemenNigerMali
Human Development Index, 1990, 1995, 2000, 2005, 2010.
GH
G E
mis
sion
Per
Cap
ita
(tons
/yea
r, C
O2 e
quiv
alen
t), 1
990,
199
5, 2
000,
200
5, 2
010.
(PRC)

272
Figure 25. GHG Emissions Per Capita by HDI, 10th Group Countries, 1990–2010 (enlarged).
SOURCE: Climate Analysis Indicators Tool (GHGpc) and United Nations Development Programme (HDI)
0
2
4
6
8
10
0.0 0.1 0.2 0.3 0.4 0.5 0.6 0.7
Burundi
Afghanistan
Bangladesh
Malawi
Congo Dem Rep
Uganda
Tanzania
Mozambique
Lao PDR
Sierra Leone
Nepal
Myanmar
Viet Nam
Human Development Index, 1990, 1995, 2000, 2005, 2010.
GH
G E
mis
sion
Per
Cap
ita
(tons
/yea
r, C
O2 e
quiv
alen
t), 1
990,
199
5, 2
000,
200
5, 2
010.
Vietnam

273
Appendix 3. GHG Emission per capita and HDI of Countries (these figures are to compare their shapes, so no values are indicated on each axis)
Figure 26. Trajectory Group - Downward Slope to the Right: Continuous Improvement of HDI and Slight Decrease of GHGpc
Countries Included: Jamaica, Tunisia, Ireland, United Kingdom, Italy, Mali, Malawi, Uganda,
France, Switzerland
SOURCE: Climate Analysis Indicators Tool (GHGpc) and United Nations Development Programme (HDI)

274
Figure 27. Trajectory Group - Steep Downward Slope to the Right: Continuous Improvement of HDI and Significant Decrease of GHGpc
Countries Included: Venezuela, Papua New Guinea, Honduras, Paraguay, Ghana, Ecuador, Mauritania, Cameroon, Togo, Benin, Mozambique, Nepal, Tanzania, Germany, Denmark SOURCE: Climate Analysis Indicators Tool (GHGpc) and United Nations Development Programme (HDI)

275
Figure 28. Trajectory Group - Upward Slope to the Right: Continuous Improvement of HDI and Significant Increase of GHGpc
Countries Included: El Salvador, Syria, Vietnam, India, China (PRC), Egypt, Tonga, Thailand, Iran, Mauritius, Chile, Mexico, Portugal, Cyprus, Greece, South Korea, New Zealand, Saudi Arabia, Netherlands
SOURCE: Climate Analysis Indicators Tool (GHGpc) and United Nations Development Programme (HDI)

276
Figure 29. Trajectory Group - Sloping to the Right: Continuous Improvement of HDI and Slight Increase or No Change in GHGpc
Countries Included: Turkey, Philippines, Morocco, Algeria, Argentina, Fiji, Gambia, Haiti, Pakistan, Sri Lanka, Yemen, Bangladesh SOURCE: Climate Analysis Indicators Tool (GHGpc) and United Nations Development Programme (HDI)

277
Figure 30. Trajectory Group - U-Shaped: Continuous Improvement in HDI, while GHGpc Initially Decreases then Eventually Increases
Countries Included: Countries Included: Luxembourg, Belize, Bolivia, Ivory Coast, Estonia, Croatia, Botswana, Brunei Darussalam, Iceland SOURCE: Climate Analysis Indicators Tool (GHGpc) and United Nations Development Programme (HDI)

278
Figure 31. Trajectory Group - Inverted U: Continuous Improvement in HDI, while GHGpc Initially Increases then Eventually Decreases
Countries Included: Qatar, Kuwait, Guatemala
SOURCE: Climate Analysis Indicators Tool (GHGpc) and United Nations Development Programme (HDI)
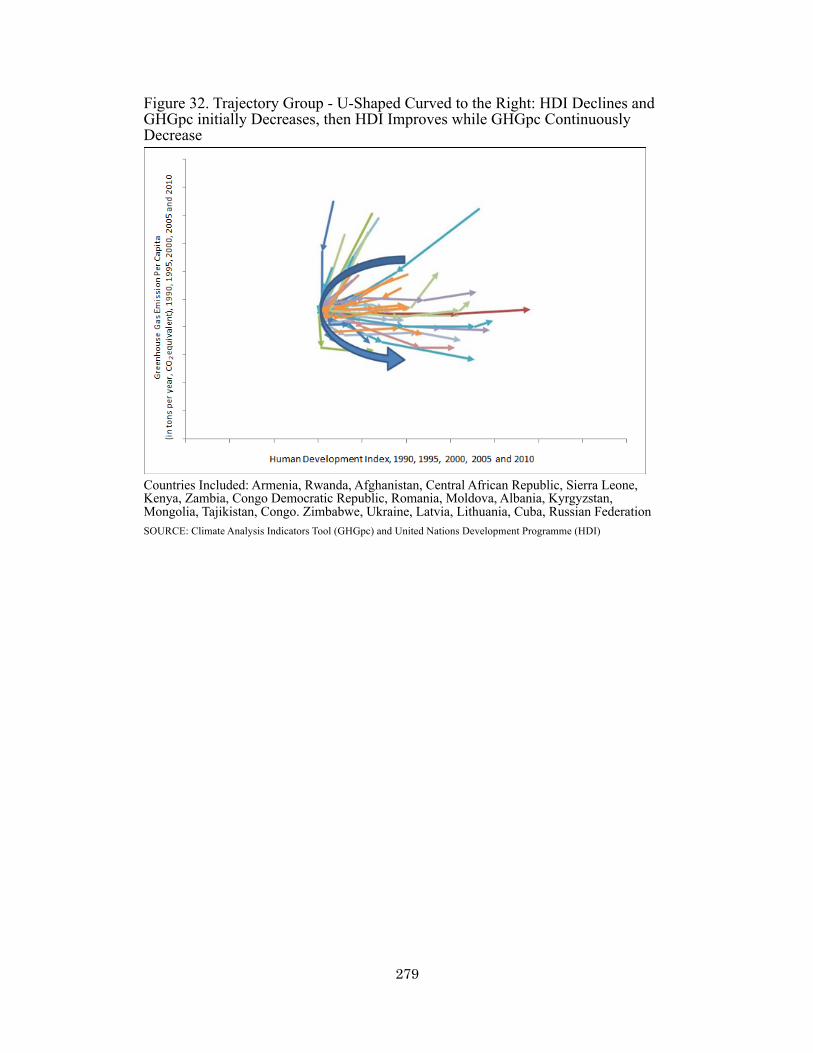
279
Figure 32. Trajectory Group - U-Shaped Curved to the Right: HDI Declines and GHGpc initially Decreases, then HDI Improves while GHGpc Continuously Decrease
Countries Included: Armenia, Rwanda, Afghanistan, Central African Republic, Sierra Leone, Kenya, Zambia, Congo Democratic Republic, Romania, Moldova, Albania, Kyrgyzstan, Mongolia, Tajikistan, Congo. Zimbabwe, Ukraine, Latvia, Lithuania, Cuba, Russian Federation SOURCE: Climate Analysis Indicators Tool (GHGpc) and United Nations Development Programme (HDI)
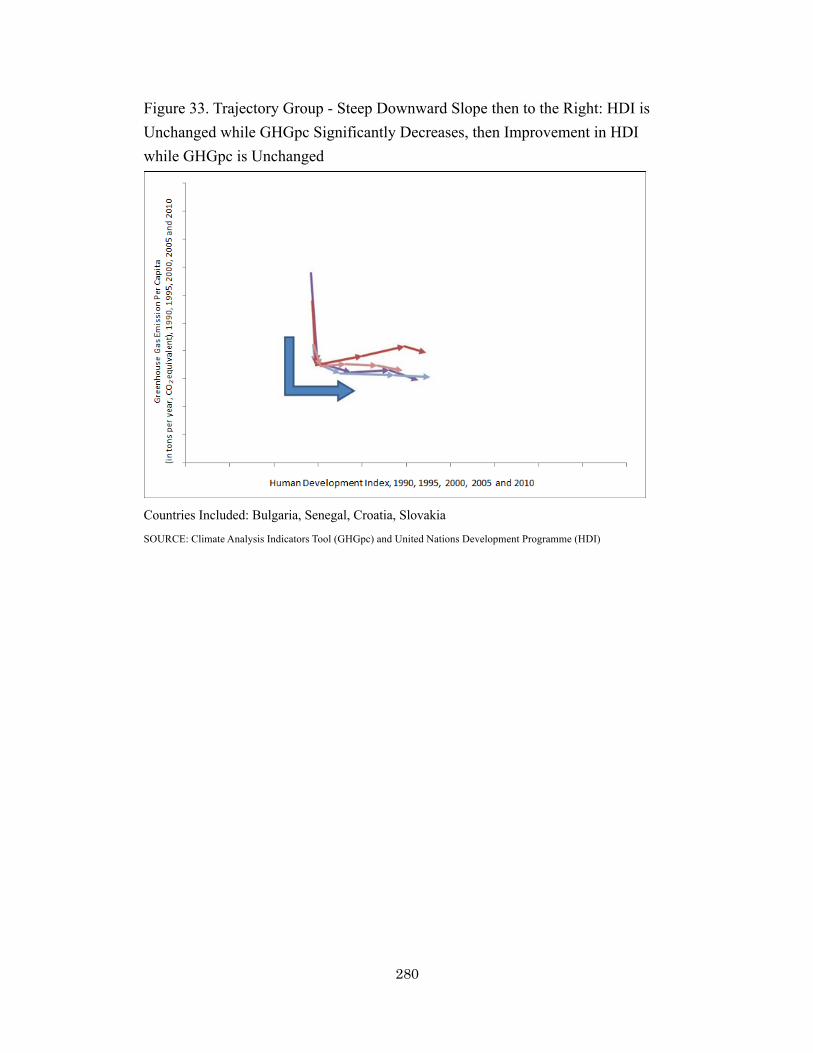
280
Figure 33. Trajectory Group - Steep Downward Slope then to the Right: HDI is Unchanged while GHGpc Significantly Decreases, then Improvement in HDI while GHGpc is Unchanged
Countries Included: Bulgaria, Senegal, Croatia, Slovakia
SOURCE: Climate Analysis Indicators Tool (GHGpc) and United Nations Development Programme (HDI)

281
Figure 34. Trajectory Group - Sloping to the Right then Steep Upward Slope: Improvement in HDI while GHGpc Unchanged, then Significant Increase in GHGpc with Slight HDI Improvement
Countries Included: Barbados, Trinidad and Tobago, Malta, Singapore, Australia
SOURCE: Climate Analysis Indicators Tool (GHGpc) and United Nations Development Programme (HDI)

282
Figure 35. Trajectory Group - Former Soviet Union
Countries Included: Armenia, Estonia, Kyrgyzstan, Latvia, Lithuania, Moldova, Russia, Tajikistan,
Ukraine Countries Not Included: Azerbaijan, Belarus, Georgia, Kazakhstan, Turkmenistan, Uzbekistan SOURCE: Climate Analysis Indicators Tool (GHGpc) and United Nations Development Programme (HDI)
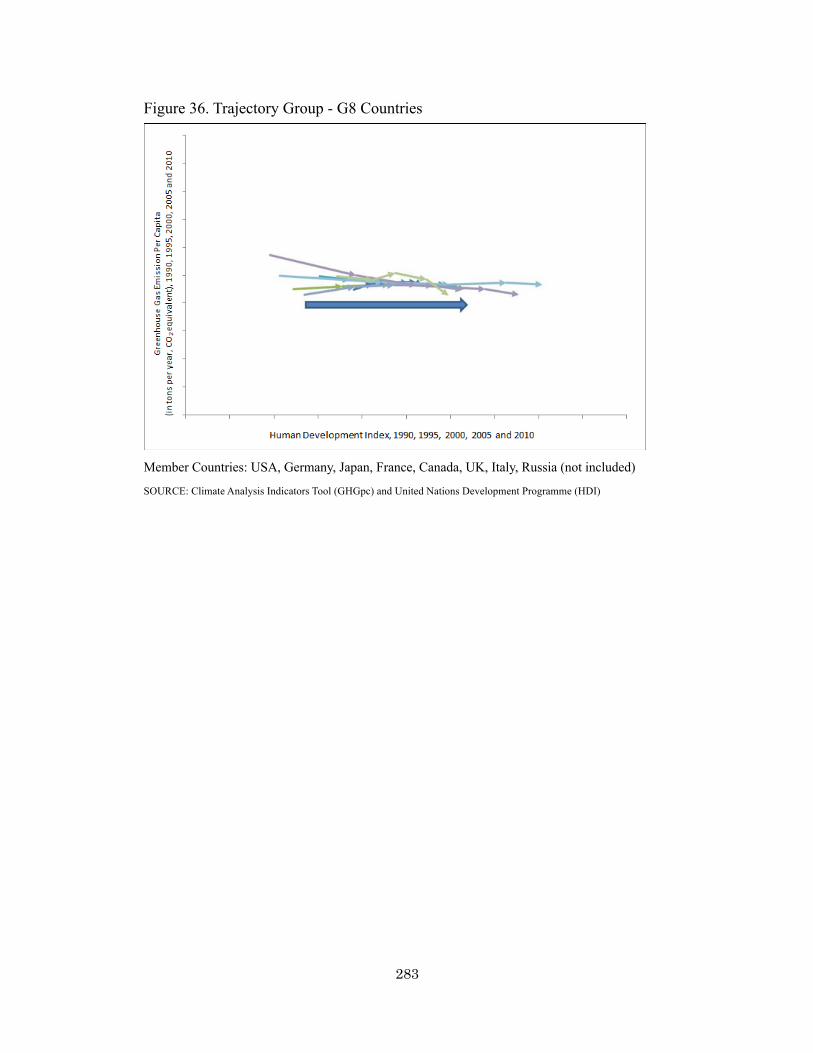
283
Figure 36. Trajectory Group - G8 Countries
Member Countries: USA, Germany, Japan, France, Canada, UK, Italy, Russia (not included)
SOURCE: Climate Analysis Indicators Tool (GHGpc) and United Nations Development Programme (HDI)

284
Figure 37. Number of Successful Countries per Country Group, 1990–2010.
y = 0.1174x2 - 1.1402x + 9.05R² = 0.1761
0123456789
10111213
0 1 2 3 4 5 6 7 8 9 10
Num
ber o
f Suc
cess
ful C
ount
ries
Country Group

285
Figure 38. Trajectories of Asian Countries
Vietnam
(PRC) G
HG
pc, 1
990
to 2
010
(incl
udes
land
use
chan
ge)
Human Development Index, 1990 to 2010
(tons
per
yea
r, CO
2 eq
uiva
lent
)

286
Figure 39. Relative Trajectories of Asian Countries (starting from 1990 as zero)
GH
Gpc
, 199
0 to
201
0 (in
clud
es la
nd u
se ch
ange
) Met
ric
tons
CO
2
Human Development Index, 1990 to 2010
(PRC)
Vietnam
(tons
per
yea
r, CO
2 eq
uiva
lent
)
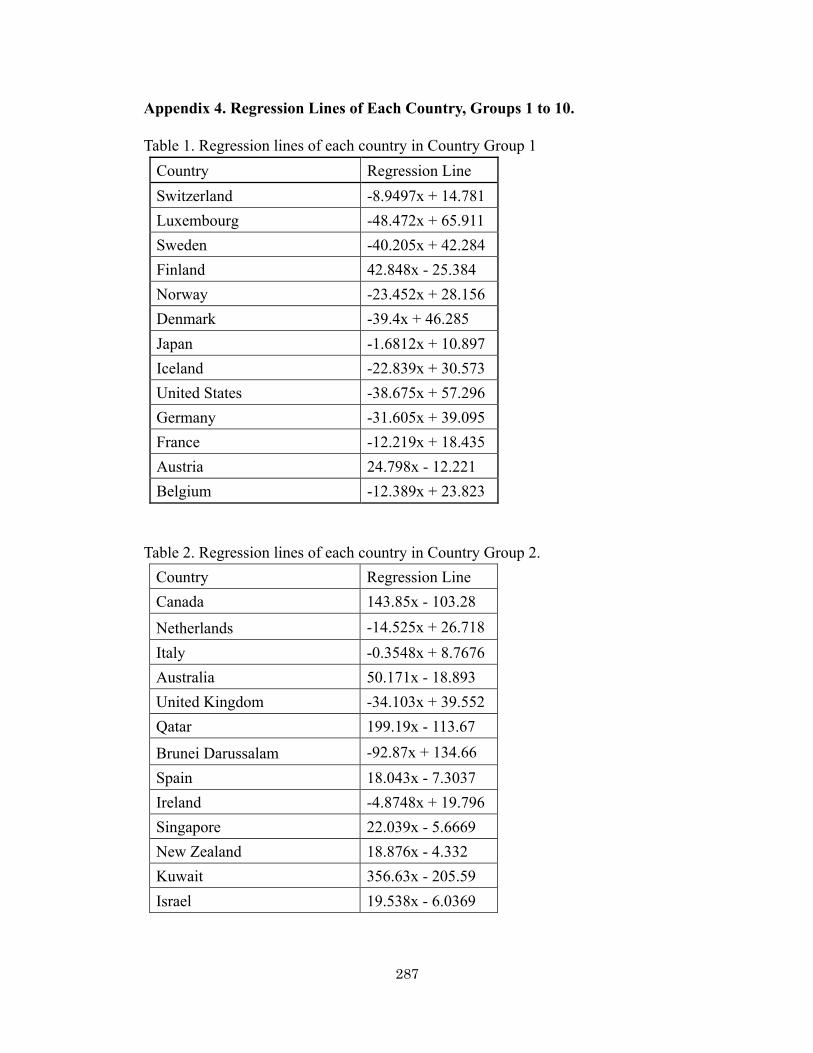
287
Appendix 4. Regression Lines of Each Country, Groups 1 to 10.
Table 1. Regression lines of each country in Country Group 1 Country Regression Line Switzerland -8.9497x + 14.781 Luxembourg -48.472x + 65.911 Sweden -40.205x + 42.284 Finland 42.848x - 25.384 Norway -23.452x + 28.156 Denmark -39.4x + 46.285 Japan -1.6812x + 10.897 Iceland -22.839x + 30.573 United States -38.675x + 57.296 Germany -31.605x + 39.095 France -12.219x + 18.435 Austria 24.798x - 12.221 Belgium -12.389x + 23.823
Table 2. Regression lines of each country in Country Group 2. Country Regression Line Canada 143.85x - 103.28
Netherlands -14.525x + 26.718 Italy -0.3548x + 8.7676 Australia 50.171x - 18.893 United Kingdom -34.103x + 39.552 Qatar 199.19x - 113.67
Brunei Darussalam -92.87x + 134.66 Spain 18.043x - 7.3037 Ireland -4.8748x + 19.796 Singapore 22.039x - 5.6669 New Zealand 18.876x - 4.332 Kuwait 356.63x - 205.59 Israel 19.538x - 6.0369
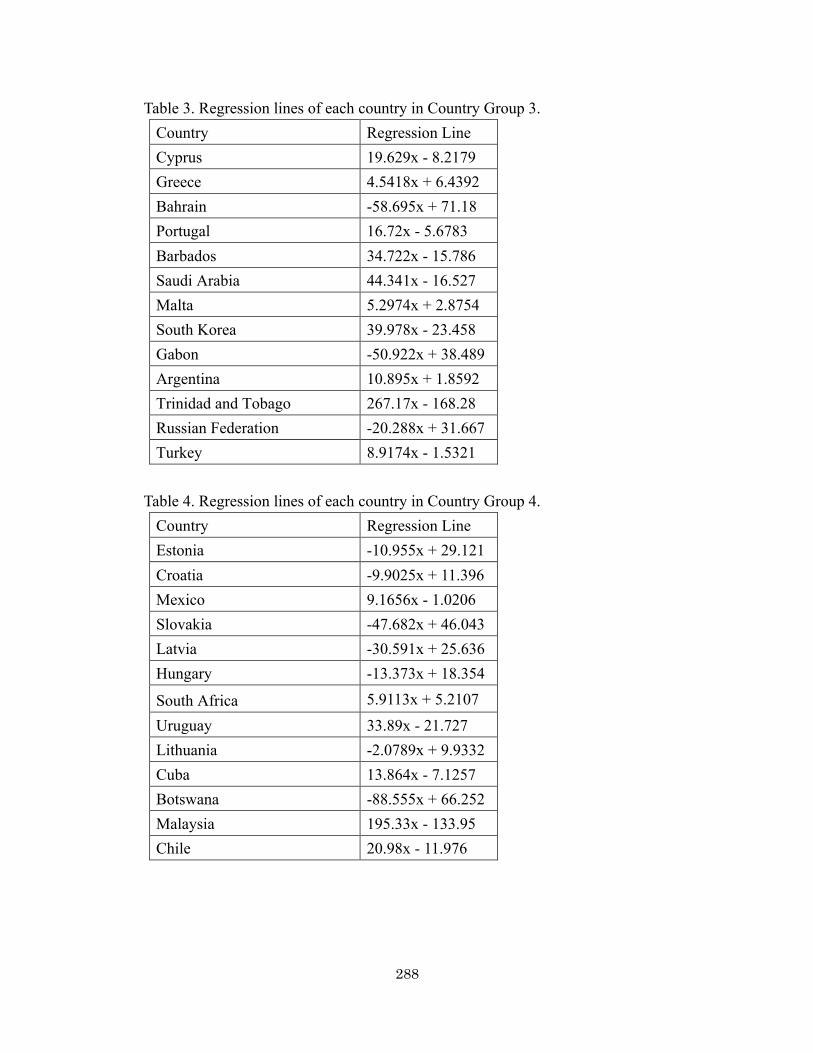
288
Table 3. Regression lines of each country in Country Group 3. Country Regression Line Cyprus 19.629x - 8.2179 Greece 4.5418x + 6.4392 Bahrain -58.695x + 71.18 Portugal 16.72x - 5.6783 Barbados 34.722x - 15.786 Saudi Arabia 44.341x - 16.527 Malta 5.2974x + 2.8754 South Korea 39.978x - 23.458 Gabon -50.922x + 38.489 Argentina 10.895x + 1.8592 Trinidad and Tobago 267.17x - 168.28 Russian Federation -20.288x + 31.667 Turkey 8.9174x - 1.5321
Table 4. Regression lines of each country in Country Group 4.
Country Regression Line Estonia -10.955x + 29.121 Croatia -9.9025x + 11.396 Mexico 9.1656x - 1.0206 Slovakia -47.682x + 46.043 Latvia -30.591x + 25.636 Hungary -13.373x + 18.354
South Africa 5.9113x + 5.2107 Uruguay 33.89x - 21.727 Lithuania -2.0789x + 9.9332 Cuba 13.864x - 7.1257 Botswana -88.555x + 66.252 Malaysia 195.33x - 133.95 Chile 20.98x - 11.976
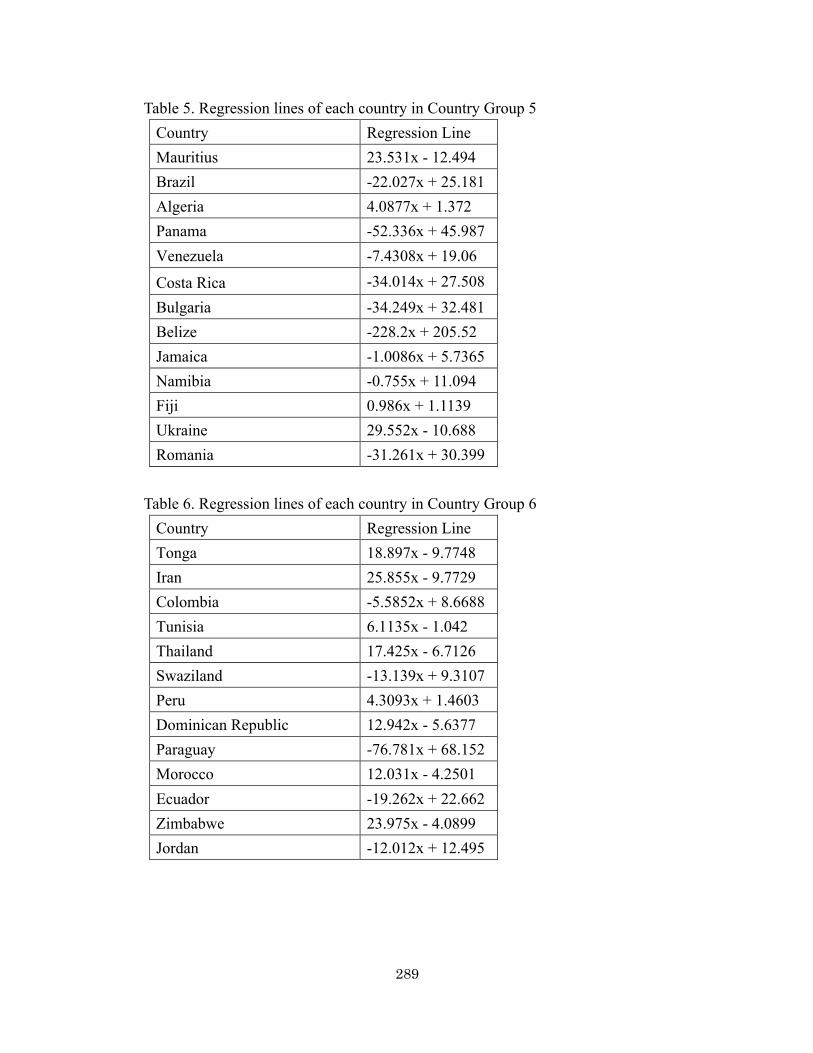
289
Table 5. Regression lines of each country in Country Group 5 Country Regression Line Mauritius 23.531x - 12.494 Brazil -22.027x + 25.181 Algeria 4.0877x + 1.372 Panama -52.336x + 45.987 Venezuela -7.4308x + 19.06
Costa Rica -34.014x + 27.508 Bulgaria -34.249x + 32.481 Belize -228.2x + 205.52 Jamaica -1.0086x + 5.7365 Namibia -0.755x + 11.094 Fiji 0.986x + 1.1139 Ukraine 29.552x - 10.688 Romania -31.261x + 30.399
Table 6. Regression lines of each country in Country Group 6
Country Regression Line Tonga 18.897x - 9.7748 Iran 25.855x - 9.7729 Colombia -5.5852x + 8.6688 Tunisia 6.1135x - 1.042 Thailand 17.425x - 6.7126 Swaziland -13.139x + 9.3107 Peru 4.3093x + 1.4603 Dominican Republic 12.942x - 5.6377 Paraguay -76.781x + 68.152 Morocco 12.031x - 4.2501 Ecuador -19.262x + 22.662 Zimbabwe 23.975x - 4.0899 Jordan -12.012x + 12.495

290
Table 7. Regression lines of each country in Country Group 7 Country Regression Line Congo -32.615x + 23.585 Cameroon -84.354x + 50.416 Republic of Moldova 42.301x - 21.529
El Salvador 4.5221x - 0.7371
Philippines 3.5005x - 0.6545
Syrian Arab Republic 1.1774x + 3.8638
Côte d'Ivoire -7.0389x + 5.9082
Senegal -3.1442x + 3.711 Mauritania -14.423x + 9.4752
Guatemala 3.5777x + 2.0242 Gambia -0.2945x + 4.2998 Bolivia -30.774x + 34.348 Albania -1.3589x + 3.2938
Table 8. Regression lines of each country in Country Group 8
Country Regression Line Honduras -41.041x + 31.601 Ghana -10.461x + 7.9411 Indonesia 17.46x - 2.5109 Nicaragua -4.6061x + 10.75 Guyana -5.6756x + 13.308 Papua New Guinea -98.129x + 58.932 Egypt 8.7461x - 2.3119 Mongolia -26.754x + 35.958 Armenia -10.268x + 9.9884 Lesotho -1.7427x + 1.9996 Kyrgyzstan 19.807x - 9.8407 Tajikistan 12.618x - 5.5006 Kenya -2.3662x + 2.6303

291
Table 9. Regression lines of each country in Country Group 9 Country Regression Line
Central African Republic -145.22x + 76.573 Togo -24.679x + 13.744 Sri Lanka 2.2154x + 0.8507 Pakistan 2.4001x + 0.6421 Zambia -55.965x + 35.515 Benin -15.935x + 9.724 India 4.6559x - 0.7358 Haiti 2.8643x - 0.4548 Rwanda -10.641x + 4.3643 China (PRC) 22.346x - 8.8393 Yemen 2.9683x + 0.0625 Niger -5.1821x + 2.8521 Mali -3.3894x + 3.4127
Table 10. Regression lines of each country in Country Group 10
Country Regression Line Burundi 38.499x - 8.5536
Afghanistan -0.5333x + 1.0424
Bangladesh 1.0077x + 0.4931 Malawi -1.2794x + 2.0564 Democratic Republic of the Congo
25.035x + 0.7332
Uganda -4.2319x + 3.2196 Tanzania: Mainland -16.985x + 11.531 Mozambique -12.676x + 6.4249
Lao PDR -4.4484x + 9.0605 Sierra Leone -6.5527x + 4.0946 Nepal -12.343x + 7.6352 Myanmar -11.279x + 9.8411 Vietnam 14.603x - 6.1862
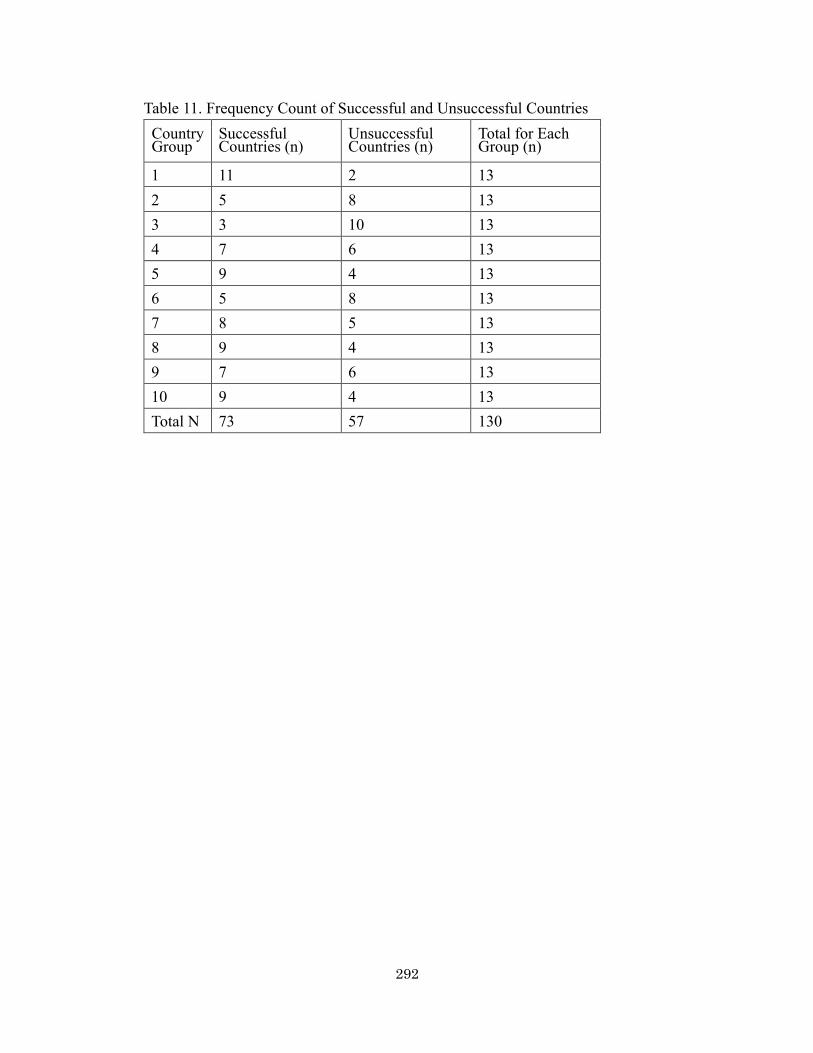
292
Table 11. Frequency Count of Successful and Unsuccessful Countries Country Group
Successful Countries (n)
Unsuccessful Countries (n)
Total for Each Group (n)
1 11 2 13 2 5 8 13 3 3 10 13 4 7 6 13 5 9 4 13 6 5 8 13 7 8 5 13 8 9 4 13 9 7 6 13 10 9 4 13 Total N 73 57 130
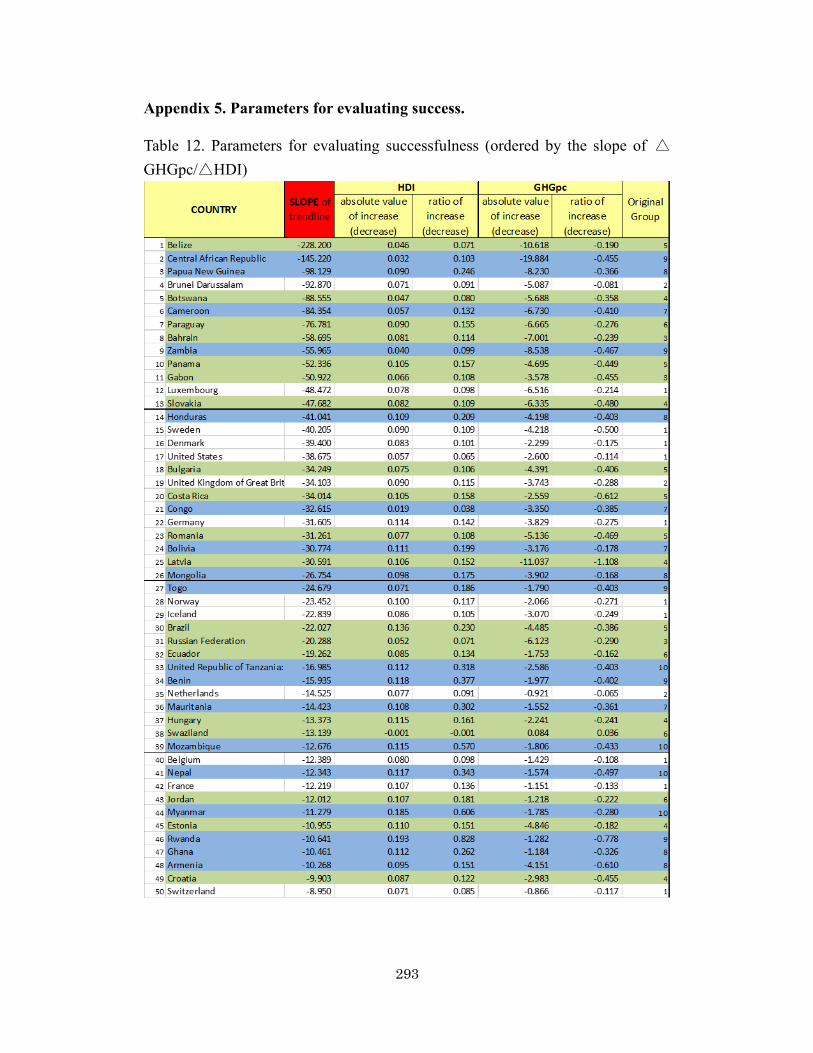
293
Appendix 5. Parameters for evaluating success.
Table 12. Parameters for evaluating successfulness (ordered by the slope of △GHGpc/△HDI)

294
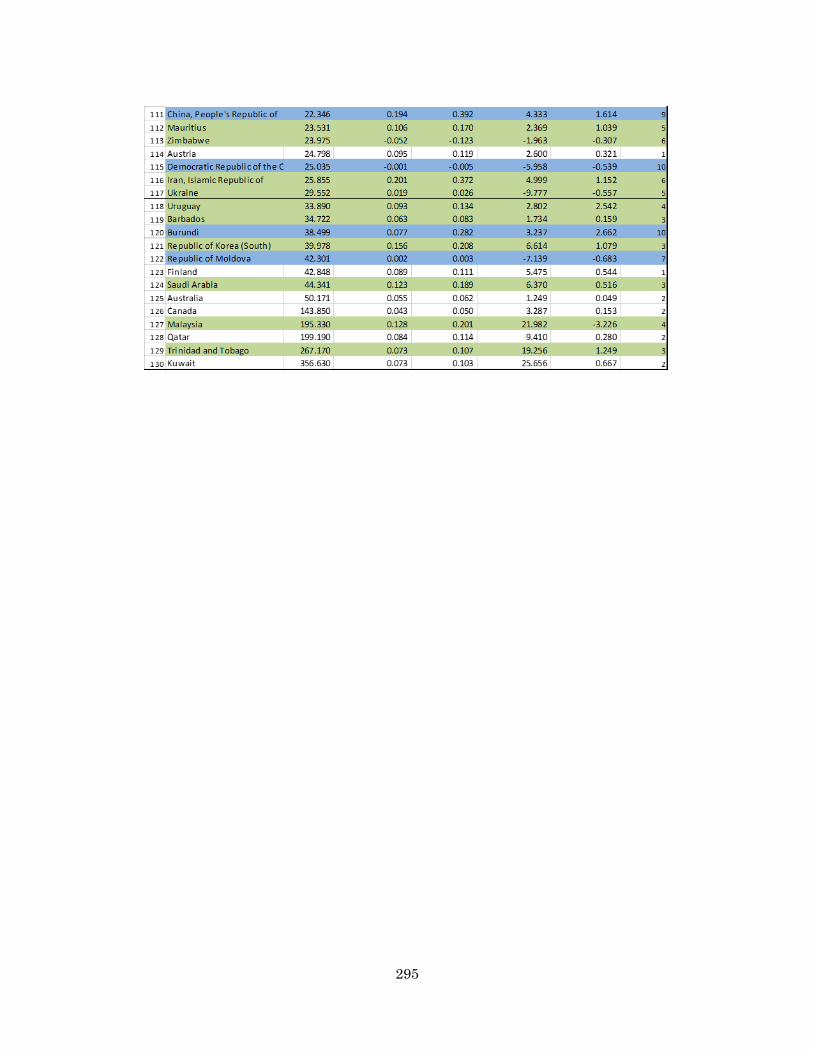
295
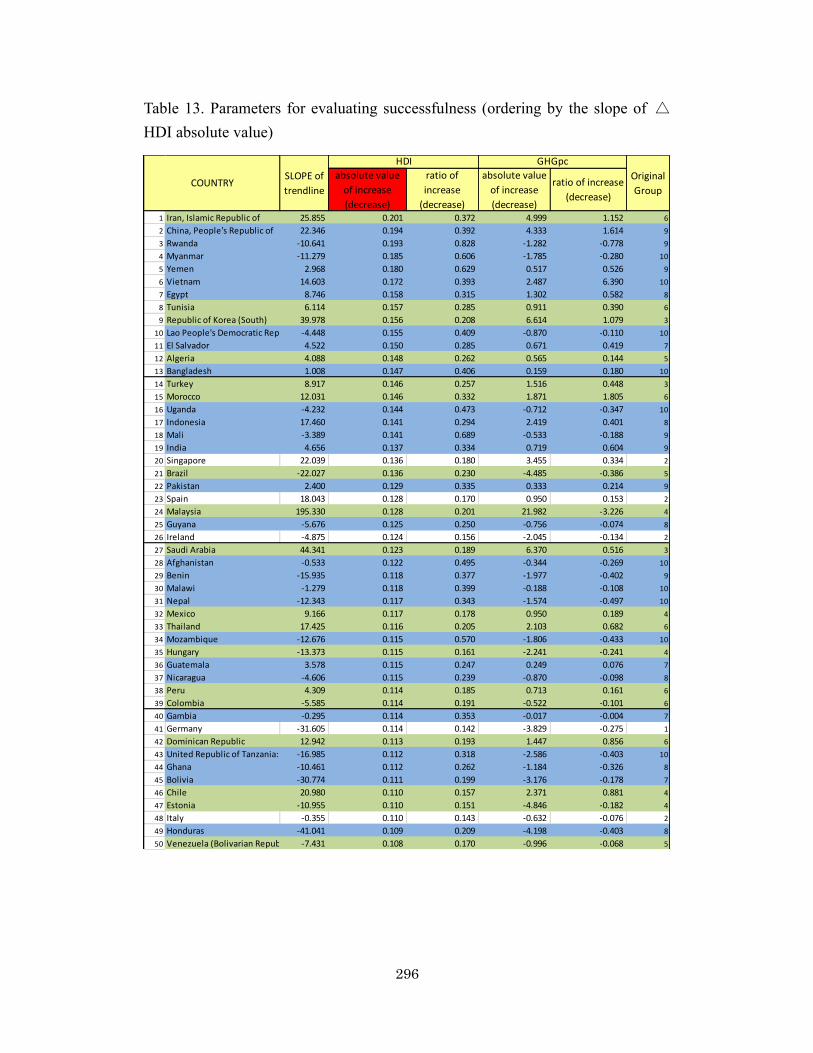
296
Table 13. Parameters for evaluating successfulness (ordering by the slope of △HDI absolute value)
1 Iran, Islamic Republic of 25.855 0.201 0.372 4.999 1.152 62 China, People's Republic of 22.346 0.194 0.392 4.333 1.614 93 Rwanda -10.641 0.193 0.828 -1.282 -0.778 94 Myanmar -11.279 0.185 0.606 -1.785 -0.280 105 Yemen 2.968 0.180 0.629 0.517 0.526 96 Vietnam 14.603 0.172 0.393 2.487 6.390 107 Egypt 8.746 0.158 0.315 1.302 0.582 88 Tunisia 6.114 0.157 0.285 0.911 0.390 69 Republic of Korea (South) 39.978 0.156 0.208 6.614 1.079 3
10 Lao People's Democratic Republic -4.448 0.155 0.409 -0.870 -0.110 1011 El Salvador 4.522 0.150 0.285 0.671 0.419 712 Algeria 4.088 0.148 0.262 0.565 0.144 513 Bangladesh 1.008 0.147 0.406 0.159 0.180 1014 Turkey 8.917 0.146 0.257 1.516 0.448 315 Morocco 12.031 0.146 0.332 1.871 1.805 616 Uganda -4.232 0.144 0.473 -0.712 -0.347 1017 Indonesia 17.460 0.141 0.294 2.419 0.401 818 Mali -3.389 0.141 0.689 -0.533 -0.188 919 India 4.656 0.137 0.334 0.719 0.604 920 Singapore 22.039 0.136 0.180 3.455 0.334 221 Brazil -22.027 0.136 0.230 -4.485 -0.386 522 Pakistan 2.400 0.129 0.335 0.333 0.214 923 Spain 18.043 0.128 0.170 0.950 0.153 224 Malaysia 195.330 0.128 0.201 21.982 -3.226 425 Guyana -5.676 0.125 0.250 -0.756 -0.074 826 Ireland -4.875 0.124 0.156 -2.045 -0.134 227 Saudi Arabia 44.341 0.123 0.189 6.370 0.516 328 Afghanistan -0.533 0.122 0.495 -0.344 -0.269 1029 Benin -15.935 0.118 0.377 -1.977 -0.402 930 Malawi -1.279 0.118 0.399 -0.188 -0.108 1031 Nepal -12.343 0.117 0.343 -1.574 -0.497 1032 Mexico 9.166 0.117 0.178 0.950 0.189 433 Thailand 17.425 0.116 0.205 2.103 0.682 634 Mozambique -12.676 0.115 0.570 -1.806 -0.433 1035 Hungary -13.373 0.115 0.161 -2.241 -0.241 436 Guatemala 3.578 0.115 0.247 0.249 0.076 737 Nicaragua -4.606 0.115 0.239 -0.870 -0.098 838 Peru 4.309 0.114 0.185 0.713 0.161 639 Colombia -5.585 0.114 0.191 -0.522 -0.101 640 Gambia -0.295 0.114 0.353 -0.017 -0.004 741 Germany -31.605 0.114 0.142 -3.829 -0.275 142 Dominican Republic 12.942 0.113 0.193 1.447 0.856 643 United Republic of Tanzania: Mainland-16.985 0.112 0.318 -2.586 -0.403 1044 Ghana -10.461 0.112 0.262 -1.184 -0.326 845 Bolivia -30.774 0.111 0.199 -3.176 -0.178 746 Chile 20.980 0.110 0.157 2.371 0.881 447 Estonia -10.955 0.110 0.151 -4.846 -0.182 448 Italy -0.355 0.110 0.143 -0.632 -0.076 249 Honduras -41.041 0.109 0.209 -4.198 -0.403 850 Venezuela (Bolivarian Republic of)-7.431 0.108 0.170 -0.996 -0.068 5
COUNTRYSLOPE of trendline
HDI GHGpcOriginal Group
absolute value of increase (decrease)
ratio of increase
(decrease)
absolute value of increase (decrease)
ratio of increase (decrease)

297
51 Mauritania -14.423 0.108 0.302 -1.552 -0.361 752 Jordan -12.012 0.107 0.181 -1.218 -0.222 653 France -12.219 0.107 0.136 -1.151 -0.133 154 Mauritius 23.531 0.106 0.170 2.369 1.039 555 Latvia -30.591 0.106 0.152 -11.037 -1.108 456 Costa Rica -34.014 0.105 0.158 -2.559 -0.612 557 Panama -52.336 0.105 0.157 -4.695 -0.449 558 Argentina 10.895 0.104 0.148 1.077 0.114 359 Portugal 16.720 0.103 0.144 1.096 0.185 360 Senegal -3.144 0.102 0.278 -0.405 -0.156 761 Norway -23.452 0.100 0.117 -2.066 -0.271 162 Niger -5.182 0.100 0.506 -0.374 -0.227 963 Sierra Leone -6.553 0.099 0.399 -0.736 -0.283 1064 Mongolia -26.754 0.098 0.175 -3.902 -0.168 865 Sri Lanka 2.215 0.098 0.161 0.126 0.057 966 Austria 24.798 0.095 0.119 2.600 0.321 167 Armenia -10.268 0.095 0.151 -4.151 -0.610 868 Cuba 13.864 0.094 0.139 -0.069 -0.017 469 Greece 4.542 0.094 0.122 -0.116 -0.012 370 Uruguay 33.890 0.093 0.134 2.802 2.542 471 Papua New Guinea -98.129 0.090 0.246 -8.230 -0.366 872 United Kingdom of Great Britain and Northern Ireland-34.103 0.090 0.115 -3.743 -0.288 273 Paraguay -76.781 0.090 0.155 -6.665 -0.276 674 Sweden -40.205 0.090 0.109 -4.218 -0.500 175 Finland 42.848 0.089 0.111 5.475 0.544 176 Syrian Arab Republic 1.177 0.088 0.158 0.032 0.007 777 Croatia -9.903 0.087 0.122 -2.983 -0.455 478 Malta 5.297 0.087 0.115 0.212 0.030 379 Israel 19.538 0.087 0.107 2.151 0.233 280 Iceland -22.839 0.086 0.105 -3.070 -0.249 181 Jamaica -1.009 0.085 0.133 -0.215 -0.046 582 Fiji 0.986 0.085 0.138 -0.144 -0.085 583 Ecuador -19.262 0.085 0.134 -1.753 -0.162 684 Qatar 199.190 0.084 0.114 9.410 0.280 285 Albania -1.359 0.084 0.127 -1.152 -0.345 786 Denmark -39.400 0.083 0.101 -2.299 -0.175 187 Slovakia -47.682 0.082 0.109 -6.335 -0.480 488 New Zealand 18.876 0.082 0.098 0.771 0.068 289 Bahrain -58.695 0.081 0.114 -7.001 -0.239 390 Belgium -12.389 0.080 0.098 -1.429 -0.108 191 Luxembourg -48.472 0.078 0.098 -6.516 -0.214 192 Lithuania -2.079 0.077 0.106 -4.176 -0.326 493 Netherlands -14.525 0.077 0.091 -0.921 -0.065 294 Burundi 38.499 0.077 0.282 3.237 2.662 1095 Romania -31.261 0.077 0.108 -5.136 -0.469 596 Bulgaria -34.249 0.075 0.106 -4.391 -0.406 597 Trinidad and Tobago 267.170 0.073 0.107 19.256 1.249 398 Kuwait 356.630 0.073 0.103 25.656 0.667 299 Japan -1.681 0.072 0.086 -0.302 -0.033 1
100 Switzerland -8.950 0.071 0.085 -0.866 -0.117 1101 Brunei Darussalam -92.870 0.071 0.091 -5.087 -0.081 2102 Togo -24.679 0.071 0.186 -1.790 -0.403 9103 Cyprus 19.629 0.070 0.090 1.377 0.210 3104 Philippines 3.501 0.068 0.116 0.302 0.240 7105 Côte d'Ivoire -7.039 0.067 0.186 -0.447 -0.120 7106 Gabon -50.922 0.066 0.108 -3.578 -0.455 3107 Barbados 34.722 0.063 0.083 1.734 0.159 3108 Cameroon -84.354 0.057 0.132 -6.730 -0.410 7109 United States -38.675 0.057 0.065 -2.600 -0.114 1110 Australia 50.171 0.055 0.062 1.249 0.049 2

298
111 Tonga 18.897 0.052 0.080 0.929 0.347 6112 Russian Federation -20.288 0.052 0.071 -6.123 -0.290 3113 Haiti 2.864 0.051 0.127 0.105 0.151 9114 Kenya -2.366 0.048 0.105 -0.456 -0.247 8115 Botswana -88.555 0.047 0.080 -5.688 -0.358 4116 Belize -228.200 0.046 0.071 -10.618 -0.190 5117 Canada 143.850 0.043 0.050 3.287 0.153 2118 Zambia -55.965 0.040 0.099 -8.538 -0.467 9119 Namibia -0.755 0.034 0.060 0.990 0.101 5120 Central African Republic -145.220 0.032 0.103 -19.884 -0.455 9121 Congo -32.615 0.019 0.038 -3.350 -0.385 7122 Ukraine 29.552 0.019 0.026 -9.777 -0.557 5123 Kyrgyzstan 19.807 0.005 0.009 -7.661 -1.126 8124 Republic of Moldova 42.301 0.002 0.003 -7.139 -0.683 7125 South Africa 5.911 0.000 0.000 -0.403 -0.043 4126 Swaziland -13.139 -0.001 -0.001 0.084 0.036 6127 Democratic Republic of the Congo25.035 -0.001 -0.005 -5.958 -0.539 10128 Tajikistan 12.618 -0.003 -0.005 -1.957 -0.580 8129 Lesotho -1.743 -0.022 -0.046 0.180 0.155 8130 Zimbabwe 23.975 -0.052 -0.123 -1.963 -0.307 6

299
Table 14. Parameters for evaluating successfulness (ordering by the △HDI ratio)
1 Rwanda -10.641 0.193 0.828 -1.282 -0.778 92 Mali -3.389 0.141 0.689 -0.533 -0.188 93 Yemen 2.968 0.180 0.629 0.517 0.526 94 Myanmar -11.279 0.185 0.606 -1.785 -0.280 105 Mozambique -12.676 0.115 0.570 -1.806 -0.433 106 Niger -5.182 0.100 0.506 -0.374 -0.227 97 Afghanistan -0.533 0.122 0.495 -0.344 -0.269 108 Uganda -4.232 0.144 0.473 -0.712 -0.347 109 Lao People's Democratic Republic -4.448 0.155 0.409 -0.870 -0.110 10
10 Bangladesh 1.008 0.147 0.406 0.159 0.180 1011 Malawi -1.279 0.118 0.399 -0.188 -0.108 1012 Sierra Leone -6.553 0.099 0.399 -0.736 -0.283 1013 Vietnam 14.603 0.172 0.393 2.487 6.390 1014 China, People's Republic of 22.346 0.194 0.392 4.333 1.614 915 Benin -15.935 0.118 0.377 -1.977 -0.402 916 Iran, Islamic Republic of 25.855 0.201 0.372 4.999 1.152 617 Gambia -0.295 0.114 0.353 -0.017 -0.004 718 Nepal -12.343 0.117 0.343 -1.574 -0.497 1019 Pakistan 2.400 0.129 0.335 0.333 0.214 920 India 4.656 0.137 0.334 0.719 0.604 921 Morocco 12.031 0.146 0.332 1.871 1.805 622 United Republic of Tanzania: Mainland-16.985 0.112 0.318 -2.586 -0.403 1023 Egypt 8.746 0.158 0.315 1.302 0.582 824 Mauritania -14.423 0.108 0.302 -1.552 -0.361 725 Indonesia 17.460 0.141 0.294 2.419 0.401 826 Tunisia 6.114 0.157 0.285 0.911 0.390 627 El Salvador 4.522 0.150 0.285 0.671 0.419 728 Burundi 38.499 0.077 0.282 3.237 2.662 1029 Senegal -3.144 0.102 0.278 -0.405 -0.156 730 Algeria 4.088 0.148 0.262 0.565 0.144 531 Ghana -10.461 0.112 0.262 -1.184 -0.326 832 Turkey 8.917 0.146 0.257 1.516 0.448 333 Guyana -5.676 0.125 0.250 -0.756 -0.074 834 Guatemala 3.578 0.115 0.247 0.249 0.076 735 Papua New Guinea -98.129 0.090 0.246 -8.230 -0.366 836 Nicaragua -4.606 0.115 0.239 -0.870 -0.098 837 Brazil -22.027 0.136 0.230 -4.485 -0.386 538 Honduras -41.041 0.109 0.209 -4.198 -0.403 839 Republic of Korea (South) 39.978 0.156 0.208 6.614 1.079 340 Thailand 17.425 0.116 0.205 2.103 0.682 641 Malaysia 195.330 0.128 0.201 21.982 -3.226 442 Bolivia -30.774 0.111 0.199 -3.176 -0.178 743 Dominican Republic 12.942 0.113 0.193 1.447 0.856 644 Colombia -5.585 0.114 0.191 -0.522 -0.101 645 Saudi Arabia 44.341 0.123 0.189 6.370 0.516 346 Togo -24.679 0.071 0.186 -1.790 -0.403 947 Côte d'Ivoire -7.039 0.067 0.186 -0.447 -0.120 748 Peru 4.309 0.114 0.185 0.713 0.161 649 Jordan -12.012 0.107 0.181 -1.218 -0.222 650 Singapore 22.039 0.136 0.180 3.455 0.334 2
COUNTRYSLOPE of trendline
HDI GHGpcOriginal Group
absolute value of increase (decrease)
ratio of increase
(decrease)
absolute value of increase (decrease)
ratio of increase
(decrease)

300
51 Mexico 9.166 0.117 0.178 0.950 0.189 452 Mongolia -26.754 0.098 0.175 -3.902 -0.168 853 Venezuela (Bolivarian Republic of)-7.431 0.108 0.170 -0.996 -0.068 554 Mauritius 23.531 0.106 0.170 2.369 1.039 555 Spain 18.043 0.128 0.170 0.950 0.153 256 Hungary -13.373 0.115 0.161 -2.241 -0.241 457 Sri Lanka 2.215 0.098 0.161 0.126 0.057 958 Syrian Arab Republic 1.177 0.088 0.158 0.032 0.007 759 Costa Rica -34.014 0.105 0.158 -2.559 -0.612 560 Chile 20.980 0.110 0.157 2.371 0.881 461 Panama -52.336 0.105 0.157 -4.695 -0.449 562 Ireland -4.875 0.124 0.156 -2.045 -0.134 263 Paraguay -76.781 0.090 0.155 -6.665 -0.276 664 Latvia -30.591 0.106 0.152 -11.037 -1.108 465 Estonia -10.955 0.110 0.151 -4.846 -0.182 466 Armenia -10.268 0.095 0.151 -4.151 -0.610 867 Argentina 10.895 0.104 0.148 1.077 0.114 368 Portugal 16.720 0.103 0.144 1.096 0.185 369 Italy -0.355 0.110 0.143 -0.632 -0.076 270 Germany -31.605 0.114 0.142 -3.829 -0.275 171 Cuba 13.864 0.094 0.139 -0.069 -0.017 472 Fiji 0.986 0.085 0.138 -0.144 -0.085 573 France -12.219 0.107 0.136 -1.151 -0.133 174 Uruguay 33.890 0.093 0.134 2.802 2.542 475 Ecuador -19.262 0.085 0.134 -1.753 -0.162 676 Jamaica -1.009 0.085 0.133 -0.215 -0.046 577 Cameroon -84.354 0.057 0.132 -6.730 -0.410 778 Albania -1.359 0.084 0.127 -1.152 -0.345 779 Haiti 2.864 0.051 0.127 0.105 0.151 980 Croatia -9.903 0.087 0.122 -2.983 -0.455 481 Greece 4.542 0.094 0.122 -0.116 -0.012 382 Austria 24.798 0.095 0.119 2.600 0.321 183 Norway -23.452 0.100 0.117 -2.066 -0.271 184 Philippines 3.501 0.068 0.116 0.302 0.240 785 Malta 5.297 0.087 0.115 0.212 0.030 386 United Kingdom of Great Britain and Northern Ireland-34.103 0.090 0.115 -3.743 -0.288 287 Bahrain -58.695 0.081 0.114 -7.001 -0.239 388 Qatar 199.190 0.084 0.114 9.410 0.280 289 Finland 42.848 0.089 0.111 5.475 0.544 190 Sweden -40.205 0.090 0.109 -4.218 -0.500 191 Slovakia -47.682 0.082 0.109 -6.335 -0.480 492 Romania -31.261 0.077 0.108 -5.136 -0.469 593 Gabon -50.922 0.066 0.108 -3.578 -0.455 394 Israel 19.538 0.087 0.107 2.151 0.233 295 Trinidad and Tobago 267.170 0.073 0.107 19.256 1.249 396 Bulgaria -34.249 0.075 0.106 -4.391 -0.406 597 Lithuania -2.079 0.077 0.106 -4.176 -0.326 498 Iceland -22.839 0.086 0.105 -3.070 -0.249 199 Kenya -2.366 0.048 0.105 -0.456 -0.247 8
100 Central African Republic -145.220 0.032 0.103 -19.884 -0.455 9101 Kuwait 356.630 0.073 0.103 25.656 0.667 2102 Denmark -39.400 0.083 0.101 -2.299 -0.175 1103 Zambia -55.965 0.040 0.099 -8.538 -0.467 9104 Luxembourg -48.472 0.078 0.098 -6.516 -0.214 1105 New Zealand 18.876 0.082 0.098 0.771 0.068 2106 Belgium -12.389 0.080 0.098 -1.429 -0.108 1107 Netherlands -14.525 0.077 0.091 -0.921 -0.065 2108 Brunei Darussalam -92.870 0.071 0.091 -5.087 -0.081 2109 Cyprus 19.629 0.070 0.090 1.377 0.210 3110 Japan -1.681 0.072 0.086 -0.302 -0.033 1

301
111 Switzerland -8.950 0.071 0.085 -0.866 -0.117 1112 Barbados 34.722 0.063 0.083 1.734 0.159 3113 Tonga 18.897 0.052 0.080 0.929 0.347 6114 Botswana -88.555 0.047 0.080 -5.688 -0.358 4115 Russian Federation -20.288 0.052 0.071 -6.123 -0.290 3116 Belize -228.200 0.046 0.071 -10.618 -0.190 5117 United States -38.675 0.057 0.065 -2.600 -0.114 1118 Australia 50.171 0.055 0.062 1.249 0.049 2119 Namibia -0.755 0.034 0.060 0.990 0.101 5120 Canada 143.850 0.043 0.050 3.287 0.153 2121 Congo -32.615 0.019 0.038 -3.350 -0.385 7122 Ukraine 29.552 0.019 0.026 -9.777 -0.557 5123 Kyrgyzstan 19.807 0.005 0.009 -7.661 -1.126 8124 Republic of Moldova 42.301 0.002 0.003 -7.139 -0.683 7125 South Africa 5.911 0.000 0.000 -0.403 -0.043 4126 Swaziland -13.139 -0.001 -0.001 0.084 0.036 6127 Tajikistan 12.618 -0.003 -0.005 -1.957 -0.580 8128 Democratic Republic of the Congo25.035 -0.001 -0.005 -5.958 -0.539 10129 Lesotho -1.743 -0.022 -0.046 0.180 0.155 8130 Zimbabwe 23.975 -0.052 -0.123 -1.963 -0.307 6
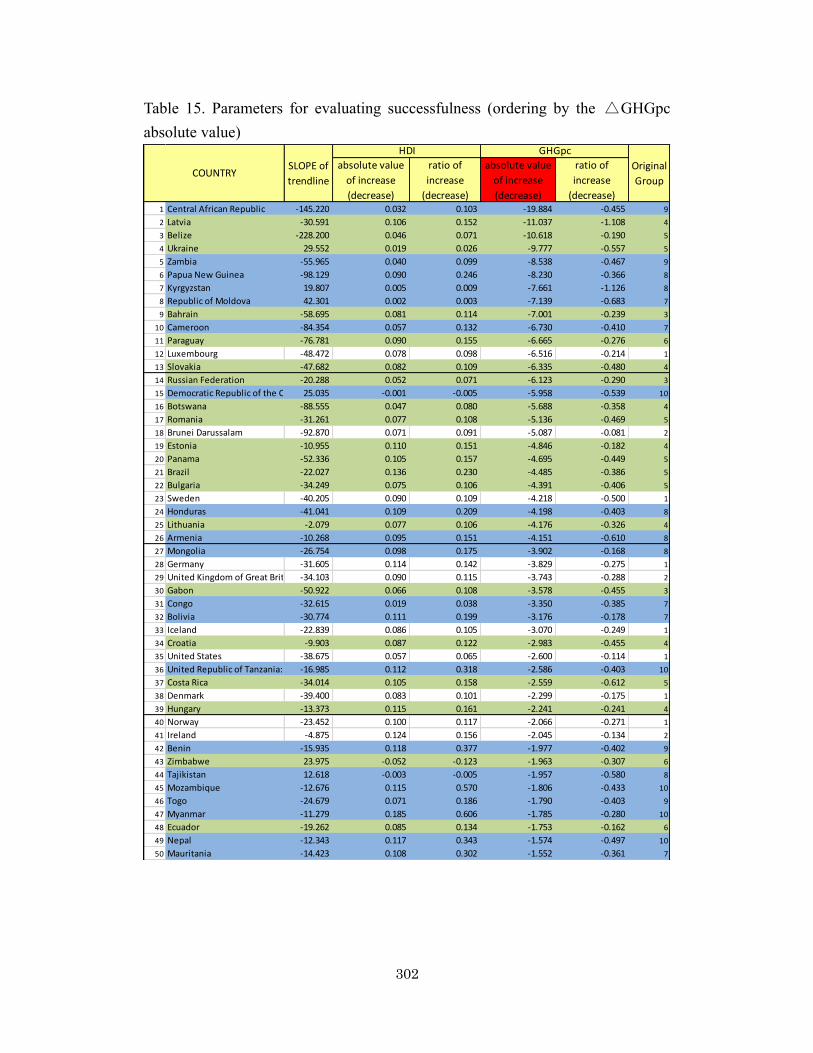
302
Table 15. Parameters for evaluating successfulness (ordering by the △GHGpc absolute value)
1 Central African Republic -145.220 0.032 0.103 -19.884 -0.455 92 Latvia -30.591 0.106 0.152 -11.037 -1.108 43 Belize -228.200 0.046 0.071 -10.618 -0.190 54 Ukraine 29.552 0.019 0.026 -9.777 -0.557 55 Zambia -55.965 0.040 0.099 -8.538 -0.467 96 Papua New Guinea -98.129 0.090 0.246 -8.230 -0.366 87 Kyrgyzstan 19.807 0.005 0.009 -7.661 -1.126 88 Republic of Moldova 42.301 0.002 0.003 -7.139 -0.683 79 Bahrain -58.695 0.081 0.114 -7.001 -0.239 3
10 Cameroon -84.354 0.057 0.132 -6.730 -0.410 711 Paraguay -76.781 0.090 0.155 -6.665 -0.276 612 Luxembourg -48.472 0.078 0.098 -6.516 -0.214 113 Slovakia -47.682 0.082 0.109 -6.335 -0.480 414 Russian Federation -20.288 0.052 0.071 -6.123 -0.290 315 Democratic Republic of the Congo25.035 -0.001 -0.005 -5.958 -0.539 1016 Botswana -88.555 0.047 0.080 -5.688 -0.358 417 Romania -31.261 0.077 0.108 -5.136 -0.469 518 Brunei Darussalam -92.870 0.071 0.091 -5.087 -0.081 219 Estonia -10.955 0.110 0.151 -4.846 -0.182 420 Panama -52.336 0.105 0.157 -4.695 -0.449 521 Brazil -22.027 0.136 0.230 -4.485 -0.386 522 Bulgaria -34.249 0.075 0.106 -4.391 -0.406 523 Sweden -40.205 0.090 0.109 -4.218 -0.500 124 Honduras -41.041 0.109 0.209 -4.198 -0.403 825 Lithuania -2.079 0.077 0.106 -4.176 -0.326 426 Armenia -10.268 0.095 0.151 -4.151 -0.610 827 Mongolia -26.754 0.098 0.175 -3.902 -0.168 828 Germany -31.605 0.114 0.142 -3.829 -0.275 129 United Kingdom of Great Britain and Northern Ireland-34.103 0.090 0.115 -3.743 -0.288 230 Gabon -50.922 0.066 0.108 -3.578 -0.455 331 Congo -32.615 0.019 0.038 -3.350 -0.385 732 Bolivia -30.774 0.111 0.199 -3.176 -0.178 733 Iceland -22.839 0.086 0.105 -3.070 -0.249 134 Croatia -9.903 0.087 0.122 -2.983 -0.455 435 United States -38.675 0.057 0.065 -2.600 -0.114 136 United Republic of Tanzania: Mainland-16.985 0.112 0.318 -2.586 -0.403 1037 Costa Rica -34.014 0.105 0.158 -2.559 -0.612 538 Denmark -39.400 0.083 0.101 -2.299 -0.175 139 Hungary -13.373 0.115 0.161 -2.241 -0.241 440 Norway -23.452 0.100 0.117 -2.066 -0.271 141 Ireland -4.875 0.124 0.156 -2.045 -0.134 242 Benin -15.935 0.118 0.377 -1.977 -0.402 943 Zimbabwe 23.975 -0.052 -0.123 -1.963 -0.307 644 Tajikistan 12.618 -0.003 -0.005 -1.957 -0.580 845 Mozambique -12.676 0.115 0.570 -1.806 -0.433 1046 Togo -24.679 0.071 0.186 -1.790 -0.403 947 Myanmar -11.279 0.185 0.606 -1.785 -0.280 1048 Ecuador -19.262 0.085 0.134 -1.753 -0.162 649 Nepal -12.343 0.117 0.343 -1.574 -0.497 1050 Mauritania -14.423 0.108 0.302 -1.552 -0.361 7
COUNTRYSLOPE of trendline
HDI GHGpcOriginal Group
absolute value of increase (decrease)
ratio of increase
(decrease)
absolute value of increase (decrease)
ratio of increase
(decrease)

303
51 Belgium -12.389 0.080 0.098 -1.429 -0.108 152 Rwanda -10.641 0.193 0.828 -1.282 -0.778 953 Jordan -12.012 0.107 0.181 -1.218 -0.222 654 Ghana -10.461 0.112 0.262 -1.184 -0.326 855 Albania -1.359 0.084 0.127 -1.152 -0.345 756 France -12.219 0.107 0.136 -1.151 -0.133 157 Venezuela (Bolivarian Republic of)-7.431 0.108 0.170 -0.996 -0.068 558 Netherlands -14.525 0.077 0.091 -0.921 -0.065 259 Nicaragua -4.606 0.115 0.239 -0.870 -0.098 860 Lao People's Democratic Republic -4.448 0.155 0.409 -0.870 -0.110 1061 Switzerland -8.950 0.071 0.085 -0.866 -0.117 162 Guyana -5.676 0.125 0.250 -0.756 -0.074 863 Sierra Leone -6.553 0.099 0.399 -0.736 -0.283 1064 Uganda -4.232 0.144 0.473 -0.712 -0.347 1065 Italy -0.355 0.110 0.143 -0.632 -0.076 266 Mali -3.389 0.141 0.689 -0.533 -0.188 967 Colombia -5.585 0.114 0.191 -0.522 -0.101 668 Kenya -2.366 0.048 0.105 -0.456 -0.247 869 Côte d'Ivoire -7.039 0.067 0.186 -0.447 -0.120 770 Senegal -3.144 0.102 0.278 -0.405 -0.156 771 South Africa 5.911 0.000 0.000 -0.403 -0.043 472 Niger -5.182 0.100 0.506 -0.374 -0.227 973 Afghanistan -0.533 0.122 0.495 -0.344 -0.269 1074 Japan -1.681 0.072 0.086 -0.302 -0.033 175 Jamaica -1.009 0.085 0.133 -0.215 -0.046 576 Malawi -1.279 0.118 0.399 -0.188 -0.108 1077 Fiji 0.986 0.085 0.138 -0.144 -0.085 578 Greece 4.542 0.094 0.122 -0.116 -0.012 379 Cuba 13.864 0.094 0.139 -0.069 -0.017 480 Gambia -0.295 0.114 0.353 -0.017 -0.004 781 Syrian Arab Republic 1.177 0.088 0.158 0.032 0.007 782 Swaziland -13.139 -0.001 -0.001 0.084 0.036 683 Haiti 2.864 0.051 0.127 0.105 0.151 984 Sri Lanka 2.215 0.098 0.161 0.126 0.057 985 Bangladesh 1.008 0.147 0.406 0.159 0.180 1086 Lesotho -1.743 -0.022 -0.046 0.180 0.155 887 Malta 5.297 0.087 0.115 0.212 0.030 388 Guatemala 3.578 0.115 0.247 0.249 0.076 789 Philippines 3.501 0.068 0.116 0.302 0.240 790 Pakistan 2.400 0.129 0.335 0.333 0.214 991 Yemen 2.968 0.180 0.629 0.517 0.526 992 Algeria 4.088 0.148 0.262 0.565 0.144 593 El Salvador 4.522 0.150 0.285 0.671 0.419 794 Peru 4.309 0.114 0.185 0.713 0.161 695 India 4.656 0.137 0.334 0.719 0.604 996 New Zealand 18.876 0.082 0.098 0.771 0.068 297 Tunisia 6.114 0.157 0.285 0.911 0.390 698 Tonga 18.897 0.052 0.080 0.929 0.347 699 Spain 18.043 0.128 0.170 0.950 0.153 2
100 Mexico 9.166 0.117 0.178 0.950 0.189 4101 Namibia -0.755 0.034 0.060 0.990 0.101 5102 Argentina 10.895 0.104 0.148 1.077 0.114 3103 Portugal 16.720 0.103 0.144 1.096 0.185 3104 Australia 50.171 0.055 0.062 1.249 0.049 2105 Egypt 8.746 0.158 0.315 1.302 0.582 8106 Cyprus 19.629 0.070 0.090 1.377 0.210 3107 Dominican Republic 12.942 0.113 0.193 1.447 0.856 6108 Turkey 8.917 0.146 0.257 1.516 0.448 3109 Barbados 34.722 0.063 0.083 1.734 0.159 3110 Morocco 12.031 0.146 0.332 1.871 1.805 6

304
111 Thailand 17.425 0.116 0.205 2.103 0.682 6112 Israel 19.538 0.087 0.107 2.151 0.233 2113 Mauritius 23.531 0.106 0.170 2.369 1.039 5114 Chile 20.980 0.110 0.157 2.371 0.881 4115 Indonesia 17.460 0.141 0.294 2.419 0.401 8116 Vietnam 14.603 0.172 0.393 2.487 6.390 10117 Austria 24.798 0.095 0.119 2.600 0.321 1118 Uruguay 33.890 0.093 0.134 2.802 2.542 4119 Burundi 38.499 0.077 0.282 3.237 2.662 10120 Canada 143.850 0.043 0.050 3.287 0.153 2121 Singapore 22.039 0.136 0.180 3.455 0.334 2122 China, People's Republic of 22.346 0.194 0.392 4.333 1.614 9123 Iran, Islamic Republic of 25.855 0.201 0.372 4.999 1.152 6124 Finland 42.848 0.089 0.111 5.475 0.544 1125 Saudi Arabia 44.341 0.123 0.189 6.370 0.516 3126 Republic of Korea (South) 39.978 0.156 0.208 6.614 1.079 3127 Qatar 199.190 0.084 0.114 9.410 0.280 2128 Trinidad and Tobago 267.170 0.073 0.107 19.256 1.249 3129 Malaysia 195.330 0.128 0.201 21.982 -3.226 4130 Kuwait 356.630 0.073 0.103 25.656 0.667 2
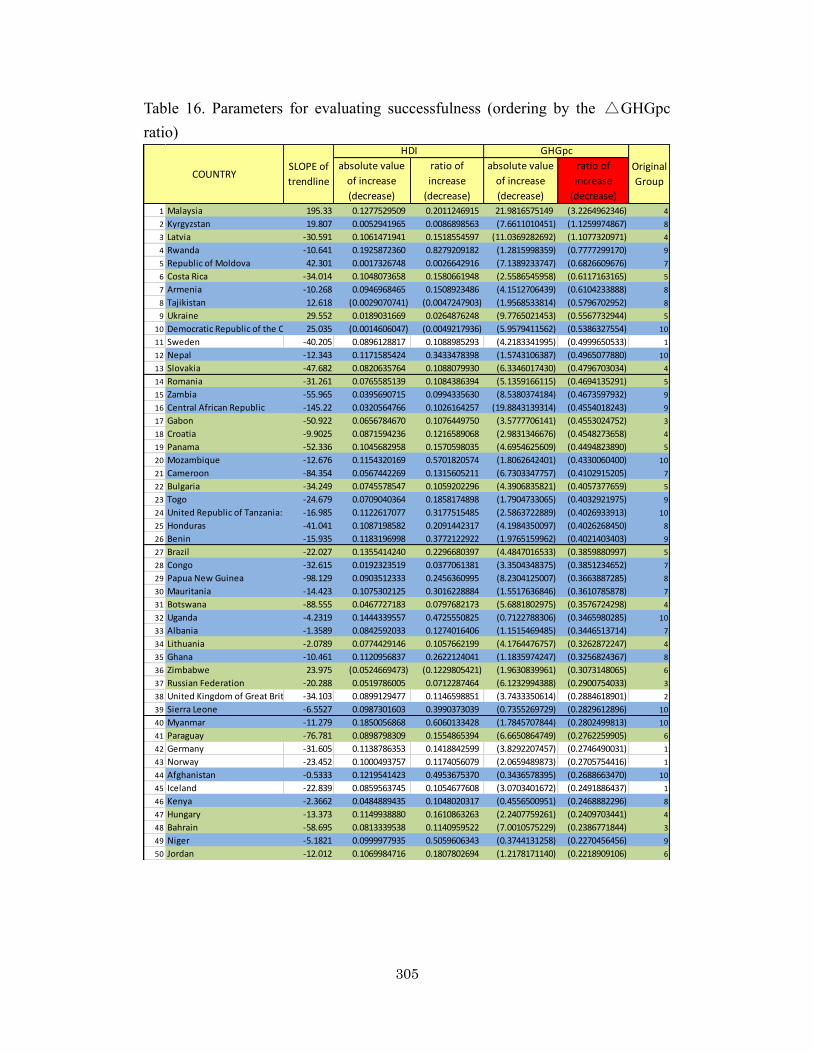
305
Table 16. Parameters for evaluating successfulness (ordering by the △GHGpc ratio)
1 Malaysia 195.33 0.1277529509 0.2011246915 21.9816575149 (3.2264962346) 42 Kyrgyzstan 19.807 0.0052941965 0.0086898563 (7.6611010451) (1.1259974867) 83 Latvia -30.591 0.1061471941 0.1518554597 (11.0369282692) (1.1077320971) 44 Rwanda -10.641 0.1925872360 0.8279209182 (1.2815998359) (0.7777299170) 95 Republic of Moldova 42.301 0.0017326748 0.0026642916 (7.1389233747) (0.6826609676) 76 Costa Rica -34.014 0.1048073658 0.1580661948 (2.5586545958) (0.6117163165) 57 Armenia -10.268 0.0946968465 0.1508923486 (4.1512706439) (0.6104233888) 88 Tajikistan 12.618 (0.0029070741) (0.0047247903) (1.9568533814) (0.5796702952) 89 Ukraine 29.552 0.0189031669 0.0264876248 (9.7765021453) (0.5567732944) 5
10 Democratic Republic of the Congo 25.035 (0.0014606047) (0.0049217936) (5.9579411562) (0.5386327554) 1011 Sweden -40.205 0.0896128817 0.1088985293 (4.2183341995) (0.4999650533) 112 Nepal -12.343 0.1171585424 0.3433478398 (1.5743106387) (0.4965077880) 1013 Slovakia -47.682 0.0820635764 0.1088079930 (6.3346017430) (0.4796703034) 414 Romania -31.261 0.0765585139 0.1084386394 (5.1359166115) (0.4694135291) 515 Zambia -55.965 0.0395690715 0.0994335630 (8.5380374184) (0.4673597932) 916 Central African Republic -145.22 0.0320564766 0.1026164257 (19.8843139314) (0.4554018243) 917 Gabon -50.922 0.0656784670 0.1076449750 (3.5777706141) (0.4553024752) 318 Croatia -9.9025 0.0871594236 0.1216589068 (2.9831346676) (0.4548273658) 419 Panama -52.336 0.1045682958 0.1570598035 (4.6954625609) (0.4494823890) 520 Mozambique -12.676 0.1154320169 0.5701820574 (1.8062642401) (0.4330060400) 1021 Cameroon -84.354 0.0567442269 0.1315605211 (6.7303347757) (0.4102915205) 722 Bulgaria -34.249 0.0745578547 0.1059202296 (4.3906835821) (0.4057377659) 523 Togo -24.679 0.0709040364 0.1858174898 (1.7904733065) (0.4032921975) 924 United Republic of Tanzania: Mainland-16.985 0.1122617077 0.3177515485 (2.5863722889) (0.4026933913) 1025 Honduras -41.041 0.1087198582 0.2091442317 (4.1984350097) (0.4026268450) 826 Benin -15.935 0.1183196998 0.3772122922 (1.9765159962) (0.4021403403) 927 Brazil -22.027 0.1355414240 0.2296680397 (4.4847016533) (0.3859880997) 528 Congo -32.615 0.0192323519 0.0377061381 (3.3504348375) (0.3851234652) 729 Papua New Guinea -98.129 0.0903512333 0.2456360995 (8.2304125007) (0.3663887285) 830 Mauritania -14.423 0.1075302125 0.3016228884 (1.5517636846) (0.3610785878) 731 Botswana -88.555 0.0467727183 0.0797682173 (5.6881802975) (0.3576724298) 432 Uganda -4.2319 0.1444339557 0.4725550825 (0.7122788306) (0.3465980285) 1033 Albania -1.3589 0.0842592033 0.1274016406 (1.1515469485) (0.3446513714) 734 Lithuania -2.0789 0.0774429146 0.1057662199 (4.1764476757) (0.3262872247) 435 Ghana -10.461 0.1120956837 0.2622124041 (1.1835974247) (0.3256824367) 836 Zimbabwe 23.975 (0.0524669473) (0.1229805421) (1.9630839961) (0.3073148065) 637 Russian Federation -20.288 0.0519786005 0.0712287464 (6.1232994388) (0.2900754033) 338 United Kingdom of Great Britain and Northern Ireland-34.103 0.0899129477 0.1146598851 (3.7433350614) (0.2884618901) 239 Sierra Leone -6.5527 0.0987301603 0.3990373039 (0.7355269729) (0.2829612896) 1040 Myanmar -11.279 0.1850056868 0.6060133428 (1.7845707844) (0.2802499813) 1041 Paraguay -76.781 0.0898798309 0.1554865394 (6.6650864749) (0.2762259905) 642 Germany -31.605 0.1138786353 0.1418842599 (3.8292207457) (0.2746490031) 143 Norway -23.452 0.1000493757 0.1174056079 (2.0659489873) (0.2705754416) 144 Afghanistan -0.5333 0.1219541423 0.4953675370 (0.3436578395) (0.2688663470) 1045 Iceland -22.839 0.0859563745 0.1054677608 (3.0703401672) (0.2491886437) 146 Kenya -2.3662 0.0484889435 0.1048020317 (0.4556500951) (0.2468882296) 847 Hungary -13.373 0.1149938880 0.1610863263 (2.2407759261) (0.2409703441) 448 Bahrain -58.695 0.0813339538 0.1140959522 (7.0010575229) (0.2386771844) 349 Niger -5.1821 0.0999977935 0.5059606343 (0.3744131258) (0.2270456456) 950 Jordan -12.012 0.1069984716 0.1807802694 (1.2178171140) (0.2218909106) 6
COUNTRYSLOPE of trendline
HDI GHGpcOriginal Group
absolute value of increase (decrease)
ratio of increase
(decrease)
absolute value of increase (decrease)
ratio of increase
(decrease)

306
51 Luxembourg -48.472 0.0781643834 0.0981527490 (6.5160095889) (0.2137814585) 152 Belize -228.2 0.0464002391 0.0710287819 (10.6181808586) (0.1903063745) 553 Mali -3.3894 0.1405121256 0.6894226791 (0.5330235137) (0.1876507136) 954 Estonia -10.955 0.1101884042 0.1512771911 (4.8464243054) (0.1824815719) 455 Bolivia -30.774 0.1109720732 0.1992961108 (3.1758279892) (0.1776062111) 756 Denmark -39.4 0.0827246577 0.1013440605 (2.2988202433) (0.1748334545) 157 Mongolia -26.754 0.0978190071 0.1748388133 (3.9015595948) (0.1676732983) 858 Ecuador -19.262 0.0847925632 0.1336136264 (1.7526920990) (0.1624609056) 659 Senegal -3.1442 0.1021746154 0.2779800049 (0.4048867616) (0.1562526278) 760 Ireland -4.8748 0.1236523176 0.1559781192 (2.0449117418) (0.1341972591) 261 France -12.219 0.1067902795 0.1361271108 (1.1507676351) (0.1328598505) 162 Côte d'Ivoire -7.0389 0.0668691711 0.1856038399 (0.4468347639) (0.1200228642) 763 Switzerland -8.9497 0.0714554161 0.0850542681 (0.8655861125) (0.1166833272) 164 United States -38.675 0.0566216808 0.0645008468 (2.5999681484) (0.1139477965) 165 Lao People's Democratic Republic-4.4484 0.1550180880 0.4091154176 (0.8695015592) (0.1095307513) 1066 Malawi -1.2794 0.1178927717 0.3991478972 (0.1879342218) (0.1077583718) 1067 Belgium -12.389 0.0796630381 0.0975526721 (1.4288961334) (0.1075681768) 168 Colombia -5.5852 0.1142900132 0.1906209811 (0.5217964687) (0.1007512188) 669 Nicaragua -4.6061 0.1146239390 0.2393775603 (0.8697385348) (0.0981078914) 870 Fiji 0.986 0.0849132766 0.1381872290 (0.1442463019) (0.0847533134) 571 Brunei Darussalam -92.87 0.0713743460 0.0912148072 (5.0866003601) (0.0813499539) 272 Italy -0.3548 0.1100341357 0.1427199432 (0.6315365971) (0.0761853911) 273 Guyana -5.6756 0.1254918023 0.2497737553 (0.7563958722) (0.0741117491) 874 Venezuela (Bolivarian Republic of)-7.4308 0.1083058411 0.1704775883 (0.9964637476) (0.0676234233) 575 Netherlands -14.525 0.0768750131 0.0912892328 (0.9213888732) (0.0650194945) 276 Jamaica -1.0086 0.0854328052 0.1330639847 (0.2153092092) (0.0460519424) 577 South Africa 5.9113 (0.0001960625) (0.0003157009) (0.4025824213) (0.0427532850) 478 Japan -1.6812 0.0720502584 0.0860867204 (0.3016193254) (0.0331845418) 179 Cuba 13.864 0.0944662860 0.1388054835 (0.0692684956) (0.0169739742) 480 Greece 4.5418 0.0938074035 0.1215074636 (0.1157512664) (0.0120130532) 381 Gambia -0.2945 0.1139468296 0.3525354504 (0.0165329573) (0.0039854851) 782 Syrian Arab Republic 1.1774 0.0882770005 0.1584124894 0.0318242336 0.0073540947 783 Malta 5.2974 0.0869339507 0.1148333135 0.2119241637 0.0300408970 384 Swaziland -13.139 (0.0007235818) (0.0013581347) 0.0842953909 0.0360591006 685 Australia 50.171 0.0545955729 0.0620069085 1.2487271477 0.0486961483 286 Sri Lanka 2.2154 0.0976923445 0.1607531132 0.1260010652 0.0572732115 987 New Zealand 18.876 0.0815172108 0.0976059871 0.7705709116 0.0677542592 288 Guatemala 3.5777 0.1146459141 0.2471482988 0.2492068935 0.0760415459 789 Namibia -0.755 0.0343331284 0.0602954842 0.9896680930 0.1009791192 590 Argentina 10.895 0.1036784198 0.1479164193 1.0768826287 0.1136545267 391 Algeria 4.0877 0.1475183859 0.2624714089 0.5652678655 0.1437301591 592 Haiti 2.8643 0.0507994616 0.1272734284 0.1054166251 0.1507763740 993 Spain 18.043 0.1281964172 0.1696717519 0.9499726916 0.1525416924 294 Canada 143.85 0.0434901647 0.0502600387 3.2866117413 0.1531332005 295 Lesotho -1.7427 (0.0216261282) (0.0456476618) 0.1802385015 0.1549215185 896 Barbados 34.722 0.0630351825 0.0829322604 1.7336933058 0.1587602709 397 Peru 4.3093 0.1144103778 0.1848329911 0.7127022632 0.1606016554 698 Bangladesh 1.0077 0.1466953693 0.4061628496 0.1592903480 0.1799244871 1099 Portugal 16.72 0.1028537244 0.1440081266 1.0959398232 0.1853044738 3
100 Mexico 9.1656 0.1165831137 0.1783086046 0.9503174465 0.1886092630 4101 Cyprus 19.629 0.0701152468 0.0899712992 1.3770885794 0.2099958730 3102 Pakistan 2.4001 0.1285001684 0.3352172827 0.3326291984 0.2140544509 9103 Israel 19.538 0.0866075219 0.1070445488 2.1513683734 0.2325911565 2104 Philippines 3.5005 0.0676731969 0.1164451521 0.3020753292 0.2401260907 7105 Qatar 199.19 0.0844984672 0.1137665779 9.4100628507 0.2799664668 2106 Austria 24.798 0.0951443018 0.1193844328 2.5997677448 0.3211380863 1107 Singapore 22.039 0.1359133859 0.1796892214 3.4554392294 0.3340564168 2108 Tonga 18.897 0.0524830007 0.0799976835 0.9286720985 0.3467127511 6109 Tunisia 6.1135 0.1573879246 0.2847507384 0.9113770945 0.3904882528 6110 Indonesia 17.46 0.1409357140 0.2944021961 2.4194511257 0.4013845543 8

307
111 El Salvador 4.5221 0.1501373310 0.2846174440 0.6709826580 0.4187207892 7112 Turkey 8.9174 0.1461713579 0.2568207631 1.5157846057 0.4481217305 3113 Saudi Arabia 44.341 0.1234605139 0.1890379520 6.3696777031 0.5159620414 3114 Yemen 2.9683 0.1798590605 0.6290369665 0.5169133912 0.5256494651 9115 Finland 42.848 0.0889219151 0.1110048594 5.4749175661 0.5436866064 1116 Egypt 8.7461 0.1584094386 0.3153200164 1.3018286110 0.5817008933 8117 India 4.6559 0.1368812915 0.3339408716 0.7194469131 0.6037495087 9118 Kuwait 356.63 0.0730520450 0.1025304723 25.6557999879 0.6666651919 2119 Thailand 17.425 0.1164030966 0.2045103989 2.1031456513 0.6815770327 6120 Dominican Republic 12.942 0.1129954630 0.1933740788 1.4473491901 0.8556205436 6121 Chile 20.98 0.1104484159 0.1572779864 2.3714816934 0.8810580902 4122 Mauritius 23.531 0.1064623305 0.1701373525 2.3691100864 1.0385701109 5123 Republic of Korea (South) 39.978 0.1557980342 0.2080668934 6.6135031794 1.0792100382 3124 Iran, Islamic Republic of 25.855 0.2005172416 0.3715254857 4.9988868452 1.1521592380 6125 Trinidad and Tobago 267.17 0.0733014736 0.1069899765 19.2556391420 1.2489605059 3126 China, People's Republic of 22.346 0.1940137709 0.3920161649 4.3328394649 1.6140752347 9127 Morocco 12.031 0.1461476780 0.3324289664 1.8714998468 1.8045379968 6128 Uruguay 33.89 0.0927885841 0.1339638683 2.8024865909 2.5422419132 4129 Burundi 38.499 0.0766953451 0.2822499896 3.2374206817 2.6624078264 10130 Vietnam 14.603 0.1724685065 0.3931706053 2.4874842097 6.3895092304 10

308
Table 17. Parameters for evaluating successfulness (ordering by the slope of △GHGpc/△GNIpc)
1 Burundi -0.009 -36.937 -0.131 3.237 2.662 102 Papua New Guinea -0.007 653.938 1.025 -8.230 -0.366 83 United Republic of Tanzania: Mainland-0.007 316.053 1.519 -2.586 -0.403 104 Zambia -0.006 651.436 1.475 -8.538 -0.467 95 Belize -0.005 2102.048 1.012 -10.618 -0.190 56 Mozambique -0.005 184.779 0.895 -1.806 -0.433 107 Nepal -0.005 353.868 1.815 -1.574 -0.497 108 Cameroon -0.004 226.829 0.238 -6.730 -0.410 79 Benin -0.004 362.690 0.959 -1.977 -0.402 9
10 Honduras -0.003 1275.428 1.899 -4.198 -0.403 811 Rwanda -0.003 164.756 0.457 -1.282 -0.778 912 Sierra Leone -0.003 230.472 1.118 -0.736 -0.283 1013 Niger -0.002 32.906 0.100 -0.374 -0.227 914 Paraguay -0.002 1662.286 1.483 -6.665 -0.276 615 Uganda -0.002 305.915 1.419 -0.712 -0.347 1016 Bolivia -0.002 1194.326 1.713 -3.176 -0.178 717 Myanmar -0.002 744.011 5.472 -1.785 -0.280 1018 Congo -0.001 1426.491 1.457 -3.350 -0.385 719 Mongolia -0.001 1434.830 2.345 -3.902 -0.168 820 Panama -0.001 4590.121 1.966 -4.695 -0.449 521 Ghana -0.001 634.608 0.958 -1.184 -0.326 822 Botswana -0.001 4702.304 1.795 -5.688 -0.358 423 Nicaragua -0.001 438.349 0.672 -0.870 -0.098 824 Mali -0.001 303.131 1.060 -0.533 -0.188 925 Brazil -0.001 8403.356 3.514 -4.485 -0.386 526 Costa Rica -0.001 5283.029 2.318 -2.559 -0.612 527 Mauritania -0.001 118.748 0.153 -1.552 -0.361 728 Kyrgyzstan -0.001 241.385 0.407 -7.661 -1.126 829 Bahrain -0.001 6988.866 0.821 -7.001 -0.239 330 Latvia -0.001 7811.505 2.518 -11.037 -1.108 431 Senegal -0.001 188.940 0.229 -0.405 -0.156 732 Guyana -0.001 1978.637 3.055 -0.756 -0.074 833 Romania 0.000 5814.225 3.327 -5.136 -0.469 534 Ecuador 0.000 2820.582 2.540 -1.753 -0.162 635 Armenia 0.000 2529.067 4.138 -4.151 -0.610 836 Brunei Darussalam 0.000 17197.862 1.232 -5.087 -0.081 237 Gabon 0.000 5183.708 0.920 -3.578 -0.455 338 Bulgaria 0.000 4029.621 1.822 -4.391 -0.406 539 Jordan 0.000 3237.793 3.022 -1.218 -0.222 640 Kenya 0.000 280.776 0.551 -0.456 -0.247 841 Sweden 0.000 22200.914 0.787 -4.218 -0.500 142 Russian Federation 0.000 6243.233 1.634 -6.123 -0.290 343 Slovakia 0.000 12608.568 4.048 -6.335 -0.480 444 Gambia 0.000 -204.030 -0.284 -0.017 -0.004 745 Lao People's Democratic Republic 0.000 833.919 4.044 -0.870 -0.110 1046 Germany 0.000 19051.665 0.869 -3.829 -0.275 147 United Kingdom of Great Britain and Northern Ireland0.000 19446.213 1.118 -3.743 -0.288 248 Hungary 0.000 9165.358 3.010 -2.241 -0.241 449 Colombia 0.000 4322.159 2.657 -0.522 -0.101 650 Denmark 0.000 31783.616 1.235 -2.299 -0.175 1
SLOPE of trendline
GNIpc GHGpcOriginal Group
absolute value of increase (decrease)
ratio of increase
(decrease)
absolute value of increase (decrease)
ratio of increase
(decrease)
COUNTRY

309
51 United States 0.000 24536.366 1.090 -2.600 -0.114 152 Croatia 0.000 9442.953 2.629 -2.983 -0.455 453 France 0.000 19051.693 0.893 -1.151 -0.133 154 Belgium 0.000 24568.086 1.208 -1.429 -0.108 155 Syrian Arab Republic 0.000 2047.869 2.415 0.032 0.007 756 Venezuela (Bolivarian Republic of) 0.000 11106.516 4.798 -0.996 -0.068 557 Albania 0.000 3029.731 4.490 -1.152 -0.345 758 Norway 0.000 59573.889 2.211 -2.066 -0.271 159 Iceland 0.000 8199.092 0.339 -3.070 -0.249 160 Netherlands 0.000 26530.455 1.350 -0.921 -0.065 261 Ireland 0.000 25931.828 1.999 -2.045 -0.134 262 Italy 0.000 14182.751 0.723 -0.632 -0.076 263 Togo 0.000 43.896 0.092 -1.790 -0.403 964 Switzerland 0.000 38650.262 1.032 -0.866 -0.117 165 Luxembourg 0.000 43220.933 1.372 -6.516 -0.214 166 South Africa 0.000 4178.640 1.427 -0.403 -0.043 467 Greece 0.000 16396.701 1.747 -0.116 -0.012 368 Swaziland 0.000 1949.863 1.505 0.084 0.036 669 Lithuania 0.000 7981.638 2.847 -4.176 -0.326 470 Japan 0.000 18914.403 0.740 -0.302 -0.033 171 New Zealand 0.000 18523.990 1.461 0.771 0.068 272 Jamaica 0.000 2721.512 1.375 -0.215 -0.046 573 Australia 0.000 37172.021 2.039 1.249 0.049 274 Malawi 0.000 86.364 0.324 -0.188 -0.108 1075 Guatemala 0.000 2043.425 2.742 0.249 0.076 776 Cyprus 0.000 17774.494 1.815 1.377 0.210 377 Malta 0.000 10410.052 1.397 0.212 0.030 378 Republic of Moldova 0.000 853.303 0.939 -7.139 -0.683 779 Sri Lanka 0.000 1881.437 4.060 0.126 0.057 980 Spain 0.000 16490.597 1.242 0.950 0.153 281 Portugal 0.000 12936.529 1.664 1.096 0.185 382 Estonia 0.000 9747.571 2.696 -4.846 -0.182 483 Fiji 0.000 1707.302 0.916 -0.144 -0.085 584 Philippines 0.000 1992.080 2.318 0.302 0.240 785 Austria 0.000 23762.501 1.114 2.600 0.321 186 Singapore 0.000 31182.254 2.447 3.455 0.334 287 Israel 0.000 16031.278 1.289 2.151 0.233 288 Argentina 0.000 4770.405 1.152 1.077 0.114 389 Finland 0.000 17735.306 0.655 5.475 0.544 190 Canada 0.000 25275.342 1.246 3.287 0.153 291 Qatar 0.000 49034.225 3.064 9.410 0.280 292 Turkey 0.000 6258.706 1.655 1.516 0.448 393 Mexico 0.000 5678.595 1.717 0.950 0.189 494 Uruguay 0.000 8434.569 2.934 2.802 2.542 495 Chile 0.000 9291.477 3.733 2.371 0.881 496 Peru 0.000 3770.874 2.915 0.713 0.161 697 Lesotho 0.000 647.581 1.078 0.180 0.155 898 Barbados 0.000 6596.084 0.853 1.734 0.159 399 Algeria 0.000 1915.086 0.810 0.565 0.144 5
100 Namibia 0.000 3017.673 1.570 0.990 0.101 5101 Ukraine 0.000 1205.084 0.675 -9.777 -0.557 5102 El Salvador 0.000 2494.825 2.847 0.671 0.419 7103 Côte d'Ivoire 0.000 279.147 0.333 -0.447 -0.120 7104 Republic of Korea (South) 0.000 14801.403 2.354 6.614 1.079 3105 Tonga 0.000 1878.560 1.076 0.929 0.347 6106 Tunisia 0.000 2402.382 1.497 0.911 0.390 6107 Dominican Republic 0.000 3674.222 2.864 1.447 0.856 6108 Tajikistan 0.000 503.134 0.941 -1.957 -0.580 8109 Haiti 0.000 246.052 0.677 0.105 0.151 9110 Bangladesh 0.000 460.901 1.695 0.159 0.180 10

310
111 Kuwait 0.001 35795.881 2.865 25.656 0.667 2112 Saudi Arabia 0.001 9175.864 1.223 6.370 0.516 3113 Cuba 0.001 2978.324 1.123 -0.069 -0.017 4114 Mauritius 0.001 5124.374 2.096 2.369 1.039 5115 Pakistan 0.001 591.401 1.320 0.333 0.214 9116 Thailand 0.001 3206.226 2.102 2.103 0.682 6117 Egypt 0.001 2013.201 3.268 1.302 0.582 8118 India 0.001 987.190 2.674 0.719 0.604 9119 Yemen 0.001 955.088 2.825 0.517 0.526 9120 Afghanistan 0.001 172.178 0.620 -0.344 -0.269 10121 Iran, Islamic Republic of 0.001 4114.292 2.507 4.999 1.152 6122 Indonesia 0.001 2215.864 3.394 2.419 0.401 8123 Morocco 0.001 1653.021 1.477 1.871 1.805 6124 China, People's Republic of 0.001 4170.723 11.988 4.333 1.614 9125 Trinidad and Tobago 0.002 11503.610 2.997 19.256 1.249 3126 Vietnam 0.002 1070.873 11.858 2.487 6.390 10127 Zimbabwe 0.003 -499.750 -0.461 -1.963 -0.307 6128 Malaysia 0.004 5886.450 2.341 21.982 -3.226 4129 Democratic Republic of the Congo 0.019 -49.104 -0.208 -5.958 -0.539 10130 Central African Republic 0.033 -33.196 -0.069 -19.884 -0.455 9
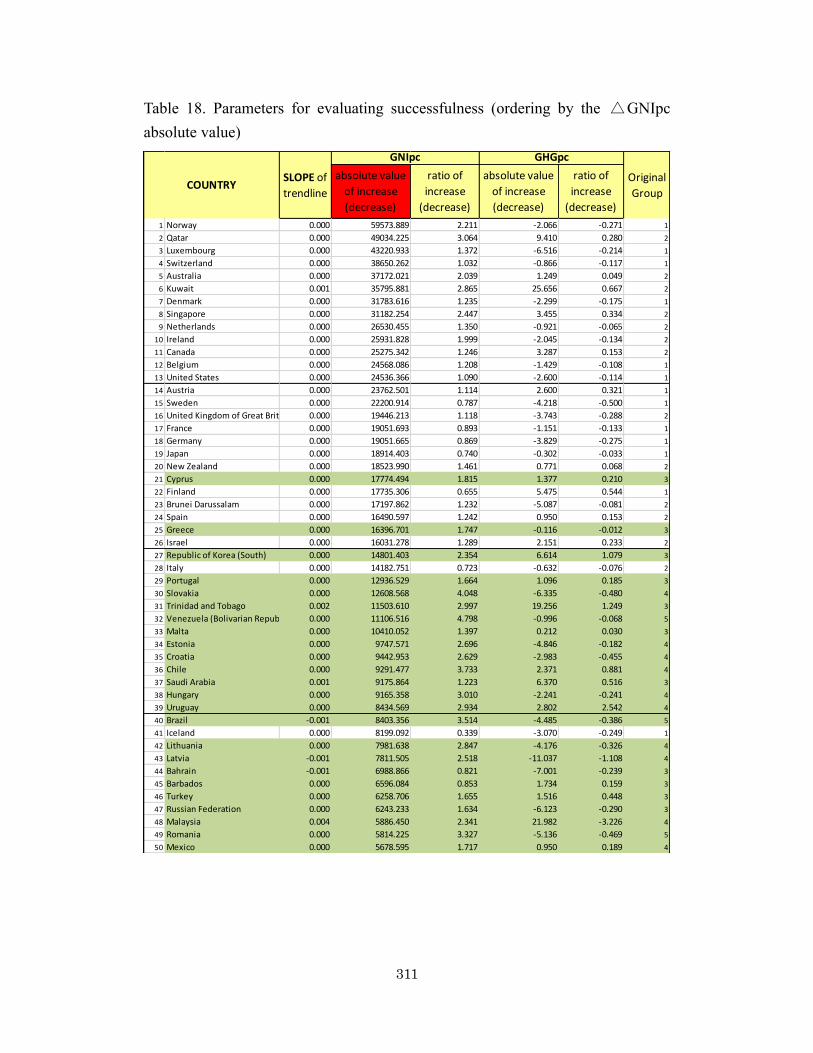
311
Table 18. Parameters for evaluating successfulness (ordering by the △GNIpc absolute value)
1 Norway 0.000 59573.889 2.211 -2.066 -0.271 12 Qatar 0.000 49034.225 3.064 9.410 0.280 23 Luxembourg 0.000 43220.933 1.372 -6.516 -0.214 14 Switzerland 0.000 38650.262 1.032 -0.866 -0.117 15 Australia 0.000 37172.021 2.039 1.249 0.049 26 Kuwait 0.001 35795.881 2.865 25.656 0.667 27 Denmark 0.000 31783.616 1.235 -2.299 -0.175 18 Singapore 0.000 31182.254 2.447 3.455 0.334 29 Netherlands 0.000 26530.455 1.350 -0.921 -0.065 2
10 Ireland 0.000 25931.828 1.999 -2.045 -0.134 211 Canada 0.000 25275.342 1.246 3.287 0.153 212 Belgium 0.000 24568.086 1.208 -1.429 -0.108 113 United States 0.000 24536.366 1.090 -2.600 -0.114 114 Austria 0.000 23762.501 1.114 2.600 0.321 115 Sweden 0.000 22200.914 0.787 -4.218 -0.500 116 United Kingdom of Great Britain and Northern Ireland0.000 19446.213 1.118 -3.743 -0.288 217 France 0.000 19051.693 0.893 -1.151 -0.133 118 Germany 0.000 19051.665 0.869 -3.829 -0.275 119 Japan 0.000 18914.403 0.740 -0.302 -0.033 120 New Zealand 0.000 18523.990 1.461 0.771 0.068 221 Cyprus 0.000 17774.494 1.815 1.377 0.210 322 Finland 0.000 17735.306 0.655 5.475 0.544 123 Brunei Darussalam 0.000 17197.862 1.232 -5.087 -0.081 224 Spain 0.000 16490.597 1.242 0.950 0.153 225 Greece 0.000 16396.701 1.747 -0.116 -0.012 326 Israel 0.000 16031.278 1.289 2.151 0.233 227 Republic of Korea (South) 0.000 14801.403 2.354 6.614 1.079 328 Italy 0.000 14182.751 0.723 -0.632 -0.076 229 Portugal 0.000 12936.529 1.664 1.096 0.185 330 Slovakia 0.000 12608.568 4.048 -6.335 -0.480 431 Trinidad and Tobago 0.002 11503.610 2.997 19.256 1.249 332 Venezuela (Bolivarian Republic of) 0.000 11106.516 4.798 -0.996 -0.068 533 Malta 0.000 10410.052 1.397 0.212 0.030 334 Estonia 0.000 9747.571 2.696 -4.846 -0.182 435 Croatia 0.000 9442.953 2.629 -2.983 -0.455 436 Chile 0.000 9291.477 3.733 2.371 0.881 437 Saudi Arabia 0.001 9175.864 1.223 6.370 0.516 338 Hungary 0.000 9165.358 3.010 -2.241 -0.241 439 Uruguay 0.000 8434.569 2.934 2.802 2.542 440 Brazil -0.001 8403.356 3.514 -4.485 -0.386 541 Iceland 0.000 8199.092 0.339 -3.070 -0.249 142 Lithuania 0.000 7981.638 2.847 -4.176 -0.326 443 Latvia -0.001 7811.505 2.518 -11.037 -1.108 444 Bahrain -0.001 6988.866 0.821 -7.001 -0.239 345 Barbados 0.000 6596.084 0.853 1.734 0.159 346 Turkey 0.000 6258.706 1.655 1.516 0.448 347 Russian Federation 0.000 6243.233 1.634 -6.123 -0.290 348 Malaysia 0.004 5886.450 2.341 21.982 -3.226 449 Romania 0.000 5814.225 3.327 -5.136 -0.469 550 Mexico 0.000 5678.595 1.717 0.950 0.189 4
SLOPE of trendline
GNIpc GHGpc
Original Group
absolute value of increase (decrease)
ratio of increase
(decrease)
absolute value of increase (decrease)
ratio of increase
(decrease)
COUNTRY

312
51 Costa Rica -0.001 5283.029 2.318 -2.559 -0.612 552 Gabon 0.000 5183.708 0.920 -3.578 -0.455 353 Mauritius 0.001 5124.374 2.096 2.369 1.039 554 Argentina 0.000 4770.405 1.152 1.077 0.114 355 Botswana -0.001 4702.304 1.795 -5.688 -0.358 456 Panama -0.001 4590.121 1.966 -4.695 -0.449 557 Colombia 0.000 4322.159 2.657 -0.522 -0.101 658 South Africa 0.000 4178.640 1.427 -0.403 -0.043 459 China, People's Republic of 0.001 4170.723 11.988 4.333 1.614 960 Iran, Islamic Republic of 0.001 4114.292 2.507 4.999 1.152 661 Bulgaria 0.000 4029.621 1.822 -4.391 -0.406 562 Peru 0.000 3770.874 2.915 0.713 0.161 663 Dominican Republic 0.000 3674.222 2.864 1.447 0.856 664 Jordan 0.000 3237.793 3.022 -1.218 -0.222 665 Thailand 0.001 3206.226 2.102 2.103 0.682 666 Albania 0.000 3029.731 4.490 -1.152 -0.345 767 Namibia 0.000 3017.673 1.570 0.990 0.101 568 Cuba 0.001 2978.324 1.123 -0.069 -0.017 469 Ecuador 0.000 2820.582 2.540 -1.753 -0.162 670 Jamaica 0.000 2721.512 1.375 -0.215 -0.046 571 Armenia 0.000 2529.067 4.138 -4.151 -0.610 872 El Salvador 0.000 2494.825 2.847 0.671 0.419 773 Tunisia 0.000 2402.382 1.497 0.911 0.390 674 Indonesia 0.001 2215.864 3.394 2.419 0.401 875 Belize -0.005 2102.048 1.012 -10.618 -0.190 576 Syrian Arab Republic 0.000 2047.869 2.415 0.032 0.007 777 Guatemala 0.000 2043.425 2.742 0.249 0.076 778 Egypt 0.001 2013.201 3.268 1.302 0.582 879 Philippines 0.000 1992.080 2.318 0.302 0.240 780 Guyana -0.001 1978.637 3.055 -0.756 -0.074 881 Swaziland 0.000 1949.863 1.505 0.084 0.036 682 Algeria 0.000 1915.086 0.810 0.565 0.144 583 Sri Lanka 0.000 1881.437 4.060 0.126 0.057 984 Tonga 0.000 1878.560 1.076 0.929 0.347 685 Fiji 0.000 1707.302 0.916 -0.144 -0.085 586 Paraguay -0.002 1662.286 1.483 -6.665 -0.276 687 Morocco 0.001 1653.021 1.477 1.871 1.805 688 Mongolia -0.001 1434.830 2.345 -3.902 -0.168 889 Congo -0.001 1426.491 1.457 -3.350 -0.385 790 Honduras -0.003 1275.428 1.899 -4.198 -0.403 891 Ukraine 0.000 1205.084 0.675 -9.777 -0.557 592 Bolivia -0.002 1194.326 1.713 -3.176 -0.178 793 Vietnam 0.002 1070.873 11.858 2.487 6.390 1094 India 0.001 987.190 2.674 0.719 0.604 995 Yemen 0.001 955.088 2.825 0.517 0.526 996 Republic of Moldova 0.000 853.303 0.939 -7.139 -0.683 797 Lao People's Democratic Republic 0.000 833.919 4.044 -0.870 -0.110 1098 Myanmar -0.002 744.011 5.472 -1.785 -0.280 1099 Papua New Guinea -0.007 653.938 1.025 -8.230 -0.366 8
100 Zambia -0.006 651.436 1.475 -8.538 -0.467 9101 Lesotho 0.000 647.581 1.078 0.180 0.155 8102 Ghana -0.001 634.608 0.958 -1.184 -0.326 8103 Pakistan 0.001 591.401 1.320 0.333 0.214 9104 Tajikistan 0.000 503.134 0.941 -1.957 -0.580 8105 Bangladesh 0.000 460.901 1.695 0.159 0.180 10106 Nicaragua -0.001 438.349 0.672 -0.870 -0.098 8107 Benin -0.004 362.690 0.959 -1.977 -0.402 9108 Nepal -0.005 353.868 1.815 -1.574 -0.497 10109 United Republic of Tanzania: Mainland-0.007 316.053 1.519 -2.586 -0.403 10110 Uganda -0.002 305.915 1.419 -0.712 -0.347 10
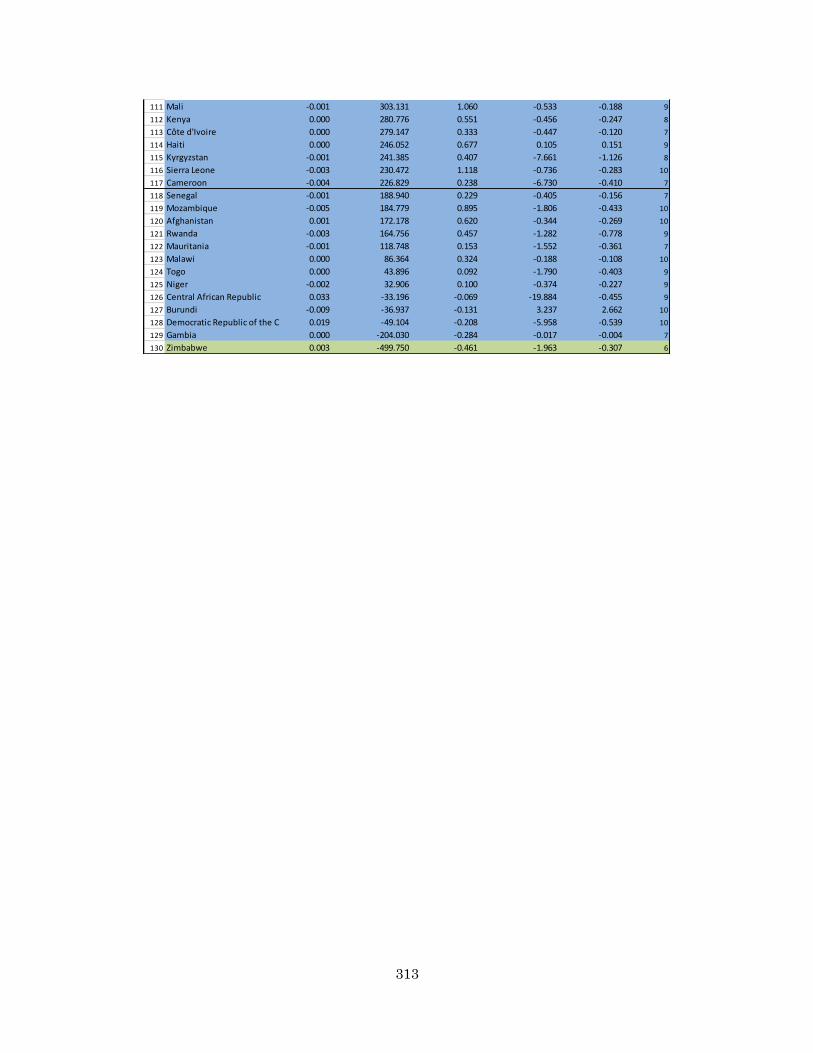
313
111 Mali -0.001 303.131 1.060 -0.533 -0.188 9112 Kenya 0.000 280.776 0.551 -0.456 -0.247 8113 Côte d'Ivoire 0.000 279.147 0.333 -0.447 -0.120 7114 Haiti 0.000 246.052 0.677 0.105 0.151 9115 Kyrgyzstan -0.001 241.385 0.407 -7.661 -1.126 8116 Sierra Leone -0.003 230.472 1.118 -0.736 -0.283 10117 Cameroon -0.004 226.829 0.238 -6.730 -0.410 7118 Senegal -0.001 188.940 0.229 -0.405 -0.156 7119 Mozambique -0.005 184.779 0.895 -1.806 -0.433 10120 Afghanistan 0.001 172.178 0.620 -0.344 -0.269 10121 Rwanda -0.003 164.756 0.457 -1.282 -0.778 9122 Mauritania -0.001 118.748 0.153 -1.552 -0.361 7123 Malawi 0.000 86.364 0.324 -0.188 -0.108 10124 Togo 0.000 43.896 0.092 -1.790 -0.403 9125 Niger -0.002 32.906 0.100 -0.374 -0.227 9126 Central African Republic 0.033 -33.196 -0.069 -19.884 -0.455 9127 Burundi -0.009 -36.937 -0.131 3.237 2.662 10128 Democratic Republic of the Congo 0.019 -49.104 -0.208 -5.958 -0.539 10129 Gambia 0.000 -204.030 -0.284 -0.017 -0.004 7130 Zimbabwe 0.003 -499.750 -0.461 -1.963 -0.307 6

314
Table 19. Parameters for evaluating successfulness (ordering by the △GNIpc ratio)
1 China, People's Republic of 0.001 4170.723 11.988 4.333 1.614 92 Vietnam 0.002 1070.873 11.858 2.487 6.390 103 Myanmar -0.002 744.011 5.472 -1.785 -0.280 104 Venezuela (Bolivarian Republic of) 0.000 11106.516 4.798 -0.996 -0.068 55 Albania 0.000 3029.731 4.490 -1.152 -0.345 76 Armenia 0.000 2529.067 4.138 -4.151 -0.610 87 Sri Lanka 0.000 1881.437 4.060 0.126 0.057 98 Slovakia 0.000 12608.568 4.048 -6.335 -0.480 49 Lao People's Democratic Republic 0.000 833.919 4.044 -0.870 -0.110 10
10 Chile 0.000 9291.477 3.733 2.371 0.881 411 Brazil -0.001 8403.356 3.514 -4.485 -0.386 512 Indonesia 0.001 2215.864 3.394 2.419 0.401 813 Romania 0.000 5814.225 3.327 -5.136 -0.469 514 Egypt 0.001 2013.201 3.268 1.302 0.582 815 Qatar 0.000 49034.225 3.064 9.410 0.280 216 Guyana -0.001 1978.637 3.055 -0.756 -0.074 817 Jordan 0.000 3237.793 3.022 -1.218 -0.222 618 Hungary 0.000 9165.358 3.010 -2.241 -0.241 419 Trinidad and Tobago 0.002 11503.610 2.997 19.256 1.249 320 Uruguay 0.000 8434.569 2.934 2.802 2.542 421 Peru 0.000 3770.874 2.915 0.713 0.161 622 Kuwait 0.001 35795.881 2.865 25.656 0.667 223 Dominican Republic 0.000 3674.222 2.864 1.447 0.856 624 Lithuania 0.000 7981.638 2.847 -4.176 -0.326 425 El Salvador 0.000 2494.825 2.847 0.671 0.419 726 Yemen 0.001 955.088 2.825 0.517 0.526 927 Guatemala 0.000 2043.425 2.742 0.249 0.076 728 Estonia 0.000 9747.571 2.696 -4.846 -0.182 429 India 0.001 987.190 2.674 0.719 0.604 930 Colombia 0.000 4322.159 2.657 -0.522 -0.101 631 Croatia 0.000 9442.953 2.629 -2.983 -0.455 432 Ecuador 0.000 2820.582 2.540 -1.753 -0.162 633 Latvia -0.001 7811.505 2.518 -11.037 -1.108 434 Iran, Islamic Republic of 0.001 4114.292 2.507 4.999 1.152 635 Singapore 0.000 31182.254 2.447 3.455 0.334 236 Syrian Arab Republic 0.000 2047.869 2.415 0.032 0.007 737 Republic of Korea (South) 0.000 14801.403 2.354 6.614 1.079 338 Mongolia -0.001 1434.830 2.345 -3.902 -0.168 839 Malaysia 0.004 5886.450 2.341 21.982 -3.226 440 Philippines 0.000 1992.080 2.318 0.302 0.240 741 Costa Rica -0.001 5283.029 2.318 -2.559 -0.612 542 Norway 0.000 59573.889 2.211 -2.066 -0.271 143 Thailand 0.001 3206.226 2.102 2.103 0.682 644 Mauritius 0.001 5124.374 2.096 2.369 1.039 545 Australia 0.000 37172.021 2.039 1.249 0.049 246 Ireland 0.000 25931.828 1.999 -2.045 -0.134 247 Panama -0.001 4590.121 1.966 -4.695 -0.449 548 Honduras -0.003 1275.428 1.899 -4.198 -0.403 849 Bulgaria 0.000 4029.621 1.822 -4.391 -0.406 550 Cyprus 0.000 17774.494 1.815 1.377 0.210 3
SLOPE of trendline
GNIpc GHGpc
Original Group
absolute value of increase (decrease)
ratio of increase
(decrease)
absolute value of increase (decrease)
ratio of increase
(decrease)
COUNTRY

315
51 Nepal -0.005 353.868 1.815 -1.574 -0.497 1052 Botswana -0.001 4702.304 1.795 -5.688 -0.358 453 Greece 0.000 16396.701 1.747 -0.116 -0.012 354 Mexico 0.000 5678.595 1.717 0.950 0.189 455 Bolivia -0.002 1194.326 1.713 -3.176 -0.178 756 Bangladesh 0.000 460.901 1.695 0.159 0.180 1057 Portugal 0.000 12936.529 1.664 1.096 0.185 358 Turkey 0.000 6258.706 1.655 1.516 0.448 359 Russian Federation 0.000 6243.233 1.634 -6.123 -0.290 360 Namibia 0.000 3017.673 1.570 0.990 0.101 561 United Republic of Tanzania: Mainland-0.007 316.053 1.519 -2.586 -0.403 1062 Swaziland 0.000 1949.863 1.505 0.084 0.036 663 Tunisia 0.000 2402.382 1.497 0.911 0.390 664 Paraguay -0.002 1662.286 1.483 -6.665 -0.276 665 Morocco 0.001 1653.021 1.477 1.871 1.805 666 Zambia -0.006 651.436 1.475 -8.538 -0.467 967 New Zealand 0.000 18523.990 1.461 0.771 0.068 268 Congo -0.001 1426.491 1.457 -3.350 -0.385 769 South Africa 0.000 4178.640 1.427 -0.403 -0.043 470 Uganda -0.002 305.915 1.419 -0.712 -0.347 1071 Malta 0.000 10410.052 1.397 0.212 0.030 372 Jamaica 0.000 2721.512 1.375 -0.215 -0.046 573 Luxembourg 0.000 43220.933 1.372 -6.516 -0.214 174 Netherlands 0.000 26530.455 1.350 -0.921 -0.065 275 Pakistan 0.001 591.401 1.320 0.333 0.214 976 Israel 0.000 16031.278 1.289 2.151 0.233 277 Canada 0.000 25275.342 1.246 3.287 0.153 278 Spain 0.000 16490.597 1.242 0.950 0.153 279 Denmark 0.000 31783.616 1.235 -2.299 -0.175 180 Brunei Darussalam 0.000 17197.862 1.232 -5.087 -0.081 281 Saudi Arabia 0.001 9175.864 1.223 6.370 0.516 382 Belgium 0.000 24568.086 1.208 -1.429 -0.108 183 Argentina 0.000 4770.405 1.152 1.077 0.114 384 Cuba 0.001 2978.324 1.123 -0.069 -0.017 485 Sierra Leone -0.003 230.472 1.118 -0.736 -0.283 1086 United Kingdom of Great Britain and Northern Ireland0.000 19446.213 1.118 -3.743 -0.288 287 Austria 0.000 23762.501 1.114 2.600 0.321 188 United States 0.000 24536.366 1.090 -2.600 -0.114 189 Lesotho 0.000 647.581 1.078 0.180 0.155 890 Tonga 0.000 1878.560 1.076 0.929 0.347 691 Mali -0.001 303.131 1.060 -0.533 -0.188 992 Switzerland 0.000 38650.262 1.032 -0.866 -0.117 193 Papua New Guinea -0.007 653.938 1.025 -8.230 -0.366 894 Belize -0.005 2102.048 1.012 -10.618 -0.190 595 Benin -0.004 362.690 0.959 -1.977 -0.402 996 Ghana -0.001 634.608 0.958 -1.184 -0.326 897 Tajikistan 0.000 503.134 0.941 -1.957 -0.580 898 Republic of Moldova 0.000 853.303 0.939 -7.139 -0.683 799 Gabon 0.000 5183.708 0.920 -3.578 -0.455 3
100 Fiji 0.000 1707.302 0.916 -0.144 -0.085 5101 Mozambique -0.005 184.779 0.895 -1.806 -0.433 10102 France 0.000 19051.693 0.893 -1.151 -0.133 1103 Germany 0.000 19051.665 0.869 -3.829 -0.275 1104 Barbados 0.000 6596.084 0.853 1.734 0.159 3105 Bahrain -0.001 6988.866 0.821 -7.001 -0.239 3106 Algeria 0.000 1915.086 0.810 0.565 0.144 5107 Sweden 0.000 22200.914 0.787 -4.218 -0.500 1108 Japan 0.000 18914.403 0.740 -0.302 -0.033 1109 Italy 0.000 14182.751 0.723 -0.632 -0.076 2110 Haiti 0.000 246.052 0.677 0.105 0.151 9

316
Table 20. Parameter Orders of Developing Countries in Asia
Table 21(a). Evaluation of Parameter Orders of Developing Countries in Asia
111 Ukraine 0.000 1205.084 0.675 -9.777 -0.557 5112 Nicaragua -0.001 438.349 0.672 -0.870 -0.098 8113 Finland 0.000 17735.306 0.655 5.475 0.544 1114 Afghanistan 0.001 172.178 0.620 -0.344 -0.269 10115 Kenya 0.000 280.776 0.551 -0.456 -0.247 8116 Rwanda -0.003 164.756 0.457 -1.282 -0.778 9117 Kyrgyzstan -0.001 241.385 0.407 -7.661 -1.126 8118 Iceland 0.000 8199.092 0.339 -3.070 -0.249 1119 Côte d'Ivoire 0.000 279.147 0.333 -0.447 -0.120 7120 Malawi 0.000 86.364 0.324 -0.188 -0.108 10121 Cameroon -0.004 226.829 0.238 -6.730 -0.410 7122 Senegal -0.001 188.940 0.229 -0.405 -0.156 7123 Mauritania -0.001 118.748 0.153 -1.552 -0.361 7124 Niger -0.002 32.906 0.100 -0.374 -0.227 9125 Togo 0.000 43.896 0.092 -1.790 -0.403 9126 Central African Republic 0.033 -33.196 -0.069 -19.884 -0.455 9127 Burundi -0.009 -36.937 -0.131 3.237 2.662 10128 Democratic Republic of the Congo 0.019 -49.104 -0.208 -5.958 -0.539 10129 Gambia 0.000 -204.030 -0.284 -0.017 -0.004 7130 Zimbabwe 0.003 -499.750 -0.461 -1.963 -0.307 6
Parameter (i) Parameter (ii) Parameter (iii) Parameter (iv) Parameter (v) Parameter (vi) Parameter (vii) Parameter (viii)
Afghanistan 10 71 28 7 73 44 120 120 114Bangladesh 10 75 13 10 85 98 110 105 56China, People's Republic of 9 111 2 14 122 126 124 59 1India 9 87 19 20 95 117 118 94 29Indonesia 8 102 17 25 115 110 122 74 12Kyrgyzstan 8 108 123 123 7 2 28 115 117Lao People's Democratic Republic 10 59 10 9 60 65 45 97 9Malaysia 4 127 24 41 129 1 128 48 39Mongolia 8 26 64 52 27 57 19 88 38Myanmar 10 44 4 4 47 40 17 98 3Nepal 10 41 31 18 49 12 7 108 51Pakistan 9 78 22 19 90 102 115 103 75Philippines 7 81 104 84 89 104 84 79 40Republic of Korea (South) 3 121 9 39 126 123 104 27 37Sri Lanka 9 77 65 57 84 86 79 83 7Tajikistan 8 96 128 127 44 8 108 104 97Thailand 6 101 33 40 111 119 116 65 43Vietnam 10 99 6 13 116 130 126 93 2
GNIpcvsGHGpc SLOPE of trendline
GNIpc
absolute value of increase (decrease)
ratio of increase
(decrease)
COUNTRY Original Group
HDIvsGHGpc SLOPE of trendline
HDI GHGpc
absolute value of increase (decrease)
ratio of increase
(decrease)
absolute value of increase (decrease)
ratio of increase
(decrease)
Vietnam Vietnam

317
Table 21 (b). Revised Evaluation of Parameter Orders of Developing Countries in Asia (adjusting parameters (vii) and (viii).
Table 22. Evaluation of the parameter (i) slope of the HDI vs GHGpc trend line I J K L M N
original group
HDIvs.GHGpc slope
Evaluation in the world
Evaluation in Asia
Afghanistan 10 71 △ ◎ very successful Bangladesh 10 75 × ○ successful China (PRC) 9 111 × △ marginal India 9 87 × ○ successful Indonesia 8 102 × △ marginal Kyrgyzstan 8 108 × NA Lao PDR 10 59 △ ◎ very successful Malaysia 4 127 × × unsuccessful Mongolia 8 26 ○ ◎ very successful Myanmar 10 44 △ ◎ very successful Nepal 10 41 △ ◎ very successful Pakistan 9 78 × ○ successful Philippines 7 81 × ○ successful Republic of Korea 3 121 × × unsuccessful Sri Lanka 9 77 × ○ successful Tajikistan 8 96 × NA Thailand 6 101 × △ marginal Vietnam 10 99 × △ marginal
Parameter (i) Parameter (ii) Parameter (iii) Parameter (iv) Parameter (v) Parameter (vi) Parameter (vii) Parameter (viii)
Afghanistan 10
△
⃝ ◎
△ △
x x xBangladesh 10 x ⃝ ◎ x x x x xChina, People's Republic of 9 x ◎ ⃝ x x x
△
◎
India 9 x ⃝ ⃝ x x x
△
⃝Indonesia 8 x ⃝ ⃝ x x x
△
⃝Kyrgyzstan 8 x x x ◎ ◎ ⃝ x xLao People's Democratic Republic 10
△
◎ ◎
△ △ △ △
◎
Malaysia 4 x ⃝
△
x ◎ x
△ △
Mongolia 8 ⃝ x x ⃝
△
⃝
△ △
Myanmar 10
△
◎ ◎
△ △
⃝
△
◎
Nepal 10
△ △
⃝
△
⃝ ◎ x
△
Pakistan 9 x ⃝ ⃝ x x x
△
xPhilippines 7 x x x x x x
△ △
Republic of Korea (South) 3 x ◎
△
x x x ⃝
△
Sri Lanka 9 x x x x x x
△
◎
Tajikistan 8 x x x
△
◎ x x xThailand 6 x
△ △
x x x
△ △
Vietnam 10 x ◎ ⃝ x x x
△
◎
COUNTRYOriginal Group
HDIvsGHGpc SLOPE of trendline
absolute value of increase (decrease)
ratio of increase
(decrease)
HDI GHGpcGNIpcvsGHGpc
SLOPE of trendline
GNIpcabsolute value
of increase (decrease)
ratio of increase
(decrease)
absolute value of increase (decrease)
ratio of increase
(decrease)

318
Appendix 6. Parameter (i) slope of the HDI vs GHGpc.
Figure 40. Parameter (i) slope of the HDI vs GHGpc trend line
Figure 41. Parameter (i) slope of the HDI vs GHGpc trend line (zoomed up)
-500
50100150200250
Afgh
anis
tan
Bang
lade
shCh
ina(
PRC)
Indi
aIn
done
sia
Lao
Peop
le's…
Mal
aysi
aM
ongo
liaM
yanm
arN
epal
Paki
stan
Phili
ppin
esRe
publ
ic o
f…Sr
i Lan
kaTh
aila
ndVi
etna
m
slope of trendline
slope of trendline
-30
-20
-10
0
10
20
30
40
Afgh
anis
tan
Bang
lade
shCh
ina(
PRC)
Indi
aIn
done
sia
Lao
Peop
le's…
Mal
aysi
aM
ongo
liaM
yanm
arN
epal
Paki
stan
Phili
ppin
esRe
publ
ic o
f…Sr
i Lan
kaTh
aila
ndVi
etna
mslope of trendline
slope of trendline

319
Figure 42. Parameter (i) slope of the HDI vs GHGpc trend line (Grouping)
-30
-20
-10
0
10
20
30
40
Afghan
istan
Bangla
desh
China(PRC)
India
Indonesi
a
Lao Peop
le's D
emocr
atic…
Malaysi
a
Mongol
ia
Myanmar
Nepal
Pakist
an
Philippin
es
Republi
c of K
orea (
South)
Sri Lan
ka
Thailan
d
Vietnam
slope of trendline
slope of trendline

320
Figure 43. Parameter (ii) absolute value of HDI increase
Figure 44. Parameter (ii) absolute value of HDI increase (zoomed up)
0.05
0.1
0.15
0.2
Afghan
istan
Bangla
desh
China(PRC)
India
Indonesi
a
Lao Peop
le's…
Malaysi
a
Mongol
ia
Myanmar
Nepal
Pakist
an
Philippin
es
Republi
c of…
Sri Lan
ka
Thailan
d
Vietnam
Increase of HDI absolute valueHDI absolute value
0.060.080.1
0.120.140.16
Afghan
istan
Bangla
desh
China(PRC)
India
Indonesi
a
Lao Peop
le's…
Malaysi
a
Mongol
ia
Myanmar
Nepal
Pakist
an
Philippin
es
Republi
c of…
Sri Lan
ka
Thailan
d
Vietnam
Increase of HDI absolute value
HDI absolute value
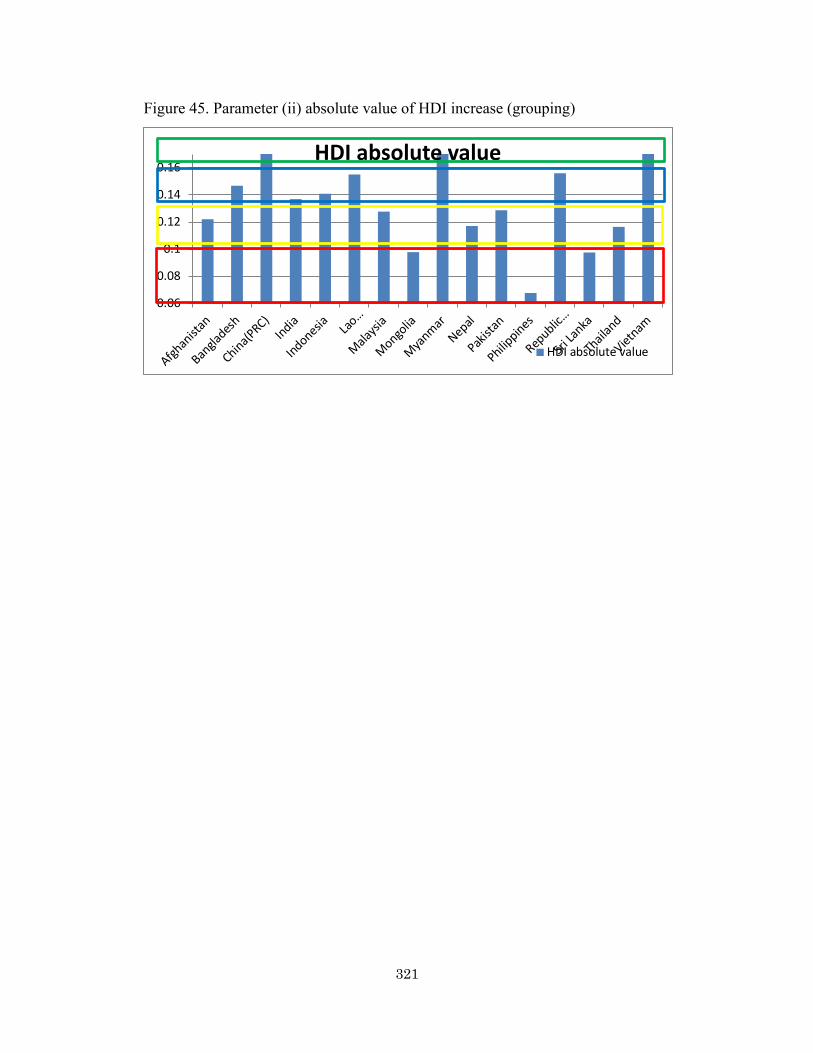
321
Figure 45. Parameter (ii) absolute value of HDI increase (grouping)
0.06
0.08
0.1
0.12
0.14
0.16
Afghan
istan
Bangla
desh
China(PRC)
India
Indonesia Lao…
Malaysi
a
Mongolia
Myanmar
Nepal
Pakist
an
Philippines
Republic…
Sri La
nka
Thail
and
Vietnam
HDI absolute value
HDI absolute value

322
Table 23. Orders of HDI component for each Asian country
Index Value
1990 2000 2005 2010 ASIAN
COUNTRIES
Afghanistan 1 Income Health Health Health
2 Health Income Education Education
3 Education Education Income Income
Bangladesh 1 Health Health Health Health
2 Income Education Education Education
3 Education Income Income Income
China
(PRC) 1 Health Health Health Health
2 Education Income Income Education
3 Income Education Education Income
India 1 Health Health Health Health
2 Income Income Education Education
3 Education Education Income Income
Indonesia 1 Health Health Health Health
2 Education Income Income Education
3 Income Education Education Income
Korea 1 Health Education Education Education
2 Education Health Health Health
3 Income Income Income Income
Kyrgyzstan 1 Health Health Health Health
2 Education Education Education Education
3 Income Income Income Income
Lao 1 Health Health Health Health
2 Income Income Income Income
3 Education Education Education Education
Malaysia 1 Health Health Health Health
2 Income Income Income Income
3 Education Education Education Education

323
Mongolia 1 Health Health Education Education
2 Education Income Health Health
3 Income Education Income Income
Myanmar 1 Health Health Health Health
2 Education Education Income Income
3 Income Income Education Education
Nepal 1 Health Health Health Health
2 Education Education Education Education
3 Income Income Income Income
Pakistan 1 Health Health Health Health
2 Income Income Income Income
3 Education Education Education Education
Philippines 1 Health Health Health Health
2 Education Education Education Education
3 Income Income Income Income
Sri Lanka 1 Health Health Health Health
2 Education Education Education Education
3 Income Income Income Income
Tajikistan 1 Education Health Health Health
2 Health Education Education Education
3 Income Income Income Income
Thailand 1 Health Health Health Health
2 Income Income Income Education
3 Education Education Education Income
Vietnam 1 Health Health Health Health
2 Education Education Education Education
3 Income Income Income Income

324
Appendix 7. Orders of HDI Component Improvement
Table 24. Orders of HDI component improvement for each Asian country Index Value Improvement 1990 2000 2005 2010 1990-2010
ASIAN
COUNTRIES
Afghanistan 1 Income Health Health Health Education
2 Health Income Education Education Health
3 Education Education Income Income Income
Bangladesh 1 Health Health Health Health Education
2 Income Education Education Education Health
3 Education Income Income Income Income
China
(PRC) 1 Health Health Health Health Income
2 Education Income Income Education Education
3 Income Education Education Income Health
India 1 Health Health Health Health Education
2 Income Income Education Education Income
3 Education Education Income Income Health
Indonesia 1 Health Health Health Health Education
2 Education Income Income Education Health
3 Income Education Education Income Income
Korea 1 Health Education Education Education Education
2 Education Health Health Health Health
3 Income Income Income Income Income
Kyrgyzstan 1 Health Health Health Health Education
2 Education Education Education Education Health
3 Income Income Income Income Income
Lao 1 Health Health Health Health Health
2 Income Income Income Income Education
3 Education Education Education Education Income
Malaysia 1 Health Health Health Health Education
2 Income Income Income Income Income
3 Education Education Education Education Health

325
Mongolia 1 Health Health Education Education Education
2 Education Income Health Health Income
3 Income Education Income Income Health
Myanmar 1 Health Health Health Health Income
2 Education Education Income Income Education
3 Income Income Education Education Health
Nepal 1 Health Health Health Health Education
2 Education Education Education Education Health
3 Income Income Income Income Income
Pakistan 1 Health Health Health Health Education
2 Income Income Income Income Health
3 Education Education Education Education Income
Philippines 1 Health Health Health Health Income
2 Education Education Education Education Health
3 Income Income Income Income Education
Sri Lanka 1 Health Health Health Health Education
2 Education Education Education Education Income
3 Income Income Income Income Health
Tajikistan 1 Education Health Health Health Health
2 Health Education Education Education Education
3 Income Income Income Income Income
Thailand 1 Health Health Health Health Education
2 Income Income Income Education Income
3 Education Education Education Income Health
Vietnam 1 Health Health Health Health Education
2 Education Education Education Education Income
3 Income Income Income Income Health
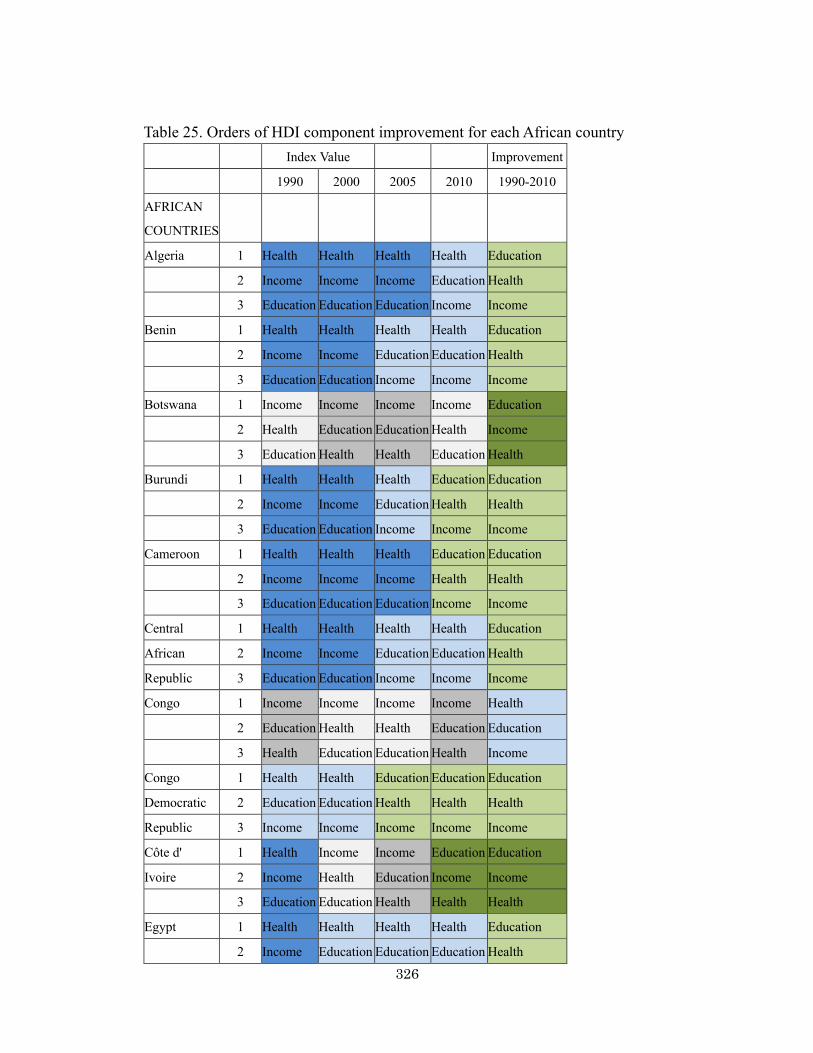
326
Table 25. Orders of HDI component improvement for each African country Index Value Improvement 1990 2000 2005 2010 1990-2010
AFRICAN
COUNTRIES
Algeria 1 Health Health Health Health Education
2 Income Income Income Education Health
3 Education Education Education Income Income
Benin 1 Health Health Health Health Education
2 Income Income Education Education Health
3 Education Education Income Income Income
Botswana 1 Income Income Income Income Education
2 Health Education Education Health Income
3 Education Health Health Education Health
Burundi 1 Health Health Health Education Education
2 Income Income Education Health Health
3 Education Education Income Income Income
Cameroon 1 Health Health Health Education Education
2 Income Income Income Health Health
3 Education Education Education Income Income
Central 1 Health Health Health Health Education
African 2 Income Income Education Education Health
Republic 3 Education Education Income Income Income
Congo 1 Income Income Income Income Health
2 Education Health Health Education Education
3 Health Education Education Health Income
Congo 1 Health Health Education Education Education
Democratic 2 Education Education Health Health Health
Republic 3 Income Income Income Income Income
Côte d' 1 Health Income Income Education Education
Ivoire 2 Income Health Education Income Income
3 Education Education Health Health Health
Egypt 1 Health Health Health Health Education
2 Income Education Education Education Health
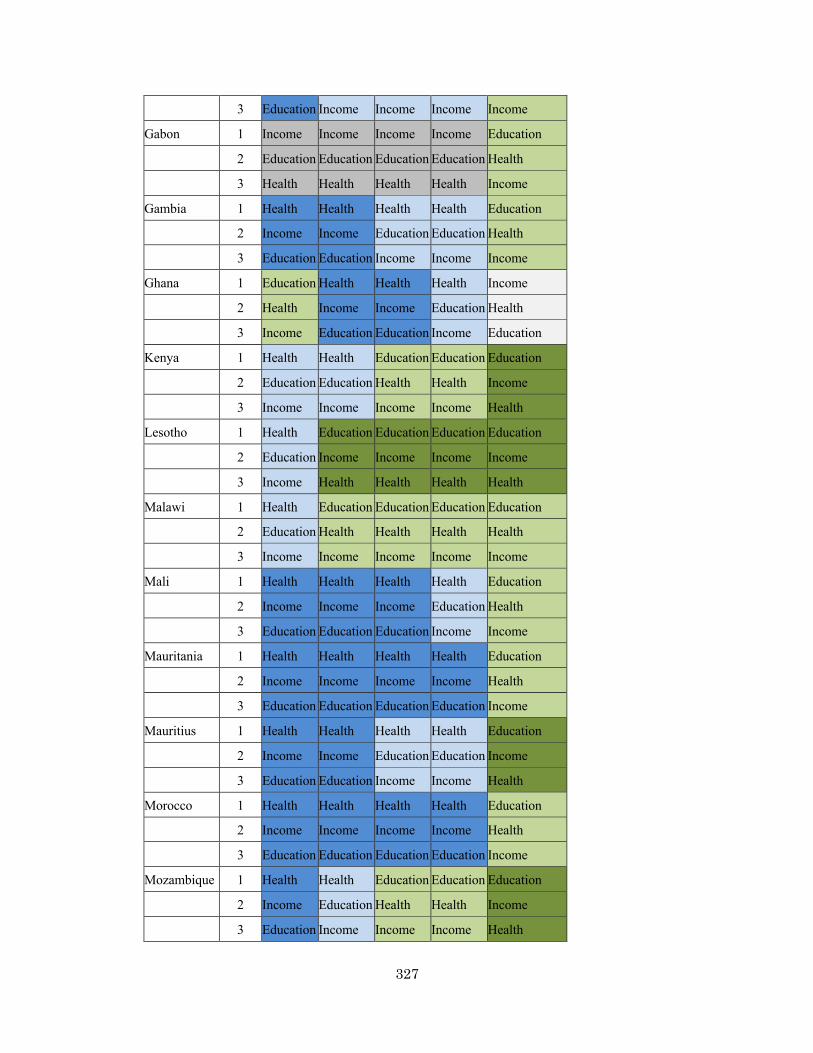
327
3 Education Income Income Income Income
Gabon 1 Income Income Income Income Education
2 Education Education Education Education Health
3 Health Health Health Health Income
Gambia 1 Health Health Health Health Education
2 Income Income Education Education Health
3 Education Education Income Income Income
Ghana 1 Education Health Health Health Income
2 Health Income Income Education Health
3 Income Education Education Income Education
Kenya 1 Health Health Education Education Education
2 Education Education Health Health Income
3 Income Income Income Income Health
Lesotho 1 Health Education Education Education Education
2 Education Income Income Income Income
3 Income Health Health Health Health
Malawi 1 Health Education Education Education Education
2 Education Health Health Health Health
3 Income Income Income Income Income
Mali 1 Health Health Health Health Education
2 Income Income Income Education Health
3 Education Education Education Income Income
Mauritania 1 Health Health Health Health Education
2 Income Income Income Income Health
3 Education Education Education Education Income
Mauritius 1 Health Health Health Health Education
2 Income Income Education Education Income
3 Education Education Income Income Health
Morocco 1 Health Health Health Health Education
2 Income Income Income Income Health
3 Education Education Education Education Income
Mozambique 1 Health Health Education Education Education
2 Income Education Health Health Income
3 Education Income Income Income Health
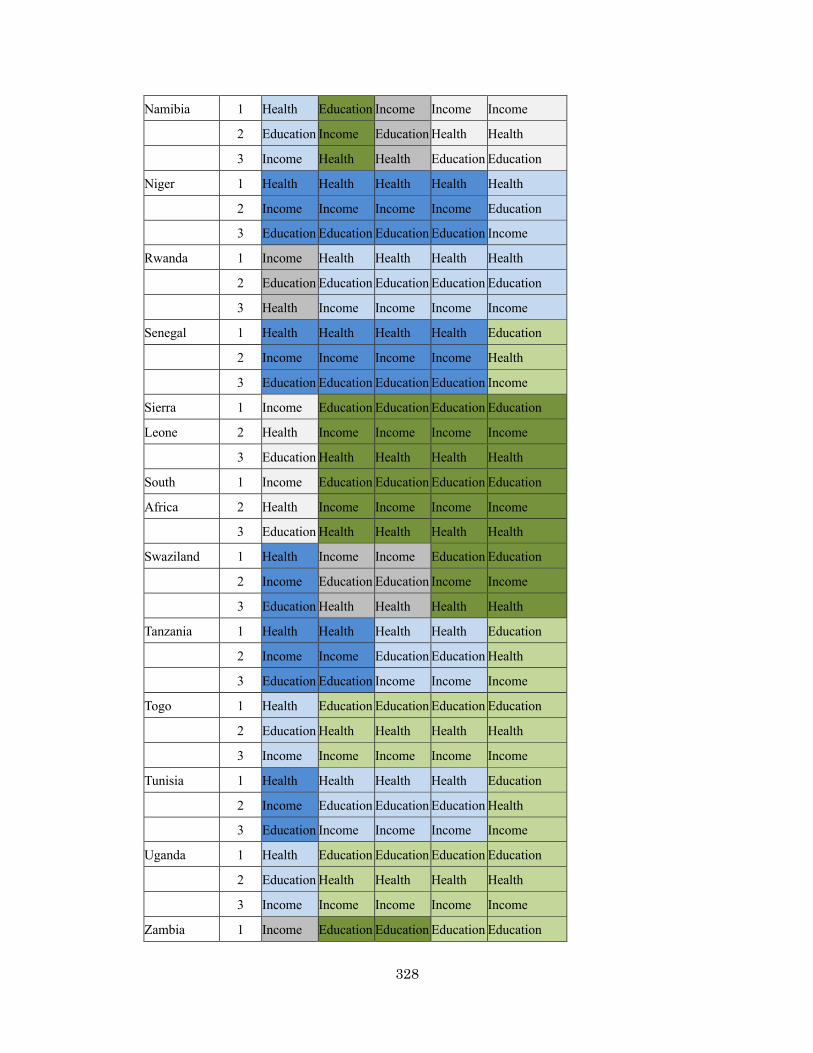
328
Namibia 1 Health Education Income Income Income
2 Education Income Education Health Health
3 Income Health Health Education Education
Niger 1 Health Health Health Health Health
2 Income Income Income Income Education
3 Education Education Education Education Income
Rwanda 1 Income Health Health Health Health
2 Education Education Education Education Education
3 Health Income Income Income Income
Senegal 1 Health Health Health Health Education
2 Income Income Income Income Health
3 Education Education Education Education Income
Sierra 1 Income Education Education Education Education
Leone 2 Health Income Income Income Income
3 Education Health Health Health Health
South 1 Income Education Education Education Education
Africa 2 Health Income Income Income Income
3 Education Health Health Health Health
Swaziland 1 Health Income Income Education Education
2 Income Education Education Income Income
3 Education Health Health Health Health
Tanzania 1 Health Health Health Health Education
2 Income Income Education Education Health
3 Education Education Income Income Income
Togo 1 Health Education Education Education Education
2 Education Health Health Health Health
3 Income Income Income Income Income
Tunisia 1 Health Health Health Health Education
2 Income Education Education Education Health
3 Education Income Income Income Income
Uganda 1 Health Education Education Education Education
2 Education Health Health Health Health
3 Income Income Income Income Income
Zambia 1 Income Education Education Education Education

329
2 Education Income Income Health Health
3 Health Health Health Income Income
Zimbabwe 1 Health Education Education Health Education
2 Education Income Income Education Income
3 Income Health Health Income Health

330
Table 26. Orders of HDI component improvement for each OECD country Index Value Improvement
1990 2000 2005 2010 1990-2010
OECD
COUNTRIES
Australia 1 Education Education Education Education Health
2 Health Health Health Health Income
3 Income Income Income Income Education
Austria 1 Income Health Health Health Education
2 Health Income Income Income Health
3 Education Education Education Education Income
Belgium 1 Income Income Health Health Education
2 Health Health Income Income Health
3 Education Education Education Education Income
Canada 1 Education Health Health Health Health
2 Health Income Income Income Income
3 Income Education Education Education Education
Denmark 1 Income Education Education Education Education
2 Health Income Income Income Health
3 Education Health Health Health Income
Finland 1 Health Education Education Education Education
2 Income Health Health Health Health
3 Education Income Income Income Income
France 1 Health Health Health Health Education
2 Income Income Income Income Health
3 Education Education Education Education Income
Germany 1 Income Health Health Health Education
2 Health Income Income Income Health
3 Education Education Education Education Income
Greece 1 Health Health Education Health Education
2 Income Income Health Education Health
3 Education Education Income Income Income
Hungary 1 Income Health Education Education Education
2 Health Education Health Health Health
3 Education Income Income Income Income

331
Iceland 1 Health Education Education Education Education
2 Income Health Health Health Health
3 Education Income Income Income Income
Ireland 1 Health Education Education Education Education
2 Income Income Income Health Income
3 Education Health Health Income Health
Israel 1 Health Health Health Health Education
2 Income Education Education Education Health
3 Education Income Income Income Income
Italy 1 Health Health Health Health Education
2 Income Income Education Education Health
3 Education Education Income Income Income
Japan 1 Health Health Health Health Education
2 Income Income Income Income Health
3 Education Education Education Education Income
Luxembourg 1 Income Income Income Income Education
2 Health Health Health Health Health
3 Education Education Education Education Income
Netherlands 1 Health Education Health Education Education
2 Income Income Education Health Health
3 Education Health Income Income Income
New 1 Health Education Education Education Education
Zealand 2 Income Health Health Health Health
3 Education Income Income Income Income
Norway 1 Income Education Income Income Education
2 Health Income Education Education Health
3 Education Health Health Health Income
Portugal 1 Health Education Health Health Education
2 Income Health Education Education Health
3 Education Income Income Income Income
Russia 1 Income Income Income Income Education
2 Health Health Education Education Income
3 Education Education Health Health Health
Slovakia 1 Health Health Health Health Education
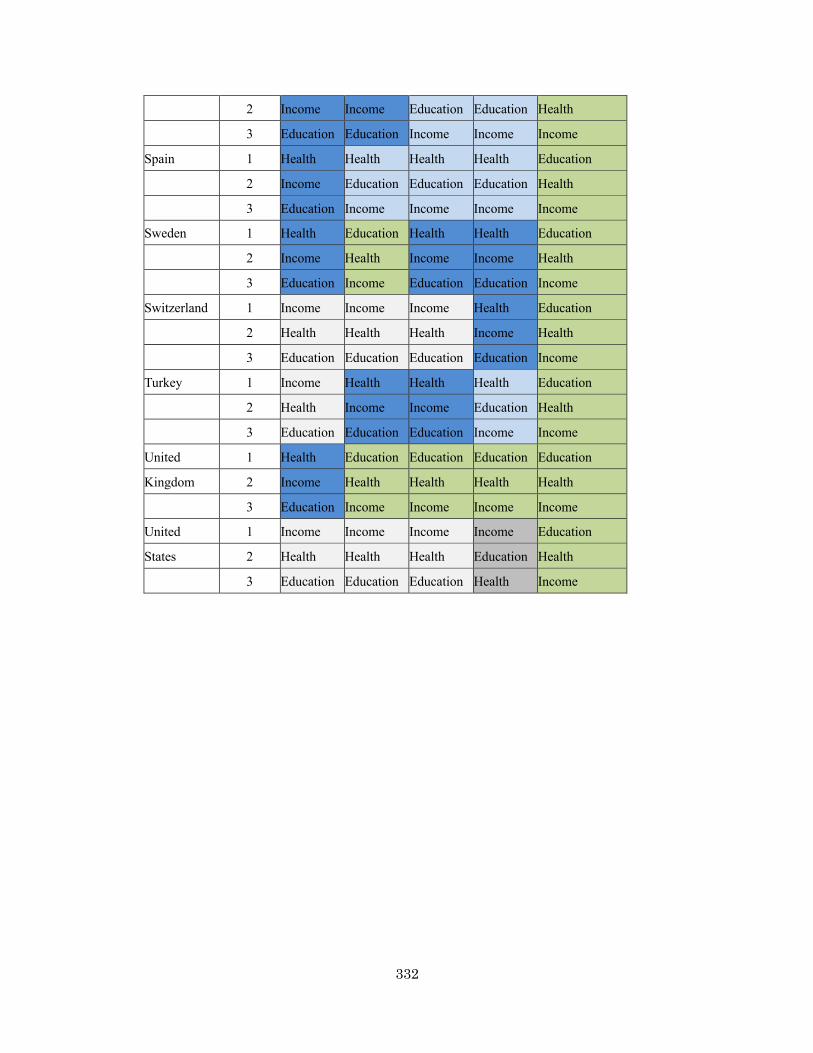
332
2 Income Income Education Education Health
3 Education Education Income Income Income
Spain 1 Health Health Health Health Education
2 Income Education Education Education Health
3 Education Income Income Income Income
Sweden 1 Health Education Health Health Education
2 Income Health Income Income Health
3 Education Income Education Education Income
Switzerland 1 Income Income Income Health Education
2 Health Health Health Income Health
3 Education Education Education Education Income
Turkey 1 Income Health Health Health Education
2 Health Income Income Education Health
3 Education Education Education Income Income
United 1 Health Education Education Education Education
Kingdom 2 Income Health Health Health Health
3 Education Income Income Income Income
United 1 Income Income Income Income Education
States 2 Health Health Health Education Health
3 Education Education Education Health Income

333
Table 27. Orders of HDI component improvement for each Latin American country Index Value Improvement
1990 2000 2005 2010 1990-2010
Argentina 1 Health Health Education Education Education
2 Education Education Health Health Income
3 Income Income Income Income Health
Barbados 1 Health Health Health Education Education
2 Education Education Education Health Health
3 Income Income Income Income Income
Belize 1 Health Health Health Health Education
2 Education Income Education Education Income
3 Income Education Income Income Health
Bolivia 1 Education Education Education Education Health
2 Health Health Health Health Education
3 Income Income Income Income Income
Brazil 1 Health Education Health Education Education
2 Income Health Education Health Health
3 Education Income Income Income Income
Chile 1 Health Health Health Health Education
2 Education Income Education Education Income
3 Income Education Income Income Health
Colombia 1 Health Health Health Health Education
2 Income Income Education Education Health
3 Education Education Income Income Income
Costa Rica 1 Health Health Health Health Education
2 Income Income Income Education Income
3 Education Education Education Income Health
Cuba 1 Health Health Health Health Education
2 Income Income Education Education Health
3 Education Education Income Income Income
Dominican 1 Health Health Health Health Income
Republic 2 Education Education Education Education Health
3 Income Income Income Income Education
Ecuador 1 Health Health Health Health Health

334
2 Education Income Education Education Income
3 Income Education Income Income Education
El
Salvador 1 Health Health Health Health Education
2 Income Income Education Education Health
3 Education Education Income Income Income
Guatemala 1 Health Health Health Health Education
2 Income Income Income Income Health
3 Education Education Education Education Income
Guyana 1 Health Health Health Health Income
2 Education Education Education Income Health
3 Income Income Income Education Education
Haiti 1 Health Health Health Health Health
2 Income Income Income Education Education
3 Education Education Education Income Income
Honduras 1 Health Health Health Health Education
2 Income Education Education Education Health
3 Education Income Income Income Income
Jamaica 1 Health Health Health Health Education
2 Income Income Education Education Health
3 Education Education Income Income Income
Mexico 1 Health Health Health Health Education
2 Income Income Income Income Health
3 Education Education Education Education Income
Nicaragua 1 Health Health Health Health Education
2 Income Education Education Education Health
3 Education Income Income Income Income
Panama 1 Health Health Health Health Income
2 Income Education Education Income Education
3 Education Income Income Education Health
Paraguay 1 Health Health Health Health Education
2 Income Education Education Education Health
3 Education Income Income Income Income
Peru 1 Health Health Health Health Health

335
2 Education Education Education Education Income
3 Income Income Income Income Education
Trinidad 1 Health Health Income Income Income
& Tobago 2 Income Income Health Health Education
3 Education Education Education Education Health
Uruguay 1 Health Health Health Health Education
2 Education Education Education Education Income
3 Income Income Income Income Health
Venezuela 1 Health Health Health Health Education
2 Income Income Income Education Health
3 Education Education Education Income Income

336
Table 28. Orders of HDI component improvement for other countries Index Value Improvement
1990 2000 2005 2010 1990-2010
FORMER USSR
Armenia 1 Health Health Health Health Health
2 Education Education Education Education Income
3 Income Income Income Income Education
Estonia 1 Health Education Education Education Education
2 Income Health Health Health Health
3 Education Income Income Income Income
Latvia 1 Income Education Education Education Education
2 Health Health Health Income Health
3 Education Income Income Health Income
Lithuania 1 Health Education Education Education Education
2 Income Health Health Income Income
3 Education Income Income Health Health
Moldova 1 Health Health Health Health Health
2 Education Education Education Education Education
3 Income Income Income Income Income
Ukraine 1 Health Health Education Education Education
2 Income Education Health Health Health
3 Education Income Income Income Income
OTHER EUROPE (NON-OECD)
Albania 1 Health Health Health Health Income
2 Education Income Income Income Health
3 Income Education Education Education Education
Bulgaria 1 Health Health Health Health Education
2 Income Education Education Education Income
3 Education Income Income Income Health
Croatia 1 Income Health Health Health Education
2 Health Income Income Education Health
3 Education Education Education Income Income
Cyprus 1 Health Health Health Health Education
2 Income Income Income Income Income

337
3 Education Education Education Education Health
Malta 1 Health Health Health Health Education
2 Income Income Income Income Health
3 Education Education Education Education Income
Romania 1 Health Health Health Health Education
2 Income Income Education Education Health
3 Education Education Income Income Income
ARAB STATES
Bahrain 1 Income Income Income Income Health
2 Health Health Health Health Education
3 Education Education Education Education Income
Iran 1 Health Health Health Health Education
2 Income Income Income Income Health
3 Education Education Education Education Income
Jordan 1 Health Health Health Health Education
2 Education Education Education Education Income
3 Income Income Income Income Health
Kuwait 1 Income Income Income Income Education
2 Health Education Health Health Health
3 Education Health Education Education Income
Qatar 1 Income Income Income Income Education
2 Health Health Health Health Health
3 Education Education Education Education Income
Saudi Arabia 1 Income Income Income Income Education
2 Health Health Health Health Health
3 Education Education Education Education Income
Syria 1 Health Health Health Health Education
2 Education Income Education Education Health
3 Income Education Income Income Income
Yemen 1 Health Health Health Health Health
2 Income Income Income Income Education
3 Education Education Education Education Income
PACIFIC
Fiji 1 Health Health Education Education Education
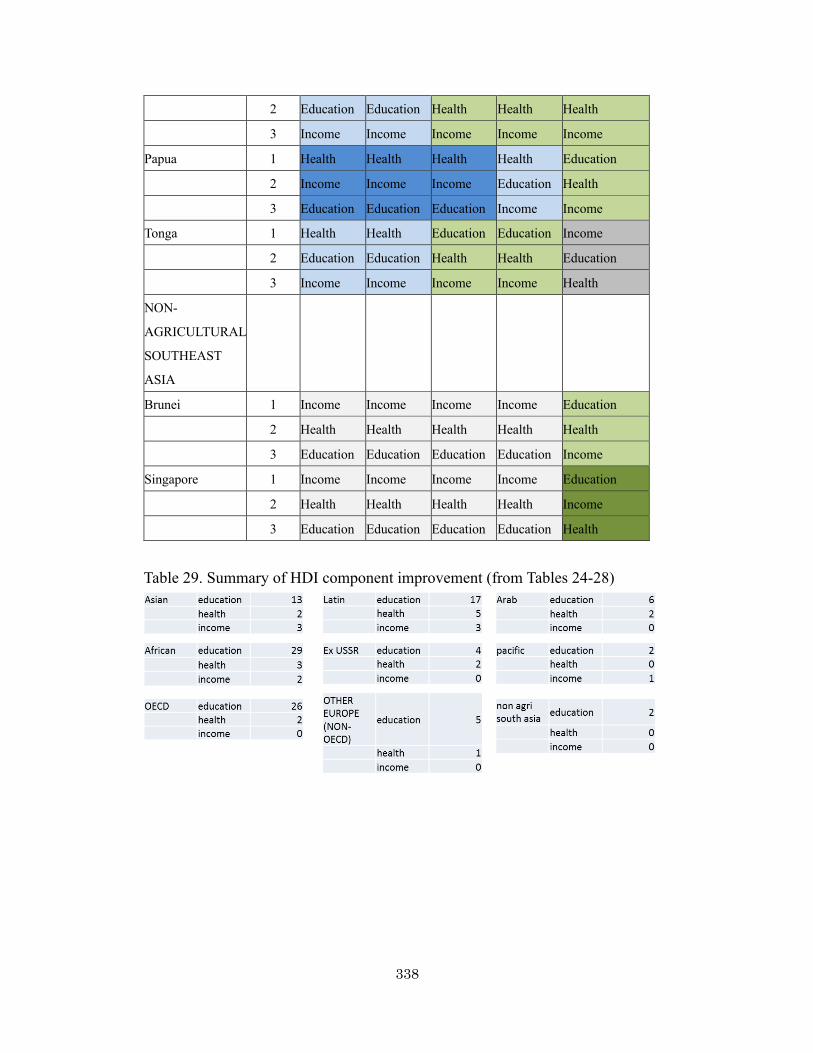
338
2 Education Education Health Health Health
3 Income Income Income Income Income
Papua 1 Health Health Health Health Education
2 Income Income Income Education Health
3 Education Education Education Income Income
Tonga 1 Health Health Education Education Income
2 Education Education Health Health Education
3 Income Income Income Income Health
NON-
AGRICULTURAL
SOUTHEAST
ASIA
Brunei 1 Income Income Income Income Education
2 Health Health Health Health Health
3 Education Education Education Education Income
Singapore 1 Income Income Income Income Education
2 Health Health Health Health Income
3 Education Education Education Education Health
Table 29. Summary of HDI component improvement (from Tables 24-28)
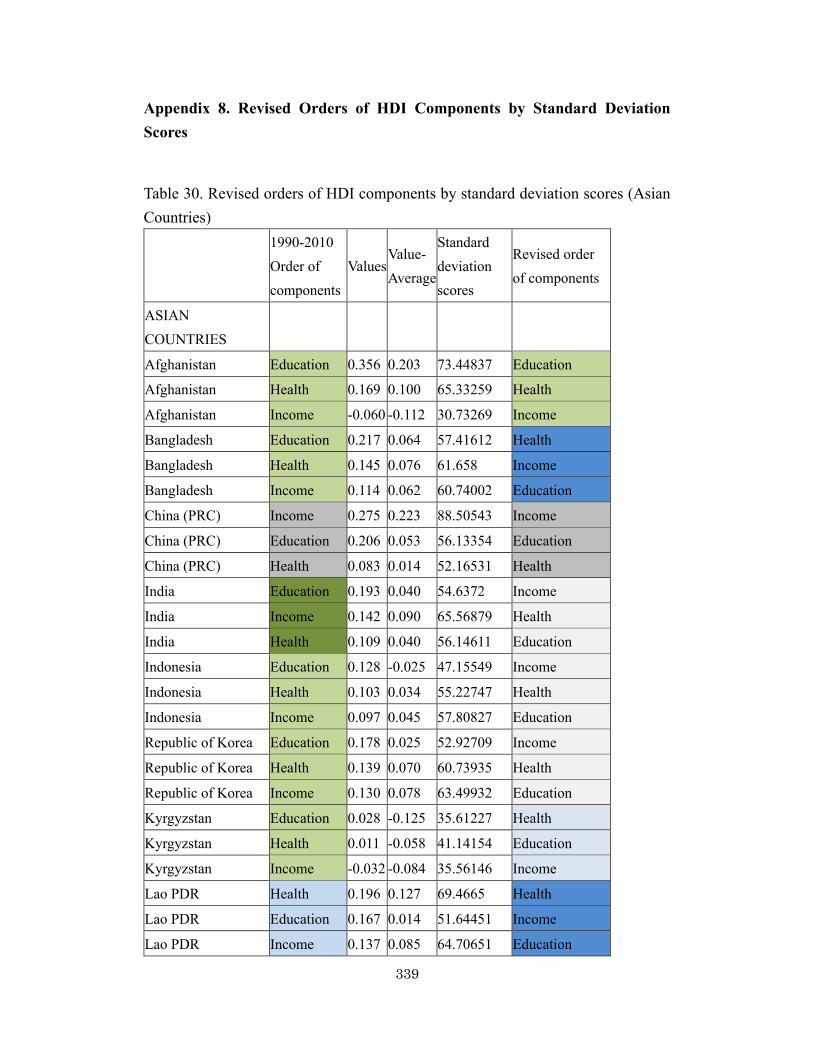
339
Appendix 8. Revised Orders of HDI Components by Standard Deviation Scores
Table 30. Revised orders of HDI components by standard deviation scores (Asian Countries)
1990-2010 Order of components
Values Value-Average
Standard deviation scores
Revised order of components
ASIAN COUNTRIES
Afghanistan Education 0.356 0.203 73.44837 Education
Afghanistan Health 0.169 0.100 65.33259 Health
Afghanistan Income -0.060 -0.112 30.73269 Income
Bangladesh Education 0.217 0.064 57.41612 Health
Bangladesh Health 0.145 0.076 61.658 Income
Bangladesh Income 0.114 0.062 60.74002 Education
China (PRC) Income 0.275 0.223 88.50543 Income
China (PRC) Education 0.206 0.053 56.13354 Education
China (PRC) Health 0.083 0.014 52.16531 Health
India Education 0.193 0.040 54.6372 Income
India Income 0.142 0.090 65.56879 Health
India Health 0.109 0.040 56.14611 Education
Indonesia Education 0.128 -0.025 47.15549 Income
Indonesia Health 0.103 0.034 55.22747 Health
Indonesia Income 0.097 0.045 57.80827 Education
Republic of Korea Education 0.178 0.025 52.92709 Income
Republic of Korea Health 0.139 0.070 60.73935 Health
Republic of Korea Income 0.130 0.078 63.49932 Education
Kyrgyzstan Education 0.028 -0.125 35.61227 Health
Kyrgyzstan Health 0.011 -0.058 41.14154 Education
Kyrgyzstan Income -0.032 -0.084 35.56146 Income
Lao PDR Health 0.196 0.127 69.4665 Health
Lao PDR Education 0.167 0.014 51.64451 Income
Lao PDR Income 0.137 0.085 64.70651 Education

340
Malaysia Education 0.167 0.014 51.64451 Income
Malaysia Income 0.106 0.054 59.36038 Education
Malaysia Health 0.057 -0.012 48.1845 Health
Mongolia Education 0.244 0.092 60.62257 Education
Mongolia Income 0.109 0.057 59.87774 Income
Mongolia Health 0.100 0.031 54.76814 Health
Myanmar Income 0.245 0.193 83.33175 Income
Myanmar Education 0.150 -0.002 49.72064 Health
Myanmar Health 0.091 0.022 53.39017 Education
Nepal Education 0.239 0.086 59.98128 Health
Nepal Health 0.186 0.117 67.93542 Education
Nepal Income 0.072 0.020 53.49688 Income
Pakistan Education 0.167 0.014 51.64451 edu
Pakistan Health 0.076 0.007 51.09355 Health
Pakistan Income 0.053 0.001 50.22021 Income
Philippines Income 0.054 0.002 50.39267 Income
Philippines Health 0.046 -0.023 46.50032 Health
Philippines Education 0.028 -0.125 35.61227 Education
Sri Lanka Education 0.128 -0.025 47.15549 Income
Sri Lanka Income 0.123 0.071 62.29213 Health
Sri Lanka Health 0.066 -0.003 49.56247 Education
Tajikistan Health 0.060 -0.009 48.64383 Health
Tajikistan Education -0.044 -0.197 27.2755 Education
Tajikistan Income -0.084 -0.136 26.59375 Income
Thailand Education 0.261 0.109 62.54644 edu
Thailand Income 0.102 0.050 58.67055 Income
Thailand Health 0.052 -0.017 47.41896 Health
Vietnam Education 0.220 0.068 57.8009 Income
Vietnam Income 0.169 0.117 70.2251 Education
Vietnam Health 0.075 0.006 50.94044 Health

341
Table 31. Revised orders of HDI components by standard deviation scores (African Countries)
AFRICAN COUNTRIES
1990-2010 Order of components
Values Value-Average
Standard deviation scores
Revised order of components
Algeria Education 0.228 0.075 58.6987 Education Algeria Health 0.059 -0.010 48.49072 Health Algeria Income 0.029 -0.023 46.08127 Income Benin Education 0.297 0.144 66.66138 Education Benin Health 0.081 0.012 51.85909 Health Benin Income 0.036 -0.016 47.28846 Income Botswana Education 0.096 -0.057 43.46807 Income Botswana Income 0.073 0.021 53.66933 Education Botswana Health 0.011 -0.058 41.14154 Health Burundi Education 0.317 0.164 68.95934 Education Burundi Health 0.081 0.012 51.85909 Health Burundi Income -0.046 -0.098 33.14708 Income Cameroon Education 0.122 -0.030 46.5142 Education Cameroon Health 0.002 -0.067 39.76357 Income Cameroon Income -0.007 -0.059 39.87286 Health Central African Republic
Education 0.097 -0.055 43.62839 Health
Central African Republic
Health 0.032 -0.037 44.3568 Education
Central African Republic
Income -0.018 -0.070 37.97584 Income
Congo Health 0.031 -0.038 44.2037 Health Congo Education -0.030 -0.183 28.91435 Income Congo Income -0.051 -0.103 32.2848 Education Congo Democratic
Education 0.131 -0.021 47.52194 Education
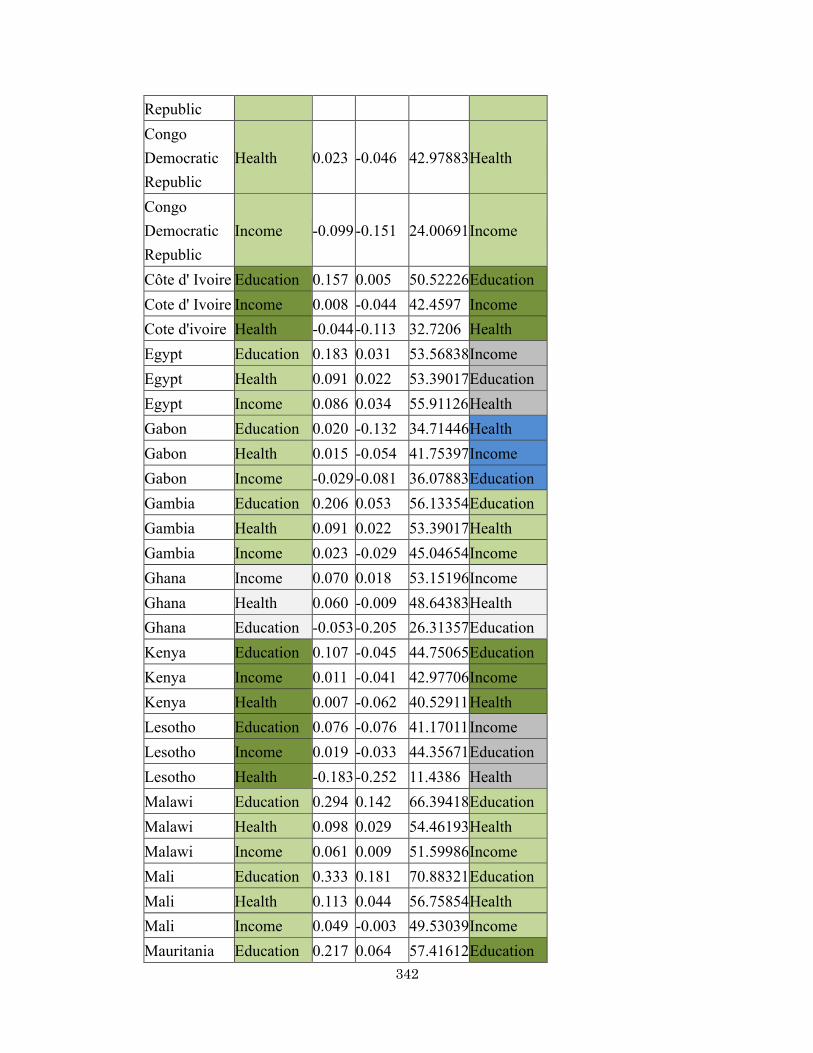
342
Republic Congo Democratic Republic
Health 0.023 -0.046 42.97883 Health
Congo Democratic Republic
Income -0.099 -0.151 24.00691 Income
Côte d' Ivoire Education 0.157 0.005 50.52226 Education Cote d' Ivoire Income 0.008 -0.044 42.4597 Income Cote d'ivoire Health -0.044 -0.113 32.7206 Health Egypt Education 0.183 0.031 53.56838 Income Egypt Health 0.091 0.022 53.39017 Education Egypt Income 0.086 0.034 55.91126 Health Gabon Education 0.020 -0.132 34.71446 Health Gabon Health 0.015 -0.054 41.75397 Income Gabon Income -0.029 -0.081 36.07883 Education Gambia Education 0.206 0.053 56.13354 Education Gambia Health 0.091 0.022 53.39017 Health Gambia Income 0.023 -0.029 45.04654 Income Ghana Income 0.070 0.018 53.15196 Income Ghana Health 0.060 -0.009 48.64383 Health Ghana Education -0.053 -0.205 26.31357 Education Kenya Education 0.107 -0.045 44.75065 Education Kenya Income 0.011 -0.041 42.97706 Income Kenya Health 0.007 -0.062 40.52911 Health Lesotho Education 0.076 -0.076 41.17011 Income Lesotho Income 0.019 -0.033 44.35671 Education Lesotho Health -0.183 -0.252 11.4386 Health Malawi Education 0.294 0.142 66.39418 Education Malawi Health 0.098 0.029 54.46193 Health Malawi Income 0.061 0.009 51.59986 Income Mali Education 0.333 0.181 70.88321 Education Mali Health 0.113 0.044 56.75854 Health Mali Income 0.049 -0.003 49.53039 Income Mauritania Education 0.217 0.064 57.41612 Education
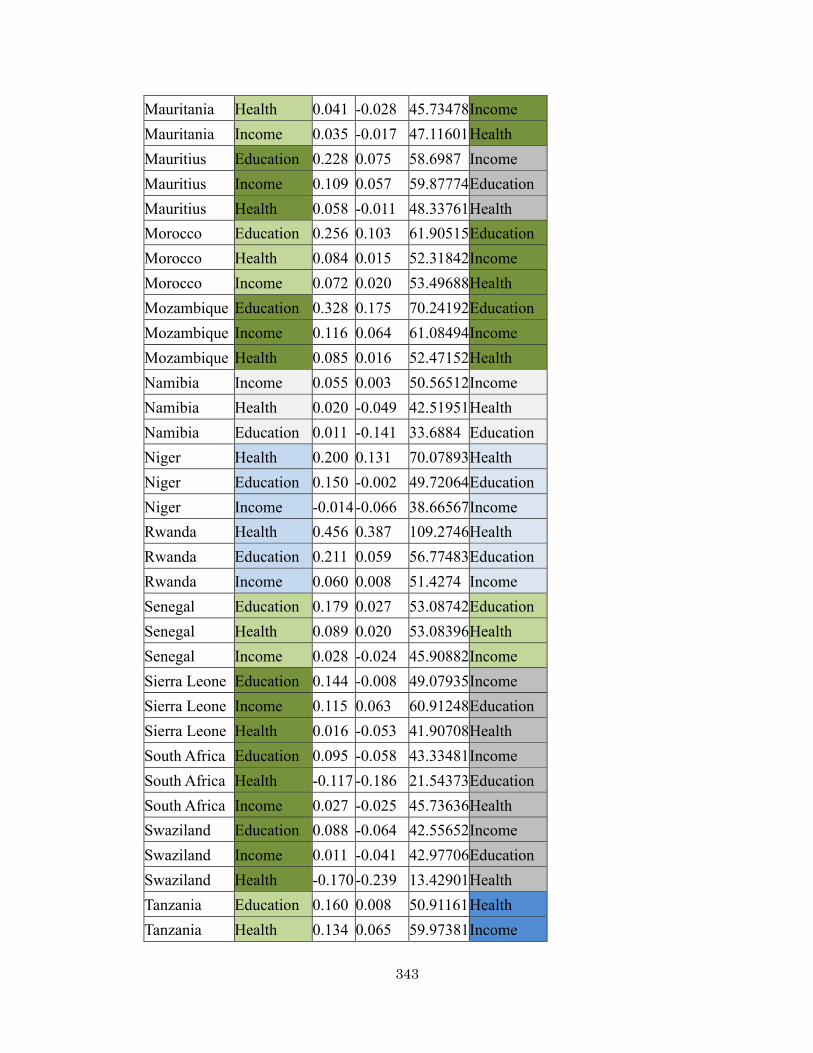
343
Mauritania Health 0.041 -0.028 45.73478 Income Mauritania Income 0.035 -0.017 47.11601 Health Mauritius Education 0.228 0.075 58.6987 Income Mauritius Income 0.109 0.057 59.87774 Education Mauritius Health 0.058 -0.011 48.33761 Health Morocco Education 0.256 0.103 61.90515 Education Morocco Health 0.084 0.015 52.31842 Income Morocco Income 0.072 0.020 53.49688 Health Mozambique Education 0.328 0.175 70.24192 Education Mozambique Income 0.116 0.064 61.08494 Income Mozambique Health 0.085 0.016 52.47152 Health Namibia Income 0.055 0.003 50.56512 Income Namibia Health 0.020 -0.049 42.51951 Health Namibia Education 0.011 -0.141 33.6884 Education Niger Health 0.200 0.131 70.07893 Health Niger Education 0.150 -0.002 49.72064 Education Niger Income -0.014 -0.066 38.66567 Income Rwanda Health 0.456 0.387 109.2746 Health Rwanda Education 0.211 0.059 56.77483 Education Rwanda Income 0.060 0.008 51.4274 Income Senegal Education 0.179 0.027 53.08742 Education Senegal Health 0.089 0.020 53.08396 Health Senegal Income 0.028 -0.024 45.90882 Income Sierra Leone Education 0.144 -0.008 49.07935 Income Sierra Leone Income 0.115 0.063 60.91248 Education Sierra Leone Health 0.016 -0.053 41.90708 Health South Africa Education 0.095 -0.058 43.33481 Income South Africa Health -0.117 -0.186 21.54373 Education South Africa Income 0.027 -0.025 45.73636 Health Swaziland Education 0.088 -0.064 42.55652 Income Swaziland Income 0.011 -0.041 42.97706 Education Swaziland Health -0.170 -0.239 13.42901 Health Tanzania Education 0.160 0.008 50.91161 Health Tanzania Health 0.134 0.065 59.97381 Income

344
Tanzania Income 0.066 0.014 52.46214 Education Togo Education 0.228 0.075 58.6987 Education Togo Health -0.006 -0.075 38.5387 Income Togo Income -0.026 -0.078 36.5962 Health Tunisia Education 0.228 0.075 58.6987 Education Tunisia Health 0.098 0.029 54.46193 Income Tunisia Income 0.094 0.042 57.29091 Health Uganda Education 0.283 0.131 65.1116 Education Uganda Health 0.151 0.082 62.57665 Health Uganda Income 0.104 0.052 59.01546 Income Zambia Education 0.283 0.130 65.05324 Education Zambia Health 0.165 0.096 64.72016 Health Zambia Income -0.004 -0.056 40.39023 Income Zimbabwe Education -0.028 -0.180 29.19937 Education Zimbabwe Income -0.083 -0.135 26.76621 Income Zimbabwe Health -0.084 -0.153 26.59629 Health Table 32. Revised orders of HDI components by standard deviation scores (OECD Countries)
OECD COUNTRIES
1990-2010 Order of components
Values Value-Average
Standard deviation scores
Revised order of components
Australia Health 0.081 0.012 51.85909 Health Australia Income 0.056 0.004 50.73758 Income Australia Education 0.033 -0.119 36.25356 Education Austria Education 0.094 -0.058 43.30775 Health Austria Health 0.079 0.010 51.55288 Income Austria Income 0.051 -0.001 49.8753 Education Belgium Education 0.106 -0.047 44.59033 Health Belgium Health 0.065 -0.004 49.40937 Income Belgium Income 0.044 -0.008 48.6681 Education Canada Health 0.057 -0.012 48.1845 Income Canada Income 0.043 -0.009 48.49565 Health Canada Education -0.044 -0.197 27.2755 Education

345
Denmark Education 0.156 0.003 50.36193 Education Denmark Health 0.062 -0.007 48.95004 Health Denmark Income 0.043 -0.009 48.49565 Income Finland Education 0.106 -0.047 44.59033 Health Finland Health 0.075 0.006 50.94044 Income Finland Income 0.053 0.001 50.22021 Education France Education 0.094 -0.058 43.30775 Health France Health 0.073 0.004 50.63423 Income France Income 0.033 -0.019 46.77109 Education Germany Education 0.142 -0.011 48.75871 Health Germany Health 0.074 0.005 50.78734 Education Germany Income 0.040 -0.012 47.97829 Income Greece Education 0.250 0.098 61.26386 Education Greece Health 0.056 -0.013 48.03139 Income Greece Income 0.042 -0.010 48.3232 Health Hungary Education 0.244 0.092 60.62257 Education Hungary Health 0.075 0.006 50.94044 Health Hungary Income 0.048 -0.004 49.35793 Income Iceland Education 0.211 0.059 56.77483 Education Iceland Health 0.056 -0.013 48.03139 Health Iceland Income 0.013 -0.039 43.32198 Income Ireland Education 0.300 0.148 67.03547 Education Ireland Income 0.093 0.041 57.11845 Income Ireland Health 0.083 0.014 52.16531 Health Israel Education 0.167 0.014 51.64451 Income Israel Health 0.075 0.006 50.94044 Education Israel Income 0.073 0.021 53.66933 Health Italy Education 0.189 0.036 54.20967 Education Italy Health 0.078 0.009 51.39977 Health Italy Income 0.022 -0.030 44.87408 Income Japan Education 0.100 -0.052 43.94904 Health Japan Health 0.063 -0.006 49.10315 Income Japan Income 0.027 -0.025 45.73636 Education Luxembourg Education 0.161 0.009 51.00322 Education

346
Luxembourg Health 0.074 0.005 50.78734 Health Luxembourg Income 0.015 -0.037 43.66689 Income Netherlands Education 0.133 -0.019 47.79678 Income Netherlands Health 0.056 -0.013 48.03139 Health Netherlands Income 0.050 -0.002 49.70285 Education New Zealand Education 0.194 0.042 54.85096 Education New Zealand Health 0.083 0.014 52.16531 Health New Zealand Income 0.039 -0.013 47.80583 Income Norway Education 0.194 0.042 54.85096 Education Norway Health 0.071 0.002 50.32801 Income Norway Income 0.062 0.010 51.77232 Health Portugal Education 0.250 0.098 61.26386 Education Portugal Health 0.077 0.008 51.24666 Health Portugal Income 0.041 -0.011 48.15074 Income Russia Education 0.072 -0.080 40.74259 Income Russia Income 0.012 -0.040 43.14952 Education Russia Health -0.006 -0.075 38.5387 Health Slovakia Education 0.183 0.031 53.56838 Education Slovakia Health 0.058 -0.011 48.33761 Income Slovakia Income 0.049 -0.003 49.53039 Health Spain Education 0.144 -0.008 49.07935 Health Spain Health 0.072 0.003 50.48112 Education Spain Income 0.045 -0.007 48.84057 Income Sweden Education 0.167 0.014 51.64451 Education Sweden Health 0.060 -0.009 48.64383 Income Sweden Income 0.056 0.004 50.73758 Health Switzerland Education 0.122 -0.030 46.5142 Health Switzerland Health 0.071 0.002 50.32801 Education Switzerland Income 0.025 -0.027 45.39145 Income Turkey Education 0.278 0.125 64.47031 Education Turkey Health 0.154 0.085 63.03597 Health Turkey Income 0.068 0.016 52.80705 Income United Kingdom
Education 0.178 0.025 52.92709 Education
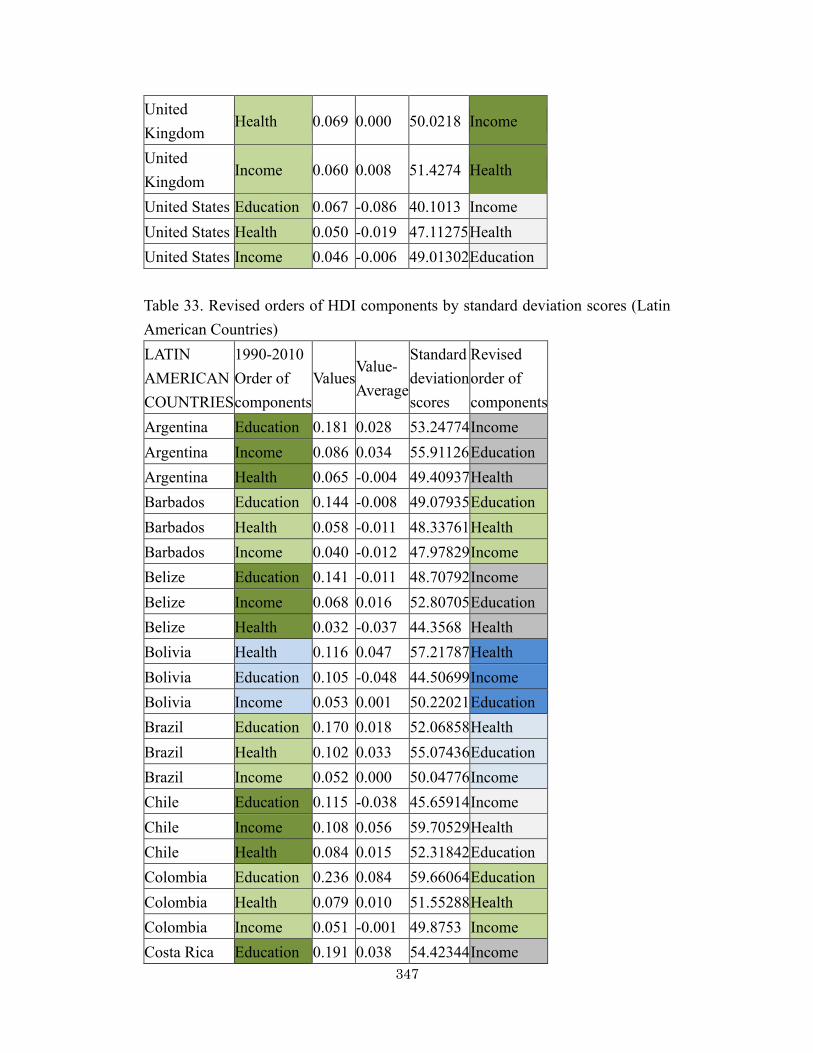
347
United Kingdom
Health 0.069 0.000 50.0218 Income
United Kingdom
Income 0.060 0.008 51.4274 Health
United States Education 0.067 -0.086 40.1013 Income United States Health 0.050 -0.019 47.11275 Health United States Income 0.046 -0.006 49.01302 Education Table 33. Revised orders of HDI components by standard deviation scores (Latin American Countries) LATIN AMERICAN COUNTRIES
1990-2010 Order of components
Values Value-Average
Standard deviation scores
Revised order of components
Argentina Education 0.181 0.028 53.24774 Income Argentina Income 0.086 0.034 55.91126 Education Argentina Health 0.065 -0.004 49.40937 Health Barbados Education 0.144 -0.008 49.07935 Education Barbados Health 0.058 -0.011 48.33761 Health Barbados Income 0.040 -0.012 47.97829 Income Belize Education 0.141 -0.011 48.70792 Income Belize Income 0.068 0.016 52.80705 Education Belize Health 0.032 -0.037 44.3568 Health Bolivia Health 0.116 0.047 57.21787 Health Bolivia Education 0.105 -0.048 44.50699 Income Bolivia Income 0.053 0.001 50.22021 Education Brazil Education 0.170 0.018 52.06858 Health Brazil Health 0.102 0.033 55.07436 Education Brazil Income 0.052 0.000 50.04776 Income Chile Education 0.115 -0.038 45.65914 Income Chile Income 0.108 0.056 59.70529 Health Chile Health 0.084 0.015 52.31842 Education Colombia Education 0.236 0.084 59.66064 Education Colombia Health 0.079 0.010 51.55288 Health Colombia Income 0.051 -0.001 49.8753 Income Costa Rica Education 0.191 0.038 54.42344 Income
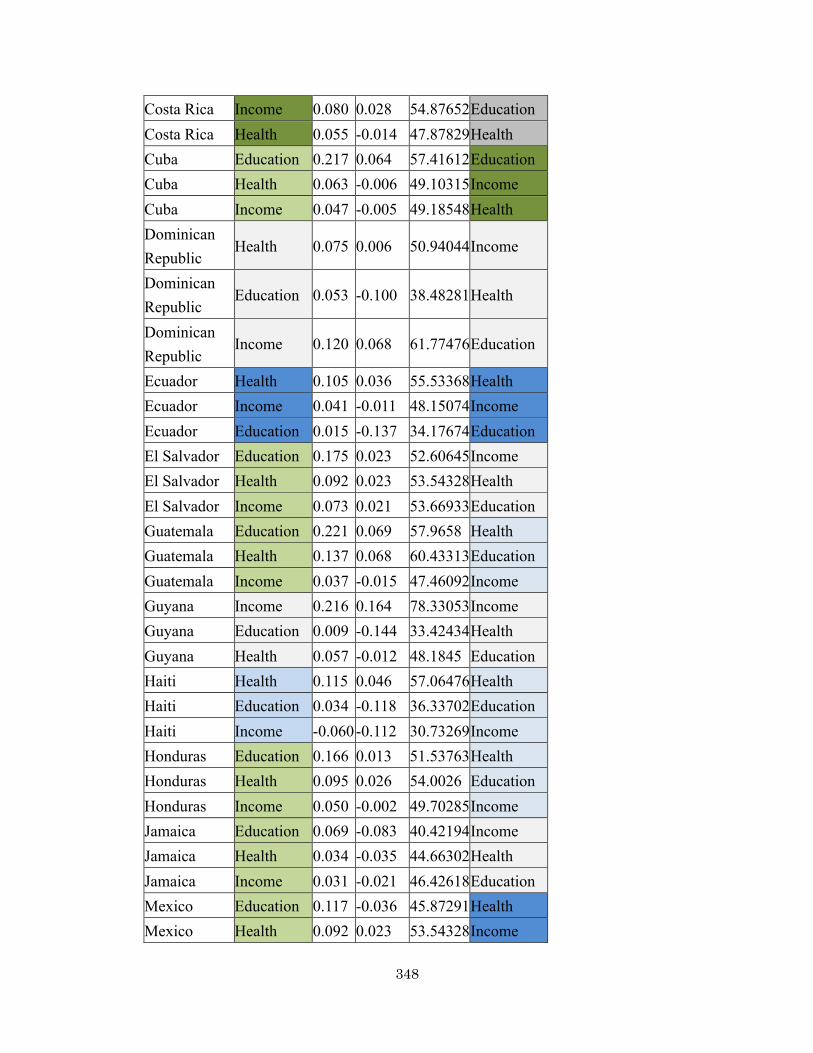
348
Costa Rica Income 0.080 0.028 54.87652 Education Costa Rica Health 0.055 -0.014 47.87829 Health Cuba Education 0.217 0.064 57.41612 Education Cuba Health 0.063 -0.006 49.10315 Income Cuba Income 0.047 -0.005 49.18548 Health Dominican Republic
Health 0.075 0.006 50.94044 Income
Dominican Republic
Education 0.053 -0.100 38.48281 Health
Dominican Republic
Income 0.120 0.068 61.77476 Education
Ecuador Health 0.105 0.036 55.53368 Health Ecuador Income 0.041 -0.011 48.15074 Income Ecuador Education 0.015 -0.137 34.17674 Education El Salvador Education 0.175 0.023 52.60645 Income El Salvador Health 0.092 0.023 53.54328 Health El Salvador Income 0.073 0.021 53.66933 Education Guatemala Education 0.221 0.069 57.9658 Health Guatemala Health 0.137 0.068 60.43313 Education Guatemala Income 0.037 -0.015 47.46092 Income Guyana Income 0.216 0.164 78.33053 Income Guyana Education 0.009 -0.144 33.42434 Health Guyana Health 0.057 -0.012 48.1845 Education Haiti Health 0.115 0.046 57.06476 Health Haiti Education 0.034 -0.118 36.33702 Education Haiti Income -0.060 -0.112 30.73269 Income Honduras Education 0.166 0.013 51.53763 Health Honduras Health 0.095 0.026 54.0026 Education Honduras Income 0.050 -0.002 49.70285 Income Jamaica Education 0.069 -0.083 40.42194 Income Jamaica Health 0.034 -0.035 44.66302 Health Jamaica Income 0.031 -0.021 46.42618 Education Mexico Education 0.117 -0.036 45.87291 Health Mexico Health 0.092 0.023 53.54328 Income

349
Mexico Income 0.036 -0.016 47.28846 Education Nicaragua Education 0.161 0.009 51.00322 Health Nicaragua Health 0.149 0.080 62.27043 Education Nicaragua Income 0.043 -0.009 48.49565 Income Panama Income 0.122 0.070 62.11967 Income Panama Education 0.111 -0.041 45.23162 Health Panama Health 0.061 -0.008 48.79693 Education Paraguay Education 0.189 0.036 54.20967 Education Paraguay Health 0.061 -0.008 48.79693 Health Paraguay Income 0.015 -0.037 43.66689 Income Peru Health 0.128 0.059 59.05516 Health Peru Income 0.090 0.038 56.60108 Income Peru Education 0.061 -0.091 39.46001 Education Trinidad & Tobago
Income 0.143 0.091 65.74125 Income
Trinidad & Tobago
Education 0.064 -0.089 39.78065 Health
Trinidad & Tobago
Health 0.023 -0.046 42.97883 Education
Uruguay Education 0.144 -0.008 49.07935 Income Uruguay Income 0.082 0.030 55.22143 Health Uruguay Health 0.065 -0.004 49.40937 Education Venezuela Education 0.206 0.053 56.13354 Education Venezuela Health 0.047 -0.022 46.65342 Health Venezuela Income 0.019 -0.033 44.35671 Income

350
Table 34. Revised orders of HDI components by standard deviation scores (Other areas)
FORMER USSR 1990-2010 Order of components
Values Value-Average
Standard deviation scores
Revised order of components
Armenia Health 0.098 0.029 54.46193 Income Armenia Income 0.095 0.043 57.46336 Health Armenia Education 0.089 -0.064 42.66646 Education Estonia Education 0.189 0.036 54.20967 Education Estonia Health 0.072 0.003 50.48112 Health Estonia Income 0.040 -0.012 47.97829 Income Latvia Education 0.178 0.025 52.92709 Education Latvia Health 0.042 -0.027 45.88788 Health Latvia Income 0.019 -0.033 44.35671 Income Lithuania Education 0.228 0.075 58.6987 Education Lithuania Income 0.037 -0.015 47.46092 Income Moldova Health 0.014 -0.055 41.60086 Health Moldova Health 0.014 -0.055 41.60086 Health Moldova Education -0.011 -0.164 31.12324 Income Moldova Income -0.044 -0.096 33.49199 Education Ukraine Education 0.133 -0.019 47.79678 Education Ukraine Health -0.026 -0.095 35.47655 Health Ukraine Income -0.051 -0.103 32.2848 Income
OTHER EUROPE (NON-OECD)
1990-2010 Order of components
Values Value-Average
Standard deviation scores
Revised order of components
Albania Health 0.076 0.007 51.09355 Income Albania Income 0.149 0.097 66.77598 Health Albania Education 0.017 -0.136 34.32969 Education Bulgaria Education 0.117 -0.036 45.87291 Income Bulgaria Income 0.076 0.024 54.1867 Education Bulgaria Health 0.030 -0.039 44.05059 Health Croatia Education 0.206 0.053 56.13354 Education Croatia Health 0.065 -0.004 49.40937 Health

351
Croatia Income -0.024 -0.076 36.94111 Income Cyprus Education 0.267 0.114 63.18773 Education Cyprus Income 0.066 0.014 52.46214 Income Malta Health 0.043 -0.026 46.04099 Health Malta Education 0.139 -0.014 48.43807 Income Malta Health 0.060 -0.009 48.64383 Health Malta Income 0.058 0.006 51.08249 Education Romania Education 0.117 -0.036 45.87291 Income Romania Health 0.061 -0.008 48.79693 Health Romania Income 0.056 0.004 50.73758 Education
ARAB STATES 1990-2010 Order of components
Values Value-Average
Standard deviation scores
Revised order of components
Bahrain Health 0.059 -0.010 48.49072 Health Bahrain Education 0.054 -0.099 38.60496 Income Bahrain Income 0.028 -0.024 45.90882 Education Iran Education 0.215 0.062 57.17064 Health Iran Health 0.150 0.081 62.42354 Education Iran Income 0.088 0.036 56.25617 Income Jordan Education 0.094 -0.058 43.30775 Income Jordan Income 0.079 0.027 54.70407 Health Jordan Health 0.054 -0.015 47.72518 Education Kuwait Education 0.233 0.081 59.33999 Education Kuwait Health 0.030 -0.039 44.05059 Health Kuwait Income 0.000 -0.052 41.08005 Income Qatar Education 0.111 -0.041 45.23162 Health Qatar Health 0.043 -0.026 46.04099 Education Qatar Income 0.000 -0.052 41.08005 Income Saudi Arabia Education 0.327 0.175 70.19425 Education Saudi Arabia Health 0.091 0.022 53.39017 Health Saudi Arabia Income 0.028 -0.024 45.90882 Income Syria Education 0.083 -0.069 42.02517 Income Syria Health 0.068 -0.001 49.86869 Health Syria Income 0.064 0.012 52.11723 Education

352
Yemen Health 0.070 0.002 50.25035 Income Yemen Education 0.071 -0.081 40.6015 Health Yemen Income 0.062 0.010 51.77232 Education
PACIFIC 1990-2010 Order of components
Values Value-Average
Standard deviation scores
Revised order of components
Fiji Education 0.183 0.031 53.58671 Education Fiji Health 0.058 -0.011 48.33761 Income Fiji Income 0.044 -0.008 48.66811 Health Papua Education 0.218 0.066 57.62331 Education Papua Health 0.099 0.030 54.61503 Health Papua Income 0.041 -0.011 48.15074 Income Tonga Income 0.085 0.033 55.7388 Income Tonga Education 0.059 -0.093 39.23098 Health Tonga Health 0.040 -0.029 45.58167 Education NON-AGRICULTURAL SOUTHEAST ASIA
1990-2010 Order of components
Values Value-Average
Standard deviation scores
Revised order of components
Brunei Education 0.102 -0.051 44.1628 Health Brunei Health 0.068 -0.001 49.86869 Education Brunei Income -0.007 -0.059 39.87286 Income Singapore Education 0.139 -0.014 48.43807 Income Singapore Income 0.111 0.059 60.22266 Health Singapore Health 0.089 0.020 53.08396 Education

353
Table 35. Summary of revised largest HDI component improvement (from Table 30-34)

354
Table 36. Revised order of the HDI components and the sum of the 3 components
1990-2010 Order of components
Values Value-Average
Standard Scores
Revised order of components
Sum of 3 components
ASIAN COUNTRIES
Afghanistan Education 0.356 0.203 73.44837 Education 169.51 Afghanistan Health 0.169 0.100 65.33259 health Afghanistan Income -0.060 -0.112 30.73269 income Bangladesh Education 0.217 0.064 57.41612 Health 179.81 Bangladesh Health 0.145 0.076 61.658 Income Bangladesh Income 0.114 0.062 60.74002 Education China (PRC) Income 0.275 0.223 88.50543 income 196.80 China (PRC) Education 0.206 0.053 56.13354 education China (PRC) Health 0.083 0.014 52.16531 health India Education 0.193 0.040 54.6372 Income 176.35 India Income 0.142 0.090 65.56879 Health India Health 0.109 0.040 56.14611 Education Indonesia Education 0.128 -0.025 47.15549 Income 160.19 Indonesia Health 0.103 0.034 55.22747 Health Indonesia Income 0.097 0.045 57.80827 Education Republic of Korea
Education 0.178 0.025 52.92709 Income 177.17
Republic of Korea
Health 0.139 0.070 60.73935 Health
Republic of Korea
Income 0.130 0.078 63.49932 Education
Kyrgyzstan Education 0.028 -0.125 35.61227 health 112.32 Kyrgyzstan Health 0.011 -0.058 41.14154 education Kyrgyzstan Income -0.032 -0.084 35.56146 income Lao PDR Health 0.196 0.127 69.4665 Health 185.82 Lao PDR Education 0.167 0.014 51.64451 Income Lao PDR Income 0.137 0.085 64.70651 Education Malaysia Education 0.167 0.014 51.64451 income 159.19

355
Malaysia Income 0.106 0.054 59.36038 education Malaysia Health 0.057 -0.012 48.1845 health Mongolia Education 0.244 0.092 60.62257 Education 175.27 Mongolia Income 0.109 0.057 59.87774 income Mongolia Health 0.100 0.031 54.76814 health Myanmar Income 0.245 0.193 83.33175 Income 186.44 Myanmar Education 0.150 -0.002 49.72064 Health Myanmar Health 0.091 0.022 53.39017 Education Nepal Education 0.239 0.086 59.98128 health 181.41 Nepal Health 0.186 0.117 67.93542 education Nepal Income 0.072 0.020 53.49688 income Pakistan Education 0.167 0.014 51.64451 Education 152.96 Pakistan Health 0.076 0.007 51.09355 health Pakistan Income 0.053 0.001 50.22021 income Philippines Income 0.054 0.002 50.39267 Income 132.51 Philippines Health 0.046 -0.023 46.50032 Health Philippines Education 0.028 -0.125 35.61227 Education Sri Lanka Education 0.128 -0.025 47.15549 Income 159.01 Sri Lanka Income 0.123 0.071 62.29213 Health Sri Lanka Health 0.066 -0.003 49.56247 Education Tajikistan Health 0.060 -0.009 48.64383 health 102.51 Tajikistan Education -0.044 -0.197 27.2755 education Tajikistan Income -0.084 -0.136 26.59375 income Thailand Education 0.261 0.109 62.54644 Education 168.64 Thailand Income 0.102 0.050 58.67055 income Thailand Health 0.052 -0.017 47.41896 health Vietnam Education 0.220 0.068 57.8009 income 178.97 Vietnam Income 0.169 0.117 70.2251 education Vietnam Health 0.075 0.006 50.94044 health

356
Appendix 9. Sum of 3 Standard Deviation Scores
Figure 46. Sum of the 3 standard deviation scores for Asian countries
Figure 47. Sum of the 3 standard deviation scores for Asian countries (enlarged)
100110120130140150160170180190200
Afghan
istan
Bangla
desh
China(PRC)
India
Indonesi
aKore
a
Kyrgyzs
tan Lao
Malaysi
a
Mongol
ia
Myanmar
Nepal
Pakist
an
Philippin
es
Sri Lan
ka
Tajikist
an
Thailan
d
Vietnam
Sum of 3 components
Sum of 3…
130
140
150
160
170
180
190
200
Afghan
istan
Bangla
desh
China(PRC)
India
Indonesi
aKore
a
Kyrgyzs
tan Lao
Malaysi
a
Mongol
ia
Myanmar
Nepal
Pakist
an
Philippin
es
Sri Lan
ka
Tajikist
an
Thailan
d
Vietnam
Sum of 3 components
Sum of 3…
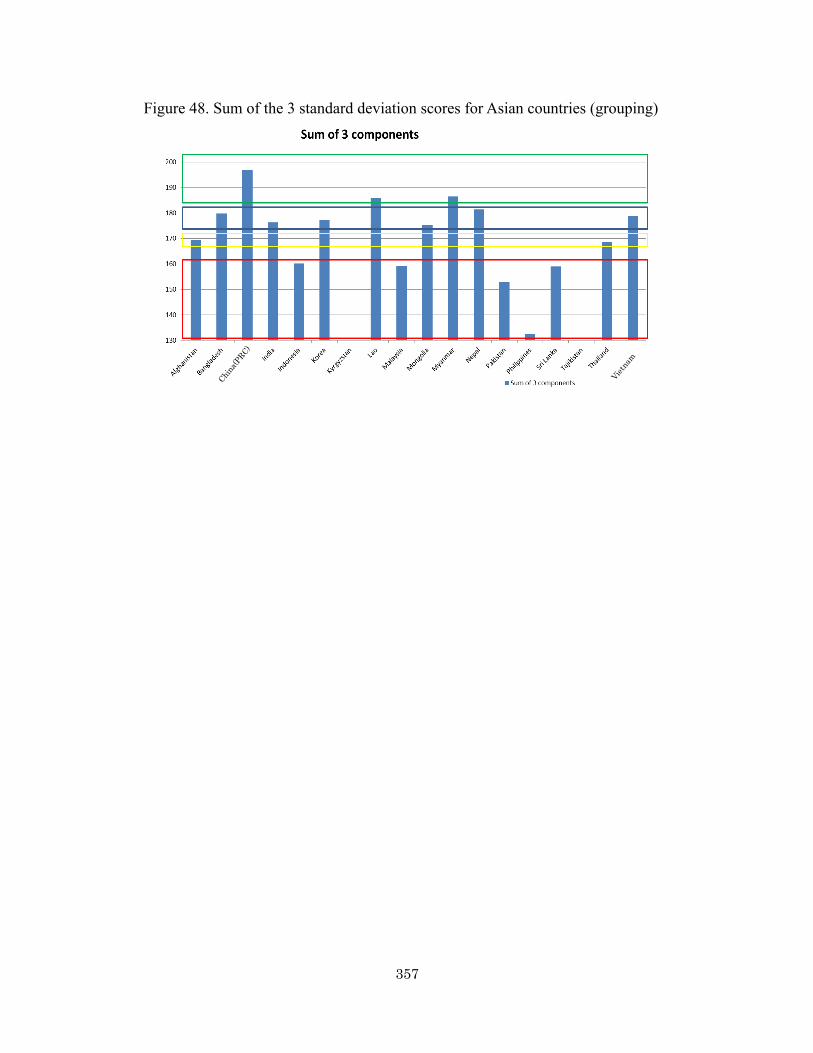
357
Figure 48. Sum of the 3 standard deviation scores for Asian countries (grouping)
China(P
RC)
Vietna
m

358
Table 37. Scoring on HDI parameters O P Q R S T U V W
HDI
absolute
value
World Asia
HDI
standard
deviation
HDI
ratio
of
incre
ase
Wo
rld Asia
HDI
evaluation
by absolute
value and
ratio of
increase
HDI
evaluation
considerin
g HDI
standard
deviation
and ratio
of
increase
Afghanistan 28 ○ △1 △1 7 ◎ ◎3 successful4 4 successful
Bangladesh 13 ○ ○2 ○2 10 ◎ ○2 successful4 4 successful
China(PRC) 2 ◎ ◎3 ◎3 14 ○ ○2 very
successful5 5
very
successful
India 19 ○ ○2 ○2 20 ○ △1 successful3 3 successful
Indonesia 17 ○ ○2 ×0 25 ○ △1 successful3 1 insufficient
Kyrgyzstan 123 × NA NA 123 × NA
Lao 10 ◎ ○2 ◎3 9 ◎ ○2 very
successful5 5
very
successful
Malaysia 24 ○ △1 ×0 41 △ ×0 marginal1 0 unsuccessf
ul
Mongolia 64 × ×0 ○2 52 × ×0 unsuccessf
ul0 2 marginal
Myanmar 4 ◎ ◎3 ◎3 4 ◎ ◎3 very
successful6 6
very
successful
Nepal 31 △ △1 ○2 18 ○ △1 marginal2 3 successful
Pakistan 22 ○ △1 ×0 19 ○ △1 marginal2 1 marginal
Philippines 104 × ×0 ×0 84 × ×0 unsuccessf
ul0 0
unsuccessf
ul
Korea 9 ◎ ○2 ○2 39 △ ×0 marginal2 2 marginal
Sri Lanka 65 × ×0 ×0 57 × ×0 unsuccessf
ul0 0
unsuccessf
ul
Tajikistan 128 × NA NA 127 × NA

359
Thailand 33 △ △1 △1 40 △ ×0 marginal1 1 marginal
Vietnam 6 ◎ ◎3 ○2 13 ○ ○2 very
successful5 4 successful
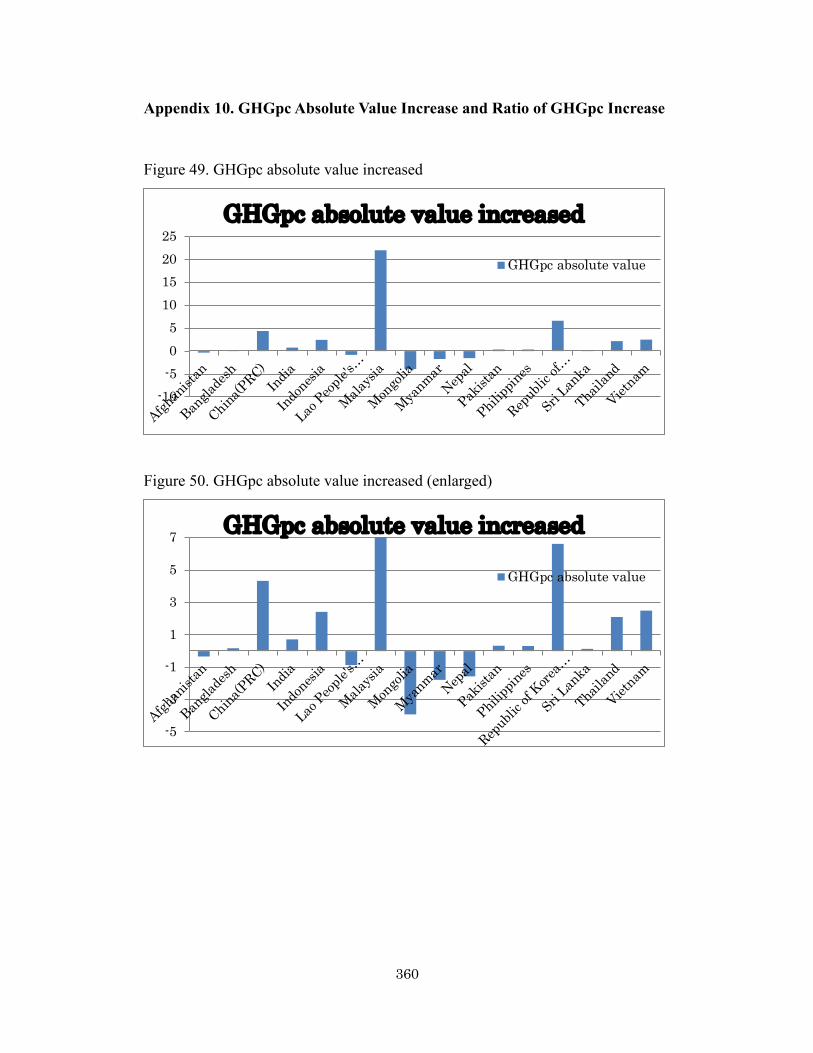
360
Appendix 10. GHGpc Absolute Value Increase and Ratio of GHGpc Increase
Figure 49. GHGpc absolute value increased
Figure 50. GHGpc absolute value increased (enlarged)
-10-505
10152025
Afghan
istan
Bangla
desh
China(PRC)
India
Indonesi
a
Lao Peop
le's…
Malaysi
a
Mongol
ia
Myanmar
Nepal
Pakist
an
Philippin
es
Republi
c of…
Sri Lan
ka
Thailan
d
Vietnam
GHGpc absolute value increased
GHGpc absolute value
-5
-3
-1
1
3
5
7
Afghan
istan
Bangla
desh
China(PRC)
India
Indonesi
a
Lao Peop
le's…
Malaysi
a
Mongol
ia
Myanmar
Nepal
Pakist
an
Philippin
es
Republi
c of K
orea…
Sri Lan
ka
Thailan
d
Vietnam
GHGpc absolute value increased
GHGpc absolute value

361
Figure 51. GHGpc absolute value increased (grouping)
-5
-3
-1
1
3
5
7
Afghan
istan
Bangla
desh
China(PRC)
India
Indonesi
a
Lao Peop
le's…
Malaysi
a
Mongol
ia
Myanmar
Nepal
Pakist
an
Philippin
es
Republi
c of K
orea…
Sri Lan
ka
Thailan
d
Vietnam
GHGpc absolute value increased
GHGpc absolute value
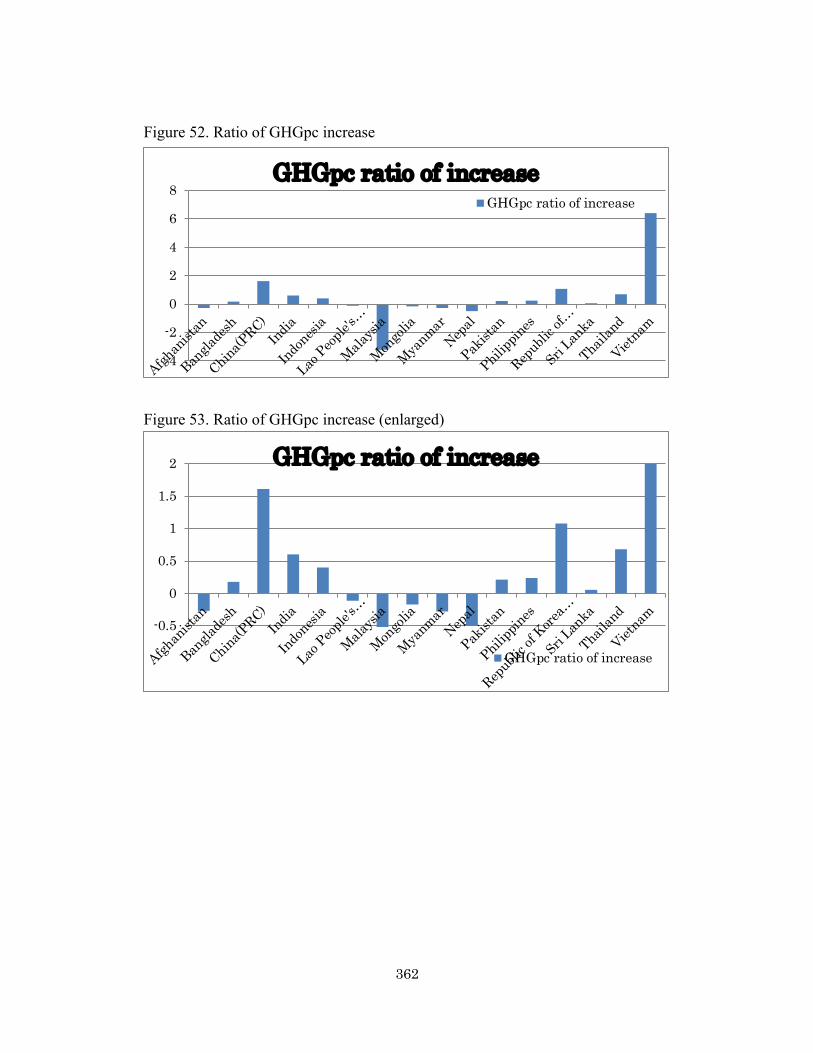
362
Figure 52. Ratio of GHGpc increase
Figure 53. Ratio of GHGpc increase (enlarged)
-4
-2
0
2
4
6
8
Afghan
istan
Bangla
desh
China(PRC)
India
Indonesi
a
Lao Peop
le's…
Malaysi
a
Mongol
ia
Myanmar
Nepal
Pakist
an
Philippin
es
Republi
c of…
Sri Lan
ka
Thailan
d
Vietnam
GHGpc ratio of increaseGHGpc ratio of increase
-0.5
0
0.5
1
1.5
2
Afghan
istan
Bangla
desh
China(PRC)
India
Indonesi
a
Lao Peop
le's…
Malaysi
a
Mongol
ia
Myanmar
Nepal
Pakist
an
Philippin
es
Republi
c of K
orea…
Sri Lan
ka
Thailan
d
Vietnam
GHGpc ratio of increase
GHGpc ratio of increase

363
Figure 54. Ratio of GHGpc increase (grouping)
Vietna
m
Chin
a (PR
C)

364
Table 38. Total evaluation of GHGpc parameters I X Y Z AA AB AC AD
GHGpc absolute value increase
World Asia GHG ratio of increase
World Asia Total evaluation of GHGpc parameters
Afghanistan 73 △ ◎ 44 △ ◎ very successful 6
Bangladesh 85 × ○ 98 × ○ successful 4
China (PRC)
122 × × 126 × × unsuccessful 0
India 95 × ○ 117 × △ marginal 3
Indonesia 115 × △ 110 × △ marginal 2
Kyrgyzstan 7 ◎ NA 2 ◎ NA Lao PDR 60 △ ◎ 65 △ ◎ very successful 6 Malaysia 129 × × 1 ◎ × unsuccessful 0 Mongolia 27 ○ ◎ 57 △ ◎ very successful 6 Myanmar 47 △ ◎ 40 △ ◎ very successful 6 Nepal 49 △ ◎ 12 ○ ◎ very successful 6
Pakistan 90 × ○ 102 × ○ successful 4
Philippines 89 × ○ 104 × ○ successful 4
Republic of Korea
126 × × 123 × × unsuccessful 0
Sri Lanka 84 × ○ 86 × ○ successful 4
Tajikistan 44 △ NA 8 ◎ NA
Thailand 111 × △ 119 × △ marginal 2
Vietnam 116 × △ 130 × × marginal 1

365
Table 39. Final total scores to identify successful countries.
Countries HDI score GHG score Total
Bangladesh 4 4 8
China (PRC) 5 0 5
India 3 3 6
Indonesia 1 2 3
Malaysia 0 0 0
Mongolia 2 6 8
Myanmar 6 6 12
Nepal 3 6 9
Pakistan 1 4 5
Philippines 0 4 4
Republic of Korea 2 0 2
Sri Lanka 0 4 4
Thailand 1 2 3
Vietnam 4 1 5

366
Table 40. Identifying successful countries
Countries HDI score
HDI evaluation
GHG score
GHG evaluation
Total Remarks (Regarding DLHE groups, please refer Section 5.1)
Bangladesh 4 successful 4 successful 4 8
Successful because of both of successful HDI and GHG (DLHE (new CO2); CO2 newly rising recently)
China (PRC)
5 very successful
0 unsuccessful 0
5
Unsuccessful because of unsuccessful GHG (DLHE (dom CO2); dominated by CO2)
India 3 successful 3 marginal 3 6
Unsuccessful because of marginal GHG (DLHE (dom CO2); dominated by CO2)
Indonesia 1 marginal 2 marginal 2 3
Unsuccessful because of marginal HDI and GHG (DLHE (LUCF); dominated by LUCF)
Malaysia 0 unsuccessful 0 unsuccessful 0
0
Unsuccessful because of unsuccessful HDI and GHG (DLHE (LUCF-+); LUCF drastic increased)
Mongolia 2 marginal 6 very successful 6
8
Successful because of very successful GHG even though HDI was marginal (Non DLHE (LUCF); dominated by LUCF)
Myanmar 6 very successful
6 very successful 6
12 Very Successful because of very

367
Countries HDI score
HDI evaluation
GHG score
GHG evaluation
Total Remarks (Regarding DLHE groups, please refer Section 5.1) successful HDI and GHG (Non DLHE (reform); emissions dropped because of the military era)
Nepal 3 successful 6 very successful 6
9
Very Successful because of very successful GHG (Non DLHE (Agri&LUCF); dominated by agriculture and LUCF
Pakistan 1 marginal 4 successful 4 5
Unsuccessful because of marginal HDI (DLHE (dom CO2); dominated by CO2)
Philippines 0 unsuccessful 4 successful 4 4
Unsuccessful because of unsuccessful HDI (DLHE (dom CO2); dominated by CO2)
Republic of Korea
2 marginal 0 unsuccessful 0
2
Unsuccessful because of both marginal HDI and unsuccessful GHG (DLHE (dom CO2); dominated by CO2)
Sri Lanka 0 unsuccessful 4 successful 4 4
Unsuccessful because of unsuccessful HDI (DLHE (yet CO2); CO2 increased but not much)
Thailand 1 marginal 2 marginal 2 3 Unsuccessful because of both marginal HDI and EKC (DLHE (dom

368
Countries HDI score
HDI evaluation
GHG score
GHG evaluation
Total Remarks (Regarding DLHE groups, please refer Section 5.1) CO2); dominated by CO2)
Vietnam 4 successful 1 marginal 1 5
Unsuccessful because of marginal GHG (DLHE (new CO2); CO2 rising recently)
Figure 55. Trajectories of Very Successful and Successful Asian Countries
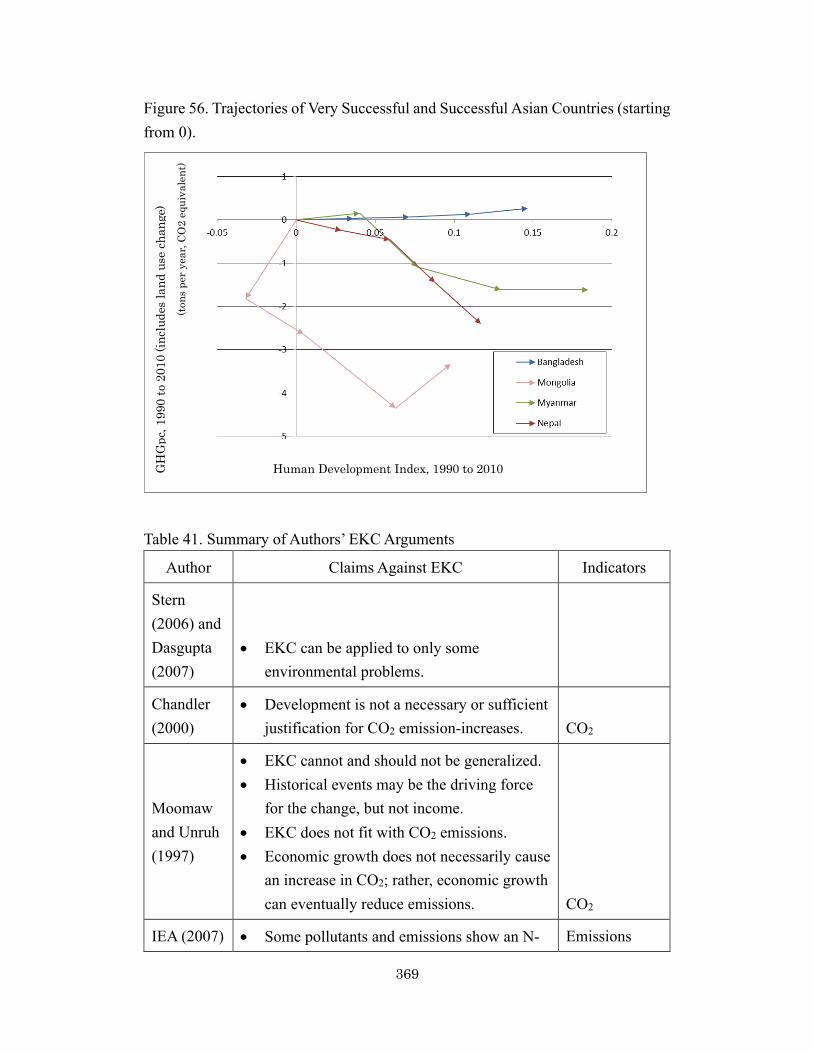
369
Figure 56. Trajectories of Very Successful and Successful Asian Countries (starting from 0).
Table 41. Summary of Authors’ EKC Arguments
Author Claims Against EKC Indicators
Stern (2006) and Dasgupta (2007)
• EKC can be applied to only some environmental problems.
Chandler (2000)
• Development is not a necessary or sufficient justification for CO2 emission-increases. CO2
Moomaw and Unruh (1997)
• EKC cannot and should not be generalized. • Historical events may be the driving force
for the change, but not income. • EKC does not fit with CO2 emissions. • Economic growth does not necessarily cause
an increase in CO2; rather, economic growth can eventually reduce emissions. CO2
IEA (2007) • Some pollutants and emissions show an N- Emissions
Human Development Index, 1990 to 2010 GH
Gpc
, 199
0 to
201
0 (in
clud
es la
nd u
se ch
ange
) (to
ns p
er y
ear,
CO2
equi
vale
nt)

370
Author Claims Against EKC Indicators
shaped curve.
Barquin (2006)
• A “scale effect” should be considered. • If it is possible to prove the existence of
EKC models, then their utility as instruments of economic policy is debatable.
Impacts by Motor Vehicles
America’s Energy Future (2009)
• Generalizations like the EKC model should not be relied upon.
• It is important to track the history of each country because development policies in developing countries are strongly influenced or “trapped” by the EKC theory.
Orban (2008)
• Even if a case in which economic growth is related to an emission improvement is found, there is no reason to believe that such improvement occurs automatically.
• If it can happen automatically, then it may be a case wherein dirty technology is replaced by clean technology.
Dirty Technology
Kidd (2009)
• Although having high standards of living with a clean environment is possible, the opposite is also true.
• The environment may further degrade, despite economic development, until the earth’s carrying capacity is reached.
Environmental Degradation
Ferrini (2012)
• Institutional change and technology are the most important items.
Shaffer (2009)
• Pollution reduction will not happen automatically even if growth happens.
• Cases in the future will not necessarily be the same as cases in the past.
• Whether a case can fit with EKC or not depends on the specifics of the case.
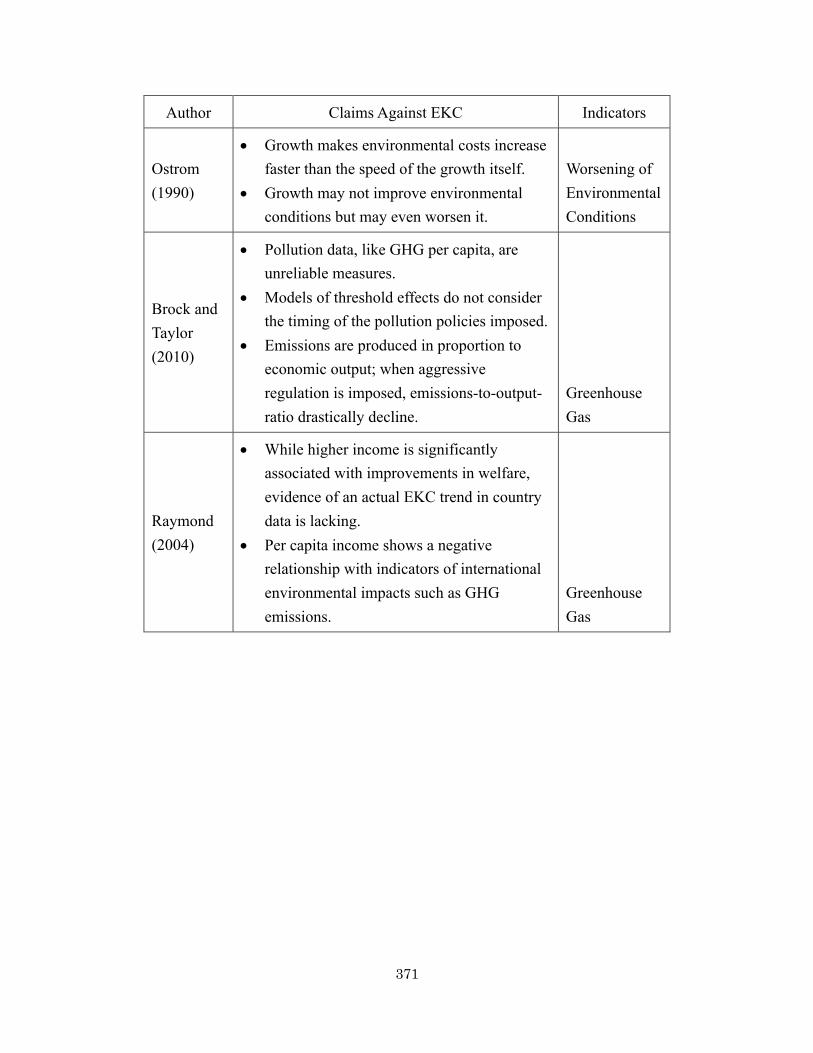
371
Author Claims Against EKC Indicators
Ostrom (1990)
• Growth makes environmental costs increase faster than the speed of the growth itself.
• Growth may not improve environmental conditions but may even worsen it.
Worsening of Environmental Conditions
Brock and Taylor (2010)
• Pollution data, like GHG per capita, are unreliable measures.
• Models of threshold effects do not consider the timing of the pollution policies imposed.
• Emissions are produced in proportion to economic output; when aggressive regulation is imposed, emissions-to-output-ratio drastically decline.
Greenhouse Gas
Raymond (2004)
• While higher income is significantly associated with improvements in welfare, evidence of an actual EKC trend in country data is lacking.
• Per capita income shows a negative relationship with indicators of international environmental impacts such as GHG emissions.
Greenhouse Gas
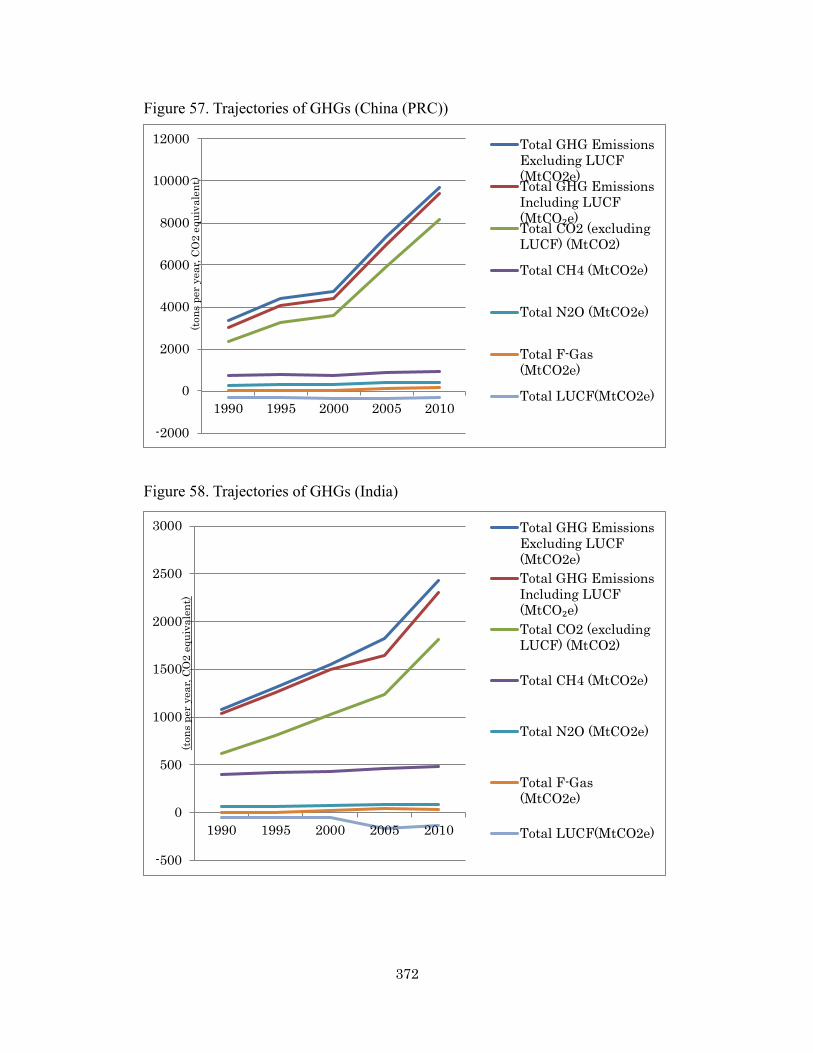
372
Figure 57. Trajectories of GHGs (China (PRC))
Figure 58. Trajectories of GHGs (India)
-2000
0
2000
4000
6000
8000
10000
12000
1990 1995 2000 2005 2010
Total GHG EmissionsExcluding LUCF(MtCO2e)Total GHG Emissions Including LUCF (MtCO₂e )Total CO2 (excludingLUCF) (MtCO2)
Total CH4 (MtCO2e)
Total N2O (MtCO2e)
Total F-Gas(MtCO2e)
Total LUCF(MtCO2e)
-500
0
500
1000
1500
2000
2500
3000
1990 1995 2000 2005 2010
Total GHG EmissionsExcluding LUCF(MtCO2e)Total GHG Emissions Including LUCF (MtCO₂e )Total CO2 (excludingLUCF) (MtCO2)
Total CH4 (MtCO2e)
Total N2O (MtCO2e)
Total F-Gas(MtCO2e)
Total LUCF(MtCO2e)
(ton
spe
rye
ar,C
O2
equi
vale
nt)
(tons
per
yea
r, CO
2 eq
uiva
lent
)

373
Figure 59. Trajectories of GHGs (Republic of Korea)
Figure 60. Trajectories of GHGs (Pakistan)
-100
0
100
200
300
400
500
600
700
1990 1995 2000 2005 2010
Total GHG EmissionsExcluding LUCF(MtCO2e)Total GHG Emissions Including LUCF (MtCO₂e )Total CO2 (excludingLUCF) (MtCO2)
Total CH4 (MtCO2e)
Total N2O (MtCO2e)
Total F-Gas (MtCO2e)
Total LUCF(MtCO2e)
(ton
spe
rye
ar,C
O2
equi
vale
nt)
0
50
100
150
200
250
300
350
1990 1995 2000 2005 2010
Total GHG EmissionsExcluding LUCF(MtCO2e)Total GHG Emissions Including LUCF (MtCO₂e )Total CO2 (excludingLUCF) (MtCO2)
Total CH4 (MtCO2e)
Total N2O (MtCO2e)
Total F-Gas (MtCO2e)
Total LUCF (MtCO2e)
(ton
sper
year
,CO
2eq
uiva
lent
)

374
Figure 61. Trajectories of GHGs (Philippines)
Figure 62. Trajectories of GHGs (Thailand)
-20
0
20
40
60
80
100
120
140
160
1990 1995 2000 2005 2010
Total GHG EmissionsExcluding LUCF(MtCO2e)Total GHG Emissions Including LUCF (MtCO₂e )Total CO2 (excludingLUCF) (MtCO2)
Total CH4 (MtCO2e)
Total N2O (MtCO2e)
Total F-Gas (MtCO2e)
Total LUCF (MtCO2e)
(ton
spe
ryea
r,C
O2
equi
vale
nt)
-50
0
50
100
150
200
250
300
350
400
1990 1995 2000 2005 2010
Total GHG EmissionsExcluding LUCF(MtCO2e)Total GHG Emissions Including LUCF (MtCO₂e )Total CO2 (excludingLUCF) (MtCO2)
Total CH4 (MtCO2e)
Total N2O (MtCO2e)
Total F-Gas (MtCO2e)
Total LUCF (MtCO2e)
(ton
s pe
r yea
r, CO
2 eq
uiva
lent
)
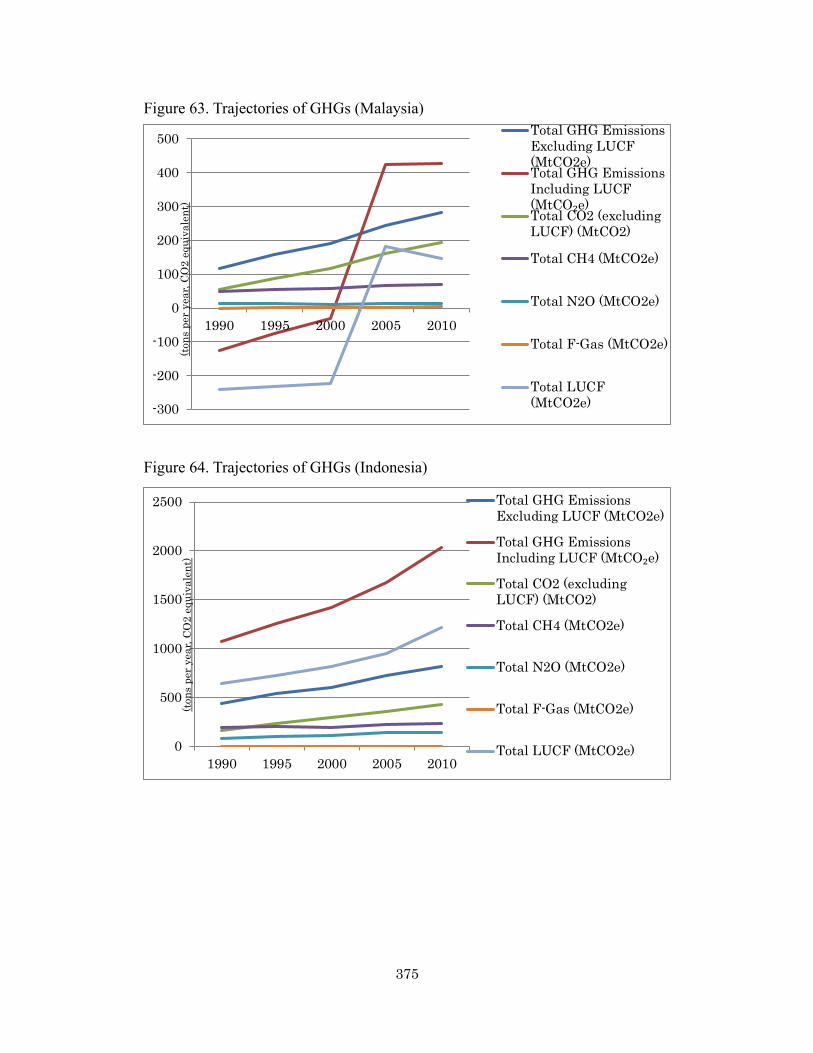
375
Figure 63. Trajectories of GHGs (Malaysia)
Figure 64. Trajectories of GHGs (Indonesia)
-300
-200
-100
0
100
200
300
400
500
1990 1995 2000 2005 2010
Total GHG EmissionsExcluding LUCF(MtCO2e)Total GHG Emissions Including LUCF (MtCO₂e )Total CO2 (excludingLUCF) (MtCO2)
Total CH4 (MtCO2e)
Total N2O (MtCO2e)
Total F-Gas (MtCO2e)
Total LUCF(MtCO2e)
(ton
spe
rye
ar,C
O2
equi
vale
nt)
0
500
1000
1500
2000
2500
1990 1995 2000 2005 2010
Total GHG EmissionsExcluding LUCF (MtCO2e)
Total GHG Emissions Including LUCF (MtCO₂e )
Total CO2 (excludingLUCF) (MtCO2)
Total CH4 (MtCO2e)
Total N2O (MtCO2e)
Total F-Gas (MtCO2e)
Total LUCF (MtCO2e)
(ton
spe
rye
ar,C
O2
equi
vale
nt)
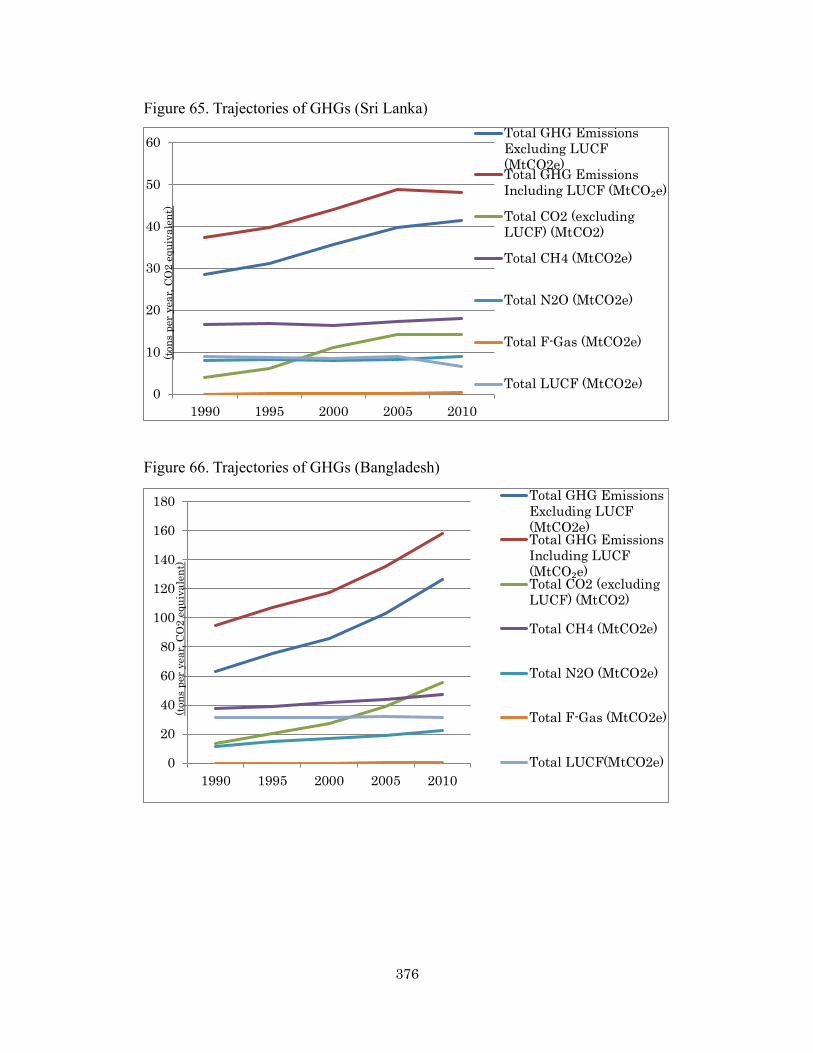
376
Figure 65. Trajectories of GHGs (Sri Lanka)
Figure 66. Trajectories of GHGs (Bangladesh)
0
10
20
30
40
50
60
1990 1995 2000 2005 2010
Total GHG EmissionsExcluding LUCF(MtCO2e)Total GHG Emissions Including LUCF (MtCO₂e )
Total CO2 (excludingLUCF) (MtCO2)
Total CH4 (MtCO2e)
Total N2O (MtCO2e)
Total F-Gas (MtCO2e)
Total LUCF (MtCO2e)
(ton
spe
rye
ar,C
O2
equi
vale
nt)
0
20
40
60
80
100
120
140
160
180
1990 1995 2000 2005 2010
Total GHG EmissionsExcluding LUCF(MtCO2e)Total GHG Emissions Including LUCF (MtCO₂e )Total CO2 (excludingLUCF) (MtCO2)
Total CH4 (MtCO2e)
Total N2O (MtCO2e)
Total F-Gas (MtCO2e)
Total LUCF(MtCO2e)
(ton
spe
rye
ar,C
O2
equi
vale
nt)
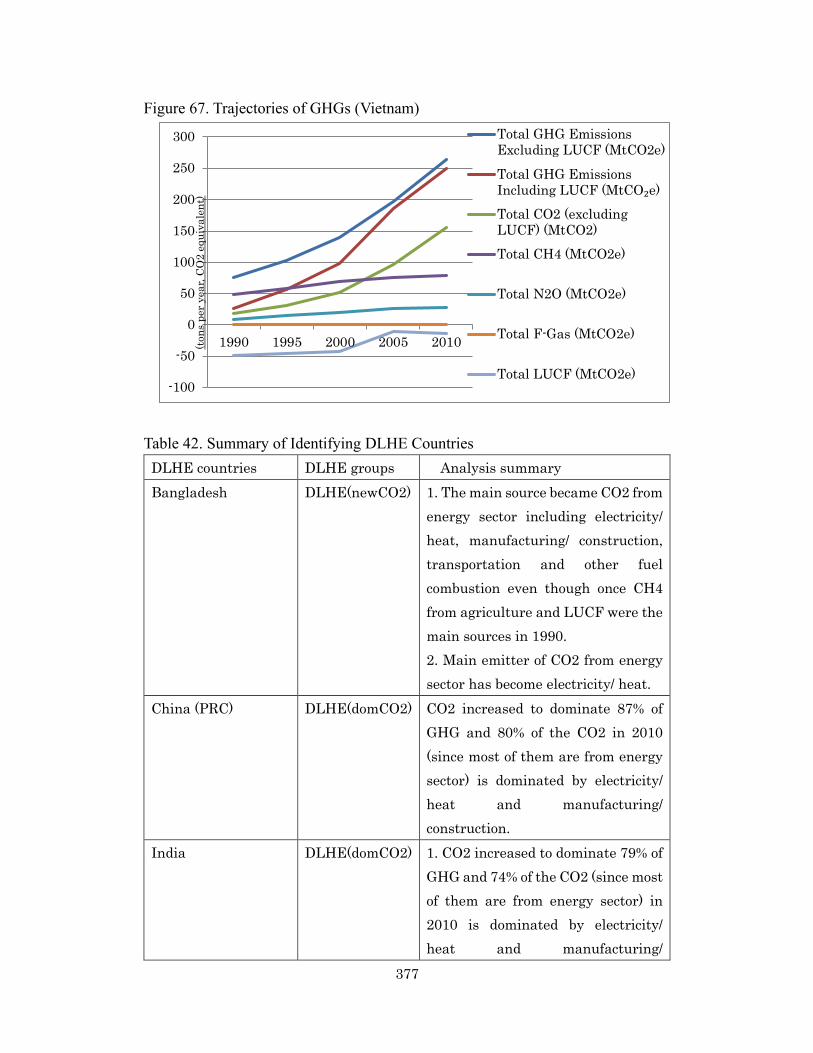
377
Figure 67. Trajectories of GHGs (Vietnam)
Table 42. Summary of Identifying DLHE Countries DLHE countries DLHE groups Analysis summary Bangladesh DLHE(newCO2) 1. The main source became CO2 from
energy sector including electricity/ heat, manufacturing/ construction, transportation and other fuel combustion even though once CH4 from agriculture and LUCF were the main sources in 1990. 2. Main emitter of CO2 from energy sector has become electricity/ heat.
China (PRC) DLHE(domCO2) CO2 increased to dominate 87% of GHG and 80% of the CO2 in 2010 (since most of them are from energy sector) is dominated by electricity/ heat and manufacturing/ construction.
India DLHE(domCO2) 1. CO2 increased to dominate 79% of GHG and 74% of the CO2 (since most of them are from energy sector) in 2010 is dominated by electricity/ heat and manufacturing/
-100
-50
0
50
100
150
200
250
300
1990 1995 2000 2005 2010
Total GHG EmissionsExcluding LUCF (MtCO2e)Total GHG Emissions Including LUCF (MtCO₂e )Total CO2 (excludingLUCF) (MtCO2)Total CH4 (MtCO2e)
Total N2O (MtCO2e)
Total F-Gas (MtCO2e)
Total LUCF (MtCO2e)
(ton
spe
rye
ar,C
O2
equi
vale
nt)
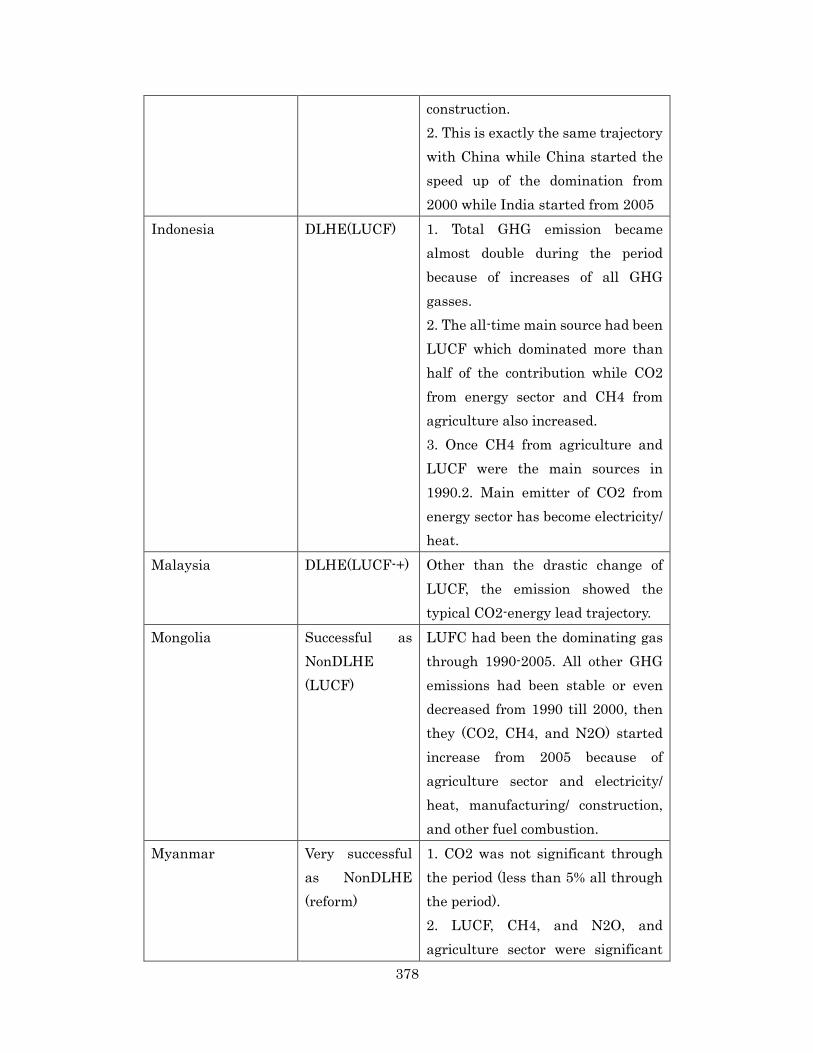
378
construction. 2. This is exactly the same trajectory with China while China started the speed up of the domination from 2000 while India started from 2005
Indonesia DLHE(LUCF) 1. Total GHG emission became almost double during the period because of increases of all GHG gasses. 2. The all-time main source had been LUCF which dominated more than half of the contribution while CO2 from energy sector and CH4 from agriculture also increased. 3. Once CH4 from agriculture and LUCF were the main sources in 1990.2. Main emitter of CO2 from energy sector has become electricity/ heat.
Malaysia DLHE(LUCF-+) Other than the drastic change of LUCF, the emission showed the typical CO2-energy lead trajectory.
Mongolia Successful as NonDLHE (LUCF)
LUFC had been the dominating gas through 1990-2005. All other GHG emissions had been stable or even decreased from 1990 till 2000, then they (CO2, CH4, and N2O) started increase from 2005 because of agriculture sector and electricity/ heat, manufacturing/ construction, and other fuel combustion.
Myanmar Very successful as NonDLHE (reform)
1. CO2 was not significant through the period (less than 5% all through the period). 2. LUCF, CH4, and N2O, and agriculture sector were significant
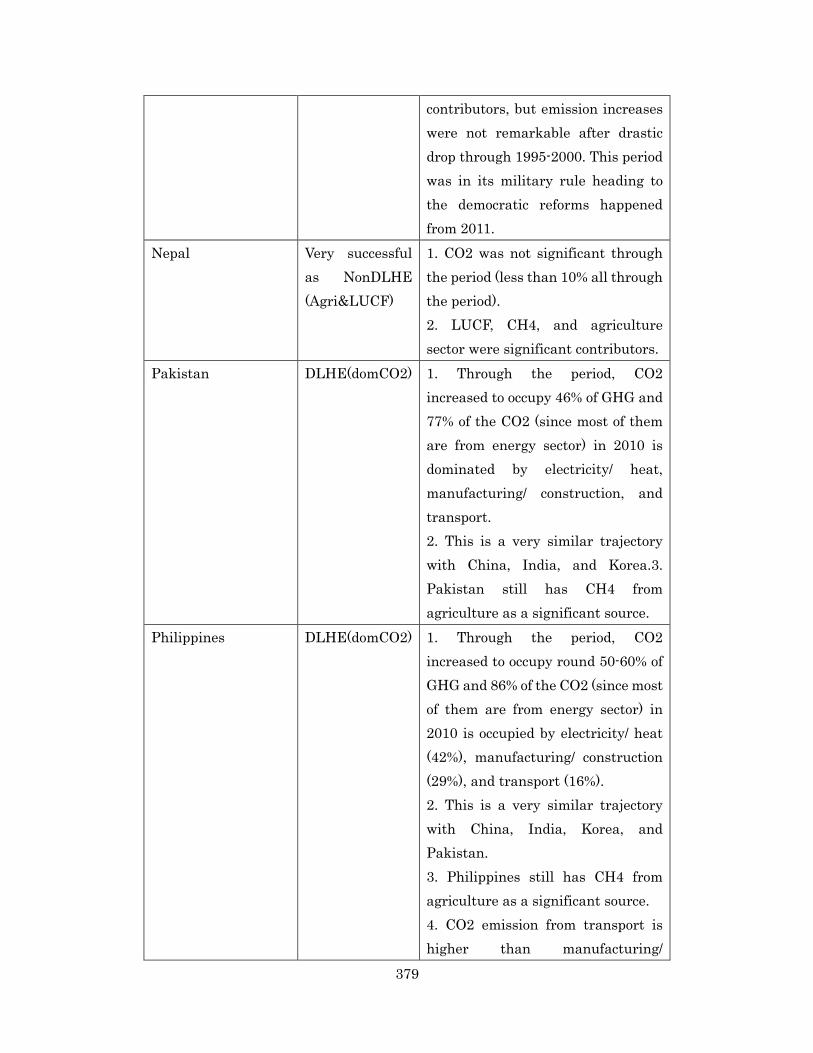
379
contributors, but emission increases were not remarkable after drastic drop through 1995-2000. This period was in its military rule heading to the democratic reforms happened from 2011.
Nepal Very successful as NonDLHE (Agri&LUCF)
1. CO2 was not significant through the period (less than 10% all through the period). 2. LUCF, CH4, and agriculture sector were significant contributors.
Pakistan DLHE(domCO2) 1. Through the period, CO2 increased to occupy 46% of GHG and 77% of the CO2 (since most of them are from energy sector) in 2010 is dominated by electricity/ heat, manufacturing/ construction, and transport. 2. This is a very similar trajectory with China, India, and Korea.3. Pakistan still has CH4 from agriculture as a significant source.
Philippines DLHE(domCO2) 1. Through the period, CO2 increased to occupy round 50-60% of GHG and 86% of the CO2 (since most of them are from energy sector) in 2010 is occupied by electricity/ heat (42%), manufacturing/ construction (29%), and transport (16%). 2. This is a very similar trajectory with China, India, Korea, and Pakistan. 3. Philippines still has CH4 from agriculture as a significant source. 4. CO2 emission from transport is higher than manufacturing/

380
construction in Philippines. It maybe result from geological reason when Philippines are made by many small islands where cannot be suitable for trains.
Korea DLHE(domCO2) 1. Through the period, CO2 increased to keep its domination above 93% of GHG and 87% of the CO2 (since most of them are from energy sector) in 2010 is dominated by electricity/ heat (55%), manufacturing/ construction (17%), and transport (15%). 2. This is a very similar trajectory with China and India while China started the speed up of the domination from 2000 while India started from 2005, but Korea started already before 1990. 3. While China and India had agriculture sector as the 2nd contributor, in Korea, agriculture sector was very insignificant.
Sri Lanka DLHE(not yetCO2)
1. CH4 had been the biggest contributor through the period while it was also stable through the period. N2O and LUCF hand been also other significant gases ranked 2-4 through the period, however they were also stable. 2. While other gasses were more or less stable, Only CO2 showed remarkable increase which bring it up from 4th position to 2nd position because of increases by CO2 emissions from transportation,

381
electricity/ heat, and other fuel combustion (other than CO2).
Thailand DLHE(domCO2) 1. Through the period, CO2 increased to keep its domination above 50% of GHG and 87% of the CO2 in 2010 is dominated by electricity/ heat (39%), manufacturing/ construction (26%), and transport (22%). 2. This is a very similar trajectory with China, India, Korea, Pakistan, and Philippines. 3. Thailand still has CH4 from agriculture as a significant source
Vietnam DLHE(newCO2) 1. The main source became CO2 from energy sector including manufacturing/ construction, electricity/ heat, transportation and other fuel combustion even though once CH4 from agriculture was the main source until 2000. 2. Main emitter of CO2 from energy sector has become manufacturing/ construction and electricity/ heat. 3. LUCF had been an absorber through the period but the amount of absorption drastically decreased in 2005 (from 40s to 10s MtCO2e).
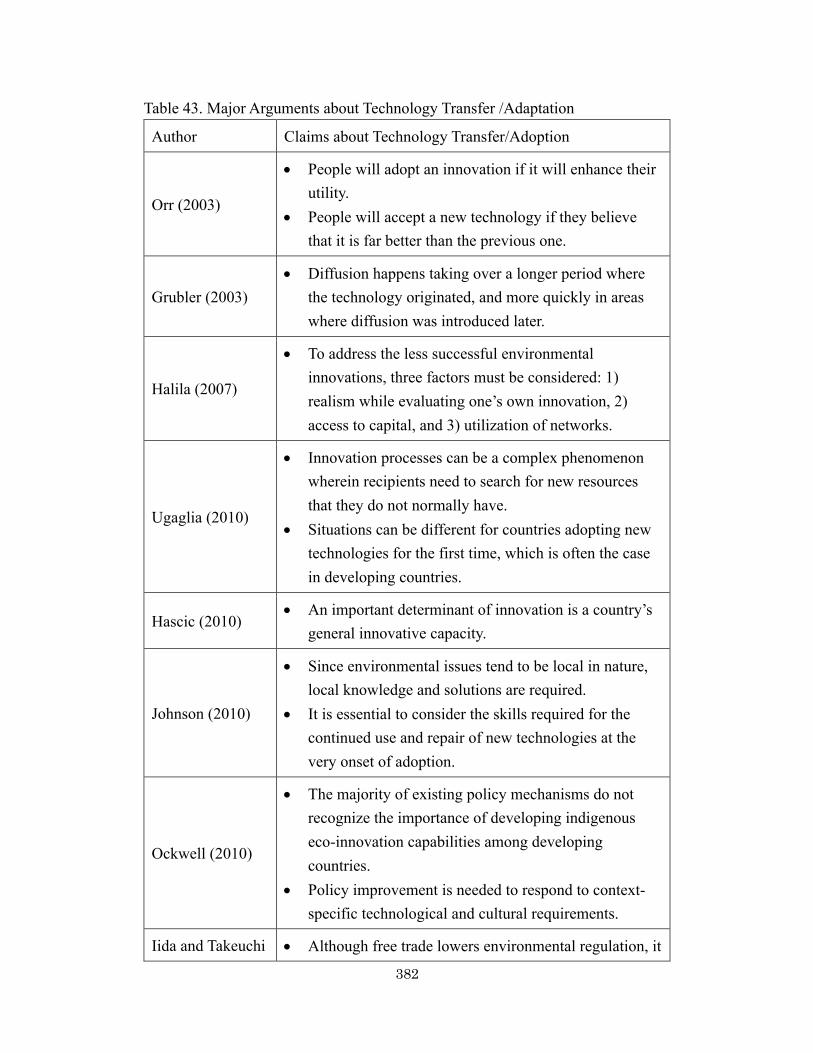
382
Table 43. Major Arguments about Technology Transfer /Adaptation
Author Claims about Technology Transfer/Adoption
Orr (2003)
• People will adopt an innovation if it will enhance their utility.
• People will accept a new technology if they believe that it is far better than the previous one.
Grubler (2003) • Diffusion happens taking over a longer period where
the technology originated, and more quickly in areas where diffusion was introduced later.
Halila (2007)
• To address the less successful environmental innovations, three factors must be considered: 1) realism while evaluating one’s own innovation, 2) access to capital, and 3) utilization of networks.
Ugaglia (2010)
• Innovation processes can be a complex phenomenon wherein recipients need to search for new resources that they do not normally have.
• Situations can be different for countries adopting new technologies for the first time, which is often the case in developing countries.
Hascic (2010) • An important determinant of innovation is a country’s
general innovative capacity.
Johnson (2010)
• Since environmental issues tend to be local in nature, local knowledge and solutions are required.
• It is essential to consider the skills required for the continued use and repair of new technologies at the very onset of adoption.
Ockwell (2010)
• The majority of existing policy mechanisms do not recognize the importance of developing indigenous eco-innovation capabilities among developing countries.
• Policy improvement is needed to respond to context-specific technological and cultural requirements.
Iida and Takeuchi • Although free trade lowers environmental regulation, it

383
Author Claims about Technology Transfer/Adoption
(2010) is still preferable when the evaluation of the environmental damage is high.
• When a country cares less about the environmental damage caused by technology transfer, free trade is Pareto improving.
• If the developing country’s concern is high enough to conduct environmental protection, free trade is not preferred.
Johnstone (2010)
• Market-based instruments can induce innovation and by encouraging potential innovators to allocate resources to identify the best way of achieving a given environmental objective, and policy flexibility can provide incentives for innovation.
Gallagher (2013)
• Technology transfer also occurs in the north-to-south-to-north, south-to-south, and south-to-north directions, and the ensuing innovation is no longer a local process, but rather happens on a global scale.
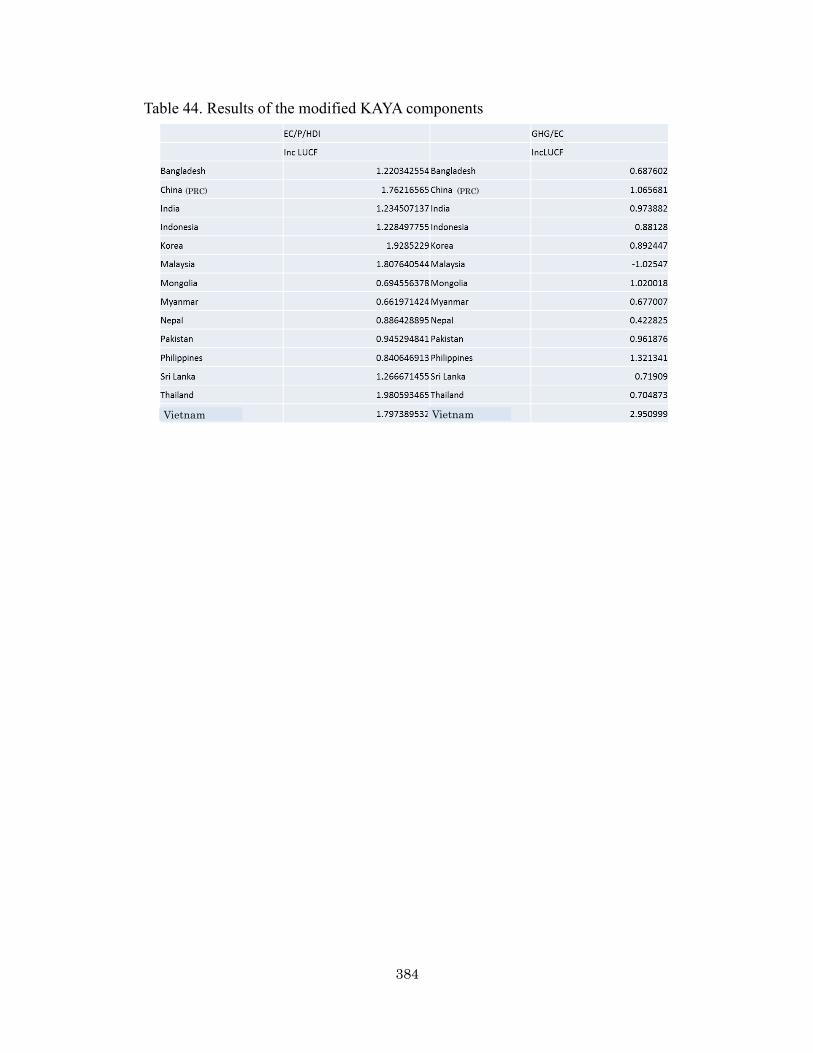
384
Table 44. Results of the modified KAYA components
(PRC)
Vietnam
Vietnam
(PRC)
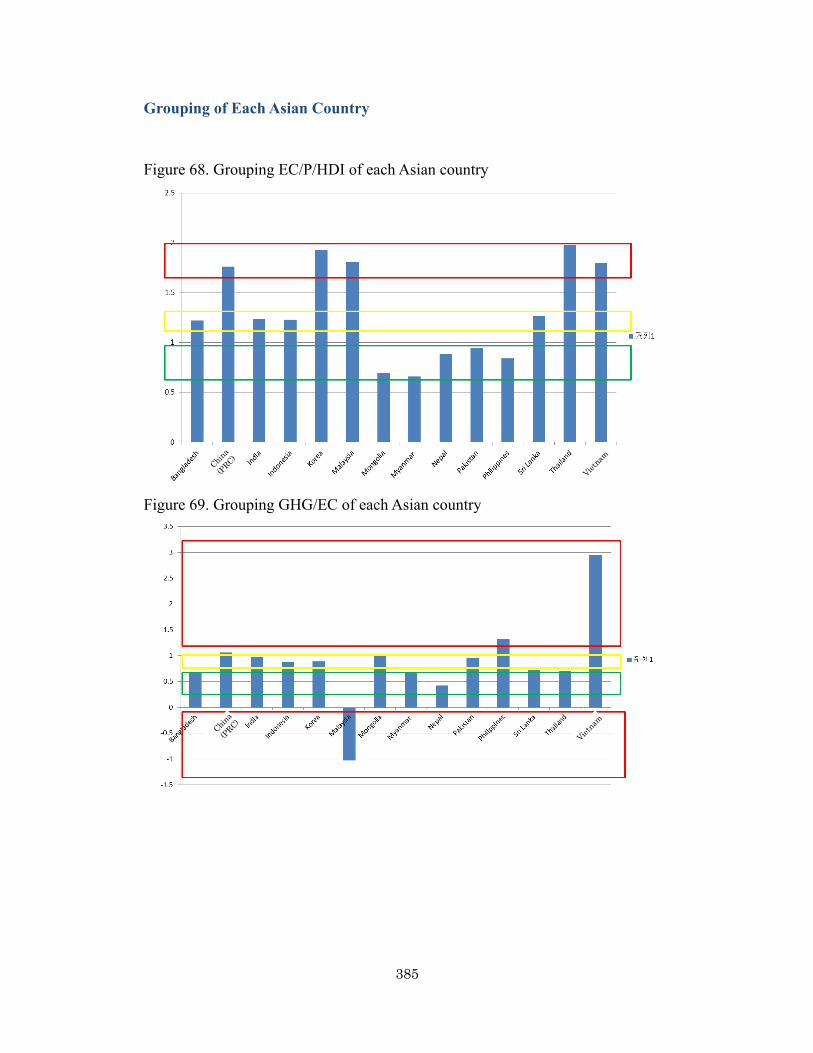
385
Grouping of Each Asian Country
Figure 68. Grouping EC/P/HDI of each Asian country
Figure 69. Grouping GHG/EC of each Asian country
China (PRC)
Vietnam
China (PRC)
Vietnam

386
Table 45. Summary of the groups and their orders EC/P/HDI GHG/EC
EFFECTIVE
2 Mongolia
EFFECTIVE
3 Bangladesh
1 Myanmar 2 Myanmar
4 Nepal 1 Nepal
5 Pakistan 5 Sri Lanka
3 Philippines 4 Thailand
MEDIOCRE
6 Bangladesh
MEDIOCRE
11 China
(PRC)
8 India 9 India
7 Indonesia 6 Indonesia
9 Sri Lanka 7 Korea
INEFFECTIVE
10 China
(PRC)
10 Mongolia
13 Korea 8 Pakistan
12 Malaysia INEFFECTIVE 14 Malaysia
14 Thailand 12 Philippines
11 Vietnam 13 Vietnam
Table 46. Each country’s result of modified KAYA components
EC/P/HDI GHG/EC
Nepal EFFECTIVE 4 EFFECTIVE 1
Myanmar EFFECTIVE 1 EFFECTIVE 2
Bangladesh MEDIOCRE 6 EFFECTIVE 3
Mongolia EFFECTIVE 2 MEDIOCRE 10
Vietnam INEFFECTIVE 11 INEFFECTIVE 13
China (PRC) INEFFECTIVE 10 MEDIOCRE 11
India MEDIOCRE 8 MEDIOCRE 9
Korea INEFFECTIVE 13 MEDIOCRE 7
Malaysia INEFFECTIVE 12 INEFFECTIVE 14
Thailand INEFFECTIVE 14 EFFECTIVE 4
Indonesia MEDIOCRE 7 MEDIOCRE 6
Pakistan EFFECTIVE 5 MEDIOCRE 8
Philippines EFFECTIVE 3 INEFFECTIVE 12
Sri Lanka MEDIOCRE 9 EFFECTIVE 5
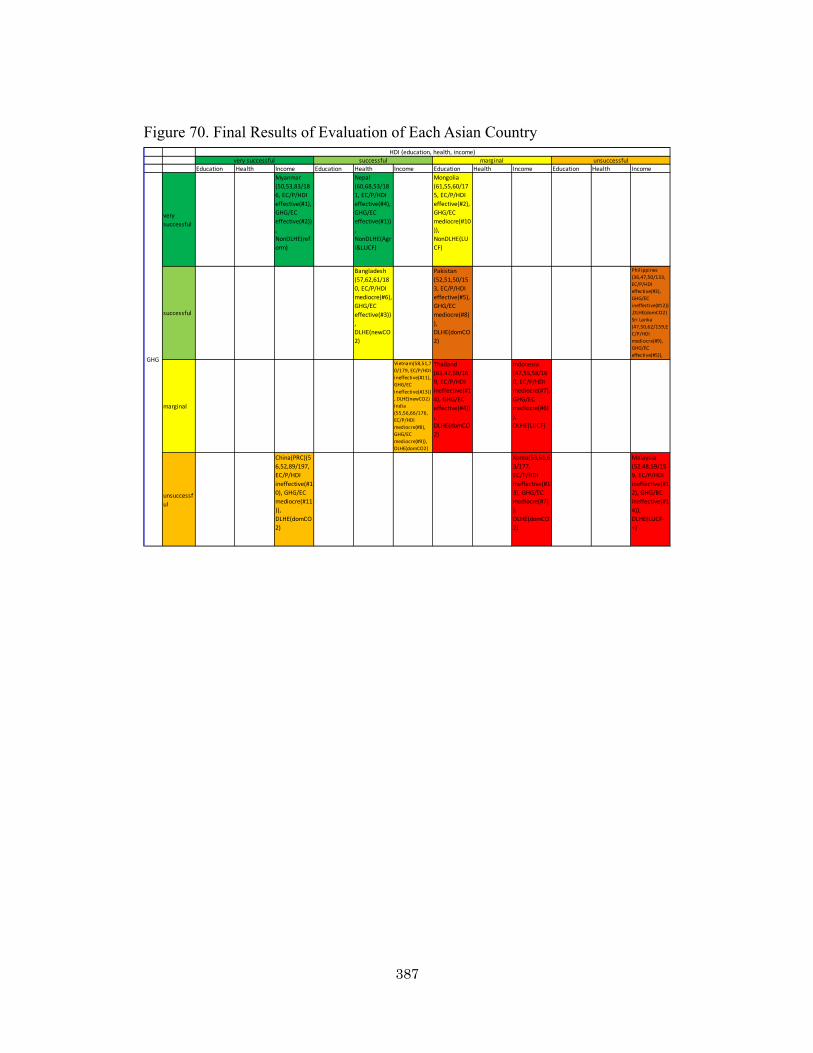
387
Figure 70. Final Results of Evaluation of Each Asian Country
Education Health Income Education Health Income Education Health Income Education Health Income
very successful
Myanmar (50,53,83/186, EC/P/HDI effective(#1), GHG/EC effective(#2)), NonDLHE(reform)
Nepal (60,68,53/181, EC/P/HDI effective(#4), GHG/EC effective(#1)), NonDLHE(Agri&LUCF)
Mongolia (61,55,60/175, EC/P/HDI effective(#2), GHG/EC mediocre(#10)), NonDLHE(LUCF)
successful
Bangladesh (57,62,61/180, EC/P/HDI mediocre(#6), GHG/EC effective(#3)), DLHE(newCO2)
Pakistan (52,51,50/153, EC/P/HDI effective(#5), GHG/EC mediocre(#8)), DLHE(domCO2)
Philippines (36,47,50/133, EC/P/HDI effective(#3), GHG/EC ineffective(#12)),DLHE(domCO2) Sri Lanka (47,50,62/159,EC/P/HDI mediocre(#9), GHG/EC effective(#5)), DLHE(yetCO2)
marginal
Vietnam(58,51,70/179, EC/P/HDI ineffective(#11), GHG/EC ineffective(#13)), DLHE(newCO2)India (55,56,66/176, EC/P/HDI mediocre(#8), GHG/EC mediocre(#9)), DLHE(domCO2)
Thailand (63,47,59/169, EC/P/HDI ineffective(#14), GHG/EC effective(#4)), DLHE(domCO2)
Indonesia (47,55,58/160, EC/P/HDI mediocre(#7), GHG/EC mediocre(#6)), DLHE(LUCF)
unsuccessful
China(PRC)(56,52,89/197, EC/P/HDI ineffective(#10), GHG/EC mediocre(#11)), DLHE(domCO2)
Korea(53,61,63/177, EC/P/HDI ineffective(#13), GHG/EC mediocre(#7)), DLHE(domCO2)
Malaysia (52,48,59/159, EC/P/HDI ineffective(#12), GHG/BC ineffective(#14)), DLHE(LUCF-+)
HDI (education, health, income)
GHG
very successful successful marginal unsuccessful

388
Appendix 11. Trajectory of HDI, KAYA Components and GHG (Myanmar)
Figure 71. Trajectory of HDI components (Myanmar)
Figure 72. Trajectory of Increased ratio of HDI components (Myanmar)
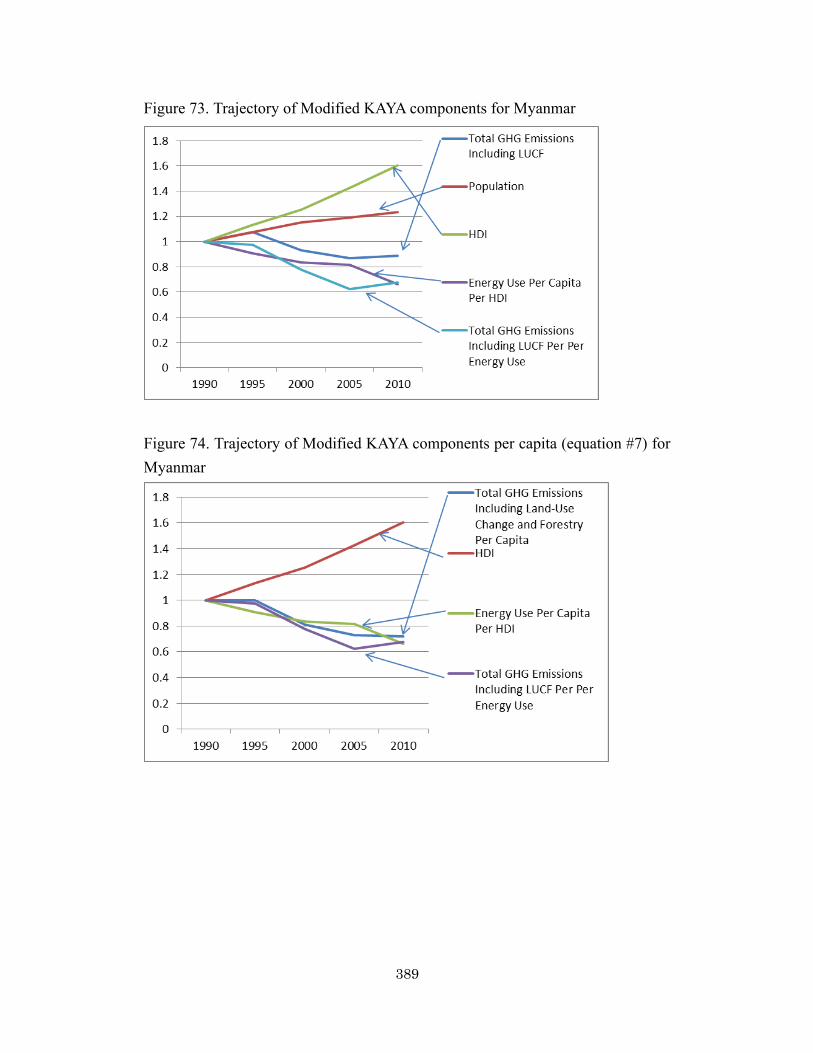
389
Figure 73. Trajectory of Modified KAYA components for Myanmar
Figure 74. Trajectory of Modified KAYA components per capita (equation #7) for Myanmar
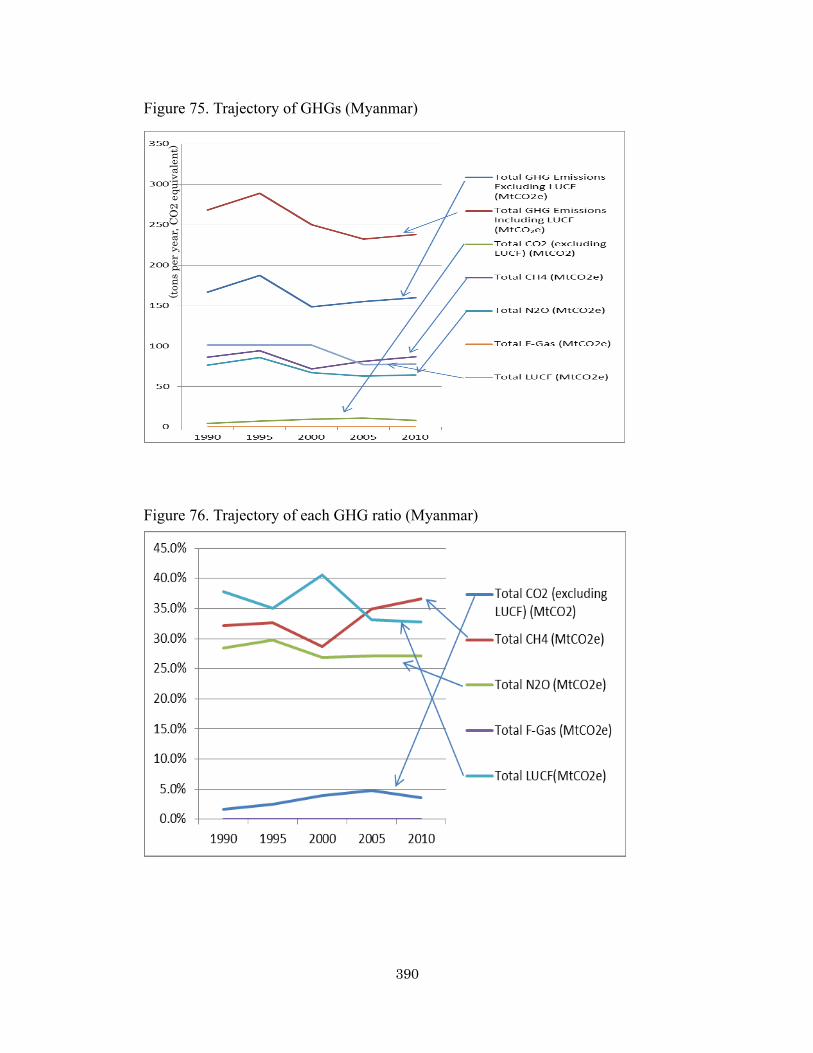
390
Figure 75. Trajectory of GHGs (Myanmar)
Figure 76. Trajectory of each GHG ratio (Myanmar)
(tons
per
yea
r, CO
2 eq
uiva
lent
)

391
Figure 77. Trajectory of GHG emissions by sources (Myanmar)
Figure 78. Trajectory of Ratio of GHG emissions by sources (Myanmar)
(tons
per
yea
r, CO
2 eq
uiva
lent
)

392
Appendix 12. Trajectory of HDI, KAYA Components and GHG (Nepal)
Figure 79. Trajectory of HDI components (Nepal)
Figure 80. Trajectory of Increased ratio of HDI components (Nepal)
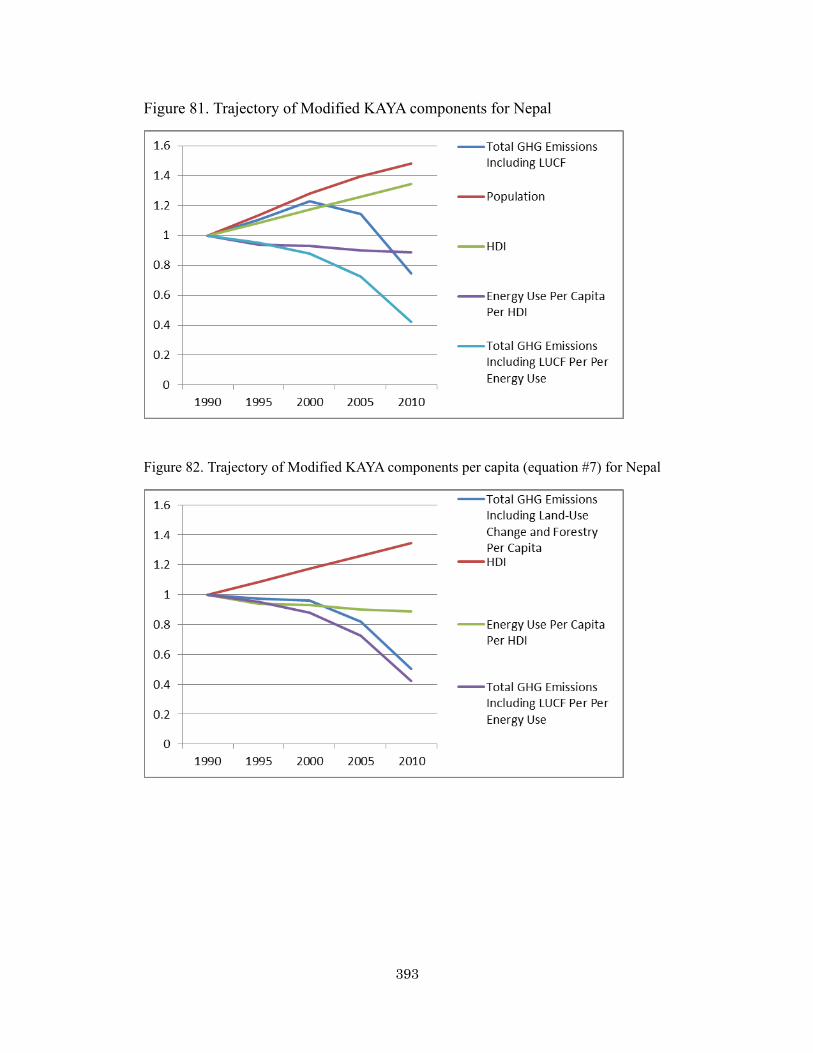
393
Figure 81. Trajectory of Modified KAYA components for Nepal
Figure 82. Trajectory of Modified KAYA components per capita (equation #7) for Nepal

394
Figure 83. Trajectory of Modified KAYA components for Nepal (excluding LUCF)
Figure 84. Trajectory of Modified KAYA components per capita (equation #7) for Nepal (excluding LUCF)

395
Figure 85. Trajectory of GHGs (Nepal)
(tons
per
yea
r, CO
2 eq
uiva
lent
)
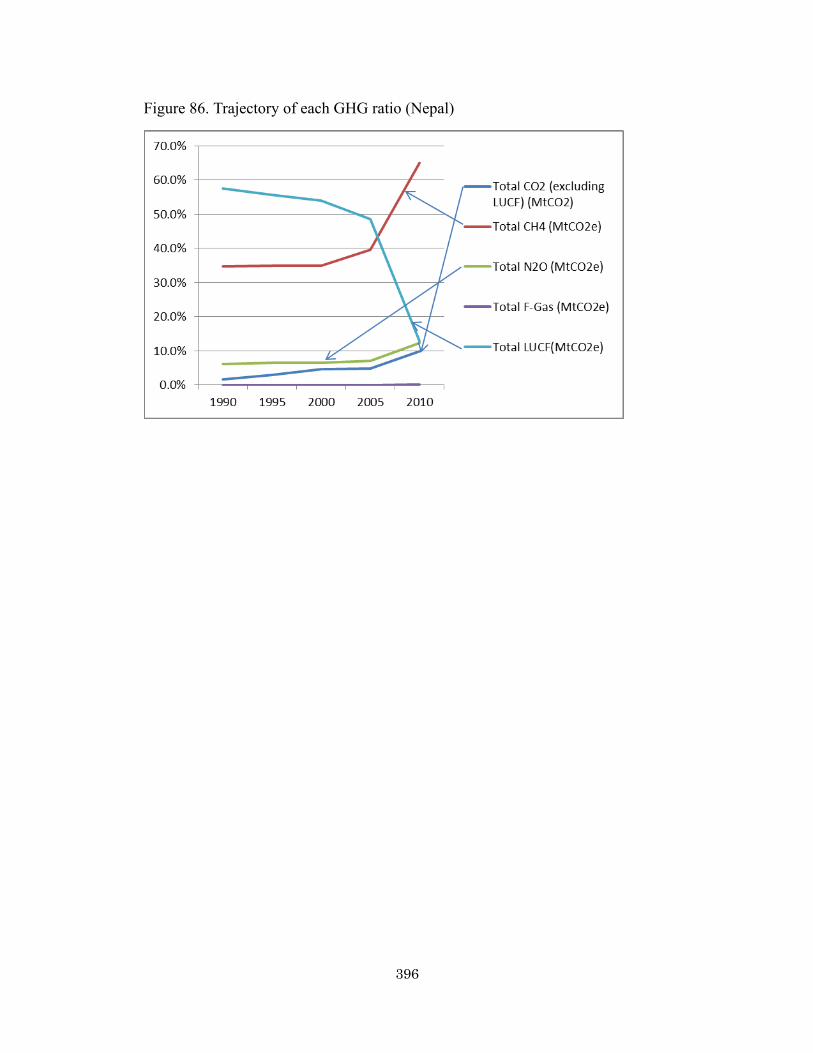
396
Figure 86. Trajectory of each GHG ratio (Nepal)
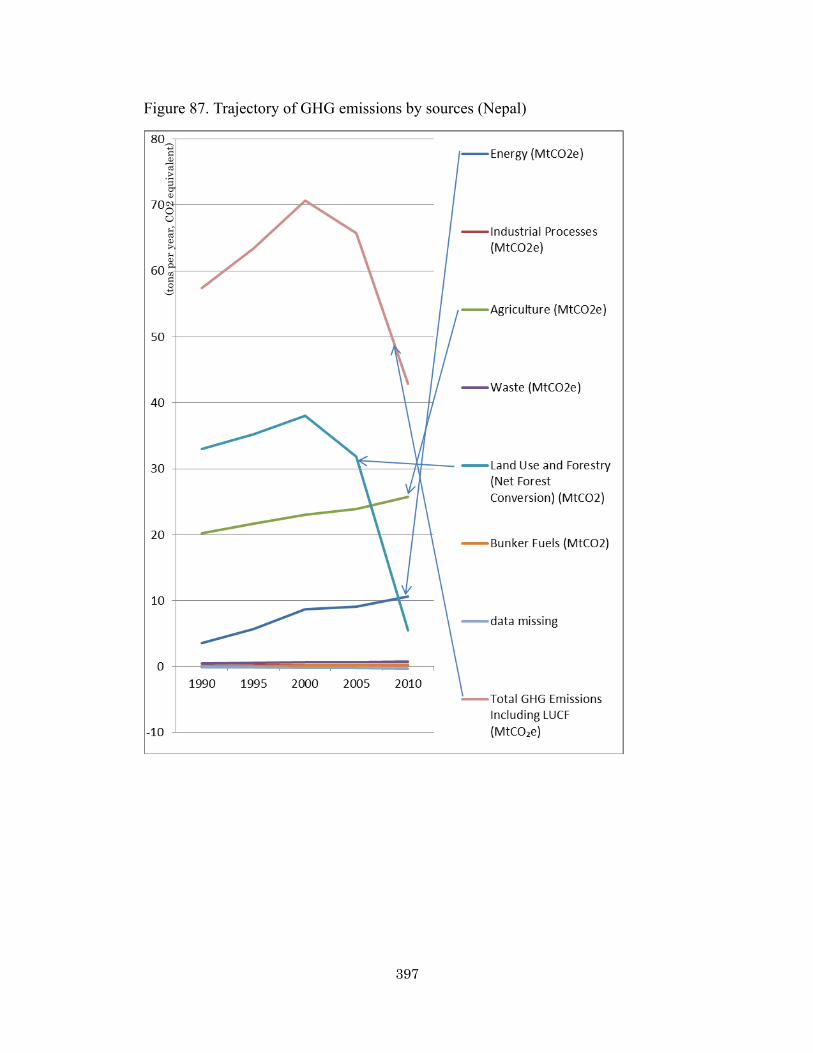
397
Figure 87. Trajectory of GHG emissions by sources (Nepal)
(tons
per
yea
r, CO
2 eq
uiva
lent
)
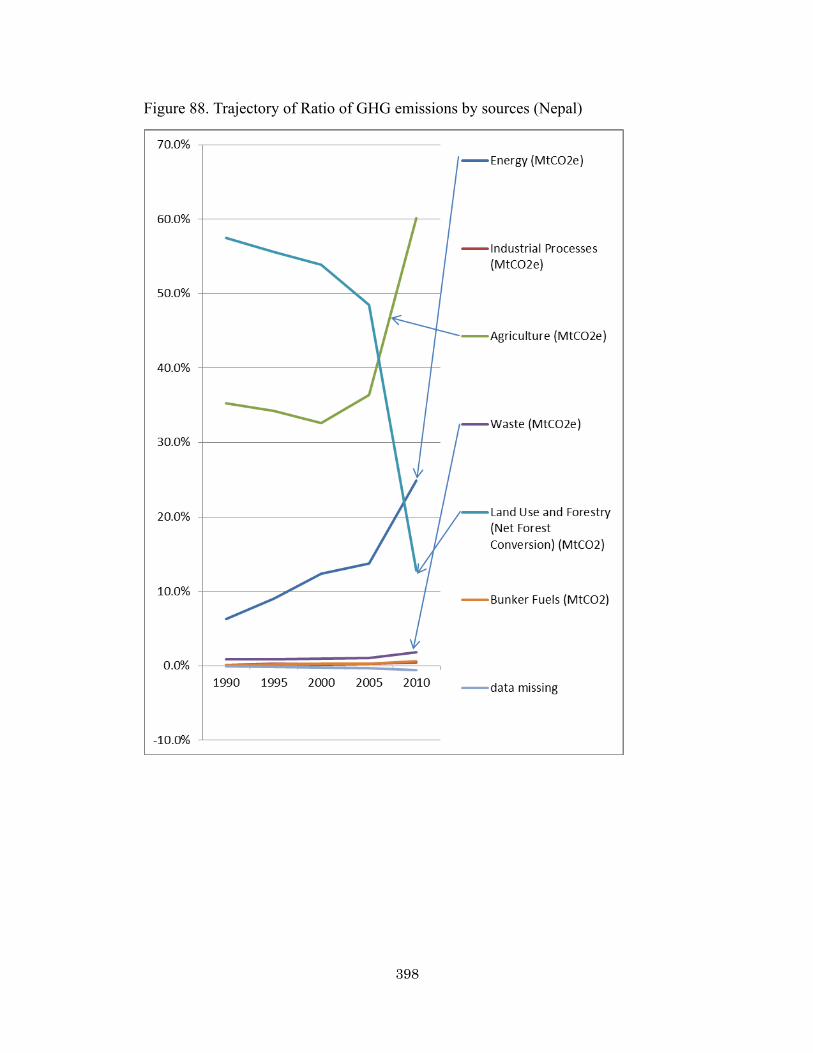
398
Figure 88. Trajectory of Ratio of GHG emissions by sources (Nepal)

399
Figure 89. Trajectory of GHG emissions from energy sector by sources (Nepal)
(tons
per
yea
r, CO
2 eq
uiva
lent
)

400
Appendix 13. Trajectory of KAYA Components and GHG (Mongolia)
Figure 90. Trajectory of GHGs (Mongolia)
(tons
per
yea
r, CO
2 eq
uiva
lent
)

401
Figure 91. Trajectory of each GHG ratio (Mongolia)
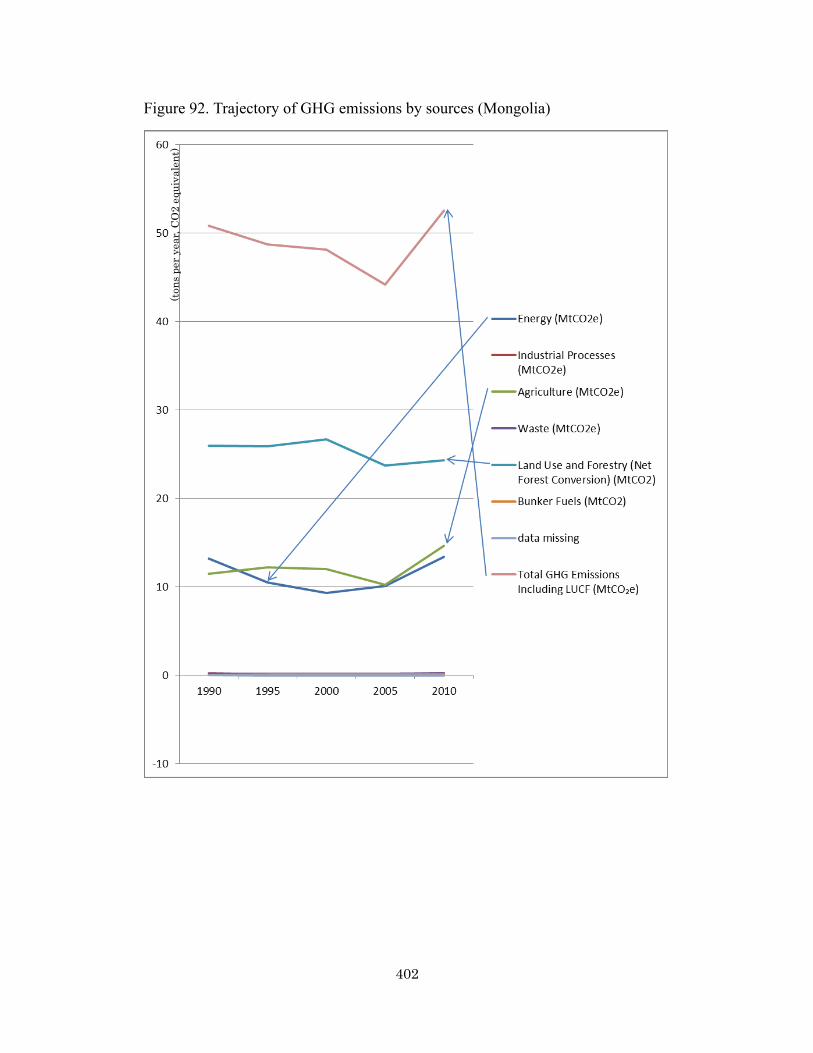
402
Figure 92. Trajectory of GHG emissions by sources (Mongolia)
(tons
per
yea
r, CO
2 eq
uiva
lent
)

403
Figure 93. Trajectory of Ratio of GHG emissions by sources (Mongolia)

404
Figure 94. Trajectory of GHG emissions from energy sector by sources (Mongolia)
(tons
per
yea
r, CO
2 eq
uiva
lent
)

405
Figure 95. Trajectory of Ratio of GHG emissions from energy sector by sources (Mongolia)

406
Figure 96. Trajectory of Modified KAYA components for Mongolia
Figure 97. Trajectory of Modified KAYA components per capita (equation #7) for Mongolia
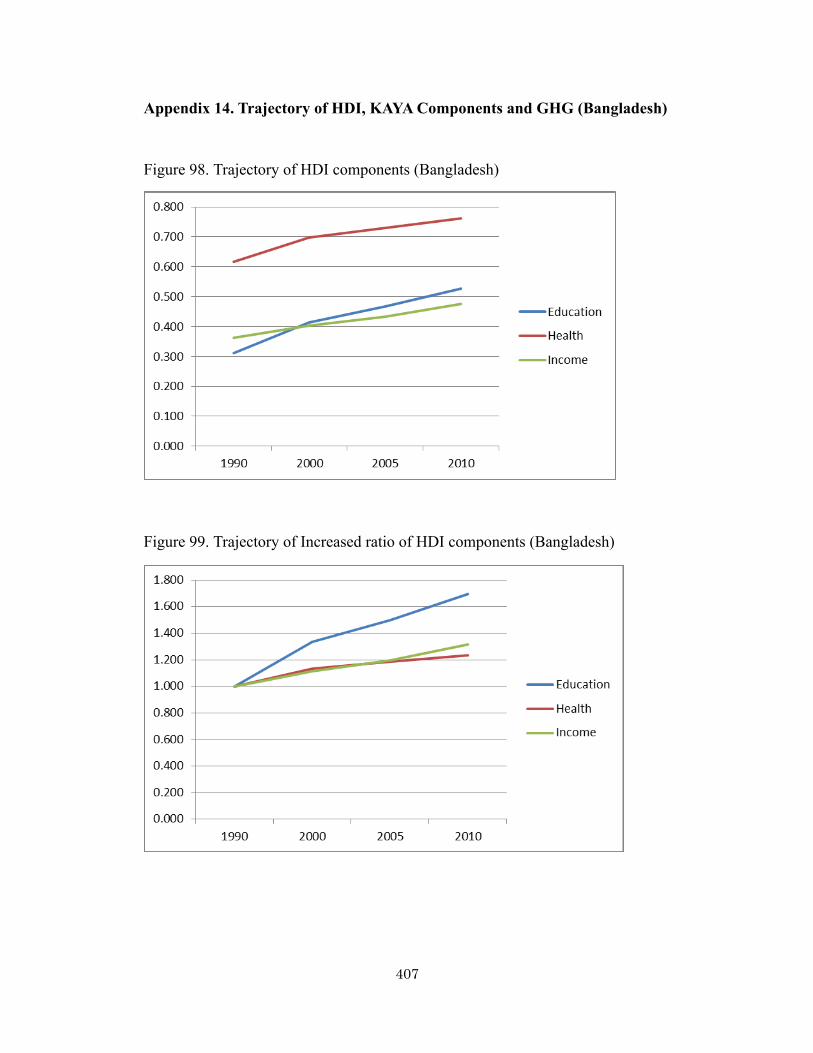
407
Appendix 14. Trajectory of HDI, KAYA Components and GHG (Bangladesh)
Figure 98. Trajectory of HDI components (Bangladesh)
Figure 99. Trajectory of Increased ratio of HDI components (Bangladesh)
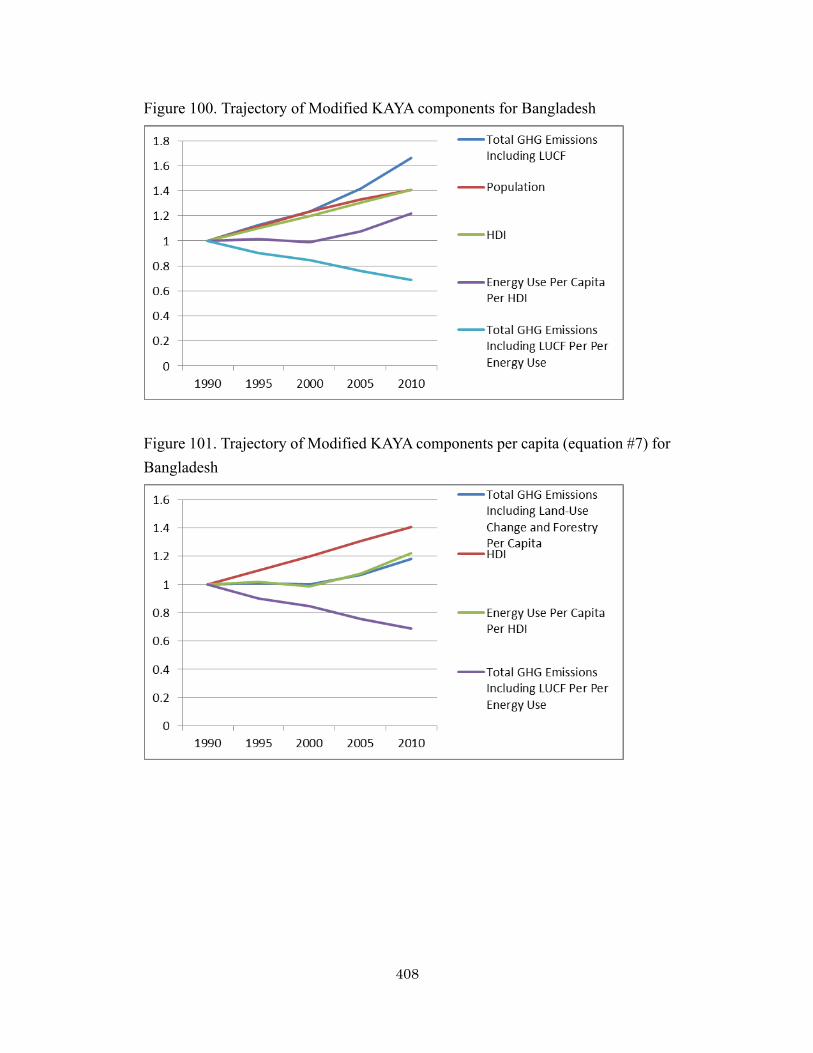
408
Figure 100. Trajectory of Modified KAYA components for Bangladesh
Figure 101. Trajectory of Modified KAYA components per capita (equation #7) for Bangladesh

409
Figure 102. Trajectory of GHGs (Bangladesh)
(tons
per
yea
r, CO
2 eq
uiva
lent
)

410
Figure 103. Trajectory of each GHG ratio (Bangladesh)

411
Figure 104. Trajectory of GHG emissions by sources (Bangladesh)
(tons
per
yea
r, CO
2 eq
uiva
lent
)

412
Figure 105. Trajectory of Ratio of GHG emissions from energy sector by sources (Bangladesh)

413
Appendix 15. Trajectory of KAYA Components and GHG (China (PRC))
Figure 106. Trajectory of Modified KAYA components for China (PRC)
Figure 107. Trajectory of Modified KAYA components per capita (equation #7) for China (PRC)

414
Figure 108. Trajectory of GHGs (China (PRC))
Figure 109. Trajectory of each GHG ratio (China (PRC))
(tons
per
yea
r, CO
2 eq
uiva
lent
)
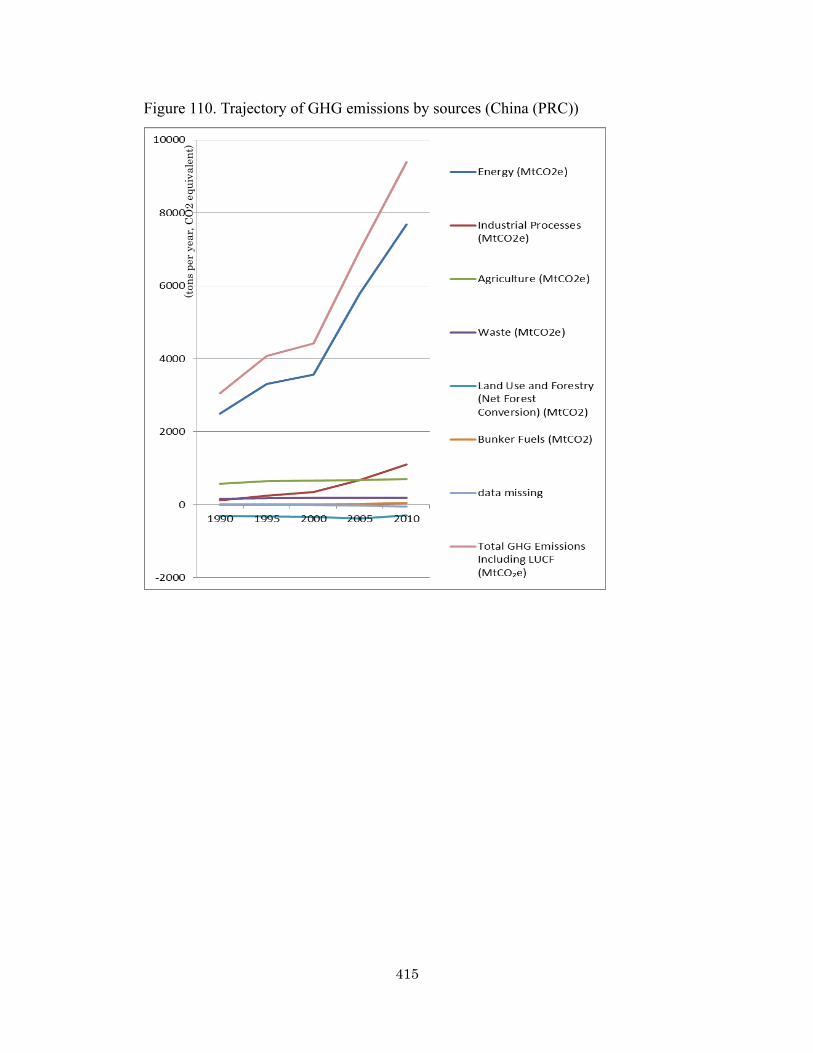
415
Figure 110. Trajectory of GHG emissions by sources (China (PRC))
(tons
per
yea
r, CO
2 eq
uiva
lent
)

416
Figure 111. Trajectory of Ratio of GHG emissions by sources (China (PRC))
Figure 112. Trajectory of GHG emissions from energy sector by sources (China (PRC))
(tons
per
yea
r, CO
2 eq
uiva
lent
) (to
ns p
er y
ear,
CO2
equi
vale
nt)
(tons
per
yea
r, CO
2 eq
uiva
lent
)

417
Figure 113. Trajectory of Ratio of GHG emissions from energy sector by sources (China (PRC)) Table 47. Myanmar, Mongolia, Pakistan and Philippines’ Successfulness
Countries Development Indicator
GHGpc EC/(P*HDI)
GHG/EC Type
Myanmar (very successful)
50,53,83/186 Very successful
Very successful
Effective Effective Reform
Mongolia (successful)
61,55,60/175 Marginal
Very successful
Effective Mediocre Non DLHE (LUCF)
Pakistan (unsuccessful by HDI)
52,51,50/153 Marginal
Successful Effective Mediocre DLHE (domCO2)
Philippines (unsuccessful by HDI)
36,47,50/133 Unsuccessful
Successful Effective Ineffective
DLHE(domCO2)
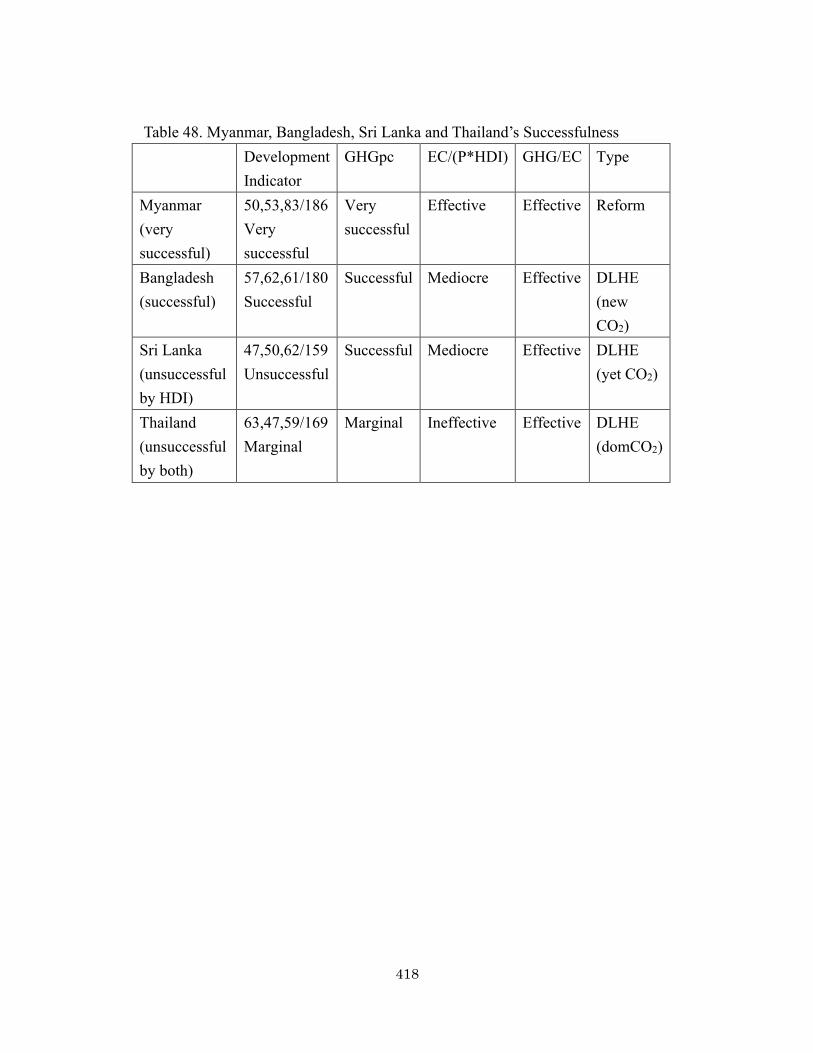
418
Table 48. Myanmar, Bangladesh, Sri Lanka and Thailand’s Successfulness
Development Indicator
GHGpc EC/(P*HDI) GHG/EC Type
Myanmar (very successful)
50,53,83/186 Very successful
Very successful
Effective Effective Reform
Bangladesh (successful)
57,62,61/180 Successful
Successful Mediocre Effective DLHE (new CO2)
Sri Lanka (unsuccessful by HDI)
47,50,62/159 Unsuccessful
Successful Mediocre Effective DLHE (yet CO2)
Thailand (unsuccessful by both)
63,47,59/169 Marginal
Marginal Ineffective Effective DLHE (domCO2)

419
Figure 114. Myanmar’s trajectory divided into 6 periods2
2 20170227 BBC News Myanmar profile – Timeline http://www.bbc.com/news/world-asia-pacific-12992883
Period #0 (before 1990)
Period #1 (1990-1994)
Period #2 (1995-1999)
Period #3 (2000-2004)
Period #4 (2005-2010)
Period #5 (after 2010)

420
Appendix 16. Myanmar Timeline
Period #0 (Country’s situation before 1990)
1962 - Military coup, forming a single-party state with the Socialist Programme
Party as the sole political party, and banning independent newspapers.
1987 - Currency devaluation wipes out many people's savings and triggers anti-
government riots.
1988 - Thousands of people are killed in anti-government riots.
1989 - Slorc declares martial law, arrests thousands of people. NLD leader Aung
San Suu Kyi, the daughter of Aung San, is put under house arrest.
Period #1
1990 - Opposition National League for Democracy (NLD) wins landslide victory
in general election.
1991 - Aung San Suu Kyi awarded Nobel Peace Prize for her commitment to
peaceful change
Period #2
1995 - Aung San Suu Kyi is released from house arrest after six years.
1997 - Admitted to Association of South East Asian Nations (ASEAN).
1998 - 300 NLD members released from prison
421
Period #3
2000 - Ruling council lifts restrictions on movements of Aung San Suu Kyi and
senior NLD members.
2002 - Pro-democracy leader Aung San Suu Kyi released after nearly 20 months of
house arrest. Aung San Suu Kyi taken into "protective custody" after clashes
between her supporters and those of government.
2003 - Five senior NLD leaders released from house arrest after visit of UN human
rights envoy.
2004 - Government and Karen National Union - most significant ethnic group
fighting government - agree to end hostilities. Constitutional convention begins,
despite boycott by National League for Democracy (NLD) whose leader Aung San
Suu Kyi remains under house arrest.
Period #4
2007 - Aung San Suu Kyi's house arrest is extended for another year. The
International Committee of the Red Cross accuses the government of abusing the
Myanmar people's rights. UN envoy Ibrahim Gambari meets opposition leader
Aung San Suu Kyi. UN Security Council deplores military crackdown on peaceful
protesters.
422
2008 - A series of bomb blasts hits the country. Cyclone Nargis hits the low-lying
Irrawaddy delta. Some estimates put the death toll as high as 134,000. Government
insists it can cope with cyclone aftermath without foreign help.
2009 - UN envoy Ibrahim Gambari meets opposition leader Aung San Suu Kyi.
The EU extends the 2006 sanctions for another year but adds that they can be
reviewed in the event of moves towards democracy. UN and aid agencies say
hundreds of thousands in the Irrawaddy Delta still need assistance a year after
Cyclone Nargis. The UN says Myanmar now allows it to bring in all the staff it
needs. Aung San Suu Kyi is convicted of breaching conditions of her house arrest,
following visit by an uninvited US national. The initial sentence of three years'
imprisonment is commuted to 18 months' house arrest. US Secretary of State
Hillary Clinton announces plans for engagement with military rulers. Aung San
Suu Kyi begins talks with Myanmar's military leaders and she was allowed to meet
Western diplomats. Main military-backed party, the Union Solidarity and
Development Party (USDP), claims resounding victory in first election for 20 years.
Opposition groups allege widespread fraud and the election is widely condemned
as a sham. The junta says the election marks the transition from military rule to a
civilian democracy. A week after the election, Aung San Suu Kyi - who had been
423
prevented from taking part - is released from house arrest.
Period #5
2011 - Government authorizes internet connection for Aung San Suu Kyi. Thein
Sein is sworn in as president of a new, nominally civilian government. President
Thein Sein meets Pro-democracy leader Aung San Suu Kyi. She says she will stand
for election to parliament. US Secretary of State Hillary Clinton visits, meets Aung
San Suu Kyi and holds talks with President Thein Sein. US offers to improve
relations if democratic reforms continue. President Thein Sein signs law allowing
peaceful demonstrations for the first time; NLD re-registers as a political party in
advance of by-elections for parliament due to be held early in 2012. Burmese
authorities agree truce deal with rebels of Shan ethnic group and orders military to
stop operations against ethnic Kachin rebels.
2012 - NLD candidates sweep the board in parliamentary by-elections, with Aung
San Suu Kyi elected. The European Union suspends all non-military sanctions
against Burma for a year. Manmohan Singh pays first official visit by an Indian
prime minister since 1987. Myanmar abolishes pre-publication media censorship.
In a major cabinet reshuffle, President Thein Sein replaces hard-liner Information
Minister Kyaw Hsan with moderate Aung Kyi, the military's negotiator with
424
opposition leader Aung San Suu Kyi. President Thein Sein tells the BBC he would
accept opposition leader Aung San Suu Kyi as president if she were elected.
Visiting European Commission chief Jose Manuel Barroso offers Myanmar more
than $100m in development aid. US President Barack Obama visits to offer "the
hand of friendship" in return for more reforms. He urges reconciliation with the
Rohingya minority.
2013 - Four private daily newspapers appear for the first time in almost 50 years as
the state monopoly ends. President Thein Sein visits Washington. President Obama
praises Myanmar's political and economic progress but criticizes violence against
Rohingya Muslims.
2014 - US extends some sanctions for another year, saying that despite the recent
reforms, rights abuses and army influence on politics and the economy persist.
2015 - A draft ceasefire agreement is signed between the government and 16 rebel
groups. Floods affect much of low-lying parts of country, killing 100 people and
displacing a million others. Opposition National League for Democracy - led by
Aung San Suu Kyi - wins enough seats in parliamentary elections to form a
government. Htin Kyaw sworn in as president, ushering in a new era as Aung San
Suu Kyi's democracy movement takes power after 50 years of military domination.

425
Table 49. Myanmar Timeline Period #0 Period #1 Period #2 Period #3 Period #4 Period #5
Political
Stability
No Indication Indication Transition Transition Beginning
Peace No No No No No Indication
Foreign Aid 1 0.43 0.19 0.34 0.82 -
Kyoto
protocol
Ratification/
Acceptance
13 August
2003
Forestry
Policy3
The Forest
Law 1992
Myanmar
Forest
Policy,
Forest
Rules,
Communit
y Forestry
Instructio
n 1995
3 “REDD Country Report”. REDD Research and Development Center. April 4, 2016. https://www.ffpri.affrc.go.jp/reddrdc/ja/redd/_trends_2014/04_country_report_myanmar.pdf#search=%27%E3%83%9F%E3%83%A3%E3%83%B3%E3%83%9E%E3%83%BC+%E6%A3%AE%E6%9E%97%E6%94%BF%E7%AD%96%27.

426
Table 50. Net ODA received per capita (current US$) during each period being compared with the total received during the period of 1986-904 86 90 91 95 96 00 01 05 06 10 Afghanistan 1 2.77768 1.263779 10.38338 27.17271 Bangladesh 1 0.831339 0.533822 0.511628 0.590508 China (PRC) 1 1.625289 1.178342 0.801531 0.589637 Indonesia 1 1.114622 0.824528 0.803282 0.612493 India 1 1.098329 0.7513 0.594359 0.815797 Lao PDR 1 1.895174 2.516942 2.142071 2.93457 Sri Lanka 1 1.051383 0.526288 0.866264 0.934764 Myanmar 1 0.427589 0.19404 0.342068 0.821948 Mongolia 1 19.20264 28.56587 28.65286 31.76899 Malaysia 1 0.53839 -0.20818 0.303312 0.3746 Nepal 1 0.952394 0.765151 0.734322 1.169099 Pakistan 1 0.924026 0.608814 1.005512 1.314235 Korea, Rep. 1 -0.3672 -3.63837 0 0 Philippines 1 1.210989 0.603218 0.451566 0.296581 Thailand 1 1.109517 1.184659 -0.13863 -0.34957 Vietnam 1 3.171311 6.578152 8.186502 12.744
4 “World Bank Indicator – Net ODA received per capita (current US$).” World Bank. January 11,
2015. https://data.worldbank.org/indicator/DT.ODA.ODAT.PC.ZS?view=chart.

427
Figure 115. Nepal’s trajectory divided into 6 periods
Period #0 (before 1990)
Period #1 (1990-1994)
Period #2 (1995-1999)
Period #3 (2000-2004)
Period #4 (2005-2010)
Period #5 (after 2010)

428
Appendix 17. Nepal Timeline
Period #0
1955 - Nepal joins the United Nations.
1955 - King Tribhuwan dies, King Mahendra ascends throne.
1959 - Multi-party constitution adopted.
1960 - King Mahendra seizes control and suspends parliament, constitution and
party politics after Nepali Congress Party (NCP) wins elections with B. P. Koirala
as premier.
1962 - New constitution provides for non-party system of councils known as
"panchayat" under which king exercises sole power. First elections to Rastrya
Panchayat held in 1963.
1972 - King Mahendra dies, succeeded by Birendra.
1980 - Constitutional referendum follows agitation for reform. Small majority
favors keeping existing panchayat system. King agrees to allow direct elections to
national assembly - but on a non-party basis.
1985 - NCP begins civil disobedience campaign for restoration of multi-party
system.
1986 - New elections boycotted by NCP.

429
Period #1
1990 - Pro-democracy agitation coordinated by NCP and leftist groups. Street
protests suppressed by security forces resulting in deaths and mass arrests. King
Birendra eventually bows to pressure and agrees to new democratic constitution.
1991 - Nepali Congress Party wins first democratic elections. Girija Prasad Koirala
becomes prime minister.
1994 - Koirala's government defeated in no-confidence motion. New elections lead
to formation of Communist government.
Period #2
1995 - Communist government dissolved. Start of Maoist revolt which drags on for
more than a decade and kills thousands. The rebels want the monarchy to be
abolished.
1997 - Prime Minister Sher Bahadur Deuba loses no-confidence vote, ushering in
period of increased political instability, with frequent changes of prime minister.
Period #3
2001 – On June 1st, Crown Prince Dipendra kills King Birendra, Queen Aishwarya
and several members of the royal family, before shooting himself. The king's
brother, Gyanendra is crowned king. In July, Maoist rebels step up campaign of
430
violence. Prime Minister GP Koirala quits over the violence; succeeded by Sher
Bahadur Deuba. In November, Maoists end four-month old truce with government,
declare peace talks with government failed. Launch coordinated attacks on army
and police posts. In November, state of emergency declared after more than 100
people are killed in four days of violence. King Gyanendra orders army to crush the
Maoist rebels. Many hundreds are killed in rebel and government operations in the
following months.
2002 - Parliament dissolved, fresh elections called amid political confrontation over
extending the state of emergency. Sher Bahadur Deuba heads interim government,
renews emergency.
2003 – In January, rebels, government declare ceasefire. In August, rebels pull out
of peace talks with government and end seven-month truce. The following months
see resurgence of violence and frequent clashes between students/activists and
police.
2004 - Nepal joins the World Trade Organisation (WTO). Street protests by
opposition groups demanding a return to democracy. Royalist Prime Minister Surya
Bahadur Thapa quits.
Period #4

431
2005 – In February, King Gyanendra dismisses the government, restores an
absolute monarchy and declares a state of emergency, citing the need to defeat
Maoist rebels. But in April, King Gyanendra bows to international pressure, lifts
the state of emergency and reinstates parliament. In November, Maoist rebels and
main opposition parties agree on a programme intended to restore democracy.
2006 – In April, King Gyanendra agrees to reinstate parliament following weeks of
violent strikes and protests against direct royal rule. Maoist rebels call a three-
month ceasefire. Then in May, Parliament votes unanimously to curb the king's
political powers. The government holds peace talks with the Maoist rebels. In
November, the government signs a peace deal with the Maoists - the
Comprehensive Peace Agreement (CPA) - formally ending the decade-long
insurgency.
2007 – In January, Maoist leaders enter parliament under the terms of a temporary
constitution. In April, Maoists join an interim government, a move which brings
them into the political mainstream. In September, Maoists quit the interim
government, demanding the abolition of the monarchy. November's constituent
assembly elections are postponed. In December, Parliament approves the abolition
of monarchy as part of peace deal with Maoists, who agree to rejoin government.
432
2008 –In April, former Maoist rebels win the largest bloc of seats in elections to the
new Constituent Assembly (CA) but fail to achieve an outright majority. In May,
Nepal becomes a republic. In July, Ram Baran Yadav becomes Nepal's first
president. In August, Maoist leader Pushpa Kamal Dahal aka Prachanda forms
coalition government, with Nepali Congress going into opposition.
2009 - Prime Minister Prachanda resigns following a row with President Yadav
over the integration of former rebel fighters into the military.
Period #5
2011 - UN ends its peace monitoring mission.
2012 - The Constituent Assembly (CA) is dissolved after failing to produce a draft
constitution.
2013 - The left-wing Nepali Congress wins the second Constituent Assembly
elections, pushing the former ruling Maoists into third place and leaving no party
with a majority.
2014 - Nepal and India sign a deal to build a $1bn hydropower plant on Nepal's
Arun river to counter crippling energy shortages.
2015 - A 7.8-magnitude earthquake strikes Kathmandu and its surrounding areas
killing more than 8,000 people, causing mass devastation and leaving millions
433
homeless. Parliament passes a landmark constitution, which defines Nepal as a
secular country, despite calls to delay voting after more than 40 people are killed in
protests.
2016 - Government lifts fuel rationing after the ethnic minority Madhesi
communities, partially backed by India, end a six-month border blockade in protest
over the new constitution which they say is discriminatory. Maoist party pulls out
of the governing coalition. Prime Minister K.P. Oli resigns ahead of a no-confidence
vote in parliament. Parliament elects former communist rebel leader and Maoist
party leader Pushpa Kamal Dahal aka Prachanda as prime minister for the second
time.
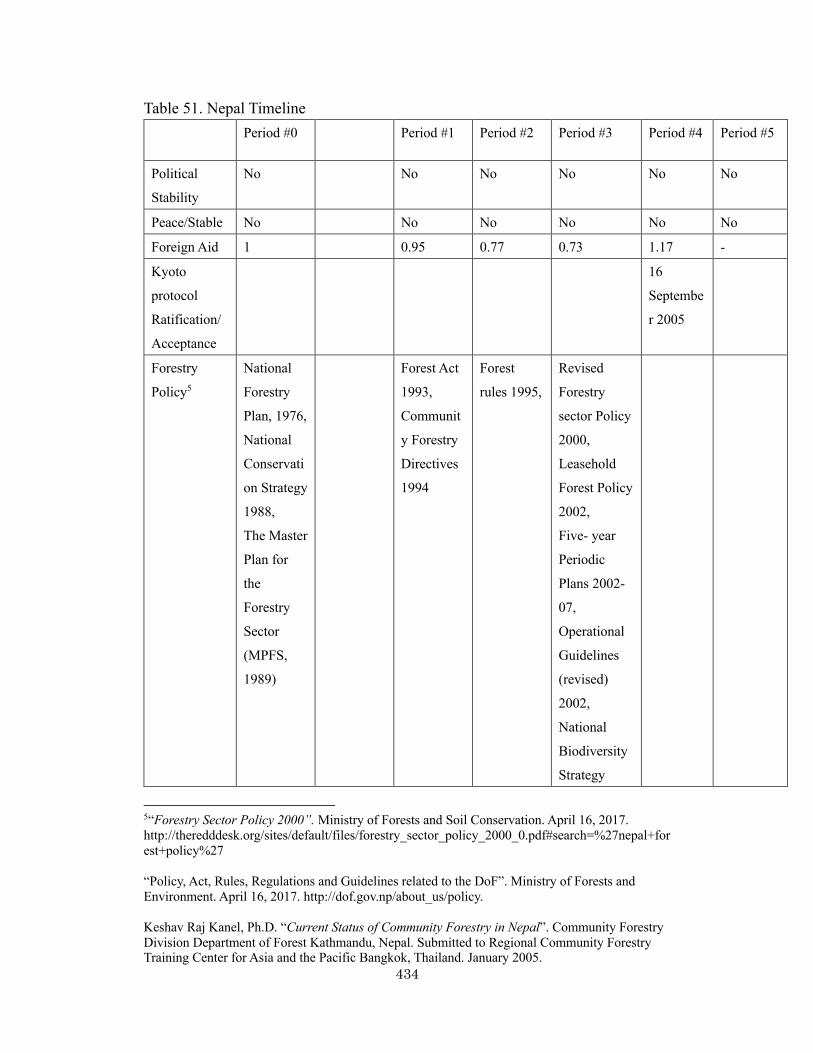
434
Table 51. Nepal Timeline Period #0 Period #1 Period #2 Period #3 Period #4 Period #5
Political
Stability
No No No No No No
Peace/Stable No No No No No No
Foreign Aid 1 0.95 0.77 0.73 1.17 -
Kyoto
protocol
Ratification/
Acceptance
16
Septembe
r 2005
Forestry
Policy5
National
Forestry
Plan, 1976,
National
Conservati
on Strategy
1988,
The Master
Plan for
the
Forestry
Sector
(MPFS,
1989)
Forest Act
1993,
Communit
y Forestry
Directives
1994
Forest
rules 1995,
Revised
Forestry
sector Policy
2000,
Leasehold
Forest Policy
2002,
Five- year
Periodic
Plans 2002-
07,
Operational
Guidelines
(revised)
2002,
National
Biodiversity
Strategy
5“Forestry Sector Policy 2000”. Ministry of Forests and Soil Conservation. April 16, 2017. http://theredddesk.org/sites/default/files/forestry_sector_policy_2000_0.pdf#search=%27nepal+forest+policy%27 “Policy, Act, Rules, Regulations and Guidelines related to the DoF”. Ministry of Forests and Environment. April 16, 2017. http://dof.gov.np/about_us/policy. Keshav Raj Kanel, Ph.D. “Current Status of Community Forestry in Nepal”. Community Forestry Division Department of Forest Kathmandu, Nepal. Submitted to Regional Community Forestry Training Center for Asia and the Pacific Bangkok, Thailand. January 2005.
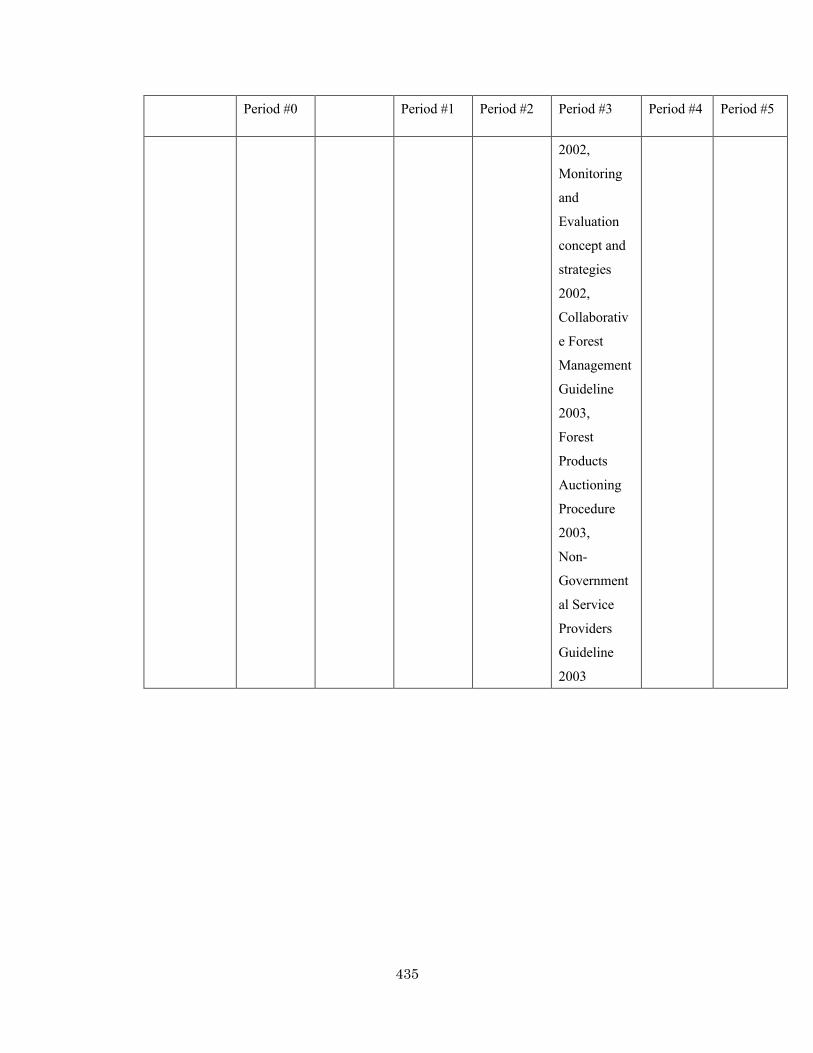
435
Period #0 Period #1 Period #2 Period #3 Period #4 Period #5
2002,
Monitoring
and
Evaluation
concept and
strategies
2002,
Collaborativ
e Forest
Management
Guideline
2003,
Forest
Products
Auctioning
Procedure
2003,
Non-
Government
al Service
Providers
Guideline
2003

436
Figure 116. Mongolia’s trajectory divided into 6 periods
Period #0 (before 1990)
Period #1 (1990-1994)
Period #2 (1995-1999)
Period #3 (2000-2004)
Period #4 (2005-2010)
Period #5 (after 2010)

437
Appendix 18. Mongolia Timeline
Period #0
1924 - The People's Party chooses Lenin's "road to socialism bypassing capitalism"
and renames itself the Mongolian People's Revolutionary Party (MPRP). The
Mongolian People's Republic is proclaimed.
1961-63 - UN Security Council approves Mongolia's UN membership. Diplomatic
relations established with the UK.
1966 - Soviet Communist Party General-Secretary Brezhnev signs a friendship
treaty in Ulan Bator allowing secret stationing of Soviet troops in Mongolia.
1973-81 - Mongolia accuses China (PRC) of planning annexation, protests against
Chinese leaders' call for withdrawal of Soviet troops, accuses China (PRC) of
"aggressive intentions" and expels some Chinese residents.
1984 - "Mongolia's Brezhnev", party General-Secretary Tsedenbal, head of state
since 1974, is forced out of office by the MPRP Politburo.
1986 - Gorbachev's Vladivostok speech opens the way to detente with China (PRC)
and the withdrawal of Soviet troops from Mongolia.
Period #1
1990 - Street demonstrations force resignation of the MPRP Politburo. Political
438
parties are legalized. Elections to the Great Hural (parliament) are won by the
MPRP, but 19 of the 50 seats in a new standing legislature go to non-communists.
1992 - Mongolia's new constitution gives first place to human rights and freedoms.
In the first democratic elections the MPRP wins 71 of the 76 seats in the new single-
chamber Great Hural.
1993 - The first direct presidential elections are won by Ochirbat, nominated by the
National and Social Democrats.
Period #2
1996 - The National and Social Democrats win 50 seats in the Great Hural elections,
but the MPRP can deny a quorum, hindering passage of legislation.
1997 - MPRP candidate Bagabandi wins presidential election.
2000 - After the democrats form three new governments in two years the MPRP
wins 72 seats in the Great Hural elections. The National and Social Democrats and
three other parties form a new Democratic Party.
Period #3
2001 - UN launches appeal for $8.7m (£6m) to support herders suffering in worst
winter conditions in more than 50 years. IMF approves nearly $40 million in low-
interest loans over next three years to help tackle poverty and boost economic

439
growth.
2004 - Russia writes off all but $300 million of Mongolia's debts.
2004 June-August - Parliamentary elections, in which the opposition performs
strongly, result in political deadlock over contested results. Tsakhiagiin Elbegdorj
is eventually appointed as prime minister following power-sharing deal.
Period #4
2005 - Protesters in the capital demand the government's resignation and an end to
poverty and official corruption. MPRP candidate Nambaryn Enkhbayar wins
presidential election.
2006 - Coalition government headed by Tsakhiagiin Elbegdorj falls after the MPRP
pulls out, blaming the leadership for slow economic growth. Parliament chooses
MPRP's Miyeegombo Enkhbold as the new prime minister.
2007 - Prime Minister Miyeegombo Enkhbold resigns. He is replaced by MPRP
leader Sanjagiin Bayar.
2008 - President Enkhbayar declares a state of emergency to quell riots in the capital
which left five dead and hundreds injured. Violence erupted after the opposition
accused the governing party of rigging elections.
2009 - Former Prime Minister and candidate of the opposition Democratic Party,
440
Tsakhiagiin Elbegdorj, wins presidential election, defeating incumbent Nambaryn
Enkhbayar by a narrow margin. Governing MPRP says it accepts the result. In
October Prime Minister Sanjagiin Bayar of the MPRP resigns for health reasons.
Foreign Minister Sukhbaataryn Batbold succeeds him.
2010 - Extreme cold kills so much livestock that the United Nations launches a
programme to pay herders to clean and collect carcasses. This will help maintain
living standards while disposing of possible sources of disease. PM Sukhbaataryn
Batbold takes over as head of governing MPRP from former PM Sanjagiin Bayar.
In November, controversy as Mongolian People's Revolutionary Party reverts to
Communist-era name of Mongolian People's Party. Ex-President Nambaryn
Enkhbayar sets up small breakaway Mongolian People's Revolutionary Party.
Period #5
2011 - Mongolia selects the US Peabody Energy, China (PRC)'s Shenhua and a
Russian-Mongolian consortium as partners to develop the highly sought-after
Tavan Tolgoi coal deposit in the Gobi desert. (2012 April - Mongolia puts Tavan
Tolgoi coal mine deal on hold while it decides whether to go it alone on developing
the project.) Mongolia and Rio Tinto-owned Ivanhoe Mines reach agreement on
stockholding in the massive Oyu Tolgoi copper mine. Mongolia settles for a 34%

441
share, as previously agreed, dropping demands for parity. (2013 August - Mining
giant Rio Tinto says it will lay off up to 1,700 workers at the massive Oyu Tolgoi
mine in Mongolia following a dispute with the government.)
2012 - Parliamentary elections. Democratic Party wins most seats and goes on to
form a coalition with the Mongolian People's Revolutionary Party, but in December,
Mongolian People's Revolutionary Party threatens to leave governing coalition in
protest at its former leader Enkhbayar's jail sentence.
2013 - Tsakhiagiin Elbegdorj, from the Democratic Party, wins a second term as
president.
2014 - Prime Minister Norov Altankhuyag is dismissed by a vote of parliament. He
had been under fire for alleged corruption and economic underperformance.
Parliament elects Chimed Saikhanbileg as prime minister in a vote boycotted by
the opposition Mongolian People's Party.
2015 - The opposition Mongolian People's Party agrees to form a coalition
government with the Democratic Party and the Justice Coalition. Prime Minister
Chimed Saikhanbileg removes the Mongolian People's Party from the coalition
government by dismissing six of its ministers.
2016 - Opposition Mongolian People's Party scores a landslide victory in the

442
parliamentary election winning 65 out of 76 seats. Prime Minister Chimed
Saikhanbileg is among the Democratic Party incumbents who fail to win re-election.
Table 52. Mongolia Timeline Period #0 Period #1 Period #2 Period #3 Period #4 Period #5 Political Stability
No Indication
Indication
Indication
Indication
Transition
Peace Yes Yes Yes Yes No Yes Foreign Aid 1 19.20264 28.56587 28.65286 31.76899 - Kyoto protocol Ratification/Acceptance
15 December 1999
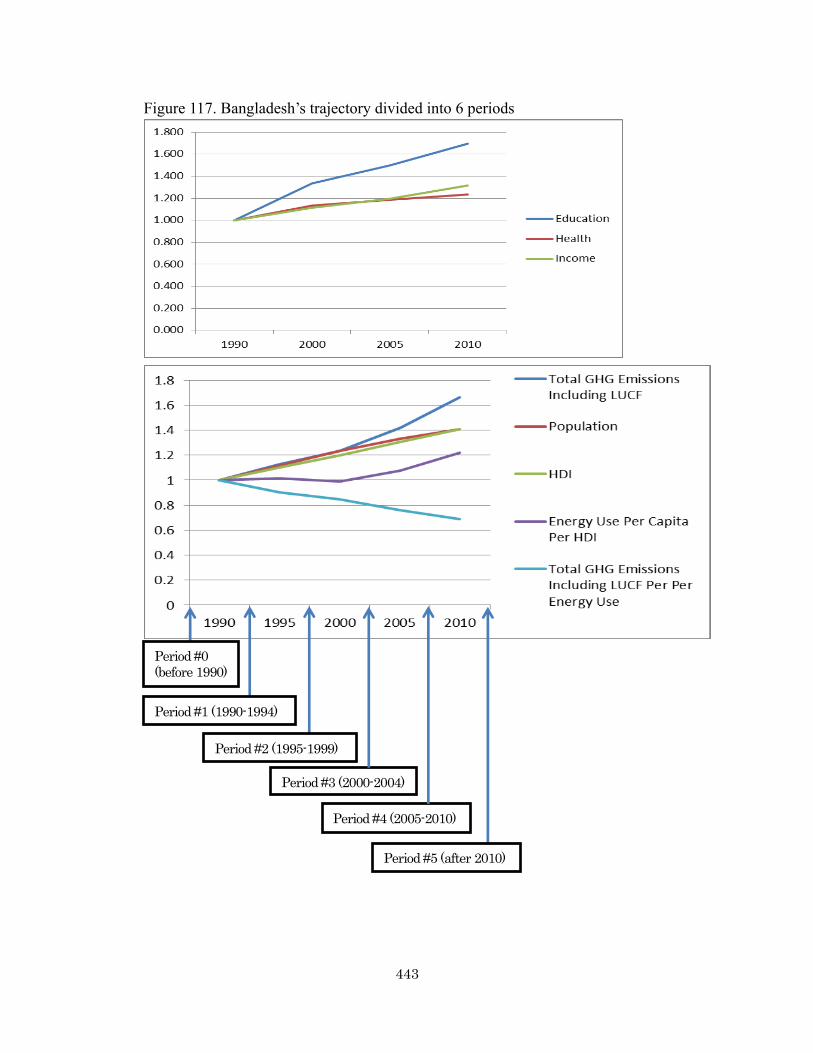
443
Figure 117. Bangladesh’s trajectory divided into 6 periods
Period #0 (before 1990)
Period #1 (1990-1994)
Period #2 (1995-1999)
Period #3 (2000-2004)
Period #4 (2005-2010)
Period #5 (after 2010)
444
Appendix 19. Bangladesh Timeline
Period #0
1971 - Sheikh Mujib arrested and taken to West Pakistan. In exile, Awami League
leaders proclaim the independence of the province of East Pakistan on 26th March.
The new country is called Bangladesh.
1972 - Sheikh Mujib returns, becomes prime minister. He begins a programme of
nationalising key industries in an attempt to improve living standards, but with little
success.
1975 - Sheikh Mujib becomes president of Bangladesh. The political situation
worsens. He is assassinated in a military coup in August. Martial law is imposed.
1976 - The military ban trade unions.
1977 - General Ziaur Rahman assumes the presidency. Islam is adopted in the
constitution.
1979 - Martial law is lifted following elections, which Zia's Bangladesh National
Party (BNP) wins.
1981 - Zia is assassinated during abortive military coup. He is succeeded by Abdus
Sattar.
1982 - General Ershad assumes power in army coup. He suspends the constitution

445
and political parties.
1983 - Limited political activity is permitted. Ershad becomes president.
1986 - Parliamentary and presidential elections. Ershad elected to a five-year term.
He lifts martial law and reinstates the constitution.
1987 - State of emergency declared after opposition demonstrations and strikes.
1988 - Islam becomes state religion. Floods cover up to three-quarters of the country.
Tens of millions are made homeless.
Period #1
1990 - Ershad steps down following mass protests.
1991 - Ershad convicted and jailed for corruption and illegal possession of weapons.
Begum Khaleda Zia, widow of President Zia Rahman, becomes prime minister.
Constitution is changed to render the position of president ceremonial. The prime
minister now has primary executive power. Cyclonic tidal wave kills up to 138,000.
Period #2
1996 - Two sets of elections eventually see the Awami League win power, with
Sheikh Hasina Wajed, the daughter of Sheikh Mujibur Rahman, becoming prime
minister.
1997 - Ershad is released from prison. The opposition BNP begins campaign of

446
strikes against the government.
1998 - Two-thirds of the country devastated by the worst floods ever. Fifteen former
army officers sentenced to death for involvement in assassination of President
Mujib in 1975.
Period #3
2000 - Sheikh Hasina criticises military regimes in a UN speech, prompting
Pakistani leader General Musharraf to cancel talks with her. Relations strained
further by row over leaked Pakistani report on 1971 war of independence.
Bangladesh expels Pakistani diplomat for comments on the 1971 war. The diplomat
had put the number of dead at 26,000, whereas Bangladesh says nearly three million
were killed.
2001 - Seven killed in bomb blast at a Bengali New Year concert in Dhaka. Sixteen
Indian and three Bangladeshi soldiers killed in their worst border clashes. Bomb
kills 10 at Sunday mass at a Roman Catholic church in Baniarchar town. Bomb at
Awami league office near Dhaka kills 22. Hasina steps down, hands power to
caretaker authority, becoming the first prime minister in the country's history to
complete a five-year term. At least eight people are killed and hundreds injured as
two bombs explode at an election rally in south-western Bangladesh. Hasina loses

447
at polls to Khaleda Zia's Nationalist Party and its three coalition partners.
2002 - Pakistani President Musharraf visits; expresses regret over excesses carried
out by Pakistan during 1971 war of independence. In September, Iajuddin Ahmed
sworn in as president. December, simultaneous bomb blasts in cinemas in a town
north of Dhaka kill 17 and injure hundreds.
2004 Opposition calls 21 general strikes over the course of the year as part of a
campaign to oust the government. Worst flooding in six years leaves nearly 800
people dead, millions homeless or stranded, and an estimated 20m in need of food
aid. September's floods in Dhaka are said to be the worst in decades. In August,
Grenade attack on opposition Awami League rally in Dhaka kills 22 people.
Period #4
2005 - Prominent Awami League politician Shah AMS Kibria is killed in a grenade
attack at a political rally. The party calls a general strike in protest. Around 350
small bombs go off in towns and cities nationwide. Two people are killed and more
than 100 are injured.
2006 – In February, opposition Awami League ends year-long parliamentary
boycott. Violent protests over government's choice of a caretaker administration to
take over when Premier Zia completes her term at the end of the month. President

448
Ahmed steps in and assumes caretaker role for period leading to elections due in
January 2007. In November, a 14-party opposition alliance led by the Awami
League campaigns for controversial election officials to be removed. Chief election
commissioner MA Aziz steps aside. In December, election date set at 22 January.
Awami alliance says it will boycott the polls. Awami leader Sheikh Hasina accuses
President Ahmed of favouring her rival. Blockade aimed at derailing parliamentary
elections paralyses much of the country.
2007 - In January, a state of emergency is declared amid violence in the election
run-up. President Ahmed postpones the poll. Fakhruddin Ahmed heads a caretaker
administration. In April, Sheikh Hasina is charged with murder. Begum Khaleda
Zia is under virtual house arrest. Several other politicians are held in an anti-
corruption drive. In August, government imposes a curfew on Dhaka and five other
cities amid violent clashes between police and students demanding an end to
emergency rule. In November, cyclone Sidr kills thousands.
2008 – In August, local elections take place, seen as a big step towards restoring
democracy. Candidates backed by the Awami League perform strongly. In
December, general elections: Awami League captures more than 250 of 300 seats
in parliament. 2009 - Sheikh Hasina is sworn in as prime minister in January.

449
Around 74 people, mainly army officers, are killed in a mutiny in Dhaka by border
guards unhappy with pay and conditions. Police arrest some 700 guards. A further
1,000 guards are detained in May. The government bans the local branch of the
global Islamist organisation Hizb-ut Tahrir, saying it poses a threat to peace.
2010 - Five former army officers are executed for the 1975 murder of founding PM
Sheikh Mujibur Rahman.
Period #5
2012 - Key figures from the main Islamist party Jamaat-e-Islami, including leader
Motiur Rahman Nizami, are charged with war crimes by a government tribunal
investigating alleged collaboration with Pakistan during the 1971 independence
struggle. In October, Muslim rioters attack Buddhist villages and shrines in south-
east Bangladesh after an image said to show a burnt Koran was posted on Facebook.
The government denounces the attacks as "premeditated and deliberate acts of
communal violence against a minority.”
2013 - War crimes tribunal sentences prominent Muslim cleric Abul Kalam Azad
to death for crimes against humanity during the 1971 independence war. Prime
Minister Sheikh Hasina vetoes Islamist bill to outlaw criticism of Islam. European
retailers promise to sign an accord to improve safety conditions in factories after a

450
garment factory building collapsed in April, killing more than 1,100 people. Worker
protests close hundreds of factories and extract a government pledge to raise the
minimum wage and make it easier to form unions. At least two people are killed as
police clash with thousands of protesters after the conviction of Ghulam Azam,
leader of the Jamaat-e-Islami party, for war crimes committed during the 1971 war
of independence. Ghulam Azam dies in October 2014.
2014 - Opposition BNP boycotts parliamentary elections, Prime Minister Sheikh
Hasina returns for third term in office. Jamaat-e-Islami Leader Motiur Rahman
Nizami and another leading figure, Mir Quasem Ali, found guilty of war crimes
during independence war in 1971.
2015 - Court sentences another senior Jamaat-e-Islami figure, Abdus Subhan, to
death for war crimes committed during independence war in 1971. Bangladesh bans
Islamist militant group Ansarullah Bangla Team, which claims responsibility for
killing and assaulting several pro-secular public figures.
2016 - Two students are sentenced to death for the 2013 killing of atheist blogger
Ahmed Rajib Haider. The Islamic State group claims an attack on a cafe in Dhaka's
diplomatic quarter in which 20 hostages, including 18 foreigners, are killed but the
government rejects the claim saying the militant group Jamaat-ul-Mujahideen was

451
responsible. Business tycoon and senior leader of Bangladesh's largest Islamist
party Jamaat-e-Islami, Mir Quasem Ali, is executed for war crimes committed
during the 1971 war of independence.
Table 53. Bangladesh Timeline Perio
d #0 Period #1
Period #2
Period #3
Period #4
Period #5
Political Stability No No No No No No Peace No No No No No No Foreign Aid 1 0.83133
9 0.533822
0.511628
0.590508
-
Kyoto protocol Ratification/Acceptance
22 October 2001
Table 54. Experts’ responses for the question related to Myanmar
Answers Representative Comments Data was untrustworthy (5)
• “I think Myanmar is a case where indicators based on statistical data will be misleading. Data is untrustworthy because until recently the regime was secretive and what data was produced was to verify performance goals (where they existed) or to divert attention from areas of exploitation. Their purpose was rarely to give a true picture of the development parameter being reported on.”
• “we know that there are huge gaps between the official stats and what happened in the field”
• “Myanmar is late comer to accurate reporting on global indices. I personally wouldn’t judge any improvements in indices as an improvement on the ground per se.”
• “The result is actually interesting since, I had an impression that Myanmar’s growth was slow during the period of

452
Answers Representative Comments international economic sanctions. If there was high income growth notwithstanding low FDI and ODA, this may be partially explained by the convergence theory, i.e. Myanmar’s growth was higher just because its starting income level was very low. Growth theories (generally speaking) predict low income economies to grow faster than middle/high income countries.”
Secondary and tertiary industries (11)
• “the income level of Myanmar people has been increased due to the economy boost originated from recent rapid growth mainly in real estate business and related tourism by the visitors, which have been created by positive expectation for Myanmar’s economy and industry by overseas investors.”
• “A new law on investments in October 2016 has improved business climate. Tourism and tourism related infrastructure construction will contribute to growth….. Income component of Myanmar increased due to shift from low productivity agriculture to higher productivity industries supported by emphasis on economic/industrial zones, SMEs and garments. The limited increase in CO2 is explained by SME emphasis as opposed to polluting large industries.”
• “the sector shifting caused due to labor transaction (sic) from the agricultural and forestry sector to labor-intensive light industrial sector and tourism, which increased the average income.”
• “increase in trade, manufacturing and services is correct.” • ”…shift from primary industry (agriculture and forestry) to
secondary and tertiary industries certainly contributed to the economic growth as primary industry is usually low in productivity than the other industries.”
• “It is developing its energy and industrial sectors.” • “might have promoted the private sector to invest on local
service sectors, including the limited middle scale industries.” • “The improving political landscape allowed more
international tourists to visit, boosting incomes and employment.”

453
Answers Representative Comments • “I believe it was more towards light industries whose GHG
emission would be modest.” Foreign investment (6)
• “there were sizable flows of investment from countries like China (PRC), that could have presumably supported the industrial growth of the country.”
• “The increase in income of Myanmar is possibly partly because during this period, the country has opened its economy to private sector participation.”
• “GDP seems to be driven by increased industry and services probably driven by FDI with country opening.”
• “Arguably, Myanmar did enjoy some political stability in the period 1990-2010 in the form of an authoritarian military regime, which likely contributed to inflow of some foreign direct investment which was outside the international sanctions regime (capital coming mainly from the PRC and other Asian countries). One might also argue that “international” sanctions were taken seriously by only a few donor countries (e.g., the US), and the sanction regime was not effective at stopping capital inflow…. It should be noted that political stability is not the same as predictability of decision-making, so although Myanmar was run by an authoritarian military regime (and to some extent still is today) the investment environment may have been predictable enough to allow risk quantification; those investors willing to ignore a weak sanctions regime could understand the risks and make reasonable well-informed investment decisions.”
• “Myanmar started to develop its oil and gas reserves, inviting foreign investors etc. Myanmar has also developed many hydropower plants with investors mainly from the PRC. Much of the oil and gas, as well as the electricity generated from hydropower, was exported during that period. This resulted in a much higher GDP.”
• “personally think that Myanmar’s recent transition from a military-rule government to democratic government has
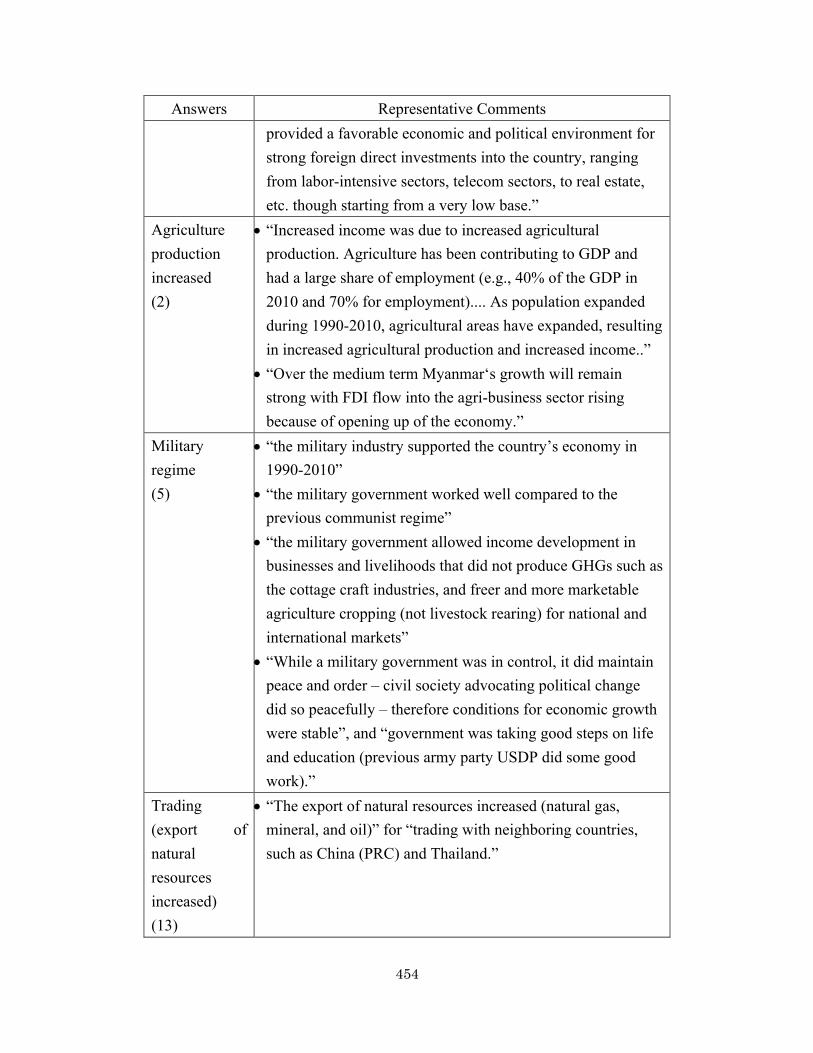
454
Answers Representative Comments provided a favorable economic and political environment for strong foreign direct investments into the country, ranging from labor-intensive sectors, telecom sectors, to real estate, etc. though starting from a very low base.”
Agriculture production increased (2)
• “Increased income was due to increased agricultural production. Agriculture has been contributing to GDP and had a large share of employment (e.g., 40% of the GDP in 2010 and 70% for employment).... As population expanded during 1990-2010, agricultural areas have expanded, resulting in increased agricultural production and increased income..”
• “Over the medium term Myanmar‘s growth will remain strong with FDI flow into the agri-business sector rising because of opening up of the economy.”
Military regime (5)
• “the military industry supported the country’s economy in 1990-2010”
• “the military government worked well compared to the previous communist regime”
• “the military government allowed income development in businesses and livelihoods that did not produce GHGs such as the cottage craft industries, and freer and more marketable agriculture cropping (not livestock rearing) for national and international markets”
• “While a military government was in control, it did maintain peace and order – civil society advocating political change did so peacefully – therefore conditions for economic growth were stable”, and “government was taking good steps on life and education (previous army party USDP did some good work).”
Trading (export of natural resources increased) (13)
• “The export of natural resources increased (natural gas, mineral, and oil)” for “trading with neighboring countries, such as China (PRC) and Thailand.”
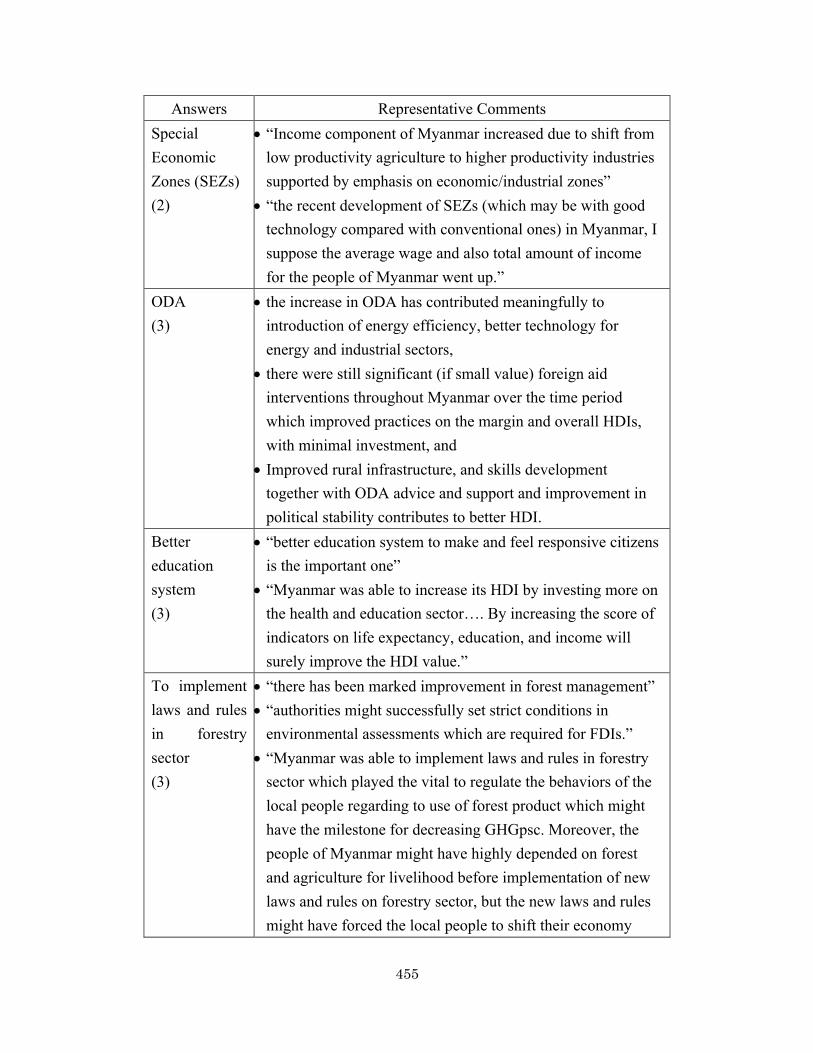
455
Answers Representative Comments Special Economic Zones (SEZs) (2)
• “Income component of Myanmar increased due to shift from low productivity agriculture to higher productivity industries supported by emphasis on economic/industrial zones”
• “the recent development of SEZs (which may be with good technology compared with conventional ones) in Myanmar, I suppose the average wage and also total amount of income for the people of Myanmar went up.”
ODA (3)
• the increase in ODA has contributed meaningfully to introduction of energy efficiency, better technology for energy and industrial sectors,
• there were still significant (if small value) foreign aid interventions throughout Myanmar over the time period which improved practices on the margin and overall HDIs, with minimal investment, and
• Improved rural infrastructure, and skills development together with ODA advice and support and improvement in political stability contributes to better HDI.
Better education system (3)
• “better education system to make and feel responsive citizens is the important one”
• “Myanmar was able to increase its HDI by investing more on the health and education sector…. By increasing the score of indicators on life expectancy, education, and income will surely improve the HDI value.”
To implement laws and rules in forestry sector (3)
• “there has been marked improvement in forest management” • “authorities might successfully set strict conditions in
environmental assessments which are required for FDIs.” • “Myanmar was able to implement laws and rules in forestry
sector which played the vital to regulate the behaviors of the local people regarding to use of forest product which might have the milestone for decreasing GHGpsc. Moreover, the people of Myanmar might have highly depended on forest and agriculture for livelihood before implementation of new laws and rules on forestry sector, but the new laws and rules might have forced the local people to shift their economy

456
Answers Representative Comments from traditional way of living embedded with forest and agriculture to non-agro-forestry sector.”
Remittances from overseas workers (1)
• “Many people from Myanmar work outside the country. For example, after Filipinos, they are the next biggest group of foreign healthcare workers in Singapore.”
Technology increases productivity (2)
• “The limited increase in CO2 in this transition may be at least partly due to (i) adoption of energy-efficient technologies from other countries; (ii) donor-funded projects to provide or introduce such technologies.”
• “Myanmar may have realized that the increase in technology increases productivity e.g. more lumber with forest replacements in parallel, as replacement. With increased production there was no need for more labor. The additional labor force did other economic activities. Also increased technology reduced wastage and therefore carbon emission.”
Hydro based with low GHG emissions (3)
• “Myanmar has developed many hydropower plants with investors.”
• “Myanmar’s energy generation is concentrated to hydropower which accounts for almost 70% of the installed capacity.”
• “Maybe new FDI industry and increased services were supplied from grid, which is hydro based with low GHG emissions.”
Others (4)
• “further distancing from strict socialism and increasing opening up of the economy during the nineties”
• “twin deficits” and “government prioritization of public investment and social spending.”
• “In the given scenarios as mentioned, I think Decentralization of powers, fair and equitable share of benefits among central, regional and local level all governmental as well as non-governmental institutions should be main cause”
• The numbers in parentheses in the table refers to the numbers of experts who mentioned the factor in their responses.
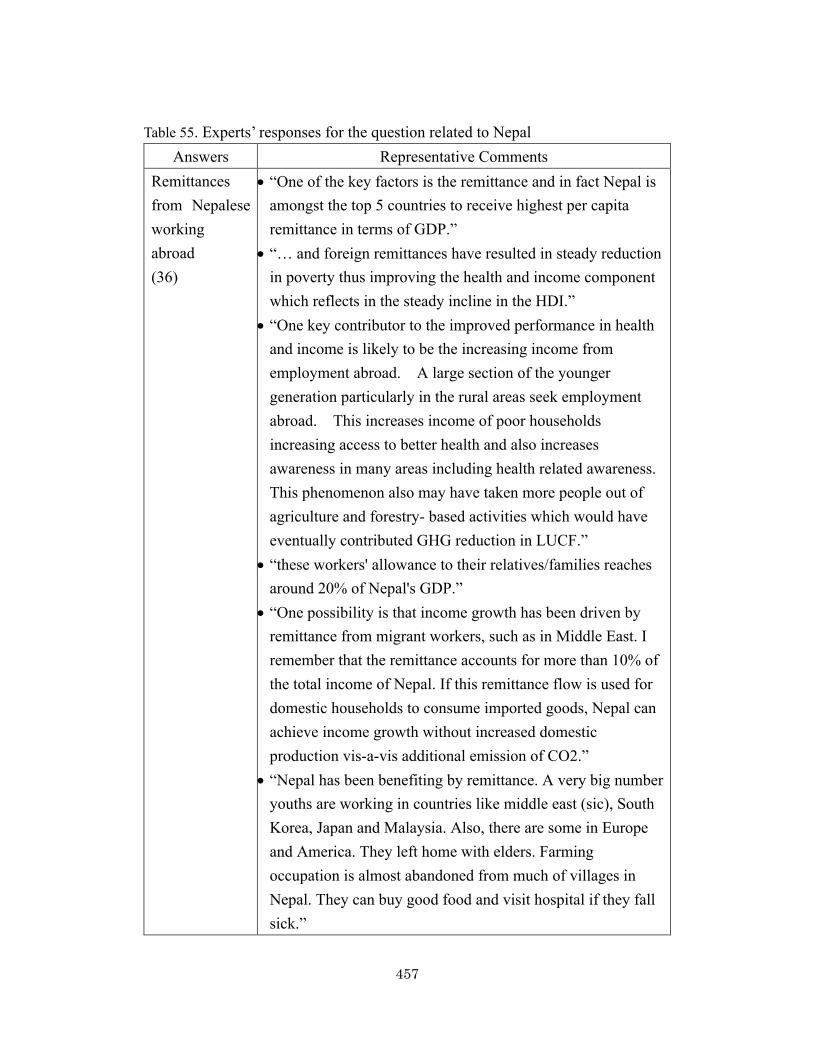
457
Table 55. Experts’ responses for the question related to Nepal
Answers Representative Comments Remittances from Nepalese working abroad (36)
• “One of the key factors is the remittance and in fact Nepal is amongst the top 5 countries to receive highest per capita remittance in terms of GDP.”
• “… and foreign remittances have resulted in steady reduction in poverty thus improving the health and income component which reflects in the steady incline in the HDI.”
• “One key contributor to the improved performance in health and income is likely to be the increasing income from employment abroad. A large section of the younger generation particularly in the rural areas seek employment abroad. This increases income of poor households increasing access to better health and also increases awareness in many areas including health related awareness. This phenomenon also may have taken more people out of agriculture and forestry- based activities which would have eventually contributed GHG reduction in LUCF.”
• “these workers' allowance to their relatives/families reaches around 20% of Nepal's GDP.”
• “One possibility is that income growth has been driven by remittance from migrant workers, such as in Middle East. I remember that the remittance accounts for more than 10% of the total income of Nepal. If this remittance flow is used for domestic households to consume imported goods, Nepal can achieve income growth without increased domestic production vis-a-vis additional emission of CO2.”
• “Nepal has been benefiting by remittance. A very big number youths are working in countries like middle east (sic), South Korea, Japan and Malaysia. Also, there are some in Europe and America. They left home with elders. Farming occupation is almost abandoned from much of villages in Nepal. They can buy good food and visit hospital if they fall sick.”

458
Answers Representative Comments • “Nepal’s improvement in HDI –income, health and
education -- are largely credited to the emergence of democracy and political transition. This historic transition has shifted the economic activities -- largely the agro- and forestry based into remittance based. Country’s economy show (sic) a lot of cash flow from remittance—that gave higher income and hence better health and education condition.”
• “Regarding the improvement of HDI, I think, the government direct and indirect policy also promote the youth for migration to Arabian Countries for labour work. Today, the remittance of the youth is became (sic) main source GDP of the country as well as household income which have been using for health, education, food and so on.”
• “The economic component is also found improved even in the political instability because of remittance particularly the labor force supply to the overseas countries. It is estimated that about 50 hundred thousand Nepalese youth now in overseas for employment. Instability create an environment to the youth to go to foreign employment. So the major portion of country’s administration expenses is bearing by the remittance.”
Increased migration (2)
• “The heavy migration of labor man power specially productive age force is either went abroad for job huntings (sic) or gathered around big cities of Nepal. This situation in other way caused no chance of clearing forest or income from forest by damaging it. So despite political instability since 2006 and even before, the attraction towards natural resources is lessened. Now the situation is forests and wilderness increased and agricultural encroachment reduced.”
• “shifting agriculture to urban labors has been observed, though they are still poor while economic indicators are not necessary getting worse, and quite a few have worked as an

459
Answers Representative Comments overseas Nepalese worker, which would significant economic indicators.”
Service sector (particularly tourism) (11)
• The massive increase in adventure tourism over the last 2-3 decades which has added significantly to Nepal’s GDP”
• “I suspect the significant change in tourism arrivals, from 2003, is a big factor, since it is the main source of revenue in the country, and foreign exchange earner.”
Increasing health facilities (12)
• “The big push of the government in terms of increasing health facilities with support from various development partners is also improving the health components”
• “the government focused on the health sector’s development.”
• “technological innovation in health care service.” • “Increment in primary health care and establishment of
community health centre” • “In health sector, health post has established in every area of
country and mobile health camp was done in remote area of country for diagnosis of disease of cure has been done”
• “In health sector health services centers are increasing day by day”
• “Number of health workers and doctors employment is increasing in hospitals including Government and private”
• “Numbers of health-related institutions are increasing in both government and private sectors.”
Increased or continuous government and donors funding for maternal health, and female community health volunteer
• “Improved HDI could be due to a number of factors including increased or continuous government and donors funding for maternal health”
• “Increased health facility in rural areas under the Ministry of Health. According to the data of DoHS, besides Doctors, Nurse/ANM and HA, around 3190 village health workers, 3985 MCHW and 63326 female community health volunteers including trained traditional birth attendants have been mobilized.”

460
Answers Representative Comments (6) Increased access to health services due to improved rural roads (3)
• “Improved HDI could be due to a number of factors including increased access to health services due to improved rural roads.”
• “Comparatively health facilities are increasing throughout the country due to transportation and communication services and people have access on it.”
Support from various development partners (11)
• “ODA may have stalled during the civil war years, but the MDBs and other development partners have maintained a significant presence and have been trying to expand financial assistance since 2006.”
• “the ODAs support remained continuous in peace building and health sector even during the period of insurgency which helped to improve HDI in the health sector.”
• “It is experienced that ODAs support was significant even when the state of political stability and peace was fragile in Nepal. During the insurgency, development partners consulted with the GoN and agreed to prepare the Basic Operating guidelines (BOGs) to pour their development assistance in different sectors like, health, education and improved governance.”
Government investment and efforts (9 including one negative view)
• “In addition to the support from donors, the Government of Nepal is also increasing its investment from its national budget in the health sector.”
• “the government has invested substantially in health and education sectors which have helped the country to achieve better human development outcomes.”
• “The health component is able to improve HDI because Government of Nepal has been started the health insurance policy from which people are concerned about health.”
• “Improvement in Nepal's HDI in health component might be due to Effectiveness of GoN plans and policies in health sector and prioritization of health services in national annual budget.”

461
Answers Representative Comments • “During this period, Nepal HDI particularly child mortality
and income poverty have been significantly improved within several unfavorable situations. Here are some reasons: Nepal has been investing huge resources in community based small but effective programme since long time like safer motherhood programme, community forestry programme, adult literacy programme and free primary education for all. These types of programme have positive impacts in other development sectors including health education and income. Adult literacy programme has not only contributed in literacy rate but also improve their knowledge and participation in health and education as well.”
(2 experts particularly focused on the government efforts for achieving an inclusive growth.) • “Nepal makes its best efforts on inclusive growth, improving
access to clean energy, education, clean water, etc., in rural communities”
• “Improvement in both health and income indicators of Nepal can be attributed to a political consensus to pursue inclusive development with focus on HDI within the overall framework of aid supported reconstruction and rehabilitation efforts.”
(negative view on the government investment) • “the support from the government at policy and program
level was not extending at the required level at the grass root.”
Awareness-raising campaigns/activities (11)
• “Similarly, the Government of Nepal has concentrated comparatively more on sensitization and awareness-raising campaigns/activities (hand wash campaign, immunization campaign, and maternal health services) on health issues in rural areas which supported to improve the health of rural people.”

462
Answers Representative Comments • “Improving the access of information about health -
Healthcare Foundation Nepal (HECAF- Nepal) uses healthcare magazines for disseminating information about healthcare services, events, news and other issues concerning health which has improved the life of people.”
• “Improvement in Nepal's HDI in health component might be due to …. Conduction of awareness program focused on child and maternity health to reduce infant mortality rate and deaths during pregnancy”
• “Nepal's HDI, particularly its health and income component able to improve may be because of …. Launch of awareness raising programmes like the welcome to School Initiative, health campaigns, primary health services ensure the access towards the services.”
• “Nepal’s HDI particularly its health component is improved because of the development and mobilization of Village health workers (VHWs) across the country particularly focusing in the rural and remote locations. These VHWs has provide their extra effort to increase the awareness level of women in the family. Organised mass awarness campaign in the community, local school aiming to increase the awareness on sanitation health and hygiene. The Government of Nepal has provided continuity to this programme from the beginning due to its successful outcomes. So this achievement made so far even in the difficult circumstance, while the country possesses through an insurgency or serious political conflict and instability.”
• “Growing awareness on climate change and also putting effort on mitigation and adaptation” as one of the main reasons for reduction of GHG.
The laws and rules related to forests in legal sense (13)
• “Forest conservation has been supported mainly from the fact that the country has suffered from flooding, land-sliding, and earthquakes, and that the poor are the most affected people.”

463
Answers Representative Comments • “the application of laws and regulations that related to
forestry helped to decrease the adverse impact to the establishment of forestry, which contribute to the GHG emission reduction.”
• “better management of forest sectors has contributed to Co2 emission reduction through sequestration.”
• “Certainly, there is change the forest policy in the past which create an enabling environment and increased people participation for the conservation and management of forest resource.”
• “The younger population with better education are not inclined to be in the forestry business. Further the rules and regulations make it difficult for those who wish to enter into the industry to do any business.”
• “the main reason for reduction of GHG” was “Enforcement of forest act and rules and several guidelines related to forestry through the period of 1976-2015.”
Community forestry (12)
• “a core policy of Nepalese Government” • “the forestry laws and rules also promoted to make the
community forestry more inclusion.” • “The community forest management model in Nepal
substantially contributed to forest conservation in Nepal.” • “Community forestry is resource-based organization which
has played key role in promoting education, health (through emergency fund they have established), and invested in income generation activities for poorer members of the community.”
• “The community forestry programs from the early 80s were responsible for the greening of the Middle Mountains and High Mountains of Nepal including parts of the frontal foot hills (Siwaliks or Churias) bringing noticeable LUCF in Nepal.”
• “has been progressively updated to take into account the needs of local communities and the experiences of stakeholders involved in community forestry projects. Local

464
Answers Representative Comments people are involved in managing forest areas in order to fulfill their needs for forest products and, indirectly, to enhance the conservation of soil and water, whilst contributing to improving the environment”
• “While development agencies/donor supported in forestry sector there was less priority in forest management that’s why forestry programmes are not very much affected with donor support. But for acceleration of active forest management there is need of external fund and will have good return.”
Alternative energy options (10)
• “Fuel wood consumption is decreasing due to other options.” • “In rural community of hill region of Nepal, the domestic
smoke pollution is the major cause of respiratory infection in women and children. Death of young children due to acute respiratory infection was mainly due to indoor smoke. However, this disease is decreasing with changing the trend of consumption of fossil fuels and the introduction of alternative energy options such as improved cooking stoves, solar home system and micro-hydro from last few years.”
• “People’s dependency on forest for their livelihoods reduced. Because, people planted forests in private farmlands, availability of Liquid Petroleum Gas as cooking energy and reduction of population dependent on agriculture. In addition to this, people are-encouraged to use alternative energy – improved cook stoves, bio-gas, solar power, micro-hydro.”
• “Uses of Alternative Renewable Energies like ICS, Biogas, Micro-hydro, Solar, Improved water mills have also helps in reduction of GHGs emission.”
• “Nepal’s low GHGpc per capita should be low simply based on it source of energy. For example, power is largely dependent on hydropower. As a result, the country’s emission factor for the power generation is almost a zero value. Therefore.”
Education (6)
• education was one of keys to improve HDI of Nepal.

465
Answers Representative Comments • “government has set up health services to the rural areas.
Peoples’ awareness on modern medicine has increased sharply. Education and media has also positive role in raising awareness in public”
• “Adult literacy programme has not only contributed in literacy rate but also improve their knowledge and participation in health and education as well.” “The younger population with better education are not inclined to be in the forestry business.”
Pervasive NGO involvement (3)
• “Nepal is the darling of the NGO community. Huge increase in local community development activities across all villages and towns.”
• “Healthcare and hospitals partnering with NGOs/INGOs operating different social work spreading awareness programs like health education, organizing specialty health camps to treat villagers at a reduced cost or free of charge as well as providing regular immunization and family planning advice and devices.”
• “Instead of political stability, peace and increasing ODAs, sector activities shifted out of forestry due to the promotion of renewable technology by different INGOs/NGOs has reduced the GHGs emission per capita.”
Change in Agriculture (3)
• “The likely contributors to increase in HDI in Nepal over 1990-2010 are increase in income from growth of the agriculture sector and…”
• “modest reductions in fertilizer use and other agricultural efficiency improvements could account for a lot of CH4 and N2O reduction which shows up in the LULUCF accounting.”
Military conflict ended (2)
• “Nepal officially began a new era of peace in 2005-06 when – after 10 years of civil war - the Maoist rebels agreed to lay down their arms. The military conflict ended, which may account for most of the health and income improvements, but the political conflict did not.”
Composition of exported goods
• “the Nepal’s composition of exported goods has varied over the course of the period. As its major trading partners, such
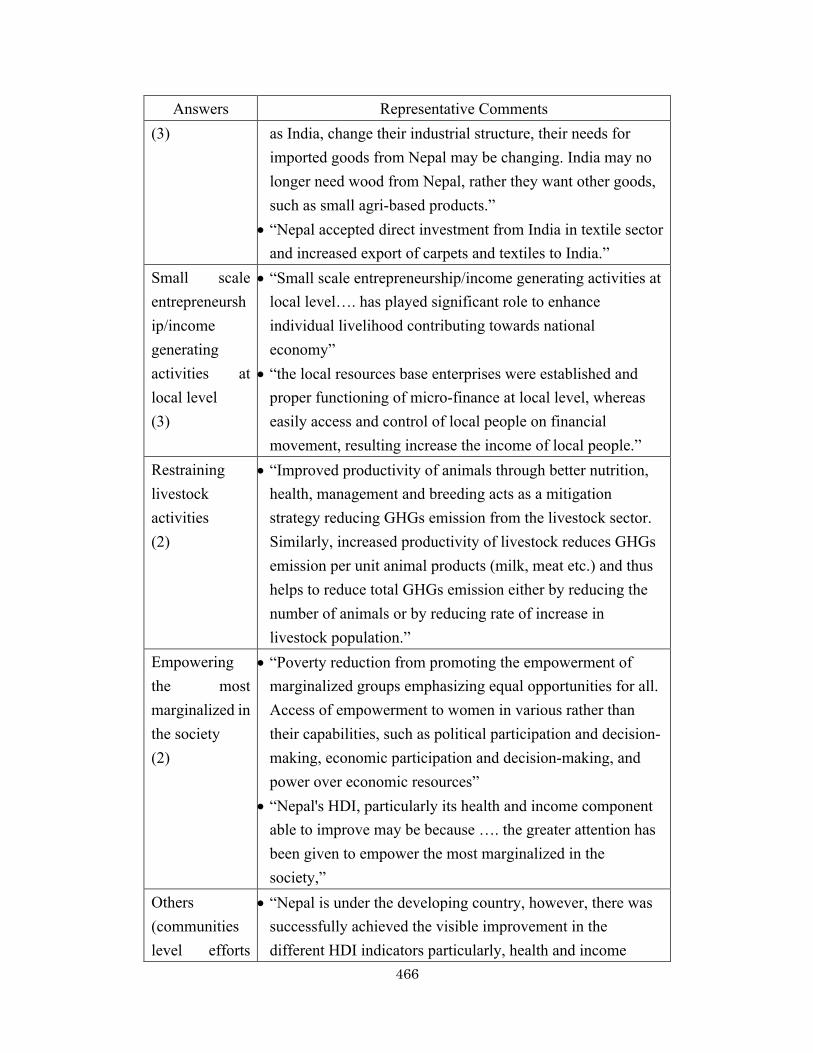
466
Answers Representative Comments (3) as India, change their industrial structure, their needs for
imported goods from Nepal may be changing. India may no longer need wood from Nepal, rather they want other goods, such as small agri-based products.”
• “Nepal accepted direct investment from India in textile sector and increased export of carpets and textiles to India.”
Small scale entrepreneurship/income generating activities at local level (3)
• “Small scale entrepreneurship/income generating activities at local level…. has played significant role to enhance individual livelihood contributing towards national economy”
• “the local resources base enterprises were established and proper functioning of micro-finance at local level, whereas easily access and control of local people on financial movement, resulting increase the income of local people.”
Restraining livestock activities (2)
• “Improved productivity of animals through better nutrition, health, management and breeding acts as a mitigation strategy reducing GHGs emission from the livestock sector. Similarly, increased productivity of livestock reduces GHGs emission per unit animal products (milk, meat etc.) and thus helps to reduce total GHGs emission either by reducing the number of animals or by reducing rate of increase in livestock population.”
Empowering the most marginalized in the society (2)
• “Poverty reduction from promoting the empowerment of marginalized groups emphasizing equal opportunities for all. Access of empowerment to women in various rather than their capabilities, such as political participation and decision-making, economic participation and decision-making, and power over economic resources”
• “Nepal's HDI, particularly its health and income component able to improve may be because …. the greater attention has been given to empower the most marginalized in the society,”
Others (communities level efforts
• “Nepal is under the developing country, however, there was successfully achieved the visible improvement in the different HDI indicators particularly, health and income

467
Answers Representative Comments and commitments, ownership development)
component because of …. increase communities level efforts and commitments, ownership development….”
The numbers in parentheses in the table refers to the numbers of experts who mentioned the factor in their responses. Table 56. Experts responses for the question #1 related to Mongolia
Answers Representative Comments Socialist regime (2)
• “Mongolia is experiencing a rapid population migration to Ulaanbaatar since early 2000s. During the socialism period, population migration must have been restricted, but people are migrating more with a freer movement policy and repeated Zuds (cold winter). Probably, the “green development” in 1990s was the benefit of the socialism regime.”
(negative view) • “Two different periods can be identified. 1990-1995, the
GHG emission decreased significantly. 1995-2000. GHG emission started to increase slowly. One explanation could be the withdrawal of the soviet support to the country leading to a slow down the economy and industrial sector, and therefore a fall on the related emission. Meanwhile, as the move to market economy was taking up the economic indicator and the income level went up.…. the decrease or good performances in GHG emission appear to be mainly due the industrial and economic slowdown in the early 90th caused the change of political changes.”
Growth of the service sector and private & public-sector trading
• “Probably it is because of the growth of the service sector and private & public-sector trading.”
• “the share of manufacturing and construction were diminishing, while mining and some service sectors were

468
Answers Representative Comments (2) expanding. This may explain the decreased GHG
emissions…. Increased revenues from the mining sector may have contributed, to some extent, to increase in those social welfare payments and also investments in education and health.”
Efficiency and technology
• “The decrease in GHG emissions could be accounted for by efficiency improvements, e.g. via modernization of combined heat and power (CHP) plants, as well as exports of coal for which GHG emissions are reported in the country of final use”
• “I guess that GHG emission from the energy sector decreased, maybe because more efficient power development was achieved thanks to the increased ODA along with its relevant higher technical standards.”
• “I think there was a huge influx of returning citizens from Europe and north America seeking to invest in the new economy and speculate. They significantly changed the attitude to traditional soviet era environmental management and construction and energy industries – and as you mentioned introduced more efficient and more profitable approaches with new technology.”
• “I think Mongolia’s energy generation as well as manufacturing was (and to some extent still is) relying on highly inefficient and polluting technologies from the Soviet era. I’m sure there was a huge room for improving GHG emission per unit energy generation or per production.”
• “Perhaps it moved towards renewable energy.” Opening up the economy (2)
• “The reason is possibly due to opening up the economy to private sector participation in the manufacturing and construction sectors”
• “the move to market economy was taking up the economic indicator and the income level went up…. income increase might be related to the transition to the market economy.”

469
Answers Representative Comments Non GHG emitting productions (5)
• “it seems that in the mid-90s the economy picked up but Mongolian economy during that time is mainly related to livestock and production of other “rural agriculture products” (for the lack of better term) such as production of cashmere/wool, dairy, etc.”
• “GHGpc declined with the education in livestock rearing.” • “The improvement in income with decreased GHG
emissions suggests that there were more investments on non-GHG generating sectors like health and education.”
• “Mongolia’s reliance on low emission agriculture…. explains income growth with decreased GHG emissions.”
Sparsely populated country so did not fit with large scale manufacturing and energy industry (1)
• “any economic improvement has minimal effect in GHG emission.”
• “Manufacturing and energy sector is not well-developed at this time or not at scale that could drastically change GHG emissions…. I think it is important to contextualize population increase and economic growth of the Mongolia. Mongolia still remains a sparsely populated country compared to other developing countries in Asia. Economic activities are concentrated in few selected areas in the vast country. Only one or two big mining operation and several enterprises makes up the economy. The energy sector is not that developed in 1990-2000. Most people are not connected to central heating or electricity services and major power plants and heating boilers at that time may not be operating at its full capacity as they are in need of repairs or upgrades (most are built during the time when the country had strong economic ties with Russia.”
Democratic system that has emerged (2)
• “Although Mongolia has experienced numerous changes of political leadership over the years since the fall of the former USSR, the democratic system that has emerged has been predictable (if a bit messy) with 2 major parties taking turns running the country”
• “Mongolia chose a parliamentary system. The parliamentary system is a very volatile system in a short
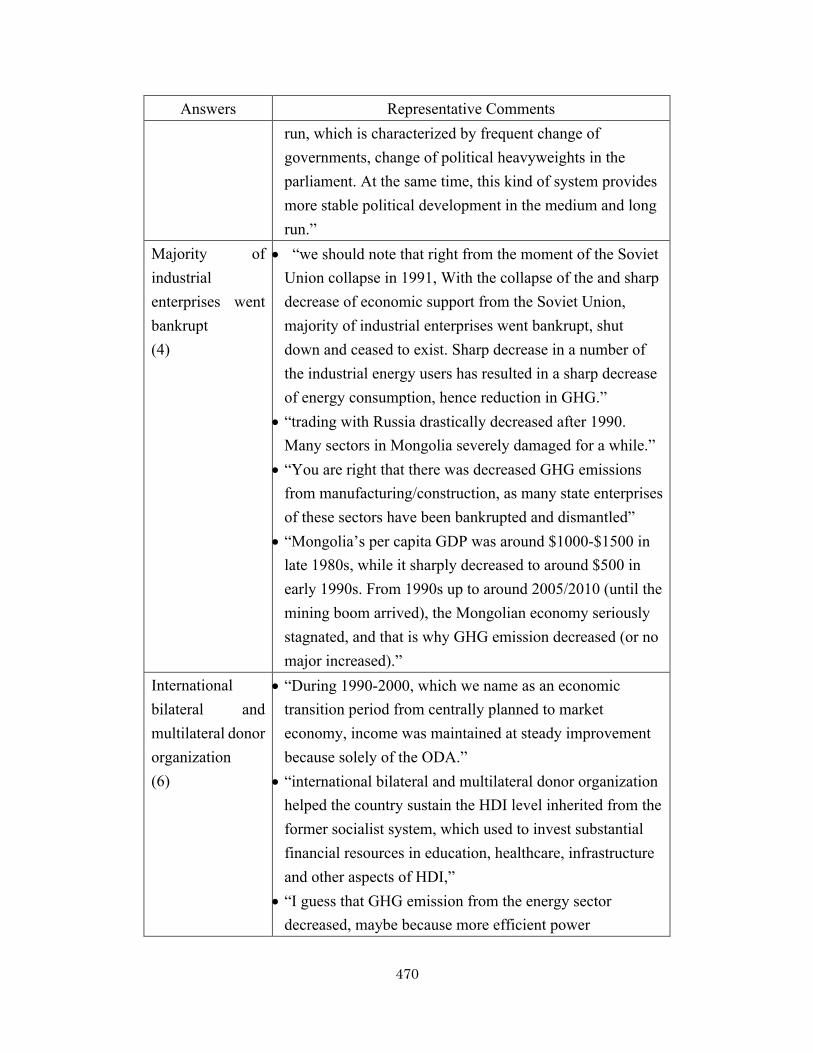
470
Answers Representative Comments run, which is characterized by frequent change of governments, change of political heavyweights in the parliament. At the same time, this kind of system provides more stable political development in the medium and long run.”
Majority of industrial enterprises went bankrupt (4)
• “we should note that right from the moment of the Soviet Union collapse in 1991, With the collapse of the and sharp decrease of economic support from the Soviet Union, majority of industrial enterprises went bankrupt, shut down and ceased to exist. Sharp decrease in a number of the industrial energy users has resulted in a sharp decrease of energy consumption, hence reduction in GHG.”
• “trading with Russia drastically decreased after 1990. Many sectors in Mongolia severely damaged for a while.”
• “You are right that there was decreased GHG emissions from manufacturing/construction, as many state enterprises of these sectors have been bankrupted and dismantled”
• “Mongolia’s per capita GDP was around $1000-$1500 in late 1980s, while it sharply decreased to around $500 in early 1990s. From 1990s up to around 2005/2010 (until the mining boom arrived), the Mongolian economy seriously stagnated, and that is why GHG emission decreased (or no major increased).”
International bilateral and multilateral donor organization (6)
• “During 1990-2000, which we name as an economic transition period from centrally planned to market economy, income was maintained at steady improvement because solely of the ODA.”
• “international bilateral and multilateral donor organization helped the country sustain the HDI level inherited from the former socialist system, which used to invest substantial financial resources in education, healthcare, infrastructure and other aspects of HDI,”
• “I guess that GHG emission from the energy sector decreased, maybe because more efficient power

471
Answers Representative Comments development was achieved thanks to the increased ODA along with its relevant higher technical standards,”
• “Mongolia could not continue relying on single support from Soviet Union as from 1990’s. Mongolia started acceptance from other developed countries from 90’s,”
• “Introduction of leapfrogging technology was a result of combined educated workforce and higher levels of ODA. Donors are always interested in environmental consequences of aid supported projects,”
• “ODA assistance improved the energy efficiency of the manufacturing and construction sectors, which helped income increase without increasing the GHG emissions.”
Exports of coal (and minerals) for which GHG emissions are reported in the country of final use. (4)
• “exports of coal for which GHG emissions are reported in the country of final use.”
• “If it is mining sector that contributed to income increase, it may happen without causing significant increase of GHG emission (because large GHG generation will happen where the fossil fuel is consumed).”
• “the coal price without huge fluctuation throughout the period 1990-2000 is the key to maintain its income steady improvement,”
• “From the early 2000s, the country enjoyed a kind of resource export boom (copper, gold etc.).”
Severe weather and climate (1)
• “Construction increased but is still restricted to non-winter months.”
Overseas remittance (1)
• “Perhaps, household income was supplemented by overseas remittance”
Others (5)
• “Majority of people could have involved in production sector, through promotion of private sector and smallholders.”
• “Willingness and responsibility of each citizen to combat global, regional and sectoral challenges are main thing.”

472
Answers Representative Comments • “Introduction of leapfrogging technology was a result of
combined educated workforce and higher levels of ODA” • “The implementation of Leapfrogging technology and
investment in education sector might have play important role to maintain steady improvement of the Mongolia's HDI.”
The numbers in parentheses in the table refers to the numbers of experts who mentioned the factor in their responses.

473
Table 57. Experts’ responses for the question #2 related to Mongolia Answers Representative Comments
Yes, it happened by the large increase of ODA (17)
• “the development happened to Mongolia since 1990 is closely related with ODA.”
• “Given Mongolia’s PPP scheme has been shaky to date, I believe ODA has played an important role. It is doubtful if the state-of-the-art technologies could have been introduced by the private sector alone.”
• “ODA specially from European countries require the adoption of Best Available Technologies (BAT) in supported projects.”
• “the state-of-the-art technologies generally cost a lot.” • “large increase of ODA since 1990 may have contributed
to the introduction of leapfrogging technology. Leapfrogging technology requires substantial funds to ensure it will work effectively and achieve the desired efficiency.”
• “especially the introduction of more advanced technology in the mining sector, and combined heat and power production.”
• “the ODA is assisting in development of establishing a better urban infrastructure including energy efficiency of buildings, sewage, drainage, healthcare. The government, in consultation with international organizations and the United Nations, aims to utilize resources from Mining to reduce the nation’s carbon and ecological footprints, reduce the high air pollution at Ulaanbaatar that houses at least one-half of the national population due to power plants, burning and vehicular pollution.”
No, it was not happened by the increase of ODA (3)
• “I don’t think there are a lot of leapfrogging technology introduced at this time. ODA increase at that time is mostly to support the country while it is in transition in the early 90s, setting up basic infrastructure such as roads, water supply, healthcare facilities, toilets, etc.; and assistance during natural disasters such as dzuds. But at that time a large part of ODA efforts are related to bringing
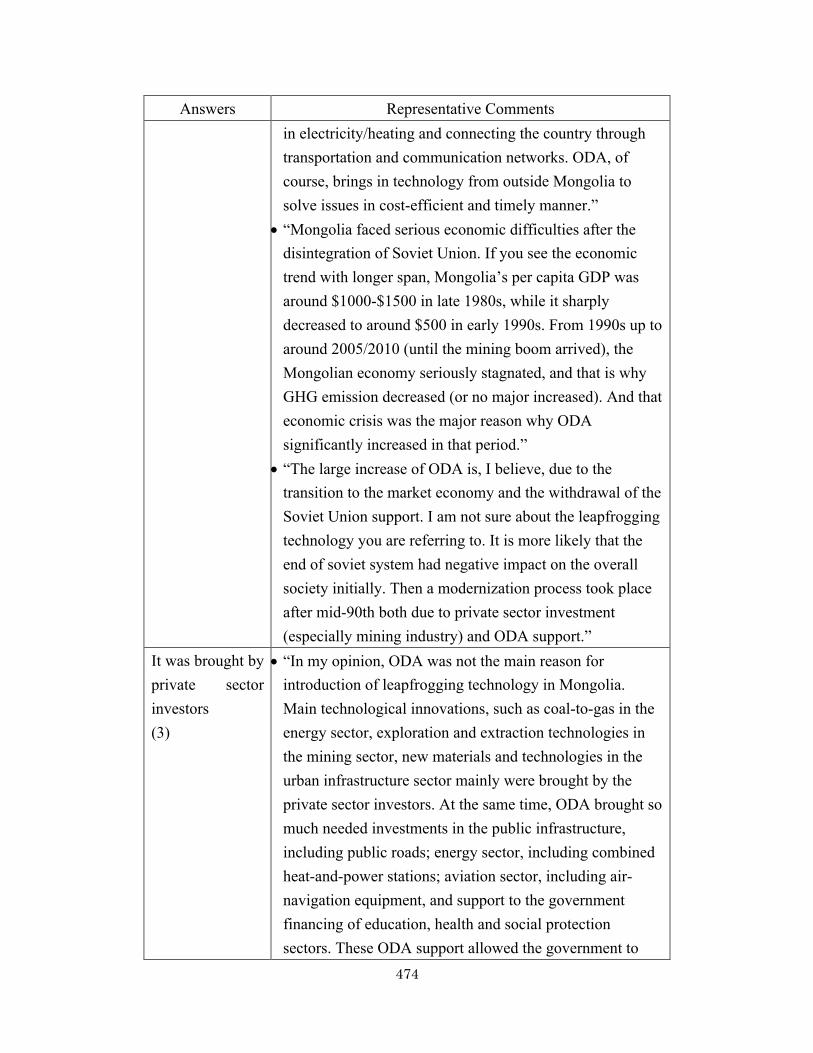
474
Answers Representative Comments in electricity/heating and connecting the country through transportation and communication networks. ODA, of course, brings in technology from outside Mongolia to solve issues in cost-efficient and timely manner.”
• “Mongolia faced serious economic difficulties after the disintegration of Soviet Union. If you see the economic trend with longer span, Mongolia’s per capita GDP was around $1000-$1500 in late 1980s, while it sharply decreased to around $500 in early 1990s. From 1990s up to around 2005/2010 (until the mining boom arrived), the Mongolian economy seriously stagnated, and that is why GHG emission decreased (or no major increased). And that economic crisis was the major reason why ODA significantly increased in that period.”
• “The large increase of ODA is, I believe, due to the transition to the market economy and the withdrawal of the Soviet Union support. I am not sure about the leapfrogging technology you are referring to. It is more likely that the end of soviet system had negative impact on the overall society initially. Then a modernization process took place after mid-90th both due to private sector investment (especially mining industry) and ODA support.”
It was brought by private sector investors (3)
• “In my opinion, ODA was not the main reason for introduction of leapfrogging technology in Mongolia. Main technological innovations, such as coal-to-gas in the energy sector, exploration and extraction technologies in the mining sector, new materials and technologies in the urban infrastructure sector mainly were brought by the private sector investors. At the same time, ODA brought so much needed investments in the public infrastructure, including public roads; energy sector, including combined heat-and-power stations; aviation sector, including air-navigation equipment, and support to the government financing of education, health and social protection sectors. These ODA support allowed the government to

475
Answers Representative Comments smoothen the transition period of early 1990-s, as well as passage through the financial crisis periods (Mongolia used IMF bailout 3 times since early 1990-s).”
• “a modernization process took place after mid-90th both due to private sector investment (especially mining industry) and ODA support.”
Mongolians place a high value on obtaining the latest technologies (1)
• “During informal discussions with Mongolian business people and government staff, it has been expressed to me several times that Mongolians place a high value on obtaining the latest technologies and wish to be up to date with global trends. In one example, a business man explained that the country needed certain medical technology, and even though there was no one qualified to operate it, the priority was to obtain it first.”
The numbers in parentheses in the table refers to the numbers of experts who mentioned the factor in their responses.

476
Table 58. Experts’ responses for the question #3 related to Mongolia Answers Representative Comments
The education improvement (9)
• “Education and health had been priority for major donors in Mongolia, including ADB, JICA, and to a lesser degree, the World Bank. There were also other bilateral donors (China (PRC), Republic of Korea, etc.) which supported education.”
• “ODA at that time includes education improvement, including trainings and capacity building to operate new facilities and to help the government in developing long term plans. Around 1990-2000 GHG emissions are not among the more urgent concerns, hence not the primary focus of ODA at that time. But sustainable development is among the focus then so ODA were seemed to be geared towards efficient resource use.”
• “(ODA) was vital support Mongolia during this period and it is true that donors placed high priority on improving education system and supporting energy sector through provision of technical supports.”
• “access to education to so called “Manhole children” had gotten some attention from donors. As Mongolia was socialist country, I believe that access to education and standard of education were high in general.”
The decreased GHG emissions from the energy sector (4)
• “Japan’s support on Mongolia in 90’s was in energy, transport, and telecommunication sector, and then, it was extended to education, health, and agricultural sector.”
• “At least, ADB has always put a priority in minimizing environmental impacts from the energy sector.”

477
• “ODA was only one of a multitudes factors for economic development of Mongolia…. One exemption is ADB’s financial assistance for upgrading combined heat and power stations in Ulaanbaatar. These projects helped the city improve efficiency of the city’s energy sector.”
• “The decreased GHG emissions from the energy sector could suggest that sources of GHG emissions may have used cleaner production technologies, improved their energy efficiency, or use renewable energy in their operations.”
The decreased GHG emissions from manufacturing/construction innovations (3)
• “(ii) and (iii) have always been the priorities of the donors in my understanding.”
All 3 of these key areas (4)
• “I am confident that the donors placed high importance on those factors during the design of the ODA projects”,
Others (2)
• “Presumably, the international standards applied for the Oyu Tolgoi mine make some contribution, to minimize environmental impacts and GHG emissions”
• “maybe just education for the energy sector because the companies need energy related workforce.”
The numbers in parentheses in the table refers to the numbers of experts who mentioned the factor in their responses.
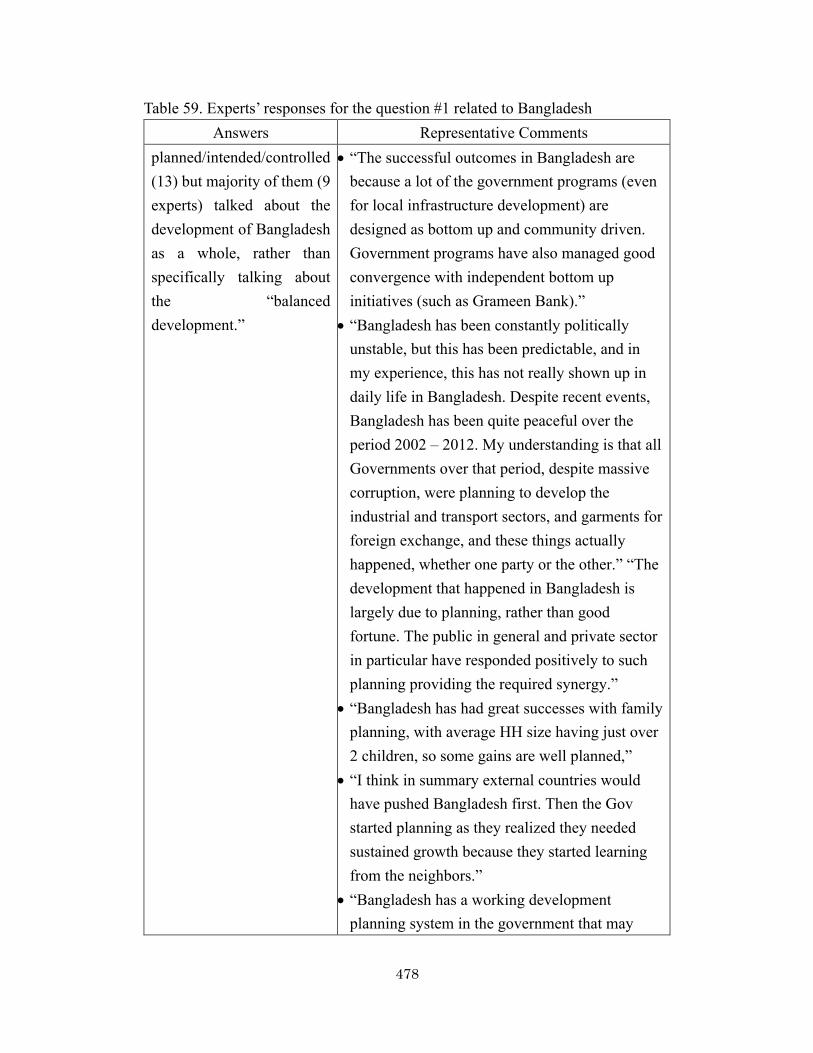
478
Table 59. Experts’ responses for the question #1 related to Bangladesh Answers Representative Comments
planned/intended/controlled (13) but majority of them (9 experts) talked about the development of Bangladesh as a whole, rather than specifically talking about the “balanced development.”
• “The successful outcomes in Bangladesh are because a lot of the government programs (even for local infrastructure development) are designed as bottom up and community driven. Government programs have also managed good convergence with independent bottom up initiatives (such as Grameen Bank).”
• “Bangladesh has been constantly politically unstable, but this has been predictable, and in my experience, this has not really shown up in daily life in Bangladesh. Despite recent events, Bangladesh has been quite peaceful over the period 2002 – 2012. My understanding is that all Governments over that period, despite massive corruption, were planning to develop the industrial and transport sectors, and garments for foreign exchange, and these things actually happened, whether one party or the other.” “The development that happened in Bangladesh is largely due to planning, rather than good fortune. The public in general and private sector in particular have responded positively to such planning providing the required synergy.”
• “Bangladesh has had great successes with family planning, with average HH size having just over 2 children, so some gains are well planned,”
• “I think in summary external countries would have pushed Bangladesh first. Then the Gov started planning as they realized they needed sustained growth because they started learning from the neighbors.”
• “Bangladesh has a working development planning system in the government that may

479
Answers Representative Comments have been instrumental in their balanced development”
• “Balanced development is well planned. Focus has been on health, education, skills development and reduction in greenhouse gas emissions, connectivity, electronic communication, and energy sector development. Bangladesh is also benefitting from its roles in regional cooperation.”
• “Since the Government does follow development plans I think that up to a certain extent the balanced development would have been planned and intended.”
• “The balance development that happened in Bangladesh was happed by planned/intended/controlled because the rapidly growing population has higher demand of consumption that happen to pressure on energy use. The higher pressure ultimately leads to increase the rate of GHG which is essential to control.”
Combination of good planning and fortune (3)
• “It is probably a combination of both. Bangladesh has a planned economy, but implementation of plans may not be great. We might say that Bangladesh got lucky but was ready to capitalize on that luck.”
• “BAN has a strong civil service and it may have worked with international players and guidance to achieve more with limited resources.”
Fortune (4)
• “I doubt whether it was planned or controlled. It was probably fortunate event. I think access to forests probably decreased due to poor infrastructure, and thus resulted in lower forestry practice.”
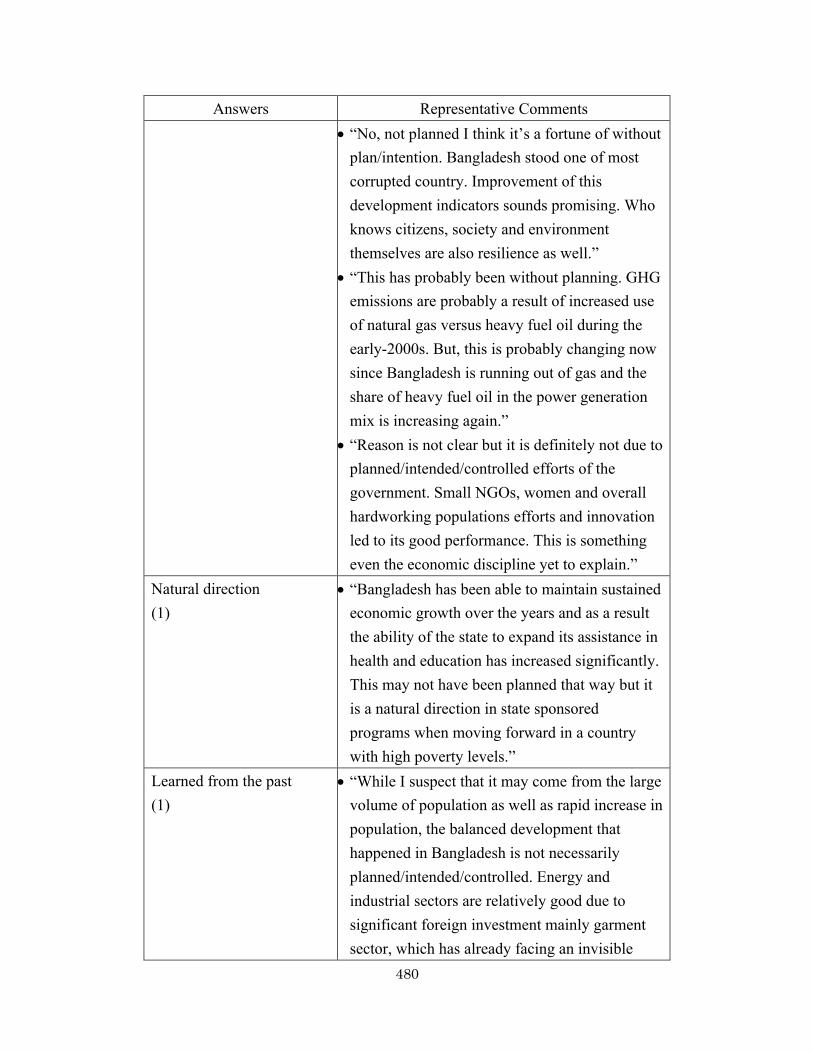
480
Answers Representative Comments • “No, not planned I think it’s a fortune of without
plan/intention. Bangladesh stood one of most corrupted country. Improvement of this development indicators sounds promising. Who knows citizens, society and environment themselves are also resilience as well.”
• “This has probably been without planning. GHG emissions are probably a result of increased use of natural gas versus heavy fuel oil during the early-2000s. But, this is probably changing now since Bangladesh is running out of gas and the share of heavy fuel oil in the power generation mix is increasing again.”
• “Reason is not clear but it is definitely not due to planned/intended/controlled efforts of the government. Small NGOs, women and overall hardworking populations efforts and innovation led to its good performance. This is something even the economic discipline yet to explain.”
Natural direction (1)
• “Bangladesh has been able to maintain sustained economic growth over the years and as a result the ability of the state to expand its assistance in health and education has increased significantly. This may not have been planned that way but it is a natural direction in state sponsored programs when moving forward in a country with high poverty levels.”
Learned from the past (1)
• “While I suspect that it may come from the large volume of population as well as rapid increase in population, the balanced development that happened in Bangladesh is not necessarily planned/intended/controlled. Energy and industrial sectors are relatively good due to significant foreign investment mainly garment sector, which has already facing an invisible

481
Answers Representative Comments wall due to hiking labor cost. On the other hand, Bangladesh development may not be necessarily sacrificing environment. Flooding and poor quality of water environment has already caused the detriment of environment. Government of Bangladesh recognized the issue, and their priority has been given to the shifting water source from groundwater to surface water, and the urgent need of solid waste management.”
The numbers in parentheses in the table refers to the numbers of experts who mentioned the factor in their responses.
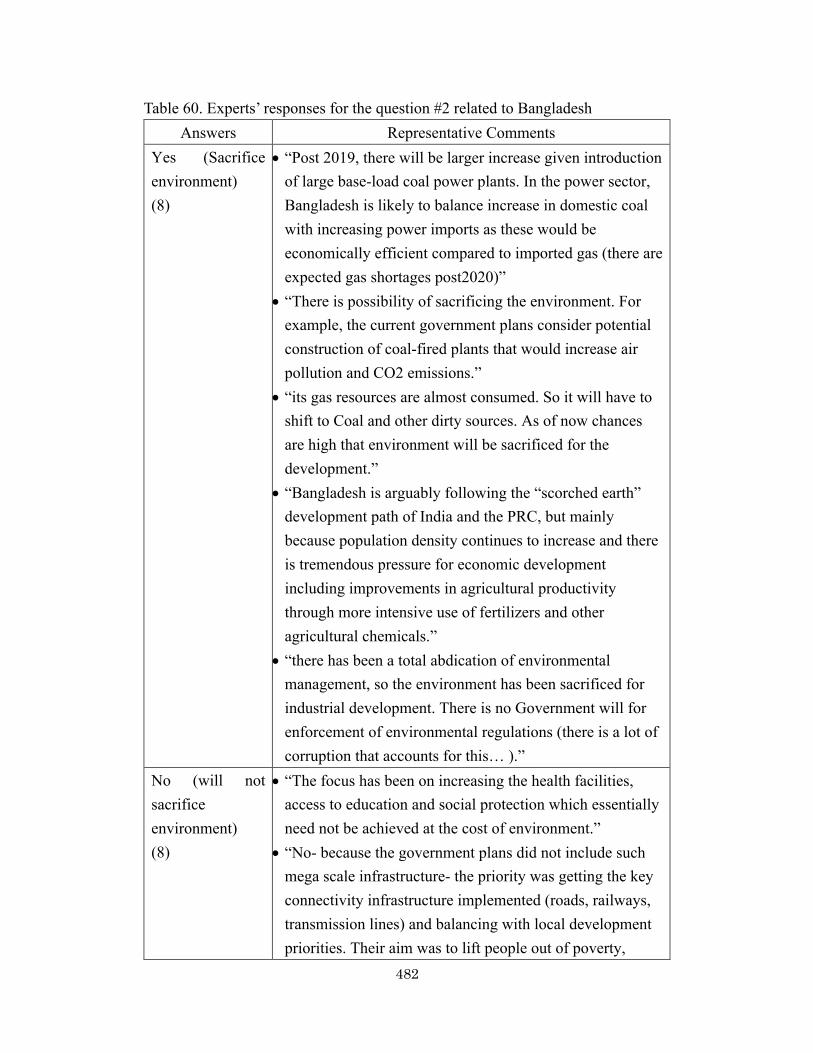
482
Table 60. Experts’ responses for the question #2 related to Bangladesh Answers Representative Comments
Yes (Sacrifice environment) (8)
• “Post 2019, there will be larger increase given introduction of large base-load coal power plants. In the power sector, Bangladesh is likely to balance increase in domestic coal with increasing power imports as these would be economically efficient compared to imported gas (there are expected gas shortages post2020)”
• “There is possibility of sacrificing the environment. For example, the current government plans consider potential construction of coal-fired plants that would increase air pollution and CO2 emissions.”
• “its gas resources are almost consumed. So it will have to shift to Coal and other dirty sources. As of now chances are high that environment will be sacrificed for the development.”
• “Bangladesh is arguably following the “scorched earth” development path of India and the PRC, but mainly because population density continues to increase and there is tremendous pressure for economic development including improvements in agricultural productivity through more intensive use of fertilizers and other agricultural chemicals.”
• “there has been a total abdication of environmental management, so the environment has been sacrificed for industrial development. There is no Government will for enforcement of environmental regulations (there is a lot of corruption that accounts for this… ).”
No (will not sacrifice environment) (8)
• “The focus has been on increasing the health facilities, access to education and social protection which essentially need not be achieved at the cost of environment.”
• “No- because the government plans did not include such mega scale infrastructure- the priority was getting the key connectivity infrastructure implemented (roads, railways, transmission lines) and balancing with local development priorities. Their aim was to lift people out of poverty,

483
Answers Representative Comments through infrastructure and community development that is more suited to their local context. The country is also quite exposed to climate change and has limited financial capacity for investing in mega infrastructure. The investment climate also did not attract large private sector players (who could “Bangladesh is highly sensitive to environmentally sustainable development.”
• “Considering the vulnerability of the country, it is a risky take if development is prioritized at the cost of environment.”
• “Even though there is no specific emphasis in reducing environmental impacts in the development programs, the awareness among the stakeholders of the need to be conscious of the adverse environmental impacts has driven the development programs to be more environmentally acceptable. Also, many of the development programs are largely funded by external development partners and hence environmental protection is embedded in the programs. Therefore, it is unlikely that Bangladesh will go through the same path as that of China (PRC) and India.”
• “The economic growth of Bangladesh has been driven mainly by external sector: (i) growth in remittance and (ii) growth in export of garments. They are not much affected by the state of politics, peace and ODA as domestic sector. In terms of HDI growth, large non-profit organizations, such as BRAC or Grameen, may have played a significant role in improving availability of quality education or healthcare services especially in rural areas.”
• “I do not agree that it be should happed as India and China (PRC) are doing. Because we should understand and analyze the political economy of the countries. Bangladesh do not have the same power that of China (PRC) and India in the world. Therefore, Bangladesh should be back to its strategies by the pressure of developed countries even India and China (PRC).”

484
Answers Representative Comments • “Bangladesh is somewhat lucky vis a vis India and China
(PRC) as the country possesses natural gas resources, a source of clean energy and which as of present is the basis for more than half of the country’s energy needs, to supplement increasing energy demand. The country has so far planned its energy resources well. If it were not for that planning, the situation would have been different, but not to the extent that of China (PRC) or India.”
Table 61. Experts’ responses for the question #3 related to Bangladesh
Answers Representative Comments Local development and rural electrification (4)
• “The present government has made goals on 100% electricity access and per-capita power consumption by 2021 and is working towards these targets.”
• “Local development through micro-credit, gramin development bank, Mohammad Yunus, Noble Laurette on Economics from Bangladesh.”
• “connectivity and clean energy.” • “Despite political confusion, Bangladesh has maintained a
reasonable level of planning and execution in all sectors, starting from proper planning in. energy…. .”
Foreign investments (2)
• “One of the policy measure taken is the FMA (Multi-Fiber Agreement). With FMA, the Government successfully invited foreign investments on the textile and garment subsector that did not produce much GHG and could absorb increased population by engaging them as cheap labor forces.”
• “Bangladesh policy makers have helped improve the climate for foreign investors and liberalizing the capital markets by making it a better investment for foreign firms for oil and gas exploration and construction of natural gas pipelines and power stations.”
Improve the living standard and poverty
• “The policy goal was set to improve the minimum living standard”

485
reduction (4)
• “Possibly, it is during this period that a Poverty Reduction Strategy Paper (PRSP), which is a development strategy document, allowed market mechanism as the driving force of development in Bangladesh.”
• “the policy goals and priorities set forth were in the areas of health care, quality of education, social security and improvement in the standard of living. The specific outcomes that were achieved were increase in health facilities, access to education and social protection.”
• “Bangladesh has a history of supporting strong social safety programs targeting the poor which may explain the small gap between top and bottom tiers.”
Job generation and low labor cost (3)
• “Manufacturing sector developed quickly lately, which contribute to job opportunities and economy development, for instance, Bangladesh has become the world second largest textile exporter, after China (PRC). I think the development should be driven by job generation to the People, in this case, even without political stability (such as the central government changes frequently), the economy generally still can be improved in a certain level.”
• “the country benefits from low wages and increases in textiles jobs (garments sector) resulting from wage increases in other countries like China (PRC) and Vietnam.”
• “Over the medium term, Bangladesh’s strength lies in competitive clothing sector thanks to relatively cheap labor.”
Supporting export-oriented industry and private sector (3)
• “the policies of supporting export-oriented manufacturing and private sector focusing at such industries as the textile industry through using the competitive advantage of low manufacturing cost (low labor cost).”
• “clothing sector” and “private sector.” Supports from development partners
• “Over the medium term, Bangladesh’s strength lies in …. international aid helping to cover financing needs”

486
(5) • “With improved political stability, and policy focus on capacity development, skills training, health, education, connectivity and clean energy together with regional cooperation and ODA support.”
• “do not have internal capacity to develop large scale infrastructure (both human resources and money). A lot of the money has come from the concerted efforts of development partners who also did not want to invest in mega infrastructure. I believe these development partners have significantly shaped the policy goals.”
• “whether one party or the other, there was a development plan, and development proceeded more or less as intended (although slow and subject to corruption). …while politics in Bangladesh were volatile, the predictability of “normal instability” allowed normal things to happen – life in the streets and construction of projects carried on… I have a sense that hundreds of millions of dollars poured into Bangladesh over the period you are interested in.”
• “The financial sector reforms in the country, which ADB supported, is regarded as one of the best in the region and supported proper capital allocation. Private sector has responded positively these changes.”
• “if total inflows did not increase noticeably from 2005; disbursement efficiency may have improved.”
Health and education (2)
• “Despite political confusion, Bangladesh has maintained a reasonable level of planning and execution in all sectors, starting from proper planning in education /health, energy, transport sectors etc.”
Others (1)
• “capacity development and skills training” • “the laws and rules either formal or informal (community-
based institution and indigenous knowledge and practices)”
• “proper planning” The numbers in parentheses in the table refers to the numbers of experts who mentioned the factor in their responses.
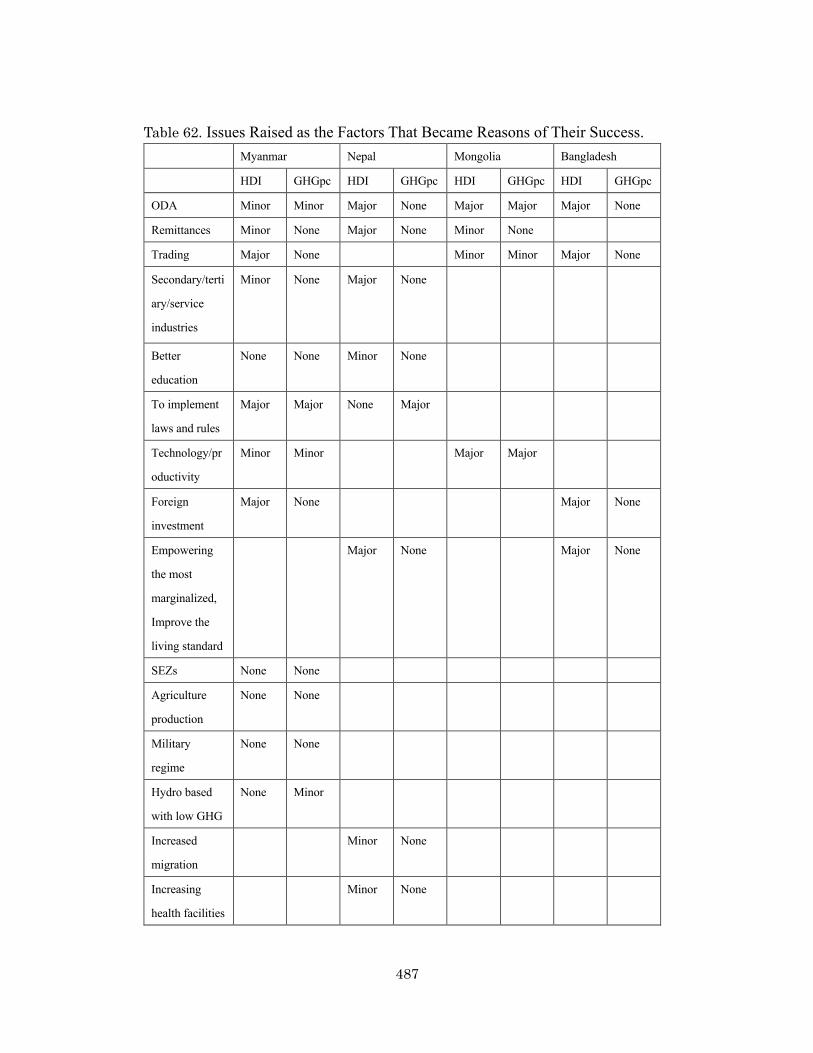
487
Table 62. Issues Raised as the Factors That Became Reasons of Their Success.
Myanmar Nepal Mongolia Bangladesh
HDI GHGpc HDI GHGpc HDI GHGpc HDI GHGpc
ODA Minor Minor Major None Major Major Major None
Remittances Minor None Major None Minor None
Trading Major None Minor Minor Major None
Secondary/terti
ary/service
industries
Minor None Major None
Better
education
None None Minor None
To implement
laws and rules
Major Major None Major
Technology/pr
oductivity
Minor Minor Major Major
Foreign
investment
Major None Major
None
Empowering
the most
marginalized,
Improve the
living standard
Major None Major
None
SEZs None None
Agriculture
production
None None
Military
regime
None None
Hydro based
with low GHG
None Minor
Increased
migration
Minor None
Increasing
health facilities
Minor None

488
Myanmar Nepal Mongolia Bangladesh
Government
and donors
funding for
health
Minor None
Access to
health services
by improved
rural roads
Minor None
Government
investment
Major None
Awareness-
raising
campaigns
Major Minor
Community
forestry
Minor Major
Alternative
energy options
Major Major
Pervasive
NGO
involvement
Major None
Change in
Agriculture
None Minor
Military
conflict ended
None None
Composition of
exported goods
None None
income
generating
activities at
local level
None None
Restraining
livestock
activities
None Minor

489
Myanmar Nepal Mongolia Bangladesh
Socialist
regime
None Minor
Opening up the
economy
Major None
Non GHG
emitting
productions
None Minor
Sparsely
populated
country
None Minor
Democratic
system
emerged
Major None
Enterprises
went bankrupt
None Major
Exports of coal
(and minerals)
Major
Minor
Severe climate None Minor
Local
development
and rural
electrification
Major
None
Job generation Major None
Health and
education
Major
None
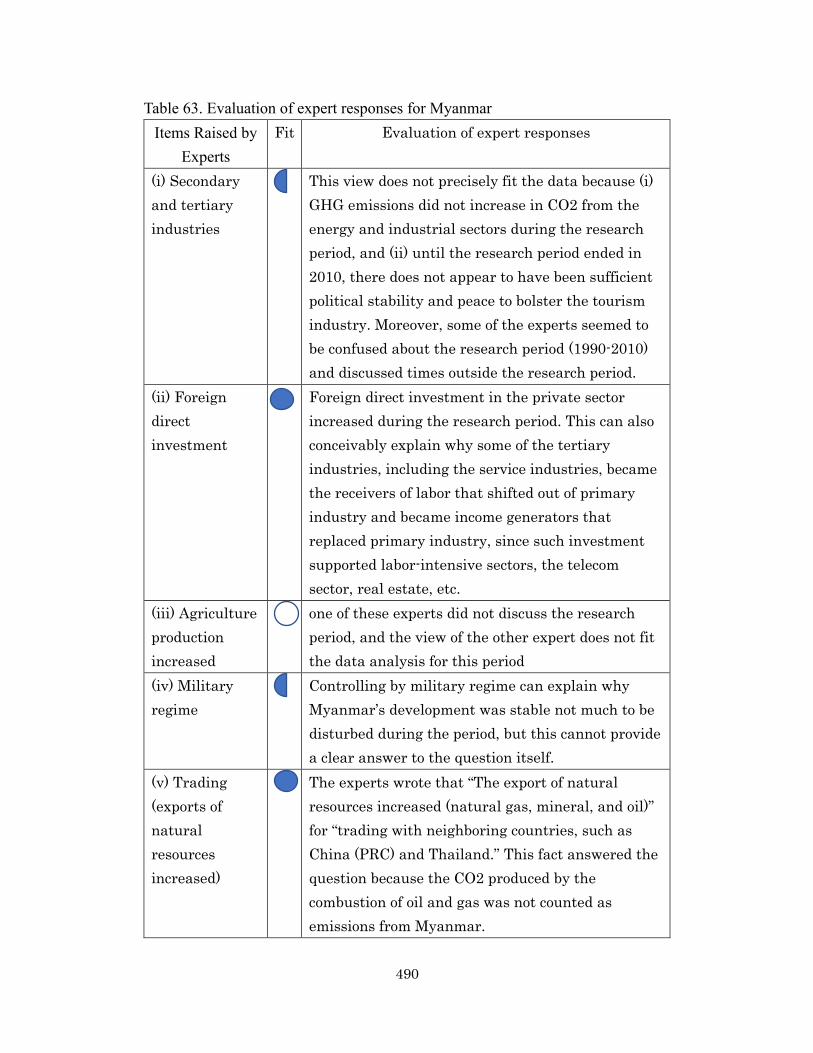
490
Table 63. Evaluation of expert responses for Myanmar Items Raised by
Experts Fit Evaluation of expert responses
(i) Secondary and tertiary industries
This view does not precisely fit the data because (i) GHG emissions did not increase in CO2 from the energy and industrial sectors during the research period, and (ii) until the research period ended in 2010, there does not appear to have been sufficient political stability and peace to bolster the tourism industry. Moreover, some of the experts seemed to be confused about the research period (1990-2010) and discussed times outside the research period.
(ii) Foreign direct investment
Foreign direct investment in the private sector increased during the research period. This can also conceivably explain why some of the tertiary industries, including the service industries, became the receivers of labor that shifted out of primary industry and became income generators that replaced primary industry, since such investment supported labor-intensive sectors, the telecom sector, real estate, etc.
(iii) Agriculture production increased
one of these experts did not discuss the research period, and the view of the other expert does not fit the data analysis for this period
(iv) Military regime
Controlling by military regime can explain why Myanmar’s development was stable not much to be disturbed during the period, but this cannot provide a clear answer to the question itself.
(v) Trading (exports of natural resources increased)
The experts wrote that “The export of natural resources increased (natural gas, mineral, and oil)” for “trading with neighboring countries, such as China (PRC) and Thailand.” This fact answered the question because the CO2 produced by the combustion of oil and gas was not counted as emissions from Myanmar.

491
Items Raised by Experts
Fit Evaluation of expert responses
It should be noted that this income increase was not a very environmentally friendly improvement, as it produced emissions outside Myanmar.
(vi) Special Economic Zones (SEZs)
The first SEZ in Myanmar was built in 2012-15 and so was outside the research period. Therefore, this cannot be the answer to the question.
(vii) ODA While the data analysis did not observe much quantitative increase in total ODA during the period, these experts indicated the possibility of qualitative improvement caused by the ODA even though the amount was not significant. The researcher cannot find any reasons to exclude this possibility. At the same time, this explanation seems too weak to have produced Myanmar’s success, which was the most significant success in Asia during this period.
(viii) Better education system
The question specifically asks about the improvement of the income component among the three HDI indicators. In addition, the benefits achieved by education improvement (which produces responsive citizens) cannot provide a tangible answer to the question itself.
(ix) Implementation of laws and rules in the forestry sector
The implementation of laws and rules in the forestry sector, which can create conditions that are more favorable for receiving FDI, improved the efficiency of forestry and agriculture, which may have reduced emissions from these sectors or caused inefficient activities to be phased out of these sectors.
(x) Remittances from overseas
While several experts pointed out this explanation for Nepal, only one response from a Myanmar expert raised the issue of remittances from overseas workers. While remittances could have been one of the reasons the income component improved

492
Items Raised by Experts
Fit Evaluation of expert responses
without increasing GHGs, their significance in Myanmar was not as great as in Nepal (More people gave this answer for Nepal).
(xi) Technology increases productivity
Two experts highly evaluated the benefits provided by technology improvements. These two experts indicate two different possibilities. One indicated that ODA and FDI expedited technology improvements in efficiency, while another indicated that the implementation of laws and rules in the forestry sector increased the efficiency of the forestry industry and, as a result, freed up additional labor that shifted to other industries.
(xii) Hydro-based energy with low GHG emissions
the additional energy needs produced by the shift out of the agriculture and forest industries were met by non-GHG-emitting sources, namely hydropower. But this cannot provide a clear answer to the question itself.
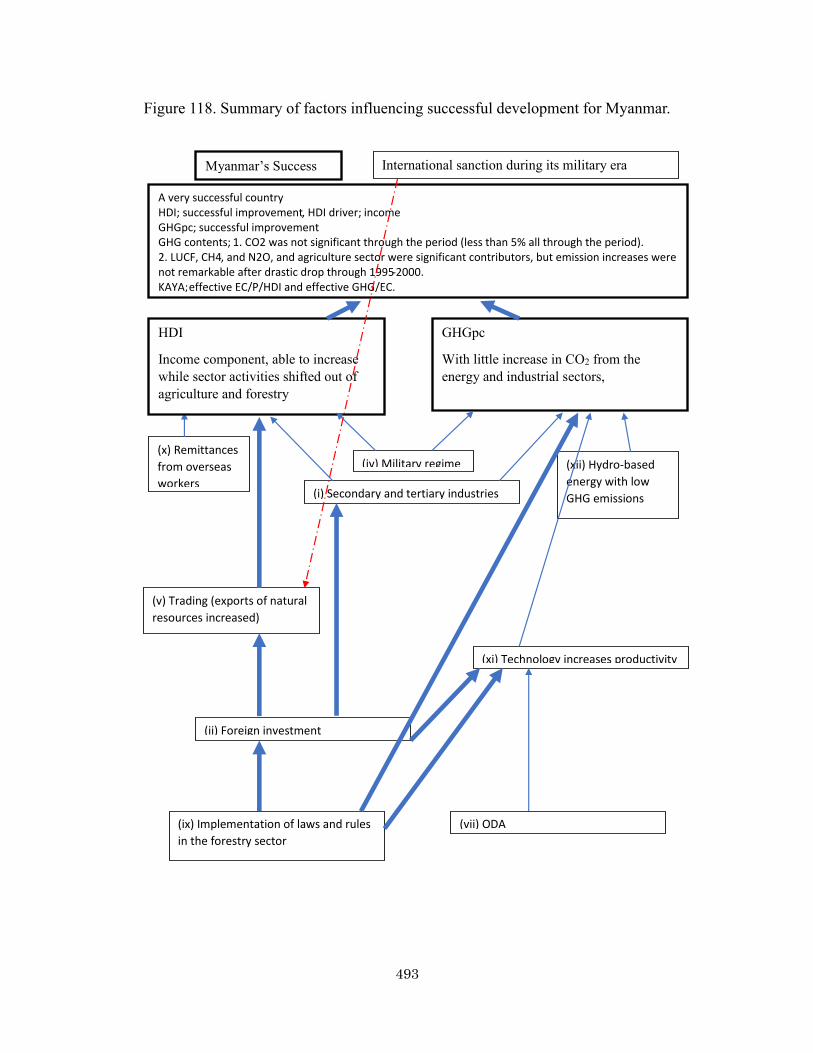
493
Figure 118. Summary of factors influencing successful development for Myanmar.
Myanmar’s Success
(i) Secondary and tertiary industries
(ii) Foreign investment
(v) Trading (exports of natural resources increased)
(xii) Hydro-based energy with low GHG emissions
(vii) ODA (ix) Implementation of laws and rules in the forestry sector
(xi) Technology increases productivity
(x) Remittances from overseas workers
HDI
Income component, able to increase while sector activities shifted out of agriculture and forestry
GHGpc
With little increase in CO2 from the energy and industrial sectors,
International sanction during its military era
(iv) Military regime
A very successful country HDI; successful improvement, HDI driver; income GHGpc; successful improvement GHG contents; 1. CO2 was not significant through the period (less than 5% all through the period). 2. LUCF, CH4, and N2O, and agriculture sector were significant contributors, but emission increases were not remarkable after drastic drop through 1995-2000. KAYA; effective EC/P/HDI and effective GHG/EC.
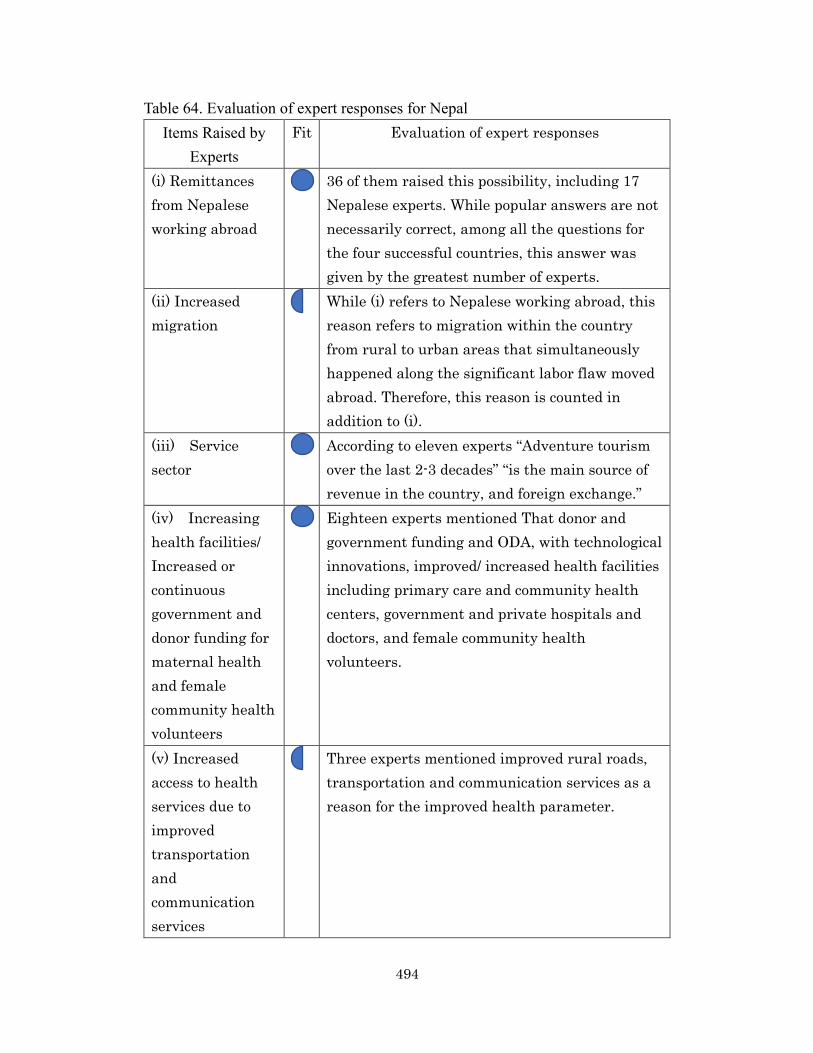
494
Table 64. Evaluation of expert responses for Nepal Items Raised by
Experts Fit Evaluation of expert responses
(i) Remittances from Nepalese working abroad
36 of them raised this possibility, including 17 Nepalese experts. While popular answers are not necessarily correct, among all the questions for the four successful countries, this answer was given by the greatest number of experts.
(ii) Increased migration
While (i) refers to Nepalese working abroad, this reason refers to migration within the country from rural to urban areas that simultaneously happened along the significant labor flaw moved abroad. Therefore, this reason is counted in addition to (i).
(iii) Service sector
According to eleven experts “Adventure tourism over the last 2-3 decades” “is the main source of revenue in the country, and foreign exchange.”
(iv) Increasing health facilities/ Increased or continuous government and donor funding for maternal health and female community health volunteers
Eighteen experts mentioned That donor and government funding and ODA, with technological innovations, improved/ increased health facilities including primary care and community health centers, government and private hospitals and doctors, and female community health volunteers.
(v) Increased access to health services due to improved transportation and communication services
Three experts mentioned improved rural roads, transportation and communication services as a reason for the improved health parameter.

495
Items Raised by Experts
Fit Evaluation of expert responses
(vi) Support from various development partners
While the data analysis showed that ODA did not increase during the research period, 11 experts highly evaluated the positive impacts provided by support from donors, regardless of the amount. “It is experienced that ODAs support was significant even when the state of political stability and peace was fragile in Nepal.”
(vii) Government investment and efforts
In addition to support from various development partners, nine experts (including one negative view) mentioned government investment as the reason for the success. Two experts focused particularly on the government’s efforts to achieve an inclusive growth. Government efforts were beneficial for clean energy improvement, education through programs such as literacy improvement, for improving heath by better insurance policy, child mortality and clean water, and income poverty reduction. Education indirectly helped to improve health.
(viii) Awareness-raising campaigns/ activities
This can be treated as one of the government efforts mentioned above, designated by 11 experts as a remarkable issue. Those campaigns and activities became beneficial for improving health of rural people. In addition, one expert mentioned growing awareness of climate as one of the main reasons for the reduction of GHG.
(ix) Laws and rules related to forests in the legal sense
Their views supported the validity of the finding in the data analysis, clarifying one of the reasons activities shifted out of Nepal’s forestry business. Concern for flooding, landslides and earthquakes enhanced forest conservation and land regulation, then those helped GHG emission reductions and management of forest resources.

496
Items Raised by Experts
Fit Evaluation of expert responses
(x) Community forestry
As in (x), one of the findings from the data analysis was supported by 12 experts: “The sudden decrease in emissions from LUFC may have been a result of the establishment of laws and rules related to forestry throughout the period 1976-2003.” Ten experts focused particularly on the benefits derived from the establishment of community forestry as the core policy which contributed to forest conservation and income generation activities.
(xi) Alternative energy options
Ten experts mentioned the promotion of alternative energy options in Nepal. These experts, rather than answering the question directly, cited it as the reason for Nepal’s good performance in GHGpc because it carried the possibility of contributing to a reduction in wood consumption (which means shifting out of forestry). Some of them particularly mentioned the in-house usage of fuel that induces smoke pollution.
(xii) Education Education and media including adult literacy and awareness programme contributed health improvements, and also better education contributed young people to get rid of forestry business.
(xiii) Pervasive NGO involvement
Nepal has been “the darling of the NGO community” and significant contributions were done by healthcare and hospitals partnering with NGOs/INGOs and by shifting out of forestry due to the promotion of renewable technology by different INGOs/NGOs.
(xiv) Change in agriculture
3 experts raised (i) growth of the agriculture sector, and (ii) reductions in fertilizer use and other agricultural efficiency improvements

497
Items Raised by Experts
Fit Evaluation of expert responses
contributed CH4 and N2O reduction which shows up in the LULUCF accounting but it did not show a perfect fit with the trajectories.
(xv) Military conflict ended
Starting of a new era of peace in 2005-06 may account for most of the health and income improvements, but the trajectories did not show much differences before and after 2005.
(xvi) Composition of exported goods
India where is a Nepal’s major trading partner changed their needs for imported goods from Nepal. They need less woods and more textiles including carpets.
(xvii) Small-scale entrepreneurship/ income-generating activities at the local level
Small scale entrepreneurships/ local resources base enterprises resulted increase the income
(xviii) Limiting livestock activities
Improved productivity of animals reduced GHGs emission per unit animal products
(xix) Empowering the most marginalized in society
In Nepal, the greater attention has been given to promote empowerment of the most marginalized group for poverty reduction.

498
Figure 119. Summary of factors influencing successful development for Nepal
(ii) Increased migration
(i) Remittances from Nepalese working abroad
(iii) Service sector
(xv) Change in agriculture
(ix) Awareness-raising campaigns/ activities
(vi) Increased access to health services due to improved transportation and communication services
(iv) Increasing health facilities/ Increased or continuous government and donor funding for maternal health and female community health volunteers
(xx) Empowering the most marginalized in society
(xix) Limiting livestock activities
(xii) Alternative energy options
HDI
health and income components able to improve
GHGpc
sector activities shifted out of forestry
Nepal’s lack of political stability
(x) Laws and rules related to forests in the legal sense
(xi) Community forestry
India’s demand for woods from Nepal decreased
(xvii) Composition of exported goods
(xviii) Small-scale entrepreneurship/ income-generating activities at the local level
A very successful country HDI; tolerable improvement, HDI driver; health GHGpc; successful improvement GHG contents; 1. CO2 was not significant through the period (less than 10% all through the period). 2. LUCF, CH4, and agriculture sector were significant contributors. KAYA; effective EC/P/HDI and effective GHG/EC.
Nepal’s Success

499
Table 65. Evaluation of expert responses for Mongolia Items Raised by Experts
Fit Evaluation of expert responses
(i) Socialist regime
Two experts cited the socialist regime as the answer to the question, looking at it from different angles. One expert treated it from a positive angle, explaining that the restrictions imposed by the socialist regime produced “green development,” while the other treated it from a negative angle, saying that the withdrawal of Soviet support for the country had led to a slowdown in the economy and the industrial sector, and therefore a fall in related emissions. Considering that the withdrawal of Soviet support happened just before the research period began in 1990, the view that a slowdown in the economy and the industrial sector caused a fall in related emissions makes sense. However, this is not enough to explain why the HDI income component was able to maintain steady improvement with decreased GHG emissions.
(ii) Growth of the service sector and private- and public-sector trading
These responses by the experts are consistent with the findings: HDI’s income component was able to maintain steady improvement with decreased GHG emissions because mining and some service sectors were expanding with little increase in GHGs while revenue increased. However, the reason this transition happened is not clear.
(iii) Efficiency and technology
These views indicate that before the research period, the technology used in the energy and manufacturing sectors introduced to Mongolia by the USSR was less efficient, and it was improved by modernization. ODA seem to have been helpful in this modernization.
(iv) Opening up the economy
After the withdrawal of the socialist regime, the opening up of the economy to private sector participation can explain why HDI’s income

500
Items Raised by Experts
Fit Evaluation of expert responses
component maintained steady improvement. It is necessary, however, to learn the details of what happened.
(v) Non-GHG-emitting production
Such production may have been happening at that time, but the question was about decreased GHG emissions from the energy sector but not from production, so this answer does not perfectly fit as the answer to the question.
(vi) Sparsely populated country so did not fit with large-scale manufacturing and the energy industry
It can modestly justify the finding of “decreased GHG emissions from the energy sector throughout the period 1990-2000,” since the centralization in Ulaanbaatar of the population along with the population increase is assumed to have started in this period.
(vii) Emergence of a democratic system
It is reasonable to think that the emergence of a democratic system created favorable conditions for investment in Mongolia that explain why HDI’s income component maintained steady improvement, but it does not show a clear justification for the decreased GHG emissions from the energy sector in 1990-2000.
(viii) Majority of industrial enterprises went bankrupt
This explanation points to the negative view of the socialist regime. While it explains the decreased GHG emissions as in (i), it cannot adequately explain why the HDI income component was able to maintain steady improvement.
(ix) International bilateral and multilateral
Observing the data that show that ODA amounts for Mongolia increased during the period, this high evaluation of ODA fits with the finding that the income component maintained steady improvement

501
Items Raised by Experts
Fit Evaluation of expert responses
donor organization
with decreased GHG emissions from the energy sector in 1990-2000.
(x) Exports of coal (and minerals) for which GHG emissions are reported in the country of final use
This can reasonably explain why Mongolia’s HDI, particularly its income component, was able to maintain steady improvement with decreased GHG emissions from the energy sector throughout the period 1990-2000, since the exports did not increase GHG emissions from Mongolia.
(xi) Severe weather and climate
This may explain the lack of increase in GHG emissions (although during the winter, coal incineration could have increased for heating purposes), but it does not explain why Mongolia’s HDI, particularly its income component, was able to maintain steady improvement.
(xii) Overseas remittances
This can be part of the reason for the increase in income while GHG emissions decreased; it was also applicable to Myanmar and Nepal. However, remittances cannot be a major or obvious reason for the trajectory found by the data analysis. Actually, remittances in Mongolia in 2009 was only 4.9% of GNI, while remittances in Nepal was 23.3% of GNI.6
6 Dilip Ratha; Sanket Mohapatra; and Ani Silwal. “The Migration and Remittances Factbook 2011.”
Migration and Remittances Unit, World Bank/June 10, 2018.
http://siteresources.worldbank.org/INTPROSPECTS/Resources/334934-
1199807908806/Mongolia.pdf. Accessed June 10, 2018.
Dilip Ratha; Sanket Mohapatra; and Ani Silwal. “The Migration and Remittances Factbook 2011.”
Migration and Remittances Unit, World Bank/June 10, 2018.
http://siteresources.worldbank.org/INTPROSPECTS/Resources/334934-
1199807908806/Nepal.pdf. Accessed June 10, 2018.

502
Figure 120. Summary of factors influencing successful development for Mongolia
Mongolia’s Success
HDI
Its income component, able to maintain steady improvement
GHGpc
With decreased GHG emissions from the energy sector throughout the period 1990-2000, particularly from manufacturing/construction
(iii) Efficiency and technology
(ii) Growth of the service sector and private- and public-sector trading
(i) Socialist regime
(xii) Overseas remittances
(xi) Severe weather and climate
(v) Non-GHG-emitting production
(iv) Opening up the economy
(ix) International bilateral and multilateral donor organization
(vi) Sparsely populated country so did not fit with large-scale manufacturing and the energy industry
(x) Exports of coal (and minerals) for which GHG emissions are reported in the country of final use
(viii) Majority of industrial enterprises went bankrupt
Crisis after the disintegration of the Soviet Union
Partially successful country HDI; marginal improvement, HDI driver; education GHGpc; successful improvement GHG contents; LUFC dominated through 1990-2005. All other GHG emissions had been stable or even decreased from 1990 till 2000 . CO2, CH4, and N2O started increase from 2005 because of agriculture sector and electricity/ hea t, manufacturing/ construction, and other fuel combustion KAYA; effective EC/P/HDI

503
Table 66. Evaluation of expert responses for Bangladesh Items Raised by Experts
Fit Evaluation of expert responses
(i) Local development
Local development was enhanced “through micro-credit, gramin development bank (sic), Mohammad Yunus, and Noble Laurette on Economics (sic).”
(ii) Foreign investments
Government successfully provided better condition for foreign firms and investments on the textile and garment subsector as well as oil and gas exploration, construction of natural gas pipelines and power stations that did not produce much GHG to accommodate needs by increased population.
(iii) Improvement in the standard of living and poverty reduction
It was during this period that a Poverty Reduction Strategy Paper (PRSP), which is a development strategy document, allowed market mechanism as a driving force of development in Bangladesh. Government prioritized to improve the minimum living standard from the areas of health care, quality of education, social security, and strong social safety programs targeting the poor.
(iv) Job generation and low labor costs/ Supporting export-oriented industry and the private sector
The policies of supporting export-oriented manufacturing and private sector such as textiles jobs (garments sector) that came along with job generation by low wages. Even without political stability, the economy generally still can be improved in a certain level.
(v) Support from development partners
The financial sector reform supported by development partners was one of the best in the region and supported proper capital allocation to which private sector has responded positively then promoted foreign investments.

504
Items Raised by Experts
Fit Evaluation of expert responses
(vi) Planning and execution
“Despite political confusion, Bangladesh has maintained a reasonable level of planning and execution in all sectors, starting from proper planning in education/health, energy, transport sectors.”
(vii) Other One expert mentioned each of the following: capacity development and skills training, formal or informal laws and rules (community-based institutions and indigenous knowledge and practices), and proper planning.
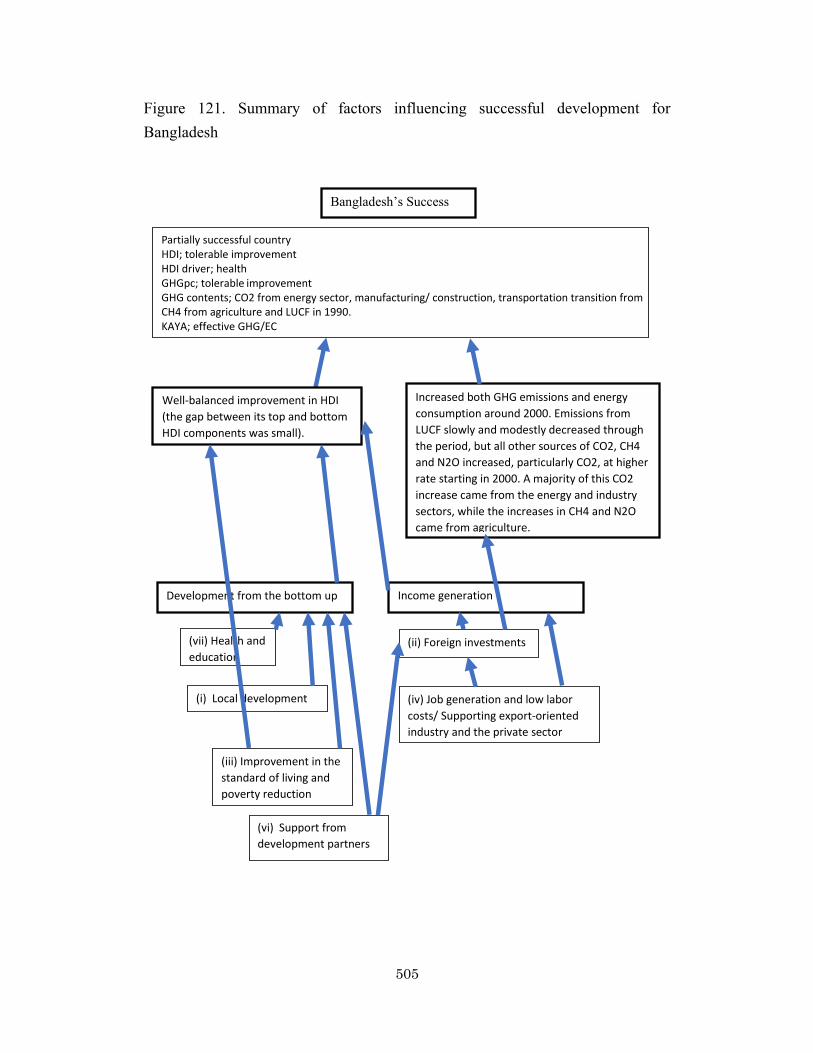
505
Figure 121. Summary of factors influencing successful development for Bangladesh
Bangladesh’s Success
(vi) Support from development partners
(vii) Health and education
(iv) Job generation and low labor costs/ Supporting export-oriented industry and the private sector
(iii) Improvement in the standard of living and poverty reduction
(ii) Foreign investments
(i) Local development
Increased both GHG emissions and energy consumption around 2000. Emissions from LUCF slowly and modestly decreased through the period, but all other sources of CO2, CH4 and N2O increased, particularly CO2, at higher rate starting in 2000. A majority of this CO2 increase came from the energy and industry sectors, while the increases in CH4 and N2O came from agriculture.
Development from the bottom up Income generation
Well-balanced improvement in HDI (the gap between its top and bottom HDI components was small).
Partially successful country HDI; tolerable improvement HDI driver; health GHGpc; tolerable improvement GHG contents; CO2 from energy sector, manufacturing/ construction, transportation transition from CH4 from agriculture and LUCF in 1990. KAYA; effective GHG/EC

506
Table 67. Evaluations of expert responses by degree of fit with HDI and GHGpc goals by the four successful countries
Items Raised
by Experts
Myanmar Nepal Mongolia Bangladesh
HDI GHGpc HDI GHGpc HDI GHGpc HDI GHGpc
ODA
Remittances/
migration
Trading
Secondary/terti
ary/service/
local level
industries
Better
education
Laws and rules
Renewable
energies/ Non-
GHG-emitting
productions
Technology/pr
oductivity
Foreign
investment
Empowerment
of the most
marginalized/
improvement
in the standard
of living/ Local
development
Agriculture
production/
Change in
agriculture/

507
Items Raised
by Experts
Myanmar Nepal Mongolia Bangladesh
HDI GHGpc HDI GHGpc HDI GHGpc HDI GHGpc
Limiting
livestock
activities
Military
regime
Improving
access to
health services
Government
investment
Awareness-
raising
campaigns
Community
forestry
Pervasive
NGO
involvement
End to military
conflict/
Opening up the
economy
Socialist
regime/
Enterprises
went bankrupt/
Emergence of
democracy
Geological
reasons
Job generation

508
Table 68. Relations between the Items raised by Experts and SDG Goals Items Raised by Experts SDG Goals Related Countries
ODA NA Myanmar
Nepal
Mongolia
Bangladesh
Remittances/ migration GOAL 8: Decent Work and
Economic Growth
Myanmar
Nepal
Mongolia
Trading GOAL 8: Decent Work and
Economic Growth
Myanmar
Nepal
Mongolia
Bangladesh
Secondary/tertiary/service/
local level industries
GOAL 8: Decent Work and
Economic Growth
Myanmar
Nepal
Better education GOAL 4: Quality Education Nepal
Bangladesh
Laws and rules NA Myanmar
Nepal
Renewable energies/ Non-
GHG-emitting productions
GOAL 7: Affordable and
Clean Energy
Myanmar
Nepal
Mongolia
Technology/productivity GOAL 7: Affordable and
Clean Energy
GOAL 13: Climate Action
Myanmar
Mongolia
Foreign investment GOAL 8: Decent Work and
Economic Growth
Myanmar
Bangladesh
Empowerment of the most
marginalized/ improvement in
the standard of living/ Local
development
GOAL 1: No Poverty
GOAL 2: Zero Hunger
Nepal
Bangladesh
Agriculture production/
Change in agriculture/ Limiting
livestock activities
GOAL 13: Climate Action Nepal
Military regime GOAL 1: No Poverty Myanmar

509
Items Raised by Experts SDG Goals Related Countries
Improving access to health
services
GOAL 3: Good Health and
Well-being
Nepal
Government investment NA Nepal
Awareness-raising campaigns GOAL 4: Quality Education Nepal
Community forestry GOAL 13: Climate Action Nepal
Pervasive NGO involvement NA Nepal
End to military conflict/
Opening up the economy
GOAL 8: Decent Work and
Economic Growth
Mongolia
Socialist regime/ Enterprises
went bankrupt/ Emergence of
democracy
NA Mongolia
Geological reasons NA Mongolia
Job generation GOAL 8: Decent Work and
Economic Growth
Bangladesh

510
Table 69. Relations between the Successes and SDG Goals SDGs Bangladesh
(HDI; tolerable improvement driven by health GHGpc; tolerable improvement)
Myanmar (HDI; successful improvement driven by income GHGpc; successful improvement)
Mongolia (HDI; marginal improvement driven by education GHGpc; successful improvement)
Nepal (HDI; tolerable improvement driven by health GHGpc; successful improvement)
Goals related to Health
GOAL 2: Zero Hunger
GOAL 3: Good Health and Well-being
GOAL 6: Clean Water and Sanitation
NA NA NA NA
Goal related to Education
GOAL 4: Quality Education
Goals related to Income
GOAL 1: No

511
Poverty GOAL 8: Decent Work and Economic Growth
Goals related to GHGpc
GOAL 7: Affordable and Clean Energy
GOAL 13: Climate Action
Table 70. Validity of the Original Four Hypotheses for the Successful Four Countries
Groups Countries Hypotheses 1 Hypotheses
2
Hypotheses
3
Hypotheses 4
Very
successful
Myanmar
(GHGpc)
(From
agriculture and
forestry to
experts in
natural
resources and
tertiary
industries)
Nepal
(HDI health
(India’s
(From forestry
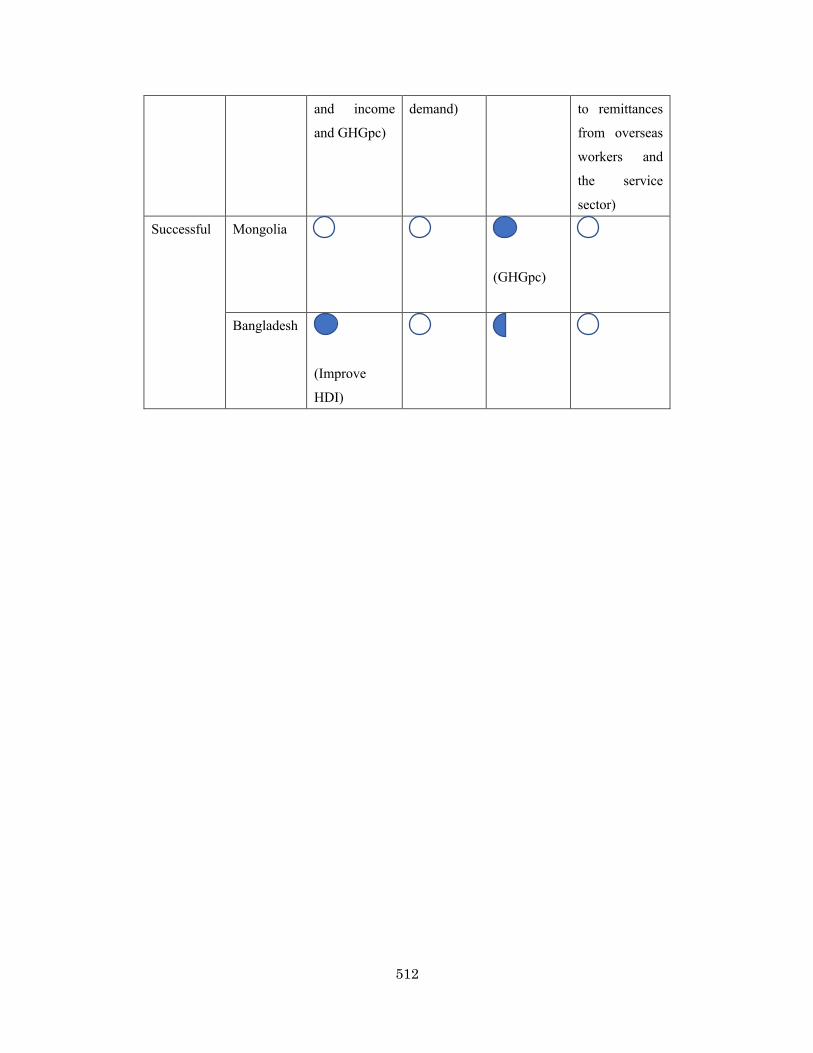
512
and income
and GHGpc)
demand) to remittances
from overseas
workers and
the service
sector)
Successful Mongolia
(GHGpc)
Bangladesh
(Improve
HDI)

513
APPENDIX B: QUESTIONNAIRE
Questionnaires for the experts sent by emails.
A. Introduction
Your expert assessment will be helpful for my research on “successful
development” through 1990-2010. This research is being conducted as part of my
academic activity, and not related with my position at ADB, and my request to
participate into my survey is only a personal request as a friend.
I tried to design this questionnaire for you to be able to complete within
one hour of your valuable time. It may take 20 minutes to read the 5 questions (I
would be very grateful if you could please provide answers to any questions on
which you have insight: feel free to skip the others if you feel you do not want or
you feel you cannot). It should take less than 40 minutes to provide your views.
Moreover, your preference on anonymity will be fully implemented if you
request it under Question H.
After reading those questionnaires, you can decide if you can kindly agree
to participate into this survey, then only if you will to participate into this survey,
please send me your agreement/consent at first. With your agreement/consent, it
will be very helpful if you can kindly introduce other experts to whom I should also
514
try to ask his/her participations in addition to yours. I will appreciate when you can
kindly send me back your responses within one week from today. If you forget to
send me your agreement/consent but send me your responses, then I automatically
suppose that you agreed to participate into the survey. Please use for your valuable
reply my email address ([email protected]) which is in the
CC list of this email.
B. Summary of my research
My research is related to “successful development” through 1990-2010,
which I defined as development that achieved successful performance in two
important measures, HDI 7 which has 3 components of income, health, and
education, and Greenhouse Gas per capita (GHGpc)8 since this can be a showcase
of development without sacrificing environmental improvement. I analyzed the
available data of 130 countries in the world, then did further detailed analysis on
7 The Human Development Index (HDI) is a composite statistic of life expectancy, education, and income indices to rank countries into four tiers of human development. It is a tool developed by the United Nations to measure and rank countries’ levels of social and economic development based on four criteria: Life expectancy at birth, mean years of schooling, expected years of schooling and gross national income per capita. The HDI makes it possible to track changes in development levels over time and to compare development levels in different countries. (SOURCE: UNDP) 8 Climate Analysis Indicators Tool (CAIT) 2.0. ©2014. Washington, DC: World Resources Institute. Available online at: http://cait2.wri.org. Please Note: CAIT data are derived from several sources. Full citations are available at http://cait2.wri.org/faq.html#q07. Any use of LULUCF (net forest conversion) data should be cited as FAO 2014, FAOSTAT Emissions database, http://faostat3.fao.org/faostat-gateway/go/to/browse/G2/*/E.

515
14 Asian developing countries that are Myanmar, Nepal, Mongolia, Bangladesh,
Pakistan, Philippines, Sri Lanka, Vietnam, India, Thailand, Indonesia, China (PRC),
Republic of Korea, and Malaysia. My findings were that among those 14 countries,
Myanmar and Nepal showed very successful development during the research
period since Myanmar’s performances in HDI and in GHGpc were both categorized
as a very successful country, and Nepal’s performance in HDI was categorized as a
successful country and in GHGpc was categorized as a very successful country.
Bangladesh and Mongolia also showed successful development during the research
period since Bangladesh’s performance in HDI was categorized as a successful
country and in GHGpc was categorized also as a successful country, and
Mongolia’s performance in HDI was categorized as an marginal country but in
GHGpc was categorized as a very successful country.
Below is a summary of findings on each of these 4 countries and related
questions for which I am requesting your valuable insights.
C. Myanmar
1. Findings from my data analysis
Myanmar’s remarkable improvement of HDI was achieved mainly by

516
income increase. In the meantime, The GHGpc decrease in Myanmar was basically
caused by the reduction of GHG that followed the reductions of emissions from
Land Use Change and Forests (LUCF), and the gases from agriculture methane
(CH4) and nitrous oxide (N2O) even while population increased. The decreased
emission from LUFC may be a result of laws and rules related to forestry through
1992-959. These data showed that sector activities in Myanmar shifted out of
agriculture and forestry without damaging its economy. Moreover, Myanmar’s
successful development has been achieved without (i) political stability, (ii)
democracy, and (iii) increasing ODAs.
2. Questions
Why is Myanmar’s HDI, particularly its income component, able to
increase while sector activities shifted out of agriculture and forestry without much
increase in CO2 from energy and industrial sectors, and without political stability,
peace and increasing ODA?
D. Nepal
1. Findings from my data analysis
Nepal’s remarkable improvement of HDI was achieved mainly by health
9 The Forest Law (1992), Myanmar Forest Policy, Forest Rules, Community Forestry Instruction (1995)

517
improvement from 2005, and modest income component improvement. In the
meantime, Nepal’s very successful performance on GHGpc was caused by GHG
reduction from the reduction of GHG from LUCF started from 2000 while the
population increased. The sudden decrease of the emission from LUFC may be a
result of those establishments of laws and rules related to forestry through the
period of 1976-200310. These data showed that sector activities in Nepal shifted out
of forestry around 2000 without damaging its economy.
Moreover, Nepal’s successful development has been achieved without (i) political
stability, (ii) peace, or (iii) increasing ODAs.
2. Questions
Why was Nepal’s HDI, particularly its health and income component able
to improve while sector activities shifted out of forestry without political stability,
peace or increasing ODAs?
E. Mongolia
1. Findings from my data analysis
10 National Forestry Plan (1976), National Conservation Strategy (1988), The Master Plan for the Forestry Sector (MPFS, 1989), Forest Act (1993), Community Forestry Directives (1994), Forest rules (1995), Revised Forestry sector Policy (2000), Leasehold Forest Policy (2002), Five- year Periodic Plans (2002- 07), Operational Guidelines (revised) (2002), National Biodiversity Strategy (2002), Monitoring and Evaluation concept and strategies (2002), Collaborative Forest Management Guideline (2003), Forest Products Auctioning Procedure (2003), Non Governmental Service Providers Guideline (2003)

518
Mongolia’s success was caused by stable emission (went down from 1990
to 2005 and recovered from 2005 to 2010) while HDI slightly increased. During
the stagnation of the country during 1990-2005, HDI, particularly income
component did not improve significantly, but remained stable. In the meantime, the
total GHG emissions in 2010 were almost identical with the emissions in 1990.
Moreover, Mongolia’s development was achieved without political
stability. One remarkable issue observed was that the ODA increased significantly
during the Period 1990-1995 maintaining this high level until 2010 which was not
linked with the extreme cold winter weathers in 2001 and 2010. During the period,
there were improvements observed that were (i) the improved education through
the Period 2000-2010, and also (ii) the decreased GHG emissions from energy
sector through Period 1990-2000 particularly from manufacturing/construction by
introducing state-of-the-art technologies from developed countries through ODA.
Those improvements may be a result of leapfrogs caused by drastic increase of the
ODA.
2. Questions
Question 1. Why was Mongolia’s HDI, particularly its income component
able to maintain steady improvement with decreased GHG emissions from the

519
energy sector throughout the period 1990-2000 particularly from
manufacturing/construction while population increased as well as there was no
political stability?
Question 2. Did introduction of leapfrogging technology happen because
of large increase of ODA since 1990?
Question 3. If manufacturing/construction through ODA was a salient
factor, did the donor place high priority on (i) the education improvement, (ii) the
decreased GHG emissions from the energy sector, and/or (iii) the decreased GHG
emissions from manufacturing/construction innovations?
F. Bangladesh
1. Findings from my data analysis
Bangladesh’s improvement of HDI was achieved by a very well-balanced
improvement in HDI (the gap between its top and bottom HDI components was
small). In the meantime, Bangladesh had similar continuous increases in GHG and
population until 2000, but from 2000, the rate of increase in GHG became faster
than the population, therefore GHGpc got worse. This means some change
happened that increased GHG emissions as well as energy consumption round 2000.

520
Around 2000, emission from LUCF slowly and modestly decreased
through the period, but all other sources of CO2, CH4 and N2O increased,
particularly CO2 with the higher rate from 2000. A majority of this CO2 increase
was from the energy and industry sectors, while CH4 and N2O were from agriculture.
The abrupt increase from the CO2/energy industry in 2000 was linked with growth
in the electricity/heat, sector, but there were no changes during this time in HDI.
It was also observed that (i) energy consumption increase did not improve
HDI, but (ii) Bangladesh became efficient to emit GHG per energy usage.
Moreover, Bangladesh’s successful development had been achieved without (i)
political stability, (ii) peace, or (iii) increasing ODA.
2. Questions
Question 1. Was the balanced development that happened in Bangladesh
planned/intended/controlled, or simply good fortune without
plan/intention/control?
Question 2. If it was not planned/intended/controlled, was the
development that happened in Bangladesh beginning in 2005 likely to track the
similar pattern of China (PRC) and India where prioritized development sacrificing
environment?

521
Question 3. If the development was planned/intended/controlled, what
policy goals were established and what policy measures were taken to achieve this
outcome while there was no political stability, peace, and increased ODA?
G. General Question
From my data analysis, for those countries that showed very successful
performances in HDI and GHGpc, it seems that the reasons of the successful
development were (i) transformation to other industries while abandoning
industries that rely on deforestation, (ii) adoption of leapfrog low carbon imported
technologies supported by ODA, and (iii) balanced improvements on health,
education, and income. Please tell me if you observed similarities or differences in
your experiences (experience in any country is appreciated; please specify country
or countries).
H. Do you prefer to remain anonymous?
At the end of your responses, please let me know if I may quote you with
attribution or do you prefer not to be identified by name? Please choose one of the
5 options below, otherwise feel free to write down here how you want to be quoted.
If I quote you by name, I will send you a copy of what I plan to say to obtain your
approval. Your preference will be fully respected.

522
1. Can disclose information including your name, position, organization,
and country (such as “Mr. Sasaki who is a Japanese senior environment specialist
from Asian Development Bank said…”)
2. Can disclose your position, organization, and country (such as “a
Japanese senior environment specialist from Asian Development Bank said….”)
3. Can disclose organization, and country (such as “a Japanese officer from
Asian Development Bank said….”)
4. Can disclose only country (such as “a Japanese officer in a multilateral
development support agency said….”)
5. Can disclose minimum information (such as “an officer in a multilateral
development support agency said….”)
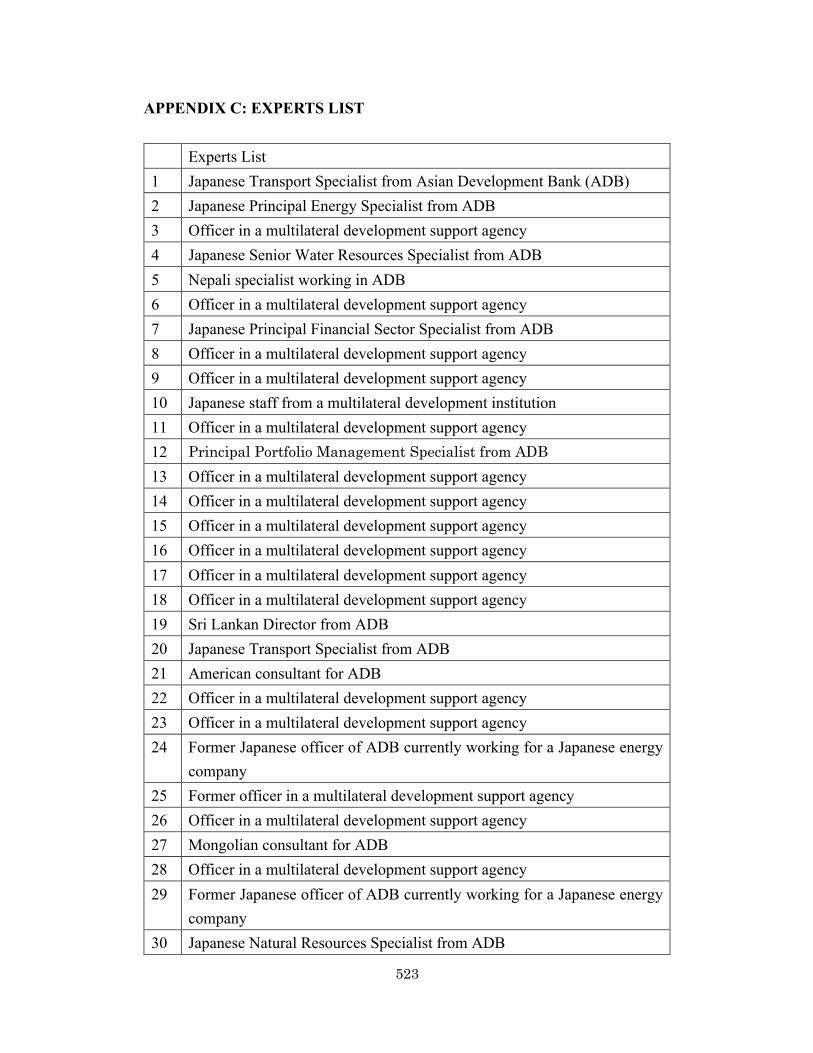
523
APPENDIX C: EXPERTS LIST
Experts List 1 Japanese Transport Specialist from Asian Development Bank (ADB) 2 Japanese Principal Energy Specialist from ADB 3 Officer in a multilateral development support agency 4 Japanese Senior Water Resources Specialist from ADB 5 Nepali specialist working in ADB 6 Officer in a multilateral development support agency 7 Japanese Principal Financial Sector Specialist from ADB 8 Officer in a multilateral development support agency 9 Officer in a multilateral development support agency 10 Japanese staff from a multilateral development institution 11 Officer in a multilateral development support agency 12 Principal Portfolio Management Specialist from ADB 13 Officer in a multilateral development support agency 14 Officer in a multilateral development support agency 15 Officer in a multilateral development support agency 16 Officer in a multilateral development support agency 17 Officer in a multilateral development support agency 18 Officer in a multilateral development support agency 19 Sri Lankan Director from ADB 20 Japanese Transport Specialist from ADB 21 American consultant for ADB 22 Officer in a multilateral development support agency 23 Officer in a multilateral development support agency 24 Former Japanese officer of ADB currently working for a Japanese energy
company 25 Former officer in a multilateral development support agency 26 Officer in a multilateral development support agency 27 Mongolian consultant for ADB 28 Officer in a multilateral development support agency 29 Former Japanese officer of ADB currently working for a Japanese energy
company 30 Japanese Natural Resources Specialist from ADB
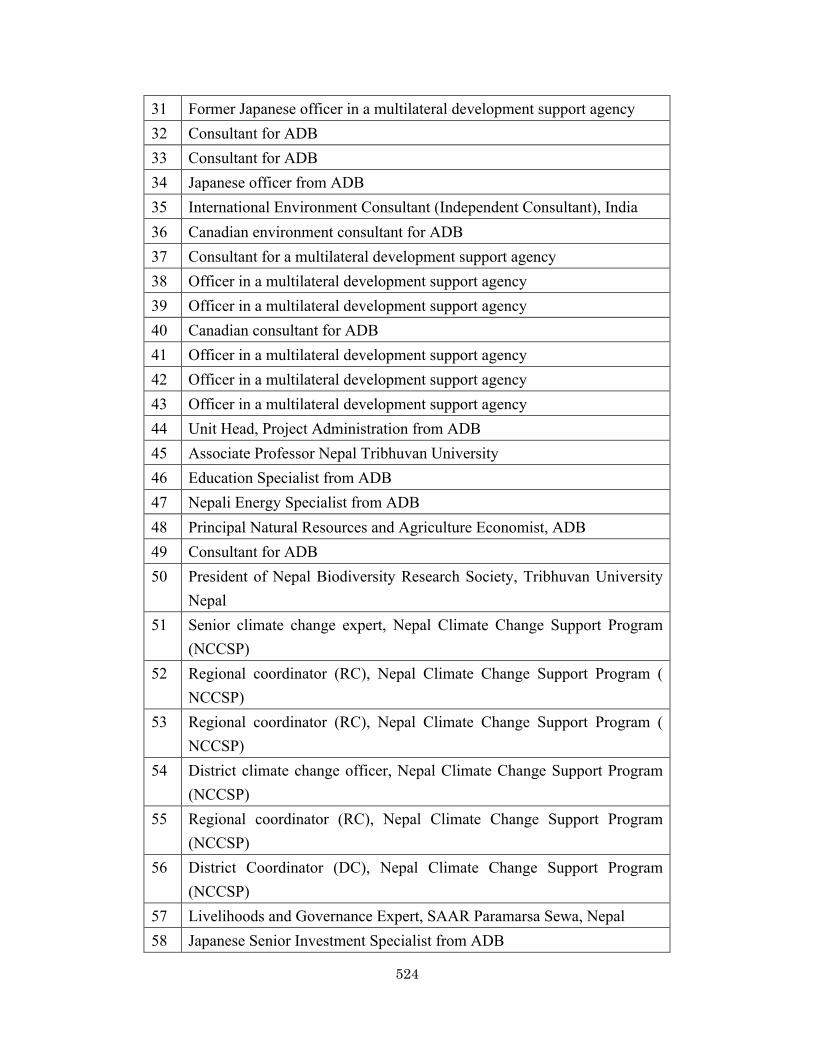
524
31 Former Japanese officer in a multilateral development support agency 32 Consultant for ADB 33 Consultant for ADB 34 Japanese officer from ADB 35 International Environment Consultant (Independent Consultant), India 36 Canadian environment consultant for ADB 37 Consultant for a multilateral development support agency 38 Officer in a multilateral development support agency 39 Officer in a multilateral development support agency 40 Canadian consultant for ADB 41 Officer in a multilateral development support agency 42 Officer in a multilateral development support agency 43 Officer in a multilateral development support agency 44 Unit Head, Project Administration from ADB 45 Associate Professor Nepal Tribhuvan University 46 Education Specialist from ADB 47 Nepali Energy Specialist from ADB 48 Principal Natural Resources and Agriculture Economist, ADB 49 Consultant for ADB 50 President of Nepal Biodiversity Research Society, Tribhuvan University
Nepal 51 Senior climate change expert, Nepal Climate Change Support Program
(NCCSP) 52 Regional coordinator (RC), Nepal Climate Change Support Program (
NCCSP) 53 Regional coordinator (RC), Nepal Climate Change Support Program (
NCCSP) 54 District climate change officer, Nepal Climate Change Support Program
(NCCSP) 55 Regional coordinator (RC), Nepal Climate Change Support Program
(NCCSP) 56 District Coordinator (DC), Nepal Climate Change Support Program
(NCCSP) 57 Livelihoods and Governance Expert, SAAR Paramarsa Sewa, Nepal 58 Japanese Senior Investment Specialist from ADB

525
59 Lecturer, Tribhuvan University, Nepal 60 Visiting faculty, Kathmandu Forestry College, Nepal 61 Independent consultant, Nepal 62 Researcher in Development Studies, Kathmandu University, Nepal 63 President, Nepal Forum for Environmental Journalist (NEFEJ) 64 Managing Director, Nepal Environmental and Scientific Services (NESS)
P Ltd 65 Technical director, Nepal Environmental & Scientific Services 66 Consultant for ADB 67 Officer in a multilateral development support agency 68 Japanese Principal Energy Specialist from ADB 69 Nepalese freelance consultant 70 Officer in a multilateral development support agency 71 Sri Lankan officer in a multilateral development support agency 72 Officer in a multilateral development support agency 73 Japanese officer from ADB 74 Japanese officer from ADB 75 Officer in a multilateral development support agency 76 Officer in a multilateral development support agency 77 Sri Lankan Senior Environment Specialist from ADB 78 Officer from the ADB 79 Korean Investment Specialist from ADB 80 French Senior Urban Specialist from ADB 81 Consultant for a multilateral development support agency 82 Bhutanese Senior Environment Specialist from ADB 83 Officer in a multilateral development support agency