Embed Size (px)
Citation preview


Hydrological, Socioeconomic and EcologicalImpacts of the North Atlantic Oscillationin the Mediterranean Region

ADVANCES IN GLOBAL CHANGE RESEARCH
VOLUME 46
Editor-in-Chief
Martin Beniston, University of Geneva, Switzerland
Editorial Advisory Board
B. Allen-Diaz, Department ESPM-Ecosystem Sciences, University of California,Berkeley, CA, USA.
R.S. Bradley, Department of Geosciences, University of Massachusetts, Amherst,MA, USA.
W. Cramer, Earth System Analysis, Potsdam Institute for Climate Impact Research,Potsdam, Germany.
H.F. Diaz, Climate Diagnostics Center, Oceanic and Atmospheric Research, NOAA,Boulder, CO, USA.
S. Erkman, Institute for communication and Analysis of Science and Technology–ICAST,Geneva, Switzerland.
R. Garcia Herrera, Facultad de Fisicas, Universidad Complutense, Madrid, Spain.M. Lal, Center for Atmospheric Sciences, Indian Institute of Technology, New Delhi, India.U. Luterbacher, The Graduate Institute of International Studies, University of Geneva,
Geneva, Switzerland.I. Noble, CRC for Greenhouse Accounting and Research School of Biological Science,
Australian National University, Canberra, Australia.L. Tessier, Institut Mediterranéen d’Ecologie et Paléoécologie, Marseille, France.F. Toth, International Institute for Applied Systems Analysis, Laxenburg, Austria.M.M. Verstraete, Institute for Environment and Sustainability, Ec Joint Research Centre,
Ispra (VA), Italy.
For other titles published in this series, go towww.springer.com/series/5588

Sergio M. Vicente-Serrano · Ricardo M. TrigoEditors
Hydrological, Socioeconomicand Ecological Impacts ofthe North Atlantic Oscillationin the Mediterranean Region
123

EditorsSergio M. Vicente-SerranoSpanish National Research Council (CSIC)Pyrenean Institute of EcologyAvda. Montañana 100550059 [email protected]
Ricardo M. TrigoCampo GrandeFaculdade de CienciasInstituto Dom Luiz, Universidade de LisboaEdificio C8Piso 31749-016 [email protected]
ISSN 1574-0919ISBN 978-94-007-1371-0 e-ISBN 978-94-007-1372-7DOI 10.1007/978-94-007-1372-7Springer Dordrecht Heidelberg London New York
Library of Congress Control Number: 2011929639
© Springer Science+Business Media B.V. 2011No part of this work may be reproduced, stored in a retrieval system, or transmitted in any form or byany means, electronic, mechanical, photocopying, microfilming, recording or otherwise, without writtenpermission from the Publisher, with the exception of any material supplied specifically for the purposeof being entered and executed on a computer system, for exclusive use by the purchaser of the work.
Printed on acid-free paper
Springer is part of Springer Science+Business Media (www.springer.com)

Contents
Introduction . . . . . . . . . . . . . . . . . . . . . . . . . . . . . . . . . 1Sergio M. Vicente-Serrano and Ricardo M. Trigo
Variability and Changes in the North Atlantic Oscillation Index . . . . 9Tim J. Osborn
The NAO Impact on Droughts in the Mediterranean Region . . . . . . 23Sergio M. Vicente-Serrano, Juan I. López-Moreno,Jorge Lorenzo-Lacruz, Ahmed El Kenawy, Cesar Azorin-Molina,Enrique Morán-Tejeda, Edmond Pasho, Javier Zabalza,Santiago Beguería, and Marta Angulo-Martínez
The Impacts of the NAO on Hydrological Resourcesof the Western Mediterranean . . . . . . . . . . . . . . . . . . . . . . . 41Ricardo M. Trigo
The Impacts of NAO on the Hydrology of the Eastern Mediterranean . 57Ercan Kahya
Influence of Winter North Atlantic Oscillation Index (NAO)on Climate and Snow Accumulation in the Mediterranean Mountains . 73Juan I. López-Moreno, Sergio M. Vicente-Serrano,Enrique Morán-Tejeda, Jorge Lorenzo-Lacruz, Javier Zabalza,Ahmed El Kenawy, and Martin Beniston
Impact of NAO on Mediterranean Fisheries . . . . . . . . . . . . . . . . 91Francesc Maynou
Impacts of the NAO on Mediterranean Crop Production . . . . . . . . . 103Simone Orlandini, Anna Dalla Marta, Marco Mancini, and Daniele Grifoni
The Impacts of the NAO on the Vegetation Activity in Iberia . . . . . . 113Célia Gouveia and Ricardo M. Trigo
Direct and Indirect Effects of the North Atlantic Oscillationon Tree Growth and Forest Decline in Northeastern Spain . . . . . . . . 129Jesús Julio Camarero
v
vi Contents
Ecological Impacts of the North Atlantic Oscillation (NAO)in Mediterranean Ecosystems . . . . . . . . . . . . . . . . . . . . . . . . 153Oscar Gordo, Carles Barriocanal, and David Robson
Impacts of the NAO on Atmospheric Pollutionin the Mediterranean Basin . . . . . . . . . . . . . . . . . . . . . . . . . 171Uri Dayan
Evaluation of the Relationship Between the NAO and RainfallErosivity in NE Spain During the Period 1955–2006 . . . . . . . . . . . 183Marta Angulo-Martínez and Santiago Beguería
Impacts of the North Atlantic Oscillationon Landslides . . . . . . . . . . . . . . . . . . . . . . . . . . . . . . . . . 199José Luís Zêzere and Ricardo M. Trigo
The Impact of the NAO on the Solar and Wind EnergyResources in the Mediterranean Area . . . . . . . . . . . . . . . . . . . 213David Pozo-Vazquez, Francisco Javier Santos-Alamillos,Vicente Lara-Fanego, Jose Antonio Ruiz-Arias, and Joaquín Tovar-Pescador
Index . . . . . . . . . . . . . . . . . . . . . . . . . . . . . . . . . . . . . 233
Contributors
Marta Angulo-Martínez Estación Experimental de Aula Dei, Spanish NationalResearch Council (CSIC), Zaragoza, Spain, [email protected]
Cesar Azorin-Molina Instituto Pirenaico de Ecología, Spanish National ResearchCouncil (CSIC), Zaragoza, Spain, [email protected]
Carles Barriocanal Departament de Geografia, Universitat de Girona, Girona,Spain, [email protected]
Santiago Beguería Estación Experimental de Aula Dei, Spanish NationalResearch Council (CSIC), Zaragoza, Spain, [email protected]
Martin Beniston C3i-Climate Change and Climate Impacts Group, Universityof Geneva, Geneva, Switzerland, [email protected]
Jesús Julio Camarero ARAID-Instituto Pirenaico de Ecología, Spanish NationalResearch Council (CSIC), Zaragoza, Spain, [email protected]
Anna Dalla Marta Department of Plant, Soil and Environmental Science,University of Florence, Florence, Italy, [email protected]
Uri Dayan Department of Geography, The Hebrew University of Jerusalem,Jerusalem, Israel, [email protected]
Ahmed El Kenawy Instituto Pirenaico de Ecología, Spanish National ResearchCouncil (CSIC), Zaragoza, Spain, [email protected]
Oscar Gordo Departamento de Zoología y Antropología Física, UniversidadComplutense de Madrid, Madrid, Spain, [email protected]
Célia Gouveia Faculty of Sciences, Instituto Dom Luiz (IDL), Universityof Lisbon, Lisbon, Portugal; EST, Polytechnic Institute of Setubal, Setúbal,Portugal, [email protected]
Daniele Grifoni Institute of Biometeorology, National Research Council,Florence, Italy, [email protected]
Ercan Kahya Istanbul Technical University, Istanbul, Turkey, [email protected]
vii

viii Contributors
Vicente Lara-Fanego Department of Physics, University of Jaén, Jaén, Spain,[email protected]
Juan I. López-Moreno Instituto Pirenaico de Ecología, Spanish NationalResearch Council (CSIC), Zaragoza, Spain, [email protected]
Jorge Lorenzo-Lacruz Instituto Pirenaico de Ecología, Spanish NationalResearch Council (CSIC), Zaragoza, Spain, [email protected]
Marco Mancini Department of Plant, Soil and Environmental Science, Universityof Florence, Florence, Italy, [email protected]
Francesc Maynou Institut de Ciències del Mar, Spanish National ResearchCouncil (CSIC), Barcelona, Spain, [email protected]
Enrique Morán-Tejeda Instituto Pirenaico de Ecología, Spanish NationalResearch Council (CSIC), Zaragoza, Spain, [email protected]
Simone Orlandini Department of Plant, Soil and Environmental Science,University of Florence, Florence, Italy, [email protected]
Tim J. Osborn Climatic Research Unit, School of Environmental Sciences,University of East Anglia, Norwich, UK, [email protected]
Edmond Pasho Instituto Pirenaico de Ecología, Spanish National ResearchCouncil (CSIC), Zaragoza, Spain, [email protected]
David Pozo-Vazquez Department of Physics, University of Jaén, Jaén, Spain,[email protected]
David Robson Institut Català d’Ornitologia, Barcelona, Spain, [email protected]
Jose Antonio Ruiz-Arias Department of Physics, University of Jaén, Jaén, Spain,[email protected]
Francisco Javier Santos-Alamillos Department of Physics, University of Jaén,Jaén, Spain, [email protected]
Joaquín Tovar-Pescador Department of Physics, University of Jaén, Jaén, Spain,[email protected]
Ricardo M. Trigo Instituto Dom Luiz, Universidade de Lisboa, Campo Grande,Faculdade de Ciencias, Edificio C8, Piso 3, 1749-016 Lisbon, Portugal,[email protected]
Sergio M. Vicente-Serrano Instituto Pirenaico de Ecología, Spanish NationalResearch Council (CSIC), Zaragoza, Spain, [email protected]
Javier Zabalza Instituto Pirenaico de Ecología, Spanish National ResearchCouncil (CSIC), Zaragoza, Spain, [email protected]
José Luís Zêzere Centre for Geographical Studies, Institute of Geography andSpatial Planning, University of Lisbon, Lisboa, Portugal, [email protected]

Introduction
Sergio M. Vicente-Serrano and Ricardo M. Trigo
This book is a collection of the main contributions in a thematic workshop devotedto the hydrological, socioeconomic, and ecological impacts of the NAO in theMediterranean area that was held in Zaragoza (Spain), in May 2010, in the frame-work of the European Science Foundation (ESF) Mediterranean Climate Variabilityand Predictability (MedCLIVAR) program (http://www.medclivar.eu/).
According to the latest IPCC report, the Mediterranean basin represents oneof the most important “hot spots” of climate change in the world, with recenttrends towards a hotter and drier climate being related to changes in atmosphericcirculation patterns. Previous work has shown that the interannual variability ofMediterranean climate is mostly associated to changes in certain relevant atmo-spheric circulation patterns (Dünkeloh and Jacobeit, 2003; Zorita et al., 1992;Xoplaki et al., 2003, 2004; Pauling et al., 2006; Trigo et al., 2006). Such changescan have significant impacts in the climate of this region but also on the naturalenvironment and several socioeconomic activities. Among these patterns, the NorthAtlantic Oscillation (NAO) is the only one which shows a clear signal throughoutthe whole year, although with stronger intensity and extension during winter due tothe stronger meridional gradients (Lamb and Peppler, 1987; Hurrell et al., 2003).During this season changes in the NAO phase lead to shifts in the location of thecenters of action and in the associated storm tracks (Trigo, 2006).
The NAO is responsible for most of the climatic variability in the North Atlantic,modifying direction and intensity of the westerlies, the track of the polar depressionsand the location of the anticyclones (Hurrell, 1995; Wanner et al., 2001). During thepositive phases, the Azores subtropical high is reinforced, leading to sunny and dryweather in the Mediterranean region (Trigo et al., 2002). On the contrary, during thenegative winters, cyclones move southward increasing precipitation on the westernMediterranean (Hurrell and Van Loon, 1997; García-Herrera et al., 2001; Moseset al., 1987). Cloudiness, temperature and solar radiation are also highly modulatedby the NAO index (Trigo et al., 2002).
S.M. Vicente-Serrano (B)Instituto Pirenaico de Ecología, Spanish National Research Council (CSIC), Zaragoza, Spaine-mail: [email protected]
1S.M. Vicente-Serrano, R.M. Trigo (eds.), Hydrological, Socioeconomicand Ecological Impacts of the North Atlantic Oscillation in the Mediterranean Region,Advances in Global Change Research 46, DOI 10.1007/978-94-007-1372-7_1,C© Springer Science+Business Media B.V. 2011
2 S.M. Vicente-Serrano and R.M. Trigo
The NAO behavior is characterized by a remarkable interannual variability,which is evident in long instrumental (Jones et al., 1997) but equally in paleorecords (Cook et al., 2002; Luterbacher et al., 2002). In the instrumental period,the NAO has shown important decadal variability and a decreasing trend between1940 and 1970. Nevertheless, the most unusual period was observed between the1970s and 1990s when the NAO showed an increasing tendency towards posi-tive phases (Osborn et al., 1999), coincident with severe drought conditions in theMediterranean (López-Moreno and Vicente-Serrano, 2008; Sousa et al., 2011) and areinforced NAO influence on climate (Vicente-Serrano and López-Moreno, 2008a).High variability has been recorded during the first decade of the twenty-first cen-tury, including extreme seasonal values of the NAO index. As usual, extreme winterNAO values are at the root of large climate impacts on different natural hazards(e.g. floods, droughts, landslides) but also several important socio-economic areassuch as agriculture, renewable energies production, water resources. Thus the win-ter 2001 (2005) was characterised by several monthly negative (positive) valuesof NAO inducing an abnormally wet (dry) year in western Mediterranean (García-Herrera et al., 2007). However, the recent winter 2010 was characterised by themost negative NAO winter value ever recorded, and it has caused notable climateanomalies and impacts namely a colder than usual central Europe (Cattiaux et al.,2010) and a wetter than usual Western Mediterranean region (Vicente-Serrano et al.,2011).
The complexity of the NAO behaviour and their impact has attracted the attentionof a wide variety of scientific communities, with more than 3800 papers pub-lished on different NAO features during the last decade (SCOPUS database, visit:15/11/2010). The association between the NAO and the Mediterranean climate vari-ability has been well documented, showing that it is one of the main forcing factorsin the region. Its impact on extreme events such as droughts, severe precipitationsor heat and cold waves has been well established (e.g. Gallego et al., 2006; Garcia-Herrera et al., 2007; Della-Marta et al., 2007; López-Moreno and Vicente-Serrano,2008). These changes have also an impact on the availability of water resourcesthroughout the entire basin, affecting, not only river flows but also storage avail-ability in lakes and reservoirs and snow cover (Trigo et al., 2004; Karabörk et al.,2005; López-Moreno et al., 2007; Küçük et al., 2009). The ecological dynamics ofthe region is also greatly affected, as has been shown through satellite imagery andtree rings (Gouveia et al., 2008; Vicente-Serrano and Heredia, 2004; Roig et al.,2009). This has an impact on the quality and quantity of crops and in the migra-tion and welfare of animal populations (Gimeno et al., 2002; Rubolini et al., 2007).The marine environment is also affected by NAO through changes in sea level andfisheries dynamics (Woolf et al., 2003; Lloret et al., 2001; Maynou, 2008). Otherreported impacts are landslides (Zêzere et al., 2008), air pollution and human health(Dayan and Lamb, 2008).
Current climate change scenarios obtained with state-of-the-art GeneralCirculation Models (GCMs) predict large modifications in the NAO behaviour inthe next decades, however a clear change towards more positive or negative NAOvalues has not been yet universally established (Solomon et al., 2007). Nevertheless,

Introduction 3
the majority of the GCMs indicate as the most probable outcome an increase of theNAO values, with a decreased gradient of the Sea Level Pressures and more frequentpositive NAO phases (Osborn et al., 1999; Osborn, 2004; Demuzere et al., 2009).However, the increase likelihood of positive NAO mode does not eliminate the highinter-annual variability, thus the possibility of occurrence of extreme negative val-ues, which can trigger large impacts (Vicente-Serrano et al., 2011). In addition,GCMs predict a more robust and stable link between NAO and surface climate vari-ables (Raible et al., 2006; Vicente-Serrano and López-Moreno, 2008b), suggestingthat future climate variability, and their related impacts in the Mediterranean regionmight be controlled even more by the NAO pattern under a warmer world.
The NAO impacts on Northern Europe have been well reviewed and compiled(Hurrell et al., 2003), but no similar work has been attempted for the Mediterranean,which is the other key area impacted by NAO (Trigo et al., 2006). The aim of thebook “Hydrological, socioeconomic and ecological impacts of the North AtlanticOscillation in the Mediterranean region” is to serve as an updated reference textthat covers the wide range of evidences on the NAO impacts in the Mediterraneanregions and from a multidisciplinary perspective. We hope that this volume con-stitutes a unique document to present the state of the art of the numerous studiesundertaken on the Hydrological, Socioeconomic and Ecological impact of the NAO,collecting the expertise of researchers from several complementary earth sciencefields (Geography, Hydrology, Remote-sensing, Climatology, Agriculture, Energy),but that have been lacking a common ground.
The first book chapter provides an updated overview on the internal spatial andtemporal variability of the NAO and how external forcing factors may affect thefuture NAO pattern. Tim J. Osborn shows how multi-model ensemble of simulationsunder increasing anthropogenic forcing strengthens earlier findings of a shift in themean state of the winter atmospheric circulation towards positive NAO conditions,but he indicates that if a shift towards positive NAO conditions is a realistic responseto increasing anthropogenic forcing, then this signal has not yet emerged from thenatural variability. He discuss that anthropogenic forcing could be altering the tem-poral or spatial character of the interannual NAO variability, though only relativelysmall changes in pattern are evident when considering a multi-model ensemble.
Some of the book chapters focus on the NAO impacts on climate extreme events,like droughts, which will also have subsequent environmental, hydrological andsocioeconomic impacts. The paper by Sergio M. Vicente-Serrano and co-authorsshow the influence of the NAO on droughts in the entire Mediterranean region,focussing on the use of the Standardized Precipitation Evapotranspiration Index, amulti-scale drought indicator that allows to determine how the effects of the win-ter NAO are propagated for further months when long time scales of drought areanalysed.
In terms of the hydrological impacts of the NAO, Ricardo M. Trigo presentsthat the strong control exerted by NAO on precipitation is very significant betweenOctober and March, being extensive to the river flow of major Iberian rivers, suchas Douro/Duero, Tejo/Tagus and Guadiana. Correlation coefficient values computedbetween Iberian winter river flow and contemporaneous (and lagged) winter NAO

4 S.M. Vicente-Serrano and R.M. Trigo
index show that the large inter-annual variability of the rivers flow is largely mod-ulated by the NAO phenomena. In fact this mode controls inter-annual and decadalvariability of both precipitation and river flow of large sectors of Iberia. In theEast of the Mediterranean region the hydrological variability of river dischargesand lake levels is also determined by the NAO. Ercan Kahya documents the impactof the NAO on the hydrology of eastern Mediterranean countries, such as Turkey,Iran, Kuwait, Oman, and Israel from a general perspective. Patterns of precipita-tion, streamflow, and lake levels in Turkey are discussed to show the NAO impacts.He devotes special attention to the NAO influences on the formation of stream-flow homogeneous region and on the probability distribution functions of criticaldroughts. The results of his analyses clearly shows that the NAO signals are quiteidentifiable in various hydrologic variables in Turkey.
The NAO also affects the water stored in the form of snow with evidenthydrological but also tourist implications, since the winter snow tourism repre-sents an important income source for several mountain chains located around theMediterranean basin. Juan I. López-Moreno and collaborators analyse the influenceof NAO on the interannual evolution of winter temperature, precipitation and snow-pack in these Mediterranean mountains. They show that the snow cover responseto winter NAO may differ spatially as a consequence of the different influence ofwinter NAO on precipitation and temperature. In Switzerland, they show how theinfluence of NAO on snow is significant at the lowest elevation areas, where tem-perature is the main control on snowpack accumulation, but in the Pyrenees thehighest correlation with snow is found at high elevations where precipitation con-trols mainly the accumulation of snow related to the NAO control of the interannualvariability of precipitation.
Primary activities over land and sea are also being largely affected by NAO. Onthe one hand, several Mediterranean fisheries reveal inter-annual variations closelyrelated to the NAO variability. Francesc Maynou shows that the NAO explains alarge part of the variability in population abundance of red shrimp Aristeus antenna-tus in the western Mediterranean Sea, with a lag of 2–3 years. Moreover, the stocksof hake also respond to the NAO since positive NAO years enhance hake fisheryproduction through increasing the individual size of recruits, as well as the individ-ual weight and abundance of adult hake. The NAO signal is also observed in thecrop productions as Simone Orlandini and collaborators illustrate. They stress thatbesides common meteorological information supplied by local stations, the use ofthe NAO may allow to forecast agricultural yields and production quality in regionsof the Mediterranean basin.
The dynamic of ecosystems of the Mediterranean region is also largely deter-mined by the NAO. In their chapter, Célia Gouveia and Ricardo Trigo analyse therelationship between NAO, vegetation dynamics and carbon absorption over IberianPeninsula. They provides strong evidence that positive (negative) values of win-ter NAO induce low (high) vegetation activity in the following spring and summerseasons. These features are mainly associated with the impact of NAO on winterprecipitation, together with the strong dependence of the spring and summer veg-etation activity on water availability during the previous winter. Jesus J. Camarero

Introduction 5
quantified the tree growth responses to NAO index across a climatic gradient inNortheastern Spain, considering ten tree species with contrasting habitats and plau-sibly different growth responses to climate. He shows that climatic variables andNAO indices explained on average 40.1 and 15.9% of the growth variance, respec-tively. He also shows how the growth responses to climate and NAO also changedthrough time, illustrating how long tree-ring chronologies of different species mayserve as valuable monitors of the responses of forests to winter NAO. In terms ofanimal communities, Oscar Gordo and collaborators review more than 60 stud-ies that have demonstrated the effects of the NAO on both terrestrial and aquaticMediterranean ecosystems. They show how the NAO affects the condition and dietof mammals and disease-related mortality in amphibians and how the birds com-munities are affected by NAO impacts on the availability and extent of their habitatand by influencing dispersal decisions of individuals. Thus, they illustrate how theNAO plays an essential role in the migration of birds throughout the Mediterraneanbasin, and it is probably a reason for the observed advance of arrival dates duringthe spring in Europe.
Moreover, the environmental NAO impacts are also evident in terms of air qualityand contaminants dispersion. Uri Dayan presents simulations of transport of anthro-pogenic CO for high and low phases of the NAO. He shows the different spatial andtemporal influence played by the positive and negative phases of the NAO modewhen controlling the dust tranport to the Mediterranean: the positive phase dur-ing summer over the western region and the negative one regulating dust transportover the Eastern Mediterranean in winter. He indicates that positive phases imply areduced import of European trace gases, an enhancement of long range transport ofair pollutants from North American sources and conditions in favor of mobilizationand transport of North African dust mainly to the western part of this fragile basin.
Geomorphological processes in the Mediterranean region are also being largelyaffected by the NAO. The erosive capacity of rainfall is the factor that triggers dif-ferent surface processes that finally determine soil erosion. Marta Angulo-Martínezand Santiago Beguería illustrate in a western Mediterranean area how the erosivepower of rainfall is stronger during the negative phase of NAO and weaker dur-ing positive NAO conditions, a finding very useful in the implementation of soilconservation strategies. In addition, soil intensity and magnitude also triggers massmovements and landslides. José Luís Zêzere and Ricardo Trigo show that NAO havean impact on the landslide events that have occurred in the region located just northof Lisbon between 1956 and 2010. Thus, they show how many months with land-slide activity are characterized by negative average values of the NAO index andhigh values of average precipitation (above 95 mm/month).
The volume ends showing the influence of the NAO on a key economic sector thatat present is increasing its economic importance. David Pozo-Vazquez and collabo-rators explore the influence of the NAO on the solar and wind energy resources inthe Mediterranean area, in particular, and over the whole North Atlantic area, in gen-eral. They show that interannual variability of the solar and wind energy resourcesin the Mediterranean area can reach values above 20% in winter and 10% in theannual case associated with changes in the NAO phase. They results are of interest

6 S.M. Vicente-Serrano and R.M. Trigo
regarding the estimation of the expected interannual variability of the wind farmsand solar plants production in the study region.
The set of chapters of this books provides the most complete overview aboutthe impacts of the NAO in the Mediterranean region, highlighting the importanceof this phenomenon not only in terms of the understanding of climate processesin the region, but also to know in depth the derived impacts that are affecting ourenvironment, economy and natural resources.
Acknowledgements The scientific workshop that made possible this book was supported by theEuropean Science Foundation, in the framework of the Mediterranean Climate Variability andPredictability (MedCLIVAR) program, the Spanish Ministry of Science and Innovation and theAragón Government (Spain).
References
Cattiaux J, Vautard R, Cassou C, Yiou P, Masson-Delmotte V, Codron F (2010) Winter 2010in Europe: a cold extreme in a warming climate. Geophys Res Lett 37. doi:10.1029/2010GL044613
Cook E, D’Arrigo RD, Mann ME (2002) A well-verified, multiproxy reconstruction of the winterNorth Atlantic Oscillation Index since A.D. 1400. J Clim 15:1754–1764
Dayan U, Lamb D (2008) Influence of atmospheric circulation on the variability of wet sulfatedeposition. Int J Climatol 28:1315–1324
Della-Marta PM, Luterbacher J, von Weissenfluh H, Xoplaki E, Brunet M, Wanner H (2007)Summer heat waves over western Europe 1880–2003, their relationship to large-scale forcingsand predictability. Clim Dyn 29:251–275
Demuzere M, Werner M, van Lipzig NPM, Roeckner E (2009) An analysis of present and futureECHAM5 pressure fields using a classification of circulation patterns. Int J Climatol 29:1796–1810
Dünkeloh A, Jacobeit J (2003) Circulation dynamics of mediterranean precipitation variability1948–98. Int J Climatol 23:1843–1866
Gallego MC, García JA, Vaquero JM, Mateos VL (2006) Changes in frequency and intensityof daily precipitation over the Iberian Peninsula. J Geophys Res D: Atmos 111:D24105.doi:10.1029/2006JD007280
García-Herrera R, Paredes D, Trigo RM, Trigo IF, Hernández H, Barriopedro D, Mendes MT(2007) The outstanding 2004–2005 drought in the Iberian Peninsula: the associatedatmospheric circulation. J Hidrometeorol 9:483–498
García-Herrera R, Gallego D, Hernández E, Gimeno L, Ribera P (2001) Influence of the NorthAtlantic Oscillation on the Canary Island precipitation. J Clim 14:3889–3903
Gimeno L, Ribera P, Iglesias R, de la Torre L, Garcia R, Hernandez E (2002) Identification ofempirical relationships between indices of ENSO and NAO and agricultural yields in Spain.Clim Res 21:165–172
Gouveia C, Trigo RM, DaCamara CC, Libonati R, Pereira JMC (2008) The North AtlanticOscillation and European vegetation dynamics. Int J Climatol 28:1835–1847
Hurrell J (1995) Decadal trends in North Atlantic Oscillation and relationship to regionaltemperature and precipitation. Science 269:676–679
Hurrell JW, Kushnir Y, Ottersen G, Visbeck M (2003) The North Atlantic Oscillation: climatesignificance and environmental impact. Geophysical monograph series, vol 134. AmericanGeophysical Union, Washington, DC
Hurrell J, Van Loon H (1997) Decadal variations in climate associated with the North AtlanticOscillation. Clim Change 36:301–326

Introduction 7
Jones PD, Jónsson T, Wheeler D (1997) Extension to the North Atlantic Oscillation using earlyinstrumental pressure observations from Gibraltar and South-West Iceland. Int J Climatol17:1433–1450
Karabörk MÇ, Kahya E, Karaca M (2005) The influences of the southern and North AtlanticOscillations on climatic surface variables in Turkey. Hydrol Process 19:1185–1211
Küçük M, Kahya E, Cengiz TM, Karaca M (2009) North Atlantic Oscillation influences on Turkishlake levels. Hydrol Process 23:893–906
Lamb PJ, Peppler RA (1987) North Atlantic Oscillation: concept and application. Bull AmMeteorol Soc 68:1218–1225
Lloret J, Lleonart J, Solé I, Fromentin J-M (2001) Fluctuations of landings and environmentalconditions in the north-western Mediterranean sea. Fisheries Oceanogr 10:33–50
Luterbacher J, Xoplaki E, Dietrich D, Jones PD, Davies TD, Portis D, González-Rouco JF, vonStorch H, Gyalistras D, Casty C, Wanner H (2002) Extending North Atlantic Oscillationreconstructions back to 1500. Atmos Sci Lett 2:114–124
López-Moreno JI, Beguería S, Vicente-Serrano SM, García-Ruiz JM (2007) The influence of theNAO on water resources in Central Iberia: precipitation, streamflow anomalies and reservoirmanagement strategies. Water Resour Res 43:W09411. doi:10.1029/2007WR005864
López-Moreno JI, Vicente-Serrano SM (2008) Extreme phases of the wintertime North AtlanticOscillation and drought occurrence over Europe: a multi-temporal-scale approach. J Clim21:1220–1243
Maynou F (2008) Influence of the North Atlantic Oscillation on Mediterranean deep-sea shrimplandings. Clim Res 36:253–257
Moses T, Kiladis N, Díaz H, Barry R (1987) Characteristics and frequency of reversals in meansea level pressure in the north Atlantic sector and their relationship to long term temperaturetrend. J Climatol 7:13–30
Osborn TJ (2004) Simulating the winter North Atlantic Oscillation: the roles of internal variabilityand greenhouse gas forcing. Clim Dyn 22:605–623
Osborn TJ, Briffa KR, Tett SFB, Jones PD, Trigo RM (1999) Evaluation of the North AtlanticOscillation as simulated by a coupled climate model. Clim Dyn 15:685–702
Pauling A, Luterbacher J, Casty C, Wanner H (2006) Five hundred years of gridded high-resolutionprecipitation reconstructions over Europe and the connection to large-scale circulation. ClimDyn 26:387–405
Raible CC et al (2006) Climate variability-observations, reconstructions, and model simulationsfor the Atlantic-European and Alpine region from 1500–2100 AD. Clim Change 79:9–29
Roig FA, Barriopedro D, Herrera RG, Patón Domínguez D, Monge S (2009) North AtlanticOscillation signatures in western Iberian tree-rings. Geogr Ann 91:141–157
Rubolini D, Ambrosini R, Caffi M, Brichetti P, Armiraglio S, Saino N (2007) Long-term trendsin first arrival and first egg laying dates of some migrant and resident bird species in northernItaly. Int J Biometeorol 51:553–563
Solomon S, Qin D, Manning M, Chen Z, Marquis M, Averyt KB, Tignor M, Miller HL (2007)Climate change 2007: the physical science basis. Cambridge University Press, Cambridge, UKand New York, NY
Sousa P, Trigo RM, Aizpurua P, Nieto R, Gimeno L, Garcia-Herrera R (2011) Trends and extremesof drought indices throughout the 20th century in the Mediterranean. Nat Hazards Earth SystSci 11:33–51
Trigo IF (2006) Climatology and interannual variability of storm-tracks in the Euro-Atlantic sector:a comparison between ERA-40 and NCEP/NCAR reanalyses. Clim Dyn 26:127–143
Trigo RM et al (2006) Relations between variability in the Mediterranean region and Mid-Latitude variability. In: Lionello P, Malanotte-Rizzoli P, Boscolo R (eds) The Mediterraneanclimate: an overview of the main characteristics and issues. Elsevier, Amsterdam,pp. 179–226
Trigo RM, Osborn TJ, Corte-Real JM (2002) The North Atlantic Oscillation influence on Europe:climate impacts and associated physical mechanisms. Clim Res 20:9–17

8 S.M. Vicente-Serrano and R.M. Trigo
Trigo RM, Pozo-Vazquez D, Osborn TJ, Castro-Diez Y, Gamiz-Fortis S, Esteban-Parra MJ (2004)North Atlantic Oscillation influence on precipitation, river flow and water resources in theIberian Peninsula. Int J Climatol 24:925–944
Vicente-Serrano SM, Heredia A (2004) NAO influence on NDVI trends in the Iberian Peninsula(1982–2000). Int J Remote Sens 25:2871–2879
Vicente-Serrano SM, López-Moreno JI (2008a) The nonstationary influence of the NorthAtlantic Oscillation on European precipitation. J Geophys Res Atmos 113:D20120.doi:10.1029/2008JD010382
Vicente-Serrano SM, López-Moreno JI (2008b) Differences in the nonstationary influence of theNorth Atlantic Oscillation on European precipitation under different scenarios of greenhousegases concentrations. Geophys Res Lett 35:L18710. doi:10.1029/2008GL034832
Vicente-Serrano SM, Trigo RM, López-Moreno JI, Liberato MLR, Lorenzo-Lacruz J, Beguería S,Morán-Tejeda E, El Kenawy A (2011) Extreme winter precipitation in the Iberian Peninsula in2010: anomalies, driving mechanisms and future projections. Clim Res 46:51–65
Wanner H et al (2001) North Atlantic Oscillation—concepts and studies. Surv Geophys22:321–382
Woolf DK, Shaw AGP, Tsimplis MN (2003) The influence of the North Atlantic Oscillation onsea-level variability in the North Atlantic region. Global Atmos Ocean Syst 9:145–167
Xoplaki E, González-Rouco JF, Luterbacher J, Wanner H (2003) Mediterranean summer air tem-perature variability and its connection to the large-scale atmospheric circulation and SSTs. ClimDyn 20:723–739
Xoplaki E, González-Rouco JF, Luterbacher J, Wanner H (2004) Wet season Mediterraneanprecipitation variability: influence of large-scale dynamics and trends. Clim Dyn 23:63–78
Zêzere JL, Trigo RM, Fragoso M, Oliveira SC, Garcia RAC (2008) Rainfall-triggered landslides inthe Lisbon region over 2006 and relationships with the North Atlantic Oscillation. Nat HazardsEarth Syst Sci 8:483–499
Zorita E, Kharin V, Von Storch H (1992) The atmospheric circulation and sea surface temperaturein the North Atlantic area in winter: their interaction and relevance for Iberian precipitation.J Clim 5:1097–1108

Variability and Changes in the North AtlanticOscillation Index
Tim J. Osborn
Abstract Most – or perhaps even all – of the observed variations in the winterNorth Atlantic Oscillation (NAO) index can be explained as internally-generatedclimate variability. The influence of external forcing factors on the observed NAObehaviour is still an open question. Two sea level pressure datasets yield differentresults for the strength of the winter NAO trend from the 1960s to the 1990s, thoughthese trends from both datasets lie outside the 90% range of trends generated by theinternal variability of climate models, and the latter is more precisely known nowthat over 8000 years of simulation under constant forcing is available for analysis.Similarly, a much expanded, multi-model ensemble of simulations under increas-ing anthropogenic forcing strengthens earlier findings of a shift in the mean stateof the winter atmospheric circulation towards positive NAO conditions. There isconsiderable inter-model spread in both the magnitude of this response to increasedforcing and in its regional structure, but of the 21 climate models analysed here,none showed an overall decrease in the mean level of the NAO index. If a shifttowards positive NAO conditions is a realistic response to increasing anthropogenicforcing, then this signal has not yet emerged from the natural variability: observa-tions since the 1990s show a return to lower values, and the 2009/2010 winter hadthe record negative NAO index in a record lasting almost two centuries. It is possi-ble that anthropogenic forcing could be altering the temporal or spatial character ofthe interannual NAO variability, though only relatively small changes in pattern areevident when considering the multi-model ensemble as a whole and there is onlyweak evidence for an increase in the interannual variance.
Keywords Internal variability · External forcing · North Atlantic Oscillationindex · Temperature
T.J. Osborn (B)Climatic Research Unit, School of Environmental Sciences, University of East Anglia,Norwich, UKe-mail: [email protected]
9S.M. Vicente-Serrano, R.M. Trigo (eds.), Hydrological, Socioeconomicand Ecological Impacts of the North Atlantic Oscillation in the Mediterranean Region,Advances in Global Change Research 46, DOI 10.1007/978-94-007-1372-7_2,C© Springer Science+Business Media B.V. 2011

10 T.J. Osborn
1 Introduction
The interannual variability of the North Atlantic Oscillation (NAO) representsbetween 20 and 30% of the Northern Hemisphere winter atmospheric sea-levelpressure (SLP) variance, and an even greater part of the variance in the Atlantic-European sector (e.g. Hurrell and Deser, 2009). For example, defining the NAOindex as the leading principal component of winter (December to February orDecember to March, as here, are typically used) SLP in the domain 15–90◦N and110◦W–70◦E represents around 40% of the variance in this domain (Figs. 1a and2a), updated from Osborn (2004). Taking instead a station-based index – simplythe difference between standardised or raw SLP records near the Azores High andIceland Low pressure systems can yield a longer record, but captures slightly lessvariance (because the principal component was optimised to maximise the variancecaptured). The Gibraltar minus Iceland record first developed by Jones et al. (1997)and updated here (Fig. 1b) now contains 187 complete winters (only those since1887 are shown here).
This is all well established, as are the links between the NAO and some aspects ofsurface climate (Trigo et al., 2002; López-Moreno and Vicente-Serrano, 2008; and
Fig. 1 Two alternative observed timeseries of the winter NAO index. (a) The leading principalcomponent timeseries of Atlantic-European SLP, using the HadSLP2r dataset (Allan and Ansell,2006). (b) The difference between Gibraltar and southwest Iceland SLP observations. The valuesrepresent the absolute pressure difference (hPa) between winter-mean values (a) from the maximaand minima of the EOF pattern, and (b) from Gibraltar and Iceland

Variability and Changes in the North Atlantic Oscillation Index 11
many others). More recent research, coupled with longer observational records thatenable empirical relationships to be better established, is increasing this knowledgeand also extending it to new areas such as the consequences of NAO variability forvarious natural and societal systems. See the rest of this volume for many exam-ples. What is considerably more uncertain is the link between internally-generatedvariability and externally-forced change, and whether the signature of the latter isevident in the observed record. The positive trend in the NAO index from the 1960sto the 1990s, evident in Fig. 1, has been a particular focus of such work (Osbornet al., 1999; Gillett et al., 2003; Osborn, 2004), though more general changes in themean level of the NAO index have also been considered (Selten et al., 2004).
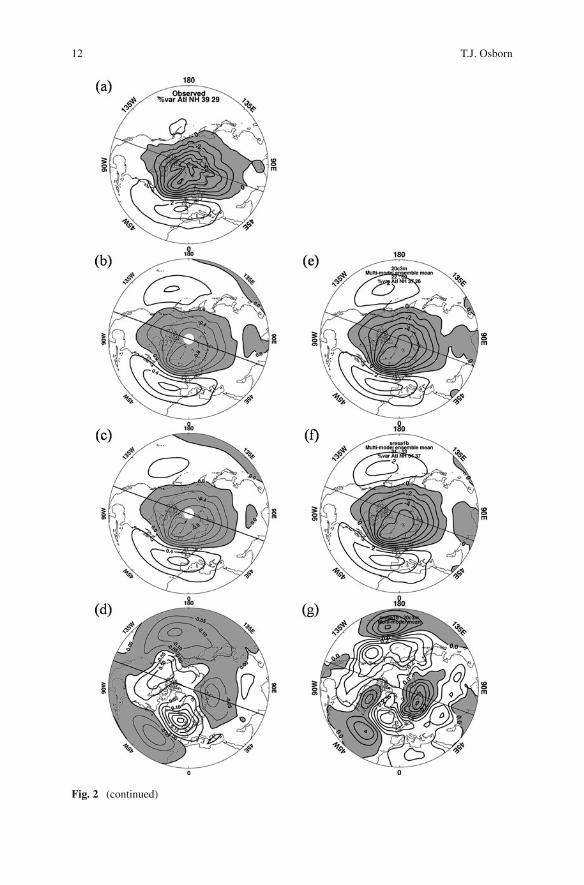
Others have investigated changes in the spatial structure of the NAO pattern(Fig. 2a). For example, a tendency for an eastward shift or extension of the NAOsignature is apparent during part of the observed record (1978–1997 comparedwith 1958–1977; Jung et al., 2003) and also in the response to increased green-house gas concentrations simulated by some climate models (Ulbrich and Christoph,1999). Multi-model analyses (Osborn, 2004; Kuzmina et al., 2005) suggest thatsuch a result is model dependent, though the multi-model mean response in bothcases did show a small north-eastward shift (Fig. 2b–d). A reconsideration of thisis worthwhile using more recent climate models that typically have finer resolu-tion and increasingly sophisticated representations of some physical and dynamicalprocesses.
In addition to possible shifts in the mean level of the NAO index – i.e. corre-sponding to a change in the mean atmospheric circulation that has a structure thatcorrelates positively with the NAO pattern (Fig. 2a) – or in the pattern of interannualNAO variability, it is feasible that external forcing could influence the amplitude oftemporal variability. This is of topical interest because the winter 2009–2010 NAOindex had a record low value in the 187-year record (Osborn, 2011). Though thiscould simply be a random event arising from internal variability, it is also importantto assess the evidence for externally-forced changes in NAO variance which couldalter the likelihood of such extreme events.
This chapter is structured as follows: Section 2 provides a brief description of theobserved and climate model simulated datasets used in this study, while Section 3compares the observed record with the range of internal variability simulated by the
�Fig. 2 Spatial patterns of SLP variability associated with the winter NAO, estimated from theregression coefficients between local SLP and the NAO principal component index. (a) Observedpattern using HadSLP2r (Allan and Ansell, 2006). (b) Average simulated pattern from 7 olderclimate models used by Osborn (2004), using pre-industrial or twentieth-century control runs.(c) As (b), but using the 2050–2099 period under a scenario with increasing CO2 concentrations(1% year–1). (d) Difference (c) minus (b). (e) Average simulated pattern from 22 CMIP3 climatemodels, using the 1922–1999 period under historic forcing (anthropogenic only or anthropogenicand natural). (f) As (e), but using the 2050–2099 period under the SRES A1B scenario of increasinganthropogenic forcing. (g) Difference (f) minus (e). Note that the contour interval is 4 times smallerin panel (d) than in panels (b) and (c), and is 10 times smaller in panel (g) than in panels (e) and (f)
12 T.J. Osborn
Fig. 2 (continued)

Variability and Changes in the North Atlantic Oscillation Index 13
climate models. Then the simulated response to increasing greenhouse gases andother anthropogenic forcings is described, for the mean circulation (Section 4), thepattern of interannual variability (Section 5) and the amplitude of temporal variance(Section 6), before some concluding remarks in Section 7.
2 Observed and Simulated Data
2.1 Observed Data, NAO Pattern and NAO Index
Monthly-mean SLP fields from 1850 to 2010 from the HadSLP2r dataset (Allanand Ansell, 2006) were used. These consist of fields on a 5◦ latitude by 5◦ longitudegrid based on ship and weather station observations till 2004, with near-real-timeupdates from 2005 to 2010 using NCEP/NCAR reanalysis data adjusted so that itsclimatological average matches the observed data. The EOF analysis used to definethe NAO index was applied to the period from 1922 to 1999, because 1922 is the firstyear in the record when at least 20% of the Northern Hemisphere grid boxes containat least 30 observations per month (Allan and Ansell, 2006). Note that the HadSLP2rdataset falls back below this threshold from 1941 to 1948; the dataset is spatiallycomplete because it is based on interpolation from the available observations, butnevertheless the values of the NAO index prior to 1922 and between 1941 and 1948should be considered with more caution.
The spatial pattern of the NAO (Fig. 2a, the leading EOF of the December-to-March seasonal mean SLP) is similar to the pattern found by Hurrell and Deser(2009) who used a longer period, a smaller spatial window focussed on the NorthAtlantic, and a different SLP dataset (Trenberth and Paolino, 1980, dataset withupdates). One difference is in the relative strengths of the northern and southernparts of the dipole, which are more equal in Hurrell and Deser’s pattern (bottompanel of their figure 8) compared with that shown in Fig. 2a here, perhaps becausethe EOF has not been calculated with area-weighting of the SLP data here. Hurrelland Deser (2009) also show that using the shorter December-to-February season(compare the top-left panel of their figure 6 with their figure 8) results in strongerloadings over the North Pacific – which is of interest because most climate modelsshow an EOF pattern with that feature.
The observed NAO index obtained by projecting the HadSLP2r seasonal meandata fields onto the leading EOF is quite similar to the Gibraltar minus Iceland index(Fig. 1). This is in contrast to the earlier analysis of Osborn (2004), where the trendfrom the 1960s to the 1990s was more pronounced and the early 1990s values weredistinctly higher than the preceding century. Osborn (2004) used SLP data based onthe UK Met Office analyses, updated from Jones (1987). Hurrell and Deser (2009)use the leading EOF of the Trenberth and Paolino (1980) SLP data to obtain an NAOindex that shows a more intermediate result. Although these NAO indices are highlycorrelated, they do have different characteristics (e.g. the strength of multi-decadalvariations compared with shorter term variability) that can influence the statisticalsignificance of trends. Further investigation is needed of the differences between
14 T.J. Osborn
these SLP datasets (e.g. whether the reduced-space optimal interpolation algorithmused for HadSLP2r affects the amplitude of long-term variations).
2.2 Simulated Data and NAO Patterns
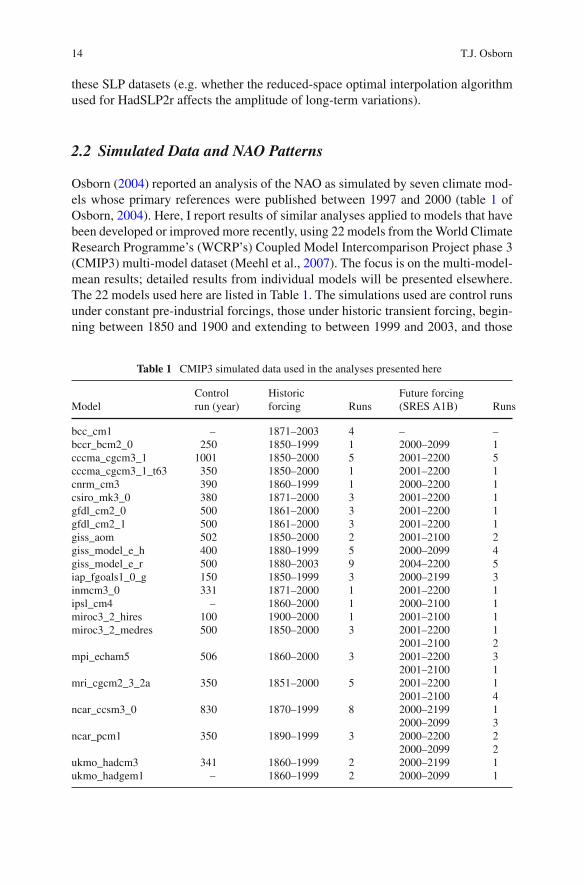
Osborn (2004) reported an analysis of the NAO as simulated by seven climate mod-els whose primary references were published between 1997 and 2000 (table 1 ofOsborn, 2004). Here, I report results of similar analyses applied to models that havebeen developed or improved more recently, using 22 models from the World ClimateResearch Programme’s (WCRP’s) Coupled Model Intercomparison Project phase 3(CMIP3) multi-model dataset (Meehl et al., 2007). The focus is on the multi-model-mean results; detailed results from individual models will be presented elsewhere.The 22 models used here are listed in Table 1. The simulations used are control runsunder constant pre-industrial forcings, those under historic transient forcing, begin-ning between 1850 and 1900 and extending to between 1999 and 2003, and those
Table 1 CMIP3 simulated data used in the analyses presented here
ModelControlrun (year)
Historicforcing Runs
Future forcing(SRES A1B) Runs
bcc_cm1 – 1871–2003 4 – –bccr_bcm2_0 250 1850–1999 1 2000–2099 1cccma_cgcm3_1 1001 1850–2000 5 2001–2200 5cccma_cgcm3_1_t63 350 1850–2000 1 2001–2200 1cnrm_cm3 390 1860–1999 1 2000–2200 1csiro_mk3_0 380 1871–2000 3 2001–2200 1gfdl_cm2_0 500 1861–2000 3 2001–2200 1gfdl_cm2_1 500 1861–2000 3 2001–2200 1giss_aom 502 1850–2000 2 2001–2100 2giss_model_e_h 400 1880–1999 5 2000–2099 4giss_model_e_r 500 1880–2003 9 2004–2200 5iap_fgoals1_0_g 150 1850–1999 3 2000–2199 3inmcm3_0 331 1871–2000 1 2001–2200 1ipsl_cm4 – 1860–2000 1 2000–2100 1miroc3_2_hires 100 1900–2000 1 2001–2100 1miroc3_2_medres 500 1850–2000 3 2001–2200
2001–210012
mpi_echam5 506 1860–2000 3 2001–22002001–2100
31
mri_cgcm2_3_2a 350 1851–2000 5 2001–22002001–2100
14
ncar_ccsm3_0 830 1870–1999 8 2000–21992000–2099
13
ncar_pcm1 350 1890–1999 3 2000–22002000–2099
22
ukmo_hadcm3 341 1860–1999 2 2000–2199 1ukmo_hadgem1 – 1860–1999 2 2000–2099 1
Variability and Changes in the North Atlantic Oscillation Index 15
under the SRES A1B future scenario of increasing greenhouse gas concentrationsand other anthropogenic forcing to 2100. For most models, the SRES A1B simula-tions are extended beyond 2100 with fixed forcings, and model output up to 2200 isused here.
Multiple simulations under the same forcing, but different initial conditions andhence different realisations of internal variability, are available in some cases. Theseinitial-condition ensembles are used by analysing the individual ensemble membersseparately, and then averaging the results to produce an ensemble mean. Table 1indicates the availability of simulations, including the size of initial-conditionensembles, for each of the models used here.
Osborn (2004) explained the advantages of regridding all datasets to a commongrid prior to analysis, so here all simulated data are regridded to the grid of theHadSLP2r observational data. The same methods described in Osborn (2004) forcalculating and scaling the principal component NAO index time series from anEOF analysis of each model simulation are used here – refer to that paper for adetailed description.
The simulated spatial pattern of the NAO, when averaged across the 22 climatemodels with twentieth century simulations (Fig. 2e), bears a very close resemblanceto the observed NAO pattern (Fig. 2a). As with the earlier models (Fig. 2b), theteleconnection between the NAO and the North Pacific is stronger than observed,resembling the Northern Annular Mode more closely (Miller et al., 2006). Notethat the NAO is defined here from an EOF analysis of only the Atlantic half of thehemisphere, but the pattern shown in the maps is from the pattern of regressioncoefficients between the principal component NAO index and SLP from across theentire northern hemisphere. With this exception, the similarity with the observedpattern provides some justification for using these model experiments to investigateNAO behaviour.
3 Comparing the Observed Record with Internally-GeneratedClimate Variability
The detection of climate changes that might be caused by some external forcingrequires the comparison of an observed record with an estimate of the varia-tions that might typically be expected to arise from internal variability. In mostcases, the amplitude of internal variability increases with decreasing timescale, sothat even where a real climate change is present the likelihood of detecting it israther small within a short (e.g. sub-decadal) record. But longer-term trends mustbe compared with an estimate of internally-generated variability on multi-decadaltimescales, and a multi-century record is required to provide an adequate sampleof such variations. The instrumental record is not long enough and is also “con-taminated” by any responses to natural or anthropogenic forcings, rather than beinga “pure” representation of internal variability. In most detection studies, therefore,the internal climate variability is estimated from climate model simulations, using

16 T.J. Osborn
a multi-century control run (i.e., a simulation in which the external forcings areconstant).
Detection results are thus completely dependent on whether the climate model(s)adequately simulate climate variability on the timescale of interest (e.g. multi-decadal fluctuations). These simulations can be evaluated by comparison with theobservational record, but the focus is of course on the shorter timescales that aresampled within the limited length of the observations. Studies that go beyond detec-tion and include an attempt to attribute some of the observed changes to particularexternal forcings also check for consistency between the observed changes and acombination of internal variability and attributed external effects. Although this canidentify instances where the internal variability simulated by the climate model isinconsistent with the observed evidence, the power of the test is again limited forthe crucial multi-decadal timescales.
Osborn (2004) compared the sub-decadal variance of simulated and observedNAO indices and found that three of the models had variances that were significantlyhigher than observed, while the other four were similar. Detection analyses wererepeated, therefore, after scaling the simulated NAO indices to have the same sub-decadal variance as observed. This scaling step profoundly alters the meaning of thedetection exercise, as noted by Osborn (2004), because the climate models are thenonly being used to estimate the spectral shape of the NAO indices, rather than theabsolute magnitude of NAO variability.
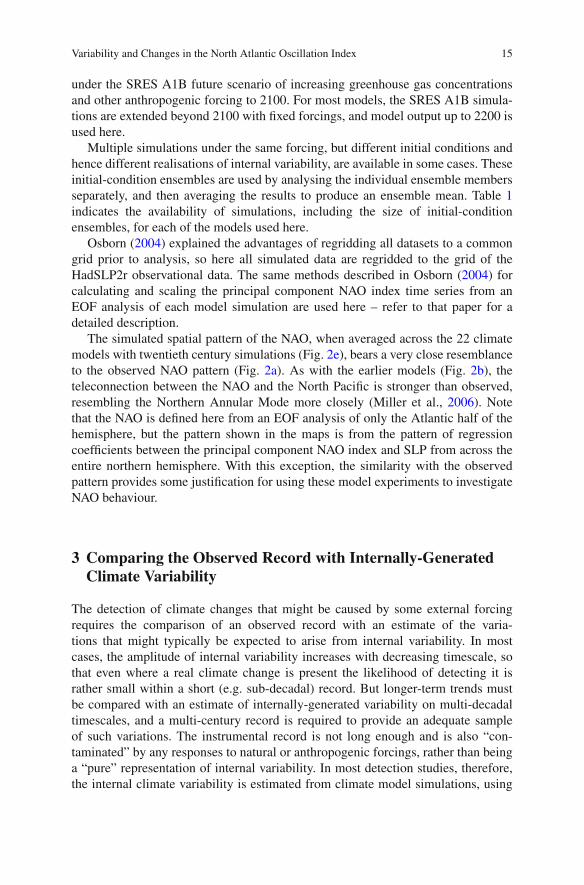
The analysis of Osborn (2004) is repeated here using the CMIP3 pre-industrialcontrol runs (Table 1), together with the NAO index from the HadSLP2r dataset.The 30-year trends evident in this observed NAO index, calculated using a slidingwindow, are compared with the distributions of 30-year trends simulated by theseclimate models with fixed, unchanging forcings (Fig. 3). These distributions are cal-culated from all the 30-year trends in the simulated NAO indices from the 19 climatemodels with pre-industrial control run data. The 5–95% ranges of these simulatedtrends are then determined either for each climate model separately (Fig. 3b) or afterall the trends have been pooled together over the multi-model ensemble (Fig. 3a).This represents a considerable extension to the analysis of Osborn (2004), with 19rather than 7 models, and total simulation time of over 8000 years rather than under3000 years; in addition, many of the models are more sophisticated or have higherspatial and temporal resolution.
The results show that when the simulated NAO indices are scaled to have thesame sub-decadal variance as the observed winter NAO index, the 30-year trendscentred around 1980 (e.g. 1965–1994) lie outside the 90% range of internal variabil-ity simulated by these climate models. The result is the same whether the modelsare pooled together (Fig. 3a) or whether they are considered separately (Fig. 3b),even for the models with the strongest multi-decadal variability (relative to theirsub-decadal variance). Note that Osborn (2004) showed the 95% range (from 2.5to 97.5%) of the control run variability, whereas here I have used the 90% range(from 5 to 95%) because previous analysis of multi-model ensembles (e.g. Osborn,2004; Kuzmina et al., 2005) now yields the a priori expectation of an increase in theNAO index, and thus 95% confidence in detecting an externally-forced trend can be
Variability and Changes in the North Atlantic Oscillation Index 17
Fig. 3 Thirty-year trends in the observed NAO index, calculated in a sliding window and plottedagainst the central year of each window (black dashed curve), compared with the 5 and 95 per-centiles of 30-year NAO index trends arising from the internal variability simulated by 19 climatemodels (horizontal lines). (a) The 5 and 95 percentiles of the overall multi-model ensemble; (b)the 5 and 95 percentiles of the individual model pre-industrial control runs (see legend). All NAOindices are calculated from the leading EOF pattern of each dataset; all simulated NAO indiceswere scaled to have the same sub-decadal variance as the observed NAO index; 30-year trends areexpressed as a trend in standard deviations per decade
assessed using a one-tailed test. The observed trend also exceeds the 97.5 percentile(not shown) of the CMIP3 control run variability (for all individual models as wellas for the multi-model ensemble), so this difference in choice of range is not critical.
The degree to which the observed trend exceeds the simulated internal variabilityis less in this study than found by Osborn (2004). This is mostly because the NAOindex obtained from the HadSLP2r dataset has a considerably weaker trend thanthat found by Osborn (2004); the former peaks just above 0.6 standard deviationsper decade, whereas the latter peaked just over 1.1 standard deviations per decade.

18 T.J. Osborn
This was noted in Section 2.1. As a result, the behaviour of the observed NAO indexmight be compatible with the internal variability of the models, since we wouldexpect the 95 percentile to be exceeded 5% of the time purely by chance. The lowerNAO values since 1995 also suggest that any contribution to the earlier increase inthe winter NAO index from continuing greenhouse gas forcing is likely to be small(see the discussion in Osborn, 2004). The most recent 30-year trend (1981–2010)is still comfortably within the range of internal variability, but analysing 15- or20-year trends in the same way (not shown) shows that the most recent trendsover these shorter periods fall below the 5 percentile of the climate model internalvariability.
4 Changes in the Mean Circulation and the Mean NAO Index
The response of the Northern Hemisphere atmospheric circulation in winter toincreasing anthropogenic forcing is quite varied between different climate models,though a feature common to all but one (GISS AOM) of the CMIP3 models analysedhere is that SLP decreases over most of the Arctic. Most of these climate models alsosimulate an increase in SLP over parts of the subtropics, though there is less consis-tency in the location of these increases. The multi-model average change in winterSLP (Fig. 4) displays these consistent or semi-consistent features: decreases in SLPover the Arctic and surrounding high latitudes, and increases over parts of the sub-tropics, especially the Mediterranean, but also the Pacific and Atlantic. This is inagreement with Miller et al. (2006), who examined the behaviour of the NorthernAnnular Mode in these models. The multi-model mean pattern of SLP change isstronger and more consistent in the CMIP3 models than in the earlier ensembleanalysed by Osborn (2004), and indicates strengthened mean westerly circulationaround the mid-latitudes, including across the Atlantic and into northern Europe.
Fig. 4 Differences inlong-term meanDecember-to-March SLP(hPa) simulated during the1950–1999 period of thehistoric simulations and the2050–2099 of the simulationsunder the SRES A1Bscenario, averaged across allavailable model simulations

Variability and Changes in the North Atlantic Oscillation Index 19
Fig. 5 Timeseries of observed (black dashed line) and simulated December-to-March NAO index,smoothed with a 30-year low-pass filter. Only the mean and estimated 5–95% range of the ensem-ble of individual climate model results are shown, indicated by the thick black line and the greyshading. The simulations are driven by historic forcing estimates up to around 2000, then by theincreasing anthropogenic forcing of the SRES A1B scenario to 2100, followed by constant forc-ings to 2200. The NAO indices are calculated from the leading EOF pattern of each dataset, andthen scaled to represent the change in absolute pressure difference (hPa) between the maximumand minimum of the EOF pattern
There are also strong changes in the western North Pacific, though they are notrelevant to the current paper.
Given this multi-model pattern of SLP change, and some consistency betweenmodels in the large-scale structure (though not in the regional details for individualmodels – not shown here), it is not surprising that the simulated NAO indices showa long-term shift towards positive values (Fig. 5). The individual model results (notshown) provide a large range of future projections, from almost no change up tovalues in excess of a 5 hPa increase in the pressure difference between the locationsof maximum and minimum of the EOF patterns (note that these do not correspondexactly with the maximum and minimum in the present-day SLP in this region). TheGISS AOM model simulates the lowest NAO index during the twenty-first century,but even for this model there is no statistically significant decrease in the NAO index.The inter-model spread is used to estimate a 5–95% range of NAO projections fromthe CMIP3 ensemble, and this is shown in Fig. 5. The observed NAO index is alsoshown, though it is not strictly comparable because some of the model results arebased on the mean of an initial-conditions ensemble (Table 1), which reduces thespread arising from internal variability.
5 Changes in the Pattern of Interannual NAO Variability
Previous work (summarised in Section 1) identified the possibility that the spatialpattern of interannual variability represented by the NAO might change when themean climate changes (e.g. Jung et al., 2003; Ulbrich and Christoph, 1999; Osborn,

20 T.J. Osborn
2004; Kuzmina et al., 2005). In particular, an eastward (or possibly north-eastward)shift or extension of the main centres of action, especially the northern anomaliesassociated with the Iceland Low pressure system, might accompany an increase inthe mean state of the NAO. Hurrell and Deser (2009) also discuss how this mightbe related to circulation regimes on shorter timescales, with regimes associated withpositive NAO conditions tending to extend further eastward in the subpolar region.
Here, I have only considered the CMIP3 models as a whole ensemble (i.e., theyhave not been stratified or selected according to the strength of the shift in the meanNAO index, which might have led to different results). For the whole ensemble,the EOF patterns calculated from the last 50 years of the twentieth century and thetwenty-first century (under the SRES A1B scenario) are compared in Fig. 2e, f.There is very little difference between the multi-model average of the individualEOFs during the two periods. The difference between the EOF patterns (Fig. 2g)shows some minor differences (note that the contour interval in Fig. 2g is ten timessmaller than in 2e and 2f). The small negative changes (shaded) in the loadingsover Scandinavia and north-west Russia, coupled with the small positive changes(unshaded) south of Iceland, represent a minor eastward shift in the northern centreof action. The change in the multi-model mean EOF pattern is, however, consider-ably smaller than obtained by Osborn (2004) from the smaller ensemble of olderclimate models (Fig. 2b–d).
6 Changes in the Amplitude of Interannual NAO Variability
Few changes in the amplitude of NAO variability simulated by individual CMIP3climate models are statistically significant. This is not surprising, however, becausehigher-order statistics, such as the temporal standard deviation, are associated withgreater sampling variability and changes in those statistics are, therefore, more “dif-ficult” to detect than changes in the mean climate (i.e. even when a real changein variability is present, the likelihood of detecting it is smaller than for an equiv-alent change in the mean). Treating them as a multi-model ensemble can help toidentify relatively small changes, providing the changes are consistent across mod-els. In this case, however, there is little consistency between models. Comparingthe intradecadal standard deviations of the simulated NAO indices during the last50 years of the twentieth century with the last 50 years of the twenty-first cen-tury (under the SRES A1B scenario), seven models show an increase of at least10%, three show a decrease of at least 10%, and 11 show changes of less than10%. Averaging across all 21 models shows a minor increase of 4% in the standarddeviation of the NAO index under the SRES A1B scenario.
Another measure of interest is the fraction of overall SLP variability that is asso-ciated with the NAO. Within the Atlantic half of the hemisphere, and over the sameperiods used above, there is also little change under increased anthropogenic forc-ing. Averaged across all 21 models, the SLP variance associated with the leadingEOF increases from 39 to 41%. However, when assessed for individual models,there are nearly as many that show a decrease in the variance explained as show anincrease.

Variability and Changes in the North Atlantic Oscillation Index 21
7 Conclusions
Fluctuations in atmospheric circulation related to the North Atlantic Oscillation arean important driver of climate variability over Europe and the Mediterranean region.Yet it is rather uncertain whether anthropogenic forcings might cause a shift in themean atmospheric circulation that resembles the NAO, or in some way alter thecharacteristics of the internal variability of the NAO (e.g. the spatial pattern or thetemporal variance). This cannot be confidently determined solely from an empiricalanalysis of the observed record, due to difficulties in separating the response to indi-vidual external forcings from internal variability within the available observationalrecord. Other approaches to learning more about NAO behaviour include exam-ining processes within the atmosphere (e.g. stratosphere-troposphere interactions,Perlwitz and Harnik, 2004) that might influence the NAO.
An alternative approach, taken in this study, is to analyse ensembles of mul-tiple climate models (based on general circulation models of the atmosphere andoceans). Here the CMIP3 ensemble of around 20 climate models shows that increas-ing anthropogenic forcings (principally greenhouse gases) might drive a shift of themean circulation towards positive NAO conditions, with enhanced westerly flowacross the Atlantic and into northern Europe. The magnitude of the simulated shiftis very model dependent, and whether such an externally-forced response is neededto explain the observed NAO record is uncertain. The observed increase in the win-ter NAO index from the 1960s to the 1990s is large compared with the models’internally-generated variability, but the dependence of the magnitude of this trend onthe sea level pressure dataset used, plus the return to lower values of the NAO indexsince the early 1990s, reduce the likelihood that a strong influence of greenhousegas forcing is already evident in the observed NAO record. This study significantlyextends earlier multi-model analyses of NAO behaviour (Osborn, 2004; Kuzminaet al., 2005) by using many more climate models, including some with finer reso-lution and more sophisticated representations of physical and dynamical processes.It also complements multi-model studies of related atmospheric circulation featuressuch as the annular modes (Miller et al., 2006).
Acknowledgements This work was supported by a Research Councils UK Academic Fellowship.The modelling groups, the Program for Climate Model Diagnosis and Intercomparison (PCMDI)and the WCRP’s Working Group on Coupled Modelling (WGCM) are acknowledged for theirroles in making available the WCRP CMIP3 multi-model dataset. Support for CMIP3 dataset isprovided by the Office of Science, U.S. Department of Energy.
References
Allan RJ, Ansell TJ (2006) A new globally complete monthly historical mean sea level pressuredata set (HadSLP2): 1850–2004. J Clim 19:5816–5842
Gillett NP, Graf HF, Osborn TJ (2003) Climate change and the North Atlantic Oscillation. InHurrell JW, Kushnir Y, Ottersen G, Visbeck M (eds) North Atlantic Oscillation: climatic sig-nificance and environmental impact. Geophysical Monograph, vol 134. American GeophyscialUnion, Washington, DC, pp 193–209

22 T.J. Osborn
Hurrell JW, Deser C (2009) North Atlantic climate variability: the role of the North AtlanticOscillation. J Mar Syst 78:28–41
Jones PD (1987) The early twentieth century Arctic high—fact or fiction? Clim Dyn 1:63–75.doi:10.1007/BF01054476
Jones PD, Jonsson T, Wheeler D (1997) Extension to the North Atlantic Oscillation using earlyinstrumental pressure observations from Gibraltar and South-West Iceland. Int J Climatol17:1433–1450
Jung T, Hilmer M, Ruprecht E, Kleppek S, Gulev SK, Zolina O (2003) Characteristics of the recenteastward shift of interannual NAO variability. J Clim 16:3371–3382
Kuzmina SI, Bengtsson L, Johannessen OM, Drange H, Bobylev LP, Miles MW (2005)The North Atlantic Oscillation and greenhouse-gas forcing. Geophys Res Lett 32:L04703.doi:10.1029/2004GL021064
López-Moreno JI, Vicente-Serrano SM (2008) Positive and negative phases of the winter-time North Atlantic Oscillation and drought occurrence over Europe: a multitemporal-scaleapproach. J Clim 21:1220–1243
Meehl GA, Covey C, Delworth T, Latif M, McAvaney B, Mitchell JFB, Stouffer RJ, Taylor KE(2007) The WCRP CMIP3 multi-model dataset: a new era in climate change research. Bull AmMeteorol Soc 88:1383–1394
Miller RL, Schmidt GA, Shindell DT (2006) Forced annular variations in the 20th centuryIntergovernmental Panel on Climate Change Fourth Assessment Report models. J GeophysRes 111:D18101. doi:10.1029/2005JD006323
Osborn TJ (2004) Simulating the winter North Atlantic Oscillation: the roles of internal variabilityand greenhouse gas forcing. Clim Dyn 22:605–623
Osborn TJ (2011) Winter 2009/2010 temperatures and a record-breaking North Atlantic Oscillationindex. Weather 66:19–21
Osborn TJ, Briffa KR, Tett SFB, Jones PD, Trigo RM (1999) Evaluation of the North AtlanticOscillation as simulated by a coupled climate model. Clim Dyn 15:685–702
Perlwitz J, Harnik N (2004) Downward coupling between the stratosphere and troposphere: therelative roles of wave and zonal mean processes. J Clim 17:4902–4909
Selten FM, Branstator GW, Dijkstra HA, Kliphuis M (2004) Tropical origins for recent andfuture Northern Hemisphere climate change. Geophys Res Lett 31:L21205. doi:10.1029/2004GL020739
Trenberth KE, Paolino DA (1980) The Northern Hemisphere sea level pressure data set, trends,errors and discontinuities. Mon Wea Rev 108:855–872
Trigo RM, Osborn TJ, Corte-Real J (2002) The North Atlantic Oscillation influence on Europe:climate impacts and associated physical mechanisms. Clim Res 20:9–17
Ulbrich U, Christoph M (1999) A shift of the NAO and increasing storm track activity over Europedue to anthropogenic greenhouse gas forcing. Clim Dyn 15:551–559

The NAO Impact on Droughtsin the Mediterranean Region
Sergio M. Vicente-Serrano, Juan I. López-Moreno, Jorge Lorenzo-Lacruz,Ahmed El Kenawy, Cesar Azorin-Molina, Enrique Morán-Tejeda,Edmond Pasho, Javier Zabalza, Santiago Beguería,and Marta Angulo-Martínez
Abstract This chapter shows the influence of the North Atlantic Oscillation (NAO)on droughts in the entire Mediterranean region between 1901 and 2006. The anal-ysis has been based on identification of positive and negative NAO winters andalso detection of the anomalies of drought severity by means of the StandardizedPrecipitation Evapotranspiration Index (SPEI). The analysis is focussed on the win-ter NAO. Nevertheless, given that the SPEI drought indicator can be obtained atdifferent time-scales, the study shows how the effects of the winter NAO on droughtsare propagated for the following months when long time scales are considered.In general, during the positive phases, the negative SPEI averages are recorded inSouthern Europe (the Iberian Peninsula, Italy and the Balkans), areas of Turkey andnorthwest Africa. On the contrary, the SPEI averages are found positive in north-east Africa. The opposite configuration, but with some differences in the spatialpatterns and the magnitude of the SPEI averages, is found during the negative NAOyears. The findings of this study should be of great applicability in terms of devel-oping early warning systems. The established relationships between NAO phasesand drought indices seem appropriate for drought prediction over large areas of theMediterranean basin.
Keywords Standardized Precipitation Evapotranspiration Index (SPEI) · Droughtindex · Drought trends · Time-scales · Potential evapotranspiration · North AtlanticOscillation (NAO)
1 Introduction
Droughts are first-order hazards of high frequency and intensity in theMediterranean region. They are one of the main natural causes of agricultural, eco-nomic and environmental damage (Burton et al., 1978; Wilhite, 1993). In contrastto other extreme events such as floods, which are typically restricted to small
S.M. Vicente-Serrano (B)Instituto Pirenaico de Ecología, Spanish National Research Council (CSIC), Zaragoza, Spaine-mail: [email protected]
23S.M. Vicente-Serrano, R.M. Trigo (eds.), Hydrological, Socioeconomicand Ecological Impacts of the North Atlantic Oscillation in the Mediterranean Region,Advances in Global Change Research 46, DOI 10.1007/978-94-007-1372-7_3,C© Springer Science+Business Media B.V. 2011

24 S.M. Vicente-Serrano et al.
regions and well-defined temporal intervals, droughts are difficult to pinpoint intime and space. In particular, droughts can affect wide areas over long periodsof time. It is also very difficult to determine the beginning of a drought eventuntil human activities, or the environment, are affected. Moreover, the influencesof a drought can persist over longer periods after it has ended (Changnon andEasterling, 1989). Although droughts are complex phenomenon related to a multi-tude of factors (Wilhite and Glantz, 1985), they always have a climatic origin. Thishas promoted scientific research to investigate the behaviour and characteristics ofclimatic droughts in the Mediterranean region, including their driving mechanisms(Van del Schrier et al., 2006).
In the Mediterranean region, droughts are a climatic risk that have severe con-sequences for agriculture and natural vegetation (Austin et al., 1998; Lázaro et al.,2001; Reichstein et al., 2002; Iglesias et al., 2003), increasing the frequency of fires(Colombaroli et al., 2007; Pausas, 2004) and significantly reducing water availabil-ity for urban and tourist consumption (Morales et al., 2000). Droughts are frequent,but not spatially uniform in the Mediterranean region (Briffa et al., 1994; López-Moreno and Vicente-Serrano, 2008), with significant spatial differences, even atregional scale (Vicente-Serrano et al., 2004; Vicente-Serrano, 2006).
The North Atlantic Oscillation (NAO) is the primary atmospheric circulationmode that determines the climate of the Mediterranean region (Hurrell et al., 2003),with large and well known impacts on temperature, precipitation, cloudiness, etc.(e.g., Hurrell et al., 2003; Hurrell and Van Loon, 1997; Trigo et al., 2002). Differentstudies have focused on analysing the role of the NAO on droughts in Southof Europe and the Mediterranean region (Briffa et al., 1994; Lloyd-Hughes andSaunders, 2002; Van del Schrier et al., 2006). These studies made significant con-tributions to literature in terms of analyzing the spatial and temporal patterns ofdrought using one of the most widely used drought indices: the Palmer DroughtSeverity Index (PDSI; Palmer, 1965).
In addition, drought is widely accepted as a multi-scalar phenomenon. McKeeet al. (1993) clearly illustrated this essential characteristic of droughts throughconsideration of usable water resources including: soil moisture, ground water,snowpack, river discharges, and reservoir storages. The time period from the arrivalof water inputs to availability of a given usable resource differs considerably. Thus,the time scale over which water deficits accumulate becomes extremely impor-tant, and functionally separates hydrological, environmental, agricultural and otherdroughts. For example, the response of hydrological systems to precipitation canmarkedly vary as a function of time (Changnon and Easterling, 1989; Elfatih et al.,1999; Pandey and Ramasastri, 2001). This is determined by the different frequen-cies of hydrologic/climatic variables (Skøien et al., 2003). For this reason, droughtindices must be associated with a specific timescale to be useful for monitoringand management of different usable water resources. Thus, the 9–12-month fixedtime scale considered by the PDSI (Guttman, 1998) limits the ability of the userto analyze certain characteristics of droughts. This is mainly because the responseof different water sources to drought is very sensitive to the chosen time scale.López-Moreno and Vicente-Serrano (2008) used the Standardised Precipitation

The NAO Impact on Droughts in the Mediterranean Region 25
Index (SPI; McKee et al., 1993) to determine the impact of the NAO on drought con-ditions, quantified at different time-scales, in Europe. They found that the responseof droughts to the NAO varies spatially, and differs largely according to the monthof the year and the time scale of the analysis.
At present there is no study that analyses the role of the NAO on droughts atdifferent time scales across the entire Mediterranean region. In this regard, thestudy conducted by López-Moreno and Vicente-Serrano (2008) only focussed onthe Mediterranean Europe employing the SPI, which neglects the role of other vari-ables different to precipitation, to determine drought severity. Different empiricalstudies have shown that temperature rise markedly affects the severity of droughtsand their derived impacts (e.g., Abramopoulos et al., 1988; Breshears et al., 2005;Ciais et al., 2005; Cai and Cowan, 2008; Gerten et al., 2008). Owing to its gen-eral increase in the Mediterranean region (0.5–2◦C) during the last past 150 years(Jones and Moberg, 2003), it is reasonably expected to have adverse consequencesof temperature on drought conditions, with an increase in water demand due toevapotranspiration (Sheffield and Wood, 2008). For this purpose, and to analysethe NAO impact on drought at different time-scales, we have used a new droughtindex (the Standardized Precipitation Evapotranspiration Index; SPEI). This indexis advantageous in that it is sensitive to changes in evaporation demand and can alsobe obtained at different time-scales.
The objective of this chapter is to show the influence of NAO phases on droughtconditions in the Mediterranean region both spatially and temporally, and also toinclude the influence on different time-scales of drought.
2 Methods
To analyse the NAO impact on droughts throughout the Mediterranean basin,we used the SPEIbase, which is based on the Standardised PrecipitationEvapotranspiration Index (SPEI). The data set covers the period 1901–2006 con-sidering time-scales of drought from 1 to 24 months at a spatial resolution of 0.5◦,which represent the variability of a variety of water usable sources (Szalai et al.,2000; Sims et al., 2002; Vicente-Serrano and López-Moreno, 2005; Patel et al.,2007; Khan et al., 2008; Lorenzo-Lacruz et al., 2010) and may have very differ-ent impacts on natural ecosystems and crops (Ji and Peters, 2003; Vicente-Serrano,2007; Quiring and Ganesh, 2010). More details about the SPEI and the correspond-ing data set can be found in Vicente-Serrano et al. (2010), Beguería et al. (2010) andVicente-Serrano et al. (2010b). From the SPEIbase we selected the area comprisedbetween 25.5–48.5◦N and 10◦W–45.5◦E.
The analysis of the NAO impact on droughts was based on a composite pro-cedure by means of the selection of the positive and negative NAO winters. Inthe present study, we used the NAO index calculated from the difference betweenthe standardized pressure anomalies measured at Gibraltar (south of Spain) andReykjavík (Iceland). The advantage of using these stations is discussed in depth byJones et al. (1997), who noted that Gibraltar appears to better represent the southern

26 S.M. Vicente-Serrano et al.
part of the NAO dipole than other commonly used stations, such as Lisbon or PontaDelgada in the Azores. The NAO index was compiled by the Climate Research Unit(CRU), University of East Anglia (http://www.cru.uea.ac.uk/cru/data/nao.htm). Wecalculated the average wintertime NAO index for months from December to March(DJFM) because the NAO has higher activity at this time of the year (Hurrell et al.,2003). Interdecadal variability of the NAO appears to be the most coherent whenthe December–March season is used, rather than using other months (Osborn et al.,1999). Since the NAO index is calculated by the CRU using data from the beginningof the nineteenth century and using the period 1950–1980 as reference, the averageof the winter NAO index for the period 1901–2006 is not 0. Therefore, in orderto have the same number of positive and negative winters and a magnitude com-parable, the resulting winter NAO series obtained from the average of the monthlyvalues was standardised to have an average of 0 and a standard deviation equal to 1.Based on the obtained series, we identified the positive and negative NAO wintersas those with values that differed from the average by at least ±σ. Consequently,16 years were identified as having positive phases and 16 as having negative phases.The positive phases are found in 1903, 1905, 1910, 1913, 1920, 1925, 1957, 1961,1967, 1983, 1989, 1990, 1992, 1994, 1995, and 2000; while the negative phasesoccur in 1917, 1936, 1940, 1941, 1947, 1955, 1956, 1963, 1964, 1965, 1969, 1971,1977, 1979, 1996 and 2006.
For both positive and negative phases of the NAO, we calculated the averagevalues of the SPEI at different time scales for each 0.5◦ series. We then used theWilcoxon–Mann–Whitney rank-sum test (Siegel and Castelan, 1988; Wilks, 2006)to determine whether contrasted NAO phases (positive/negative) lead to statisticallysignificant differences in SPEI averages (dry/humid conditions) at different timescales. The Wilcoxon–Mann–Whitney rank-sum test is based on ranks that do notrequire normally distributed samples; it is slightly less powerful than parametrictests such as the t test (Helsel and Hirsch, 1992). Although the SPEI is a normal-ized variable for the entire series, the normality of the sample cannot be guaranteed,and the distribution may be biased when a sample of years is extracted (i.e., theSPEI values during positive and negative years). For this reason, the use of a non-parametric test is more convenient. The sample that comprised SPEI values foreach of the months of the positive/negative years was compared with the valuesof SPEI for months of normal years (those years within the rank +σ > NAO <−σ)and months of years with the opposite sign. The significance level was establishedat α < 0.05.
Given that SPEI anomalies for the positive and negative NAO years wereobtained for a range of time scales and months for each 0.5◦ series, we summarisedthe information by means of Principal Component Analysis (PCA) applied to thematrix of month/time-scale SPEI anomalies for each series. PCA has been widelyused to determine the general temporal and spatial patterns of climatic variables.It allows common features to be identified and specific local characteristics to bedetermined (Jolliffe, 1990). In this case, the purpose was to identify the generalpatterns of the month/time-scale SPEI anomaly matrixes for the positive and nega-tive NAO phases. The areas represented by each mode (component) were identified

The NAO Impact on Droughts in the Mediterranean Region 27
by mapping the factorial loadings. The number of components was selected inaccordance with the criteria of an eigenvalue larger than 1.
3 Results
Figure 1 shows, as a representative example, the evolution of the SPEI at the timescales of 3-, 6-, 9-, 12-, 18- and 24-month in a region of central France (46.5◦N,8◦E). Negative SPEI index values indicate higher severity of droughts. On theshorter time scales (3 or 6 months), the dry and humid periods are short and occurwith high-frequency. At a time scale of 12 months, droughts were less frequent, butthey lasted longer. At longer time scales (18 or 24 months), droughts lasted longer,but were less frequent, with very few dry or humid periods recorded. The indexallows to identify the main drought periods affected this region in the decades of1940, 1990 and 2000.
Figure 2 shows the SPEI anomalies corresponding to the entire Mediterraneanregion from the average Mediterranean SPEI series in the positive and negativeNAO phases. The pattern is very different among both phases, with general neg-ative (positive) SPEI anomalies across time scales and months during the positive(negative) NAO phases. The most negative anomalies recorded for the positive
Fig. 1 Evolution of the 3-, 6-, 9-, 12-, 18- and 24-month SPEI in central France (46.5◦N, 8◦E)

28 S.M. Vicente-Serrano et al.
Fig. 2 Average SPEI anomalies for the entire Mediterranean region corresponding to the positiveand negative years of the NAO. The month 1 corresponds to December of the NAO phase and themonth 24 is November of two months after
NAO phases is observed at the time scales of 2- to 5-month considering the periodbetween February and June. Nevertheless, although not so intense as observed inlate winter and early spring, the negative anomalies are propagated throughoutlonger SPEI time-scales several months further. On the contrary, the negative NAOphases show general positive SPEI anomalies in most of the months and time-scales, even at the longest time-scales (e.g., 24 months). We should also remarkthat although both phases show opposite pattern, the magnitude of SPEI anoma-lies are not so high, probably due to the large spatial variability existing in therole of NAO on the precipitation and temperature across the Mediterranean basin.Figure 3 shows the average SPEI at various time-scales in different months of theyear during the year of the NAO event and the following year for the positive NAOphases. It also shows the standard deviations of the SPEI values recorded duringthe events. The first relevant conclusion is the important spatial differences in theimpact of the NAO positive phases across the Mediterranean basin. As expected,when the time-scale is higher, the effects of the positive NAO events are smoothed.Nevertheless, independently of this pattern, it is clearly observed that the strongestnegative SPEIs are recorded in the Iberian Peninsula, Morocco, Algeria, Italy andthe Balkans. The negative anomalies have a lower magnitude and a patchy config-uration in Turkey and South France. Moreover, in the Northeast Africa the SPEIanomalies are positive, and the difference of the SPEI values in relation to thenegative and normal years is statistically significant for most of the months andtime-scales.
Figure 3 shows how at short time scales (3- and 5-months) during the springimmediately after the winter NAO, the SPEI averages are very strong: negative inthe north and southwest and positive in the southeast of the basin. In most of the

The NAO Impact on Droughts in the Mediterranean Region 29
Fig
.3L
eft:
Spat
iald
istr
ibut
ion
ofth
eav
erag
eSP
EI
atdi
ffer
entt
ime-
scal
esfo
rso
me
mon
ths
ofth
epo
sitiv
eN
AO
year
san
din
Aug
usto
fth
efo
llow
ing
year
.B
lack
line
sis
olat
ear
eas
inw
hich
the
aver
age
SPE
Ifo
rth
epo
sitiv
eN
AO
year
sis
sign
ifica
ntly
diff
eren
tto
the
rest
ofth
eye
ars.
Rig
ht:S
tand
ard
devi
atio
nof
the
SPE
Iva
lues
duri
ngth
epo
sitiv
eN
AO
win
ters

30 S.M. Vicente-Serrano et al.
basin these averages show statistically significant differences regarding to the SPEIaverages recorded during the negative or normal years. Thus, in most of the IberianPeninsula and large regions of the Balkans the anomalies indicate very strong dryconditions. On the contrary, very humid conditions, on average, are identified innortheast Africa during the positive NAO winters. Droughts quantified at longertime-scales also show how the effect of the positive winter NAO propagates severalmonths after. Thus, in August negative 9-month SPEI values are still recorded inlarge areas, whereas positive values are identified in Northeast Africa. Even duringthe summer of the following year (see the chart of August of the following yearconsidering the time-scale of 21 months), the same pattern is identified, and largeareas show significant differences in the average SPEI values regarding negative andnormal years. Therefore, the results show how the NAO signal may be evident in thedrought conditions several months after the winter.
Figure 3 also shows the standard deviation values of the SPEI calculated forthe 16 positive NAO years. Low standard deviations would indicate low variabil-ity among the positive years. Independently of the time scale and the month ofthe year, regions with strong SPEI anomalies commonly show low variability. TheIberian Peninsula, Northwest Africa and areas of the Balkans show, in general, alow variability among events. On the contrary, Turkey and the eastern sectors of theBalkans, the Iberian Peninsula, and of Italy show very high variability of the SPEIvalues corresponding to the positive years.
Figure 4 shows the spatial distribution of the SPEI average and standard deviationfor the negative NAO years. In the majority of the region, and independently of thetime-scale and the month of the year, the SPEI anomalies tend to be positive. Thus,the magnitude of the average anomalies, regardless of their sign, tends to be muchhigher for the positive than for the negative NAO years. Moreover, the effect ofthe negative phases is propagated for longer, with a stronger magnitude, than theobserved for the positive phases. The two regions with droughts during positiveNAO phases are the Northeast Africa and the near East. In these areas, the NAOeffects are recorded for several months further, showing significant differences withthe SPEI values of the positive and normal years. The standard deviations of theSPEI values are, in general, lower than the observed for the positive phases, whichindicates that the humid conditions associated with the negative phases show a lowvariability among events.
The different average values of the SPEI found between the positive and the neg-ative NAO years clearly indicate a very different risk in the occurrence of droughtconditions across the Mediterranean basin. Figure 5 shows the percentage of yearsin which negative SPEI values, associated to dry conditions, have been found forthe positive and negative NAO years. The analysis covers the same months and timescales shown in Figs. 3 and 4. During the positive phases, high probabilities of dryconditions occurrence are recorded in most of South Europe, Turkey and NorthwestAfrica, mainly during the spring and summer of the positive winters. In March,at a time scale of 3 months, the majority of the Iberian Peninsula, Italy, westernTurkey, the Balkans and Morocco show a percentage higher than 90% of dry condi-tions during positive NAO winters. In France, northern Italy, Turkey and Algeria the

The NAO Impact on Droughts in the Mediterranean Region 31
Fig
.4L
eft:
Spat
iald
istr
ibut
ion
ofth
eav
erag
eSP
EI
atdi
ffer
entt
ime-
scal
esfo
rso
me
mon
ths
ofth
ene
gativ
eN
AO
year
san
din
Aug
usto
fth
efo
llow
ing
year
.B
lack
line
sis
olat
ear
eas
inw
hich
the
aver
age
SPE
Ifo
rth
ene
gativ
eN
AO
year
sis
sign
ifica
ntly
diff
eren
tto
the
rest
ofth
eye
ars.
Rig
ht:
Stan
dard
devi
atio
nof
the
SPE
Iva
lues
duri
ngth
ene
gativ
eN
AO
win
ters

32 S.M. Vicente-Serrano et al.
Fig
.5Pe
rcen
tage
ofye
ars
with
nega
tive
SPE
Iva
lues
.Lef
t:Po
sitiv
eN
AO
year
s.R
ight
:Neg
ativ
eN
AO
year
s

The NAO Impact on Droughts in the Mediterranean Region 33
probability is lower but still relatively high (> 65%). On the contrary, in NortheastAfrica the probability of having dry conditions at this time scale is close to 0. InApril, and at the time-scale of 5-months, the spatial pattern of probability is similarto March. Thus, until June the probability of having dry conditions is higher than80% in the Iberian Peninsula and North of Morocco considering a time-scale of 7months. During the negative NAO years (Fig. 5 left) the probability of having dryconditions is very low in the majority of the basin; thus in some areas of southwest-ern Iberian Peninsula the value is close to 0 during the spring and summer. Only inthe Northeast Africa and the Near East the probability is high (>80%) for most ofthe months of the year and time-scales.
We have summarised the information of the entire Mediterranean region bymeans of a principal component analysis (see methods) for the positive and the neg-ative NAO years. The purpose was to determine the most general time-scale/monthmatrices of the SPEI anomalies corresponding to both phases, in addition tothe regions represented by each pattern. The results of the matrix are shown instandardised units (PC-scores), comparable to the SPEI magnitudes.
Figure 6 shows the results for the positive phases. Three PCs were extracted,which account for 69.3% of the total variance. The component 1 shows some resem-blance with the average pattern indicated in Fig. 2: negative SPEI anomalies atthe time scales of 2–6 months between January and August of the positive year.Moreover, the negative values, indicative of dry conditions, propagate for furthermonths and are dominant until, at least, 24 months after the positive NAO winter.According to the loadings of the first PC, this pattern of time-scale/month anoma-lies mainly represents the entire Iberian Peninsula, the southern coastland of France,most of Italy, the majority of the Balkans, the Anatolian Peninsula and the north-west Africa. Therefore, in these regions the positive NAO years are associated witha propagation of the dry conditions for most of the months and SPEI time scales.In northeast Africa the PC-loadings are dominantly negative and close to –1, whichindicates that these areas are represented by the inverse of the obtained matrix duringthe positive NAO years. The second and third components represent the northern-most areas of France, Italy, the Balkans; and the northern basin of the Black Sea, andthe near East and parts of North Africa, respectively. They contribute to a lower por-tion of the total variance (15.5 and 9.7%, respectively). In the northernmost areas ofthe basin (Component 2) the positive NAO phases are also related to the generalisednegative SPEI values during the winter and spring, but there is no clear propagationthroughout time-scales and months.
For the negative NAO years, the first PC explains 49.2% of the total variance, andrepresents most of the Iberian Peninsula, south of France, Italy, Morocco, south ofthe Balkans and western Turkey (Fig. 7). The pattern of the time-scale/month SPEIanomalies reveals the first pattern of the positive NAO phases, but with oppositesigns to SPEI values. Thus, the negative NAO phases tend to cause humid con-ditions, which are propagated to the SPEI values several months after the winter.This pattern shows negative loadings in northeast Africa and the near East, suggest-ing the opposite behaviour in these areas: a propagation of the dry conditions. The

34 S.M. Vicente-Serrano et al.
Fig
.6R
esul
tsof
the
prin
cipa
lco
mpo
nent
anal
ysis
for
the
posi
tive
NA
Oye
ars.
The
uppe
rfig
ures
repr
esen
tth
ePC
load
ings
ofea
chco
mpo
nent
.The
low
erfig
ures
repr
esen
tthe
prin
cipa
lcom
pone
nts
that
sum
mar
ise
the
mat
rix
ofN
AO
-SPE
Ico
rrel
atio
nsat
diff
eren
ttim
e-sc
ales
and
mon
ths

The NAO Impact on Droughts in the Mediterranean Region 35
Fig
.7R
esul
tsof
the
prin
cipa
lco
mpo
nent
anal
ysis
for
the
nega
tive
NA
Oye
ars.
The
uppe
rfig
ures
repr
esen
tth
ePC
load
ings
ofea
chco
mpo
nent
.The
low
erfig
ures
repr
esen
tthe
prin
cipa
lcom
pone
nts
that
sum
mar
ise
the
mat
rix
ofN
AO
-SPE
Ico
rrel
atio
nsat
diff
eren
ttim
e-sc
ales
and
mon
ths

36 S.M. Vicente-Serrano et al.
components 2 and 3 represent a lower percentage of the total variance, includingareas in which the influence of the negative NAO phases is lower than the observedfor the component 1.
4 Conclusions
The results of this study have demonstrated that the response of droughts to positiveand negative phases of the NAO varies spatially and also depends greatly on thetime scale of drought. In general, during the positive phases, negative SPEI aver-ages are recorded in southern Europe (mainly in the Iberian Peninsula, Italy and theBalkans), parts of Turkey and northwest Africa. On the contrary, in northeast Africathe SPEI averages are positive. The opposite configuration, but with some differ-ences in the spatial patterns and the magnitude of the SPEI averages, is found for thenegative years. This observation is in agreement with the general and widely knownbehaviour of the effects of the NAO on precipitation and temperature throughout theMediterranean region (e.g., Hurrell and Van Loon, 1997; Trigo et al., 2002).
This study highlights the outstanding influence of positive and negative phasesof the wintertime NAO on drought conditions during the succeeding months, quan-tified by means of a multi-scalar drought indicator. This index gives indication ofthe important role of positive and negative phases of the wintertime NAO on usablewater sources throughout the year. We have found that there is a prevalence of eithermaximum or minimum values of the SPEI along the diagonal that summarised theprincipal component analysis in Figs. 6 and 7, with some differences dependingon the regions. This fact is related to the importance of winter climate in terms ofthe total annual amounts. In the Mediterranean region, where the bulk of the pre-cipitation comes mostly during winter, differences in winter precipitation betweenpositive and negative phases are very important, and this behaviour has a noticeableimpact on drought condition during the succeeding months.
Previous studies have shown that the time scales of droughts have a direct rela-tionship with usable water sources, such as soil moisture, river discharge, andreservoir storage (Vicente-Serrano and López-Moreno, 2005; Lorenzo-Lacruz et al.,2010). In general, long time scales of the SPI are related to reservoir storage andriver discharge, whereas short time scales are connected with variability in soilmoisture. Therefore, positive phases of the NAO could lead to drought conditions interms of soil moisture during winter and spring and hydrological droughts (reduc-tion in river discharge and the levels of reservoir storages) in summer and autumnover southern Europe and northwest Africa. On the contrary, in northeast Africa andthe near East the deficits will be mainly driven by the negative phases of the NAO.The above results are in agreement with the observed response of hydrological sys-tems to the NAO in different Mediterranean regions. Trigo et al. (2004) documenteda lag time of 2–3 months in the response of river discharge to NAO positive and neg-ative phases in the Atlantic basins of the Iberian Peninsula. Also, in a study of theTagus basin within the Iberian Peninsula, López-Moreno et al. (2007) reported thatthe impact of positive and negative phases of the NAO on river discharge and levels

The NAO Impact on Droughts in the Mediterranean Region 37
of storage in reservoirs is neither instantaneous nor restricted to the winter months.Thus, the decrease in the amount of water stored in the reservoirs during negativephases of the NAO is especially severe during the next summer and autumn, whereasin winter and spring the amount of stored water is similar to that of normal years.
Nevertheless, the expected impact is not only restricted to the direct usablewater resources since different natural systems and crops show a response to longerdrought time scales. Vicente-Serrano (2007) found a high correlation between thevegetation activity in semi-arid regions of northeast Spain and drought time-scalesbetween 6 and 12 months. Within dry-lands of this region, crop production of earlysummer responded considerably at time-scales between 6 and 12 months (Vicente-Serrano et al., 2006). Therefore, in these regions the NAO variability will have agreat impact on the vegetation activity, directly driven by the soil moisture avail-ability (Vicente-Serrano and Heredia-Laclaustra, 2004; Gouveia et al., 2008). Inthis way, in the coastland areas of Egypt and the near East, where large agricul-tural areas depend on winter rainfall, crop productions will be driven by droughtvariability, which is highly conditioned by the NAO positive phases.
Finally, we must highlight that although teleconnection indices such as the NAOhave been widely used to predict drought conditions with a high degree of relia-bility (e.g., Rodwell, 2003), they may be useful only in those regions in which ageneral stability of the SPEI values for the positive or negative SPEI phases is found(Figs. 3 and 4). In other areas (mainly in Turkey and South France), the large vari-ability among events observed during the positive NAO phases does not make theprediction and management of droughts an easy task, particularly those based solelyon the wintertime NAO index. Given that the NAO configurations and the NAO-climate connectivity have had large changes in the last decades (Vicente-Serranoand López-Moreno, 2008), the regions less affected by the direct influences of theNAO dipole show a large variability among events (Massei et al., 2007).
The findings reported here should be of great use in the development of earlywarning systems and in mitigating the effects of drought in an area that is especiallyprone to such phenomena. The development of measures for drought planning andpreparedness is a priority to reduce drought hazards (Wilhite, 1996; Wilhite et al.,2007; Prabhakar and Shaw, 2008). A critical component in drought planning is theprovision of timely and reliable climate information on which management deci-sions are made (Svoboda et al., 2004). Hence, drought monitoring is crucial for theimplementation of drought plans and the use of the results found here, in terms of thelagged impacts of NAO events throughout different time-scales and months, offersa unique mechanism for drought prediction. The established relationships betweenNAO phases and drought indices therefore seem appropriate for drought predictionover large areas of the Mediterranean basin.
Acknowledgements This work has been supported by the research projects CGL2008-01189/BTE and CGL2006-11619/HID financed by the Spanish Commission of Science andTechnology and FEDER, EUROGEOSS (FP7-ENV-2008-1-226487) and ACQWA (FP7-ENV-2007-1- 212250) financed by the VII Framework Programme of the European Commission, and“La nieve en el Pirineo aragonés: Distribución espacial y su respuesta a las condiciones climáticas”Financed by “Obra Social La Caixa” and the Aragón Government.
38 S.M. Vicente-Serrano et al.
References
Abramopoulos F, Rosenzweig C, Choudhury B (1988) Improved ground hydrology calculationsfor global climate models (GCMs): soil water movement and evapotranspiration. J Clim 1:921–941
Austin RB, Cantero-Martínez C, Arrúe JL, Playán E, Cano-Marcellán P (1998) Yield-rainfallrelationships in cereal cropping systems in the Ebro river valley of Spain. Eur J Agron8:239–248
Beguería S, Vicente-Serrano SM, Angulo M (2010) A multi-scalar global drought data set: theSPEIbase: a new gridded product for the analysis of drought variability and impacts. Bull AmMeteorol Soc 91:1351–1354
Breshears DD, Cobb NS, Rich PM et al (2005) Regional vegetation die-off in response to global-change-type drought. PNAS 102:15144–15148
Briffa KR, Jones PD, Hulme M (1994) Summer moisture variability across Europe, 1892–1991:an analysis based on the Palmer drought severity index. Int J Climatol 14:475–506
Burton I, Kates RW, White GF (1978) The environment as hazard. Oxford University Press,New York, 240 pp
Cai W, Cowan T (2008) Evidence of impacts from rising temperature on inflows to the Murray-darling basin. Geophys Res Lett 35:L07701. doi:10.1029/2008GL033390
Changnon SA, Easterling WE (1989) Measuring drought impacts: the Illinois case. Water ResourBull 25:27–42
Ciais Ph, Reichstein M, Viovy N et al (2005) Europe-wide reduction in primary productivity causedby the heat and drought in 2003. Nature 437:529–533
Colombaroli D, Marchetto A, Tinner W (2007) Long-term interactions between Mediterranean cli-mate, vegetation and fire regime at Lago di Massaciuccoli (Tuscany, Italy). J Ecol 95:755–770
Elfatih A, Eltahir B, Yeh PJF (1999) On the asymmetric response of aquifer water level to floodsand droughts in Illinois. Water Resour Res 35:1199–1217
Gerten D, Rost S, von Bloh W, Lucht W (2008) Causes of change in 20th century global riverdischarge. Geophys Res Lett 35:L20405. doi:10.1029/2008GL035258
Gouveia C, Trigo RM, DaCamara CC, Libonati R, Pereira JMC (2008) The North AtlanticOscillation and European vegetation dynamics. Int J Climatol 28:1835–1847
Guttman NB (1998) Comparing the Palmer drought index and the Standardized PrecipitationIndex. J Am Water Resour Assoc 34:113–121
Helsel DR, Hirsch RM (1992) Statistical methods in water resources. Elsevier, New York, 522 ppHurrell JW, Kushnir Y, Ottersen G, Visbeck M (2003) An overview of the North Atlantic
Oscillation. In Hurrell JW, Kushnir Y, Ottersen G, Visbeck M (eds) The North AtlanticOscillation: climate significance and environmental impact. Geophysical Monograph Series,vol 134, pp 1–36
Hurrell J, Van Loon H (1997) Decadal variations in climate associated with the North AtlanticOscillation. Clim Change 36:301–326
Iglesias E, Garrido A, Gomez-Ramos A (2003) Evaluation of drought management in irrigatedareas. Agric Econ 29:211–229
Ji L, Peters AJ (2003) Assessing vegetation response to drought in the northern Great Plains usingvegetation and drought indices. Rem Sens Environ 87:85–98
Jolliffe IT (1990) Principal component analysis: a beginner’s guide. Part I: Introduction andapplication. Weather 45:375–382
Jones PD, Jónsson T, Wheeler D (1997) Extensions to the North Atlantic Oscillation usingearly instrumental pressure observations from Gibraltar and southwest Iceland. Int J Climatol17:1433–1450
Jones PD, Moberg A (2003) Hemispheric and large-scale surface air temperature variations: anextensive revision and an update to 2001. J Clim 16:206–223
Khan S, Gabriel HF, Rana T (2008) Standard precipitation index to track drought and assess impactof rainfall on watertables in irrigation areas. Irrigat Drain Syst 22:159–177

The NAO Impact on Droughts in the Mediterranean Region 39
Lloyd-Hughes B, Saunders MA (2002) A drought climatology for Europe. Int J Climatol22:1571–1592
Lorenzo-Lacruz J, Vicente-Serrano SM, López-Moreno JI, Beguería S, García-Ruiz JM, CuadratJM (2010) The impact of droughts and water management on various hydrological systems inthe headwaters of the Tagus River (central Spain). J Hydrol 386:13–26
Lázaro R, Rodrigo FS, Gutiérrez L, Domingo F, Puigdefábregas J (2001) Analysis of a 30-yearrainfall record (1967–1997) in semi-arid SE spain for implications on vegetation. J AridEnviron 48:373–395
López-Moreno JI, Beguería S, Vicente-Serrano SM, García-Ruiz JM (2007) The influence of theNAO on water resources in central Iberia: precipitation, streamflow anomalies and reservoirmanagement strategies. Water Resour Res 43:W09411. doi: 10.1029/2007WR005864
López-Moreno JI, Vicente-Serrano SM (2008) Extreme phases of the wintertime North AtlanticOscillation and drought occurrence over Europe: a multi-temporal-scale approach. J Clim21:1220–1243
Massei N, Durand A, Deloffre J, Dupont JP, Valdes D, Laignel B (2007) Investigating possiblelinks between the North Atlantic Oscillation and rainfall variability in Northwestern Franceover the past 35 years. J Geophys Res 112:D09121. doi:10.1029/2005JD007000
McKee TBN, Doesken J, Kleist J, (1993) The relationship of drought frequency and durationto time scales. 8th conference on applied climatology, Anaheim, CA. Amer Meteor Soc,pp 179–184
Morales A, Olcina J, Rico AM (2000) Diferentes percepciones de la sequía en España: adaptación,catastrofismo e intentos de corrección. Investigaciones Geográficas 23:5–46
Osborn TJ, Briffa KR, Tell SFB, Jones PD, Trigo RM (1999) Evaluation of the North AtlanticOscillation as simulated by a climate model. Clim Dyn 15:685–702
Palmer WC (1965) Meteorological droughts. U.S. Department of Commerce Weather BureauResearch Paper 45, 58 pp
Pandey RP, Ramasastri KS (2001) Relationship between the common climatic parameters andaverage drought frequency. Hydrol Process 15:1019–1032
Patel NR, Chopra P, Dadhwal VK (2007) Analyzing spatial patterns of meteorological droughtusing standardized precipitation index. Meteorol Appl 14:329–336
Pausas JG (2004) Changes in fire and climate in the eastern Iberian Peninsula (Mediterraneanbasin). Clim Change 63:337–350
Prabhakar SVRK, Shaw R (2008) Climate change adaptation implications for drought riskmitigation: a perspective for India. Clim Change 88:113–130
Quiring SM, Ganesh S (2010) Evaluating the utility of the Vegetation Condition Index (VCI) formonitoring meteorological drought in Texas. Agr Forest Meteoro 150:330–339
Reichstein M, Tenhunen JD, Roupsard O, Ourcival J-M, Rambal S, Miglietta F, Peressotti A,Valentini R (2002) Severe drought effects on ecosystem CO2 and H2O fluxes at threeMediterranean evergreen sites: revision of current hypotheses? Global Change Biol 8:999–1017
Rodwell MJ (2003) On the predictability of the North Atlantic climate. In: Hurrell JW, Kushnir Y,Ottersen G, Visbeck M (eds) The North Atlantic Oscillation: climate significance and envi-ronmental impact. Geophysical Monograph Series, American Geophysical Union (AGU),Washington DC, vol 134, pp 173–192
Sheffield J, Wood EF (2008) Projected changes in drought occurrence under future global warmingfrom multi-model, multi-scenario, IPCC AR4 simulations. Clim Dyn 31:79–105
Siegel S, Castelan NJ (1988) Nonparametric statistics for the behavioral sciences. McGraw-Hill,New York
Sims AP, Nigoyi DS, Raman S (2002) Adopting indices for estimating soil moisture: a NorthCarolina case study. Geophys Res Lett 29:1183. doi:10.1029/2001GL013343
Skøien JO, Blösch G, Western AW (2003) Characteristic space scales and timescales in hydrology.Water Resour Res 39:1304. doi:10.1029/2002WR001736
Svoboda MD, Hayes MJ, Wilhite DA, Tadesse T (2004) Recent advances in drought monitoring.14th conference on applied climatology, Seattle, WA, Jan 12–16. American MeteorologicalSociety, pp 5237–5240

40 S.M. Vicente-Serrano et al.
Szalai S, Szinell CS, Zoboki J (2000) Drought monitoring in Hungary. In: Early warning sys-tems for drought preparedness and drought management. World Meteorological Organization,Lisbon, pp 182–199
Trigo RM, Osborn TJ, Corte-Real JM (2002) The North Atlantic Oscillation influence on Europe:climate impacts and associated physical mechanisms. Clim Res 20:9–17
Trigo RM, Pozo-Vazquez D, Osborn TJ, Castro-Diez Y, Gamiz-Fortis S, Esteban-Parra MJ (2004)North Atlantic Oscillation influence on precipitation, river flow and water resources in theIberian Peninsula. Int J Climatol 24:925–944
Van del Schrier G, Briffa KR, Jones PD, Osborn TJ (2006) Summer moisture variability acrossEurope. J Clim 19:2818–2834
Vicente-Serrano SM (2006) Spatial and temporal analysis of droughts in the Iberian Peninsula(1910–2000). Hydrol Sci J 51:83–97
Vicente-Serrano SM (2007) Evaluating the impact of drought using remote sensing in a mediter-ranean, semi-arid region. Nat Hazards 40:173–208
Vicente-Serrano SM, Beguería S, López-Moreno JI (2010) A multi-scalar drought index sensi-tive to global warming: the standardized precipitation evapotranspiration index – SPEI. J Clim23:1696–1718
Vicente-Serrano SM, Beguería S, López-Moreno JI, Angulo M, El Kenawy A (2010b) A newglobal 0.5◦ gridded dataset (1901–2006) of a multiscalar drought index: comparison with cur-rent drought index datasets based on the Palmer Drought Severity Index. J Hydrometeorol11:1033–1043
Vicente-Serrano SM, Cuadrat JM, Romo A (2006) Early prediction of crop productions usingdrought indices at different time scales and remote sensing data: application in the Ebro valley(North-East Spain). Int J Remote Sens 27:511–518
Vicente-Serrano SM, González-Hidalgo JC, de Luis M, Raventós J (2004) Spatial and temporalpatterns of droughts in the Mediterranean area: the Valencia region (East–Spain). Clim Res26:5–15
Vicente-Serrano SM, Heredia-Laclaustra A (2004) NAO influence on NDVI trends in the IberianPeninsula (1982–2000). Int J Remote Sens 25:2871–2879
Vicente-Serrano SM, López-Moreno JI (2005) Hydrological response to different time scales ofclimatological drought: an evaluation of the standardized precipitation index in a mountainousMediterranean basin. Hydrol Earth Syst Sci 9:523–533
Vicente-Serrano SM, López-Moreno JI (2008) The nonstationary influence of the NorthAtlantic Oscillation on European precipitation. J Geophys Res Atmos 113:D20120.doi:10.1029/2008JD010382
Wilhite DA (1993) Drought assessment, management and planning: theory and case studies.Kluwer, Boston, MA
Wilhite DA (1996) A methodology for drought preparedness. Nat Hazards 13:229–252Wilhite DA, Glantz MH (1985) Understanding the drought phenomenon: the role of definitions.
Water Int 10:111–120Wilhite DA, Svoboda MD, Hayes MJ (2007) Understanding the complex impacts of drought: a key
to enhancing drought mitigation and preparedness. Water Resour Manag 21:763–774Wilks DS (2006) Statistical methods in the atmospheric sciences. Academic Press, San Diego, CA,
648 pp

The Impacts of the NAO on HydrologicalResources of the Western Mediterranean
Ricardo M. Trigo
Abstract The present study analyses the impact of the North Atlantic Oscillation(NAO) on the precipitation and river flow regime of the western Mediterraneanregion. The spatial pattern of the NAO impact over western Europe and theMediterranean is evaluated on a monthly basis showing that the NAO impact is wellapparent and significant between December and March, and not so well definedbetween October and November. I have focused the attention on the impact ofthe NAO pattern on the river flow regimes for the three largest transboundaryIberian river basins, namely the Douro (north), the Tejo (centre) and the Guadiana(south). Results show that the large inter-annual variability of these three riversflow is largely modulated by the NAO phenomena. Moreover, the magnitude ofthe relationship between NAO and river discharges increases substantially for thelast period considered (1973–1998), with values being statistically significant at the1%. Major changes in the precipitation regime of Iberia have occurred in the last 5decades, with an outstanding decrease in precipitation being noticed in March sincethe 1960s, which is significantly associated with increasing probabilities of posi-tive values of the NAO index. It is also shown that this decline of precipitation isinducing a significant decrease of river flow for the three Iberian river basins consid-ered. Finally, it is well known that the precipitation and river flow regimes in Iberiapresent large values of inter-annual variability, being characterised by large dispar-ities between wet and dry years. These characteristics will probably exacerbate inthe coming decades as, according to modelling results, the entire Mediterraneanbasin is bound to become hotter and drier under an increased frequency of posi-tive NAO winters. Therefore, if we consider the rising use of water in both Iberiancountries (Portugal and Spain) for agricultural, touristic, hydroelectricity productionand urban purposes, one can foresee an increasing stressed situation for the waterresources management in the region directly driven by the NAO conditions.
Keywords NAO · Precipitation · Water resources · River flow · IberianPeninsula · Trends
R.M. Trigo (B)Instituto Dom Luiz, Universidade de Lisboa, Campo Grande, Faculdade de Ciencias,Edificio C8, Piso 3, 1749-016 Lisbon, Portugale-mail: [email protected]
41S.M. Vicente-Serrano, R.M. Trigo (eds.), Hydrological, Socioeconomicand Ecological Impacts of the North Atlantic Oscillation in the Mediterranean Region,Advances in Global Change Research 46, DOI 10.1007/978-94-007-1372-7_4,C© Springer Science+Business Media B.V. 2011

42 R.M. Trigo
1 Introduction
The western Mediterranean region is roughly positioned at the southern edge of theNorth Atlantic storm tracks. Thus this sector is particularly susceptible to interan-nual shifts in the trajectories of mid-latitude cyclones and associated fronts that canlead to remarkable anomalies of precipitation and, to a lesser extent, of temperature(Trigo et al., 2006). Given the seasonal characteristics of the Atlantic storm-tracks,this is particularly true in winter when the influence of mid-latitude variability isat its greatest. Storm-track variability impacts primarily the western Mediterranean,but it has also a signature clearly present in the eastern Mediterranean (e.g. Türkesand Erlat, 2003; Xoplaki et al., 2004). The Iberian Peninsula orography has a stronginfluence on the way that most low pressure systems affect the climate at a morelocal scale, as mountain ranges shield regions from oceanic moisture advection(Gimeno et al., 2010). Thus the precipitation regime in the northern and westernsectors of the Iberian Peninsula is mostly controlled by the mean annual cycle ofthe location of the Atlantic storm track, while the interior and the eastern sectorsof Iberia are partially affected by large-scale synoptic systems with Atlantic ori-gin, but also by convective precipitation with Mediterranean influence (Trigo et al.,1999, 2000). The amount and distribution of precipitation in the Iberian Peninsulais highly irregular in both the spatial and temporal dimensions (Esteban-Parra et al.,1998; Serrano et al., 1999; Trigo and DaCamara, 2000).
The variability of precipitation over large sectors of Iberia are known to beclosely connected to the large-scale atmospheric circulation modes, including theNorth Atlantic Oscillation (von Storch et al., 1993; Serrano et al., 1999; Trigoand Palutikof, 2001; López-Moreno et al., 2007). The North Atlantic Oscillation(NAO) has been described since the pioneering works of Walker (1924) in theearly twentieth century and corresponds to one of the major patterns of atmosphericvariability in the Northern Hemisphere (Wallace and Gutzler, 1981; Barnston andLivezey, 1987). This important circulation mode was poorly studied in the fol-lowing decades until relatively recently when it has been characterised in moredetail (e.g., Wallace and Gutzler, 1981; Barnston and Livezey, 1987; Hurrell, 1995;Hurrell et al., 2003). In simple terms, the NAO corresponds to a large-scale merid-ional oscillation of atmospheric mass between the subtropical anticyclone near theAzores and the subpolar low pressure system near Iceland (Hurrell, 1995; Trigoet al., 2002). Recently, a number of different studies have shown the relevanceof the NAO to the winter surface climate of the Northern Hemisphere in gen-eral and over the Atlantic/European sector in particular (Hurrell, 1995; Hurrelland van Loon, 1997; Trigo et al., 2002). Furthermore several studies have estab-lished links between different NAO modes and changes in the associated activityof North-Atlantic storm tracks (Osborn et al., 1999; Trigo et al., 2006). Theexistence of two contemporaneous and possibly related winter-time trends overthe last 3 decades: a trend towards the positive phase of the NAO and a trendtowards warmer Northern Eurasian land temperatures has now been established(Hurrell and van Loon, 1997). Nevertheless it should be noted that the influenceof the NAO pattern in the Mediterranean is considerably higher for precipitation

The Impacts of the NAO on Hydrological Resources of the Western Mediterranean 43
than for temperature, where it plays a relatively minor role (Castro-Díez et al.,2002).
The strong control exerted by the NAO on precipitation over the Mediterraneanbasin is bound to be reflected in the seasonal flow of rivers across the region. Itshould be noted that the river basin system acts as an effective spatial and temporalintegrator of precipitation (rain and snow), temperature, and related evapotranspira-tion over a specific region. Therefore, seasonal to interannual streamflow variabilityin many river-basins can be controlled by corresponding changes in large scaleatmospheric circulation patterns. The relationship between these climatic regimesand its hydrological response, through its streamflow, presents different grades ofcomplexity according to the physical characteristics of the basin (e.g. topography,land cover, soil types, lithology, etc.). Thus, the spatial variability in the responseof river discharges to the NAO can be very high, with strong differences betweenneighbour rivers as a consequence of the basin characteristics (Morán-Tejeda et al.,2011).
During the last decade several works have been published focusing on the impactof the NAO pattern on river flow regimes of many Mediterranean river basins (e.g.Struglia et al., 2004; Trigo et al., 2004; López-Moreno et al., 2007) but also for adja-cent Middle Eastern rivers, including the Tigris, Euphrates and Jordan (Cullen anddeMenocal, 2000; Cullen et al., 2002), and the large central European river Danube(Rîmbu et al., 2002). While the statistical significance of results varies among riverbasins, these studies show that river flow tends to be lower (higher) when the NAOindex is in its positive (negative) phase.
The main objective of this chapter is to summarize different impacts of the NAOinvestigated by the author in the last decade, namely on the European/Mediterraneanclimate (Trigo and Palutikof, 2001, 2002, 2004, Trigo et al., 2006), with a particularemphasis on the Iberian water resources (Trigo et al., 2004; Trigo, 2008), but alsoon changes of precipitation and river flow regime (Paredes et al., 2006; Trigo et al.,2008).
2 Results
2.1 Impact in Large-Scale Circulation and Precipitation
There are a number of NAO indices available in the literature and providedby researchers that have implemented different methodological approaches (e.g.Barnston and Livezey, 1987; Hurrell, 1995; Jones et al., 1997). Results presentedhere were based on the NAO index developed at the Climatic Research Unit(University of East Anglia, UK) and defined, on a monthly basis, as the differ-ence between the normalized surface pressure at Gibraltar (southern tip of IberianPeninsula) and Stykkisholmur in Iceland (Jones et al., 1997). Taking into accountthat the NAO index for winter months presents a positive trend during the last 3decades of the twentieth century its distribution is dominated by positive values,

44 R.M. Trigo
with monthly averages above zero (Jones et al., 1997). Therefore it is advisableto normalize the entire winter NAO index (average of DJFM values) so it haszero mean (for the normal period 1961–2000) and standard deviation one. Finally,we defined the seasonal high NAO composite to be a combination of all winterswith NAO index greater than 0.5, while the low NAO composite corresponds to allwinters characterised with an NAO index value smaller than –0.5.
Following the approach adopted in Trigo et al. (2004), we show the large-scaleimpact of winter NAO on atmospheric circulation and precipitation for the NorthAtlantic and European sector (Fig. 1). This is performed using monthly averagevalues of sea level pressure (SLP) and precipitation rate fields obtained from theNCEP/NCAR (National Centers for Environmental Prediction/National Center forAtmospheric Research) reanalyses dataset (Kalnay et al., 1996) for the period span-ning between 1961 and 2000. Anomaly fields of SLP and precipitation rate forwinter (DJFM) months characterized by high (NAO index > 0.5) and low (NAOindex < –0.5) values are shown in Fig. 1a, b, respectively. The spatial signatureof the NAO is given by the difference in SLP between composites (Fig. 1c). Thecorresponding precipitation rate anomalies are also represented (grey scale), wher-ever those anomalies are significantly different (at the 5% level) from climatology(Fig. 1a, b) or between composites (Fig. 1c). Several aspects in this figure are worthto be mention, namely:
(a) The typical NAO pattern can be recognised in the SLP anomalies obtained forboth the positive (Fig. 1a) and negative (Fig. 1b) composites that reveal theexpected dipole between the Iceland and the Azores regions so well depictedwhen the difference between composites is computed (Fig. 1c). However, itshould be noted that the southern centre of action is not located over the straitof Gibraltar (where the station used for computing the NAO index is placed),because the variance of SLP is lower there than over the Azores, and thus themagnitude of the composite anomaly is greater over the Azores (Trigo et al.,2002);
(b) The impact of the NAO on the North Atlantic winter precipitation field, for bothphases of the NAO index, is not restricted to the European continent but extendsconsiderably over large sectors of the, mostly uninhabited, North Atlantic. Infact Fig. 1c shows quasi-zonal bands of opposite anomaly signs, with large pos-itive differences concentrated in the northern latitudes, extending from easternGreenland to Scandinavia. At lower latitudes, a significant band of negative dif-ferences extends from south of Newfoundland crosses the Azores archipelagoand extends throughout the northern Mediterranean basin until Turkey, withlarger differences located west of Iberia.
Interestingly, the vast majority of works that have been published evaluating theimpact of NAO in Europe/Mediterranean have been performed on a seasonal basis,usually confined to the winter months (e.g. DJF of DJFM). Following the approachadopted in Trigo et al. (2008) the monthly spatial correlation pattern between theEuropean precipitation and the corresponding monthly NAO pattern is presented

The Impacts of the NAO on Hydrological Resources of the Western Mediterranean 45
Fig. 1 Precipitation rate anomaly fields (mm/day) from the NCEP/NCAR reanalysis for wintermonths with (a) high NAO index > 0.5, (b) low NAO index < –0.5 and, and, (c) their difference.Precipitation anomalies are represented only if significant at the 5% level. Positive (solid) andnegative (dashed) isolines of the sea level pressure anomaly field (hPa) are also represented
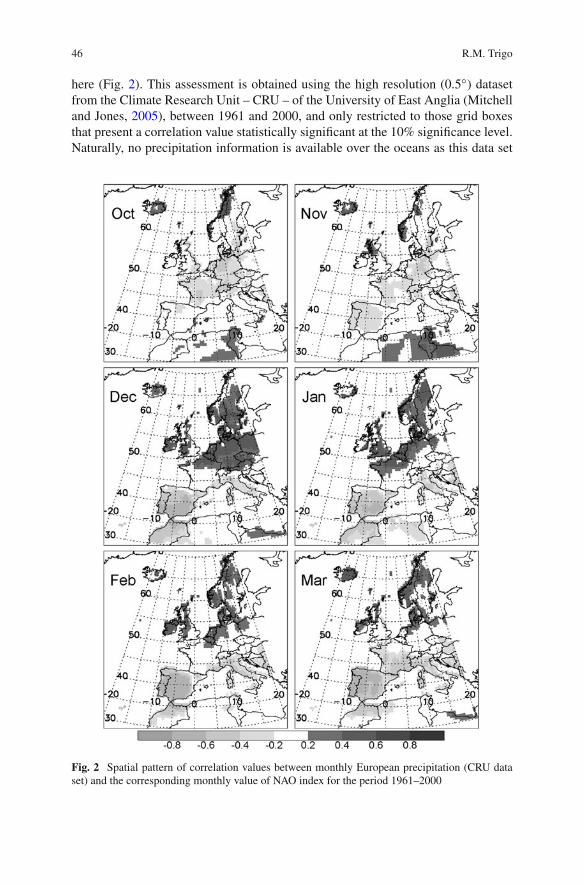
46 R.M. Trigo
here (Fig. 2). This assessment is obtained using the high resolution (0.5◦) datasetfrom the Climate Research Unit – CRU – of the University of East Anglia (Mitchelland Jones, 2005), between 1961 and 2000, and only restricted to those grid boxesthat present a correlation value statistically significant at the 10% significance level.Naturally, no precipitation information is available over the oceans as this data set
Fig. 2 Spatial pattern of correlation values between monthly European precipitation (CRU dataset) and the corresponding monthly value of NAO index for the period 1961–2000

The Impacts of the NAO on Hydrological Resources of the Western Mediterranean 47
is constructed with precipitation values observed in rain gauges. The typical win-ter NAO-precipitation pattern shown in Fig. 2 confirms that the most prominentcorrelations can be observed between the core winter months that span Decemberand March, with large negative values over Iberia (r < –0.7), northern Africa andcentral Mediterranean, while positive values dominate over northern Europe, albeitwith a smaller magnitude (r < 0.6). A slightly different pattern emerges betweenOctober and November with weak, but still statistically significant, negative correla-tion values covering most of Europe between Iberia and southern Scandinavia, whilepositive values remained confined to small-scattered patches of UK and Scandinaviaand most of northern Africa.
2.2 Impact in Western Mediterranean Water Resources
As stated in the introduction, it is expectable that the strong impact of the NAO onthe precipitation regime over the western and central sectors of the Mediterraneanshould be also observed on the stream flow of rivers located within these sectors.This section focuses on three large transboundary Iberian rivers (Douro, Tejo andGuadiana) that correspond almost to 50% of the entire Iberian surface (Fig. 3)and flow westwards, i.e. from Spain to Portugal. It should be stressed that waterresources in this south-western European region are characterised by present andfuture challenges, namely:
• As a consequence of high interannual precipitation variability most Iberianrivers show relatively high coefficients of interannual stream flow variation, thatdecrease from rivers located in the north (∼50% for Douro) to those in thesouthern sector (∼100% for Guadiana).
• There has been a steady decline of Iberian precipitation in late winter (February)and early spring (March) since the 1960s (González-Hidalgo et al., 2010). Thisdecrease is driven by latitudinal shifts of storm-tracks over the Atlantic that areultimately associated with an increasing trend of the NAO index (Paredes et al.,2006; Trigo et al., 2008). This trend in precipitation is noticeable in river flow inMarch and April and diminishes the soil water moisture available in the followingspring and summer seasons.
• Both Iberian countries present an increasing demand of water supply in recentdecades. Besides hydroelectricity production, the touristic (e.g. golf courses)and agricultural sectors correspond to the two main socio-economic activi-ties responsible for this increment. The strong socio-economic impacts of therecent extreme drought observed during the 2004/2005 hydrological year furtheremphasises the necessity to develop long-term planning tools (García-Herreraet al., 2007).
• The latest IPCC report (Solomon et al., 2007) confirms what many studiesbased on global and regional climate models have been suggesting in the lastdecade; i.e. that the Mediterranean area will register a general trend towardsless precipitation during the twenty-first century (e.g. Giorgi and Lionello, 2008;

48 R.M. Trigo
Fig. 3 Location of the three Iberian river basins considered. Small vertical lines show the locationof river flow gauges used in each basin
López-Moreno et al., 2009). The combined effects of this future precipitationdecrease and the widely accepted future increment in the surface temperatureon the Mediterranean will bear important changes in the region’s water cycle(Mariotti et al., 2008).
Following the work developed in Trigo et al. (2004) and updated in Trigo (2008)we used monthly river flow data for the three rivers depicted in Fig. 3, namely theGuadiana, the Tejo (Tagus or Tajo) and the Douro (or Duero). The datasets werekindly provided by the Portuguese Institute of Water (INAG). The location of theriver gauges, corresponds to large dams located within the Portuguese section ofthe rivers as shown in Fig. 3. Monthly river flow anomalies during and follow-ing winters with high (low) NAO index values are represented by black (grey)bars in Figs. 4a, 5a and 6a for the Douro, Tejo and Guadiana rivers, respectively.Taking into account the very dry months that characterize Iberia between July andSeptember we show results using the hydrological year, i.e. between October andSeptember of the following year. It is clear that all three cases are characterized by aclear separation of river flow between the high and low winter NAO composites

The Impacts of the NAO on Hydrological Resources of the Western Mediterranean 49
Fig. 4 (a) Monthly river flow anomalies (hm3/month) of river Douro at Pocinho during and fol-lowing winters with high NAO index (black bars) and winters with low NAO index (grey bars),(b) Interannual variability of the mean winter (JFM) river flow (solid curve), for river Douro atPocinho, and the lagged winter (DJF) NAO index. Both curves have been normalised
Fig. 5 The same as in Fig. 4 but for river Tejo at Fratel
Fig. 6 The same as in Fig. 4 but for river Guadiana at Pulo do Lobo

50 R.M. Trigo
and that such impact is not restricted to the winter months but extends consid-erably to the following seasons. Moreover, these changes increase as we movesouthwards with successive larger ranges of positive (black) and negative (grey)bars size. Thus for river Douro these differences are significant (at the 5% signif-icance level) only between January and April, while for rivers Tejo and Guadianathese differences are significant between January and September. Lagged and non-lagged correlation coefficients were computed between winter river flow (DJF) andcontemporaneous winter NAO index, using the full period of data available foreach river.
The 1-month lagged correlation values were computed considering the NAOindex for DJF and the river flow for JFM. In order to evaluate how stationary resultsare correlation coefficients were computed for three consecutive sub-periods; 1923–1947, 1948–1972 and 1973–1998 for rivers Tejo and Douro rivers while, due toshorter time series availability, results for Guadiana have to be restricted for thetwo most recent sub-periods (Table 1). The inter-annual variability of winter (JFM)river flow against the winter (DJF) NAO index is represented in Figs. 4b, 5b and6b for the Douro, Tejo and Guadiana rivers, respectively. Sub-periods are delimitedby vertical dotted lines, additionally both curves (river flow and NAO index) werenormalized (for the total period of available data for each river) and representedbetween 1920 and 2000 to facilitate comparisons between all three rivers. Thesefigures (and correlation values shown in the companying Table 1) provide someconsiderations:
(1) Generally speaking the 1 month-lagged correlation coefficient values areconsistently higher than the corresponding non-lagged ones. In fact, whenconsidering the entire period of data available for all three rivers, the corre-lation coefficient values increase when the NAO index is lagged by 1 month.Considering the last sub-period (i.e. 1973–1998) the 1-month lagged correlation
Table 1 Seasonal 1-month lagged (lag 1) and simultaneous (lag 0) correlation coefficientsbetween winter NAO index and river flow in Pulo do Lobo (Guadiana), Fratel (Tejo) and Pocinho(Douro). Statistically significant results at the 5% level are highlighted in bold
River flow Lag 1NAO (DJF), flow (JFM)
River flow Lag 0NAO (DJF), flow (DJF)
Guadiana 1948–1972 –0.60 –0.451973–1998 –0.79 –0.671948–1998 –0.69 –0.57
Tejo 1923–1947 –0.56 –0.541948–1972 –0.37 –0.251973–1998 –0.77 –0.611923–1998 –0.52 –0.45
Douro 1923–1947 –0.48 –0.271948–1972 –0.29 –0.101973–1998 –0.76 –0.581923–1998 –0.55 –0.35

The Impacts of the NAO on Hydrological Resources of the Western Mediterranean 51
coefficients achieve very significant values, namely; –0.76 for Douro, –0.77 forTejo and –0.79 for Guadiana. These results have opened promising prospects forthe use of these relationships for constructing monthly to seasonal forecastingmodels.
(2) The longer time series available for the Douro and Tejo rivers allow furtherinsight on the long term behavior of these link between NAO and river flow.Interestingly, both rivers reveal a certain decrease between the first and thesecond sub-periods that is followed by a major increment between the sec-ond and third sub-periods. The long term evolution of this relationship canbe also appreciated by the change in coherence between both time series(Figs. 4b, 5b and 6b).
The increase in the strength of the impact of NAO in the river flow since the1970s reflects most probably two different aspects that contribute to such an out-come. On the one hand the link between precipitation and the NAO patterns isnot stationary, but changes at decadal scale, having increased significantly betweenthe mid-twentieth century to the last few decades (e.g. Trigo et al., 2004; Vicente-Serrano and López-Moreno, 2008). Additionally, it has been suggested that part ofthis increment in strength is related to the increase in water storage volume asso-ciated with the construction of major dams in the 1950s and 1960s (Trigo et al.,2004), given that there are evidences that variability in the water stored by reser-voirs of the Tagus basin is more determined by NAO than river discharges, both inthe duration and magnitude of the anomalies (López-Moreno et al., 2007). In fact,results obtained in Table 1 show that the correlation increase is larger at 1-monthlag than it is for simultaneous correlations.
2.3 Precipitation and River Flow Trends Associated with the NAO
A number of studies has shown that winter (DJFM) precipitation has been decreas-ing steadily since the 1960s over western Mediterranean, particularly for the monthof March (e.g. Trigo and DaCamara, 2000; Paredes et al., 2006; González-Hidalgoet al., 2010), with latter analysis showing that such decline is becoming to beextensive to the month of February (Trigo et al., 2008). These authors show thatMarch monthly-accumulated precipitation for the central and western regions ofthe Iberian Peninsula presents a very significant decline of circa 50% during the1960–2000 period. Naturally these changes are not confined to Iberia but cor-respond to the most visible aspect of a larger phenomenon affecting the entireNorth-Atlantic/European sector. In fact, while Iberia and the majority of the westernsector of the Mediterranean experiences this decreasing trend in March, the northernregions of Scandinavia and British Isles present a remarkable increase (Trigo et al.,2008). It should be notice that the significance of these trends varies according tothe period of data considered.
As expected such trends are bound to be connected with changes of the atmo-spheric circulation over the North Atlantic and European sectors. In this regard a

52 R.M. Trigo
number of different approaches were used to quantify the links with large-scale andsmaller scale features (Paredes et al., 2006; Trigo et al., 2008). Based on the IberianWeather Types (WTs) classification developed by Trigo and DaCamara (2000) itwas shown that, at the synoptic scale, the major contributors towards the Marchdecline are associated with a corresponding decrease in the frequency of a few spe-cific WTs. These “wet” WTs are characterized by higher than average values ofdaily precipitation and include the cyclonic (C), the western (W) and south-western(SW). On the contrary, March is also characterized by a notorious increment inthe frequency of “dry” anticyclonic (A) type. In contrast the corresponding “wet”WTs for the British Isles display increasing frequencies justifying the incrementof Precipitation observed in England and Scotland (Paredes et al., 2006). Withina larger context, a Lagrangean approach, based on the analysis of storm-tracksover the entire North Atlantic region, reveals dramatic changes in the location ofcyclones since the early 1960s that coincides with the corresponding precipitationtrends in Europe (Trigo et al., 2008). It is of no surprise that the NAO is some-how related with both phenomena, i.e. changes in the preferred path of most lowpressure perturbations and contemporaneous changes of monthly precipitation totalsfor March. In fact, for Iberia, the region displaying the maximum correlation val-ues between NAO and March precipitation is almost exactly coincident with theregion presenting the largest decreases in precipitation. Using data for the 1960–2000 period the spatially averaged series of precipitation shows a correlation valueof –0.60, that decreases to –0.48 when computed with the detrended series (Paredeset al., 2006).
It should be emphasised that the region with significant NAO induced decline ofprecipitation in March encloses the three major international Iberian river basinsreferred in the previous section, i.e. rivers Douro (North), Tejo (Center) andGuadiana (South). Thus, it is highly expectable that such a significant change inprecipitation must have an imprint on the long-term evolution of monthly river flowfor these rivers. That is precisely what can be seen for rivers Douro and Guadiana(Fig. 7), with both cases exhibiting very strong declines (significant at 1%) of riverflow in March, computed between 1956 and 2000, similar results were obtainedfor river Tejo (not shown). Moreover, this decline is not restricted to the month of
Fig. 7 Inter-annual variability of March river flow for Douro and Guadiana rivers. The corre-sponding linear regression trend is also represented

The Impacts of the NAO on Hydrological Resources of the Western Mediterranean 53
March but can be observed also in the following months of April and May (albeitless pronounced) due to the relatively high values of persistence that characterizeriver flow time series.
Finally it must be stressed that these changes can have significant socio-economicimpacts for both Portugal and Spain economies. Large amounts of water from thesethree rivers are used for various economic activities as well as for water supply tourban areas. As an example, these three rivers together account for a very significantamount of hydroelectric production in both Iberian countries, with roughly 55%(70%) of Spanish (Portuguese) annual average (Trigo et al., 2004).
3 Conclusions
Western Mediterranean precipitation regime is strongly influenced by the NAO pat-tern with roughly 40% of the winter precipitation being related to the NAO index.Because this large-scale atmospheric circulation phenomenon is characterized bya marked interannual variability, it implies that the Iberian Peninsula is particu-larly prone to large inter-annual variability of precipitation. Therefore NAO is a keycomponent of the relatively high frequency of wet and drought periods observed inIberia (Vicente-Serrano, 2006; Sousa et al., 2011). Two recent extreme years exem-plify perfectly this dichotomy, the extreme dry hydrological year of 2004/2005 andthe wet winter of 2009/2010. The year of 2004–2005 was considered the driest formany stations in Iberia (including Lisbon and Madrid) since the beginning of thetwentieth century (García-Herrera et al., 2007). This extreme event was induced byseveral favoring atmospheric circulation anomalies including positive values of theNAO index between November 2004 and February 2005. On the contrary the win-ter of 2009/2010 was characterized by record breaking negative values of the NAOindex at the monthly and seasonal scales (Cattiaux et al., 2010; Wang et al., 2010).This anomalous circulation triggered particularly cold temperatures over central andnorthern Europe (Cattiaux et al., 2010) and simultaneously, large parts of the IberianPeninsula (including Gibraltar and Lisbon) have registered the highest amounts ofwinter precipitation since the beginning of regular measurements in the second halfof the nineteenth century (Vicente-Serrano et al., 2011).
As shown here the influence of NAO on the winter Iberian precipitation is exten-sive to the river flow of major Iberian rivers. Moreover it is possible to state that themagnitude of the NAO impact is considerably larger for Iberian rivers than what hasbeen obtained by other authors for rivers Tigris and Euphrates (Cullen and deMeno-cal, 2000) and the Danube (Rîmbu et al., 2002). In fact, according to the resultsobtained by Struglia et al. (2004) for many river basins in the Mediterranean thereare very few European rivers presenting a seasonal correlation coefficient value with– either with NAO or other large-scale circulation mode – similar to the valuesobtained here (~0.75). Recent results obtained by Spanish colleagues have extendedthe results presented here to many more gauges of Douro and Tejo, including sev-eral subsidiaries (López-Moreno et al., 2007; Morán-Tejeda et al., 2011). Theseauthors showed that the impact of positive and negative phases of the NAO on river

54 R.M. Trigo
discharge and levels of storage in reservoirs is neither instantaneous nor restrictedto the winter months, extending well into the rest of the year. Thus, the decreasein the amount of water stored in the reservoirs during positive phases of the NAOis especially severe during the following summer and autumn, whereas in winterand spring the amount of stored water is similar to that of normal years. In thisregard it is now clear that the NAO during winter months holds a significant capac-ity to constrain the observed river flow and water capacity for most of the year inmost Iberian rivers, thus representing an important factor to be accounted for allwater resources managers in general, and by agricultural and hydroelectric powerproduction companies in particular.
Acknowledgements This work was supported by the Portuguese Science Foundation (FCT)through project ENAC (Evolution of North Atlantic Climate; the role of Blocking and Storm-tracks in the Past, Present and Future climate of Southern Europe) PTDC/AAC-CLI/103567/2008.Many thanks to Pedro Sousa for helping with the editing of this chapter.
References
Barnston AG, Livezey RE (1987) Classification, seasonality and persistence of low-frequencyatmospheric circulation patterns. Mon Wea Rev 115:1083–1127
Castro-Díez Y, Pozo-Vázquez D, Rodrigo FS, Esteban-Parra MJ (2002) NAO and winter tempera-ture variability in southern Europe. Geophys Res Lett 29. doi:10.1029/2001GL014042
Cattiaux J, Vautard R, Cassou C, Yiou P, Masson-Delmotte V, Codron F (2010) Winter 2010 inEurope: a cold extreme in a warming climate. Geophys Res Lett 37:L20704. doi:10.1029/2010GL044613
Cullen HM, Kaplan A, Arkin PA, DeMenocal PB (2002) Impact of the North Atlantic Oscillationon the Middle Eastern climate and streamflow. Clim Change 55:315–338
Cullen HM, deMenocal PB (2000) North Atlantic influence on Tigris-Euphrates streamflow. Int JClimatol 20:853–863
Esteban-Parra MJ, Rodrigo FS, Castro-Díez Y (1998) Spatial and temporal patterns of precipitationin Spain for the period 1880–1992. Int J Climatol 18:1557–1574
García-Herrera R, Paredes D, Trigo RM, Trigo IF, Hernández E, Barriopedro D, Mendes MA(2007) The outstanding 2004/05 drought in the Iberian Peninsula: associated atmosphericcirculation. J Hydrometeorol 8:483–498
Gimeno L, Drumond A, Nieto R, Trigo RM, Sthol A (2010) On the origin of continentalprecipitation. Geophys Res Lett 37:L13804. doi:10.1029/2010GL04371
Giorgi F, Lionello P (2008) Climate change projections for the Mediterranean region. Glob PlanetChange 63:90–104
Gonzalez-Hidalgo JC, Brunetti M, de Luis M (2010) Precipitation trends in Spanish hydrologicaldivisions, 1946–2005. Clim Res 43:215–228
Hurrell JW (1995) Decadal trends in the north Atlantic oscillation: regional temperatures andprecipitation. Science 269:676–679
Hurrell JW, Kushnir Y, Ottersen G, Visbeck M (2003) The North Atlantic Oscillation: climatesignificance and environmental impact. Geophysical Monograph Series, vol 134. AmericanGeophysical Union, Washington, DC
Hurrell JW, van Loon H (1997) Decadal variations in climate associated with the north AtlanticOscillation. Clim Change 36:301–326
Jones PD, Jónsson T, Wheeler D (1997) Extension to the North Atlantic Oscillation using earlyinstrumental pressure observations from Gibraltar and South-West Iceland. Int J Climatol17:1433–1450

The Impacts of the NAO on Hydrological Resources of the Western Mediterranean 55
Kalnay E, Kanamitsu M, Kistler R, Colins W, Deaven D, Gandin L, Iredell M, Saha S, White G,Wollen J, Zhu Y, Leetmaa A, Reynolds R, Chelliah M, Ebisuzaki W, Higgins W, Janowiak J, MoKC, Ropelewski C, Wang J, Jenne R, Joseph D (1996) The NCEP/NCAR 40-years reanalysesproject. Bull Am Meteorol Soc 77:437–471
López-Moreno JI, Beguería S, Vicente-Serrano SM, García-Ruiz JM (2007) The influence of theNAO on water resources in Central Iberia: precipitation, streamflow anomalies and reservoirmanagement strategies. Water Resour Res 43:W09411. doi: 10.1029/2007WR005864
López-Moreno JI, Vicente-Serrano SM, Gimeno L, Nieto R (2009) The stability of precipitationregimes in the Mediterranean region: observations since 1950 and projections for the twenty-first century. Geophys Res Lett 36:L10703
Mariotti A, Zeng N, Yoon JH, Artale V, Navarra A, Alpert P, Li L (2008) Mediterranean water cyclechanges: transition to drier 21st century conditions in observations and CMIP3 simulations.Environ Res Lett 3(4):044001. doi:10.1088/1748-9326/3/4/044001
Mitchell TD, Jones P (2005) An improved method of constructing a database of monthly climateobservations and associated high-resolution grids. Int J Climatol 25:693–712
Morán-Tejeda E, López-Moreno JI, Ceballos-Barbancho A, Vicente-Serrano SM (2011)Evaluating Duero’s basin (Spain) response to the NAO phases: spatial and seasonal variability.Hydrol Process 25:1313–1326
Osborn TJ, Briffa KR, Tett SFB, Jones PD, Trigo RM (1999) Evaluation of the North AtlanticOscillation as simulated by a climate model. Clim Dyn 15:685–702
Paredes D, Trigo RM, Garcia-Herrera R, Trigo IF (2006) Understanding precipitation changesin Iberia in early Spring: weather typing and storm-tracking approaches. J Hydrometeorol7:101–113
Rîmbu N, Boroneant C, Carmen B, Mihai D (2002) Decadal variability of the Danube riverflow in the lower basin and its relation with the North Atlantic Oscillation. Int J Climatol22:1169–1179
Serrano A, García JA, Mateos VL, Cancillo ML, Garrido J (1999) Monthly modes of variation ofprecipitation over the Iberian Peninsula. J Clim 12:2894–2919
Solomon S, Qin D, Manning M, Alley RB, Berntsen T, Bindoff NL, Chen Z, Chidthaisong A,Gregory JM, Hegerl GC, Heimann M, Hewitson B, Hoskins BJ, Joos F, Jouzel J, Kattsov V,Lohmann U, Matsuno T, Molina M, Nicholls N, Overpeck J, Raga G, Ramaswamy V, Ren J,Rusticucci M, Somerville R, Stocker TF, Whetton P, Wood RA, Wratt D (2007) Technicalsummary. In: Solomon S, Qin D, Manning M, Chen Z, Marquis M, Averyt KB, Tignor M,Miller HL (eds) Climate change 2007: the physical science basis. Contribution of WorkingGroup I to the 4th assessment report of the Intergovernmental Panel on Climate Change.Cambridge University Press, Cambridge, UK and New York, NY, USA
Sousa P, Trigo RM, Aizpurua P, Nieto R, Gimeno L, Garcia-Herrera R (2011) Trends and extremesof drought indices throughout the 20th century in the Mediterranean. Nat Hazards Earth SystSci 11:33–51. doi:10.5194/nhess-11-33-2011
Struglia MV, Mariotti A, Filograsso A (2004) River discharge into the Mediterranean Sea:climatology and aspects of the observed variability. J Clim 17:4740–4751
Trigo IF, Davies TD, Bigg GR (1999) Objective climatology of cyclones in the Mediterraneanregion. J Clim 12:1685–1696
Trigo IF, Davies TD, Bigg GR (2000) Decline in Mediterranean rainfall caused by weakening ofMediterranean cyclones. Geophys Res Lett 27:2913–2916
Trigo RM et al (2006) Relations between variability in the Mediterranean region and Mid-latitudevariability. In: Lionello P, Malanotte-Rizzoli P, Boscolo R (eds) The Mediterranean climate: anoverview of the main characteristics and issues. Elsevier, Amsterdam, pp 179–226
Trigo RM (2008) Quantifying the impact of the North Atlantic Oscillation on western Iberia. In:Soares A, Pereira MJ, Dimitrakopoulos R (eds) geoENV VI – geostatistics for environmentalapplications. Springer, Berlin, pp 235–246
Trigo RM, DaCamara C (2000) Circulation weather types and their impact on the precipitationregime in Portugal. Int J Climatol 20:1559–1581

56 R.M. Trigo
Trigo RM, Osborn TJ, Corte-Real JM (2002) The North Atlantic Oscillation influence on Europe:climate impacts and associated physical mechanisms. Clim Res 20:9–17
Trigo RM, Palutikof JP (2001) Precipitation scenarios over Iberia: a comparison between DirectGCM output and different downscaling techniques. J Clim 14:4422–4446
Trigo RM, Pozo-Vazquez D, Osborn TJ, Castro-Diez Y, Gámis-Fortis S, Esteban-Parra MJ (2004)North Atlantic Oscillation influence on precipitation, river flow and water resources in theIberian Peninsula. Int J Climatol 24:925–944
Trigo RM, Valente MA, Trigo IF, Miranda PM, Ramos AM, Paredes D, García-Herrera R(2008) North Atlantic wind and cyclone trends and their impact in the Europeanprecipitation and Atlantic significant wave height. Ann NY Acad Sci 1146:212–234.doi:10.1196/annals.1446.014
Türkes M, Erlat E (2003) Precipitation changes and variability in Turkey linked to the NorthAtlantic Oscillation during the period 1930–2000. Int J Climatol 23:1771–1796
Vicente-Serrano SM (2006) Spatial and temporal analysis of droughts in the Iberian Peninsula(1910–2000). Hydrol Sci J 51:83–97
Vicente-Serrano SM, López-Moreno JI (2008) The nonstationary influence of the NorthAtlantic Oscillation on European precipitation. J Geophys Res Atmos 113:D20120.doi:10.1029/2008JD010382
Vicente-Serrano SM, Trigo RM, Liberato MLR, López-Moreno JI, Lorenzo-Lacruz J, Beguería S,Morán-Tejeda H, El Kenawy A (2011) Extreme winter precipitation in the IberianPeninsula, 2010: anomalies, driving mechanisms and future projections. Clim Res 46:51–65.doi:10.3354/cr00977
von Storch H, Zorita E, Cubasch U (1993) Downscaling of global climate change estimates toregional scales: an application to Iberian rainfall in wintertime. J Clim 6:1161–1171
Walker GT (1924) Correlations in seasonal variations of weather, IX. Mem Indian Meteorol Dept24:275–332
Wallace JM, Gutzler DS (1981) Teleconnections in the geopotential height field during theNorthern Hemisphere winter. Mon Wea Rev 109:784–812
Wang C, Liu H, Lee S (2010) The record-breaking cold temperatures during the winter of2009/2010 in the Northern Hemisphere. Atmos Sci Lett 11:161–168
Xoplaki E, González-Rouco JF, Luterbacher J, Wanner H (2004) Wet season Mediterraneanprecipitation variability: influence of large-scale dynamics. Clim Dyn 23:63–78

The Impacts of NAO on the Hydrologyof the Eastern Mediterranean
Ercan Kahya
Abstract The impacts of the NAO on the hydrology of eastern Mediterraneancountries, such as Turkey, Iran, Kuwait, Oman, and Israel, are documented herefrom a general perspective. Results for the eastern Mediterranean countries differfrom one location to another in terms of consistent NAO signal. Patterns of pre-cipitation, streamflow, and lake levels in Turkey are discussed to show the NAOimpacts. A special attention is devoted to the NAO influences on the formation ofstreamflow homogeneous region and on the probability distribution functions ofcritical droughts. The results of all these analyses clearly showed that the NAO sig-nals are quite identifiable in various hydrologic variables in Turkey. For example,the NAO during winter was found to influence precipitation and streamflow pat-terns. In contrast temperature patterns appeared to be less sensitive to the NAO. Theresults of wavelet analysis showed that the Tuz, Sapanca, and Uluabat lakes reflectstrong NAO influences. In southwest Iran, the October–December season is influ-enced mostly by the NAO in both dry and wet spells. Positive significant correlationvalues were found between the NAO and the total rainfall in the centre and southernIsrael and with some of the rainfall categories. High correlations between the wintermode of the NAO and temperature and sea level pressure in Israel were also noted.In conclusion, current evidences have shown that the NAO has detectable influenceson the hydrology of eastern Mediterranean countries with different magnitudes.
Keywords NAO · Eastern Mediterranean · Middle East · Hydrology · Climate
1 Introduction
The intensification hypothesis of the hydrologic cycle at the global scale wasreported by climate modellers; however, knowledge of these changes will providelittle guidance for developing long-term strategies in water resources managementfrom a water resources perspective. Most water resources issues are regional innature, and decisions are often made at river basin to catchment scales. Therefore,
E. Kahya (B)Istanbul Technical University, Istanbul, Turkeye-mail: [email protected]
57S.M. Vicente-Serrano, R.M. Trigo (eds.), Hydrological, Socioeconomicand Ecological Impacts of the North Atlantic Oscillation in the Mediterranean Region,Advances in Global Change Research 46, DOI 10.1007/978-94-007-1372-7_5,C© Springer Science+Business Media B.V. 2011

58 E. Kahya
it is import to note that future climate impacts are appropriately observed andstudied at regional scales to make relevant and accurate information available fordecision-making purposes (Sorooshian et al., 2003).
Studies in recent decades have shown that the North Atlantic Oscillation (NAO),a dominant mode of Atlantic sector climate variability, has the far-field influence oninterannual to decadal variations of main climate and hydrological variables (i.e.,temperature, precipitation and streamflow) in the eastern Mediterranean region. TheMiddle East (ME) region is commonly neglected in North Atlantic studies becauseof its proximity to the monsoonal region and the relatively scarceness of hydrolog-ical data. However the form of the NAO signature, with enhanced precipitation inthe western Europe during its high index phases, and in the eastern Mediterraneanduring its low index phases, has been noted. A relationship between the easternMediterranean and Atlantic sector is expected since the NAO controls Atlantic heatand moisture fluxes into the Mediterranean region. In this context, it was shown thatthe first principal component of December through March streamflow variabilityreflects changes in the NAO using a sea surface temperature (SST) based index ofthe NAO and available streamflow data from some Middle Eastern rivers (Cullenet al., 2002).
A summary of climate characteristics of the ME where a complicated relationbetween land and climate exists is worthwhile to mention here. The ME region isknown to experience a Mediterranean climate type (Csa in the Köeppen classifica-tion) with wet winters and dry summers in most parts; however, spatial gradientsin climate are sharper than in the broad prototype Csa region to the west (Evanset al., 2004). That is, northward transition from desert through steppe to cool high-land climate all take places within 400 km along the 40◦N meridian. Presence ofmany coastlines and mountain ranges function in the modification of local climatesin the ME elsewhere. Specifically speaking, upslope seasonal precipitation occursin mountain ranges of southern the Black and Caspian Seas, and eastern coast ofthe Mediterranean Sea. Similarly orographic precipitation in the Taurus and ZagrosMountains feeds the Euphrates and Tigris Rivers, a source integrated watershedsystem for the Mesopotamia region. As prevailing sources of water vapour, the RedSea and Persian Gulf activate little precipitation locally owing to descending airmass in the Hadley cell. Interior steppe and deserts extending Syria, Iraq, Jordanand Saudi Arabia, cause drier climate conditions by means of surrounding mountainranges. Dry summers render only winter rainfall (which is highly changeable) pos-sible for source of renewable water in the eastern Mediterranean region. Developingeconomies in the region heavily depend upon water, so they are extremely vul-nerable to droughts. Krichak et al. (2002) proclaimed that the NAO and the EastAtlantic-West Russian oscillation (EA-WR) have a combined effect, so that whenthey are both in their positive phase, a rainy season occurs in the southeastern region,and vice versa.
For regional atmospheric patterns governing rainfall in Israel, Ziv et al. (2006)explained that the synoptic-scale system affecting the eastern Mediterranean thatis responsible for most of the annual rainfall is an extratropical cyclone, known asthe Cyprus Low. Rainfall is formed within cold air masses originated from Europe,entering the region from the northwest. Air masses gain moisture from warm water

The Impacts of NAO on the Hydrology of the Eastern Mediterranean 59
and become conditionally unstable. The strong thermal affects significantly cyclonedynamics over this region, in turn, resulting in intensive rainfall over Israel.
A relationship between the eastern Mediterranean and Atlantic sector is tobe expected since the NAO controls Atlantic heat and moisture fluxes into theMediterranean region (Türkes, 1996). Since these winter cyclones are the domi-nant source of Middle Eastern rainfall and streamflow, changes in Atlantic westerlyheat/moisture transport and Atlantic/Mediterranean SSTs in relation to the NAOare expected to influence the ME climate (Cullen et al., 2002). Thus both fun-damental climatic processes and their critical socio-economical consequences aremanifested in the eastern Mediterranean region, and offer the motivation for thischapter. Presentation of typical pictures of the NAO impacts on the country andregional scales in the eastern Mediterranean region is the purpose of this chapter.
2 Results
In the last 2 decades, climate modelling studies have been undertaken to simu-late the climate of the Middle East/eastern Mediterranean region. For example,Evans et al. (2004) had the same aim and showed that processes controlling theseasonality of precipitation differ in different subregions and are often differentfrom the processes controlling interannual variability in the Middle East. Morerecently, in a regional climate modelling study of the winter climate of Central–Southwest Asia (CSWA), focusing on the mean model climatology of temperatureand precipitation, Syed et al. (2010) analysed the simulated storm characteristicsand the effects of ENSO and NAO on storm activity and precipitation. Their detailedstorm analysis demonstrated that they are mostly associated with an intensificationof western disturbances originating in the eastern Mediterranean and Middle Eastregions and moving eastward across a mid-troposphere (500 hPa) trough situatedover the CSWA during the positive NAO and warm ENSO phases. The NAO andENSO signals are reinforced by enhanced moisture sources from the Mediterranean,Caspian and Arabian Seas.
To overview the NAO signals on two essential hydrologic variables (precipita-tion and streamflow) in the eastern Mediterranean region, it would be reasonable toaddress the issue at both regional and country scale under the lights of some majorstudies. For the first scale, we prefer to rely on our review on two diagnostic studiesby Cullen and her colleagues in this section. For the second scale, the order of nam-ing country in the region is selected according to clockwise direction starting fromthe north.
2.1 Regional Scale Review: NAO Impacts on the Hydrologyof Middle East Region
2.1.1 Precipitation Variability Associated with the NAO
Cullen et al. (2002) described the influence of the NAO on interannual todecadal precipitation variability in the Middle East by computing composite

60 E. Kahya
precipitation anomalies using the 21-year CMAP monthly data set over the region(90◦W–60◦E; 20◦N–70◦N) extending from the east coast of the U.S. to the MiddleEast for months with positive and negative values of the NAO index for the completeperiod 1979–1998. Their composite analysis clearly showed evident appearanceof the expected signature of the NAO in the form of enhanced precipitation innorth Europe during high index periods and in the Mediterranean region duringlow index periods (Fig. 1). Another important clue visualised in this figure issaid to be an axis of enhanced monthly wintertime precipitation that is clearlyobservable during low index periods extending from southeastern U.S. across theAtlantic to the Iberian Peninsula having negative anomalies more or less paral-lel to the north and south. In contrast a reversed pattern with departures fromstrict linearity is virtually evident during high index periods. More specificallythis pattern comprises of the enhanced precipitation axis during low index monthsextending across the northern Mediterranean nearly to the Caspian Sea with anenhanced secondary maximum along the west coast of Spain and Portugal andover Turkey.
Fig. 1 (a) Composite of the most negative quartile of NAO index years (negative NAO phase)and (b) the most positive quartile of NAO index years (positive NAO phase) (adopted from Cullenet al., 2002)

The Impacts of NAO on the Hydrology of the Eastern Mediterranean 61
2.1.2 Streamflow Variability Associated with the NAO
Cullen et al. (2002) examined streamflow data in relation to the NAO from fiveMiddle Eastern rivers, namely Ceyhan (Turkey), Euphrates (Turkey), Karun (Iran),Tigris (Iraq), and Yarmouk (Jordan). They demonstrated that the first principal com-ponent of December through March streamflow variability reflects changes in theNAO. The hydrology of these rivers revealed two primary flooding periods: the firstdue to rainfall-driven runoff from December through March, regulated on inter-annual to decadal timescales by the NAO, and the second period due to springsnowmelt from April through June, contributing in excess of 50% of annual runoff.They also noted that the latter witness no significant NAO teleconnection and a lessdirect relationship with local climatic factors.
2.2 NAO Impacts on the Hydrology of Turkey
Climate response in Turkey to variability of the NAO, in particular, has been a majorconcern in last decade. The results of Türkes and Erlat (2003) indicated that neg-ative correlation coefficients between Turkish precipitation and the NAO indiceswere stronger in winter and autumn, and weaker in spring and almost non-existentin summer. They stated that annual and seasonal composite precipitation meanswere mostly characterized by wetter than longterm average during the weak NAOphase, whereas the strong NAO responses mostly exhibited drier than long-termaverage annually and in all seasons except summer. Spatially coherent and statisti-cally significant changes in precipitation amounts during the extreme NAO phaseswere more evident in western and middle Turkey.
Henceforth this section will emphasize on the findings of the author and his col-leagues’ earlier and current works in regard to the NAO impacts on hydrologicalsurface variables in Turkey. As a first start of presenting our results based upon basicstatistical analyses, we examined Turkish climatic variables (precipitation, stream-flow and maximum and minimum temperatures) in association with the NAO usingcorrelation analysis with various lag combinations (Karabörk et al., 2005). In thisstudy, we used monthly precipitation totals (compiled from 94 climate stations witha period 1951–1993), monthly streamflow (compiled from 76 streamflow gaugingstations with a period 1964–1994) and monthly maximum and minimum temper-ature (compiled from 54 climate stations with a period 1951–1994) observations.In general, simultaneous and lag cross-correlation analyses showed that precipita-tion, streamflow, maximum temperature and minimum temperature patterns overTurkey have significant negative correlations with the NAO index. The results ofsome lag correlations also indicated a considerable prediction potential for precip-itation and streamflow variables. A portion of this potential for streamflow couldbe readily explained by the carry-on effects of catchments, nevertheless there is aneed for further investigation to elucidate the NAO and precipitation relationshipthat has been identified to be valid for the time lag of several months in some cases.Correlation analysis revealed less sensitive characteristics of Turkish temperature

62 E. Kahya
patterns against the NAO. The consequences of the present study verify far reach-ing influences of the NAO in eastern Mediterranean basin and the Middle Eastregion. Moreover, we stated that the SOI series was negatively correlated with bothTurkish precipitation and streamflow patterns; however, these correlations were notas significant when compared with those between the NAO and precipitation andstreamflow separately.
Of particular interest in Hurrell (1996) is said to be the contribution of the NAOvariability to the recent trend in global hemispheric mean wintertime temperature.It was shown that both the NAO and SO extremes are linearly related to the climatetrend, with the NAO dominating a larger land area than the SO. When he used onlythe NAO and the SO indices in his regression models, more confidence was observedin the estimated coefficients and 44% of the variance of the extra-tropical NorthernHemisphere temperatures was explained.
This diagnosis also appeared, to some extent, in the results of our next inves-tigation (Kalayci and Kahya, 2006), involving the systematic modes of spatial andtemporal variation in monthly streamflow records in Turkey using the principal com-ponents (PCs) analysis. The PC1 reproduces 38.2% of the total variance of the entirestreamflow data set. In other words, 142 of 372 observed anomaly map patternsduring the study period 1964–1994 have a similar map pattern to that of PC1 load-ings (Fig. 2), illustrating only positive sign across the study domain. It representsa basic streamflow anomaly pattern having above-normal streamflow anomalieseverywhere when the PC1 scores are positive or below-normal streamflow anoma-lies everywhere when the scores are negative values. The homogeneous appearanceof PC1 is a common feature of the PC analysis. The contoured values in Fig. 2 arethe PC1 loadings, corresponding to the values of correlation coefficients betweenstreamflow and the PC values. It is important to note that strongest loadings indicategreatest departures from the mean streamflow (Lins, 1985). We then targeted sea-sonal correlations between the PC scores and the indices of large-scale atmosphericcirculation (i.e., the NAO and SO) to elucidate the physical meaning of the com-ponents. For this purpose, we carried out various correlation analyses between thescores of each PC and the series of the NAO index at the annual and seasonal bases.The relation between PC1 scores and NAO index was witnessed as –0.491 (signif-icant at 99% level) for annual average; –0.424 (significant at 95% level) for DJFseasonal average; –0.387 (significant at 95% level) for MAM seasonal average; and–0.506 (significant at 99% level) for JFM seasonal average. There were no similarsignificant correlations for other PCs. For the JFM season, Karabörk et al. (2005)also found a highly significant relation in conjunction with the NAO in the westernTurkey. These indications clearly imply the sensitivity of the Turkish streamflowclimatology to the NAO variations.
More recently we considered the NAO impacts on the hydrology of Turkey usingdifferent variables through new but uncommon perspectives and arrived to follow-ing interesting results. Let’s consider first drought variables, representing complexevents which may impair social, economic, agricultural, and other activities in asociety. We were concerned in Sarlak et al. (2009) with a hydroclimatological study,which shed light on the NAO impacts on regional drought characteristics in Turkey,
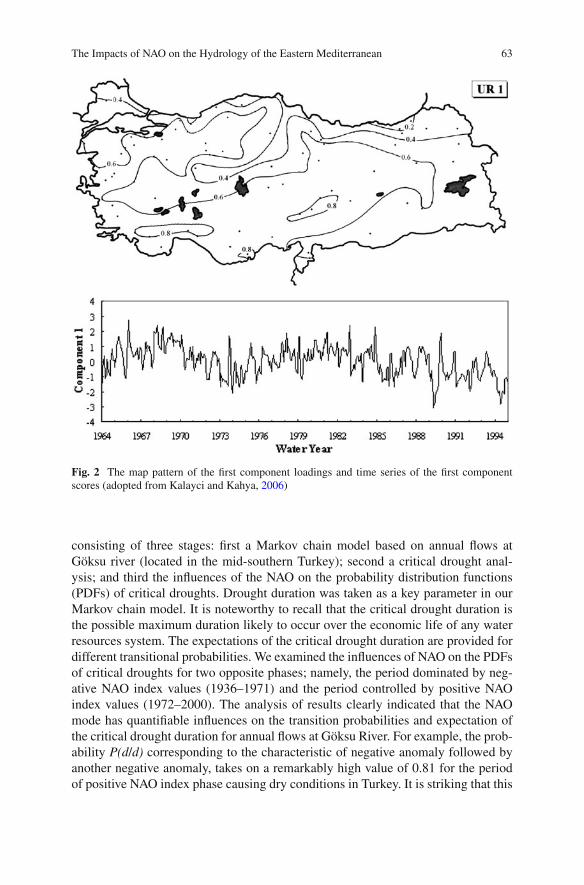
The Impacts of NAO on the Hydrology of the Eastern Mediterranean 63
Fig. 2 The map pattern of the first component loadings and time series of the first componentscores (adopted from Kalayci and Kahya, 2006)
consisting of three stages: first a Markov chain model based on annual flows atGöksu river (located in the mid-southern Turkey); second a critical drought anal-ysis; and third the influences of the NAO on the probability distribution functions(PDFs) of critical droughts. Drought duration was taken as a key parameter in ourMarkov chain model. It is noteworthy to recall that the critical drought duration isthe possible maximum duration likely to occur over the economic life of any waterresources system. The expectations of the critical drought duration are provided fordifferent transitional probabilities. We examined the influences of NAO on the PDFsof critical droughts for two opposite phases; namely, the period dominated by neg-ative NAO index values (1936–1971) and the period controlled by positive NAOindex values (1972–2000). The analysis of results clearly indicated that the NAOmode has quantifiable influences on the transition probabilities and expectation ofthe critical drought duration for annual flows at Göksu River. For example, the prob-ability P(d/d) corresponding to the characteristic of negative anomaly followed byanother negative anomaly, takes on a remarkably high value of 0.81 for the periodof positive NAO index phase causing dry conditions in Turkey. It is striking that this
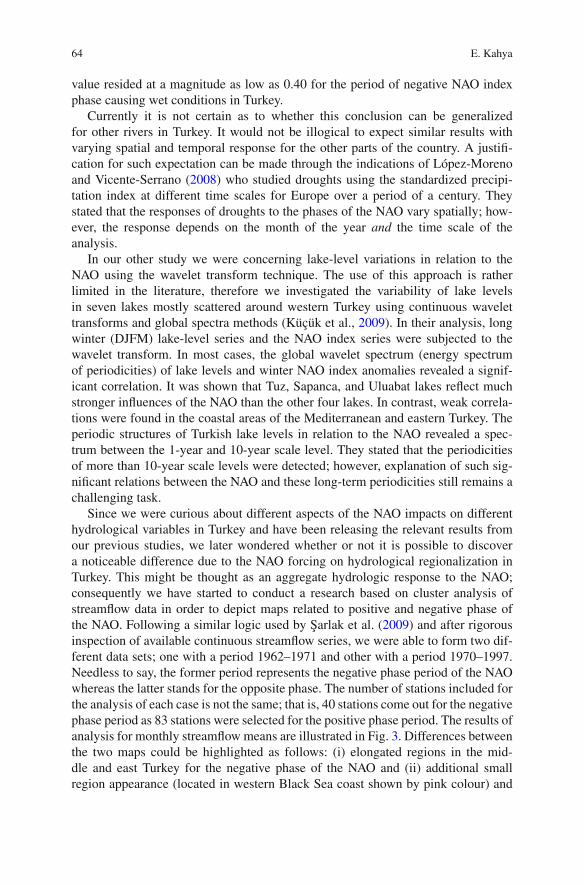
64 E. Kahya
value resided at a magnitude as low as 0.40 for the period of negative NAO indexphase causing wet conditions in Turkey.
Currently it is not certain as to whether this conclusion can be generalizedfor other rivers in Turkey. It would not be illogical to expect similar results withvarying spatial and temporal response for the other parts of the country. A justifi-cation for such expectation can be made through the indications of López-Morenoand Vicente-Serrano (2008) who studied droughts using the standardized precipi-tation index at different time scales for Europe over a period of a century. Theystated that the responses of droughts to the phases of the NAO vary spatially; how-ever, the response depends on the month of the year and the time scale of theanalysis.
In our other study we were concerning lake-level variations in relation to theNAO using the wavelet transform technique. The use of this approach is ratherlimited in the literature, therefore we investigated the variability of lake levelsin seven lakes mostly scattered around western Turkey using continuous wavelettransforms and global spectra methods (Küçük et al., 2009). In their analysis, longwinter (DJFM) lake-level series and the NAO index series were subjected to thewavelet transform. In most cases, the global wavelet spectrum (energy spectrumof periodicities) of lake levels and winter NAO index anomalies revealed a signif-icant correlation. It was shown that Tuz, Sapanca, and Uluabat lakes reflect muchstronger influences of the NAO than the other four lakes. In contrast, weak correla-tions were found in the coastal areas of the Mediterranean and eastern Turkey. Theperiodic structures of Turkish lake levels in relation to the NAO revealed a spec-trum between the 1-year and 10-year scale level. They stated that the periodicitiesof more than 10-year scale levels were detected; however, explanation of such sig-nificant relations between the NAO and these long-term periodicities still remains achallenging task.
Since we were curious about different aspects of the NAO impacts on differenthydrological variables in Turkey and have been releasing the relevant results fromour previous studies, we later wondered whether or not it is possible to discovera noticeable difference due to the NAO forcing on hydrological regionalization inTurkey. This might be thought as an aggregate hydrologic response to the NAO;consequently we have started to conduct a research based on cluster analysis ofstreamflow data in order to depict maps related to positive and negative phase ofthe NAO. Following a similar logic used by Sarlak et al. (2009) and after rigorousinspection of available continuous streamflow series, we were able to form two dif-ferent data sets; one with a period 1962–1971 and other with a period 1970–1997.Needless to say, the former period represents the negative phase period of the NAOwhereas the latter stands for the opposite phase. The number of stations included forthe analysis of each case is not the same; that is, 40 stations come out for the negativephase period as 83 stations were selected for the positive phase period. The results ofanalysis for monthly streamflow means are illustrated in Fig. 3. Differences betweenthe two maps could be highlighted as follows: (i) elongated regions in the mid-dle and east Turkey for the negative phase of the NAO and (ii) additional smallregion appearance (located in western Black Sea coast shown by pink colour) and

The Impacts of NAO on the Hydrology of the Eastern Mediterranean 65
Fig. 3 The map patterns of hydrological regionalization based on the positive phase of NAO (toppanel) and the negative phase of NAO (lower panel)
patchy form of Marmara region for the positive phase of the NAO. As a result thiscomparison shows a potential of the NAO in controlling mechanisms for hydrologicregionalization in Turkey.
2.3 NAO Impacts on the Hydrology of Iran
The influence of the NAO on historically observed rainfed crop yields of both bar-ley and wheat in the northeast of Iran was investigated by Bannayan et al. (2010a)for the period 1983–2005. In central part (Mashhad), the NAO provided a firm basisfor a measurable teleconnection between crop yields and climate factors. They notedsignificant correlation between the NAO and wheat only during October, but no suchsignificant relationship for barley was detected for any month in Mashhad. Duringthe period of positive NAO index, yields increased whereas the reverse happened

66 E. Kahya
during the opposite phase. In other words, it is likely to expect a higher wheat yieldin Mashhad when the NAO index is negative. Moreover Bannayan et al. (2010b)studied that the relationship between aridity index (AI) and detrended crop yield ofselected crops (wheat and barley) and the influence of three climate indices (AO,NAO and NINO-3.4) were assessed for Khorasan province in northeast of Iran.They observed a significant correlation between the NAO and NINO-3.4 with AI.Precipitation is one of the components of AI, in turn; the AI response to the NAOand NINO-3.4 can be related to the observed association between this index andprecipitation. It seems that these climate indices could be used to construct usefultools to monitor drought patterns and subsequent yield variability in some regionsof Khorasan province. Owing to the importance of reference evapotranspiration(ETo) in determining crop water demand, some studies were conducted to assessthe impacts of different climate factors that are known to account for importantfraction of climate variability in many areas of the world. For example, Sabziparvaret al. (2010) stated the following two important points: (i) the teleconnection impactof El Nino/Southern Oscillation (ENSO) phenomenon on ETo in warm arid regions(southern parts of Iran), in general, was more significant than that in warm humidregions, and (ii) the modulation of the ENSO impacts by the NAO variability mightalso cause complex interactions on ETo process in some sites in the north coastsof Iran.
Besides analyzing recent trends in streamflow, precipitation and temperature inmountainous, semiarid Karkheh River basin (which is located in the western part ofIran), Masih et al. (2010) studied also the relationship between the NAO index withthe local climate variable (e.g., precipitation and temperature). Some earlier stud-ies for the Middle East have demonstrated the NAO influences on temperature andprecipitation regime during winter and early spring (e.g. Cullen et al., 2002; Mann,2002; Evans et al., 2004). Following these works Masih et al. (2010) examinedthe magnitude of correlation values between monthly NAO index and the monthlyprecipitation and temperature during the winter months from December to March.Their findings regarding precipitation appeared to be different than those of Cullenet al. (2002) who found strong impact of changes in the NAO on the streamflow, pre-cipitation and temperature during December–March for the Euphrates-Tigris Riversystem. However, the results of Masih et al. (2010) confirmed those of Evans et al.(2004) who indicated that the NAO index alone could not be a predictor of the localclimate in the Zagros Mountains, Iran.
In order to make more reliable decisions in water resources management, infor-mation on regional characteristics of drought duration and intensity is thought toprovide critical insights in arid and semiarid regions. In this regard, determinationof appropriate predictors for seasonal rainfall is important in regional analyses ofmeteorological droughts, since rainfall is the sole variable to quantify the char-acteristics of such drought. Dezfuli et al. (2010) concerned the regional rainfallrelationships with the SOI and NAO at the seasonal time scale to find the appro-priate regional drought predictors over southwest Iran. They found that the NAO isnegatively correlated with autumn rainfall such that it is least likely for an extremeautumn drought to occur when June–August NAO is negative. A spring drought

The Impacts of NAO on the Hydrology of the Eastern Mediterranean 67
is usually preceded by an October–December NAO greater than 0.5. In contrastwinter droughts were not lag-correlated with either NAO or SOI. In addition tothe findings for droughts, these indices considerably influenced wet seasons. A wetautumn tends to occur when either May–July SOI is less than −0.5 or June–AugustNAO is less than about −0.3. It is also noted that the extreme wet springs wereabsent during positive October–December NAO. This season is influenced mostby NAO in both dry and wet spells. Finally, Defluzi et al. concluded that, sim-ilar to droughts, the wet winter seasons were not in association with either SOIor NAO.
Ghasemi and Khalili (2006), who studied the impact of the Arctic Oscillation(AO) on the winter surface air temperature (SAT) over Iran, found a significant rela-tionship between the NAO index and the winter SAT for about 53% of 51 stations inIran. Significant correlation coefficients between the NAO index and the winter SATvary from –0.34 in Tabriz to –0.58 in Abadan. Using seasonal average of the NAO,there were some attempts to develop a forecasting model for climate variables inIran. A model developed by Setoodeh et al. (2004) was able to predict rainfall andtemperature one season ahead with reasonable error based on neural network-basedmodels in Shiraz.
2.4 NAO Impacts on the Hydrology of Kuwait, Oman and Israel
Because of small geographical extent and limitation in data coverage and lengthcountry wise, there is no ample amount of studies that could reflect different aspectsof NAO signals in Oman and Kuwait. However recent results introduced by Marcellaand Eltahir (2008) may shed light on possible teleconnection between the NAOand Kuwait’s hydrology. Kuwait, surrounded by the Syrian and Arabian Deserts tothe west and the Persian Gulf to the east, is located in a semiarid climate zone.Its location lies in a transitional area between the tropics and midlatitudes; hence,the contributions of both climate zones to Kuwait’s rainfall intrigues for answer tohow sensitive the country and the surrounding region’s rainfall is to large-scale cir-culation indices. Among other issues in their study, Marcella and Eltahir (2008)attempted to explain changes in the strength of the NAO in affecting Kuwait’sannual rainfall. Nevertheless their investigation revealed no significant correlationon a monthly or yearly time scale for the relationship between Kuwait rainfall andNAO. These results are similar to those of Evans et al. (2004), who did not find asignificant correlation between the NAO and rainfall in the Middle East. As far asit can be seen from their paper, the authors have used normalized annual rainfallanomalies in Kuwait from CRU (Climate Research Unit: 1976–2001) and GPCP(Global Precipitation Climatology Project: 1979–2001). The use of gridded datasets(that have used with few original stations in their assemblage) casts some doubtson the significance of these results and might explain why these are fundamen-tally different from the relatively well established impacts of NAO over Turkey, Iranand Oman.

68 E. Kahya
A recent work by Charabi and Al-Hatrushi (2010) provides some evidence forOman, having studied the relation between winter rainfall in Oman and the large-scale circulation as well as synoptic activity on a monthly basis. Their investigationfocused on wet and dry spells that occurred during the period 1984–2007 basedon composite analysis and the role of the main Eurasian oscillations; the EA/WRand the NAO in controlling the Oman winter rainfall. Charabi and Al-Hatrushiobtained the best results for the NAO in such a way that the wet spells are neg-atively correlated with NAO. The negative NAO phase corresponds to enhancedwesterly flow (850-hPa up to 200-hPa), bringing moisture from the Atlantic oceanacross the Mediterranean area towards Oman. However, the correlation detectedbetween dry spells and positive phase of the NAO was relatively weak. The tele-connection showed that the extreme wet spells in northern Oman during wintercorrespond to the extreme negative index of NAO. Such prominent examples werenoted in December 1989 (regional rainfall index = 1.45 vs. NAO index = −1.15)and in December 1995 (regional rainfall index = 3.32 vs. NAO index = −1.67).It is also worth to note that the influence of a weak NAO in winter precipitationmay tend to cause a widespread wet event rather than an expected widespreaddrought condition in northern Oman during some winter months (e.g., December1991, December 1992, January 1998, January 2001, February 1993, and March1987). The bulk of rainfall in northern Oman occurs in the winter seif season fromNovember/December to April and accounts for 58–83% of the average annual rain-fall. These are caused by midlatitude westerly depression by polar front jet stream(Andy et al., 2009). An essential conclusion drew by Charabi and Al-Hatrushi(2010) was that the winter rainfall in Oman showed, in general, some linkages withthe negative phase of NAO.
Israel is located on a climatic border, between the temperate and the arid regions.There have been extensive studies to put forward detailed aspects of the NAOimpacts on hydrology and climatology of Israel and some major works in the con-text of this section are reviewed here. Ziv et al. (2006) aimed to find a linkagebetween the interannual variations of the rainfall measured in twelve stations inthe northern half of Israel (the southern Levant) and regional to global scale atmo-spheric circulations. For the relation between the southern Levant rainfall and NAO,they pointed out that weak correlation found between the rainfall and the NAO byBen-Gai et al. (2001) and in this study is inconsistent with Eshel and Farrell (2000,2001), who found that the rainfall variability over the EM is explained through themodulations of a North Atlantic/Mediterranean teleconnectivity. Other than rainfallvariable, Ben-Gai et al. (2001) showed high correlations between the winter modeof the NAO and temperature and sea level pressure (SLP) in Israel with a magni-tude of –0.8 and +0.9, respectively. However, none of these studies witnessed anysignificant correlation between NAO and the rainfall over the southern Levant.
Categorized rainfall intensity in different regions of Israel could be put on thetable for searching the NAO signals. Yosef et al. (2009) examined rainfall intensitytrends and searched NAO signals at the same time. Their results included that apositive significant correlation was found with the total rainfall in the centre andsouth and with some of the rainfall categories.

The Impacts of NAO on the Hydrology of the Eastern Mediterranean 69
3 Conclusions
The findings in terms of consistent NAO signal for the eastern Mediterranean coun-tries differ from one location to another. The following aspects are the articledhighlights of the NAO signals in the eastern Mediterranean countries.
Highlights for Turkey;
1. The results of some lag correlations indicated a considerable prediction potentialfor precipitation and streamflow variables.
2. Correlation analysis revealed less sensitive characteristics of Turkish tempera-ture patterns with the NAO.
3. The relation between the NAO index and streamflow PC1 scores (representinga basic streamflow anomaly pattern in the entire Turkey) was determined highlysignificant for annual average and various seasonal averages.
4. The NAO has quantifiable influences on the transition probabilities and expecta-tion of the critical drought duration for annual flows at Göksu River.
5. Tuz, Sapanca, and Uluabat lakes demonstrated much stronger influences of theNAO than the other four lakes.
6. The NAO was shown as a factor affecting the form of hydrological regionaliza-tion depending on its positive and negative phases.
Highlights for Iran;
1. In the central part of Iran (Mashhad), the NAO provided a firm basis for a mea-surable teleconnection between crop yields and climate factors. It is likely toexpect a higher wheat yield in Mashhad when the NAO index is negative.
2. Aridity index series compiled from Khorasan province in northeast of Iranrevealed significant correlations between the NAO and NINO-3.4.
3. The NAO index alone could not be a predictor of the local climate in theZagros Mountains, Iran. Similar to droughts, the wet winter seasons were notin association with the NAO in the same area.
4. In southwest Iran, the October–December NAO season was influenced most bythe NAO in both dry and wet spells.
5. Significant relationship between the NAO index and winter surface air tempera-ture was found in about 53% of 51 stations throughout Iran.
Highlights for Kuwait, Oman and Israel;
1. No significant correlation on a monthly or yearly time scale for the relationshipbetween the NAO and Kuwait rainfall was noted.
2. During the period 1984–2007, the wet spells in Oman winter rainfall werenegatively correlated with the NAO.
3. Extreme wet spells in northern Oman during winter corresponded to the extremeNAO negative index.

70 E. Kahya
4. Poor correlation was found between the NAO and rainfall in the northern half ofIsrael.
5. High correlations were detected between the winter mode of the NAO andtemperature and sea level pressure in Israel.
6. Positive significant correlation was found with the total rainfall in the centre andsouth and with some of the rainfall categories.
It will be a good practice to close this chapter by a rare NAO related indicationfor Iraq. Recalling preliminary research showing that the band of drying and cool-ing during the positive NAO phase extends from Spain through northern Africa andItaly to Turkey and the Middle East, this signal for temperature in Iraq was excep-tionally strong, with the NAO explaining nearly 50% of the variance in wintertimetemperatures according to the study by Sorooshian et al. (2003). Such a strong sig-nal level is not common among climate studies, therefore it provides a potential foraccurate seasonal forecasts.
Acknowledgements The author is grateful to the efforts of organizers of ESF-MedCLIVARWorkshop (Hydrological, socioeconomic and ecological impacts of the North Atlantic Oscillationin the Mediterranean region, Zaragoza, Spain, May 24–27, 2010) Drs. García-Herrera, Trigo andVicente-Serrano. This work has been funded through support by TUBITAK Research Project, No:ÇAYDAG 108Y165.
References
Andy YK, Dorvlo AS, Kumar GTV (2009) Analysis of a 27-year rainfall data (1977–2003) in theSultanate of Oman. Int J Climatol 29:605–617
Bannayan M, Lotfabadi SS, Sanjani S, Mohamadian A, Aghaalikhani M (2010a) Effects of pre-cipitation and temperature on crop production variability in northeast Iran. Int J Biometeorol55(3):387–401
Bannayan M, Sanjani S, Alizadeh A, Lotfabadi SS, Mohamadian A (2010b) Association betweenclimate indices, aridity index, and rainfed crop yield in northeast of Iran. Field Crops Res118:105–114
Ben-Gai T, Bitan A, Manes A, Alpert P, Kushnir Y (2001) Temperature and surface pressureanomalies in Israel and the North Atlantic Oscillation. Theor Appl Climatol 69:171–177
Charabi Y, Al-Hatrushi S (2010) Synoptic aspects of winter rainfall variability in Oman. AtmosRes 95:470–486
Cullen HM, Kaplan A, Arkin PA, Demenocal PB (2002) Impact of the north Atlantic oscillationon the Middle Eastern climate and streamflow. Clim Change 55:315–338
Dezfuli AK, Karamouz M, Araghinejad S (2010) On the relationship of regional meteorologicaldrought with SOI and NAO over southwest Iran. Theor Appl Climatol 100:57–66
Eshel G, Farrell BF (2000) Mechanisms of Eastern Mediterranean rainfall variability. J Atmos Sci57:3219–3232
Eshel G, Farrell BF (2001) Thermodynamics of Eastern Mediterranean rainfall variability. J AtmosSci 58:87–92
Evans JP, Smith RB, Oglesby RJ (2004) Middle East climate simulation and dominant precipitationprocesses. Int J Climatol 24:1671–1694
Ghasemi R, Khalili D (2006) The influence of the Arctic oscillation on winter temperatures in Iran.Theor Appl Climatol 85:149–164
Hurrell JW (1996) Influence of variation in extratropical wintertime teleconnections on NorthernHemisphere temperature. Geophys Res Lett 23:665–668

The Impacts of NAO on the Hydrology of the Eastern Mediterranean 71
Kalayci S, Kahya E (2006) Assessment of streamflow variability modes in Turkey: 1964–1994.J Hydrol 324:163–177
Karabörk MÇ, Kahya E, Karaca M (2005) The influences of the Southern and North AtlanticOscillations on climatic surface variables in Turkey. Hydrol Process 19:1185–1211
Krichak SO, Kishcha P, Alpert P (2002) Decadal trends of main Eurasian oscillations and theEastern Mediterranean precipitation. Theor Appl Climatol 72:209–220
Küçük M, Kahya E, Cengiz TM, Karaca M (2009) North Atlantic oscillation influences on Turkishlake levels. Hydrol Process 23:893–906
Lins HF (1985) Streamflow variability in the United States: 1931–1978. J Clim Appl Climatol24:463–471
López-Moreno JI, Vicente-Serrano SM (2008) Positive and negative phases of the wintertimenorth Atlantic oscillation and drought occurrence over Europe: a multitemporal-scale approach.J Clim 21:1220–1242
Mann ME (2002) Large-scale climate variability and connections with the Middle East in the pastcenturies. Clim Change 55:287–314
Marcella MP, Eltahir EAB (2008) The hydroclimatology of Kuwait: explaining the variability ofrainfall at seasonal and interannual time scales. J Hydrometeorol 9:1095–1105
Masih I, Uhlenbrook S, Maskey S, Smakhtin V (2010) Streamflow trends and climate linkages inthe Zagros Mountains, Iran. Clim Change 104(2):317–338
Sabziparvar AA, Mirmasoudi SH, Tabari H, Nazemosadat MJ, Maryanajic Z (2010) ENSO tele-connection impacts on reference evapotranspiration variability in some warm climates of Iran.Int J Climatol 31(6)
Sarlak N, Kahya E, Bég AO (2009) Critical drought analysis: a case study of Göksu River (Turkey)and north Atlantic oscillation influences. J Hydrol Eng 14:795–802
Setoodeh P, Safavi A, Nazemosadat MJ (2004) Intelligent forecasting of rainfall and temperatureof Shiraz city using neural networks. Iran J Sci Technol 28:165–174
Sorooshian S, Imam B, Mahani S, Pagano T, Whitaker M (2003) Hydrologic sciences and waterresources management issues in a changing world. In: Alsharhan AS, Wood WW (eds) Waterresources perspectives: evaluation, management and policy. Developments in water science,vol 50. Elsevier Science, Amsterdam, pp 83–92
Syed FS, Giorgi F, Pal JS, Keay K (2010) Regional climate model simulation of winter climate overCentral–Southwest Asia, with emphasis on NAO and ENSO effects. Int J Climatol 30:220–235
Türkes M (1996) Spatial and temporal analysis of annual rainfall variations in Turkey. IntJ Climatol 16:1057–1076
Türkes M, Erlat E (2003) Precipitation changes and variability in Turkey linked to the NorthAtlantic Oscillation during the period 1930–2000. Int J Climatol 23:1771–1796
Yosef Y, Saaroni H, Alpert P (2009) Trends in daily rainfall intensity over Israel 1950/1-2003/4.Open Atmos Sci J 3:196–203
Ziv B, Dayan U, Kushnir Y, Roth C, Enzel Y (2006) Regional and global atmospheric patternsgoverning rainfall in the southern Levant. Int J Climatol 26:55–73

Influence of Winter North AtlanticOscillation Index (NAO) on Climate and SnowAccumulation in the Mediterranean Mountains
Juan I. López-Moreno, Sergio M. Vicente-Serrano, Enrique Morán-Tejeda,Jorge Lorenzo-Lacruz, Javier Zabalza, Ahmed El Kenawy,and Martin Beniston
Abstract This work analyses the influence of NAO on the interannual evolutionof winter temperature, precipitation and snowpack in the Mediterranean mountains.Due to lack of snow data in many mountain areas, the occurrence of four differ-ent winter modes are used as a proxy of the amount of accumulated snow. Wintermodes are defined on the basis of combined precipitation and temperature thresh-olds: warm and wet (WW), warm and dry (WD), cold and wet (CW), and coldand dry (CD). The study focuses on 15 relevant mountain areas located in theMediterranean Europe, Morocco, Turkey and Lebanon. Moreover, we present therelationship between winter NAO and snow depth data in the Swiss Alps and theSpanish Pyrenees. It has been demonstrated that snowpack accumulation in a givenyear is closely related to the occurrence of these winter modes. However, such rela-tionship is variable among mountain areas and also there are differences dependingon elevation in a particular mountain range. Results show that occurrence of dif-ferent winter modes is strongly related to the winter NAO for the majority of themountain chains under study, although these relationships are weaker in the east-ernmost part of the Mediterranean basin. Moreover, it has also been proven that thesnow cover response to winter NAO may differ spatially as a consequence of thedifferent influence of winter NAO on precipitation and temperature. In Switzerland,NAO is correlated more with temperature than with precipitation. Therefore, theinfluence of NAO on snow is significant at the lowest elevation areas, where tem-perature is the main control on snowpack accumulation. On the other hand, over theSpanish Pyrenees the NAO mainly controls the interannual variability of precipi-tation. In this region, the highest correlation with snow is found at high elevationswhere the interannual variability of temperature does not significantly influencessnowpack, whereas precipitation controls mainly the accumulation of snow.
Keywords Snow · North Atlantic Oscillation (NAO) · Precipitation ·Temperature · The Mediterranean
J.I. López-Moreno (B)Instituto Pirenaico de Ecología, Spanish National Research Council (CSIC), Zaragoza, Spaine-mail: [email protected]
73S.M. Vicente-Serrano, R.M. Trigo (eds.), Hydrological, Socioeconomicand Ecological Impacts of the North Atlantic Oscillation in the Mediterranean Region,Advances in Global Change Research 46, DOI 10.1007/978-94-007-1372-7_6,C© Springer Science+Business Media B.V. 2011

74 J.I. López-Moreno et al.
1 Introduction
In the Mediterranean mountains snow cover exerts a strong control over ecology,agriculture, availability of water resources, feasibility of a diverse range of economicactivities, and associated risks in mountainous and high-latitude regions (Beniston,2003; Breiling and Charamza, 1999; López-Moreno and García-Ruiz, 2004; López-Moreno, 2005; De Jong et al., 2009). The climate in the Mediterranean region ismarkedly characterized by a strong seasonality, with relatively low annual precip-itation and high interannual variability (Lionello et al., 2006). Winter is the mosthumid season of the year, with a large proportion of the annual precipitation. Thus,climate anomalies during winter may have major implications for the annual waterbudget (López-Moreno et al., 2008).
Previous research has identified the North Atlantic Oscillation as one of the mainatmospheric circulation modes that determines the temporal evolution of winter pre-cipitation and temperature in the Mediterranean area (Hurrell, 1995; Corte-Realet al., 1995; Hurrell and van Loon, 1997). Thus, it can be expected to exert astrong control on snowpack variability in many mountain areas. However, such ahypothesis is difficult to verify owing to the scarcity of snow data in most of theMediterranean mountain ranges. In this study, we investigated the possible effectsof the NAO on winter precipitation and temperature in 15 mountain ranges in theMediterranean Europe, Morocco, Turkey and Lebanon during the period 1950-2005Moreover, snow data from the Swiss Alps and the Spanish Pyrenees has also enabledto analyze the direct influence of the NAO on the variability of snow depth in twocontrasted regions in terms of winter NAO influences on climate. In this context,a special emphasis was given to analyze the effect of NAO on combined win-ter precipitation and temperature modes. Winter modes were identified accordingto possible combinations of cold-warm and dry-wet conditions. The occurrenceof different winter modes is closely related to the amount of accumulated snow;although such a relation is highly determined by the elevation of the mountainousarea. Thus, Beniston et al. (in press) concluded that cold and wet years in the SwissAlps significantly favor the development of a thick snow pack in mountain areas,although during warm and wet years the potential for snow accumulation is essen-tially restricted to high altitude sites. On the other hand, the association betweenwarm and dry years often results in low snow accumulation at all elevations, andparticularly on the lowest slopes.
Although the effect of the NAO on precipitation and temperature has been widelyanalyzed in the Mediterranean area (e.g. Hurrell and van Loon, 1997; Krichak andAlpert, 2005; López-Bustins et al., 2008), there have not been previous studiesfocusing on the main mountain areas, and only a few studies have considered thelocal influence of the NAO on combined temperature and precipitation modes orsnow depth.

Influence of Winter North Atlantic Oscillation Index (NAO) on Climate and Snow . . . 75
2 Data and Methods
The CRU TS3.0 monthly gridded (latitude/longitude resolution = 0.5◦) precipita-tion and temperature database was used for the entire Mediterranean region for theperiod 1950-2005. It was compiled by the Climate Research Unit at the Universityof East Anglia (http://www.cru.uea.ac.uk; Mitchell and Jones, 2005). In addition,climate and snow data was provided for the Alps by the national meteorologicalservice (Meteoswiss). The climate data of the Spanish Pyrenees was also providedby the Spanish Meteorological Agency (AEMET). Snow depth data in the Pyreneeswas obtained from 106 snow poles placed in the area since 1985. The poles and thecollection of data are managed by the ERHIN Programme (Estudio de los RecursosHídricos INvernales: Study of winter water resources), run by the Spanish Ministryof Environment. Measurements are taken regularly three times each year, althoughweather conditions slightly modify the measurement dates. In this study, only snowdepths measured in March were considered. Snowpack at this time is determined bythe climate of the previous winter (López-Moreno, 2005) and, hence, it adequatelydetermines the accumulated role of the winter NAO conditions. The snow depthseries for the period 1985–2005 showed a high correlation with the winter precipi-tation and temperature. These high correlations allowed the prediction of a regionalseries for snow pack in March between 1950 and 1999. More details about snowmeasurements and the methodology of building the snow depth series is found inLópez-Moreno (2005).
From the CRU database, only those series corresponding to the grid cells thatcover the 15 selected mountain areas (see Fig. 1), were used in the study. Allthe mountain ranges selected for the current analysis experience some level ofMediterranean climatic influence, or drain to the Mediterranean Sea (or the CaspianSea in the case of northern Turkey and the Caucasus). This included four mountainsystems in the Iberian Peninsula (the Pyrenees, the Cantabrian Range, the CentralSystem and the Sierra Nevada); the Atlas Mountains in Morocco; the Apennines inItaly; the Alps, the Carpathian, the Balkan and the Pindos mountains, and DynaricAlps in the Balkan Peninsula; the Taurus and northern mountains in Turkey; theCaucasus in Armenia and Georgia and the Lebanese mountains.
We used the NAO index defined by Jones et al. (1997), which is based on the dif-ference in anomalies of the sea level pressure measured at the Gibraltar (southwestIberian Peninsula) and Reykjavik (southwest Iceland) stations. The NAO index wascompiled by the Climatic Research Unit, University of East Anglia (http://www.cru.uea.ac.uk/cru/data/nao.htm) for the period 1821 to the present. Prior to corre-lating series of winter temperature and precipitation (from December to March;DJFM) with the winter NAO (DJFM), we linearly de-trended the time series forautocorrelation. This approach minimized the influence of time series trends andmulti-year to decadal signal variability on the strength and significance of thecomputed correlations and the deduced NAO predictability.
To assess the impact of the winter NAO on combined precipitation and tempera-ture, we used the joint quantile approach described by Beniston and Goyette (2007).New insights on statistics that integrate mutual feedbacks between temperature and

76 J.I. López-Moreno et al.
Fig. 1 Study area
moisture are possible when temperature and precipitation records are combined(Beniston, 2009). The 40 and 60% joint quantiles were used to define particularwinter modes: (i) cold/dry (CD; when the joint quantiles were equal to or belowT40p40; the subscript refers to the quantile threshold); (ii) cold/wet (CW; T<40p>60);(iii) warm/dry (WD; T>60p<40); and (iv) warm/wet (WW; T>60p>60). The winterNAO values for individual years belonging to each of the four winter modes wereanalyzed and compared with the other three modes. The 40 and 60 percentiles wereselected, as opposed to the more restrictive percentiles used in previous research(Beniston, 2009). This was principally done to have a sufficient number of years foreach winter mode to assess if differences in NAO among winter modes were statis-tically significant. The non-parametric Wilcoxon-Mann-Whitney rank test (Siegeland Castelan, 1988) was applied to determine whether differences in the NAOduring the various winter modes were significant (α < 0.05).
3 Results
3.1 Effects of the Winter Modes on Snow Accumulationin Mountain Areas
As an example, Fig. 2 shows how the occurrence of different winter modes affectsthe annual patterns of snow accumulation at four different locations in the Swiss

Influence of Winter North Atlantic Oscillation Index (NAO) on Climate and Snow . . . 77
Fig. 2 (a) Mean snow accumulation (in cm) in four locations of the Swiss Alps during years thatbelong to different winter modes: warm and wet (WW), warm and dry (WD), cold and wet (CW)and cold and dry (CD). (b) Snow accumulation and melting patterns on Château d’Oex (b, 980 ma.s.l.) and Saentis (c, 2500 m a.s.l.). Day 1 is October 1st
Alps. Although this example is only based on data collected within the Swiss Alps,the results can be considered to be representative of the other mountainous areasbecause it depicts the absence of temperature influences on snow accumulation aselevation increases. This behavior can typically be expected in all mountain regions.Thus, the relation between winter modes and snow accumulation varies noticeablyaccording to the elevation of the observatory. Figure 2a indicates the variabilityin mean snow accumulation from December to March according to different win-ter modes. Snow amounts have been standardized according to the value of theirpercentile, thereby enabling comparison between the impacts of the occurrence ofwinter modes on snow accumulation, independently of the magnitude of snowpackin each site. At high elevation sites (e.g. Saentis [2500 m a.s.l.] and Arosa [1850m a.s.l.]), the occurrence of high accumulation is mainly related to the occurrence
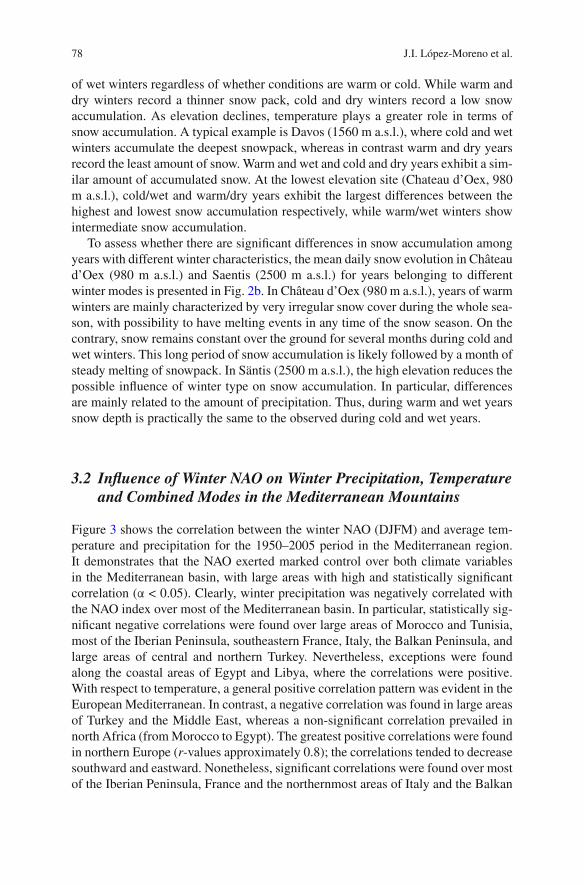
78 J.I. López-Moreno et al.
of wet winters regardless of whether conditions are warm or cold. While warm anddry winters record a thinner snow pack, cold and dry winters record a low snowaccumulation. As elevation declines, temperature plays a greater role in terms ofsnow accumulation. A typical example is Davos (1560 m a.s.l.), where cold and wetwinters accumulate the deepest snowpack, whereas in contrast warm and dry yearsrecord the least amount of snow. Warm and wet and cold and dry years exhibit a sim-ilar amount of accumulated snow. At the lowest elevation site (Chateau d’Oex, 980m a.s.l.), cold/wet and warm/dry years exhibit the largest differences between thehighest and lowest snow accumulation respectively, while warm/wet winters showintermediate snow accumulation.
To assess whether there are significant differences in snow accumulation amongyears with different winter characteristics, the mean daily snow evolution in Châteaud’Oex (980 m a.s.l.) and Saentis (2500 m a.s.l.) for years belonging to differentwinter modes is presented in Fig. 2b. In Château d’Oex (980 m a.s.l.), years of warmwinters are mainly characterized by very irregular snow cover during the whole sea-son, with possibility to have melting events in any time of the snow season. On thecontrary, snow remains constant over the ground for several months during cold andwet winters. This long period of snow accumulation is likely followed by a month ofsteady melting of snowpack. In Säntis (2500 m a.s.l.), the high elevation reduces thepossible influence of winter type on snow accumulation. In particular, differencesare mainly related to the amount of precipitation. Thus, during warm and wet yearssnow depth is practically the same to the observed during cold and wet years.
3.2 Influence of Winter NAO on Winter Precipitation, Temperatureand Combined Modes in the Mediterranean Mountains
Figure 3 shows the correlation between the winter NAO (DJFM) and average tem-perature and precipitation for the 1950–2005 period in the Mediterranean region.It demonstrates that the NAO exerted marked control over both climate variablesin the Mediterranean basin, with large areas with high and statistically significantcorrelation (α < 0.05). Clearly, winter precipitation was negatively correlated withthe NAO index over most of the Mediterranean basin. In particular, statistically sig-nificant negative correlations were found over large areas of Morocco and Tunisia,most of the Iberian Peninsula, southeastern France, Italy, the Balkan Peninsula, andlarge areas of central and northern Turkey. Nevertheless, exceptions were foundalong the coastal areas of Egypt and Libya, where the correlations were positive.With respect to temperature, a general positive correlation pattern was evident in theEuropean Mediterranean. In contrast, a negative correlation was found in large areasof Turkey and the Middle East, whereas a non-significant correlation prevailed innorth Africa (from Morocco to Egypt). The greatest positive correlations were foundin northern Europe (r-values approximately 0.8); the correlations tended to decreasesouthward and eastward. Nonetheless, significant correlations were found over mostof the Iberian Peninsula, France and the northernmost areas of Italy and the Balkan

Influence of Winter North Atlantic Oscillation Index (NAO) on Climate and Snow . . . 79
Fig. 3 Pearson’s correlation coefficients between the winter (DJFM) NAO and precipitation andtemperature for the period 1950–2005
Peninsula. In contrast, southern Italy, Greece and western Turkey exhibited lowand non-significant correlations. These results are in good agreement with previ-ous works describing the overall impact of NAO in European and Mediterraneantemperatures (e.g. Trigo et al., 2002).
Table 1 presents the mean, the 25th and 75th percentiles and the coefficient ofvariation in the correlation of winter temperature and precipitation with the NAOindex in each mountain area. In the Iberian Peninsula, the influence of the NAOon precipitation and temperature was evident for the four analyzed mountain areas.The correlation with mean temperature is statistically significant (α < 0.05) in theCantabrian Mountains, the Central System and over most of the Pyrenees. TheSierra Nevada, southeast the Iberian Peninsula, was the only mountain area withstatistically non-significant correlation between the NAO and temperature. On theother hand, winter precipitation was negatively correlated with the NAO in the fourmountain areas. Temperature in the Atlas Mountains in Morocco was negativelybut not significantly correlated with the NAO. However, precipitation over most

80 J.I. López-Moreno et al.
Table 1 Mean correlation, 25th and 75th percentiles (C25 and C75) and coefficient of varia-tion between precipitation, temperature and NAO in the 15 mountain areas. Average significantcorrelations (α < 0.05) are in bold
Precipitation Temperature
Mean C25 C75 CV Mean C25 C75 CV
Cantabrian M. –0.61 −0.65 −0.54 −0.11 0.39 0.38 0.39 0.02Central S. –0.63 −0.66 −0.62 −0.06 0.39 0.34 0.44 0.17Pyrenees –0.53 −0.60 −0.50 −0.17 0.31 0.27 0.31 0.17S. Nevada –0.72 −0.72 −0.71 −0.02 0.14 0.10 0.17 0.42Atlas –0.45 −0.57 −0.37 −0.38 0.15 −0.28 −0.04 1.03Alps –0.3 −0.44 −0.24 −0.74 0.52 0.47 0.57 0.14Apenines –0.39 −0.48 −0.32 −0.24 0.17 0.11 0.23 0.46Carphatians –0.37 −0.46 −0.31 −0.22 0.29 0.27 0.31 0.1Dinaric Alps –0.62 −0.66 −0.59 −0.09 0.22 0.17 0.26 0.25Pindos –0.61 −0.66 −0.58 −0.10 0.04 −0.10 0.02 2.03Balkan M. –0.49 −0.57 −0.42 −0.18 0.20 0.15 0.25 0.25Taurus –0.29 −0.36 −0.23 −0.28 0.41 −0.45 −0.37 0.13N. Turkey –0.19 −0.26 −0.14 −0.60 0.25 −0.31 −0.22 0.45Caucasus 0.01 −0.11 0.08 3.2 0.11 −0.07 0.18 0.94Lebanon –0.12 −0.15 −0.11 −0.43 0.43 −0.46 −0.40 0.09
of this area showed a statistically significant correlation with the NAO, but withhigh spatial variability. Although the Alps exhibited statistically significant posi-tive correlations with the mean temperatures, precipitation showed marked spatialvariability, but on average there was a significant negative correlation. Nonetheless,coefficients of correlation were noticeably lower than those found for the Pyrenees,which is a consequence to be an area between Southern and Northern Europe whereNAO correlations with temperature goes increasingly south or north of the Alps.The Apennines exhibited a positive but non-significant relationship with tempera-ture, and a negative correlation with precipitation. A similar pattern was evident forthe Dynaric Alps and the Carpathians. However, for the Carpathians, the correlationwith temperature was close to or exceeded the significance threshold. There was noclear correlation between the NAO and temperature in the Pindos and Balkan moun-tains although showed a marked influence on the interannual variability of winterprecipitation. For the Taurus Mountains, the NAO was significantly and negativelycorrelated with both precipitation and temperature. The correlation for the moun-tains of northern Turkey was similar to that observed for the Taurus Mountains,but the α-coefficients were slightly above the statistical significance threshold.The NAO had not a significant influence on winter precipitation or temperaturein the Caucasus. In the Lebanon Mountains, the NAO only showed a statisticallysignificant negative correlation with temperature.
In the mountains of the Iberian Peninsula, the winter NAO values were clearlydistributed according to the joint quantiles of precipitation and temperature. In par-ticular, the WD winters were associated with the highest NAO values (Fig. 4), whilethe WW and CW winters accompanied to the lowest NAO values. Also, the CD

Influence of Winter North Atlantic Oscillation Index (NAO) on Climate and Snow . . . 81
Fig. 4 Boxplots of the winter NAO values recorded during each winter mode in mountain areasof the Iberian Peninsula, Atlas, Alps, Apenines and the Carphatians. In each panel is depictedthe pairs of winter modes in which NAO values has exhibited statistically significant differencesaccording to the Mann-Whitney rank test
winters were related to the intermediate NAO values. The Mann-Whitney rankingindicated that the NAO values during the WD mode differed significantly from thoseobserved during the wet modes (i.e. WW and CD).
Moreover, in the Sierra Nevada, the NAO values for the CD years were differentfrom those of the CW and WD years. In the Pyrenees there were also significantdifferences between the NAO values during the WD and CD winters. In the AtlasMountains (Morocco) precipitation is clearly affected by the NAO, which decreasedfrom dry to wet winters. Thus, during the WW and CW winters, the NAO wasmuch lower than those of the WD and CD winters. The differences between the CDwinters and both the WW and CW winters were found statistically significant.
In the Alps the highest NAO values occurred during the WD winters. Significantdifferences in the NAO were identified between the CW and both CD and WDwinters. For the Apennines there was no clear influence of the NAO on the wintermodes; the only significant difference was between the CW and CD years.
In the Balkan Peninsula the NAO decreased from dry to wet years, with no clearpattern of influence on temperature. In the Carpathians (Fig. 4) the highest valuesof the NAO occurred during the WD years, which were statistically different fromthe WW years. In the Dinaric Alps (Fig. 5) there was a very similar pattern, but

82 J.I. López-Moreno et al.
Fig. 5 Same as Fig. 4 but for the Dinaric Alps, Pindos, Balkans, mountain areas of Turkey andLebanon
with statistically different WD years from both CW and WW winters. The PindosMountains had high NAO values during the WD and CD winters. However, in bothcases the values were significantly different from those in the WW years. Moreover,the magnitude of the NAO during the CD years was significantly different to theCW years. Apart from the CW and CD years, the Balkan Mountains did not showclear differences in NAO values during the various winter modes.
The Taurus Mountains and the mountains of northern Turkey showed a nega-tive NAO gradient as temperature increased. In the former there were significantdifferences between the WW and CD years, whereas in the later significant differ-ences were found between the WD and CD years. In the Caucasus there was noevident signal in the magnitude of the NAO related to any of the four winter modes.In the Lebanese mountains, the NAO values varied with temperature, and signifi-cant differences were found between the WD and CD winters. Similarly, there weredifferences, but insignificant, in the mean NAO values between the WW and CWwinters.
3.3 Influence of Winter NAO on Snow Accumulationin Switzerland
Table 2 shows the correlation between winter NAO and temperature, precipita-tion and snow indices (mean snow depth, days with snow over the ground and

Influence of Winter North Atlantic Oscillation Index (NAO) on Climate and Snow . . . 83
Table 2 Correlation between winter NAO and winter temperature, precipitation, mean snow depth(Mean SD), days with snow (Days) and maximum snow accumulation (Max.snow)
Elev.(m.a.s.l.)
Lat(◦N)
Long(◦E) Tmax Tmin Tavg Precip
MeanSD Days Max.snow
St Gallen 779 47.43 9.4 0.52 0.52 0.52 –0.15 –0.49 –0.46 –0.40Saentis 2490 47.25 9.35 0.51 0.48 0.51 0.45 0.25 0.14 0.24Neuchâtel 485 47.00 6.95 0.60 0.50 0.55 –0.19 –0.4 –0.41 –0.41Lugano 273 46.00 8.97 0.59 0.35 0.59 –0.37 –0.19 –0.16 0.23Geneva 420 46.25 6.13 0.27 0.32 0.45 –0.24 –0.47 –0.49 –0.42Davos 1590 46.82 9.85 0.41 0.33 0.55 0.15 0.09 –0.04 0.13Zurich 443 47.43 8.52 0.55 0.52 0.55 –0.05 –0.41 –0.40 –0.40Arosa 1740 46.78 9.68 0.43 0.46 0.47 0.25 0.03 –0.10 0.05Chateau
D’Oex981 46.28 7.08 0.53 0.35 0.44 0.00 –0.16 –0.10 –0.07
Bold numbers indicate significant correlations (p < 0.05).
maximum snow accumulation) in 9 locations across Switzerland. Following theresults obtained for the Alps using the CRU dataset, average temperature exhib-ited a positive correlation with the NAO in all the considered locations, exceeding0.44 in all cases. For precipitation, coefficients of correlation are markedly lowerthan for temperature; and they varied from negative (generally eastward) to positive(westward). In some cases contrasted correlations between the NAO and precipita-tion were found at very short distances. This was the case in St. Gallen (r = –015)and Saentis (r = 0.45), suggesting a more dominant influence of the complextopography of the region than an influence of large-scale atmospheric circulationson local precipitation. Given the response of temperature and precipitation to theNAO, interannual evolution of winter snow indices are only related to the NAOin those observatories located at low elevation (i.e. Zurich, Geneva, St Gallen andNeuchâtel). This is a consequence of the strong influence of the NAO on tempera-ture, which determines not only the phase of precipitation (liquid or solid), but alsothe occurrence of melting events in those areas close to the 0◦C winter isotherm. Onthe other hand, at highly elevated sites, temperature is always sufficiently cold forprecipitation to fall essentially as snow during winter. In those areas, the interan-nual evolution of snowpack depends largely on winter precipitation amount, whichis not generally controlled by the NAO in Switzerland. One exception is the Saentisweather station located at 2490 m a.s.l., where winter precipitation was clearly influ-enced by the NAO (r = 0.45), and snow indices accordingly exhibited a positivecorrelation with the NAO.
Figure 6 shows the temporal evolution of mean snow depth, days with snowcover and the NAO in Zurich (443 m a.s.l.) and Davos (1590 m a.s.l.). Both sitesare located at a rather similar geographic position in the Swiss territory, but at acontrasted elevation. Both observatories have shown not only positive correlationsbetween winter temperatures and the NAO, but also exhibited weak relationshipsbetween the NAO and precipitation. As previously mentioned, when the NAO onlyexerts a significant control on temperature as occurred in both sites, snow indices

84 J.I. López-Moreno et al.
Fig. 6 Temporal evolution of mean snowdepth (in cm), days with snow cover and NAO in Zurichand Davos
were only correlated with the NAO at the lower elevation sites. Thus, mean snowdepth and days with snow on the ground were significantly correlated with the NAOin Zurich (r = –0.41 and r = –0.40 respectively). On the other hand, both indices didnot show any significant relationship in Davos. Indeed, we can observe how evolu-tion of mean snow depth is independent of the winter NAO evolution. Likewise, thewinter (DJFM) snow cover in Davos presents an inter-annual variability insensitiveto the corresponding evolution of the winter NAO time series.
3.4 Influence of Winter NAO on Snow Accumulationin the Spanish Pyrenees
Previous studies using observational data in the Spanish Pyrenees (López-Moreno,2005; López-Moreno and Vicente-Serrano, 2006) revealed that winter NAO had apositive but not significant correlation with the regional series of winter temper-ature (r = 0.19, α < 0.05 for the 1950–2000 period), and a significant negativecorrelation with the regional precipitation (r = –0.6, α < 0.05 for the 1950–2000period). This strong relationship between the NAO and winter precipitation explainsto large extent the negative correlation between the regional series of snow depthaccumulated in March and winter NAO (Fig. 7).

Influence of Winter North Atlantic Oscillation Index (NAO) on Climate and Snow . . . 85
Fig. 7 (a) Temporal evolution of Winter (DJFM) NAO index and regional series of snow depthfor the Pyrenees in March. (b) Correlation between NAO and snow depth series
Nonetheless, the weak relationship between winter NAO and temperature leadsto a significant altitudinal gradient in the strength and significance of the correlationcoefficients observed at individual sites in the Pyrenees. The differentiated influenceof the NAO on snow depth depends on elevation. This is mainly a consequence ofthe necessity of low temperatures to ensure that precipitation falls as snow. At lowelevation sites, interannual variability of winter precipitation is also controlled bythe NAO. However, temperature determines the nature of precipitation (i.e. rain orsnow) and also the occurrence of melting events during winter. In contrast, at highelevation sites, temperature is not the main control on snowpack and precipitation.Therefore, the NAO seems to be the principle factor governing the interannual vari-ability of snow. Figure 8 shows the correlation coefficients between winter NAO
Fig. 8 Coefficient of correlation between winter NAO and snow depth measured in March in86 locations at contrasted elevation. Dashed line indicate the threshold of statistical significance(α < 0.05)

86 J.I. López-Moreno et al.
and snow depth measured at 86 snow poles located across the Pyrenees during theperiod 1986–2006. Depending on whether snow poles are located above or below2100 m a.s.l., we can find statistical significant differences between both groups.Thus, snow depth measured at snow poles located below 2100 m a.s.l. showed amean correlation of –0.36 with the NAO, which is statistically insignificant in themajority of cases. Conversely, snow depth measured above 2100 m a.s.l. exhibitsa mean correlation of –0.48 with winter NAO, meeting the statistical significancethreshold in most cases.
4 Discussion and Conclusions
The results of this study confirm the major influence of winter NAO on climate andsnowpack in most of the Mediterranean mountains. Following the results obtainedion previous works we have identified large scale negative (positive) correlationwith precipitation (temperature) (e.g., Trigo et al., 2002). However, there are notice-able spatial differences in the magnitude or sign of the correlations (Dunkeloh andJacobeit, 2003). Thus, the negative correlation with precipitation tended to be higherin the western part of the Mediterranean basin (i.e. the Iberian Peninsula and north-western Morocco), northern Italy, the western part of the Balkan Peninsula and someparts of central Turkey. Winter precipitation exhibited a close relationship with theNAO in the mountains of the Iberian Peninsula (the Cantabrian Mountains, CentralSystem, Pyrenees and Sierra Nevada), the Atlas, the Pindos and the Balkan moun-tains, and the Dinaric Alps. Other mountains showed negative correlation with theNAO, but with lower coefficients. The exceptions were found in northern Turkey,the Caucasus and the Lebanese mountains, where no significant correlations wereexhibited. The positive correlation between temperature and winter NAO tendedto decrease southward in the Mediterranean basin. Only the Alps, the CantabrianMountains, the Central System, the Pyrenees and the Carpathians showed significantpositive correlations. In the case of the Pyrenees, the correlation with temperaturewas positive but not statistically significant when the observational data was consid-ered for analysis in the 1950–2000 period. In contrast to the general tendency, themountains of Lebanon and some parts of the Caucasus and northern Turkey showeda significant negative correlation.
Spatial differences in the influence of the NAO on precipitation and temperatureexplain why there were differences in the response of the combined precipitationand temperature modes to winter NAO in the Mediterranean mountain areas. Inmost cases winters dominated by positive NAO conditions had warm and dry con-ditions, except for the eastern part of the Mediterranean basin, where NAO usuallyyields cold and dry winters. Negative NAO winters usually cause wet conditionsin the Mediterranean mountains (except for those located in the eastern part of thebasin), but generally there was no clear difference in their occurrence under warmor cold modes. Irrespective of the geographical location, the NAO had a statisti-cally significant influence on the occurrence of winter modes in all the mountains,except the Caucasus and the Lebanese mountains. The NAO had a major influence

Influence of Winter North Atlantic Oscillation Index (NAO) on Climate and Snow . . . 87
on the occurrence of various winter modes in the Pyrenees, the Sierra Nevada andthe Pindos Mountains.
The occurrence of different winter modes has a major influence on the accumu-lation of snow in the mountain areas. Using snow depth data from the Swiss Alps,we have confirmed that snowpack varies noticeably depending on the occurrenceof a given winter mode. However, the elevation of each specific mountain area oraltitudinal gradients within a particular mountain sector often produces a contrastedresponse of snowpack to winter modes. In particular, the wet modes in the highlyelevated sites of the Swiss Alps are associated with a deep snowpack, indepen-dently of whether the winters are warm or cold. As elevation decreases, the role oftemperature increases. At the lowest altitudes, the cold and wet modes are exclu-sively associated to high snow accumulation. In all cases warm and dry modes areassociated with winters that have an insufficient snowpack.
Given the relationship between the winter modes and snow pack, and alsoconsidering the large influence of the NAO on winter modes, it is not surpris-ing that previous research has suggested the NAO pattern as an important driverof interannual variability of snowpack in mountain areas including: the Pyrenees(López-Moreno and Vicente-Serrano, 2006; García et al., 2009), the Alps (Beniston,1997; Scherrer and Appenzeller, 2006; Schöner et al., 2009), the Romanian moun-tains (Micu, 2009), the Bulgarian Carpathians (Petkova et al., 2004). Followingthe results of this study, it can be concluded that the snow in mountain areas ofthe Iberian Peninsula (the Sierra Nevada, the Cantabrian Mountains, the CentralSystem), the Atlas, the Pindos and Turkish mountains could also be markedlyaffected by the NAO in winter.
This research provides clear evidence of the role of elevation as an importantvariable in explaining the spatial variability of the impacts of the NAO on snow-pack evolution within a specific mountain region. The Swiss and Spanish casestudies have enabled to assess how coefficients of correlation between NAO andsnow indices may exhibit opposite dependence with elevation. More specifically,winter NAO in Switzerland controls mainly temperature, with a variable influenceon precipitation. Accordingly, the NAO does not explain interannual variability ofsnow at highly elevated areas, where temperature is generally below the freezinglevel. Similarly, snowpack is significantly influenced by the NAO in sites locatedat low altitudes. In the valley bottoms, temperature determines whether precipita-tion is solid or liquid, and the NAO controls the interannual characteristics of wintertemperature. An opposite example is the Spanish Pyrenees, where the NAO mainlycontrols the interannual evolution of winter precipitation rather than temperature.Thus, at high elevation sites, where temperature is usually below the freezing point,the NAO explains to a larger extent the interannual variability of the snowpack.However, when elevation decreases, the influence of the precipitation on snowpackweakens, and temperature becomes the major control on snow pack duration andmagnitude.
Nonetheless, under global warming conditions expected in the Mediterraneanregion during the next decades (Giorgi, 2006), the relationships obtained in thisstudy may be different from those for past and current climates. For instance, the

88 J.I. López-Moreno et al.
frequency of cold modes is expected to dramatically decrease in favor of both theWD and WW modes in the Swiss Alps (Beniston et al., in press). Also, a higherfrequency of warm modes is likely to occur in all mountain areas under study owingto the expected increase in the Mediterranean temperature. In large areas of theMediterranean region winter precipitation is expected to decrease (López-Morenoet al., 2009). A higher frequency of warm and dry winters in those areas could neg-atively affect snow cover. In other areas where an increase in winter precipitationis expected, an increase in the WW winters could likely occur in several mountainareas. An increase in the WW winters will be favorable for snow accumulation onlyat very high altitudes, where precipitation falling as snow can remain in the solidstate over a number of consecutive days, even under generally warmer conditions.This hypothesis coincides with numerous studies that have simulated future snow-pack and predicted a general decrease in the Mediterranean mountains, especiallyfor sites at low elevations (López-Moreno et al., 2008; Uhlmann et al., 2009).
Acknowledgements This work was supported by the research projects CGL2006-11619/HID,CGL2008-01189/BTE, and CGL2008-1083/CLI, financed by the Spanish Commission of Scienceand Technology and FEDER, EUROGEOSS (FP7-ENV-2008-1-226487) and ACQWA (FP7-ENV-2007-1-212250), financed by the VII Framework Programme of the European Commission; and“La nieve en el Pirineo Aragonés y su respuesta a la variabilidad climática”, financed by “ObraSocial La Caixa” and the Aragón Government.
References
Beniston M (1997) Variations of snow depth and duration in the Swiss Alps over the last 50 years:links to changes in large-scale climatic forcings. Clim Change 36:281–300
Beniston M (2003) Climatic change in mountain regions: a review of possible impacts. ClimChange 59:5–31
Beniston M (2009) Trends in joint quantiles of temperature and precipitation in Europe since 1901and projected for 2100. Geophys Res Lett 36:L07707
Beniston M, Goyette S (2007) Changes in variability and persistence of climate in Switzerland:exploring 20th century observations and 21st century simulations. Glob Planet Change 57:1–20
Beniston M, Uhlmann B, Goyette S, Lopez-Moreno JI (in press) Will snow-abundant winters stillexist in the Swiss Alps in a greenhouse climate? Int J Climatol. doi:10.1002/joc.2151
Breiling M, Charamza P (1999) The impact of global warming on winter tourism and skiing: aregionalised model for Austrian snow conditions. Reg Environ Change 1:4–14
Corte-Real J, Zhang X, Wang X (1995) Large-scale circulation regimes and surface climaticanomalies over the Mediterranean. Int J Climatol 15:1135–1150
De Jong C, Lawler D, Essery R (2009) Mountain hydroclimatology and snow seasonality andhydrological change in mountain environments. Hydrol Process 23:955–961
Dunkeloh A, Jacobeit J (2003) Circulation dynamics of Mediterranean precipitation variability1948–98. Int J Climatol 23:1843–1866
García C, Martí G, Oller P, Moner I, Gavalda J, Martinez P, Peña JC (2009) Major avalanchesoccurrence at regional scale and related atmospheric circulation patterns in the EasternPyrenees. Cold Regions Sci Technol 59:106–118
Giorgi F (2006) Climate change hot-spots. Geophys Res Lett 33:L08707. doi:10.1029/2006GL025734
Hurrell J (1995) Decadal trends in the North-Atlantic Oscillation. Regional temperatures andprecipitation. Science 269:676–679

Influence of Winter North Atlantic Oscillation Index (NAO) on Climate and Snow . . . 89
Hurrell J, van Loon H (1997) Decadal variations in climate associated with the North AtlanticOscillation. Clim Change 36:301–336
Jones PD, Jónsson T, Wheeler D (1997) Extensions to the North Atlantic oscillation usingearly instrumental pressure observations from Gibraltar and southwest Iceland. Int J Climatol17:1433–1450
Krichak SO, Alpert P (2005) Decadal trends in the East Atlantic–West Russia pattern andMediterranean precipitation. Int J Climatol 25:183–192
Lionello P, Malanotte-Rizzoli P, Boscolo R, Alpert P, Artale V, Li L, Luterbacher J, May W,Trigo R, Tsimplis M, Ulbrich U, Xoplaki E (2006) The Mediterranean climate: an overviewof the main characteristics and issues. In: Lionello P, Malanotte-Rizzoli P, Boscolo R (eds)Mediterranean climate variability. Elsevier, Amsterdam, pp 1–26
López-Bustins J-A, Martin-Vide J, Sanchez-Lorenzo A (2008) Iberia winter rainfall trends basedupon changes in teleconnection and circulation patterns. Glob Planet Change 63:171–176
López-Moreno JI (2005) Recent variations of snowpack depth in the Central Spanish Pyrenees.Arct Antarct Alpine Res 37:253–260
López-Moreno JI, García-Ruiz JM (2004) Influence of snow accumulation and snowmelt onstreamflow in the Central Spanish Pyrenees. Int J Hydrol Sci 49:787–802
López-Moreno JI, García-Ruiz JM, Beniston M (2008) Environmental change and water manage-ment in the Pyrenees. Facts and future perspectives for Mediterranean mountains. Glob PlanetChange 66:300–312
López-Moreno JI, Vicente-Serrano SM (2006) Atmospheric circulation influence on the interan-nual variability of snowpack in the Spanish Pyrenees during the second half of the twentiethcentury. Nordic Hydrol 38:38–44
López-Moreno JI, Vicente-Serrano SM, Gimeno L, Nieto R (2009) The stability of precipitationregimes in the Mediterranean region: observations since 1950 and projections for the twentieth-one century. Geophys Res Lett 36:L10703. doi:10.1029/2009GL037956
Micu D (2009) Snow pack in the Romanian Carpathians under changing climatic conditions.Meteorol Atmos Phys 105:1–16
Mitchell TD, Jones PD (2005) An improved method of constructing a database of monthly climateobservations and associated higher resolution grids. Int J Climatol 25:693–712
Petkova N, Koleva E, Alexandrov V (2004) Snow cover variability and change in mountainousregions of Bulgaria, 1931–2000. Meteorologische Zeitschrift 13:19–23
Scherrer SC, Appenzeller C (2006) Swiss Alpine snow pack variability: major patterns and linksto local climate and large-scale flow. Clim Res 32:187–199
Schöner W, Auer I, Böhm R (2009) Long term trend of snow depth at Sonnblick (Austrian Alps)and its relation to climate change. Hydrol Process 23:1052–1073
Siegel S, Castelan NJ (1988) Nonparametric statistics for the behavioral sciences. McGraw-Hill,New York
Trigo RM, Osborn TJ, Corte-Real JM (2002) The North Atlantic Oscillation influence on Europe:climate impacts and associated physical mechanisms. Clim Res 20:9–17
Uhlmann B, Gollete S, Beniston M (2009) Sensitivity analysis of snow patterns in Swiss skiresorts to shifts in temperature precipitation and humidity under condition of climate change.Int J Climatol 29:1048–1055

Impact of NAO on Mediterranean Fisheries
Francesc Maynou
Abstract The effect of the North Atlantic Oscillation (NAO) on fisheries pro-duction has received attention in the last 2 decades, especially in relation to theinter-annual fluctuation of the important North Atlantic cod fisheries. Results ofthese studies show that the effects of NAO on cod stocks vary geographically,with opposite patterns in the western and eastern North Atlantic and that NAOaffects mainly the recruitment success of cod, especially on heavily fished stocks.In the Mediterranean sea the number of studies is much more limited, due in partto the paucity of sufficiently long and reliable data series for Mediterranean fish-eries. A recent study on the interannual variation of landings of the red shrimpAristeus antennatus in Catalonia shows that the NAO explains a large part of thevariability in population abundance with a lag of 2–3 years. New results presentedhere show that, at the scale of the entire Mediterranean, stocks of hake (Merlucciusmerluccius) respond to the NAO with different trends in the northwestern and south-eastern stocks. Analysis of detailed life history data of this species in the SpanishMediterranean coast allows to postulate the hypothesis that positive NAO yearsenhance hake fishery production through increasing the individual size of recruits,as well as the individual weight and abundance of adult hake. No effect on otherdemographic parameters such as recruitment strength or natural mortality could bedemonstrated.
Keywords Aristeus antennatus · Fisheries · Mediterranean · Merlucciusmerluccius · NAO
1 Introduction
Fisheries production depends on the interaction between human inputs (fishingeffort) and the biomass of fish. While fishing effort may change over time dueto socioeconomic factors, such as market interests, changing costs of effort orother reasons, fish biomass fluctuates over time due to environmental factors,such as biological productivity of its prey resources, or abiotic factors such as
F. Maynou (B)Institut de Ciències del Mar, Spanish National Research Council (CSIC), Barcelona, Spaine-mail: [email protected]
91S.M. Vicente-Serrano, R.M. Trigo (eds.), Hydrological, Socioeconomicand Ecological Impacts of the North Atlantic Oscillation in the Mediterranean Region,Advances in Global Change Research 46, DOI 10.1007/978-94-007-1372-7_7,C© Springer Science+Business Media B.V. 2011

92 F. Maynou
changes in temperature or salinity (Bakun, 1996; Cushing, 1996; Ottersen et al.,2004).
The abundance of marine fish is difficult to determine and many different meth-ods have been developed over time (Hilborn and Walters, 1992). Briefly, fishabundance can be estimated from two basic sources: fisheries dependent data (com-mercial catches) or fisheries-independent data. In the first case, data series of catchesare relatively easy to obtain because most countries maintain relatively long databases on fish production by species (Evans and Grainger, 2001). However, to inter-pret catch data it is often necessary to know the evolution of fishing effort andcatchability, which are often not available or difficult to estimate (Hilborn andWalters, 1992). Fisheries-independent programmes are more reliable but expensiveto maintain and rarely have the long time spans required to assess the relation-ship between environmental variations and fish abundance (Sparre and Venema,1998). In the European North Atlantic, there exist data series derived from scien-tific trawl surveys longer than 40 years (International Bottom Trawl Survey: http://datras.ices.dk), but in the Mediterranean, the only continuous fisheries monitor-ing programme (MEDITS: Mediterranean International Trawl Surveys: http://www.ifremer.fr/Medits_indices) to cover all EU member states started in 1994 and thedata series is thus considerably shorter than in the Atlantic (Bertrand et al., 2002).In any case both types of data sources, commercial and trawl surveys, have advan-tages and disadvantages and it is convenient to use the two types of data concurrentlywhen possible.
It is known that the changes in total biomass of a fishery target species can bedue to individual changes in (one or more) individual demographic parameters. Forinstance, the abundance of a given year class may fluctuate from year to year due toenvironmental factors that cause enhanced survival (or conversely, increased mor-tality) of the individuals of that particular year class (Cushing, 1996; Myers, 2002;Watanabe et al., 2003). This is specially important in the first age class recruitedto the fishery (known as recruitment), and several studies have shown the relation-ship between interannual fluctuations in recruitment and environmental variability(e.g. Mendelsohn and Mendo, 1987; Watanabe et al., 1996; Stige et al., 2006). Otherkey life history parameters affected by environmental variability are the individualgrowth rate, the natural mortality or the reproductive success (Hänninen et al., 1999;Jobling, 2002).
It is often difficult to determine the causes of the relationship between large scaleclimatic indices and fisheries due to the paucity of data, but also due to the complex-ity of the mechanisms involved (Cushing, 1996). In recent years, the usefulness ofemploying large scale climatic indices such as the NAO index as a proxy for com-plex space-time variations in ecological variables has been suggested (Hallett et al.,2004; Stenseth and Mysterud, 2005) and indeed the relationship between climaticindices and fisheries is well documented in non-Mediterranean settings, particularlyin upwelling ecosystems (e.g. anchovy/sardine substitutions in the Pacific Kuroshioand Humboldt Current ecosystems and teleconnections among fish populations,reviewed in Alheit and Bakun, 2010).

Impact of NAO on Mediterranean Fisheries 93
The effects of NAO on North Atlantic fisheries has received attention in recentdecades, especially in the last 10 years (Reid et al., 2001; Beaugrand, 2004), withstudies focused particularly on cod (Gadus morhua, Mann and Drinkwater, 1994;Beaugrand et al., 2003; Stige et al., 2006). The results of these studies show thatthe NAO affects cod fisheries mainly by modulating the strength of cod recruitmentwith a time lag of 2 years (Brodziak and O’Brien, 2005). It has been shown also thatthe effect is stronger when spawning stock biomass (SSB) is low (Brander, 2005).Most significantly, some of these studies showed that the effect of the NAO variesspatially across North Atlantic cod stocks (synthesized in the model by Stige et al.,2006): while cod recruitment is enhanced in Newfoundland, Greenland, Iceland,northern Norway and the Faroes during positive NAO years, it is decreased in theeastern US, around the British Isles, in the North sea and in the Baltic sea (figure 4in Stige et al., 2006).
In many cases the relationship between the NAO and fisheries production hasbeen shown to be mediated by changes in the composition and abundance of zoo-plankton (Fromentin and Planque, 1996; Ottersen and Stenseth, 2001; Reid et al.,2003; Molinero et al., 2008).
In the Mediterranean, the relationship between the NAO and fisheries hasreceived less attention, probably because data series are generally shorter than inAtlantic fisheries. Lloret et al. (2001) assessed the relationship between river runoffin 13 coastal fishery species of the Catalan coasts. They found that catches per unitof effort were positively correlated with the wind mixing index in the Gulf of Lionsand the runoff of local rivers, which varied synchronously with the NAO index: neg-ative NAO indices were associated with higher river runoff (probably because duringnegative NAO years precipitation increases in the NW Mediterranean, Mariottiet al., 2002). Maynou (2008) showed that the detrended landings of the deepwa-ter red shrimp Aristeus antennatus were positively correlated with the NAO indexwith time lags of 2 and 3 years. An ecological mechanism to explain this correlationwas produced, based on current knowledge of the biology of this species and thewater mass dynamics in the study area (NW Mediterranean): positive NAO yearsare correlated with decreased rainfall in the NW Mediterranean sea, especially inthe Gulf of Lions, the Ligurian sea and adjacent hinterland (Mariotti et al., 2002).Decreased rainfall is linked to enhanced vertical mixing of the water masses in theGulf of Lions (Demirov and Pinardi, 2002; Jordi and Hameed, 2009), due to thesaltier (hence, more dense) surface water mass in low rainfall years. Knowing thatfood supply in winter is key to the reproductive success of A. antennatus, becauseduring this period females switch from their normal generalist diet to a high-energycontent diet based on zooplankton (Cartes et al., 2008; Maynou, 2008) postulatedthat positive NAO years would enhance egg production and higher abundance ofrecruits to the fishery.
The objective of this contribution is to assess the effects of NAO in anotherimportant Mediterranean demersal fishery resource, the hake Merluccius merluc-cius at the scale of the entire Mediterranean basin, in order to investigate whetherecological mechanisms linking the NAO with fisheries productivity demonstrated inlocal areas (Catalan sea, Ligurian sea) can be extrapolated to wider areas.

94 F. Maynou
2 Results
European hake (Merluccius merluccius) is an important resource of theMediterranean demersal fishery, with catches fluctuating between 20 and 50,000t in recent decades (FAO Fisheries Department, 2000). The biology of this speciesis well-known (e.g. the review by Oliver and Massutí, 1995; Recasens et al., 1998).Hake is distributed mainly over the continental shelf between 50 and 200 m depth,although occasional large individuals are caught down to 800 m. It is a heavilyexploited species and catches are at present mainly composed of juvenile individualsof age classes 0–2. The recruitment period of hake varies across Mediterranean sub-areas and is relatively protracted, but it occurs mainly in early summer (June–July)in the NW Mediterranean (Recasens et al., 1998).
I analyzed the annual data series of hake catches for the period 1970–2005 in theseven geographical areas of the Mediterranean used by the FAO for fisheries statis-tics purposes (Fig. 1) based on the FISHSTAT database (FAO Fisheries Department,2000).
As shown in Fig. 2, the data series of hake catches are very noisy, although somegeneral patterns emerge. First, hake catches increased from 1970 until the early1990s in most areas (Gulf of Lions, Adriatic, Ionian and Aegean). In these areas, andalso in the Levant, hake production decreased since the early 1990s to the presentdue probably to overfishing (Lleonart, 2008). In the Balearic area no overall trendcan be distinguished, but periods of high catches and low catches can be discerned,while in the Sardinia area hake catches have been decreasing since the beginning ofthe time series (Fig. 2).
To analyze these data sets, a Generalized Additive Model (GAM) was set upfor each statistical area, using year as the main effect (because it is expected thatlong-term trends in interannual variations in catches are mainly due to the observed
Fig. 1 FAO fisheries divisions in the Mediterranean and geographic names mentioned in the text(italics)

Impact of NAO on Mediterranean Fisheries 95
Fig. 2 Data series of hake (Merluccius merluccius) landings in the seven Mediterranean FAOfisheries divisions for the period 1970–2005 (data extracted from FISHSTAT, FAO FisheriesDepartment, 2000)

96 F. Maynou
increase in fishing effort, Lleonart, 2008) and the NAO index as additional effectwith time lags of 1 and 2 years (nao1 and nao2). GAMs are a flexible class ofstatistical regression models which allow to assess linear or nonlinear relationshipsbetween a set of predictors (in our case, year, nao1 and nao2) and a dependentvariable (in our case hake catch) (Wood, 2006):
log(catch) = s(year) + s(nao1) + s(nao2) + ε,
where ε is a normally distributed error term.I used smoothing splines to represent the possibly nonlinear effect of predic-
tors and Generalized Cross Validation (GCV) to establish the optimal degree ofthe smooth terms. Model selection was achieved by means of Akaike’s InformationCriteria to assess the goodness of fit (Wood, 2006).
The GAM models fitted for hake catch in the seven statistical subareas for theperiod 1970–2005 helped explain between 62% (Gulf of Lions) and 96% (Aegeansea) of the deviance in the data series (Table 1). These results show that most ofthe variability in the catch data series can be attributed to the year effect, whichmostly reflects changes in fishing effort over time. More interestingly, the results ofthe GAM analysis show that the lagged NAO index explains between 2 and 8% ofthe deviance of the models and that some of the functional non-parametric termsare statistically significant (Table 1). The shape of these nonparametric terms canbe examined in Fig. 3, which shows that hake stocks in the western and northernMediterranean areas (Gulf of Lions, Balearic and Adriatic) are positively corre-lated with the NAO index at lags 1 and 2 years, while hake stocks in the easternMediterranean (Aegean and Levant) would be negatively correlated with these NAO
Table 1 Results of the GAM analysis of hake (Merluccius merluccius) landings in the sevenMediterranean areas for fishery purposes defined by FAO
Area
Devianceexplained byfull model (%)
Devianceexplained byterm year (%)
Devianceexplained byterm nao1
Devianceexplained byterm nao2
Gulf of Lions 62.3 55.0 4.3% 3.0%Balearic 87.5 81 5.7% 0.8% (NS)Sardinia 69.1 62.6 2.1% (NS) 4.4%Adriatic 66.8 44.9 1.2% 0.7% (NS)Ionian 95.0 93.9 0.1% (NS) 1%Aegean 96.2 89.7 4.2% 2.0%Levant 81.5 77.2 3.7% 0.6% (NS)
Data series from FAO Fisheries Department (2000).nao1 and nao2 are the NAO index lagged 1 and 2 years, respectively.NS: non-significant term, otherwise significant terms at p < 0.1 level.

Impact of NAO on Mediterranean Fisheries 97
Fig. 3 Non-parametric smooth terms determined by the GAM analysis for hake (Merluccius mer-luccius) landings in the seven Mediterranean FAO fisheries divisions. Left column: effect of NAOindex lagged 1 year. Right column: effect of NAO index lagged 2 years
indices (Fig. 3). Hake stocks in the central Mediterranean show weak correlations(Ionian) or of opposite sign (Sardinian).
To investigate the causes linking NAO with hake fisheries variability I analyzedthe correlation between several life-history indicators derived from fisheries inde-pendent trawl surveys in the western Mediterranean (MEDITS surveys carried outalong the continental coast of Spain, Bertrand et al., 2002) by means of autocor-relation function analysis (Venables and Ripley, 2002). The span of this data set(1994–2009) is shorter than the FAO production statistics, but includes a criticaltransitional period from positive values of the NAO index in the 1990s to nega-tive or zero values later on. I extracted several demographic indicators from the

98 F. Maynou
Table 2 Demographic indicators of hake (Merluccius merluccius) analyzed by autocorrelationfunctions. Indicators were derived from the annual MEDITS trawl surveys carried out along theMediterranean continental coast of Spain (1994–2009)
Age class Result
Abundance indices 0 (recruits) NSNo of individuals/km2 1 NS
2 NSAverage for ages 3–6 S (lags 1 and 2)
Individual length (cm TL) 0 (recruits) S (lag 1)1 NS2 NSAverage for ages 3–6 NS
Individual weight (g) 0 (recruits) NS1 NS2 NSAverage for ages 3–6 S (lag 1)
Natural mortality (year–1) 0 (recruits) NS1 NS2 NSAverage for ages 3–6 NS
Biomass Total population biomass NSSpawning stock biomass (SSB) NS
Data elaborated from http://www.ifremer.frS: significant; NS: Not Significant at p<0.05 level.
MEDITS database (http://www.ifremer.fr/Medits_indices): abundance by age class,natural mortality by age class, total biomass, spawning stock biomass, and averageindividual length and weight (Table 2).
The results of autocorrelation function analysis (Fig. 4) show that the meanlength of recruits (hake of age class 0) is positively correlated with NAO at lag1, i.e. recruits are larger than average after positive NAO years. Also the abundanceof adults (age classes 3–6) of hake is increased 1 and 2 years after positive NAOyears, while the average weight of adults is positively correlated with NAO at lag1. Despite this increase in abundance and mean weight of adults, no increase inspawning stock biomass could be shown in positive NAO years, probably becausethe biomass of the adult fraction of the population is much lower than the juvenilefraction (age classes 0–2) in this heavily exploited population. Natural mortalitywas not correlated to the NAO. These results show that in the Balearic subarea,and probably also in the Gulf of Lions and Adriatic, positive NAO years have apositive effect in at least 3 critical indicators of the hake life history (length ofrecruits, abundance of adults and weight of adults) suggesting that the positiveeffects on the catches shown earlier from the FAO production data series can berelated to increase size and weight of the hake population and not, for instance, todecreased natural mortality or increased reproductive success, as in the red shrimp(Maynou, 2008).

Impact of NAO on Mediterranean Fisheries 99
Fig. 4 Autocorrelograms of significant demographic indicators (Table 2) extracted from theMEDITS database for hake (Merluccius merluccius) in the Spanish Mediterranean coast (subarea6). Dotted lines indicate significant correlation at the p < 0.05 level

100 F. Maynou
3 Conclusions
The North Atlantic Oscillation has profound influences on fisheries productivity,mediated by complex dynamics of ocean processes and biological productivity, asshown in North Atlantic fish stocks (Ottersen and Stenseth, 2001; Reid et al., 2001,2003; Stenseth and Mysterud, 2005; Stige et al., 2006), but also in the Mediterranean(Lloret et al., 2001; Maynou, 2008).
In fisheries research the influence of environmental variation on stock productiv-ity may be difficult to detect due to the lack of long and consistent time series of themain oceanographic and ecological parameters at appropriate scales. Large-scaleclimatic indices such as the NAO are often better proxies of ecological processesthan local weather variables, because they reduce the complexities of time andspace variability in environmental phenomena to simple measures (Hallett et al.,2004; Stenseth and Mysterud, 2005), and are specially useful for fish abundancedata where comparable environmental data sets are non existent or expensive toobtain (e.g. for deep-sea fishery resources, Maynou, 2008).
The influence of the NAO on fish stocks has been shown to vary geographically,with impacts of different sign in cod stocks of, broadly, the western Atlantic and theeastern Atlantic (Stige et al., 2006). In Mediterranean hake stocks, present resultssuggest also geographically varying impacts of the NAO. A N/S – W/E trend in theeffects of NAO has been evidenced: in the N and W areas (Balearic sea, Gulf ofLions, Adriatic sea) the effect is close to linear and positive (enhanced hake catchesat positive NAO values). In the E and S subareas (Aegean sea, Levantine sea) theeffects is negative (enhanced catches at negative NAO values), while in the two cen-tral subareas (Sardinian seas and Ionian sea) the effect is weak but mainly positive.Focusing on the Balearic area, I used a shorter data set derived from fisheries inde-pendent surveys to investigate the possible biological causes of enhanced catches byNAO in this area. I showed that the positive relationship between NAO and catchesof hake is related to the positive effect of NAO (with temporal lags of 1 or 2 years) onat least 3 critical indicators of the hake life history: length of recruits, abundance ofadults and weight of adults. These results suggest that the positive effects of NAOon Mediterranean hake catches can be related to increased size and weight of thehake population and not, for instance, to decreased natural mortality nor increasedreproductive success, as in the red shrimp (Maynou, 2008).
Although the effect of the NAO on fisheries of Mediterranean stocks has beenshown in a few studies (Lloret et al., 2001; Maynou, 2008; present work for hake),further research is needed to investigate the relationships linking the North AtlanticOscillation, Mediterranean oceanography and biological productivity. Although itis likely that the effect of the NAO on higher trophic levels (which constitutethe fisheries target species) is mediated by the effects of NAO on zooplankton(Fromentin and Planque, 1996; Maynou, 2008; Molinero et al., 2008) the detailsof these relationships are often mere working hypotheses that need to be refined andtested.

Impact of NAO on Mediterranean Fisheries 101
References
Alheit J, Bakun A (2010) Population synchronies within and between ocean basins: apparentteleconnections and implications as to physical-biological linkage mechanisms. J Mar Syst79:267–285
Bakun A (1996) Patterns in the ocean: ocean processes and marine population dynamics. CaliforniaSea Grant College System/Centro de Investigaciones Biológicas del Noroeste, La Paz, 323 pp
Beaugrand G (2004) The North Sea regime shift: evidence, mechanisms and consequences. ProgOceanogr 60:245–262
Beaugrand G, Brander KM, Lindley JA, Souissi S, Reid PC (2003) Plankton effect on codrecruitment. Science 426:661–664
Bertrand JA, Gil de Sola L, Papaconstantinou C, Relini G, Souplet A (2002) The generalspecifications of the MEDITS surveys. Sci Marina 66:9–17
Brander K (2005) Cod recruitment is strongly affected by climate when stock biomass is low. ICESJ Mar Sci 62:339–343
Brodziak J, O’Brien L (2005) Do environmental factors affect recruits per spawner anomalies ofNew England groundfish? ICES J Mar Sci 62:1394–1407
Cartes JE, Madurell T, Fanelli E, López-Jurado JL (2008) Dynamics of suprabenthos-zooplanktoncommunities around the Balearic Islands (western Mediterranean): influence of environmentalvariables and effects on the biological cycle of Aristeus antennatus. J Mar Syst 71:316–335
Cushing DH (1996) Towards a science of recruitment in fish populations. International EcologyInstitute, Oldendorf/Luhe
Demirov E, Pinardi N (2002) Simulation of the Mediterranean Sea circulation from 1979 to 1993:Part I. The interannual variability. J Mar Syst 33–34:23–50
Evans D, Grainger R (2001) Gathering data for resource monitoring and fisheries management. In:Hart PJB, Reynolds JD (eds) Handbook of fish biology and fisheries, vol 2, chapter 5. BlackwellPublishing, Oxford
FAO Fisheries Department (2000) FISHSTAT plus: universal software for fishery statistical timeseries. Version 2.30. FAO Fisheries Department, Fishery Information, Data and Statistics Unit
Fromentin JM, Planque B (1996) Calanus and environment in the eastern North Atlantic. II.Influence of the North Atlantic Oscillation on C. finmarchicus and C. helgolandicus. Mar EcolProg Ser 134:111–118
Hallett TB, Coulson T, Pilkington JG, Clutton-Brock TH, Pemberton JM, Grenfell BT (2004)Why large-scale climate indices seem to predict ecological processes better than local weather.Nature 430:71–75
Hänninen J, Vuorinen I, Hjelt P (1999) Climatic factors in the Atlantic control the oceanographicand ecological changes in the Baltic Sea. Limnol Oceanogr 45:703–710
Hilborn R, Walters CJ (1992) Quantitative fish stock assessment: choice, dynamics and uncertainty.Chapman and Hall, London
Jobling M (2002) Environmental factors and rates of development and growth. In: Hart PJB,Reynolds JD (eds) Handbook of fish biology and fisheries, vol 1, chapter 5. BlackwellPublishing, Oxford
Jordi A, Hameed S (2009) Influence of the Icelandic low on the variability of surface air tem-perature in the Gulf of Lion: implications for intermediate water formation. J Phys Oceanogr39:3228–3232
Lleonart J (2008) Review of the state of Mediterranean and Black Sea fishery resources. In:Basurco B (ed) The Mediterranean fisheries sector. Options méditerranéennes, Série B: Étudeset recherches, n. 62. CIHEAM/FAO/GFCM, Rome, 179 pp
Lloret J, Lleonart J, Solé I, Fromentin J-M (2001) Fluctuations of landings and environmentalconditions in the north-western Mediterranean Sea. Fish Oceanogr 10:33–50
Mann KH, Drinkwater KF (1994) Environmental influences on fish and shellfish production in theNorthwest Atlantic. Environ Rev 2:16–32

102 F. Maynou
Mariotti A, Struglia MV, Zeng N, Lau KM (2002) The hydrological cycle in the Mediterraneanregion and implications for the water budget of the Mediterranean Sea. J Clim 15:1674–1690
Maynou F (2008) Influence of the North Atlantic Oscillation on Mediterranean deep-sea shrimplandings. Clim Res 36:253–257
Mendelsohn R, Mendo J (1987) Exploratory analysis of anchoveta recruitment off Peru and relatedenvironmental series. In: Pauly D, Tsukuyama I (eds) The Peruvian anchoveta and its upwellingecosystem: three decades of change. ICLARM studies and reviews, Instituto del Mar de Peru,Callao (Peru), vol 15. pp 109–116
Molinero JC, Ibanez F, Souissi S, Buecher E, Dallot S, Nival P (2008) Climate control on the long-term anomalous changes of zooplankton communities in the northwestern Mediterranean. GlobChange Biol 14:11–26
Myers R (2002) Recruitment: understanding density-dependence in fish populations. In: HartPJB, Reynolds JD (eds) Handbook of fish biology and fisheries, vol 1, chapter 6. BlackwellPublishing, London
Oliver P, Massutí E (1995) Biology and fisheries of western Mediterranean hake (M. merluccius).In: Alheit J, Pitcher TJ (eds) Hake: biology, fisheries and markets. Chapman and Hall, London,pp 181–202
Ottersen G, Alheit J, Drinkwater K, Friedland K, Hagen E, Stenseth NC (2004) The responses offish populations to ocean climate fluctuations. In: Stenseth NC, Ottersen G, Hurrell J, BelgranoA (eds) Marine ecosystems and climate variation: the North Atlantic. Oxford University Press,Oxford, pp 73–94
Ottersen G, Stenseth NC (2001) Atlantic climate governs oceanographic and ecological variabilityin the Barents Sea. Limnol Oceanogr 46:1774–1780
Recasens L, Lombarte A, Morales-Nin B, Torres GJ (1998) Spatiotemporal variation in thepopulation structure of the European hake in the NW Mediterranean. J Fish Biol 53:387–401
Reid PC, Borges MF, Svendsen E (2001) A regime shift in the North Sea circa 1988 linked tochanges in the North Sea horse mackerel fishery. Fish Res 50:163–171
Reid PC, Edwards M, Beaugrand G, Skogen M, Stevens D (2003) Periodic changes in the zoo-plankton of the North Sea during the 20th century linked to oceanic inflow. Fish Oceanogr12:260–269
Sparre P, Venema SC (1998) Introduction to tropical fish stock assessment – Part 1: Manual. FAOFisheries Technical Paper 306/1
Stenseth NC, Mysterud A (2005) Weather packages: finding the right scale and composition ofclimate in ecology. J Animal Ecol 74:1195–1198
Stige LC, Ottersen G, Brander K, Chan KS, Stenseth NC (2006) Cod and climate: effect ofthe Northa Atlantic Oscillation on recruitment in the North Atlantic. Mar Ecol Prog Ser325:227–241
Venables WN, Ripley BD (2002) Modern applied statistics with S, 4th edn. Springer, BerlinWatanabe Y, Kurita Y, Noto M, Oozeki Y, Kitagawa D (2003) Growth and survival of Pacific saury
(Cololabis saira) in the Kuroshio-Oyashio transitional waters. J Oceanogr 59:403–414Watanabe Y, Zenitani H, Kimura R (1996) Causes of population decline in the Japanese sar-
dine (Sardinops melanostictus): overfishing or early mortality? In: Watanabe Y, Yamashita Y,Oozeki Y (eds) Survival strategies in early life stages of marine resources. Balkema, Rotterdam,pp 83–94
Wood S (2006) Generalized additive models: an introduction with R. Chapman and Hall/CRC,London, p 410

Impacts of the NAO on MediterraneanCrop Production
Simone Orlandini, Anna Dalla Marta, Marco Mancini, and Daniele Grifoni
Abstract Meteorological conditions can influence the main biological processesresponsible of plant growth and development affecting vegetative growing, settingand ripening of different plant organs, onset and duration of phenological stages andthe final production, exerting a strong impact on agricultural activities. In particular,the study of the variability of timing and length of the plants growing season is gain-ing importance because plant phenology is a sensitive indicator of climate changeand has large impacts on terrestrial ecosystems through changes in productivity andin the annual carbon and water cycles. For many years, starting from meteorolog-ical information, mathematical descriptions of these effects have been formulatedin order to provide users (farmers, technicians, extension services, researchers, etc.)with operational tools for improving management and planning activities. Besidescommon meteorological information supplied by local or synoptic weather stations,the use of large-scale climatic variables has also been investigated in order to fore-cast agricultural yields and production quality in several regions of the world. InEurope, the North Atlantic Oscillation (NAO) seems to be responsible for a largecomponent of climate variability, particularly influencing winter and, through cli-mate interactions on plants, crop production quality and quantity characteristics. Theuse of large-scale meteorological information showed great potential, particularlyfor the development of crop production forecasting systems.
Keywords Wheat · Grapevine · Growth · Development · Yield
1 Introduction
Observations of the physical and biological variables in the environment are essen-tial in agricultural meteorology. Meteorological considerations enter in assessingthe performance of a plant or animal because their development is a result ofthe combined effect of genetic characteristics and their response to environment.Without quantitative data, agrometeorological planning, forecasting, research andservices by agrometeorologists cannot properly assist agricultural producers to meet
S. Orlandini (B)Department of Plant, Soil and Environmental Science, University of Florence, Florence, Italye-mail: [email protected]
103S.M. Vicente-Serrano, R.M. Trigo (eds.), Hydrological, Socioeconomicand Ecological Impacts of the North Atlantic Oscillation in the Mediterranean Region,Advances in Global Change Research 46, DOI 10.1007/978-94-007-1372-7_8,C© Springer Science+Business Media B.V. 2011

104 S. Orlandini et al.
the ever-increasing demands for food and agricultural products. Such data arealso needed to assess the impacts of agricultural activities and processes on theenvironment and climate.
Crop production is the result of a complex interaction among environmentalconditions, agronomic management and plant characteristics. Soil, described by itschemical, biological and physical properties, and climate (i.e. degree days accumu-lation, rainfall, total solar radiation) are the main environmental factors affectingplant responses.
Crop production is influenced by meteorological conditions such as temperature,precipitation, solar radiation (intensity, photoperiod, and quality) and wind. As thesevariables correspond to the main driving factors of crops production spatial andtemporal variability, they are commonly used for the analysis and simulation ofcrop yield.
A number of approaches have been used to describe crop yield based on weatherparameters. In most statistical approaches, regressions are obtained correlating envi-ronmental variables and yield. The main problems with statistical approaches arethat yield is more complex than growth simulation and that there is little confidencein extrapolating the results beyond the original limits of the data-sets. On the otherhand, in using mechanistic approaches, difficult arises from numerous assumptions.Intermediate approaches between statistical and complex models are to use sim-plified mechanistic models which define crop behaviour by only few relationships(Bindi et al., 1997).
Agrometeorological stations can provide data to feed crop yield simulators. Thequality of agrometeorological variables is the basis for a precise simulation and con-sequently for the processing of information that meets the needs of the end-users.However, ground weather stations often fail to satisfy these quality standards, bothin terms of accuracy and precision of measured data and of spatial and temporalrepresentativeness (WMO, 1981). The implementation of networks of weather sta-tions could partly solve these problems, but would involve high installation andmaintenance costs (Vose and Menne, 2004).
Moreover meteorological observations do not inform us about the state of thelocal atmosphere unless we know how the observations were made – the instrument,its installation height and exposure, used sampling and averaging times – and theway in which the measurements were processed. Specifications of all these links ofthe observation chain are called metadata, and their availability determines the valueof measurements. Unfortunately they are not commonly available, making the use ofstation data unable to provide a realistic description of crop responses, particularlyfor application at meso or macroscale level.
The internet has increasingly been used to disseminate climate and meteorolog-ical data, given its rapid manipulation and displays of information, the interactionand feedback with the users, and the reduction of cost. The internet allows for find-ing suitable applications providing free access to meteorological information withdifferent spatial domains and temporal resolutions.
Besides common meteorological information supplied by local or synopticweather stations, the use of large-scale climatic variables has also been investigated

Impacts of the NAO on Mediterranean Crop Production 105
in order to forecast agricultural yields and production quality in several regionsof the world (Atkinson et al., 2005). Among these indices that identify the large-scale distribution of pressures and temperatures over defined geographical areas,the North Atlantic Oscillation (NAO) is one of the most studied due to its significantimpact on the climate over important production regions worldwide (Tables 1 and 2).In Spain, Gimeno et al. (2002) found that the yield of many crops (lemon, orange,tangerine, wheat, rye and olive) is affected by NAO, while in Italy the effect ofNAO was related to the phenology of grapevine (Dalla Marta et al., 2010a) andquality of wine (Grifoni et al., 2006). Many studies demonstrated a relationshipbetween the wheat yield and grain quality (Hagber falling number, specific weightand protein concentration) and the winter NAO in Italy (Dalla Marta et al., 2010b),Portugal (Gouveia and Trigo, 2008) and UK (Kettlewell et al., 1999; Wanner et al.,2001; Hurrell et al., 2003; Atkinson et al., 2005, 2008). According to Kettlewellet al. (2003) the winter NAO has an effect on cumulated precipitation in summer inEngland and Wales and, consequently, on wheat quality, while Colman (1997) sug-gested an association between Sea Surface Temperature (SST) and NAO in the UK.
Large-scale climate variability affects average conditions considerably and istherefore likely to influence the phenology of plants. In Europe, the North AtlanticOscillation (NAO) seems to be responsible for a large component of climate vari-ability (Post and Stenseth, 1999; Benestad, 2001; Wanner et al., 2001; Sivle, 2005),particularly influencing winter weather and, through climate interactions on plants,flowering time of many tree species (Klaveness and Wielgolaski, 1996; Gormsenet al., 2005; Avolio et al., 2008).
At the same time, winter meteorological conditions play an important role inprocesses controlling the termination of dormancy and bud-break, strongly affectingthe onset of the growing season, spring flowering phenophases and pollen season ofdifferent woody plants in North and southern Europe (Fitter et al., 1995; Klavenessand Wielgolaski, 1996; D’Odorico et al., 2002; Gormsen et al., 2005; Avolio et al.,2008; Nordli et al., 2008).
Table 1 Example of NAO effect on vegetation, forest and trees
Ecologicaldescriptor Parameter Correlation Period Variable affected References
Europevegetation
Timing of springphenology
Negative Jan–Mar Temperature,precipitation
D’Odorico et al.(2002)
Europevegetation
Timing ofphenology
Negative Winter Temperature,precipitation
Gouveia et al. (2008)
Europeforests
Timing ofphenology
Negative N.A. Temperature Cook et al. (2005)
Norwaytrees
Timing ofphenology
Negative Winter Temperature Post et al. (1999)
Norwaytrees
Timing ofphenology
Negative Winter Temperature Nordli et al. (2008)
Germanytrees
Timing of spring/summerphenology
Negative Jan–MarFeb–Mar
Temperature Menzel (2003)

106 S. Orlandini et al.
Table 2 Example of NAO effect on crop responses
Ecologicaldescriptor Parameter Effect Period Variable affected References
Spain wheat,orange,lemon
Yield Positive Yearly Temperature,precipitation
Gimeno et al.(2002)
Portugal wheat Yield N.A. Feb–Mar Temperature,precipitation
Gouveia et al.(2008)
UK wheat Quality (specificweight)
Positive Winter Radiation,precipitation
Atkinson et al.(2005)
UK wheat Quality (specificweight)
Positive Jan Radiation,precipitation
Atkinson et al.(2008)
UK wheat Quality (specificweight,protein)
Positive Jan–Feb Radiation,temperature
Kettlewell et al.(1999)
UK wheat Quality (specificweight)
Positive Winter Summerprecipitation
Kettlewell et al.(2003)
Italy durumwheat
Quality (proteincontent)
Positive Nov–Feb Winterprecipitation
Dalla Marta et al.(2010b)
Italy grapevine Timing ofphenology
Negative Feb–Mar Radiation andtemperature
Dalla Marta et al.(2010a)
Italy grapevine Quality (rating) Negative Apr–Jul Temperature,precipitation
Grifoni et al.(2006)
Italy olives Pollen season Negative Mar–Jun Temperature Avolio et al.(2008)
1.1 Objectives
The main objective of this chapter was to analyze the correlations between NAOindex (Jones et al., 1997) and several Italian crop productions. Different case studieswere considered, all taking into consideration high quality Mediterranean crops,such as wheat and grapevine. Local ground weather stations data were also analysed,to compare obtained results by using large scale indices. Different temporal scaleswere compared in order to propose a crop response analysis and forecasting methodbased on meteorological conditions observed several months before harvest. Resultsare discussed with the aim of evaluating the possibility of assessing crop productionwith the freely available data, solving the problems related to the use of groundweather stations.
2 Results
2.1 NAO and Grapevine Phenology
In this study, data series of phenological stages of Sangiovese grapevine wereanalysed for the productive area of Montepulciano wine. Bud-break (1979–2006),

Impacts of the NAO on Mediterranean Crop Production 107
flowering and harvest (1970–2006) dates were used for the analysis and related tothe NAO index. The phenology is the scientific study of periodic biological phenom-ena such as flowering, breeding, and migration in relation to climatic conditions.Phenological data, expressed as the day of the year in which the phenological stage(bud-break, flowering, fruit set, etc.) was reached (Balloid and Baggiolini, 1993),were collected by skilled field operators and considered as the mean value of 20vines.
Bud-break date was negatively correlated with NAO index for February(r = –0.402, p ≤ 0.05) and for the period February–March (r = –0.377, p ≤ 0.05)(Fig. 1), even if the month of March did not show a significant correlation whenconsidered independently.
The negative correlation between February and March NAO index and bud-breakdata was due to the relation between NAO and weather conditions in the wine pro-duction area at the beginning of the grapevine vegetative season. Winter and earlyspring NAO has a strong and well-documented effect on precipitation and conse-quently on the cloudiness of the same period. The role of NAO, therefore, could bemainly due to a reduction in cloud cover and consequently greater insolation thanaverage for the positive NAO index phase. Greater sunshine probably leads to anincreased surface temperature and thus the heat requirement for various stages ofplant development could be reached earlier (Avolio et al., 2008).
Flowering of grapevine in the study area usually occurs between mid-May andearly June. The NAO index of single months showed no correlation with floweringstage (data not shown) but a significant negative correlation was found between theNAO index for February–March (r = –0.397, p ≤ 0.05) (Fig. 2) and the pheno-logical stage date. The effect of winter NAO on flowering stage was probably anindirect result beginning at the bud-break stage. In fact, the effect of NAO on mete-orological conditions is strong during winter and decreases in the spring and earlysummer months. However, the two stages of bud-break and flowering are partially
Fig. 1 Linear correlation between NAO index of the period February–March and grapevine bud-break phase date

108 S. Orlandini et al.
Fig. 2 Linear correlation between NAO index of the period February–March and grapevineflowering phase date
auto-correlated and the period in between is mainly determined by a thermal sum-mation. Therefore, the anticipation of bud-break due to high values of winter NAOalso has the indirect effect of anticipating flowering in late spring.
Harvest is usually conducted from mid-September to mid-October, depending ondifferent environmental and physiological factors. The NAO index did not signifi-cantly affect harvest date, confirming that its effect on meteorological conditions isreally evident in winter and, less strongly, in early spring.
2.2 NAO and Wheat Quality
The research was carried in Val d’Orcia (Siena, Italy) where durum wheat is con-sidered an important quality production with a cultivated area of almost 135,000 ha,about 15% of the total cultivated surface. The quality of durum wheat grain wasdescribed by its protein content, expressed as the percentage of dry matter, due to itsdirect relation with the production of good quality pasta. Data were analyzed for theperiod 1997–2009. These results are not as robust as those obtained in the previoussection due to the short time-series available (13-year), but the wheat quality waspositively correlated with the NAO index for several months, in particular during thewinter period. The higher correlations on a monthly basis were found for November(r = 0.580, p ≤ 0.05) and February (r = 0.546, p ≤ 0.05), but more significantresults were obtained by aggregating NAO index on a multi-monthly basis whenNovember and February are included. In particular, the best correlation was obtainedfor the November–February period (r = 0.845, p ≤ 0.001) (Fig. 3) due to the con-tribution of the 2 months in between that are not significantly, but still positively,correlated to the final grain protein content. This result can be explained by thewinter NAO index defining a specific atmospheric synoptic configuration over theAtlantic Ocean, strongly affecting winter precipitation over the Mediterranean seaand consequently over the study area (Hurrell and Van Loon, 1997; Bartolini et al.,

Impacts of the NAO on Mediterranean Crop Production 109
Fig. 3 Linear correlation between NAO index of the period November–February and durum wheatquality
2009). In turn, winter precipitation is negatively correlated with protein content. Thenegative effect of rainfall on grain quality is probably related to problems concerningcrop management. In fact, abundant precipitations in November can create seriousproblems for field operations, even causing a significant delay in the sowing date.Nevertheless, even if wheat can be sown in time, a too high soil water content maygive rise to asphyxia phenomena leading to further problems during crop develop-ment. Moreover, the negative effect of rainfall may be due to the losses of nitrogenapplied with fertilization. Anyway, wheat protein resulted slightly more correlatedwith the NAO index than with cumulated precipitation, probably because the for-mer is able to better describe the environmental conditions (being a consequence ofatmospheric circulation) rather than just the precipitation.
To investigate the effect of NAO and common meteorological variables as awhole, a stepwise linear multiple regression analysis was performed. The model,based on an automatic procedure of variable inclusion/exclusion (p ≤ 0.05 andp ≥ 0.10 respectively), was tested by using the multi-monthly period for which thebest correlation coefficients were obtained for each single meteorological variable.In particular, the variables used were February–June air temperature (r = 0.609,p ≤ 0.05), November–May precipitations (r = 0.732, p ≤ 0.01) and November–February NAO (r = 0.845, p ≤ 0.001). Within the stepwise regression results, thesimplest model was obtained using NAO index (r = 0.845, p ≤ 0.001), while precip-itation and air temperature were excluded since their addition to the model failed toimprove its performance. This result is consistent with the previous considerationsconcerning the dependence of these variables on NAO, which already contains theirpartial contribution to the determination of wheat quality.
2.3 NAO and Wine Quality
This case study analyzed the relationships between NAO index and the qualityof different important Italian wines for the period 1970–2002. The quality data

110 S. Orlandini et al.
Fig. 4 Linear correlation between NAO index of the period April–July and Italian wine quality
series of the following six wines were used: Brunello di Montalcino, Nobile diMontepulciano and Chianti Classico (Tuscany region, central Italy), Barolo andBarbaresco (Piedmont region, north-western Italy), and Amarone (Veneto region,north-eastern Italy). Vintage ratings were used to define wine quality ranking. Therating of a given vintage is conducted in a single blind tasting of the individualvarietals by a panel of experts. Although this rating does not consider variations inquality among the individual vineyards, it is the most comprehensive overall ratingcompiled for high-quality Italian wines (Corsi and Ashenfelter, 2001). This analysisallows for verifying whether the wine meets market expectations and represents acomposite of all the quality elements of the wine. In production area, this rankingis based upon the collection of estimates from 1 to 5 classes (from insufficient toexcellent) (Riou, 1994). The relationships between quality data of wines and NAOindex were investigated through regression analysis on monthly and multi-monthlybases.
Wine quality rankings were inversely correlated with the NAO Index of sev-eral previous months (included in the growing season) and in particular, the highernegative correlations were obtained for April (r = –0.439, p ≤ 0.05) and May(r = –0.359, p ≤ 0.05).
More significant results were obtained by developing regression of the wine qual-ity versus NAO Index aggregated on a multi-monthly basis including April and May.The best result, for some selected aggregations, was obtained for the April–Julyperiod (r = 0.607, p ≤ 0.001) (Fig. 4). These results could be explained by the factthat the NAO index defines a specific atmospheric synoptic configuration over theAtlantic Ocean, affecting the regional rainfall and air temperature.
3 Conclusions
Obtained results are useful for agricultural communities when used to modify man-agement decisions and to adopt practices that are better adapted to the expected

Impacts of the NAO on Mediterranean Crop Production 111
conditions. However the possible use of seasonal climate information for agri-cultural aims has been slower than expected for a number of reasons. The mostsignificant is that the deterministic information requested by the farmers is beyondthat elaborated by the NAO and other indices (ENSO, AO, etc.). As an example, thequality of short term forecast is not comparable with the information available fromseasonal index. Recent development, however, provide some evidence of progresstoward meeting user needs and forecast capabilities. This is due to the considera-tion that reliable sources of daily rainfall and temperature data are becoming morewidely available for many parts of the world. Secondly, climate scientists are begin-ning to use these data to examine the observed statistics of climatic variables overthe course of the season and how these statistics influence climatic indices. Further,investigations are being initiated to examine the ability of numerical weather modelsto replicate these statistics in analyses and forecasts (Baethgen et al., 2009).
Acknowledgements The authors wish to thank Fondazione Monte dei Paschi di Siena, ConsorzioAgrario di Siena and COST734 Action for their support of this research.
References
Atkinson MD, Kettlewell PS, Hollins PD, Stephenson DB, Hardwik NV (2005) Summer climatemediates UK wheat quality response to winter North Atlantic Oscillation. Agri Forest Meteorol130:27–37
Atkinson MD, Kettlewell PS, Poulton PR, Hollins PD (2008) Grain quality in the Broadbalk WheatExperiment and the winter North Atlantic Oscillation. J Agric Sci 146:541–549
Avolio E, Pasqualoni L, Federico S, Fornaciari M, Bonofiglio T, Orlandi F, Bellocci C, RomanoB (2008) Correlation between large-scale atmospheric fields and the olive pollen season inCentral Italy. Int J Biometeorol 52:787–796
Baethgen WE, Carriquiry M, Ropelewski C (2009) Tilting the odds in maize yields. Bull AmMeteorol Soc 2:179–183
Balloid M, Baggiolini M (1993) Les stades repères de la vigne. Revue Suisse de ViticultureArboriculture Horticulture 25:7–9
Bartolini E, Claps P, D’Odorico P (2009) Interannual variability of winter precipitation in theEuropean Alps: relations with the North Atlantic Oscillation. Hydrol Earth Syst Sci 13:17–25
Benestad RE (2001) The cause of warming over Norway in the ECHAM4/OPYC3 GHGintegration. Int J Climatol 21:371–387
Bindi M, Miglietta F, Gozzini B, Orlandini S, Seghi L (1997) A simple model for simulation ofgrowth and development in grapevine (Vitis vinifera L.). I Model description. Vitis 36:67–71
Colman A (1997) Prediction of summer central England temperature from preceding NorthAtlantic winter sea surface temperature. Int J Climatol 17:1285–1300
Cook BI, Smith TM, Mann ME (2005) The North Atlantic Oscillation and regional phenologyprediction over Europe. Glob Change Biol 11:919–926
Corsi A, Ashenfelter O (2001) Predicting Italian wines quality from weather data and experts’ratings, 18 pp. Cahier Scientifique de l’OCVE, n 4
Dalla Marta A, Grifoni D, Mancini M, Storchi P, Zipoli G, Orlandini S (2010a) Analysis of the rela-tionships between climate variability and grapevine phenology in the Nobile di Montepulcianowine production area. J Agric Sci 148:657–666
Dalla Marta A, Grifoni D, Mancini M, Zipoli G, Orlandini S (2010b) The influence of climate ondurum wheat quality in Tuscany, Central Italy. Int J Biometeorol 55:87–96
D’Odorico P, Yoo JC, Jaeger S (2002) Changing seasons: an effect of the North AtlanticOscillation? J Clim 15:435–445

112 S. Orlandini et al.
Fitter AH, Fitter RSR, Harris ITB, Williamson MH (1995) Relationship between first floweringdate and temperature in the flora of a locality in Central England. Funct Ecol 9:55–60
Gimeno L, Ribera P, Iglesias R, de la Torre L, Garcia R, Hernandez E (2002) Identification ofempirical relationships between indices of ENSO and NAO and agricultural yields in Spain.Clim Res 21:165–172
Gormsen AK, Hense A, Toldam-Andersen TB, Braun P (2005) Large-scale climate variability andits effects on mean temperature and flowering time of Prunus and Betula in Denmark. TheorAppl Climatol 82:41–50
Gouveia C, Trigo RM (2008) Influence of climate variability on wheat production in Portugal. In:Soares A, Pereira MJ, Dimitrakopoulos R (eds) geoENV VI – geostatistics for environmentalapplications. Springer, Berlin, pp 335–345
Gouveia C, Trigo RM, Da Camara CC, Libonati R, Pereira JMC (2008) The North AtlanticOscillation and European vegetation dynamics. Int J Climatol 28:1835–1847
Grifoni D, Mancini M, Maracchi G, Orlandini S, Zipoli G (2006) Analysis of Italian wine qualityusing freely available meteorological information. Am J Enol Vitic 57:339–346
Hurrell JW, Kushnir Y, Ottersen G, Visbeck M (eds) (2003) The North Atlantic Oscillation: cli-matic significance and environmental impact. Geophys Monogr 134:1–35. Copyright 2003 bythe American Geophysical Union 10.1029/134GM01
Hurrell JW, Van Loon H (1997) Decadal variations in climate associated with the North AtlanticOscillation. Clim Change 36:301–326
Jones PD, Jonsson T, Wheeler D (1997) Extension to the North Atlantic Oscillation using earlyinstrumental pressure observations from Gibraltar and South-West Iceland. Int J Climatol17:1433–1450
Kettlewell PS, Sothern RB, Koukkari WLJ (1999) U.K. wheat quality and economic value aredependent on the North Atlantic Oscillation. J Cereal Sci 29:205–209
Kettlewell PS, Stephenson DB, Atkinson MD, Hollins PD (2003) Summer rainfall and wheat grainquality: relationships with the North Atlantic Oscillation. Weather 58:155–164
Klaveness D, Wielgolaski FE (1996) Plant phenology in Norway – a summary of past and presentfirst flowering dates (FFDs) with emphasis on conditions within three different areas. PhenolSeason 1:47–61
Menzel A (2003) Plant phenological anomalies in Germany and their relation to air temperatureand NAO. Clim Change 57:243–263
Nordli Ø, Wielgolaski FE, Bakken AK, Hjeltnes SH, Måge F, Sivle A, Skre O (2008) Regionaltrends for bud burst and flowering of woody plants in Norway as related to climate change. IntJ Biometeorol 52:625–639
Post E, Stenseth NC (1999) Climatic variability, plant phenology, and northern ungulates. Ecology80:1322–1339
Riou C (1994) The effect of climate on grape ripening: application to the zoning of sugar contentin the European Community. European Commission, Brussels, 319 pp
Sivle A (2005) Climatic oscillations in the period 1910–2004 (in Norwegian). GeophysicalInstitute, University of Bergen, Bergen
Vose RS, Menne MJ (2004) A method to determine station density requirements for climateobserving networks. J Clim 17:2961–2971
Wanner H, Bronnimann S, Casty C, Gyalistras D, Luterbacher J, Schmutz C, Stephenson DB,Xoplaki E (2001) North Atlantic Oscillation – concepts and studies. Surv Geophys 22:321–381
World Meteorological Organization (1981) Guide to agricultural meteorological practices, 2ndedn. Secretariat of World Meteorological Organization, Geneva
The Impacts of the NAO on the VegetationActivity in Iberia
Célia Gouveia and Ricardo M. Trigo
Abstract The present study analyses the relation between North AtlanticOscillation (NAO) and satellite-based measures of vegetation dynamics (as obtainedusing Normalized Difference Vegetation Index, NDVI), carbon absorption by livingplants (obtained by Net Primary Production, NPP estimates) over Iberian Peninsulaand wheat yield in Portugal. There is a strong evidence that positive (negative) val-ues of winter NAO induce low (high) vegetation activity in the following spring andsummer seasons. Consequently, significant correlations patterns between NAO andNPP were also obtained, identifying a negative impact in spring and summer oversouthern Iberia. These features are mainly associated with the impact of NAO onwinter precipitation, together with the strong dependence of the spring and summervegetation activity on water availability during the previous winter. The differentrole played by NAO along the vegetative cycle of wheat yield in Portugal is alsoassessed and results obtained suggest using spring NDVI together with NAO inApril and June to build up a simple model of wheat yield in Portugal. Results revealto be satisfactory and are expect to be useful to estimate crop production and toperform agricultural monitoring.
Keywords NAO · Vegetation activity · NDVI · NPP · Wheat yield
1 Introduction
Recent global changes in vegetation dynamics have been continuously moni-tored from space and, additionally, significant connections with changes of surfaceclimatic variables, such as temperature and precipitation, have been established(Myneni et al., 1997; Zhou et al., 2001; Nemani et al., 2003). In particular, theobserved increment in temperature during spring and autumn over high latituderegions of the Northern Hemisphere leads to higher photosynthetic activity andlarger growing seasons (Groisman et al., 1994; Boagert et al., 2002; Shabanov
C. Gouveia (B)Faculty of Sciences, Instituto Dom Luiz (IDL), University of Lisbon, Lisbon,Portugal; EST, Polytechnic Institute of Setubal, Setúbal, Portugale-mail: [email protected]
113S.M. Vicente-Serrano, R.M. Trigo (eds.), Hydrological, Socioeconomicand Ecological Impacts of the North Atlantic Oscillation in the Mediterranean Region,Advances in Global Change Research 46, DOI 10.1007/978-94-007-1372-7_9,C© Springer Science+Business Media B.V. 2011

114 C. Gouveia and R.M. Trigo
et al., 2002). However, whereas in spring photosynthesis dominates respiration,the opposite takes place in autumn and therefore it is in spring that an increasein CO2 sequestration is expected to occur (Piao et al., 2008). Accordingly, in afuture warmer world, carbon sequestration capacity by northern hemisphere ecosys-tems may decrease faster than previously suggested due to a faster warming inautumn than in spring (Sitch et al., 2008). Nevertheless, changes in the seasonal-ity of temperature and precipitation may have distinct impacts, depending on localcharacteristics. The strong dependence of vegetation dynamics on water availabilityin the Mediterranean regions has been now widely recognized (e.g. Gouveia et al.,2009; Vicente-Serrano, 2007; Lindner et al., 2010). It has been showed that the lackof precipitation over a certain period, combined with other climatic anomalies, suchas high temperature, strong wind and low relative humidity over a particular area,may result in reduced green vegetation cover.
The above mentioned changes in the vegetation annual cycle can be detected,using satellite information, namely from observed changes in the most widely usedvegetation-related satellite variable, the Normalised Difference Vegetation Index(NDVI) (Stöckli and Vidale, 2004; Vicente-Serrano and Heredia-Laclaustra, 2004).However, there is a strong need of long term studies of the impact of atmosphericcirculation variability on vegetation greenness. In this context, special attention hasbeen devoted to study the links between vegetation dynamics and the North AtlanticOscillation (NAO). D’Odorico et al. (2002) showed that spring phenology and tim-ing of pollen season in British Isles, Poland, Norway and Sardinia are influencedby NAO, with leaf unfolding occurring later (earlier) for negative (positive) phasesof NAO. Stöckli and Vidale (2004) found that spring phenology over Europe, asobtained using AVHRR Pathfinder NDVI data, correlates well with anomalies inwinter NAO index, as well as in winter temperature. More recently, Maignan et al.(2008) showed the strong impact of NAO on the vegetation onset over a large frac-tion of Northern Europe. The pattern of the NAO control on the vegetation dynamicsis clearly apparent over a large extension of Europe revealing in general an evidentNorth–South gradient.
On a more regional context, Vicente-Serrano and Heredia-Laclaustra (2004)analysed the NAO control on Iberian vegetation productivity trends, as representedby the annual integral of monthly AVHRR Pathfinder NDVI values. The NAOimpact revealed to be stronger in southern Iberia that corresponds to areas of stableor decreasing vegetation productivity. On the other hand the NAO impact on vege-tation greenness is weaker in the north of the peninsula, over areas where significantpositive productivity trends occur. Gouveia et al. (2008) expanded the analysis onthe relationship between vegetation greenness and NAO to the entire Europe. Theauthors relate the different vegetation behaviours particularly over Iberian Peninsulaand Northeastern Europe, with a strong dependence of vegetation dynamics fromwater availability in Iberia and from winter temperature in Northeastern Europe.
Terrestrial Net Primary Production (NPP) is a measure of the amount of carbonfixed by the living plants and converted into plant biomass. Nemani et al. (2003)showed that changes in climate, related to increasing temperature and solar radi-ation, have eased several critical constrains to plant growth, leading to an upward
The Impacts of the NAO on the Vegetation Activity in Iberia 115
trend in global NPP from 1982 to 1999. However, they have also shown that NPPrespond differentially with respect to latitude to major climate events, such as vol-canic eruptions and El Niño episodes. Globally, NPP decreases during the threemajor El Niño events (particularly over tropical regions), while the decrease afterMount Pinatubo eruption was mostly restricted to northern hemisphere high lati-tudes. Recently, Zhao and Running (2010) showed that large-scale droughts havereduced NPP during the last decade, imposing a drying trend for the entire south-ern hemisphere, whereas an increased NPP can be found over the majority of thenorthern hemisphere.
Finally, climate is a key factor for the majority of agricultural systems, due totheir dependence on interannual climate variability and in particular, their vulner-ability to extreme events such as; droughts, floods and frost or hail occurrences.Important relations between regional distributions of temperature and precipitationand wheat yield for the European countries have been found (Cantelaube et al.,2004). In particular the winter NAO index has been associated with UK wheat cropand with better wheat, rye, oat and citrus yields in the Iberian Peninsula (Atkinsonet al., 2005; Gimeno et al., 2002). Although not directly related to NAO, someauthors have analysed in detail the links to climate variables that are ultimatelyrelated to this mode of variability. Iglesias and Quiroga (2007) evaluated over fivesites in Spain the effects of climate variability on the final crop. Similarly droughtindices and remote-sensed data were used to predict wheat and barley yields inthe Ebro valley (Vicente-Serrano et al., 2006). Rodríguez-Puebla et al. (2007) havederived a model that integrates the effects of abundant precipitation together withdynamic aspects of the air masses during the maturation in order evaluate theireffects on winter cereals productivity in Spain.
1.1 Objectives
Here we intend to provide a comprehensive assessment on the impact of NAO onvarious vegetation related variables, namely NDVI, NPP and crop yields. Whilesome of these analyses were initially performed for other regions in northern Europewe opted here to focus only on the western Mediterranean sector.
1.2 Data
A number of restrictions on access to different types of dataset implied slightly dis-tinct periods of analysis. The NPP monthly estimates were obtained in the frameof a Portuguese funded project entitled CARBERIAN, using the Carnegie AmesStanford Approach (CASA) terrestrial biogeochemical model (Potter et al., 1993;Friedlingstein et al., 1999) for the period 1982–1999. The CASA simulates plantand soil processes allowing the estimation of both NPP and NEP (Net EcosystemProductivity). Besides climate variables (precipitation, temperature and radiation)

116 C. Gouveia and R.M. Trigo
the model incorporates information from vegetation and land cover types usingsatellite data, as well as soil texture and soil depth (Seixas et al., 2009).
The NDVI monthly anomalies, with 8 km of spatial resolution, were obtainedfrom the Global Inventory Modeling and Mapping Studies (GIMMS) dataset. Thisdataset holds 24 values per year (i.e. twice a month) and corresponds to the mostcomplete and longest remote sensing dataset covering the entire Mediterraneanregion. In the case of the assessment of the NAO impact on vegetation dynamicswe have performed the analysis for the period 1982–2002. Finally, the evaluationof the NAO impact on Portuguese crop yields covers the period spanning between1982 and 2005.
The NAO index used in this study is based on the one developed by the ClimaticResearch Unit (CRU), which was originally defined, on a monthly basis, as thedifference between the normalized surface pressure at Gibraltar, in the southern tipof the Iberian Peninsula and Stykkisholmur, in Iceland (Jones et al., 1997). For eachyear covering the above mentioned periods, we have derived a late winter NAOindex (hereafter referred only as NAO), defined as the average of the monthly valuesfor January, February and March of the corresponding year.
2 Results
2.1 NAO and Vegetation Dynamics
Figure 1 displays the spatial patterns over Iberia of point correlation values ofwinter NAO and NDVI for spring (NDVIMAM), summer (NDVIJJA) and autumn(NDVISON) for the period between 1982 and 2002. Results show a negative correla-tion over the Iberian Peninsula in spring and summer, with some values reaching aslow as –0.8. Positive correlations are found in northern and eastern Iberia, as wellas in Murcia region in spring (values around 0.7). However in summer the positive
SPRING SUMMER AUTUMN
Fig. 1 Point correlation fields of NAO vs. NDVIMAM (left panel) and NAO vs. NDVIJJA (middlepanel) and NAO vs. NDVISON (right panel) for the period from 1982 to 2002. The colorbar iden-tifies values of correlation and the two arrows indicate the ranges that are significant at 5% level

The Impacts of the NAO on the Vegetation Activity in Iberia 117
correlations are restricted to the Murcia region. A weaker pattern of correlationsis found during autumn, presenting lower but still significant positive correlation(values around 0.4) spreading over eastern and Northern Iberia and presenting anegative pattern in Southern Iberia. These patterns are in good agreement with thoseobtained previously in the works of Buermann et al. (2003) and Vicente-Serrano andHeredia-Laclaustra (2004). This behaviour reflects the response of the annual vari-ability of meteorological variables to large-scale atmospheric variability associatedto the NAO mode, as well as the different response of vegetation to atmospheric vari-ability, namely the changes induced by temperature and precipitation in the annualcycle of heat and moisture.
It should be stressed that other factors linked to the human influence can dis-turb the relationship between atmospheric parameters and vegetation, such as thenature and quality of the plant substrate, the over-use of agriculture land and theemployment of irrigation (Gouveia et al., 2008). In order to isolate the NAO effecton vegetation dynamics, as obtained by NDVI, from factors related to the humaninfluence, we have compared the NDVI anomalies for two subsets of years associ-ated to extreme NAO indices: (i) higher than usual values of seasonal NAO index(whenever the NAO index is higher than the percentile 75 of its distribution) and(ii) lower than usual (whenever the NAO index is lower than the percentile 75 ofits distribution). Figure 2 shows a comparison of seasonal NDVI anomalies for thetwo subsets of years associated with NAO– (upper panel) and NAO+ (lower panel).In the case of spring NDVI anomalies present well defined pattern over central andwestern Iberia. The southern anomaly center is particularly intense, positive (nega-tive) anomalies being observed in spring NAO– (NAO+). The pattern is remaining in
NAO-
NAO+
SPRING SUMMER AUTUMN
Fig. 2 Seasonal anomalies of NDVI for years of NAO– (top panel) and NAO+ (bottom panel) forspring (left), summer (middle) and autumn (right)

118 C. Gouveia and R.M. Trigo
the following seasons, albeit with lower correlation values. Therefore, it means thatfor years characterised with positive winter NAO values, the vegetation is in vege-tative stress, with lower than usual NDVI values, a feature that is common duringdrought years, like the recent 2004/2005 drought event (Gouveia et al., 2009).
In fact, Gouveia et al. (2008) have found significant correlations between winterNAO and contemporaneous late winter means of surface temperature and precipi-tation. For precipitation a well-developed meridional dipolar structure over Europe,delimiting two well-defined zonal bands of positive and negative correlation valuesalong Northern Europe and Mediterranean region respectively. However it is alsoknown that the connection between NAO and temperature over Iberia is not as clear-cut as for precipitation (Castro-Díez et al., 2002; Trigo et al., 2002). Although it isknown that the impact of NAO on temperature and precipitation described above isespecially prominent in winter (e.g. Vicente-Serrano and Heredia-Laclaustra, 2004;Trigo et al., 2004), such behaviour contrasts with that obtained for vegetation activ-ity (Fig. 1), where the impact of NAO is clearly significant in spring, summerand autumn. Consequently the relationship between late winter temperature andprecipitation with vegetation greenness in the following seasons are very important.
Additionally the work of Gouveia et al. (2008) showed that almost two thirds(64%) of the pixels that exhibit the highest (lowest) values of positive (negative)correlations of NDVIMAM and NDVIJJA with NAO correspond to areas of springcrops and about one sixth (17%) to forests and shrublands. The relative proportionof the two types undergoes a significant change in summer with only 29% relativeto forest and shrubland, and an increase to 47% associated to cultivated areas. Theseresults reflect the distinct responses of the various land cover types to moisture andheat conditions prevailing during the previous winter.
The Iberian Peninsula presents the same response of vegetation to precipitationin spring and summer, i.e. an increase (decrease) of vegetation greenness for NAO–(NAO+) years. A small dependence of vegetation greenness on temperature is alsoapparent in the case of spring (Gouveia et al., 2008). Additionally, Gouveia et al.(2008) have emphasized that the impact on precipitation is three times larger overIberian Peninsula than the corresponding impact over Northern Europe. This featureis consistent with the specific dependence of NDVI on precipitation over Iberia,since vegetation growth is much more water-limited in Iberia than in NorthernEurope, where temperature and snow cover play a major role (Trigo et al., 2002;Gouveia et al., 2008).
The remarkable differences in the response of vegetation to moisture and heatconditions, lead us to analyse the NDVI annual cycle for the highest (lowest) valuesof positive (negative) correlations of NDVIMAM and NDVIJJA with NAO over Iberia.Figure 3 shows the annual cycles of NDVI monthly values for the highest (lowest)values of positive (negative) correlations of NDVIMAM and NDVIJJA with winterNAO, for spring (left panel) and summer (right panel). The annual cycles of averagesfor the NAO+ (NAO–) subsets are identified by the thin solid (dashed) curves, whilethe annual cycles of mean NDVI for the entire period (1982–2002) are representedby thick solid lines.

The Impacts of the NAO on the Vegetation Activity in Iberia 119
Fig. 3 Annual cycles of monthly values of NDVI for the highest (lowest) values of positive (nega-tive) correlations of NDVIMAM and NDVIJJA with winter NAO, for spring (left panel) and summer(right panel), over Iberia. The annual cycles of averages for the NAO+ (NAO–) subsets are iden-tified by the thin solid (dashed) curves and the annual cycles of mean NDVI for the entire period(1982–2002) are represented by thick solid lines
The highest impact of NAO is observed to occur during the periods of the yearcharacterised by more intense vegetation activity (Ji and Peters, 2003), i.e. aroundApril (June) in the case of highest correlated pixels for spring (summer). In thecase of spring vegetation, two thirds of the pixels correspond to cultivated areas thatare mostly associated to non irrigated crops, adapted to the relatively dry Iberianconditions. Vegetation has a short growth cycle, due to the generally observed hightemperatures, starting as soon as water is available. This is a typical situation thatcan be favoured by NAO–. In the case of summer, the growing period of the mostimpacted vegetation starts later and therefore the response to precipitation tends toextend late in the year (Gouveia et al., 2008).
2.2 NAO and NPP Estimates
Figure 4 displays the spatial patterns over Iberia of point correlation values of win-ter NAO (NAOJFM) and NPP for spring (NPPMAM), summer (NPPJJA) and autumn(NPPSON) for the period between 1982 and 1999. This slightly shorter period resultsfrom the limited period of available data obtained with the CASA model by our col-leagues within the CARBERIAN project that started in the early 2000s. Resultsshow a negative correlation between NAO and NPP over the Iberian Peninsula inspring and summer, with values as low as –0.7 (Fig. 4, top panel). Positive cor-relations are found in northern and eastern Iberia and Northwestern Portugal. Thehighest positive correlations (values around 0.6) are found in Pyrenees and in coastalMediterranean region of Murcia in spring. However in summer the positive corre-lations are mostly restricted to the Murcia region. A weaker pattern of correlationsis found during autumn, presenting lower but still significant positive correlation(values around 0.4) spreading over eastern and Northern Iberia, Murcia region andsouthern Portugal. Interesting to notice the strong pattern of negative correlationslocated in the Southern interior of Iberia.

120 C. Gouveia and R.M. Trigo
NPPMAM NPPJJA NPPSON
PrecJFM PreMAM PrecJJA
RadJFM RadMAM RadJJA
SPRING SUMMER AUTUMN
Fig. 4 Correlation fields of NAO vs. NPP, for spring (left panel), summer (middle panel) andautumn (right panel) over the period from 1982 to 1999 (top panel) and NAO vs. Precipitation(middle panel) and NAO vs. short wave radiation (bottom panel), for winter (left panel), spring(middle panel) and summer (right panel) over the period from 1982 to 1999
The impact of NAO in the previous winter, as well as in spring and summer inprecipitation and short wave radiation is also provided in Fig. 4 (middle and bottompanels, respectively). As expected the negative pattern of correlations between NAOand NPP in spring is highly related to the corresponding impact of NAO on winterprecipitation and short wave radiation. Thus, during the years characterised with apositive NAO mode in winter, lower precipitation and higher short-wave radiation(and fewer clouds) can be observed in the central Iberia, corresponding to lowerNPP estimates. These results are in good agreement with the works of Nemani et al.(2003) and Zhao and Running (2010). This behaviour reflects the response of short-rooted grassland and croplands characteristic of the northern mid-latitudes, wherewater availability is a dominant control for plant growth. Accordingly to the analysis

The Impacts of the NAO on the Vegetation Activity in Iberia 121
undertaken by the above mentioned authors, NPP has a significant positive correla-tion with both total precipitation and Palmer Drought Severity Index (PDSI), whichmeans that higher precipitation values and consequently lowers than usual NAOvalues, usually lead to higher NPP estimates. This result is compatible with the neg-ative values of correlations between winter NAO and NPP that are prevailing duringspring, summer and autumn. The exceptions for this behaviour are the forest areastypical over the Northwestern Iberia and higher altitude mountains in Pyrenees, thatare more insensitive to precipitation and temperature and also the Murcia regionwhere the NAO plays a negligible role.
The above mentioned differences in the response of vegetation to moisture andheat conditions prompted the analysis of the evolution (for NAO+ and NAO–) ofNPP annual cycles for two sites over Iberia, used to calibrate and validate the CASAModel over Iberia (Seixas et al., 2009). Figure 5 (left panel) shows the annual cyclesof monthly NPP for the above selected sites. The two selected sites correspond totwo contrasting situations; one site being characterised mainly by negative correla-tion between NAO and NPP estimates located in the south of Iberia (site 1 in Fig. 5,top panel) while the other is characterised by positive correlations located in theNorth of Iberia (site 2 in Fig. 5, bottom panel). Moreover, while site 1 presents amaximum of NPP estimates during spring and site 2 corresponds to pixels with amaximum of NPP estimates during summer. Figure 5 (left panel) shows the annualcycles of NPP monthly anomalies for the above selected sites.
Fig. 5 Left panel: Annual cycles of monthly NPP estimates for site 1 located in the south of Iberia(top panel) and a site 2 located in the north of Iberia (bottom panel). Right panel: correspondingannual cycles of monthly anomalies of NPP estimates for the NAO– (thin solid line) and NAO+(thin dashed line) subsets over site 1 (top panel) and site 2 (bottom panel)

122 C. Gouveia and R.M. Trigo
The annual cycles of NPP anomalies for the NAO– (NAO+) subsets are identifiedby the thin solid (dashed) curves. The highest impact of NAO is observed to occurduring spring and also in summer in the case of site 2. Differences in topographyshould be taken into account, as site 1 corresponds to low altitude areas while site 2is located in a mountainous region. Moreover there are disparities in the main vege-tation type characteristic of these sites; while site 1 are mainly grasses, cereal crops,site 2 is dominated by needleleaf forest. During years characterized by positive win-ter NAO, NPP estimates present low values during spring over site 1. This situationcorresponds to years with considerably lower (higher) than usual precipitation (shortwave radiation) that may inhibit the vegetation greenness and consequently low NPPestimates. This is the typical situation during drought events (García-Herrera et al.,2007). In the case of mountainous areas (site 2) where the vegetation activity is notdependent of the scarcity of water in part due to the lower temperature, the NPPestimates are relatively high during spring and even during summer although withrelatively lower values than in spring. These features are in good agreement withthe previously mentioned authors that related the climate variability and the carbonabsorption from living plants (Nemani et al., 2003; Zhao and Running, 2010).
2.3 NAO and Wheat Yield
In order to quantify the climate impact on the wheat yield in Portugal it must bestressed that it is considerably smaller than the corresponding wheat yield obtainedin the North-western European countries, with cold (but not too wet) winters andrelatively wet summers (Gouveia and Trigo, 2008). During the grain filling until thecomplete grain ripening phase, the Mediterranean conditions may even get worse,due to the short period of time between frost episodes and relatively high temper-atures at the end of spring (May/June). Another adverse situation, especially whencompared with the same period for North-western European countries, consists inthe low photoperiod (number of sun hours) and the high temperatures, which mayoccur at the end of the maturation phase. During this phase large values of potentialevapotranspiration may lead to weak photosynthetic activity, since the plant mostlyspends most of energy in the transpiration process in order to offset the warm seasoneffects, thus reducing its capacity to produce dry matter. An excess of evapotran-spiration may therefore lead to a decrease of wheat quality (Gouveia and Trigo,2008).
In order to evaluate the seasonal evolution of the correlation between NAO andwheat yield we have performed a monthly evaluation (Table 1) reflecting the dif-ferent role played by NAO along the vegetative cycle of wheat. In fact, the contrastbetween late winter/early spring and late spring/early summer is well apparent, withlow correlations between NAO and yield in January to March being replaced by pos-itive correlations for April and June (the last one significant at the 5% level). Therole of NAO in June appears to be related to the need of warm temperatures duringthe wheat maturation phase, and simultaneously the absence of precipitation.

The Impacts of the NAO on the Vegetation Activity in Iberia 123
Table 1 Correlation coefficient values between annual wheat yield and monthly NAO (fromJanuary to June) for the pixels coded as arable land not irrigated. Bold values highlighted whensignificant at the 5% level
Jan Feb Mar Apr May Jun
NAO 0.06 0.08 –0.04 0.27 –0.06 0.53
The first and simplest assessment on the NAO effective impact on wheat pro-duction is shown in Fig. 6 (top panel) that depicts the inter-annual evolution of theNAO during April and June (NAOAJ) and detrended wheat yield, considering the24 year period between 1982 and 2005, presenting a correlation value of 0.49. Withthe aim of isolating the effect NAO on annual wheat yield from human-related fac-tors we adopted the methodology described in Section 2.1, comparing the detrendedwheat yield for two subsets of years associated to extreme NAO indices: (i) higherthan usual values of seasonal NAO index (NAO > percentile 75) and (ii) lower thanusual (NAO lower than percentile 25). Figure 6 (lower panel) shows a compari-son of annual wheat yield for the three subsets of years associated with NAO+,NAO– and intermediate class. Generally speaking, years presenting positive (nega-tive) anomalies for wheat yield are usually characterized by positive (negative) NAOindex values in late spring. Therefore, it is possible to confirm that late spring cor-respond to an important moment for the wheat vegetative cycle in Portugal and thatthe NAO index controls, at least partially, what is happening in this moment of thevegetative cycle.
Fig. 6 Top panel: Inter-annual variability of spring NAO Index (dashed line) and wheat yieldover the period 1982–2005. Bottom panel: Inter-annual evolution of annual wheat yield for yearscharacterised by NAOAJ+, NAOAJ– and intermediate subsets

124 C. Gouveia and R.M. Trigo
In summary, a good wheat yield usually corresponds to years characterized bypositive NAO values in spring, particularly in April and June. This behaviour maybe viewed as reflecting the integrated impact on radiation, temperature and precip-itation fields of the large scale atmospheric circulation patterns associated to thedifferent phases of NAO. The role of NAO in June could be especially related to thenecessity of warm temperatures during the maturation phase of wheat.
Figure 7 (left panel) shows the grid point correlations between spring NDVIcomposites (NDVIMAM) and detrended wheat yield, considering the 24 year periodbetween 1982 and 2005. The highest positive and significant correlations (at the 1%level) are found over the southern region of Alentejo (Fig. 7, left panel). The analy-sis was restricted to the set of pixels that were coded, using Corine Land Cover Map(CLC2000) as non irrigated arable land. The average of spring NDVI for this sub-set of pixels holds a correlation value of 0.70 (significant at the 1% level). Resultsobtained above suggest using spring NDVI together with late spring NAO to buildup a simple model of wheat yield for Portugal for the period 1982–2005. SpringNDVI is an indicator of the healthiness of wheat during the growing stage whichin turn reflects the meteorological conditions in terms of radiation, temperature and
Fig. 7 Left panel: Patterns of simple correlation between spring NDVI composites and wheat yieldin Portugal, for the period of 1982–2005, for pixels coded as arable land non-irrigated and signif-icant at the 1% level. Right panel: Time series (1982–2005) of observed (dark curve) wheat yieldin Portugal and of corresponding modelled values (dashed curve) when using a linear regressionmodel based on spring NDVI and NAO in April and June (upper panel). Time series (1982–2005)of residuals and respective 95% level confidence intervals (central panel). Time series (1982–2005)of observed (dark curve) wheat yield in Portugal and of corresponding modelled values (dashedcurve) as obtained from the leave-one-out cross-validation procedure

The Impacts of the NAO on the Vegetation Activity in Iberia 125
precipitation regimes. On the other hand late spring NAO is an indicator of the large-scale circulation affecting Portugal which in turn is related to regional conditions interms of radiation, temperature and precipitation that have an important role in thewheat maturation process.
In fact a simple multi-linear regression model was calibrated and validated for the24-year period of available data, using as predictors the spring NDVIMAM togetherwith NAOAJ. Figure 7 (right-upper panel) presents the time series of observed andmodeled wheat yield. The overall agreement is worth being noted, with the twotime-series presenting a correlation of 0.73. Figure 7 (right-central panel) showsthe time series of residuals, defined as departures of observed values from mod-eled ones. The 95% confidence intervals relative to these residuals are plotted aserror bars and it may be noted that there is not presenting any outlier since its errorbar does not cross the zero reference line. Simple calibration approaches, using theentire period of available data, can lead to misleading results, namely over-fitting(Wilks, 2006). Therefore it is advisable to use more robust validation approaches,such as the leave-one-out cross validation (Fig. 7, right-lower panel). The goodagreement between the modelled time series by the regression model (upper panel)and the one obtained by the cross validation indicate that the developed model isrelatively robust with only a slight decrease (from 0.73 to 0.66) on the correlationbetween original and modelled time series. In summary, these results are statisticallyrobust but also physically sound, revealing a very satisfactory performance and areexpect to be useful to estimate crop production as well as to perform agriculturalmonitoring.
3 Conclusions
The behaviour of vegetation reflects the different response of surface climate tolarge-scale atmospheric variability associated to the NAO mode. Over Iberia there isstrong evidence that positive (negative) values of winter NAO induce low (high) veg-etation activity in the following spring and summer seasons. This feature is mainlyassociated with the impact of NAO on winter precipitation, together with the strongdependence of spring and summer NDVI on contemporary water availability. It isalso related with the strong impact of climate variability in semi-arid areas, namelyregarding effects of drought conditions on vegetation activity (Vicente-Serrano andHeredia-Laclaustra, 2004), in particular during the intense spring vegetation growthperiod.
In Iberia the NAO impact is greater on non-forested vegetation which respondsrapidly to spatio-temporal variations in precipitation and soil moisture. During sum-mer, forests and other dense vegetation areas display the highest sensitivity to NAOdynamics, as this type of vegetation shows slower response to precipitation, andtherefore the NAO impacts are delayed until late in the year. Consequently, the NAOimpact negatively on NPP estimates in southern and central Iberia and positivelyover the Northern mountainous areas. In fact, in Iberia the NAO impacts negativelythe short-rooted grassland and croplands which responds rapidly to spatio-temporal

126 C. Gouveia and R.M. Trigo
variations in precipitation and soil moisture. This type of vegetation is very sensitiveto drought events.
It should be stressed that our lagged relationships between winter NAO andNDVI values for spring, summer and autumn already represent an added valuesince they allow formulating, by the end of March, simple outlooks of vegetationgreenness for certain land cover types over the Iberian Peninsula that may provideuseful information for a wide range of applications, including long-lead wildfire riskassessment and crop forecasts. It is within this context that we have evaluated theimpact of NAO on cereal production over a specific region of Iberia with sufficientdata. Accordingly, a strong negative correlation (range from 0.6 to 0.8) betweenNDVI and wheat yield for the 24 year-long period 1982–2005, over the southernpart of Portugal (Alentejo) was obtained. A good year for wheat yield is usuallycharacterized by positive NAO values for late spring. To obtain a good wheat yield,the NAO index signal in late spring should be positive, inducing higher values ofshort wave radiation and lower values of precipitation in the Iberian Peninsula. Thelow precipitation wheat requirements in this period allow a slow maturation to ori-gin well formed grains and avoid the pests development and potential decrease ofthe wheat quality as mentioned before.
Acknowledgements This work was supported by the Portuguese Science Foundation (FCT)through project ENAC (Evolution of North Atlantic Climate; the role of Blocking and Storm-tracks in the Past, Present and Future climate of Southern Europe) PTDC/AAC-CLI/103567/2008.The authors would like to thank J. Seixas and N. Carvalhais for the NPP dataset derived in theframe of CARBERIAN project. The wheat yield was provided by Portuguese Statistical Institute(INE). The NDVI dataset was kindly supplied by Global Inventory Modeling and Mapping Studies(GIMMS, http://glcf.umiacs.umd.edu/data/gimms/) project.
References
Atkinson MD, Kettlewell PS, Hollins PD, Stephenson DB, Hardwick NV (2005) Summer climatemediates UK wheat quality response to winter North Atlantic Oscillation. Agri Forest Meteorol130:27–37
Bogaert J, Zhou L, Tucker CJ, Myneni RB, Ceulemans R (2002) Evidence for a persistent andextensive greening trend in Eurasia inferred from satellite vegetation index data. J GeophysRes 107:4119. doi:10.1029/2001JD00107
Buermann W, Anderson B, Tucker CJ, Dickinson RE, Lucht W, Potter CS, Myneni RB (2003)Interannual covariability in Northern Hemisphere air temperatures and greenness associ-ated with El Niño-southern oscillation and the Arctic Oscillation. J Geophys Res 108:4396.doi:10.1029/2002JD002
Cantelaube P, Terres J-M, Doblas-Reyes FJ (2004) Influence of climate variability on Europeanagriculture – analysis of winter wheat production. Clim Res 27:135–144
Castro-Díez Y, Pozo-Vázquez D, Rodrigo FS, Esteban-Parra MJ (2002) NAO and winter tempera-ture variability in southern Europe. Geophys Res Lett 29:1160. doi:10.1029/2001GL014042
D’Odorico P, Yoo JC, Jaeger S (2002) Changing seasons: an effect of the North AtlanticOscillation? J Clim 15:435–445
Friedlingstein P, Joel G, Field CB, Fung IY (1999) Toward an allocation scheme for globalterrestrial carbon models. Glob Change Biol 5:755–770
García-Herrera R, Paredes D, Trigo RM, Trigo IF, Hernández E, Barriopedro D, Mendes MA(2007) The outstanding 2004/05 drought in the Iberian Peninsula: associated atmosphericcirculation. J Hydrometeorol 8:483–498

The Impacts of the NAO on the Vegetation Activity in Iberia 127
Gimeno L, Ribera P, Iglesias R, Torre L, Garcia R, Hernández E (2002) Identification of empiricalrelationships between indices of ENSO and NAO and agricultural yields in Spain. Clim Res21:165–172
Gouveia C, Trigo RM (2008) Influence of climate variability on wheat production in Portugal. In:Soares A, Pereira MJ, Dimitrakopoulos R (eds) geoENV VI – geostatistics for environmentalapplications. Springer, Berlin, pp 335–345
Gouveia C, Trigo RM, DaCamara CC (2009) Drought and vegetation stress monitoring in Portugalusing satellite data. Nat Hazards Earth Syst Sci 9:185–195
Gouveia C, Trigo RM, DaCamara CC, Libonati R, Pereira JMC (2008) The North AtlanticOscillation and European vegetation dynamics. Int J Climatol 28:1835–1847
Groisman PY, Karl TR, Knight RW (1994) Observed impact of snow cover on the heat balanceand the rise of continental spring temperatures. Science 263:198–200
Iglesias A, Quiroga S (2007) Measuring the risk of climate variability to cereal production at fivesites in Spain. Clim Res 34:47–57
Ji L, Peters AJ (2003) Assessing vegetation response to drought in the northern Great Plains usingvegetation and drought indices. Rem Sens Environ 87:85–98
Jones PD, Jónsson T, Wheeler D (1997) Extension to the North Atlantic Oscillation using earlyinstrumental pressure observations from Gibraltar and south-west Iceland. Int J Climatol17:1433–1450
Lindner M, Maroshek M, Netherer S, Kremer A, Barbati A, García-Gonzalo J, Seidl R, DelzonS, Corona P, Kolström M, Lexer M, Marchetti M (2010) Climate change impacts, adaptivecapacity and vulnerability of European forest ecosystems. Forest Ecol Manag 259:698–709
Maignan F, Bréon F-M, Bacour C, Demarty J, Poirson A (2008) Interannual vegetation phenologyestimates from global AVHRR measurements: comparison with in situ data and applications.Rem Sens Environ 112:496–505
Myneni RB, Keeling CD, Tucker CJ, Asrar G, Nemani RR (1997) Increase plant growth in thenorthern high latitudes from 1981–1991. Nature 386:698–702
Nemani RR, Keeling CD, Hashimoto H, Jolly WM, Piper SC, Tucker CJ, Myneni RB, RunningSW (2003) Climate-driven increases in global terrestrial net primary production from 1982 to1999. Science 300:1560–1563
Piao S, Ciais P, Friedlingstein P, Peylin P, Reichstein M, Luyssaert S, Margolis H, Fang J, BarrA, Chen A, Grelle A, Hollinger DY, Laurila T, Lindroth A, Richardson AD, Vesala T (2008)Net carbon dioxide losses of northern ecosystems in response to autumn warming. Nature 451:49–52
Potter CS, Randerson JT, Field CB, Matson PA, Vitousek PM, Mooney HA, Klooster SA (1993)Terrestrial ecosystem production – a process model-based on global satellite and surface data.Global Biogeochem Cycles 7:811–841
Rodríguez-Puebla C, Ayuso SM, Frias MD, Garcia-Casado LA (2007) Effects of climate variationon winter cereal production in Spain. Clim Res 34:223–232
Seixas J, Carvalhais N, Nunes C, Benali A (2009) Comparative analysis of MODIS-FAPARand MERIS-MGVI datasets: potential impacts on ecosystem modeling. Rem Sens Environ113:2547–2559
Shabanov NV, Zhou L, Knyazikhin Y, Myneni RB (2002) Analysis of interannual changes in north-ern vegetation activity observed in AVHRR data during 1981 to 1994. IEEE Trans Geosci RemSens 40:115–130
Sitch S, Huntingford C, Gedney N, Levy PE, Lomas M, Piao SL, Betts R, Ciais P, Cox P,Friedlingstein P, Jones CD, Prentice IC, Woodward FI (2008) Evaluation of the terrestrialcarbon cycle, future plant geography and climate-carbon cycle feedbacks using five DynamicGlobal Vegetation Models (DGVMs). Glob Change Biol 14:2015–2039
Stöckli R, Vidale PL (2004) European plant phenology and climate as seen in a 20-year AVHRRland-surface parameter dataset. Int J Rem Sens 25:3303–3330
Trigo RM, Osborn TJ, Corte-Real JM (2002) The North Atlantic Oscillation influence on Europe:climate impacts and associated physical mechanisms. Clim Res 20:9–17

128 C. Gouveia and R.M. Trigo
Trigo RM, Pozo-Vazquez D, Osborn TJ, Castro-Diez Y, Gámis-Fortis S, Esteban-Parra MJ (2004)North Atlantic Oscillation influence on precipitation, river flow and water resources in theIberian Peninsula. Int J Climatol 24:925–944
Vicente-Serrano SM (2007) Evaluating the Impact of drought using remote sensing in aMediterranean, semi-arid region. Nat Hazards 40:17–208
Vicente-Serrano SM, Cuadrat-Prats JM, Romo A (2006) Early prediction of crop production usingdrought indices at different time-scales and remote sensing data: application in the Ebro valley(North–East Spain). Int J Rem Sens 27:511–518
Vicente-Serrano SM, Heredia-Laclaustra A (2004) NAO influence on NDVI trends in the IberianPeninsula (1982–2000). Int J Rem Sens 25:2871–2879
Wilks DS (2006) Statistical methods in the atmospheric sciences, International Geophysics Series,2nd edn, vol 59. Academic, New York, NY, 627 pp
Zhao M, Running SW (2010) Drought-induced reduction in global terrestrial net primaryproduction from 2000 through 2009. Science 20:940–943
Zhou L, Tucker CJ, Kaufmann RK, Slayback D, Shabanov NV, Myneni RB (2001) Variationsin northern vegetation activity inferred from satellite data of vegetation index during 1981 to1999. J Geophys Res 106:20069–20083
Direct and Indirect Effects of the North AtlanticOscillation on Tree Growth and Forest Declinein Northeastern Spain
Jesús Julio Camarero
Abstract NAO effects on tree growth have not been assessed in the NortheasternIberian Peninsula where: (i) Atlantic (NAO) and Mediterranean influences affecttree growth and (ii) contrasting climatic conditions determine very different foresttypes. It is hypothesized that positive (negative) values of winter NAO are linkedto drier winter conditions and low (high) forest growth on the following spring.To understand the effects of climate and NAO on tree growth, first I quantified thegrowth responses to monthly and seasonal climatic variables (mean temperature,total precipitation and cloud cover) and NAO indices across a climatic gradient inNortheastern Spain. Dendrochronological methods are used and an extensive tree-ring network (48 sites, 687 trees) based on ten tree species with contrasting habitatsand plausibly different growth responses to climate. Then, I focused on the longesttree-ring chronologies to estimate how unstable are the relationships between treegrowth and NAO indices. Finally, the resultant findings are applied to understandhow NAO has affected climatic variability during the last decades and how thismay be related to the recent silver fir (Abies alba) decline in the Pyrenees. Climaticvariables and NAO indices explained on average 40.1 and 15.9% of the growthvariance, respectively. The maximum growth variance (52.1%) explained by NAOindices was found in a Juniperus thurifera forest under continental Mediterraneanconditions. High NAO values during the previous December were linked to a reduc-tion in precipitation and a low radial growth the following spring, but high FebruaryNAO values were also associated with warmer early-spring conditions and enhancedgrowth. The growth responses to climate and NAO also changed through time. Inthe case of silver fir, a shift in the positive relationship between growth and NAOindices of the previous winter (November, February) coincided with the trigger-ing of decline in 1986 suggesting an alteration in the growth response to NAO andrelated climatic variables.
Keywords Atmospheric circulation patterns · Dendrochronology · Forestdieback · Juniperus thurifera · Tree ring-width
J.J. Camarero (B)ARAID-Instituto Pirenaico de Ecología, Spanish National Research Council (CSIC),Zaragoza, Spaine-mail: [email protected]
129S.M. Vicente-Serrano, R.M. Trigo (eds.), Hydrological, Socioeconomicand Ecological Impacts of the North Atlantic Oscillation in the Mediterranean Region,Advances in Global Change Research 46, DOI 10.1007/978-94-007-1372-7_10,C© Springer Science+Business Media B.V. 2011

130 J.J. Camarero
1 Introduction
Climatic projections foresee strong warming trends and a decrease in rainfall for theMediterranean region during the twenty-first century (IPCC, 2007). Such tenden-cies toward drier conditions have been linked to an increasing anticyclonic activityassociated with a northward shift of the north Atlantic storm track (Giorgi andLionello, 2008). Thus, the predicted changes in atmospheric circulation and cli-matic conditions should affect forest growth in the Mediterranean basin directlythrough changes in large scale temperature but also indirectly through modificationsin atmospheric patterns and proximate local climate factors such as wind patternsand precipitation (Hirschboeck et al., 1996; Girardin and Tardif, 2005).
Large-scale climatic indices may outperform local climatic conditions in explain-ing variation in ecological processes (Hallett et al., 2004). Such distinct results maybe explained by the more spatially and temporally variable associations betweenlocal climate data (e.g., monthly temperature means or precipitation sums) andecological process as compared with large-scale indices which can partially cap-ture these processes giving insights on the underlying mechanisms (Garfin, 1998).However, few studies have assessed the influence of large-scale indices on treegrowth in areas subjected to diverse climatic conditions, as is the case of the IberianPeninsula, where climates range from mild to continental and from humid to semi-arid resulting in diverse forest types subjected to different constraints for tree growth(Nahal, 1981).
In the Iberian Peninsula the climatic variability is under the influence of severallarge-scale atmospheric circulation patterns including the North Atlantic Oscillation(NAO), which is defined by a north-south dipole of sea level pressures and geopoten-tial heights in the North Atlantic region (Hurrell et al., 2003). The NAO variabilityis related to changes in the position of the Iceland low-pressure and the Azoreshigh-pressure systems, and to modifications in the direction and strength of westerlywinds in southern Europe (Hurrell, 1995). The NAO has a strong effect on winterclimate over the Iberian Peninsula Iberia where high (low) NAO values in winter arelinked to low (high) precipitation (Hurrell and Van Loon, 1997), being these asso-ciations particularly strong in western Iberia (Rodó et al., 1997; Rodríguez-Pueblaet al., 2001). The NAO does not exert a relevant influence on winter temperaturevariability in the western Mediterranean Basin (Sáenz et al., 2001).
Spatially heterogeneous and lagged effects of the previous winter NAO on treegrowth of the following year have been described in mesic forests from westernSpain (Roig et al., 2009; Rozas et al., 2009) and in drier locations from easternSpain (Bogino and Bravo, 2008). However, few data exist in transitional areas closerto the Mediterranean Sea and subjected to xeric conditions, where the NAO influ-ence on growth might differ as compared with western mesic areas. In this work, it isevaluated if high NAO values (increased westerlies, storms track towards SouthernEurope) during the previous winter are linked to a reduction in tree radial growththrough lower precipitation and water availability at the beginning of the growingseason the following spring. The objectives of this study are: (i) to quantify thegrowth responses to monthly and seasonal climatic variables (mean temperature,

Direct and Indirect Effects of the North Atlantic Oscillation on Tree Growth and. . . 131
total precipitation and cloud cover) and NAO indices across a climatic gradient inNortheastern Spain using dendrochronological methods and an extensive tree-ringnetwork (48 sites); (ii) to estimate how unstable are the relationships between treegrowth and NAO indices, and (iii) to understand how NAO has affected climaticvariability during the last decades and how this may be related to recent silver fir(Abies alba) decline episodes. Such decline events were observed in the SpanishCentral Pyrenees since the 1980s and showed a marked geographical pattern char-acterized by a greater abundance of declining forests in more xeric sites from thewestern Pyrenees than elsewhere (Camarero et al., 2002).
2 Materials and Methods
2.1 Study Sites
In total 687 trees of ten tree species (Abies alba Mill., Fagus sylvatica L., Juniperusoxycedrus L., Juniperus thurifera L., Pinus halepensis Mill., Pinus sylvestris L.,Pinus uncinata Ram., Pistacia terebinthus L., Quercus faginea Lam., Quercus roburL.) were sampled in 48 forests located in an area of approximately 150,000 km2
within Northeastern Spain (Table 1). The studied species belong to diverse fam-ilies (Anacardiaceae, Cupressaceae, Fagaceae, Pinaceae) and the studied forestsoccupy sites encompassing wide gradients of elevation (340–1800 m) and cli-matic types (mean annual temperature: 8.3–13.8◦C; total annual precipitation:317–2350 mm).
In Northeastern Spain, the rainfall decreases from north to south and fromthe coast towards inland sites resulting in diverse climatic conditions (González-Hidalgo et al., 2009). In the study area, Atlantic (e.g., higher winter and springprecipitation derived from the Atlantic storm track) and Mediterranean (e.g., higherautumn precipitation caused by cyclonic influence from the close MediterraneanSea) influences increase westwards and eastwards, respectively. Such contrastingclimatic conditions determine different forest types including Mediterranean conif-erous forests growing under semi-arid continental climates (J. thurifera, P. halepen-sis), mesic Mediterranean shrub formations (P. terebinthus), sub-Mediterraneantransitional oak forests (Q. faginea), humid temperate forests (A. alba, Q. robur),and cold mountain conifer forests (P. sylvestris, P. uncinata). Some of the studiedsites corresponded to relict and isolated tree populations as is the case of Q. roburin the Moncayo site or J. thurifera in the Retuerta de Pina site. Other forests rep-resent ecological limits near the “xeric” limit of the species distribution such as theF. sylvatica and P. sylvestris forests in the Monrepos site. Finally, the P. uncinatapopulation in the Moncayo site was a plantation outside the main Iberian range ofthe species in the Pyrenees. Most sites are located on marls and limestones, whichgenerate basic soils.

132 J.J. Camarero
Tabl
e1
Cha
ract
eris
tics
ofth
est
udy
site
s
Spec
ies
Site
(cod
e)L
atitu
de(N
)L
ongi
tude
Ele
vatio
n(m
)P
(mm
)a
Que
rcus
robu
rB
értiz
(QrB
E)
43◦ 0
9′1◦
36′ W
405
1677
Abi
esal
baIr
ati(
AaI
R)
42◦ 5
9′1◦
03′ W
1020
780
Que
rcus
fagi
nea
Lue
sia
(QfL
U)
42◦ 2
2′1◦
01′ W
950
684
Pin
ussy
lves
tris
Lue
sia
(PsL
U)
42◦ 2
2′1◦
01′ W
920
684
Que
rcus
robu
rM
onca
yo(Q
rMO
)41
◦ 48′
1◦51
′ W14
0010
20P
inus
unci
nata
Mon
cayo
(PuM
O)
41◦ 4
7′1◦
49′ W
1850
1350
Fagu
ssy
lvat
ica
Mon
repo
s(F
sMR
)42
◦ 19′
0◦25
′ W12
9012
00P
inus
sylv
estr
isM
onre
pos
(PsM
R)
42◦ 1
9′0◦
25′ W
1300
1200
Abi
esal
baD
eclin
ing
site
s–
Pyre
nees
(Aad
PY)b
42◦ 4
4′0◦
45′ W
1196
1150
Abi
esal
baN
onde
clin
ing
site
s–
Pyre
nees
(Aan
PY)
42◦ 3
5′0◦
23′ W
1390
1800
Juni
peru
sox
yced
rus
Agü
ero
(JoA
G)
42◦ 1
8′0◦
47′ W
750
635
Pis
taci
ate
rebi
nthu
sM
edia
no(P
tME
)42
◦ 19′
0◦14
′ E48
873
2P
inus
hale
pens
isPe
ñaflo
r(P
hPE
)41
◦ 47′
0◦43
′ W34
534
0Ju
nipe
rus
thur
ifer
aPe
ñaflo
r(J
tPE
)41
◦ 47′
0◦43
′ W34
034
0Ju
nipe
rus
thur
ifer
aR
etue
rta
dePi
na(J
tRE
)41
◦ 27′
0◦16
′ W35
039
5Ju
nipe
rus
thur
ifer
aO
lmed
illa
(JtO
L)
40◦ 1
9′0◦
44′ W
1400
700
Juni
peru
sth
urif
era
Ade
muz
(JtA
D)
40◦ 0
4′1◦
15′ W
1518
750
a Ann
ualp
reci
pita
tion
base
don
loca
lclim
atic
data
and
corr
ecte
dta
king
into
acco
untt
hesi
teel
evat
ion.
bM
ean
valu
esof
the
refe
rred
char
acte
rist
ics
wer
eob
tain
edfo
rde
clin
ing
and
non-
decl
inin
gsi
tes.

Direct and Indirect Effects of the North Atlantic Oscillation on Tree Growth and. . . 133
2.2 Field Sampling and Dendrochronological Methods
In each site 8–88 dominant trees were randomly selected and their size (Dbh, diame-ter at 1.3 m) was measured (Table 2). At least two radial cores per tree were sampledat 1.3 m using a Pressler increment borer. Cores were prepared following standarddendrochronological methods (Fritts, 2001). They were mounted and sanded untiltree-rings were clearly visible under a binocular microscope. All samples were visu-ally cross-dated and tree-ring widths were measured to a precision of 0.001 mmusing a LINTAB measuring device (Rinntech, Heidelberg, Germany). Cross-datingwas evaluated using the program COFECHA (Holmes, 1983).
Each individual series was standardized using a spline function with a 50% fre-quency response of 32 years to keep high-frequency variability. Standardizationinvolved transforming the measured value into a dimensionless index by dividingit by the expected values given by the spline function. Autoregressive modellingwas carried out on each series to remove temporal autocorrelation (Table 2). Thenthe indexed residual series were averaged using a biweight robust mean to obtainsite chronologies for each species using the program ARSTAN (Cook, 1985). Inthe case of A. alba the chronologies were averaged in two groups of sites withcommon growth trends and similar decline symptoms corresponding to declining(8 sites) and non-declining (25 sites) stands. Declining sites were regarded as thosewith more than 25% trees with crown defoliation greater than 50% (Camarero et al.,2002). In the case of the raw width series the mean and standard deviation (SD) andthe first-order autocorrelation (AR1), which measures the year-to-year persistencein growth, were calculated. The statistical quality of the residual chronologies wasevaluated using several dendrochronological statistics (Briffa and Jones, 1990): themean correlation (r) of individual series with the mean site chronology; the meansensitivity (MSx) which quantifies the relative change in width among consecutiveyears; and the Expressed Population Signal (EPS) of residual series which indicatesto what extent the sample size is representative of a theoretical infinite population.The common interval of each site and species was selected for EPS values above the0.85 threshold which is widely used in dendrochronological studies (Wigley et al.,1984).
2.3 NAO and Climatic Data
Monthly and season values of the NAO index were calculated based on the differ-ences between time series of sea-level pressures recorded at Gibraltar and Reykjavik(Jones et al., 1997). NAO data are available in the Climate Research Unit (CRU)homepage (http://www.cru.uea.ac.uk/cru/data/nao.htm). The monthly climatic dataused (mean temperature, total precipitation, cloud cover) were also produced byCRU, they are freely available at http://badc.nerc.ac.uk/data/cru/ and correspond tothe TS 2.1 and 3.0 gridded (0.5◦ resolution) datasets (Mitchell and Jones, 2005).The missing data of cloud cover were replaced by the mean values of each monthlyvariable. In addition to the local climatic datasets compiled at 0.5◦ resolution, a

134 J.J. Camarero
Tabl
e2
Den
droc
hron
olog
ical
stat
istic
sof
the
grow
thse
ries
Site
N◦ t
rees
(cor
es)
Dbh
(cm
)R
W(m
m)
rM
SxA
R1
Com
mon
inte
rval
aC
limat
eR
2 adj
(%)
NA
OR
2 adj
(%)
QrB
E15
(30)
45.0
2.11
±0.
760.
540.
230.
7419
24–2
008
16.3
3.0
AaI
R14
(29)
32.0
1.83
±0.
890.
540.
170.
8719
44–2
003
31.8
5.1
QfL
U88
(176
)13
.41.
43±
0.60
0.61
0.27
0.68
1955
–200
214
.16.
1Ps
LU
8(1
5)36
.02.
21±
0.83
0.64
0.33
0.77
1946
–200
427
.610
.1Q
rMO
12(2
4)23
.41.
45±
0.55
0.43
0.26
0.75
1931
–200
071
.514
.4Pu
MO
15(3
0)20
.52.
41±
0.95
0.58
0.15
0.70
1960
–200
818
.210
.8Fs
MR
11(2
2)26
.31.
34±
0.09
0.61
0.28
0.71
1920
–200
966
.53.
5Ps
MR
11(2
3)40
.61.
50±
0.11
0.65
0.29
0.79
1915
–200
941
.513
.0A
adPY
66(1
40)
43.3
1.77
±0.
430.
580.
240.
7918
86–2
000
66.0
12.5
Aan
PY32
2(6
60)
55.3
2.36
±0.
670.
490.
200.
8218
89–2
000
53.0
10.9
JoA
G8
(21)
12.0
1.07
±0.
530.
500.
270.
5919
58–2
009
38.7
14.1
PtM
E24
(41)
8.8
1.06
±0.
510.
530.
400.
4919
59–2
006
70.9
9.9
PhPE
15(2
9)17
.21.
12±
0.73
0.73
0.37
0.66
1900
–200
645
.033
.8Jt
PE10
(20)
16.0
1.47
±0.
780.
600.
340.
7419
56–2
006
37.8
25.5
JtR
E15
(25)
17.6
1.00
±0.
590.
720.
350.
5819
55–2
004
51.8
52.1
JtO
L13
(25)
26.8
0.97
±0.
470.
630.
320.
6519
49–2
005
20.0
9.7
JtA
D40
(80)
15.0
1.10
±0.
370.
560.
300.
4219
60–2
004
11.2
36.0
Abb
revi
atio
ns:R
W,m
ean
(±SD
)tr
ee-r
ing
wid
thfo
rth
eco
mm
onin
terv
al;r
,mea
nco
rrel
atio
nw
ithth
em
ean
mas
ter
site
chro
nolo
gy;M
Sx,m
ean
sens
itivi
tyof
the
resi
dual
chro
nolo
gies
;A
R1,
first
-ord
erau
toco
rrel
atio
n;C
limat
eR
2 adj,
adju
sted
perc
enta
geof
the
vari
ance
ofgr
owth
expl
aine
dby
mon
thly
clim
atic
vari
able
s(m
ean
tem
pera
ture
,tot
alpr
ecip
itatio
n);N
AO
R2 ad
j,ad
just
edpe
rcen
tage
ofth
eva
rian
ceof
grow
thex
plai
ned
bym
onth
lyN
AO
indi
ces.
a The
com
mon
inte
rval
isth
epe
riod
rega
rded
asst
atis
tical
lyw
ellr
eplic
ated
with
EPS
>0.
85,w
here
the
EPS
isth
eE
xpre
ssed
Popu
latio
nSi
gnal
(am
easu
reof
the
tree
-to-
tree
com
mon
grow
thva
rian
ce).

Direct and Indirect Effects of the North Atlantic Oscillation on Tree Growth and. . . 135
regional climatic dataset was obtained considering for the area contained withincoordinates 40◦ 00
′–43◦ 30
′N and 1◦ 30
′W–0◦ 30
′E.
2.4 Statistical Analyses
The spatio-temporal of ring-width residual chronologies was described using aPrincipal Component Analysis (PCA) calculated from their correlation matrix forthe common period 1960–1999. The broken stick test was performed to deter-mine the significance of the first three principal components (Holmes, 1992). Toquantify the influence of the monthly and seasonal climatic data (mean temper-ature, total precipitation) and NAO indices on growth, bootstrapped correlationanalyses were carried out for the common period 1960–1999 using the programDendroclim2002 (Biondi and Waikul, 2004). Spatial patterns of climate-growthrelationships were explored using the KNMI Climate Explorer (http://climexp.knmi.nl/). The significances of the correlations were based on 999 bootstrapped esti-mates. The long-term serial correlation in the NAO monthly or seasonal series(winter, December–February; spring, March–May; summer, June–August; autumn,September–November) were removed assuming linear trends. Furthermore, corre-lation analyses considering all NAO data (n = 40) or only positive (n = 16−27)or negative (n = 13−24) NAO indices were performed to emphasize the effects ofdifferent NAO phases on growth. The relationships between climate or NAO data(monthly and seasonal values) and growth (residual indices) were analyzed fromthe previous September up to the current September. In the case of seasonal data,I focused on the relationships between previous-winter and current-spring NAOindices and growth data based on previous results in nearby areas (Rozas et al.,2009). To estimate the percentage of variance (R2) and its adjusted value (R2
adj)in growth data explained by climatic (temperature, precipitation) and NAO data,multiple regressions were performed based on the forward selection of significant(P < 0.05) monthly predictors. Cloud cover was not used in the climatic modelbecause most dendroclimatic studies are based on temperature and precipitation data(Fritts, 2001). To detect if NAO-growth associations were unstable through time,moving correlations for 30-year periods were performed between NAO monthly andseasonal indices and growth data of the longest chronologies which covered most ofthe past twentieth century (PsMR, PhPE and the silver fir series AadPY, AanPY).
3 Results
3.1 Growth and Dendrochronological Data
Tree size changed considerably across the study area with mean diameter (Dbh)ranging between 8.8 (P. terebinthus) and 55.3 cm (A. alba) (Table 1). The mean ringwidths varied also notably among sites and species with minimum values of 1.0 mm

136 J.J. Camarero
(open J. thurifera stands under semi-arid and continental conditions) and maximumvalues of 3.4 mm (young P. uncinata mountain forests) (Table 2). High growth val-ues were also observed in mesic temperate forests (A. alba, P. sylvestris, Q. robur),whereas tree rings were usually narrow in sites with a pronounced drought periodunder Mediterranean conditions dominated by P. terebinthus, Juniperus speciesand P. halepensis. The maximum correlations between tree series and the meansite chronology were observed in semi-arid sites dominated by J. thurifera andP. halepensis followed by transitional P. sylvestris forests, whereas low correla-tions were observed in more mesic sites both in temperate (Q. robur, A. alba) andin Mediterranean conditions (J. oxycedrus, P. terebinthus). Mesic temperate for-est showed the lowest mean sensitivity values, while J. thurifera and P. halepensissemi-arid sites showed the highest mean relative change in width among consecutiveyears. Conversely, these last forests and Mediterranean sites (P. terebinthus) showedthe lowest first-order autocorrelation values, whereas A. alba and P. sylvestris treesshowed the highest year-to-year persistence in growth. Finally, the maximum inter-specific correlations between growth series were observed for the Mediterraneansites PtME and PhPE (r=0.56, P<0.001), separated by 112 km, and for the temper-ate or transitional sites AadPY and PsMR (r=0.53, P<0.001), which were located59 km apart. However, negative associations were detected between Mediterraneancontinental J. thurifera sites and mesic Q. robur forests separated by about 200 km(QrMO-JtAD, r=−0.17, P=0.40; QrBE-JtRE, r = −0.16, P = 0.30).
Forests with trees of greater diameter showed a higher mean ring-width(r = 0.68, P = 0.003) and first-order autocorrelation of tree-ring series (r = 0.71,P = 0.001) but a lower mean sensitivity (r = −0.48, P = 0.04) (Table 2). Thepercentage of growth variance explained by climatic variables was not significantlyrelated to tree size or to any dendrochronological statistic. However, the percentageof growth variance explained by NAO indices was negatively related to tree-ringwidth (r=−0.47, P=0.05) and first-order autocorrelation (r=−0.50, P=0.04) butpositively associated with the mean sensitivity (r = 0.48, P = 0.05).
The first three principal components of the PCA explained, 40.5, 10.9 and 7.1%of the total variance of growth data for all sites (48 series), respectively, being sig-nificant (P < 0.05) the first two components (results not presented). Consideringthe mean growth series for the two groups of A. alba forests based on their declinesymptoms and the rest of sites (17 series), the first (PC1) and second (PC2) compo-nents were again significant and explained, respectively, 34 and 13% of the totalvariance (Fig. 1). The PC1 arranged sites according to their main climatic con-ditions related to precipitation differences since forests located in the more xericsites (Mediterranean continental climate) showed high scores along this compo-nent whereas forests in more mesic habitats (temperate and mountain forests) hadthe lowest scores. Mountain conifer forests and Quercus forests, both mesic andtransitional sites, showed high scores in the PC2.

Direct and Indirect Effects of the North Atlantic Oscillation on Tree Growth and. . . 137
PC1 (34.0%)
0.0 0.2 0.4 0.6 0.8 1.0
PC
2 (1
3.0%
)
–0.6
–0.4
–0.2
0.0
0.2
0.4
0.6
0.8
1.0
Non declining A. alba sitesDeclining A. alba sitesA. alba (AaIR)Q. roburP. sylvestrisF. sylvatica (FsMR)P. uncinata (PuMO)Q. faginea (QfLU)J. thuriferaJ. oxycedrus (JoAG)P. halepensis (PhPE)P. terebinthus (PtME)
Fig. 1 Scatter diagram of growth chronologies based on the scores of the first two principal com-ponents of a PCA considering the mean series of non-declining and declining A. alba sites and therest of study sites (17 series). Codes are as in Table 1
3.2 Relationships Between Growth and Climatic Variables
Tree growth in most study sites was enhanced by warmer April temperatures, wet-ter and cloudier conditions in June during the year of tree-ring growth (Table 3).In addition, higher February temperatures and more rainfall and cloud cover inMay and wet conditions in August of the current year also favored wood forma-tion. However, a previous warm September with low values of cloud cover wasusually related to decreased growth. In mesic or transitional sub-Mediterraneansites, a wet January was associated to lower growth the following spring, but inMediterranean sites tree growth was enhanced by wet conditions in January and theprevious December.
The spatial patterns of climate-growth relationships changed according to theclimatic variable. For instance, the positive effect of winter precipitation (previousDecember) on tree growth was stronger in the southern than in the northern part ofthe study area in Northeastern Spain (Fig. 2). However, the positive effects of latespring and early summer precipitation (current June) on growth did not show suchdivergence and it was observed near the core of the study area.

138 J.J. Camarero
Tabl
e3
Sign
ifica
nt(P
<0.
05)
corr
elat
ions
(Pea
rson
coef
ficie
nts)
obta
ined
betw
een
mon
thly
clim
atic
data
(T,m
ean
tem
pera
ture
;P,
tota
lpr
ecip
itatio
n;C
C,
clou
dco
ver)
and
grow
thfo
rth
est
udy
site
sin
clud
ing
the
first
and
seco
ndpr
inci
pal
com
pone
nts
(PC
1,PC
2).
Mon
ths
abbr
evia
ted
bylo
wer
-an
dup
perc
ase
lette
rsco
rres
pond
toth
eye
ars
befo
re(t
–1)
and
duri
ng(t
)tr
ee-r
ing
form
atio
n.C
odes
are
asin
Tabl
e1
Yea
rt–
1Y
ear
t
Ts
on
dJ
FM
AM
JJ
AS
QrB
E0.
32A
aIR
0.29
0.30
0.42
QfL
U0.
29Ps
LU
–0.3
90.
350.
340.
32Q
rMO
0.29
–0.4
1Pu
MO
0.29
FsM
R–0
.28
PsM
R–0
.42
0.38
0.29
Aad
PY–0
.49
0.34
0.38
Aan
PY–0
.50
0.40
0.39
0.40
JoA
G0.
29Pt
ME
0.36
PhPE
–0.3
30.
320.
310.
290.
29–0
.29
JtPE
JtR
E0.
310.
380.
42–0
.45
JtO
L0.
290.
33Jt
AD
0.29
0.30
PC1
–0.3
60.
450.
46PC
2–0
.28
0.32
0.29
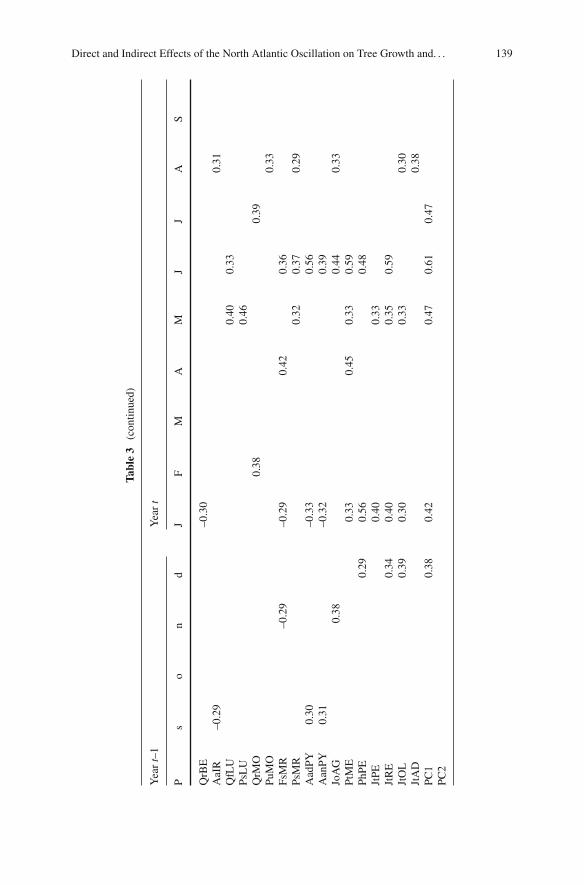
Direct and Indirect Effects of the North Atlantic Oscillation on Tree Growth and. . . 139
Tabl
e3
(con
tinue
d)
Yea
rt–
1Y
ear
t
Ps
on
dJ
FM
AM
JJ
AS
QrB
E–0
.30
AaI
R–0
.29
0.31
QfL
U0.
400.
33Ps
LU
0.46
QrM
O0.
380.
39Pu
MO
0.33
FsM
R–0
.29
–0.2
90.
420.
36Ps
MR
0.32
0.37
0.29
Aad
PY0.
30–0
.33
0.56
Aan
PY0.
31–0
.32
0.39
JoA
G0.
380.
440.
33Pt
ME
0.33
0.45
0.33
0.59
PhPE
0.29
0.56
0.48
JtPE
0.40
0.33
JtR
E0.
340.
400.
350.
59Jt
OL
0.39
0.30
0.33
0.30
JtA
D0.
38PC
10.
380.
420.
470.
610.
47PC
2

140 J.J. Camarero
Tabl
e3
(con
tinue
d)
Yea
rt–
1Y
ear
t
CC
so
nd
JF
MA
MJ
JA
S
QrB
E0.
29A
aIR
0.31
–0.3
5Q
fLU
0.41
0.31
PsL
U0.
29Q
rMO
0.31
–0.3
40.
29Pu
MO
–0.3
3–0
.30
FsM
R0.
29Ps
MR
0.42
Aad
PY0.
420.
390.
30–0
.30
Aan
PY0.
480.
33–0
.34
JoA
G0.
310.
44Pt
ME
0.30
0.38
0.49
PhPE
0.51
0.52
0.30
0.34
0.39
JtPE
0.33
0.46
JtR
E0.
360.
300.
30Jt
OL
0.33
JtA
D–0
.32
0.37
PC1
0.34
0.37
0.46
PC2
0.29

Direct and Indirect Effects of the North Atlantic Oscillation on Tree Growth and. . . 141
Fig. 2 Spatial patterns of some of the main growth-climate relationships in Northeastern Spain.The maps show correlations between scores of the first principal component (PC1) of growthchronologies and precipitation data (0.5◦ resolution) for the previous (Dec t–1) and the currentJune (Jun t)
The best climatic model for the PC1 scores, capturing the main growth trendsof the study sites during the period 1960–1999, explained 78.3% of their variance(R2
adj = 0.75, F = 24.6, P < 0.001) and included the following variables: Apriland late spring-early summer (May, June, July) precipitation, previous October andcurrent April temperature (Fig. 3).

142 J.J. Camarero
1960 1965 1970 1975 1980 1985 1990 1995 2000
PC
1 sc
ore
–2
–1
0
1
2
3PC1Climate model
Fig. 3 Temporal patterns of the PC1 scores and modeled values based on a climatic modelconsidering monthly climate variables (mean temperature, total precipitation)
3.3 Relationships Between Growth and NAO Indices
Several xeric sites under Mediterranean and continental conditions showed negativeassociations between growth and the previous December NAO index, while othersshowed a similar relationship with the previous September NAO index (Table 4).However, in mesic or transitional sites such as mountain conifer forest or oakwoodland it was also detected positive association with the previous November andDecember NAO indices. Some sites showed positive relationships with the currentFebruary index, whereas others showed negative relationships with the current Juneindex.
The scores of the PC1 and PC2 of growth data were negatively and significantlyrelated to the previous December (P = 0.003) and January (P = 0.05) and to thecurrent August (P = 0.02) NAO indices, respectively (Table 4). In the case of thePC1, a slightly stronger association was found with the mean NAO index of theprevious December and the current January (r = −0.47, P = 0.002). On the otherhand, the PC2 was positively but not significantly related to the mean NAO index ofthe previous November and December (r = 0.20, P = 0.07).
The analyses based on positive NAO indices mostly reflected local effects sinceno significant association was found with the scores of the PC1 (Table 5). Most sig-nificant correlations corresponded to previous December and current February NAOindices. Considering only negative NAO indices, several sites and the PC1 showedpositive associations with the values of the current February index and negative rela-tionships with the values of the previous December index, whereas the PC2 showednegative associations with the NAO indices of the previous September and the cur-rent August and a positive association with the NAO index of the current March(Table 6).

Direct and Indirect Effects of the North Atlantic Oscillation on Tree Growth and. . . 143
Table 4 Significant (P < 0.05) correlations obtained between monthly and seasonal NAO indicesand growth for the study sites including the first and second principal components (PC1, PC2).Values in bold are highly significant (P = 0.001) and months or seasons without significant valuesare not presented. Codes are as in Tables 1 and 3
Year t–1 Year t
Site Summer sep nov dec Spring Jan Feb Mar Apr Jun Aug
QrBE 0.22 0.21AaIR –0.30PsLU 0.23QrMO –0.41PuMO 0.33 0.45FsMR –0.29 –0.25 –0.21PsMR –0.30 0.23 –0.28AadPY 0.20AanPY 0.27 0.28JoAG –0.28 0.32 –0.31PtME –0.32 –0.31PhPE –0.49JtPE –0.29 –0.36 –0.33JtRE –0.49JtOL 0.35 –0.30 0.34JtAD 0.54 –0.35 0.40PC1 –0.46 –0.31 –0.28PC2 –0.28 –0.36
Table 5 Significant (P < 0.05) correlations obtained between monthly and seasonal positive NAOindices and growth for the study sites. Values in bold are highly significant (P = 0.001). Codes areas in Tables 1 and 4
Year t–1 Year t
Site sep dec Winter Spring Fall Feb Mar Apr
QrBE 0.28AaIR 0.35QfLU –0.32PuMO 0.29FsMR –0.22 –0.39PsMR –0.34AadPY 0.45 –0.22JoAG 0.50PhPE 0.26 0.20JtRE –0.49JtOL –0.38 0.28 0.43JtAD 0.35 0.53

144 J.J. Camarero
Table 6 Significant (P < 0.05) correlations obtained between monthly and seasonal negativeNAO indices and growth for the study sites. Values in bold are highly significant (P = 0.001).Codes are as in Tables 1 and 4
Year t–1 Year t
Site Summer Fall sep oct dec Spring Summer Feb Mar May Jun Aug
QrBE –0.26 –0.36AaIR 0.69QfLU –0.42QrMO 0.51PsMR –0.28 –0.32AadPY 0.30 –0.27AanPY –0.25 –0.37JoAG –0.42PhPE –0.33 0.33JtPE –0.39 –0.31 0.50 –0.33JtRE 0.38 –0.52 0.44JtOL –0.44 0.39JtAD –0.43 0.53PC1 0.45 –0.58 –0.35 0.48 –0.39PC2 –0.45 0.62 –0.56
The negative associations between the PC1 and PC2 scores and the previousDecember and the current August NAO indices were more noticeable in the last 2decades of the past century than before (Fig. 4). In fact, the moving correlationsindicated that the negative associations between growth and the previous DecemberNAO index in PhPE and PsMR were unstable and became significant since the1960s (Fig. 5).
In contrast with the climatic model of the PC1 scores which explained 78%of growth variance (Fig. 3), the best model of the PC1 based on the NAO indexexplained only 27.9% of their variance (F = 8.5, P = 0.001) and contained aspredictors the averaged index of the previous December and the current Januaryand the current May index. Actually, only in one study site (JtRE) the NAO indiceswere able to account for a similar variance of growth as the monthly climatic vari-ables did (Fig. 6). In this J. thurifera forest subjected to semiarid and continentalMediterranean conditions, the climatic model explained 51.8% of the growth vari-ance (F = 11.7, P < 0.001), whereas the NAO model captured 52.1% of the growthvariance (F = 11.9, P < 0.001). The climatic model included the following vari-ables (effects between parentheses): June precipitation (+), February, April (+) andJuly temperature (−) (Table 3; Fig. 6). The NAO indices which were selected in themodel corresponded to the previous December (−) and to current February (+) andSeptember (+) (Tables 4, 5 and 6; Fig. 6).
3.4 NAO and Silver Fir Decline
The instability in the NAO-growth relationships was also observed in the case ofsilver fir forests which showed positive associations with monthly November and

Direct and Indirect Effects of the North Atlantic Oscillation on Tree Growth and. . . 145
1960 1965 1970 1975 1980 1985 1990 1995 2000
PC
1 sc
ore
–2
–1
0
1
2
3
NA
O D
ect-
1 in
dex
–4
–2
0
2
4PC1NAO Dec
Years1960 1965 1970 1975 1980 1985 1990 1995 2000
PC
2 sc
ore
–2
–1
0
1
2
3
NA
O A
ugt i
ndex
–4
–2
0
2
4PC2 NAO Aug
Fig. 4 Temporal patterns of the scores of the first two principal components (PC1, PC2) of growthchronologies and related December and August NAO indices for the years before (t–1) and during(t) tree-ring formation, respectively
February indices of winter before tree-ring growth (Table 4). In some of these forestsa decline episode characterised by massive defoliation and mortality was observedin the 1980s after a severe growth reduction in 1986 (Camarero et al., 2002), whenthe minimum value of the November–February NAO index during the twentieth cen-tury was also observed (Fig. 7). The analyses based on moving correlations detecteda shift towards positive and significant associations between such index and silverfir growth since the growth reduction in 1986, i.e. the responsiveness of silver firgrowth to NAO winter indices increased in the last 2 decades of the past century.Furthermore, this rise in the NAO-growth correlation was greater in non-decliningthan in declining forests (Fig. 7).

146 J.J. Camarero
30-year periods1915 1920 1925 1930 1935 1940 1945 1950 1955 1960 1965 1970 1975 1980 1985
Cor
rela
tion
–0.6
–0.4
–0.2
0.0
0.2
PhPE PsMR
P < 0.05
Fig. 5 Moving correlations (30-year periods) between the NAO index of the previous (year t–1)December and growth of two selected sites (PhPE, PsMR; see sites codes in Table 1). The years inthe x axis indicate the mid-point of each 30-year period. The dashed line indicates the significance(P < 0.05) threshold for negative correlations lower than −0.3
J. thurifera (JtRE)
1960 1965 1970 1975 1980 1985 1990 1995 2000
Rin
g-w
idth
inde
x
0.5
1.0
1.5ActualClimate modelNAO model
Fig. 6 Temporal patterns of the growth indices of J. thurifera in the Retuerta de Pina site (JtRE)as compared with models of tree growth based on climatic (monthly mean temperature and totalprecipitation) or NAO (indices) predictors

Direct and Indirect Effects of the North Atlantic Oscillation on Tree Growth and. . . 147
Year1900 1910 1920 1930 1940 1950 1960 1970 1980 1990 2000
Gro
wth
inde
x
0.6
0.8
1.0
1.2
1.4
NA
O (
Nov
t –1 -
Feb
t ) in
dex
–3
–2
–1
0
1
2
3
Declining sites (AadPY) Non declining sites (AanPY) NAO
30-year periods1915 1920 1925 1930 1935 1940 1945 1950 1955 1960 1965 1970 1975 1980 1985
Cor
rela
tion
–0.2
0.0
0.2
0.4
0.6Declining sites (AadPY) Non declining sites (AanPY)
P < 0.05
Fig. 7 Growth indices in declining and non-declining silver fir forests (sites codes are as inTable 1) compared with the November–February NAO index of the year before tree-ring growth(upper graph) and moving correlations calculated between silver-fir growth and that NAO index(lower graph). The years in the x axis indicate the mid-point of each 30-year period. The dashedline indicates the significance (P < 0.05) threshold for correlations greater than 0.3. The rectangledelimits the period 1957–1986 and the arrows point to the corresponding correlation value when ashift in the NAO-growth correlations was observed

148 J.J. Camarero
4 Discussion
4.1 Climatic and NAO Influences on Tree Growth
Radial growth of most of the studied tree species responded positively to warm latewinters (February) and springs (April) and to wet and cloudy late springs and earlysummers (May, June), whereas there were both positive and negative responses towet winters (January) in the case of Mediterranean (e.g., P. halepensis) and temper-ate or cold sites (e.g., A. alba), respectively. However, most Mediterranean forestsunder continental conditions dominated by J. thurifera showed positive growthresponses to wet conditions in the previous winter (December, January) and weremore sensitive to winter NAO indices than temperate forests in mesic sites (e.g.,Q. robur). The observed responses to spring conditions are in agreement with den-droecological and xylogenesis studies which have inferred or found the maximumradial-growth rates of these species in spring (Camarero et al., 2002, 2010).
The positive responses to previous-winter climatic variables (precipitation, tem-perature, cloud cover) detected in P. halepensis and J. thurifera forests undercontinental Mediterranean climates indicate that warm, wet and cloudy conditions inDecember and January enhance growth the following spring. In evergreen conifers,earlywood and tree-ring growth depend on the synthesis of carbohydrates duringthe previous winter (Kagawa et al., 2006). However, results obtained here sug-gest that the moisture reserves in the soil supplied by winter precipitation may bemore relevant to enhance tree growth of these species in spring than temperature-mediated responses which were less important than rainfall effects. In addition,cloudy winter conditions were also linked to enhanced growth indicating that winterphotosynthesis and the synthesis of carbohydrate were not constrained by radiation.
In agreement with the main hypothesis of this study, high NAO values during theprevious winter are linked to a reduction in precipitation and water availability and alow radial growth the following spring. Previous studies have found that winter NAOindices are negatively associated with tree growth in Southern Europe (Piovesanand Schirone, 2000), whereas the reverse response was detected in Northern Europe(Linderholm et al., 2003; Macias et al., 2004; Schultz et al., 2008). The observednegative relationship between the December NAO index and growth in the studyarea is also consistent with results from earlier studies of Iberian conifer forests inNorthwestern (Roig et al., 2009; Rozas et al., 2009) and Southeastern Spain (Boginoand Bravo, 2008).
Such negative associations between winter NAO and tree growth were not greaterin northwestern (e.g., QfLU) than in at southeastern sites (e.g., JtRE), despite theformer sites are under stronger influence of Atlantic westerlies than the later ones.Additionally, this results agrees with the spatial patterns of the correlations betweenthe first principal component of growth and previous December precipitation whichwere higher in southeastern than in northwestern sites. Although the NAO mainlyaffects the precipitation patterns in southwestern Iberia, the southwest flows arereactivated when they reach the Pyrenees, explaining why tree growth of forestsgrowing in the Middle Ebro Basin (e.g., JtRE) in eastern sites with continental

Direct and Indirect Effects of the North Atlantic Oscillation on Tree Growth and. . . 149
Mediterranean climates are also greatly affected by NAO patterns (Vicente-Serranoand Lopez-Moreno, 2006). In this J. thurifera site, both climatic and NAO-basedmodels were able to capture about half of the growth variance which suggests thatlong chronologies of this species in semiarid and continental sites may provide avaluable proxy for reconstructions of winter NAO indices. The response of growthto NAO in this and other sites was not related o elevation as suggested Bogino andBravo (2008) in the case of Pinus pinaster. Furthermore, this suggestion agreeswith the negative association between the percentage of growth variance explainedby NAO indices and tree-ring width, which indicate that series from sites withlow growth and high inter-annual variability may reflect well NAO effects on thewinter precipitation in the high-frequency domain. It is also noticeable that the aver-age explained variance by climatic variables was much higher (40.1%) than thatexplained by NAO indices (15.9%), but the NAO-models explained a much higherpercentage of growth if only J. thurifera and P. halepensis forests from semiarid andcontinental sites were considered (36.8%). Contrastingly, tree growth in mesic andtransitional forests was less related to NAO variability as indicated the low growthvariance captured by NAO indices (8.6%) (see similar values in Bogino and Bravo,2008; Rozas et al., 2009). This result was observed even if these sites were locatedin Western areas near the Atlantic Ocean, probably because of wet conditions, anda low growth responsiveness of dominant tree species to winter precipitation. Forinstance, sites QrBE (Q. robur) and JtRE (J. thurifera) are located at linear dis-tances of 32 and 252 km from the Atlantic Ocean, respectively, but NAO indicesexplained 3.0 and 52.1% of their recent growth variability, respectively.
Most dendroecological studies have focused on the effect of winter NAO onclimate and tree growth in the low-frequency domain (Bogino and Bravo, 2008;Roig et al., 2009) because the NAO mainly affects long-term winter and springclimatic variability in Western Europe (Hurrell, 1995). However, several authorshave also noted that summer precipitation at high-frequency timescales is relatedto tree growth in southern Europe where rainfall in the dry season may allevi-ate drought stress (Piovesan and Schirone, 2000). In this study, it was observedthat tree growth was inversely related to current NAO summer indices, a seasonwhen growth is mainly enhanced by wet (June, August) and cloudy (June) con-ditions in xeric and transitional sites. The spatial pattern of the positive effectof June precipitation on growth was centered in Northeastern Spain and resem-bled related NAO-precipitation associations suggesting that the NAO was involvedin this summer effect on growth, but further studies are required to test theseassumptions. These results contrast with the positive effect of late-spring andearly-summer NAO indices and temperature on tree growth in Fennoscandia(Macias et al., 2004), and even in Northwest Spain (Rozas et al., 2009). InFennoscandia the positive effect of NAO on growth of Scots pine was mostlyobserved for negative NAO indices series indicating that these spring NAO val-ues corresponded to climatic conditions (late snowmelt and beginning of thegrowing season) constraining tree growth whereas positive NAO values did notgreatly affect growth (Macias et al., 2004). In this study, a similar effect wasobserved for February NAO values which were positively related to growth in

150 J.J. Camarero
temperate (A. alba, Q. robur) and continental Mediterranean sites (J. thurifera,P. halepensis). Thus, a warmer early-spring linked to high NAO February valuesin negative NAO series may be related to an earlier growth resumption in some ofthese sites where growth was also enhanced by February and April temperatures.
4.2 NAO Variability and Silver Fir Decline
Silver fir growth showed positive associations with monthly November andFebruary NAO indices of the previous winter but such association steeply rose inthe mid 1980s when silver fir growth fell abruptly and decline started in xeric sites.Since the 1980s, southwestern Europe has been under the influence of extendedperiods of warm winters, which were associated with a persistent positive phase ofthe NAO index for that season (Hurrell, 1995). These results and the growth-climaterelationships found for silver fir suggest that high NAO winter indices were possiblylinked to warmer late-winter conditions and an enhanced growth through an earliercambial reactivation of the silver fir xylogenesis, particularly in non-declining sites.However, silver firs produced an extremely narrow ring in 1986 probably because ofthe previous September 1985 which was very warm and dry (Camarero et al., 2002).Further studies are required to understand if the NAO or other circulation patternswere involved in the climatic determination of such silver fir decline.
One of the main shortcomings of the present study results from the short length ofsome of the dendrochronological series used. To assess the value of dendrochrono-logical records as a proxy of NAO and as sources of climatic information containedin the NAO index, further analyses are required to investigate the NAO signalsin long tree-ring chronologies of different species, particularly in sensitive siteswith species whose growth is responsive to NAO variability. These longer den-drochronological records should be analyzed focusing on the temporal instability ofNAO-growth relationships on decadal and multidecadal scales (5–15 years) whichare the scales of the highest influence of the NAO on climate variability (Hurrellet al., 2003).
5 Conclusions
The proper assessment of the relationships between NAO and tree growth requiresan approach based on the analysis of multi-species networks across contrasting geo-graphical and climatic gradients. Regional monthly climatic variables were shownto be usually better predictors of tree growth than large-scale NAO indices. Innortheastern Spain, tree growth was enhanced by warm and wet conditions inspring during the year of tree-ring formation. High NAO values during the previ-ous December were linked to a reduction in precipitation and a low radial growththe following spring, but high February NAO values were also associated withwarmer early-spring conditions and enhanced growth. Forests growing under xeric

Direct and Indirect Effects of the North Atlantic Oscillation on Tree Growth and. . . 151
conditions with semiarid and continental climates such as Mediterranean Juniperusthurifera sites showed a higher sensitivity in their recent growth patterns to NAOvariability than forests growing under more mesic conditions. In fact, only in oneJ. thurifera forest under continental Mediterranean conditions the growth varianceexplained by NAO indices was high and similar to that explained by climatic data.Further research efforts to monitor the effects of NAO on forest growth and declineshould build long J. thurifera tree-ring chronologies in continental Mediterraneanxeric sites which have proved to be very sensitive to high-frequency changes inwinter precipitation and NAO indices of the previous December.
Acknowledgements This work has been supported by the research projects RTA01-071-C3-1 andCGL2008-04847-C02-01/BOS financed by the Spanish Ministry of Science. I thank the support ofARAID and several colleagues for providing samples and driving me to many impressive forests(E. Arrechea, J.M. Gil, R. Hernández, G. Montserrat-Martí, C. Lastanao, N.A. Laskurain, V. Pérez,M.A. Ros, A. Solla).
References
Biondi F, Waikul K (2004) DENDROCLIM2002: a C++ program for statistical calibration ofclimate signals in tree-ring chronologies. Comput Geosci 30:303–311
Bogino S, Bravo F (2008) SOI and NAO impacts on Pinus pinaster Ait. growth in Spanish forests.In: Elferts D, Brumelis G, Gärtner H, Helle G, Schleser G (eds) TRACE – Tree rings in archae-ology, climatology and ecology, vol. 6. GFZ Potsdam, Scientific technical report STR 08/05,Potsdam, pp 21–26
Briffa KR, Jones PD (1990) Basic chronology statistics and assessment. In: Cook ER, KairiuktsisLA(eds) Methods of dendrochronology. Kluwer Academic, Dordrecht, pp 137–152
Camarero JJ, Olano JM, Parras A (2010) Plastic bimodal xylogenesis in conifers from continentalMediterranean climates. New Phytol 185:471–480
Camarero JJ, Padró A, Martín-Bernal E, Gil-Pelegrín E (2002) Aproximación dendroecológica aldecaimiento del abeto (Abies alba Mill.) en el Pirineo aragonés. Montes 70:26–33
Cook ER (1985) A time series approach to tree-ring standardization. PhD Dissertation, Universityof Arizona, Tucson, AZ
Fritts H (2001) Tree rings and climate. Academic Press, LondonGarfin GM (1998) Relationships between winter atmospheric circulation patterns and extreme tree
growth anomalies in the Sierra Nevada. Int J Climatol 18:725–740Giorgi F, Lionello P (2008) Climate change projections for the Mediterranean region. Glob Planet
Change 63:90–104Girardin MP, Tardif J (2005) Sensitivity of tree growth to the atmospheric vertical profile in the
boreal plains of Manitoba, Canada. Can J For Res 35:48–64González-Hidalgo JC, López-Bustins JA, Štepánek P, Martín-Vide J, de Luis M (2009) Monthly
precipitation trends on the Mediterranean fringe of the Iberian Peninsula during the second halfof the 20th century (1951–2000). Int J Climatol 29:1415–1429
Hallett TB, Coulson T, Pilkington JG, Clutton-Brock TH, Pemberton JM, Grenfell BT (2004)Why large-scale climate indices seem to predict ecological processes better than local weather.Nature 430:71–75
Hirschboeck KK, Ni F, Wood ML, Woodhouse C (1996) Synoptic dendroclimatology: overviewand outlook. In: Dean JS, Meko DM, Swetnam TW (eds) Tree rings, environment, andhumanity. Radiocarbon, Tuscon, pp 205–223
Holmes RL (1983) Computer-assisted quality control in tree-ring dating and measurement. Tree-Ring Bull 43:69–78

152 J.J. Camarero
Holmes RL (1992) Dendrochronology program library. Version 1992-1. Laboratory of Tree-RingResearch, University of Arizona, Tucson, AZ
Hurrell J (1995) Decadal trends in North Atlantic Oscillation and relationship to regionaltemperature and precipitation. Science 269:676–679
Hurrell J, Kushnir Y, Ottersen G, Visbeck M (2003) An overview of the North Atlantic Oscillation.The North Atlantic Oscillation: climate significance and environmental impact. GeophysMonogr, vol. 134, Amer Geophys Union, pp 1–36
Hurrell J, Van Loon H (1997) Decadal variations in climate associated with the North AtlanticOscillation. Clim Change 36:301–326
IPCC (2007) Climate change 2007: the physical science basis. Contribution of Working GroupI to the 4th assessment report of the Intergovernmental panel on climate change. CambridgeUniversity Press, Cambridge, UK
Jones PD, Jónsson T, Wheeler D (1997) Extension to the North Atlantic Oscillation using earlyinstrumental pressure observations from Gibraltar and south-west Iceland. Int J Climatol17:1433–1450
Kagawa A, Sugimoto A, Maximov T (2006) 13CO2 pulse-labelling of photoassimilates revealscarbon allocation within and between tree rings. Plant Cell Environ 29:1571–1584
Linderholm HW, Solberg BO, Lindholm M (2003) Tree-ring records from central Fennoscandia:the relationship between tree growth and climate along a west-east transect. The Holocene13:887–895
Macias M, Timonen M, Kirchhefer AJ, Lindholm M, Eronen M, Gutiérrez E (2004) Growthvariability of Scots Pine (Pinus sylvestris) along a west-east gradient across NorthernFennoscandia: a dendroclimatic approach. Arct Antarct Alp Res 36:565–574
Mitchell TD, Jones PD (2005) An improved method of constructing a database of monthly climateobservations and associated high-resolution grids. Int J Climatol 25:693–712
Nahal I (1981) The Mediterranean climate from a biological viewpoint. In: di Castri F, GoodallFW, Specht RL (eds) Mediterranean-type shrublands. Elsevier, Amsterdam, the Netherlands,pp 63–86
Piovesan G, Schirone B (2000) Winter North Atlantic Oscillation effects on the tree rings of theItalian beech (Fagus sylvatica L.). Int J Biometeorol 44:121–127
Rodó X, Baert E, Comin F (1997) Variations in seasonal rainfall in Southern Europe during thepresent century: relationships with the North Atlantic Oscillation and the El Niño-SouthernOscillation. Clim Dyn 13:275–284
Rodríguez-Puebla C, Encinas AH, Sáenz J (2001) Winter precipitation over the Iberian Peninsulaand its relationship to circulation indices. Hydrol Earth Syst Sci 5:233–244
Roig FA, Barriopedro D, Herrera RG, Patón Domínguez D, Monge S (2009) North AtlanticOscillation signatures in western Iberian tree-rings. Geogr Ann 91:141–157
Rozas V, Lama S, García-González I (2009) Differential tree-growth responses to local and large-scale climatic variation in two Pinus and two Quercus species in northwest Spain. Écoscience3:299–310
Sáenz J, Rodríguez-Puebla C, Fernández J, Zubillaga J (2001) Interpretation of interannual wintertemperature variations over southwestern Europe. J Geophys Res 106:20641–20652
Schultz J, Neuwirth B, Friedrichs DA, Löffler J, Winiger M (2008) Growth responses to NAOalong a Central European West-East transect. In: Elferts D, Brumelis G, Gärtner H, Helle G,Schleser G (eds) TRACE – Tree rings in archaeology, climatology and ecology, vol. 6. GFZPotsdam, Scientific technical report STR 08/05, Potsdam, pp 17–24
Vicente-Serrano SM, Lopez-Moreno JI (2006) The influence of atmospheric circulation at differentspatial scales on winter drought variability through a semi-arid climatic gradient in northeastSpain. Int J Climatol 26:1427–1453
Wigley TML, Briffa KR, Jones PD (1984) On the average value of correlated time series, withapplications in dendroclimatology and hydrometeorology. J Clim Appl Meteorol 23:201–203

Ecological Impacts of the North AtlanticOscillation (NAO) in Mediterranean Ecosystems
Oscar Gordo, Carles Barriocanal, and David Robson
Abstract Large-scale climate indices have received much attention in recent yearsin ecology-climate research due to the advantages they have over typically usedlocal weather variables, such as temperature or rainfall. In the Mediterranean, theNorth Atlantic Oscillation (NAO) is a major forcing of climate patterns, especiallyprecipitation. More than 60 studies to date have demonstrated the effects of theNAO on both terrestrial and aquatic Mediterranean ecosystems. In terrestrial ecosys-tems, the NAO affects the phenology and growth of plants and crop yields. It alsoaffects the condition and diet of mammals and disease-related mortality in amphib-ians. The effects of the NAO are probably better known in marine ecosystems,where the impact on the hydrodynamics of the water column and currents is feltin the dynamics of populations from plankton to fishes in both pelagic and ben-thonic environments. Additionally, birds are an especially well studied taxon whenit comes to effects of the NAO. The NAO has been shown to affect the populationdynamics of water birds by impacting the availability and extent of their habitatand by influencing dispersal decisions of individuals. The NAO plays an essentialrole in the migration of birds throughout the Mediterranean basin, and it is probablya reason for the observed advance of arrival dates during the spring in Europe. Inspite of the notable number of studies carried out to date, we are far from knowingaccurately the ecological impacts of the NAO on Mediterranean ecosystems. Moreefforts are needed to understand regional differences in the NAO effects within theMediterranean basin and how they compare with more northern latitudes of Europe.
Keywords Birds · Climate · Ecosystem · Phenology · Review
1 Why Using Large Scale Climate Indices in Ecology?
We are all aware that environmental conditions, defined as the set of abiotic vari-ables to which organisms are subjected, shape the distribution, abundance, behavior
O. Gordo (B)Departamento de Zoología y Antropología Física, Universidad Complutense de Madrid,Madrid, Spaine-mail: [email protected]
153S.M. Vicente-Serrano, R.M. Trigo (eds.), Hydrological, Socioeconomicand Ecological Impacts of the North Atlantic Oscillation in the Mediterranean Region,Advances in Global Change Research 46, DOI 10.1007/978-94-007-1372-7_11,C© Springer Science+Business Media B.V. 2011

154 O. Gordo et al.
and ultimately the evolution of organisms (Begon et al., 2006). Among environ-mental drivers, climate is recognized as one of the most important abiotic factors.Therefore, one should not be surprised that organisms are responding to the ongoingclimate change, even though observed changes in Earth’s climate have so far beenrelatively small (e.g., the global mean annual temperature has increased only byabout 0.7◦C during the last century (Solomon et al., 2007)). Even though many otherfactors operate on a long-term temporal scale (e.g., density-dependent processes,land-use transformations, etc.) and may prevent us from establishing unambigu-ously a causal link between climate change and some responses of organisms (Salaet al., 2000; Forchhammer and Post, 2004), evidence of climate change impacts onorganisms is abundant. The impacts are widespread, ranging from the equator tothe poles in both terrestrial and aquatic ecosystems and suggesting a climate changeimprint on the biosphere at a global scale (Parmesan and Yohe, 2003; Root et al.,2003). Climate-induced responses range from the plasticity of many traits to adaptto weather variability to persistent alterations in ecosystem functioning, communitycomposition and functional interactions among species. Therefore, climate changesignals are already apparent on all biological scales (Parmesan, 2006; Rosenzweiget al., 2008).
Given the current global climate change scenario, there is an urgent need tounderstand better how organisms are affected by climate. This understanding isessential to the accurate prediction of the biological consequences of the ongoingalterations of climate and from this to delineate the necessary actions to ensureconservation of natural populations, communities and ecosystems. One of the mainchallenges in the study of the effects of climate on organisms is to find the key cli-mate parameter controlling a certain biological phenomenon and its temporal andspatial scales (Hallett et al., 2004; Stenseth and Mysterud, 2005; Gordo, 2007).Temperature is probably the most frequently used climate variable in ecologi-cal research. In fact, many biological processes are temperature-dependent (e.g.,metabolism, development, activity, etc.), and thus, one may make sound predictionsabout its effect. In addition, temperature is the climate variable with the most homo-geneous and coherent pattern of change across the globe during the last century(i.e., global warming; Solomon et al., 2007). However, temperature is not the onlyimportant variable. Other variables, such as precipitation (rainfall and snow), solarradiation, wind, etc., are also essential for individual survival and ecosystem func-tioning and are, in some cases, as in arid regions, more important than temperature.Therefore, the key climate variable may differ according to the species or the biolog-ical process under study. Moreover, the effect of a certain climate variable may varyin space, being more influential for some populations than for others (Forchhammeret al., 2002a, b; Stenseth et al., 2004; Doi and Takahashi, 2008). Such complexresponses of organisms to climate are just a reflection of the fact that weather can-not be described simply by temperature or rainfall. Weather is complex to quantifybecause it results from a collection of physical features of the atmosphere at a certainmoment along with their interactions. In addition, weather does not affect organismsin isolation. Climate fluctuations affect all organisms in a certain ecosystem, and itis essential to understand how climate influences organisms and their interactions

Ecological Impacts of the North Atlantic Oscillation (NAO) in Mediterranean. . . 155
with other individuals. In summary, the influence of climate on the individual seemstoo complex to be described simply by one or a few climate variables.
Large-scale climate indices may help one to deal with these complexities result-ing from the heterogeneous influence of climate across taxa and populations. Itis obvious that organisms adapt to climate at a local scale by responding to tem-perature, amount of rainfall, intensity of winds, and so on. However, climate is aparadigm of spatial autocorrelation because sites that are close together resembleeach other in their patterns of temporal variability of climate. This feature arisesfrom the fact that local weather is controlled by atmospheric circulatory patterns,which work on a large scale. Climate indices are able to summarize in a single valuethe weather conditions for a large area. This synthetic nature has been demonstratedto be of great value and use in ecology-climate research, and the application ofclimatic indices has become increasingly frequent during the last decade (Fig. 1).
Climatologists have defined over a dozen large-scale climate indices that gov-ern most of the observable interannual variability of climate at the planetary scale.Among them, the El Niño-Southern Oscillation (ENSO) and the North AtlanticOscillation (NAO) are probably the most commonly used by ecologists and arethose for which the ecological consequences are best known (Stenseth et al., 2002,2003; Forchhammer and Post, 2004). As broadly described in other parts of thisbook, the NAO is a large-scale fluctuation in atmospheric pressure difference alonga north-south gradient between the subtropical North Atlantic region (centered onthe Azores) and the subpolar region (centered on Iceland). The differences in atmo-spheric pressure at sea level between the subtropical and the subpolar centers affectthe speed and direction of the westerly surface winds across the North Atlanticfrom North America to Europe (40◦N–60◦N). As a consequence, the numbers andpaths of storms and their associated weather are affected (Hurrell, 1995; Hurrell andvan Loon, 1997). Furthermore, there are effects on ocean surface temperature andcurrents, which in turn have direct effects on heat transport in the North Atlantic andthe sea ice coverage in the Arctic region (Ottersen et al., 2001; Stenseth et al., 2003).Although present throughout the year, the greatest interannual and decadal variabil-ity is seen during the boreal winter, when the atmosphere is most dynamically active
Year
5
10
15
20
Num
ber
of s
tudi
es
Aquatic (34)
Terrestrial (31)
2000 2002 2004 2006 2008 2010
Fig. 1 Number of publishedstudies using the NorthAtlantic Oscillation as anexplanatory variable of anybiological phenomena interrestrial or aquaticecosystems of theMediterranean region Source:Isi Web of Knowledge(access date 1-10-2010)

156 O. Gordo et al.
(Hurrell, 1995). The NAO is the most robust mode of recurrent atmospheric behav-ior in the North Atlantic and has been suggested as the most probable cause forthe remarkable changes in the climate over the middle and high latitudes of theNorthern Hemisphere during recent decades (Hurrell and van Loon, 1997; Hoerlinget al., 2001; Visbeck et al., 2001).
Positive values of the NAO are associated with more frequent and stronger winterstorms crossing the Atlantic Ocean on a more northerly track, leading to warmer andwetter conditions in northern Europe and in the eastern coastal areas of the UnitedStates (Ottersen et al., 2001; Visbeck et al., 2001; Mysterud et al., 2003; Stensethet al., 2003; Forchhammer and Post, 2004). In contrast, during negative phases ofthe NAO, the westerlies are weakened and become less frequent, and the warm andwet winter weather remains over North America, leaving northern Europe cold anddry. The most important feature arising from a comparison between the positive andthe negative phases of the NAO is that this large-scale atmospheric circulatory pat-tern has a geographically marked differential impact on local weather. Correlationsbetween the NAO and other climate variables, such as temperature and rainfall, varyregionally (Hurrell and van Loon, 1997; Ottersen et al., 2001; Visbeck et al., 2001;López-Moreno and Vicente-Serrano, 2008), and thus, the value and interpretation ofthe NAO as a proxy of climate fluctuations is variable. A paradigmatic example ofregional variability is found between northern and southern Europe. During a posi-tive phase of the NAO, the northward track of storms leads to drought anomalies inthe Mediterranean basin, while northern latitudes enjoy a wetter climate than aver-age. Unfortunately, the heterogeneous effects of the NAO at the continental scaleremain poorly studied in ecology (but see Sanz, 2002, 2003; Jonzén et al., 2006;Gouveia et al., 2008). Moreover, the overwhelming majority of studies about theecological impact of the NAO have been focussed on central and northern Europe(Ottersen et al., 2001; Mysterud et al., 2003; Forchhammer and Post, 2004), wherethe intensity and sign of its effect are quite different from other areas.
2 Impacts of the NAO in Mediterranean Ecosystems
Although local climate is also driven by the NAO in the Mediterranean basin, espe-cially precipitation patterns (Lamb and Peppler, 1987; Rodó et al., 1997; Quadrelliet al., 2001; Trigo et al., 2004; Rodrigo and Trigo, 2007; Vicente-Serrano andCuadrat, 2007), there are few studies describing ecological impacts of the NAOin Mediterranean latitudes. A search in the Web of Science using the next chain“(NAO or North Atlantic Oscillation) and Mediterranean” provided only 65 studiesin the fields of Ecology, Biodiversity and Conservation, Zoology, Forestry, Marineand Freshwater Biology, Fisheries, and Agriculture (Fig. 1). Terrestrial and aquatic(both marine and freshwater) ecosystems have received similar attention (31 vs. 34articles, respectively). Most of the studies have been published in the last few years

Ecological Impacts of the North Atlantic Oscillation (NAO) in Mediterranean. . . 157
in journals such as Climate Research, Fisheries Oceanography, Global ChangeBiology, International Journal of Biometeorology, Journal of Animal Ecology,Journal of Marine Systems, or Progress in Oceanography. Therefore, the studyof ecological impacts of the NAO in Mediterranean ecosystems is recent and hasoccupied many pages in some of the top journals in ecology.
In terrestrial ecosystems, it has been demonstrated that positive NAO values arerelated to increased growth and advancement of spring phenological events, such asflowering, leaf unfolding or pollen release, of trees (Piovesan and Schirone, 2000;Avolio et al., 2008; Campelo et al., 2009; Rozas et al., 2009; Gordo and Sanz, 2010;Orlandi et al., 2010). Nonetheless, proposed mechanisms for the NAO effect ingrowth and phenology were different. In the case of plant growth, the main driveris soil moisture, which is dependent mainly on winter rainfalls, which are in turnstrongly dependent on the NAO (Piovesan and Schirone, 2000; Campelo et al., 2009;Rozas et al., 2009). However, the effect of the NAO on spring plant phenology wouldbe mediated by its effect on spring temperatures (Gouveia et al., 2008; Gordo andSanz, 2010). From a more applied point of view, the NAO has been found to affectthe yields of wheat and citruses in Spain (Gimeno et al., 2002; Rodríguez-Pueblaet al., 2007). Interestingly, wine production and quality were not affected by theNAO in this country (Rodó and Comín, 2000), but they were affected in Portugal(Esteves and Orgaz, 2001). Such differences in crop effects may be due to differ-ences in the regional influence of the NAO on local weather. Therefore, the NAOinfluence could vary even among areas close together within the Mediterraneanbasin.
Evidence of NAO effects in terrestrial animals is almost entirely limited to stud-ies with birds. We still lack in depth knowledge on the NAO effect on invertebrate,amphibian, reptile or mammal distributions, abundances and behavior. In a recentstudy, Martínez-Jauregui et al. (2009) demonstrated that the NAO did not have aneffect on seasonal variation of weight in females of red deer (Cervus elaphus) in alocality in central Spain. Interestingly, the NAO did play an important role in under-standing changes in body weight of females of the same species in populations inScotland and Norway. Geographical differences in the NAO effect are seen oncemore, suggesting that one needs to exercise caution in generalizing the NAO effectover broad areas because its effect shows marked regional differences, especiallybetween the Mediterranean and more northern latitudes in Europe. However, theNAO has been an important predictor of the observed changes during the last 3decades in the diet of the nearly extinct population of Iberian brown bears (Ursusarctos; Rodríguez et al., 2007). By altering the phenology and productivity of someplant species (Gordo and Sanz, 2010), the NAO may play an important role inthe conservation of this iconic species. The NAO has also been demonstrated tobe important to understanding amphibian declines in mountainous lakes of centralSpain (Bosch et al., 2007). In this particular case, the NAO has driven increases inlocal temperatures, which have promoted the spread of a fungus disease that causesmass mortality among amphibians.

158 O. Gordo et al.
The NAO effects in marine ecosystems of the Mediterranean Sea are probablyknown with greater certainty than in terrestrial ecosystems. The NAO affects thewater column hydrodynamics, which in turn affect vertical gradients of mixing,nutrient flow and irradiance, by its control of weather conditions (e.g., temperature,winds, or storms). Knowledge of water column hydrodynamics is essential to anunderstanding of plankton functioning, abundance, and diversity, so it is not surpris-ing that plankton community dynamics are closely related to the NAO fluctuationsin the Mediterranean Sea as well as in other areas (Katara et al., 2008; Kamburskaand Fonda-Umani, 2009; Gladan et al., 2010; Pérez et al., 2010). For instance, in thenorthwestern Mediterranean, dominant zooplankton species vary under positive andnegative phases of the NAO because each phase favors different species by impos-ing different hydrodynamic features (Molinero et al., 2005, 2008; de Puelles et al.,2007; de Puelles and Molinero, 2008). However, the NAO can also show regionaldifferences in its effects in the sea. For instance, Centropages typicus, the common-est calanoid copepod in Mediterranean waters, showed a response to the NAO in itsabundance in populations in the Gulf of Naples that was opposite to its response inthe Bay of Villefranche (Mazzochi et al., 2007).
The NAO effect on hydrodynamics, and consequently on plankton, may have acascade effect on higher trophic levels. Several studies have found significant associ-ations between the NAO and fish and cephalopod abundances in the Mediterranean(Grbec et al., 2002; Relini et al., 2006, 2010; Bridges et al., 2009; Pérez et al.,2010; but see Ravier and Fromentin, 2004). In the northwestern region of theMediterranean Sea, the collapse of the sardine Sardina pilchardus stocks in the1990s has been related to the dominant positive phase of the NAO during recentdecades (Guisande et al., 2004). Similarly, the collapse of the anchovy Engraulisencrasicolus population in 1987 in the Adriatic Sea has been attributed to lowrecruitment due to the extreme positive value of the NAO during the autumn of 1986(Santojanni et al., 2006). Along with the cascade effect through hydrodynamics andplankton, fish abundances could also be indirectly affected by water discharge ofMediterranean rivers, which is closely related to the NAO due to precipitation pat-terns, because the rivers supply nutrients to the sea (Lloret et al., 2001; Cartes et al.,2009).
The NAO has also been related to the strength of some currents within theMediterranean basin. This relationship has direct effects on the horizontal transportof nutrients from some regions to others of the sea, enhancing productivity and, asconsequence, the richness of marine communities. For instance, population dynam-ics of the hake (Merluccius merluccius), an economically important fishery in theMediterranean, have been linked to the NAO through its effect on currents in theLigurian and Tyrrhenian Seas (Abella et al., 2008; Massutí et al., 2008).
It is not only the abundance and dynamics of marine organisms that are affectedby the NAO. The NAO has also been suggested as the cause of the increase ofthermophilic species in the Adriatic Sea as a result of its control over sea temperature(Dulcic et al., 2004; Grubelic et al., 2004).
The NAO fingerprint has also been detected in benthonic communities. Forinstance, periodical surveys of the benthic macrofauna (especially polychetes) in

Ecological Impacts of the North Atlantic Oscillation (NAO) in Mediterranean. . . 159
the Bay of Banyuls-sur-Mer (France) since the 1960s have shown notable changesthat have been partially attributed to NAO fluctuations (Lebrune et al., 2007). Thisfingerprint can reach even those benthic communities living at depths greater than1000 m. Off the Catalan coast, it was found that changes in the abundance and com-position of deep megabenthos were related to the contrasting values of the NAObetween the surveys carried out at the end of the 1980s and the end of the 2000s(Cartes et al., 2009). Similarly, landings of the shrimp Aristeus antennatus, whichlives at depths between 600 and 800 m, were higher following positive values of thewinter NAO (Maynou, 2008a, b). In this case, there was a time lag in the responseto the NAO, supporting the idea that the NAO effect may be carried by a popula-tion over a number of years following a particular NAO situation (Ottersen et al.,2001).
3 Effects of the NAO on Bird Populations
The NAO has a direct effect on demographic parameters, such as survival, dispersalor fecundity, of many animal species (Ottersen et al., 2001; Mysterud et al., 2003;Forchhammer and Post, 2004). Therefore, one expects to find effects of the NAOon abundances and dynamics of bird populations, and they have indeed been found(Sæther et al., 2004). For instance, a long-term study in a Norwegian population ofdippers (Cinclus cinclus) demonstrated that year-to-year variations in the populationsize were positively related to the NAO index, i.e., the population increased underpositive NAO values (Sæther et al., 2000). Positive NAO values were related tomilder winters, which reduced the duration of the frozen surface of rivers wherethese individuals forage. These improved conditions for foraging enhanced survival,especially of the younger individuals, which recruited in larger numbers the nextspring, leading to an increase in the breeding population.
In the Mediterranean region, the NAO effects on dynamics and demography ofbird populations have been studied in a wide variety of species, such as water birds(Almaraz and Amat, 2004a, b; Figuerola, 2007; Bechet and Johnson, 2008; Jiguetet al., 2008), seabirds (Jenouvrier et al., 2009), raptors (Rodríguez and Bustamante,2003; Costantini et al., 2010), and songbirds (Sanz, 2002, 2003; Grosbois et al.,2006; Rubolini et al., 2007; Balbontín et al., 2009). Such diversity of species demon-strates that NAO signals are apparent in the Mediterranean avifauna as a whole andsupports the notion that the NAO effect can be found across all habitats of a largearea like the Mediterranean.
Several studies have demonstrated effects of the NAO on water birds, a fact thatis not surprising if we take into account the strong dependence of these specieson lakes, ponds and marshlands. The occurrence and extent of wetlands in theMediterranean region are strongly dependent on precipitation patterns, which inturn are driven by the NAO (see other chapters in this book). Almaraz and Amat(2004a, b) showed for the first time that large-scale indices, such as the NAO andthe ENSO, were related to population dynamics of the white-headed duck (Oxyuraleucocephala), a threatened water bird species. Low values of the winter NAO were
160 O. Gordo et al.
linked with increased rainfall, which led to a large expansion of the range of thespecies during the following breeding season as a result of an increase in wet-land surface in Spain (Almaraz and Amat, 2004a). Furthermore, El Niño events(i.e., high ENSO values) were linked with increased rainfall during the summer inthe Mediterranean, which reduced breeding densities and increased markedly therecruitment in the next year.
In similar studies, some breeding populations of waders from the Mediterraneanshowed clear fluctuations in their numbers related to the NAO. In the DoñanaNational Park (southwestern Spain), the black-winged stilt (Himantopus himanto-pus) breeds in numbers from a dozen pairs up to more than 14,000 pairs (whichrepresents about 30% of the European population). Such extreme variability wasrelated to positive and negative phases of the NAO, respectively, which affect theextent of the Doñana marshlands and consequently the phylopatry and dispersalbehavior of this species (Figuerola, 2007). The NAO also drives the hydrologi-cal conditions of another major wetland area of the Mediterranean, the Camargue(southern France). Interestingly, the NAO signal is even detected in those popula-tions that use strongly human-managed habitats, such as the commercial salt pans,for breeding, as in the case of the greater flamingo (Phoenicopterus roseus; Bechetand Johnson, 2008). Even though the date of the start of salt production deter-mines the potential number of breeding pairs of the species each year, the observedbreeding population is also dependent on the water levels in the Camargue lagoons,which are under the NAO influence. A larger extent of marshlands increases thefood availability and thus the opportunities for breeding.
Kestrels are small falcons that inhabit open landscapes in Europe and Asia.During the twentieth century, the lesser kestrel (Falco naumanni) has shown markeddeclines, which have led to a threatened status in most European countries and evento extinction in some. Rodríguez and Bustamante (2003) investigated whether recentclimatic changes were related to declines in populations from southern Spain. Theyfound significant influences of the winter NAO and annual precipitation patternson kestrel demography. However, rainfall outperformed the predictive ability of theNAO in demographic models because rainfall probably captured better the environ-mental variability at the local scale, i.e., at the scale of the breeding colonies of thespecies. Nevertheless, the rainfall in southern Spain and the NAO showed strongcorrelations, and thus the NAO influence on bird demography could be shown forthis terrestrial species via precipitation amount and seasonal distribution. However,in spite of the drier conditions recorded during recent decades in the kestrel coloniesas a result of the prevailing positive phase of the NAO, the authors concluded thatthe effect was not sufficient to explain the population declines and that causes mustbe sought in other environmental factors. In Italy, reproductive decisions and repro-ductive success in a population of kestrels (Falco tinnunculus) were also closelyrelated to rainfall, temperature and the NAO index during both the spring and theprevious winter (Costantini et al., 2010). Contrary to predictions, this populationlaid smaller clutches after mild and dry winters (i.e., positive winter NAO index).The authors hypothesized as possible causes for this result a greater survival oflow-quality individuals during the winter and/or a disruption in prey phenology.

Ecological Impacts of the North Atlantic Oscillation (NAO) in Mediterranean. . . 161
Nevertheless, the mechanism is unclear, and this fact demonstrated the complexitiesof the NAO influence on animal population dynamics. The NAO effect can be medi-ated by conditions in previous seasons, and the balance between current and pastweather determines environmental conditions and thus the observable reproductivesuccess.
In a similar way, the NAO effect may be different among different populations(e.g., Sanz, 2002), and this fact may lead to divergent patterns of response to climatechange. For instance, barn swallows (Hirundo rustica) from Spain are more likelyto survive during their first year of life when the winter NAO is positive, whileDanish swallows show increased mortality during positive phases of the winter NAO(Balbontín et al., 2009). Unlike the black-winged stilt recruitment (Figuerola, 2007),the recruitment probability of the barn swallows to their natal areas was not affectedby the NAO. In these studied populations of swallows, dispersal was explained byanother large-scale climate index, the Southern Oscillation Index (SOI), which alsoshowed an opposite effect between the two populations (Balbontín et al., 2009).
4 Effects of the NAO on Bird Migration
Every year millions of individuals move between breeding and wintering areas inone of the most fascinating events of nature: bird migration. Bird migration haslong been known to be influenced by weather (Newton, 2008). In fact, the arrivalof some migratory species, such as swallows or cuckoos (Cuculus canorus), hasbeen traditionally used as an unequivocal signal of spring onset. This sensitivityof bird migratory phenology to weather has led to a renewed interest in this phe-nomenon in light of the ongoing climate change. If bird migration is sensitive toclimate fluctuations, we can use it as a bioindicator of climate change impacts. Aplethora of studies has demonstrated shifts in the timing of migration for manyspecies along with significant relationships between climate from departure, pas-sage and arrival areas and bird phenology (see reviews in Gordo, 2007; Lehikoinenand Sparks, 2010). Although climate change seems to be the cause for the alterationof bird migration timing during recent decades, the precise ecological and evolution-ary mechanisms by which birds are changing their migratory schedule in responseto the new environmental conditions remain to be elucidated.
The arrival date of a migrant to a certain site depends on two factors: (1) theonset date of migration and (2) the speed of progression across the areas betweenthe start and end points of its journey (Gordo, 2007). Experiments with captive birdshave demonstrated that the onset of migration is controlled by inflexible endogenousrhythms with a genetic basis (Berthold, 2001; Newton, 2008). However, a growingnumber of correlative studies have recently suggested some plasticity in the onsetof migration; i.e., birds may adjust their departure date according to the prevailingweather or to the ecological conditions found at their departure areas (Saino et al.,2004; Gordo et al., 2005; Saino et al., 2007; Gordo and Sanz, 2008). In addition,many other studies have demonstrated that temperature, precipitation, wind, or vege-tation phenology in the passage areas affect bird progression (Gordo, 2007). Overall,

162 O. Gordo et al.
the evidence suggests that climate may influence bird migration both directly andindirectly at several times throughout the year and at several sites. Such complexitiesof climate effects are not surprising if one takes into account the fact that migrantsspend much time moving across vast areas. In this situation, large-scale climateindices become ideal explanatory variables for bird migratory phenology becausethey are capable of summarizing these complexities of local weather in a singlevariable that is easy to interpret and obtain (see Section 1).
The NAO index was employed for the first time by Forchhammer et al. (2002a)to explain migratory phenology of some common migrants in Norway. Since then,more than 30 studies have used this variable to explain interannual variability inarrival dates of migrants (Gordo, 2007; Hubálek and Capek, 2008; Donnelly et al.,2009; Balbontín et al., 2009; Tøttrup et al., 2010). As a norm, most of the time-seriesof arrival dates show a negative relationship with the NAO; i.e., birds arrive earlywhen the NAO (especially the winter NAO index) is positive (Gienapp et al., 2007).Positive NAO values imply milder winters and thus an advance of the spring (e.g.,earlier flowering and leafing of plants, Gordo and Sanz, 2010) and an enhancementof weather conditions during migratory flights (e.g., more tail winds, Hüppop andHüppop, 2003; Sinelschikova et al., 2007). Therefore, the proposed mechanism forthe effect of positive NAO values on migration is the improved environmental con-ditions for migratory progression across Europe in terms of both food availabilityand the weather.
However, this picture may be less clear than it seems because most of the stud-ies have been conducted in northern and western Europe, where the NAO effectis stronger and bird populations are subjected along their entire migratory route tothe NAO influence. If we focus on the particular case of Mediterranean popula-tions, there are few studied cases, and those studies that do exist usually suggest noeffect of the NAO. In Spain, the arrival dates of five common migrants, the whitestork (Ciconia ciconia), the cuckoo, the swift (Apus apus), the barn swallow orthe nightingale (Luscinia megarhynchos), were not related to the NAO, either forearlier individuals or for later ones (Gordo and Sanz, 2008). In a locality of cen-tral Italy, the arrival dates of the first swifts, swallows and nightingales were notrelated to either the winter NAO (December–March) or the spring NAO (March–May) (Rubolini et al., 2007). Here, only one species, the house martin (Delichonurbicum), advanced significantly their arrival in response to positive winter NAO.In a long-term monitoring study of the arrival dates of nightingales in Croatia (Kraljand Dolenec, 2008), the winter NAO did not show any effect. Although the num-ber of studies of Mediterranean bird populations is still small, the evidence suggeststhat the NAO has little influence on their arrival dates. This fact supports the ideathat the NAO effect would be felt mainly from the Mediterranean latitudes north-wards and thus, that only those populations breeding in the northernmost regionsof the continent, and consequently with extensive migratory routes over Europe,would be significantly influenced by the NAO (Forchhammer et al., 2002a; Hüppopand Hüppop, 2003). Moreover, some studies have demonstrated that the negative

Ecological Impacts of the North Atlantic Oscillation (NAO) in Mediterranean. . . 163
relationship with the winter NAO is stronger in short-distance migrants (i.e., thosespecies overwintering in the Mediterranean basin) than in long-distance ones (i.e.,those species overwintering to the south of the Sahara) (Rainio et al., 2006; Tøttrupet al., 2010). If it is considered that positive NAO values are related to drought in theMediterranean and thus to harsh ecological conditions, it follows that short-distancemigrants must benefit from a positive NAO en route but not during their winteringstay in the Mediterranean. Unfortunately, the environmental factors operating on thedynamics of wintering populations in the Mediterranean are poorly known, as is theeffect of the NAO.
Finally, the Mediterranean basin is an obligatory passage area for all long-distance migrants coming from Africa and moving into Europe for breeding(Newton, 2008). In spite of this key role in the European-African migratory system,only two studies have analyzed the NAO effect on passing migratory bird popula-tions. The Istituto Nazionale per la Fauna Selvatica from Italy has been promotingsince 1988 the monitoring scheme Progetto Piccole Isole. This is a network of ring-ing sites located in islands and coastal sites, mainly in the central and western partsof the Mediterranean Sea (Italy, Spain, France and Malta), that uses standardizedprotocols for traping birds (Spina et al., 1993). One of the pioneering and mostactive ringing stations is located on the Italian island of Capri. There, the passagedates of nine trans-Saharan species were positively correlated to the winter NAOboth in early and in late individuals, in opposition to the relationship found betweenthe NAO and passage dates for the same species in ringing sites in Scandinavia(Jonzén et al., 2006). While a positive NAO would enhance migration across Europe(see above), it would impair ecological conditions in northern Africa by droughts inthe Mediterranean basin and rainfall deficits during the monsoon season in WestAfrica (Lamb and Peppler, 1987; Hurrell, 1995; McHugh and Rogers, 2001; Obaet al., 2001; Stige et al., 2006). Therefore, the contrasting effect of the NAO in pas-sage dates of the same species between Mediterranean and Scandinavian latitudesreinforces the idea of the heterogeneous effect of this variable among regions andthus their populations. Populations in Scandinavia have traveled for weeks acrossEurope and have benefited from enhanced conditions for migratory progression dueto positive phases of the NAO. However, in Italy, just after the birds leave Africa,the positive phase of the NAO has the opposite consequences in the environment,and this is reflected in a delayed passage date. However, this is just one study ina single locality. A recent study with 11 migratory species on 3 Spanish islandsdemonstrated that the NAO did not have any effect on passage dates (Robson andBarriocanal, 2011). Moreover, it was the worst explanatory variable of the timingof migration compared to other predictors, such as temperature, vegetation produc-tivity or the SOI. This extreme contrast in the results of different studies highlightsthe urgent need to develop more studies in the Mediterranean region to elucidatethe true effects of the NAO on migratory bird phenology and the potential regionalvariability in the effects in relation to each migratory route across the Mediterranean.

164 O. Gordo et al.
5 Conclusions
There is already a notable number of studies that have assessed the effect ofNAO fluctuations on a wide variety of species and biological phenomena in theMediterranean region (Fig. 1). However, after a comprehensive review of theavailable evidence, we conclude that the impacts of the NAO on Mediterraneanecosystems are still poorly understood, especially on terrestrial ecosystems. We haveidentified three major non-excluding possible causes for the present state of the art:
(i) There is a considerable heterogeneity in the species and biological phenom-ena studied, and consequently, there are only one or a few populations studiedin each case and usually from a single site. This fact hinders seriously ourcapacity to make generalizations because the NAO effect on local weather(the relevant scale for organisms) varies among regions (even within theMediterranean), and we must be very cautious about extrapolating results fromone site to others. In addition, many studies, especially in aquatic ecosystems,just report significant associations between the NAO and biological phenomenawithout providing a mechanistic interpretation of these results. We are firmlyconvinced that without a biological interpretation, results are of limited use.
(ii) Most of the studies have assessed only the effect of the winter NAO index(December–March), probably imitating the pioneering studies carried out innorthern latitudes. Indeed, this phase shows the greater variability (Hurrell,1995), but the potential influence of the NAO in organisms through climatepatterns of other seasons has been completely neglected (but see Gordo andSanz, 2010). The NAO effect on climate over the whole annual cycle is well-known by the climatologists (e.g., this book), but this is another point whereconsiderably additional progress needs to be made. The climatologic literatureis extensive, but unfortunately it is difficult to understand for most ecologists.In addition, the method of studying and defining climate patterns by climatol-ogists is not necessarily the most relevant for organisms (e.g., see Doi et al.,2008). It seems obvious that there is an urgent need to establish multidisci-plinary collaborations between climatologists and ecologists to deal accuratelywith the complex interactions between climate and biosphere.
(iii) Despite the NAO influence on the variability of Mediterranean climate, theNAO may indeed have little effect on Mediterranean ecosystems, especiallyon terrestrial ecosystems, as the remarkable number of studies reportingnon-significant results may demonstrate (e.g., Ravier and Fromentin, 2004;Grosbois et al., 2006; Gordo and Sanz, 2008; Jiguet et al., 2008; Kraljand Dolenec, 2008; Jenouvrier et al., 2009; Robson and Barriocanal, 2011).Moreover, some studies have shown that the NAO effect is overridden by localweather (e.g., Rodríguez and Bustamante, 2003; Gordo and Sanz, 2010). Theextremely variable nature of the Mediterranean climate among years as wellas the complex balances between temperature and rainfall could be the causefor the poor correlations with the NAO. However, a larger sample of studieswould be needed to distinguish unambiguously between a real absence of aneffect and a simple lack of evidence.

Ecological Impacts of the North Atlantic Oscillation (NAO) in Mediterranean. . . 165
In view of the current climate change, we need to improve our knowledgeabout climate effects on organisms. The NAO, as a major driver of climate in theMediterranean region, may become a keystone to the understanding of past, presentand future impacts of climate change on Mediterranean ecosystems. However, themechanisms by which the NAO influences organisms in Mediterranean ecosystemsare different and to some extent more complex than they are in more northern lati-tudes. These facts demand of the Mediterranean ecologists more original thoughtand more effort to start long-term monitoring programs of biodiversity and toenhance and maintain those already in progress.
Acknowledgements Oscar Gordo was supported by a Juan de la Cierva contract (ref. JCI-2009-05274).
References
Abella A, Fiorentino F, Mannini A, Relini LO (2008) Exploring relationships between recruitmentof European hake (Merluccius merluccius L. 1758) and environmental factors in the LigurianSea and the Strait of Sicily (Central Mediterranean). J Mar Syst 71:279–293
Almaraz P, Amat JA (2004a) Complex structural effects of two hemispheric climatic oscillators onthe regional spatio-temporal expansion of a threatened bird. Ecol Lett 7:547–556
Almaraz P, Amat JA (2004b) Multi-annual spatial and numeric dynamics of the white-headedduck Oxyura leucocephala in southern Europe: seasonality, density dependence and climaticvariability. J Anim Ecol 73:1013–1023
Avolio E, Pasqualoni L, Federico S, Fornaciari M, Bonofiglio T, Orlandi F, Bellecci C, RomanoB (2008) Correlation between large-scale atmospheric fields and the olive pollen season inCentral Italy. Int J Biometeorol 52:787–796
Balbontín J, Møller AP, Hermosell IG, Marzal E, Reviriego M, de Lope F (2009) Divergent patternsof impact of environmental conditions on life history traits in two populations of a long-distancemigratory bird. Oecologia 159:859–872
Bechet A, Johnson AR (2008) Anthropogenic and environmental determinants of GreaterFlamingo Phoenicopterus roseus breeding numbers and productivity in the Camargue (Rhonedelta, southern France). Ibis 150:69–79
Begon M, Townsend CR, Harper JL (2006) Ecology: from individuals to ecosystems, 4th edn.Blackwell Publishing, Oxford
Berthold P (2001) Bird migration: a general survey. Oxford University Press, OxfordBosch J, Carrascal LM, Durán L, Walker S, Fisher MC (2007) Climate change and outbreaks of
amphibian chytridiomycosis in a montane area of Central Spain: is there a link? Proc Roy SocLond B 274:253–260
Bridges CR, Krohn O, Deflorio M, de Metrio G (2009) Possible NAO and SST influences onthe eastern bluefin tuna stock – the in-exfish approach. Collect Vol Sci Papers ICCAT 63:138–152
Campelo F, Nabais C, García-González I, Cherubini P, Gutiérrez E, Freitas H (2009)Dendrochronology of Quercus ilex L. and its potential use for climate reconstruction in theMediterranean region. Can J For Res 39:2486–2493
Cartes JE, Maynou F, Fanelli E, Papiol V, Lloris D (2009) Long-term changes in the com-position and diversity of deep-slope megabenthos and trophic webs off Catalonia (westernMediterranean): Are trends related to climatic oscillations? Prog Oceanogr 82:32–46
Costantini D, Carello L, Dell’Omo G (2010) Patterns of covariation among weather conditions,winter North Atlantic Oscillation index and reproductive traits in Mediterranean kestrels.J Zoology 280:177–184
166 O. Gordo et al.
de Puelles MLF, Alemany F, Jansa J (2007) Zooplankton time-series in the Balearic Sea (westernMediterranean): Variability during the decade 1994–2003. Prog Oceanogr 74:329–354
de Puelles MLF, Molinero JC (2008) Decadal changes in hydrographic and ecological time-series in the Balearic Sea (western Mediterranean), identifying links between climate andzooplankton. ICES J Mar Sci 65:311–317
Doi H, Gordo O, Katano I (2008) Heterogeneous intra-annual climatic changes drive differentphenological responses at two trophic levels. Clim Res 36:181–190
Doi H, Takahashi M (2008) Latitudinal patterns in the phenological responses of leaf colouringand leaf fall to climate change in Japan. Glob Ecol Biogeogr 17:556–561
Donnelly A, Cooney T, Jennings E, Buscardo E, Jones M (2009) Response of birds to climaticvariability: evidence from the western fringe of Europe. Int J Biometeorol 53:211–220
Dulcic J, Grbec B, Lipej L, Paklar GB, Supic N, Smircic A (2004) The effect of the hemisphericclimatic oscillations on the Adriatic ichthyofauna. Fresenius Environ Bull 13:293–298
Esteves MA, Orgaz MDM (2001) The influence of climatic variability on the quality of wine. Int JBiometeorol 45:13–21
Figuerola J (2007) Climate and dispersal: Black-winged stilts disperse further in dry springs. PLoSONE 2:e539
Forchhammer MC, Post E (2004) Using large-scale climate indices in climate change ecologystudies. Popul Ecol 46:1–12
Forchhammer MC, Post E, Stenseth NC (2002a) North Atlantic Oscillation timing of long- andshort-distance migration. J Anim Ecol 71:1002–1014
Forchhammer MC, Post E, Stenseth NC, Boertmann DM (2002b) Long-term responses in arcticungulate dynamics to changes in climatic and trophic processes. Popul Ecol 44:113–120
Gienapp P, Leimu R, Merilä J (2007) Responses to climate change in avian migration time –microevolution or phenotypic plasticity? Clim Res 35:25–35
Gimeno L, Ribera P, Iglesias R, de la Torre L, García R, Hernández E (2002) Identification ofempirical relationships between indices of ENSO and NAO and agricultural yields in Spain.Clim Res 21:165–172
Gladan ZN, Marasovic I, Grbec B, Skejic S, Buzancic M, Kuspilic G, Matijevic S, Matic F (2010)Inter-decadal variability in phytoplankton community in the Middle Adriatic (Katela Bay) inrelation to the North Atlantic Oscillation. Estuaries Coasts 33:376–383
Gordo O (2007) Why are bird migration dates shifting? A review of weather and climate effectson avian migratory phenology. Clim Res 35:37–58
Gordo O, Brotons L, Ferrer X, Comas P (2005) Do changes in climate patterns in wintering areasaffect the timing of the spring arrival of trans-Saharan migrant birds? Glob Change Biol 11:12–21
Gordo O, Sanz JJ (2008) The relative importance of conditions in wintering and passage areas onspring arrival dates: the case of long-distance Iberian migrants. J Ornithol 149:199–210
Gordo O, Sanz JJ (2010) Impact of climate change on plant phenology in Mediterraneanecosystems. Glob Change Biol 16:1082–1106
Gouveia C, Trigo RM, DaCamara CC, Libonati R, Pereira JMC (2008) The North AtlanticOscillation and European vegetation dynamics. Int J Climatol 28:1835–1847
Grbec B, Dulcic J, Morovic M (2002) Long-term changes in landings of small pelagic fish inthe eastern Adriatic – possible influence of climate oscillations over the Northern Hemisphere.Clim Res 20:241–252
Grosbois V, Henry PY, Blondel J, Perret P, Lebreton JD, Thomas DW, Lambrechts MM (2006)Climate impacts on Mediterranean blue tit survival: an investigation across seasons and spatialscales. Glob Change Biol 12:2235–2249
Grubelic I, Antolic B, Despalatovic M, Grbec B, Paklar GB (2004) Effect of climatic fluctuationson the distribution of warm-water coral Astroides calycularis in the Adriatic Sea: new recordsand review. J Mar Biol Assoc UK 85:599–602
Guisande C, Vergara AR, Riveiro I, Cabanas JM (2004) Climate change and abundance of theAtlantic-Iberian sardine (Sardina pilchardus). Fish Oceanogr 13:91–101

Ecological Impacts of the North Atlantic Oscillation (NAO) in Mediterranean. . . 167
Hallett TB, Coulson T, Pilkington JG, Clutton-Brock TH, Pemberton JM, Grenfell BT (2004)Why large-scale climate indices seem to predict ecological processes better than local weather.Nature 430:71–75
Hoerling MP, Hurrell JW, Xu T (2001) Tropical origins for recent North Atlantic climate change.Science 292:90–92
Hubálek Z, Capek M (2008) Migration distance and the effect of North Atlantic Oscillation on thespring arrival of birds in Central Europe. Folia Zoologica 57:212–220
Hüppop O, Hüppop K (2003) North Atlantic Oscillation and timing of spring migration in birds.Proc Roy Soc Lond B 270:233–240
Hurrell JW (1995) Decadal trends in the North Atlantic Oscillation: regional temperatures andprecipitation. Science 269:676–679
Hurrell JW, Van Loon H (1997) Decadal variations in climate associated with North AtlanticOscillation. Clim Change 36:301–326
Jenouvrier S, Thibault JC, Viallefont A, Vidal P, Ristow D, Mougin JL, Brichetti P, Borg JJ,Bretagnolle V (2009) Global climate patterns explain range-wide synchronicity in survival ofa migratory seabird. Glob Change Biol 15:268–279
Jiguet F, Doxa A, Robert A (2008) The origin of out-of-range pelicans in Europe: wild birddispersal or zoo escapes? Ibis 150:606–618
Jonzén N, Lindén A, Ergon T, Knudsen E, Vik JO, Rubolini D, Piacentini. D, Brinch C, Spina F,Karlsson L, Stervander M, Andersson A, Waldenström J, Lehikoinen A, Edvardsen E, SolvangR, Stenseth NC (2006) Rapid advance of spring arrival dates in long-distance migratory birds.Science 312:1959–1961
Kamburska L, Fonda-Umani S (2009) From seasonal to decadal inter-annual variability ofmesozooplankton biomass in the Northern Adriatic Sea (Gulf of Trieste). J Mar Syst 78:490–504
Katara I, Illian J, Pierce GJ, Scott B, Wang JJ (2008) Atmospheric forcing on chlorophyllconcentration in the Mediterranean. Hydrobiologia 612:33–48
Kralj J, Dolenec Z (2008) First arrival dates of the Nightingale (Luscinia megarhynchos) to CentralCroatia in the early 20th century and at the turn of the 21st century. Cent Eur J Biol 3:295–298
Lamb PJ, Peppler RA (1987) North Atlantic Oscillation: concept and application. Bull AmMeteorol Soc 68:1218–1225
Lebrune C, Gremare A, Guizien K, Amouroux JM (2007) Long-term comparison of soft bottommacrobenthos in the Bay of Banyuls-sur-Mer (north-western Mediterranean Sea): a reappraisal.J Sea Res 58:125–143
Lehikoinen E, Sparks TH (2010) Bird migration. In: Møller AP, Fiedler W, Berthold P (eds) Effectsof climate change on birds. Oxford University Press, Oxford, pp 89–112
Lloret J, Lleonart J, Solé I, Fromentin JM (2001) Fluctuations of landings and environmentalconditions in the north-western Mediterranean Sea. Fish Oceanogr 10:33–50
López-Moreno JI, Vicente-Serrano SM (2008) Positive and negative phases of the winter-time North Atlantic Oscillation and drought occurrence over Europe: a multitemporal-scaleapproach. J Clim 21:1220–1243
Martínez-Jauregui M, San Miguel-Ayanz A, Mysterud A, Rodríguez-Vigal C, Clutton-BrockTH, Langvatn R, Coulson T (2009) Are local weather, NDVI and NAO consistent determi-nants of red deer weight across three contrasting European countries? Glob Change Biol 15:1727–1738
Massutí E, Monserrat S, Oliver P, Moranta J, López-Jurado JL, Marcos M, Hidalgo M, GuijarroB, Carbonell A, Pereda P (2008) The influence of oceanographic scenarios on the populationdynamics of demersal resources in the western Mediterranean: hypothesis for hake and redshrimp off Balearic Islands. J Mar Syst 71:421–438
Maynou F (2008a) Environmental causes of the fluctuations of red shrimp (Aristeus antennatus)landings in the Catalan Sea. J Mar Syst 71:294–302
Maynou F (2008b) Influence of the North Atlantic Oscillation on Mediterranean deep-sea shrimplandings. Clim Res 36:253–257

168 O. Gordo et al.
Mazzochi MG, Christou ED, Di Capua I, de Puelles MLF, Fonda-Umani S, Molinero JC, NivalP, Siokou-Frangou I (2007) Temporal variability of Centropages typicus in the MediterraneanSea over seasonal-to-decadal scales. Prog Oceanogr 72:214–232
McHugh MJ, Rogers JC (2001) North Atlantic Oscillation influence on precipitation variabilityaround the Southeast African convergence zone. J Clim 14:3631–3642
Molinero JC, Ibañez F, Souissi S, Buecher E, Dallot S, Nival P (2008) Climate control on the long-term anomalous changes of zooplankton communities in the northwestern Mediterranean. GlobChange Biol 14:11–26
Molinero JC, Ibañez F, Souissi S, Chifflet M, Nival P (2005) Phenological changes in the north-western Mediterranean copepods Centropages typicus and Temora stylifera linked to climateforcing. Oecologia 145:640–649
Mysterud A, Stenseth NC, Yoccoz NG, Ottersen G, Langvatn R (2003) The response of terrestrialecosystems to climate variability associated with the North Atlantic Oscillation. In: Hurrell JW,Kushnir Y, Ottersen G, Visbeck MH (eds) The North Atlantic Oscillation: climatic significanceand environmental impact. American Geophysical Union, Washington, pp 235–262
Newton I (2008) The migration ecology of birds. Academic Press, LondonOba G, Post E, Stenseth NC (2001) Sub-Saharan desertification and productivity are linked to
hemispheric climate variability. Glob Change Biol 7:241–246Orlandi F, García-Mozo H, Galán C, Romano B, Díaz de la Guardia C, Ruiz L, del Mar Trigo M,
Domínguez-Vilches E, Fornaciari M (2010) Olive flowering trends in a large Mediterraneanarea (Italy and Spain). Int J Biometeorol 54:151–163
Ottersen G, Planque B, Belgrano A, Post E, Reid PC, Stenseth NC (2001) Ecological effects of theNorth Atlantic Oscillation. Oecologia 128:1–14
Parmesan C (2006) Ecological and evolutionary responses to recent climate change. Annu RevEcol Evol Syst 37:637–669
Parmesan C, Yohe G (2003) A globally coherent fingerprint of climate change impacts acrossnatural systems. Nature 421:37–42
Piovesan G, Schirone B (2000) Winter North Atlantic Oscillation effects on the tree rings of theItalian beech (Fagus sylvatica L.). Int J Biometeorol 44:121–127
Pérez FF, Padín XA, Pazos Y, Gilcoto M, Cabanas M, Pardo PC, Doval MD, Farina-Busto L(2010) Plankton response to weakening of the Iberian coastal upwelling. Glob Change Biol16:1258–1267
Quadrelli R, Pavan V, Molteni F (2001) Wintertime variability of Mediterranean precipitation andits links with large-scale circulation anomalies. Clim Dyn 17:457–466
Rainio K, Laaksonen T, Ahola M, Vähätalo AV, Lehikoinen E (2006) Climatic responses in springmigration of boreal and arctic birds in relation to wintering area and taxonomy. J Avian Biol37:507–515
Ravier C, Fromentin JM (2004) Are the long-term fluctuations in Atlantic bluefin tuna (Thunnusthynnus) population related to environmental changes? Fish Oceanogr 13:145–160
Relini LO, Mannini A, Fiorentino F, Palandri G, Relini G (2006) Biology and fishery of Eledonecirrhosa in the Ligurian Sea. Fish Res 78:72–88
Relini LO, Palandri G, Garibaldi F, Relini M, Cima C, Lanteri L (2010) Large pelagic fish, sword-fish, bluefin and small tunas, in the Ligurian Sea: biological characteristics and fishery trends.Chem Ecol 26:341–357
Robson D, Barriocanal C (2011) Ecological conditions in wintering and passage areas asdeterminants of timing of spring migration in trans-Saharan migratory birds. J Anim Ecol80:320–331
Rodó X, Baert E, Comín FA (1997) Variations in seasonal rainfall in Southern Europe during thepresent century: relationships with the North Atlantic Oscillation and the El Niño-SouthernOscillation. Clim Dyn 13:275–284
Rodó X, Comín FA (2000) Links between large-scale anomalies, rainfall and wine qual-ity in the Iberian Peninsula during the last three decades. Glob Change Biol 6:267–273

Ecological Impacts of the North Atlantic Oscillation (NAO) in Mediterranean. . . 169
Rodrigo FS, Trigo RM (2007) Trends in daily rainfall in the Iberian Peninsula from 1951 to 2002.Int J Climatol 27:513–529
Rodríguez C, Bustamante J (2003) The effect of weather on lesser kestrel breeding success: canclimate change explain historical population declines? J Anim Ecol 72:793–810
Rodríguez C, Naves J, Fernández-Gil A, Obeso JR, Delibes M (2007) Long-term trends in foodhabits of a relict brown bear population in northern Spain: the influence of climate and localfactors. Environ Conserv 34:36–44
Rodríguez-Puebla C, Ayuso SM, Frías MD, García-Casado LA (2007) Effects of climate variationon winter cereal production in Spain. Clim Res 34:223–232
Root TL, Price JT, Hall KR, Schneider SH, Rosenzweig C, Pounds JA (2003) Fingerprints of globalwarming on wild animals and plants. Nature 421:57–60
Rosenzweig C, Karoly D, Vicarelli M, Neofotis P, Wu Q, Casassa G, Menzel A, Root TL, EstrellaN, Seguin B, Tryjanowski P, Liu C, Rawlins S, Imeson A (2008) Attributing physical andbiological impacts to anthropogenic climate change. Nature 435:353–357
Rozas V, Lamas S, García-González I (2009) Differential tree-growth responses to local and large-scale climatic variation in two Pinus and two Quercus species in northwest Spain. Ecoscience16:299–310
Rubolini D, Ambrosini R, Caffi M, Brichetti P, Armiraglio S, Saino N (2007) Long-term trendsin first arrival and first egg laying dates of some migrant and resident bird species in northernItaly. Int J Biometeorol 51:553–563
Saino N, Rubolini D, Jonzén N, Ergon T, Montemaggiori A, Stenseth NC, Spina F (2007)Temperature and rainfall anomalies in Africa predict timing of spring migration in trans-Saharan migratory birds. Clim Res 35:123–134
Saino N, Szep T, Romano M, Rubolini D, Spina F, Møller AP (2004) Ecological conditions duringwinter predict arrival date at the breeding quarters in a trans-Saharan migratory bird. Ecol Lett7:21–25
Sala OE, Chapin FS, Armesto JJ, Berlow E, Bloomfield J, Dirzo R, Huber-Sanwald E, HuennekeLF, Jackson RB, Kinzig A, Leemans R, Lodge DM, Mooney HA, Oesterheld M, LeRoy PoffN, Sykes MT, Walker BH, Walker M, Wall DH (2000) Global biodiversity scenarios for theyear 2100. Science 287:1770–1774
Santojanni A, Arneri E, Bernardini V, Cingolani N, Di Marco M, Russo A (2006) Effects ofenvironmental variables on recruitment of anchovy in the Adriatic Sea. Clim Res 31:181–193
Sanz JJ (2002) Climate change and breeding parameters of great and blue tits throughout thewestern Palaeartic. Glob Change Biol 8:408–422
Sanz JJ (2003) Large-scale effect of climate change on breeding parameters of pied flycatchers inWestern Europe. Ecography 26:45–50
Sæther BE, Sutherland WJ, Engen S (2004) Climate influences on avian population dynamics. AdvEcol Res 35:185–209
Sæther BE, Tufto J, Engen S, Jerstad K, Rostad OW, Skåtan JE (2000) Population dynamicalconsequences of climate change for a small temperate songbird. Science 287:855–856
Sinelschikova A, Kosarev V, Panov I, Baushev AN (2007) The influence of wind conditions inEurope on the advance in timing of the spring migration of the song thrush (Turdus philomelos)in the south-east Baltic region. Int J Biometeorol 51:431–440
Solomon S, Qin D, Manning M, Chen Z, Marquis M, Averyt KB, Tignor M, Miller HL (eds) (2007)Climate change 2007: the physical science basis. Contribution of Working Group I to the 4thassessment report of the Intergovernmental panel on climate change. Cambridge UniversityPress, Cambridge
Spina F, Massi A, Montemaggiori A, Baccetti N (1993) Spring migration across centralMediterranean: general results from the ‘Progetto Piccole Isole’. Die Vogelwarte 37:1–94
Stenseth NC, Ehrich D, Rueness EK, Lingjærde OC, Chan KS, Boutin S, O’Donoghue M,Robinson DA, Viljugrein H, Jakobsen KS (2004) The effect of climatic forcing on popu-lation synchrony and genetic structuring of the Canadian lynx. Proc Natl Acad Sci USA101:6056–6061

170 O. Gordo et al.
Stenseth NC, Mysterud A (2005) Weather packages: finding the right scale and composition ofclimate in ecology. J Anim Ecol 74:1195–1198
Stenseth NC, Mysterud A, Ottersen G, Hurrell JW, Chan KS, Lima M (2002) Ecological effects ofclimate fluctuations. Science 297:1292–1296
Stenseth NC, Ottersen G, Hurrell JW, Mysterud A, Lima M, Chan KS, Yoccoz NG, Ådlandsvik B(2003) Studying climate effects on ecology through the use of climate indices: the NorthAtlantic Oscillation, El Niño Southern Oscillation and beyond. Proc Roy Soc Lond B270:2087–2096
Stige LC, Stave J, Chan KS, Ciannelli L, Pettorelli N, Glantz M, Herren HR, Stenseth NC (2006)The effect of climate variation on agro-pastoral production in Africa. Proc Natl Acad Sci USA103:3049–3053
Tøttrup AP, Rainio K, Coppack T, Lehikoinen E, Rahbek C, Thorup K (2010) Local temperaturefine-tunes the timing of spring migration in birds. Integr Comp Biol 50:293–304
Trigo RM, Pozo-Vázquez D, Osborn TJ, Castro-Díez Y, Gámiz-Fortis S, Esteban-Parra MJ (2004)North Atlantic oscillation influence on precipitation, river flow and water resources in theIberian Peninsula. Int J Climatol 24:925–944
Vicente-Serrano SM, Cuadrat JM (2007) North Atlantic Oscillation control of droughts in north-east Spain: evaluation since 1600 A.D. Clim Change 85:357–379
Visbeck MH, Hurrell JW, Polvani L, Cullen HM (2001) The North Atlantic Oscillation: past,present, and future. Proc Natl Acad Sci USA 98:12876–12877

Impacts of the NAO on Atmospheric Pollutionin the Mediterranean Basin
Uri Dayan
Abstract There are several inherent problems in attributing pollution concen-trations to changes in large-scale atmospheric circulation: (1) the year to yearvariability being modulated by both, changes in circulation and changes in upwindemissions, (2) the shorter life-time of some pollutants precluding a meaningful rela-tionship with changes in circulation, and (3) the both-ways interaction betweentrace gases, aerosols and climate. Simulations of transport of anthropogenic CO forhigh and low phases of the NAO are presented followed by an observational-basedstudy relating the ozone seasonal variability across North Atlantic and the WesternMediterranean to the NAO. Both phases of the NAO controlling dust transport tothe Mediterranean are described: the positive phase during summer over the westernregion and the negative one regulating dust transport over the Eastern Mediterraneanin winter. Low NAO indices have been related to a higher cyclonic activity over thewestern basin. On the contrary, other studies found no correlation between annualwet deposition of African dust-related elements and the NAO. Although, at present,there is no consensus on the process responsible for the observed low-frequencyvariations in the NAO, most of them predict the continuation of the positive NAOstate until the mid twenty-first century implying a predominantly zonal circula-tion over the western Mediterranean. This imply a reduced import of Europeantrace gases, an enhancement of long range transport of air pollutants from NorthAmerican sources and conditions in favor of mobilization and transport of NorthAfrican dust mainly to the western part of this fragile basin.
Keywords Air Pollution · Atmospheric circulation · Environment · MediterraneanBasin · NAO
U. Dayan (B)Department of Geography, The Hebrew University of Jerusalem, Jerusalem, Israele-mail: [email protected]
171S.M. Vicente-Serrano, R.M. Trigo (eds.), Hydrological, Socioeconomicand Ecological Impacts of the North Atlantic Oscillation in the Mediterranean Region,Advances in Global Change Research 46, DOI 10.1007/978-94-007-1372-7_12,C© Springer Science+Business Media B.V. 2011
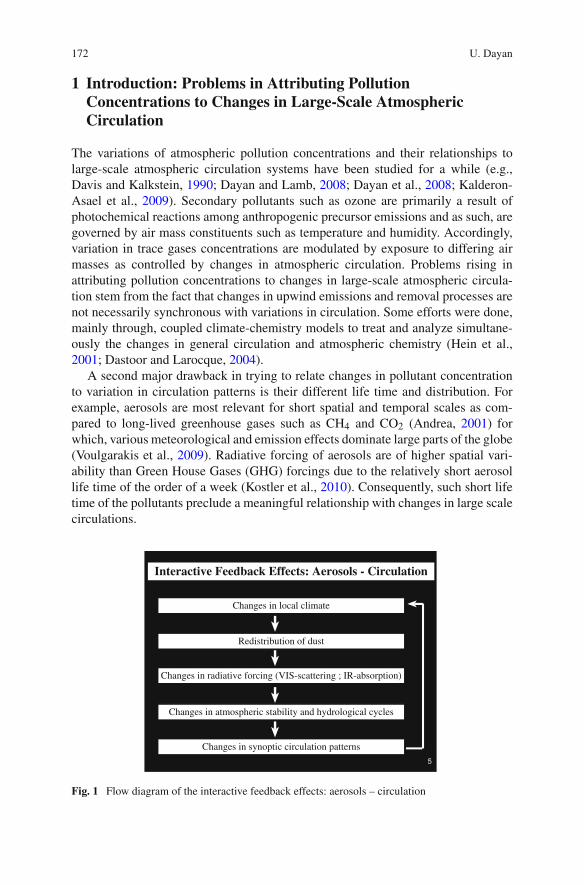
172 U. Dayan
1 Introduction: Problems in Attributing PollutionConcentrations to Changes in Large-Scale AtmosphericCirculation
The variations of atmospheric pollution concentrations and their relationships tolarge-scale atmospheric circulation systems have been studied for a while (e.g.,Davis and Kalkstein, 1990; Dayan and Lamb, 2008; Dayan et al., 2008; Kalderon-Asael et al., 2009). Secondary pollutants such as ozone are primarily a result ofphotochemical reactions among anthropogenic precursor emissions and as such, aregoverned by air mass constituents such as temperature and humidity. Accordingly,variation in trace gases concentrations are modulated by exposure to differing airmasses as controlled by changes in atmospheric circulation. Problems rising inattributing pollution concentrations to changes in large-scale atmospheric circula-tion stem from the fact that changes in upwind emissions and removal processes arenot necessarily synchronous with variations in circulation. Some efforts were done,mainly through, coupled climate-chemistry models to treat and analyze simultane-ously the changes in general circulation and atmospheric chemistry (Hein et al.,2001; Dastoor and Larocque, 2004).
A second major drawback in trying to relate changes in pollutant concentrationto variation in circulation patterns is their different life time and distribution. Forexample, aerosols are most relevant for short spatial and temporal scales as com-pared to long-lived greenhouse gases such as CH4 and CO2 (Andrea, 2001) forwhich, various meteorological and emission effects dominate large parts of the globe(Voulgarakis et al., 2009). Radiative forcing of aerosols are of higher spatial vari-ability than Green House Gases (GHG) forcings due to the relatively short aerosollife time of the order of a week (Kostler et al., 2010). Consequently, such short lifetime of the pollutants preclude a meaningful relationship with changes in large scalecirculations.
Changes in synoptic circulation patterns
Changes in radiative forcing (VIS-scattering ; IR-absorption)
Redistribution of dust
Changes in local climate
Changes in atmospheric stability and hydrological cycles
Interactive Feedback Effects: Aerosols - Circulation
5
Fig. 1 Flow diagram of the interactive feedback effects: aerosols – circulation

Impacts of the NAO on Atmospheric Pollution in the Mediterranean Basin 173
Beside these above mentioned problems, at times, both ways interactions existbetween trace gases, aerosols and atmospheric circulation patterns. Tegen et al.(1996) described the interactive feedback effects between mineralogical aerosolsand atmospheric circulation emphasizing that: “. . .both sources and removal ofdust are dependent on local climate, changes in radiative forcing by dust mayinduce changes in regional circulation patterns and therefore to further changes indust sources and sinks. . .”. Such interactive feedback effects between aerosols andcirculation is shown in Fig. 1.
2 Fundamental Approaches Relating Circulationto Environment - Examples
Due to the strong potential for highly interactive feedback effects between typicalenvironmental phenomena related to several modes of the circulation, a method-ology consisting of both interactions is needed. This methodology will take intoaccount both approaches: on how the circulation affects the environment (i.e.,climatically related variables such as air pollutants) and how the environmentaffects the circulation. Here, we adopted Yarnal (1993) ideas who addressed theseboth approaches followed by some examples on studies relating circulation to theenvironment.
Yarnal explained that in the “Circulation to Environment” classification you firstclassify the circulation into distinct several patterns and then relate it to the envi-ronment, whereas in the second method you classify the circulation data alongenvironment-based criteria (Fig. 2).
The first example demonstrating the impact of circulation on air trace gases isa recent study by Theoharatos et al. (2010) investigating the relationship betweensynoptic-scale circulation patterns, induced thermal stresses and its possible associ-ation to air pollution over Athens, Greece. Here, the authors have shown that poorair quality conditions for SO2 and O3 were related to a northward displacement ofthe Subtropical Jet Stream and large-scale subsidence.
Liu et al. (2009) explained the “Middle East ozone maximum”, a summertimeenhancement in ozone observed by the Tropospheric Emission Spectrometer satel-lite instrument as caused by strong descent in the middle and upper tropospherefeaturing both Arabian and Saharan anticyclones (Fig. 3).
Another study showing the impact of circulation on aerosols was done by Moulinet al. (1998) who used 11-year of daily Meteosat data to develop a satellite-derivedclimatology of African dust transport. They found that the dust transport patternsare related to cyclogenesis over North Africa.
The last example, this time, depicting the impact of air quality on climate isLelieveld et al. (2002) study which indicates the influence of elevated Europeansulfate emissions on cooling of the Mediterranean sea surface temperatures duringthe mid-1970s. This cooling led to a reduction in evaporation and consequently, lessprecipitation over the basin.

174 U. Dayan
Select circulationdata &
environmental data1) Compileclassification2) Relate toenvironment
Classifycirculation databy environment– based criteria
Chooseclassification
methodCirculation toEnvironmentClassification
Environment toCirculation
Classification
Both alternative methods
(From: Yarnal, B. 1993)
Fig. 2 Both alternative methods to relate environmental phenomena to circulation (adapted fromYarnal, 1993)
Fig. 3 Monthly mean ozone mixing ratio in July 2005 at 464 hPa from the Tropospheric EmissionSpectrometer (from Liu et al., 2009)

Impacts of the NAO on Atmospheric Pollution in the Mediterranean Basin 175
3 Circulation to Environment: The Role of the NAOin Controlling the Pathways of Pollutionto the Mediterranean
The North Atlantic Oscillation (NAO) index is determined by the intensity andposition of the Icelandic low and the Bermuda Azores high. Several studies haveidentified the NAO as the dominant mode of variability of the surface atmosphericcirculation in the Atlantic (Barnston and Livezey, 1987; Kushnir and Wallace, 1989;Hurrell, 1995). The NAO affects not only climatic conditions, but also, climatic-derived conditions such as air pollutant transport and dispersion. Consequently, thisis also the oscillation influencing pollution transport over the Northern Hemisphereat large, and more specifically over Western Europe and the western Mediterranean(Eckhardt et al., 2003). Further on, several studies results will be presented to showthe strong influence of the NAO on the strengths and locations of the main pollu-tant transport pathways over the Mediterranean. These changes in these pathwaysare mainly changes in the mean circulation patterns over Western Europe and thewestern Mediterranean Basin associated with the NAO and believed to be the mainfactor for their interannual variations.
Eckhardt et al. (2003) used the Flexpart Lagrangian particle dispersion model tosimulate the transport of CO over Europe and the Mediterranean Basin. CO was usedas tracer of anthropogenic pollution due to its long life time. The simulation wasperformed for the 20% lowest and highest NAO for December through February of1979–1993. They found out that during positive NAO phases, reduced CO outflowfrom Central Europe to the Mediterranean were obtained due to stronger westerlywinds flowing over Europe and most of the pollution was transported northward.These strong westerlies characterizing positive phases of the NAO serve as con-veyor belt to transport O3 formed over the Eastern US to Europe and the WesternMediterranean. This conclusion was reached by Crielson et al. (2003) who used thetropospheric O3 residual technique which utilizes coincident observations of TotalOzone Mapping Spectrometer (TOMS) and stratospheric O3 profiles from the SolarBackscatter Ultraviolet instruments to examine the spatial distribution of O3 and itspositive relationship with the NAO (Fig. 4).
NAO controls not only trace gases but particulate as well. Moulin et al. (1997)used Meteosat data from 1983 to 1994 to develop a satellite climatology of Africandust transport to the Mediterranean. They found that the interannual variationsin dust transport over the Western Mediterranean is well correlated (R = 0.66,p = 0.027) with the NAO index during summertime. This positive correlation isexplained by the frequent passage of cyclones sweeping the western basin duringpositive phases of the NAO and mobilizing dust from North Africa.
Contrary to the NAO positive phase impact on the dust transport during summerover the western basin, Dayan et al. (2008) presented evidence on the role of thenegative phase of the NAO in controlling dust transport during winter to the SouthEastern Mediterranean (SEM). In their study, they examined the atmospheric circu-lation governing dust over the SEM for the “high dust season” (i.e., October–May)

176 U. Dayan
Fig. 4 Springtime depiction showing the interannual variability and positive relationship betweenspringtime tropospheric ozone residual anomaly for Region 5: Eastern North Atlantic and WesternEurope and springtime Hurrell NAO index from 1979–2000 (from Crielson et al., 2003)
for 37 years (1968–2004) and found a significant correlation (R = –0.66) betweenthe interannual variability of accumulated dust over Beer-Sheba, located in southernIsrael which represents the SEM and the NAO modulating the cyclonic activity overthe Mediterranean (Fig. 5).
These results indicate that the synoptic system that produces the majority of thedust over the SEM is the Cyprus Low, a cold cyclone, contributing over 2/3 of both,the total yearly dust and rain fields. Namely, the same synoptic system controls bothmodes of deposition, i.e., wet and dry, and therefore have a similar relationship withthe NAO over the SEM.
In another study, Avila and Roda (2002) could not find any correlation betweenthe NAO and wet deposition of African dust over a rural western Mediterranean sitein north-east Spain. They suggested that contrary to the Eastern Mediterranean, thetwo variables controlling wet deposition over the Western Mediterranean vary inan opposite direction with respect to the NAO, i.e., precipitation inversely and dustupdraft directly, therefore, canceling each other effects.
In summary we can say that both phases of the NAO have a major role in control-ling the transport of particulate matter (mineralogical dust) over the MediterraneanBasin. However, this control is seasonal dependent and differs substantially betweenthe two Mediterranean halves, with the positive phase of the NAO affecting theWestern Mediterranean during summertime, whereas, its negative phase produces alarger impact over the Eastern Mediterranean and during winter.

Impacts of the NAO on Atmospheric Pollution in the Mediterranean Basin 177
Fig. 5 Annual variation of accumulated dust over southern Israel representing the SEM forOctober–May (dashed) and the NAOI averaged over December–March (solid) (from Dayan et al.,2008)
4 Environment to Circulation: Influence of GHG InducedClimate Change on the NAO
In the last section under the “Circulation to Environment” concept, we dealt withthe role of the NAO in controlling the export and import pathways of pollution tothe Mediterranean Basin based on observations. Here, we will present some studiesresults, based mainly, on atmospheric model simulations to demonstrate the influ-ence of the increase GHG concentrations on the NAO variability as a sign of globalclimate change.
Paeth et al. (1999) examined the NAO variability with an observational data setand several model data sets including GHG-induced external forcings. They haveshown that the IPCC (BAU) scenario results predict the continuation of the recentpositive NAO phase until mid of the twenty-first century. Furthermore, they foundstatistical evidence that radiative forcing due to increasing GHG concentrations hasan impact on the simulated variability of the NAO on time-scale exceeding 60 years.Never the less, such evidence could not be discerned for the real NAO due to itsstrong interannual variability. The implication of a persisting positive phase of theNAO for the next 30–50 years is a predominantly zonal circulation over WesternEurope and less pollution from European sources transported to the MediterraneanBasin.
Osborn (2004) analyzed the simulated response of the winter NAO to GHGforcing using seven coupled climate models. Even though, not all models showedagreement between NAO pattern and regional scale changes expressed as sea levelpressure trends for winter atmospheric circulation, a clear correspondence wasfound for two coupled ocean-atmosphere models, the CCSR (Emori et al., 1999)and the ECHAM-4 (Bacher et al., 1998). All models showed a mean increase of0.25 hPa/K of global mean temperature increase caused by enhanced GHG forcing

178 U. Dayan
over the Mediterranean Basin. Osborn (2004) main conclusion is that a combinationof internal variability and GHG forcing as external variability, has contributed to theNAO increase observed from the 1960s to the 1990s leading to strongest zonal windover Europe strengthening meridional flow over the Mediterranean.
Based on numerous papers indicating an existing positive relationship betweenGHG and the NAO (e.g., Paeth et al., 1999; Osborn, 2004; Stephenson et al., 2006),Dayan and Lamb (2005) analyzed the atmospheric circulation that controls wetdeposition over Europe and the northern Mediterranean. A positive phase of theNAO is indicative of a predominantly zonal circulation over Europe as comparedto a negative phase characterized by relatively strong meridional flows (Paeth et al.,1999). The predominance of the meridional flow and sulfate loaded-deposition yearsfound by Dayan and Lamb (2005) is consistent with the significant negative correla-tion (R = –0.43, p < 0.005) obtained between the 16-year time series of the 925 hPameridional wind and the NAO. A further confirmation of this phenomenon is the sig-nificant correlation (R = –0.39, p < 0.005) found between the meridional wind andsulfate deposition over Europe. The overall downward trend in sulfate depositionobserved for the last 16 years over Europe and the northern Mediterranean Basin,the concurrent increases in average temperature (Klein Tank et al., 2002) and theincreased frequency of extreme warm-weather events for the summer (Domonkoset al., 2003) suggest, along with the decline in SO2 emissions, that this period wascharacterized by predominantly zonal circulation, as indicated by the trend towardsgreater prevalence of positive NAO. Consequently, Dayan and Lamb (2005) reachedthe conclusion that negative NAOI years correspond to predominant meridional flowleading to more sulfate deposition over Europe as compared to positive NAO yearscharacterized by a zonal flow and less pollution (Fig. 6). Their conclusion corrobo-rates Duncan and Bey (2004) who emphasized the strong influence of the NAO onthe strengths and locations of the export pollution (e.g., O3) pathways from Europeto the Mediterranean and northern Africa.
Fig. 6 Block diagram of themeteorological and chemicalcontributions to changes insulfate deposition oversouthern Europe (from Dayanand Lamb, 2005)
Impacts of the NAO on Atmospheric Pollution in the Mediterranean Basin 179
5 Future Phases of the NAO and Possible Implications on AirPollution over the Western and Eastern Mediterranean Basin
Most recent studies point at the difficulty to identify a preferred timescale of vari-ability for the NAO as well as the large amount of its intra-seasonal variability asmain reasons for the lack of consensus on the process responsible for its presentobserved low-frequency variations (Hurrell and Deser, 2010) and, obviously, ourinability to predict its trend and variability in the future. Moreover, although thisoscillation is natural, it seems to respond to external forcing in addition to itsinherent internal variability.
Kuzmina et al. (2005), based on results obtained from 12 coupled climate mod-els, found that the forced model runs resulted in stronger NAO as compared to thecontrol runs. This indicates a possible intensification of the NAO in the future withfurther increases in GHG concentrations in the atmosphere.
In contrary to Kuzmina et al. (2005) study, Selten et al. (2004) suggest that thestrengthening of the westerlies over the North Atlantic is not caused by GHG butrather to a climate variation governed by increased precipitation over the tropicalIndian Ocean.
To summarize this section, we can say, with much prudence, that presently thereare two opposed scientific views as regarded to the NAO trend and variability, sev-eral researchers consider that external climate forcings, such as volcanic eruptionsor increased GHG, are the main drivers for a predominance of positive phases ofthe NAO while other groups consider that physical driven processes internal to theclimate system are responsible in driving NAO variations.
Until the scientific community understands better the causes and effects of theobserved NAO trend and variability, we should restrict our conclusions on futureNAO’s implication on air pollution over the Mediterranean Basin by presenting theanticipated impacts of both prevailing modes (positive and negative phases) overthis basin as experienced so far. Based on our present limited knowledge, the futureNAO’s implications are as follow:
A prevailing positive NAO over the Western Mediterranean is likely to:
(1) Reduce the import of European trace gases;(2) Enhance the long range transport of pollutants from upwind eastward sources,
e.g., North America;(3) Enhance the mobilization and transport of dust from North African sources to
the Mediterranean.
A prevailing negative NAO over the Eastern Mediterranean is expected to enhancecyclonic conditions favorizing the passage of more deep cyclones mobilizing andtransporting dust from North African sources to this part of the basin.

180 U. Dayan
References
Andrea MO (2001) The dark side of aerosols. Nature 409:671–672Avila A, Roda F (2002) Assessing decadal changes in rainwater alkalinity at a rural Mediterranean
site in the Montseny Mountains (NE Spain). Atmos Environ 36:2881–2890Bacher S, Oberhuber JM, Roeckner E (1998) ENSO dynamics and seasonal cycle in the tropical
Pacific as simulated by the ECHAM4/OPYC3 coupled general circulation model. Clim Dyn14:1659–1672
Barnston AG, Livezey RE (1987) Classification, seasonality and persistence of low frequencyatmospheric circulation patterns. Mon Wea Rev 115:1083–1125
Crielson JK, Fishman J, Wozniak AE (2003) Intercontinental transport of troposheric ozone: astudy of its seasonal variability across the North Atlantic utilizing tropospheric ozone residualsand its relationship to the North Atlantic Oscillation. Atmos Chem Phys 3:2053–2066
Dastoor AP, Larocque Y (2004) Global circulation of atmospheric mercury: a modeling study.Atmos Environ 38:147–161
Davis RE, Kalkstein LS (1990) Using a spatial synoptic classification to assess changes inatmospheric pollution concentrations. Phys Geog 11:320–342
Dayan U, Lamb D (2005) Global and synoptic-scale weather patterns controlling wet atmosphericdeposition over Central Europe. Atmos Environ 39:521–533
Dayan U, Lamb D (2008) Influence of atmospheric circulation on the variability of wet sulfatedeposition. Int J Climatol 28:1315–1324
Dayan U, Ziv B, Shoob T, Enzel Y (2008) Suspended dust over Southeastern Mediterranean andits relation to atmospheric circulations. Int J Climatol 28:915–924
Domonkos P, Kysely J, Piotrowicz P, Petrovic P, Likso T (2003) Variability of extreme temperatureevents in South-Central Europe during the 20th century and its relationship with large-scalecirculation. Int J Climatol 23:987–1010
Duncan BN, Bey I (2004) A modeling study of the export pathways of pollution fromEurope: seasonal and interannual variations (1987–1997). J Geophys Res 109:D08301.doi:10.1029/2003JD004079
Eckhardt D, Stohl A, Bierle S, Spichtinger N, James P, Forster C, Junker C, Wagner T, Platt U,Jennings SG (2003) The North Atlantic Oscillation controls air pollution transport to the Arctic.Atmos Chem Phys 3:1769–1778
Emori S, Kozawa T, Abe-Ouchi A, Numaguti A, Kimoto M, Nakajima T (1999) Couple ocean-atmosphere model experiments of future climate change with an explicit representation ofsulfate aerosol scattering. J Meteorol Soc Jpn 77:1299–1307
Hein R, Dameris M, Schnadt C, Land C, Grewe V, Kohler I, Ponater M, Sausen R, Steil BB,Landgraf J, Bruhl C (2001) Results of an interactively coupled atmospheric chemistry – generalcirculation model: comparisons with observations. Annales Geophysicae 19:435–457
Hurrell JW (1995) Decadal trends in the North Atlantic Oscillation: regional temperatures andprecipitation. Science 269:676–679
Hurrell JW, Deser C (2010) North Atlantic climate variability: the role of the North AtlanticOscillation. J Mar Syst 79:231–244
Kalderon-Asael B, Erel Y, Sandler A, Dayan U (2009) Mineralogical and chemical characterizationof suspended atmospheric particles over the Eastern Mediterranean based on synoptic-scalecirculation patterns. Atmos Environ 43:3963–3970
Klein Tank AMG, Wijngaard JB, Konen JP, Bohm R, Demaree G, Gocheva A, Mileta M, Petrovic P(2002) Daily dataset of the 20th century surface air temperature and precipitation series for theEuropean climate assessment. Int J Climatol 22:1441–1453
Kostler S, Deutener F, Feichter J, Raes F, Lohman U, Roeckner E, Fischer-Bruns I (2010) A GCMstudy of future climate response to aerosol pollution reductions. Clim Dyn 34:1177–1194
Kushnir Y, Wallace JM (1989) Low frequency variability in the Northern Hemisphere win-ter – geographical distribution, structure and time-scale dependence. J Atmos Sci 46:3122–3142

Impacts of the NAO on Atmospheric Pollution in the Mediterranean Basin 181
Kuzmina SI, Bengtsson L, Jahannenssen OM, Drange H, Bobylev LP, Miles MW (2005)The North Atlantic Oscillation and greenhouse-gas forcing. Geophys Res Lett 32:L04703.doi:10.1029/2004 GL021064
Lelieveld J, Berresheim H, Borrmann S et al (2002) Global air pollution crossroads over theMediterranean. Science 298:794–799
Liu JJ, Dylan B, Jones A, Worden JR, Noone D, Parington M, Kar J (2009) Analysis of thesummertime buildup of tropospheric O3 abundances over the Mid-East and North Africa asobserved by the Tropospheric Emission Spectrometer instrument. J Geophy Res 114:D05304.doi:10.1029/2008JD010993
Moulin C, Lambert CE, Dayan U, Masson V, Ramonet M, Bousquet P, Dulac F (1998) Satelliteclimatology of African dust transport in the Mediterranean atmosphere. J Geophys Res103:13137–13144
Moulin C, Lambert CE, Dulac F, Dayan U (1997) Control of atmospheric export of dust fromNorth Africa by the North Atlantic Oscillation. Nature 387:691–694
Osborn TJ (2004) Simulating the winter North Atlantic Oscillation: the role of internal variabilityand greenhouse gas forcing. Clim Dyn 22:605–623
Paeth H, Hense A, Glowienka-Hense R, Voss R, Cubasch U (1999) The North Atlantic Oscillationas an indicator for greenhouse-gas induced regional climate change. Clim Dyn 15:953–960
Selten FM, Branstator GW, Dijkstra HA, Kliphius M (2004) Tropical origins forrecent and future Northern Hemisphere climate change. Geophys Res Lett 31:L21205.doi:10.1029/2004GL020739
Stephenson DB, Pavan V, Collins M, Junge MM, Quadrelli R (2006) North Atlantic Oscillationresponse to transient greenhouse gas forcing and the impact on European winter climate: aCMIP2 multi-model assessment. Clim Dyn 27:401–420
Tegen I, Lacis AA, Fung I (1996) The influence on climate forcing of mineral aerosols fromdisturbed soils. Nature 380:419–422
Theoharatos G, Pantavou K, Mavrakis A, Spanou A, Katavoutas G, Efstathiou P, Mpekas P,Assimakopoulos D (2010) Heat waves observed in 2007 in Athens, Greece: synoptic con-ditions, bioclimatological assessment, air quality levels and health effects. Environ Res110:152–161
Voulgarakis A, Savage NH, Braesicke P, Wild O, Carver GD, Pyle JA (2009) Interannual variabilityof tropospheric composition: the influence of changes in emission, meteorology and clouds.Atmos Chem Phys Discuss 9:14023–14057
Yarnal B (1993) Synoptic climatology in environmental analysis. Bellhaven Press, London

Evaluation of the Relationship Between the NAOand Rainfall Erosivity in NE Spain Duringthe Period 1955–2006
Marta Angulo-Martínez and Santiago Beguería
Abstract Rainfall erosivity is the ability of precipitation to erode soil.Microerosion processes due to the impact of raindrops on the soil – rainsplash –represent an important mechanism of detachment of soil particles, which might beremoved thereafter by surface runoff. The annual and interannual patterns of rainfallerosivity are controlled by the variability of rainfall intensity. This study analysesthe interannual variability of daily rainfall erosivity due to precipitation in the NEof Spain during the period 1955–2006, and its connection with the North AtlanticOscillation (NAO). It was found that the erosive power of rainfall is stronger dur-ing the negative phase of NAO and weaker during positive NAO conditions, as arethe rainfall amounts. Daily rainfall erosivity series were adjusted to a GeneralizedPareto probability distribution for positive and negative NAO phases for assessingthe effect of NAO on extreme events. Results showed higher values expected fora given return period in most of the area under negative NAO conditions. Thesefindings would be useful in the implementation of soil conservation strategies.
Keywords Rainfall erosivity · EI · North Atlantic Oscillation · R factor · NE Spain
1 Introduction
The concept of rainfall erosivity refers to the ability of any rainfall event to erodesoil. It links together the dynamic properties of rainfall as a consequence of rainfall-generating processes and their impact on the soil surface, and involves two mainmechanisms: (i) rainsplash – the detachment of soil particles due to the kineticenergy of the raindrops –, and (ii) runoff erosion – motion of soil particles by shearstress exerted by the surface runoff. Rainfall erosivity is responsible of changes inthe soil properties as: crusting, disruption of aggregates, removal of nutrient-richparcels of soil, etc. Rainfall erosivity represents one of the main mechanisms ofdegradation in semiarid landscapes where vegetation is scarce. Its influence dependson the characteristics of soil, topography and land use, as well as on other features of
M. Angulo-Martínez (B)Estación Experimental de Aula Dei, Spanish National Research Council (CSIC), Zaragoza, Spaine-mail: [email protected]
183S.M. Vicente-Serrano, R.M. Trigo (eds.), Hydrological, Socioeconomicand Ecological Impacts of the North Atlantic Oscillation in the Mediterranean Region,Advances in Global Change Research 46, DOI 10.1007/978-94-007-1372-7_13,C© Springer Science+Business Media B.V. 2011

184 M. Angulo-Martínez and S. Beguería
the rainfall regime (D’Odorico et al., 2001). Rainfall erosivity estimates are neededfor the estimation of soil erosion amounts through space and time. In the contextof climate change the effect of altered rainfall characteristics combined with otheraspects as biomass and changes in the soil moisture are some major concerns of soilconservation studies.
Empirical studies have demonstrated an exponential relationship between rain-fall intensity and rainfall erosivity (Brown and Foster, 1987; Coutinho and Tomás,1995; Van Dijk et al., 2002). This relationship allows introducing some importantcharacteristics of the rainfall events as: (i) the raindrop size distribution and theirassociated kinetic energy, and (ii) the rainfall intensity at detailed time intervals.
Among the several indices developed to estimate rainfall erosivity the mostextensively used is the USLE/RUSLE R factor, which is calculated from the EI30
index (Wischmeier, 1959; Wischmeier and Smith, 1978; Brown and Foster, 1987;Renard et al., 1997). At many sites worldwide the R factor has been shown to behighly correlated with soil loss (Van der Knijff et al., 2000; Diodato, 2004; Shi et al.,2004; Hoyos et al., 2005; Curse et al., 2006; Onori et al., 2006; Domínguez-Romeroet al., 2007).
One of the main disadvantages of the RUSLE R factor is the need for highfrequency – typically lower than 15 min or pluviograph data –, long data series.Information of this nature is rarely available with adequate spatial and temporalcoverage, and daily records are usually the best available data at most locations.Attempts to estimate rainfall erosivity from daily rainfall records or storm eventdata have been based largely on exponential relationships (Richardson et al., 1983;Bagarello and D’Asaro, 1994; Petkovsek and Mikos, 2004; Angulo-Martínez andBeguería, 2009). Due to the high temporal and spatial variability of rainfall ero-sivity (Angulo-Martínez et al., 2009), accurate records based on long data seriesare required in order to evaluate temporal or spatial trends that may be linked withatmospheric circulation patterns.
Previous work has shown that the spatial and interannual variability of rain-fall intensity can be explained by atmospheric circulation patterns (Hurrell, 1995;Jones et al., 1997; Hurrell et al., 2003). The main atmospheric circulation pat-tern that affects the climate of Europe is the North Atlantic Oscillation (NAO).The NAO is characterized by a north–south sea-level pressure dipolar pattern, withone of the centres located over Iceland and the other one approximately over theAzores Islands. This dipolar pattern reflects the strong contrast in meridional pres-sure over the North Atlantic region. The positive phase of the NAO reflects belownormal heights and pressure across the high latitudes of the North Atlantic, andabove-normal heights and pressure over the central North Atlantic. The NAO neg-ative mode produces high-pressure blocking in the northeast Atlantic, and a moremeridional circulation than the opposite mode (Jacobeit, 1987; Moses et al., 1987).Upper-air troughs and incursions of polar air over the Mediterranean are more fre-quent during negative NAO, and the Atlantic storm tracks are displaced south. Allthese factors are responsible of wetter conditions in the western Mediterranean(Jacobeit, 1987; Moses et al., 1987; Maheras, 1988; Kutiel et al., 1996). In con-trast, the NAO positive mode is characterized by moisture transport across the North

Evaluation of the Relationship Between the NAO and Rainfall Erosivity in NE Spain. . . 185
Atlantic that has a more southwest to northeast orientation and extends furtherinto northern Europe and Scandinavia. Hence, moisture transport and rainfall arereduced over southern Europe and the Mediterranean (Hurrell, 1995; Hurrell andvan Loon, 1997; Moulin et al., 1997; Marshall et al., 2001). The NAO shows a clearsignal throughout the whole year, but with stronger intensity and extension duringwinter due to the stronger meridional gradients.
The influence of the NAO on precipitation over the Iberian Peninsula has beenrecognized in previous studies (Rodó et al., 1997; Esteban-Parra et al., 1998;Rodríguez-Puebla et al., 1998; Serrano et al., 1999), with a clear difference betweenthe western (Atlantic) and eastern (Mediterranean) areas of the region. It is pos-sible to identify a large part of central and southern Spain and southern Portugalfor which the influence of the NAO is dominant. In contrast, the southeast-ern Mediterranean coast of Spain is dominated by more easterly Mediterraneaninfluences.
There are no previous studies relating rainfall erosivity to atmospheric telecon-nection patterns in the Iberian Peninsula. Some works have addressed the influenceof the El Niño-Southern Oscillation (ENSO) on rainfall erosivity for some areas ofUnited States (D’Odorico et al., 2001) and Peru (Romero et al., 2007). Since theNorth Atlantic Oscillation controls the interannual variability of rainfall over theregion, there is a need to know in which way rainfall erosivity is related to NAO.Since rainfall erosivity is more related to single extreme precipitation events thanto average events, the relationship between the NAO and rainfall erosivity is notnecessarily explained by the negative correlation between the NAO and total pre-cipitation amounts. In addition, this knowledge may help agricultural managers totake soil conservation measures to protect the soil.
The aim of this study is to assess the influence of the NAO on daily rainfall ero-sivity in NE Spain, during the period 1955–2006. A second objective is to identifythe changes in the probability of occurrences of extreme daily erosivity events inrelation with daily NAO phases.
2 Study Area and Methods
2.1 Study Area
The study area covers the northeast of Spain, encompassing an area of about147,000 km2 that corresponds to the administrative territorial province demarkswhich conform the Ebro Basin. The study area is geographically complex. Itencloses several mountain ranges and a main central valley, the Ebro basin. The areais limited to the north by the Cantabric Sea, the Cantabrian Range and the Pyrenees,with maximum elevations above 3000 m a.s.l. At the south and southwest the IberianRange closes the Ebro valley, with maximum elevations in the range of 2000–2300m a.s.l. To the east valley is closed by the Catalan Prelittoral Range, with maximumelevations of 1000–1900 m a.s.l., and then continues to the Mediterranean sea.

186 M. Angulo-Martínez and S. Beguería
The climate is influenced by both the Atlantic and the Mediterranean, and theeffect of the relief on precipitation and temperature. The bordering mountain rangesisolate the central valley, blocking the maritime influence and resulting in a con-tinental climate with arid conditions (Lana and Burgueño, 1998; Vicente-Serrano,2005). A climatic gradient in the NW–SE direction is notable, determined by strongAtlantic influences in the north and northwest of the area during much of the year,and the influence of the Mediterranean to the east. The mountain ranges add com-plexity to the climate of the region, with the Pyrenees extending the Atlantic Oceaninfluence to the east by increasing precipitation. Precipitation in inland areas ischaracterized by alternating wet and dry periods as a consequence of the seasonaldisplacement of the polar front and its associated pressure systems. Inter-annualvariability in precipitation can be very high, and prolonged dry periods can befollowed by torrential rainfall events that last for several days. The most extremeprecipitation events have been recorded along the Mediterranean seaside (Romeroet al., 1998; Llasat, 2001; Peñarrocha et al., 2002).
Rainfall erosivity reproduces the characteristics of the precipitation in the studyarea, as revealed by station-data (Fig. 1). Three different areas can be recognized,following a NW–SE gradient. The NW zone, influenced by the Atlantic, shows thehighest monthly rainfall values and minimum rainfall erosivity; the highest erosivityis attained at the beginning of the summer, coinciding with late spring storms. Thecentral zone includes the majority of the observatories, with precipitation amountsthat are lower than in the NW zone (although still abundant), though erosivity is
Fig. 1 Homogeneous monthly rainfall erosivity regions in NE Spain (EI index, see Methods,Section 2), and precipitation associated obtained by means hierarchical cluster

Evaluation of the Relationship Between the NAO and Rainfall Erosivity in NE Spain. . . 187
Fig. 2 Spatial surface of the cultivated soil in the NE Spain (68,000 km2); data: Corine LandCover version 8/2005 (EEA, 2000)
greater and shows two annual peaks, one in late spring (May–June) and a second(highest) at the end of summer (August–September). The NE zone has a typicalMediterranean rainfall behavior, with maxima in spring and autumn and highesterosivity in autumn. It is important to note that the spring rainfall peaks are not aserosive as those of the autumn, due to differences between these seasons in rainfallgeneration mechanisms. Spring rainfall events are usually frequent, but tend to havelow intensity. In contrast, precipitation in autumn is usually attributable to a fewvery intense events.
Due to its complex climatology (as a consequence of being a meteorologicalborder region) and the contrasted relief, the Ebro Basin has a long history of social,economic and environmental damage caused by extreme rainfall events (García-Ruiz et al., 2000; Lasanta, 2003; Llasat et al., 2005). The main activity in this areais agriculture, representing approximately 46% of the land use. It is extended aroundthe Ebro valley occupying a broader area close to the Mediterranean coast (Fig. 2).During winter agricultural soils remain uncovered. Consequently, rainfall erosivityis the principal cause of soil erosion with no limiting factor at that time. Mountainareas represent approximately 20% of the study region.
2.2 Daily Rainfall Erosivity Database
The database consisted of 156 daily rainfall series from the Spanish MeteorologicalAgency (AEMET) for the period 1955–2006 (Fig. 3). Data on cumulativeprecipitation were taken every day at 0600 LT. The series were obtained via a
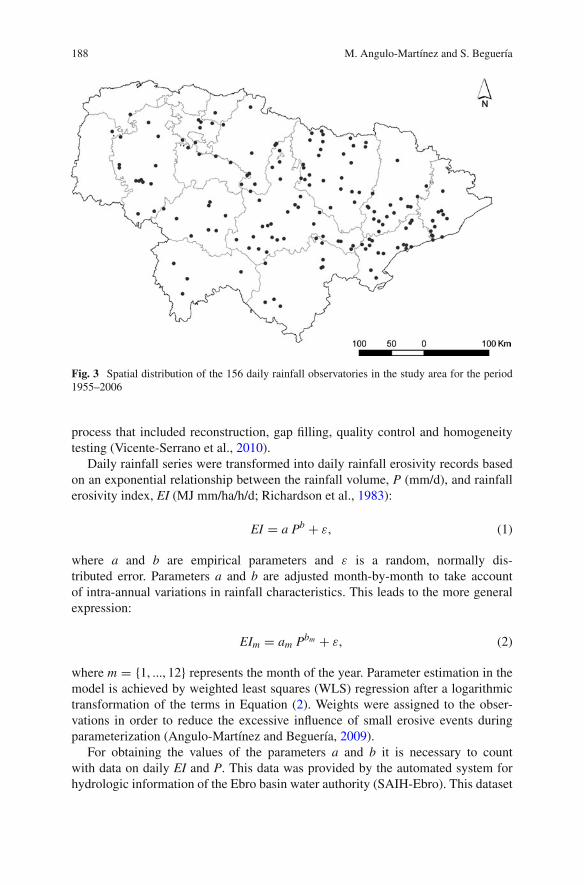
188 M. Angulo-Martínez and S. Beguería
Fig. 3 Spatial distribution of the 156 daily rainfall observatories in the study area for the period1955–2006
process that included reconstruction, gap filling, quality control and homogeneitytesting (Vicente-Serrano et al., 2010).
Daily rainfall series were transformed into daily rainfall erosivity records basedon an exponential relationship between the rainfall volume, P (mm/d), and rainfallerosivity index, EI (MJ mm/ha/h/d; Richardson et al., 1983):
EI = a Pb + ε, (1)
where a and b are empirical parameters and ε is a random, normally dis-tributed error. Parameters a and b are adjusted month-by-month to take accountof intra-annual variations in rainfall characteristics. This leads to the more generalexpression:
EIm = am Pbm + ε, (2)
where m = {1, ..., 12} represents the month of the year. Parameter estimation in themodel is achieved by weighted least squares (WLS) regression after a logarithmictransformation of the terms in Equation (2). Weights were assigned to the obser-vations in order to reduce the excessive influence of small erosive events duringparameterization (Angulo-Martínez and Beguería, 2009).
For obtaining the values of the parameters a and b it is necessary to countwith data on daily EI and P. This data was provided by the automated system forhydrologic information of the Ebro basin water authority (SAIH-Ebro). This dataset

Evaluation of the Relationship Between the NAO and Rainfall Erosivity in NE Spain. . . 189
consisted on 110 series of rainfall data with 15 min resolution, covering the period1997–2007. Daily EI values were calculated from these series following the RUSLEmethodology, and were used for estimating the parameters in Equation (2). Giventhe good spatial coverage of the dataset, spatial fields of the parameters a and b wereobtained by spatial interpolation, and their values at the location of the AEMETobservatories were recorded. These values where then used to obtain daily series ofEI for the period 1955–2006, using the AEMET daily rainfall data.
2.3 Atmospheric Circulation Events: North AtlanticOscillation Index
Following Jones et al. (1997) a North Atlantic Oscillation index (NAOI) was calcu-lated as the normalized difference between time series of sea level pressure recordedat two points in the southwest Iberian Peninsula (Gibraltar, 35◦N 5◦W) and south-west Iceland (Reykjavik, 65◦N, 20◦W). Daily sea-level pressure grids from theds010.0 Daily Northern Hemisphere Sea Level Pressure Grids data set (UniversityCorporation for Atmospheric Research, 1979) were used for calculating the NAOI.We selected those grid points located closest to the mentioned points.
Although the NAO influence is more intense during winter time, in the presentstudy we considered the whole year. Positive and negative events of the NAO indexwere identified as those days with values of the NAO index higher than 0.5 andlower than –0.5, respectively.
2.4 Differences in Daily Rainfall Erosivity Between Positiveand Negative NAO Phases
To evaluate the relationship between the phase of the NAOi and monthly rain-fall erosivity we generated different daily rainfall erosivity (EI) series regardingthe value of NAOi – positive (negative) daily EINAOi series were created with thedaily EI values which were greater (inferior) of 0.5 (−0.5) NAOi values, dur-ing the period 1955–2006. Daily rainfall erosivity was summed to obtain monthlypositive – EINAOi+ – and negative – EINAOi− – rainfall erosivity for NAOi. We com-puted the relative difference EIdif between median annual and monthly and in everyobservatory by:
EIdif = (EINAO− − EINAO+)/
EINAO+, (3)
where EINAOi− and EINAOi+ are the median annual and monthly rainfall erosivityduring negative and positive days of the NAOi. Month maps of EIdif were produceto help visualize spatial differences in the effect of NAOi on rainfall erosivity.
The statistical significance of the relative differences was evaluated using theWilcoxon-Mann-Whitney (WMW) rank test (Siegel and Castelan, 1988). The non-parametric WMW test, though less powerful than the t test, was preferred due to

190 M. Angulo-Martínez and S. Beguería
its robustness against non-normality of the variables (Helsel and Hirsch, 1992). Themonthly rainfall erosivity data series during daily negative NAO were comparedwith the monthly rainfall erosivity data series with the opposite NAO sign, monthby month. The significance level was established at α= 0.05.
2.5 Extreme Value Analysis of Rainfall Erosivity During Positiveand Negative NAO Phases
Changes in the probability distributions of extreme rainfall erosivity depending onthe NAO phase were analyzed using the extreme value theory (Hershfield, 1973).Peaks-over-threshold (POT) series of daily erosivity (EI) were obtained for positiveand negative NAO phases, selecting only the observations for which EI exceededa value corresponding to the 95th percentile of the respective series. The resultingseries were fitted to a Generalized Pareto (GP) distribution by the maximum likeli-hood approach. GP is the limit distribution of a POT variable, provided that the POToccurrences fit a Poisson process, i.e. that they are time independent. The appropri-ateness of the GP distribution to model the daily erosivity POT series was checkedvisually by means of the L-moment ratios diagram and by a Kolmogorov-Smirnovtest (Beguería, 2005; Beguería et al., 2009).
The GP distribution is described by a shape parameter k and a scale parameter α,with probability density function:
f (x) = 1
α
[1 − k
α(x − ε)
](4)
and distribution function:
P(X ≤ x) = 1 −(
1 − κ(x − ε)
α
) 1κ
, (5)
where x is the daily rainfall erosivity exceeding the threshold value ε, which actsas a location parameter. Estimates of α, κ can be obtained by maximum likelihood(Rao and Hamed, 2000). The highest expected precipitation XT over a period of Tyears is obtained as:
XT = ε + α
κ
[1 −
(1
λT
)κ], (6)
where λ is the average number of events per year.Maps of the extreme events corresponding to return periods of 10 and 50 years
were produced for positive and negative NAO phased based on the GP models fit-ted to the POT series. These maps were compared in order to evaluate differences

Evaluation of the Relationship Between the NAO and Rainfall Erosivity in NE Spain. . . 191
in expected extreme events depending on the NAO. Though NAO mostly influ-ences during winter season, some influence can be recognised during autumn andspring. Therefore the POT analysis was applied to the period between October andFebruary.
3 Results
3.1 Differences in Average Daily Rainfall Erosivity BetweenNegative and Positive NAO Phases
The results of the WMW test comparing the distributions of daily erosivity duringpositive and negative NAO phases yielded 92 (59%) of significant series globally.Monthly results are shown in Table 1. These differences were present almost allthe year, however being especially evident from autumn to early spring (October–March). Most observatories reflected this behaviour. During summer (June–August)the influence of NAO on rainfall erosivity was almost non-existent.
The spatial distribution of the significant relative differences between the dailyrainfall erosivity recorded during negative and positive NAO phases for every monthare shown in Fig. 4. The NAO influence can be noted from November to April, withdifferent spatial patterns. From June to October we found no influence of NAO inrainfall erosivity, in addition, the relative differences were not significant for mostof the area during June to September.
Higher differences were found closer to the Mediterranean. The highest differ-ences between positive and negative NAO phases occurred from November to April,though March did not show any difference, most noticeable in the Mediterraneanarea where rainfall erosivity under negative NAO phases was between 6 and 30 timeshigher to the values registered under positive NAO. November showed the highestdifferences, affecting almost one half of the area extending from the Mediterraneancoast to the west towards the centre of the Ebro valley.
Table 1 Difference inmonthly erosivitybetween positive andnegative NAO phases(Wilcoxon-Mann-Witneytest): number and proportionof series with significantdifferences
Month Significant series
Jan 144 (92%)Feb 136 (87%)Mar 68 (44%)Apr 147 (94%)May 109 (70%)Jun 27 (17%)Jul 40 (26%)Aug 36 (23%)Sep 11 (7%)Oct 94 (60%)Nov 152 (97%)Dec 145 (93%)

192 M. Angulo-Martínez and S. Beguería
Fig. 4 Relative differences in median monthly rainfall erosivity during negative and positive NAOphases. White masked areas indicate no significant difference
3.2 Differences in Extreme Rainfall Erosivity Between Negativeand Positive NAO Phases
The GP model provided a very good fit to the POT series of rainfall erosivity, asshown by the L-moment diagrams (Fig. 5). Independently of the sign of the NAO,the empirical L-moments of the rainfall erosivity series plotted closest to the the-oretical curve of the GP distribution. The results of the Kolmogorov-Smirnov testallowed accepting the GP distribution for the data, since only in very few casesthe null hypothesis that the data came from a GP distribution was rejected. Thisresult agrees with recent studies that demonstrated the high performance of the GPdistribution in fitting extreme hydrological variables using partial duration series(Hosking and Wallis, 1987; Madsen and Rosbjerg, 1997; Beguería, 2005). Here wealso found that the GP distribution has a good performance in fitting daily rainfallerosivity data.
By adjusting the daily rainfall erosivity series for the selected months to the GPprobability distribution we obtained the probability of occurrence of daily rainfallerosivity records associated with negative and positive NAO conditions. Resultsshow greatest rainfall erosivity values expected under negative NAO conditions.Differences could be found between observatories. Those located inland to the southof the region did not show significant differences, however, as expected by results
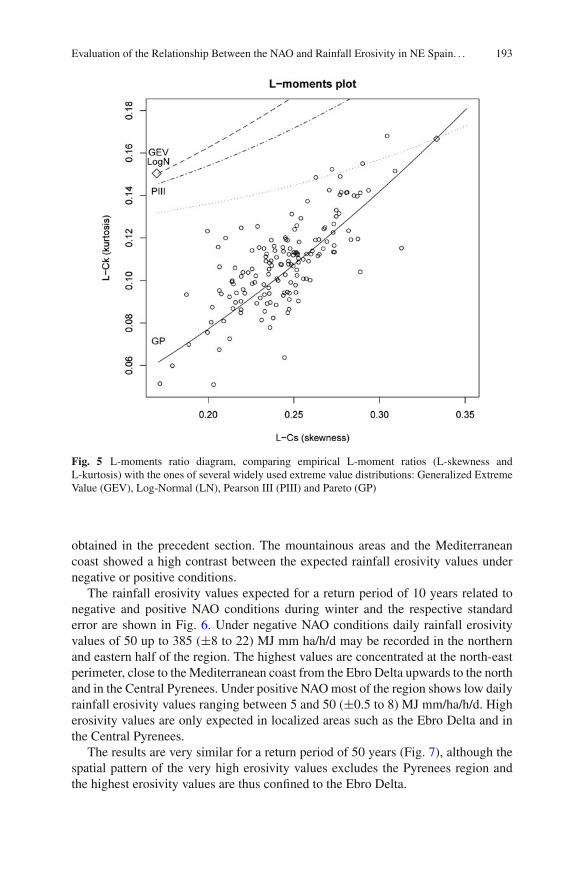
Evaluation of the Relationship Between the NAO and Rainfall Erosivity in NE Spain. . . 193
Fig. 5 L-moments ratio diagram, comparing empirical L-moment ratios (L-skewness andL-kurtosis) with the ones of several widely used extreme value distributions: Generalized ExtremeValue (GEV), Log-Normal (LN), Pearson III (PIII) and Pareto (GP)
obtained in the precedent section. The mountainous areas and the Mediterraneancoast showed a high contrast between the expected rainfall erosivity values undernegative or positive conditions.
The rainfall erosivity values expected for a return period of 10 years related tonegative and positive NAO conditions during winter and the respective standarderror are shown in Fig. 6. Under negative NAO conditions daily rainfall erosivityvalues of 50 up to 385 (±8 to 22) MJ mm ha/h/d may be recorded in the northernand eastern half of the region. The highest values are concentrated at the north-eastperimeter, close to the Mediterranean coast from the Ebro Delta upwards to the northand in the Central Pyrenees. Under positive NAO most of the region shows low dailyrainfall erosivity values ranging between 5 and 50 (±0.5 to 8) MJ mm/ha/h/d. Higherosivity values are only expected in localized areas such as the Ebro Delta and inthe Central Pyrenees.
The results are very similar for a return period of 50 years (Fig. 7), although thespatial pattern of the very high erosivity values excludes the Pyrenees region andthe highest erosivity values are thus confined to the Ebro Delta.

194 M. Angulo-Martínez and S. Beguería
Fig. 6 Spatial distribution of expected daily rainfall erosivity during winter (October–March) cor-responding to a return period of 10 years under negative (a) and positive (b) NAO phases, and theirrespective standard errors (c and d, respectively)
Fig. 7 Spatial distribution of expected daily rainfall erosivity during winter (October–March) cor-responding to a return period of 50 years under negative (a) and positive (b) NAO phases, and theirrespective standard errors (c and d, respectively)

Evaluation of the Relationship Between the NAO and Rainfall Erosivity in NE Spain. . . 195
4 Discussion and Conclusions
Rainfall erosivity bridges the gap between rainfall dynamics and its direct impactover the surface of the soil, taking into account the energy of the raindrops hittingthe soil, and the runoff which will remove the disaggregated soil particles. Thereis an increasing interest regarding the effects of the climate dynamics, especially ina context of climate change, in the environment. However, very few studies haverelated the atmospheric circulation patterns to rainfall erosivity due mostly to thelack of accurate rainfall erosivity series long enough to make this analysis possible.
The NAO is responsible for most of the climatic variability in the North Atlantic,modifying direction and intensity of the westerly winds, the track of the polardepressions and the location of the anticyclones. During the negative phase cyclonesmove southward increasing precipitation on the western Mediterranean. On the con-trary, during the positive phases, the Azores subtropical high is reinforced, leadingto a drier weather in the Mediterranean region.
This study has shown that atmospheric dynamics, in this case the NAO, haveinfluenced interannual variability of rainfall erosivity at NE of Spain for the period1955–2006. Higher rainfall erosivity values were related to negative NAO condi-tions whereas the high pressures associated with positive NAO conditions resultedin lower rainfall erosivity values. This difference was highest towards the east of thestudy area (Mediterranean region), and the centre of the Ebro valley, and during thewinter months (November–April). Agriculture is a major land use in this area, andduring this time of the year the agricultural soils are mostly uncovered and exposedto the erosive power of the rain, intensifying the impact of the NAO on soil erosion.
Knowledge of the spatial and temporal patterns of rainfall erosivity will helpdeepening our understanding of the processes of soil erosion, and might provehelpful for designing soil protection measures.
Acknowledgements We thank the Spanish Meteorological Agency (Agencia Española deMeteorología, AEMET) and the Ebro Basin Water Authority (Confederación Hidrográfica delEbro, CHE) for providing the data used in this study. The research of M.A. was supported by aJAE-Predoc Research Grant from the Spanish National Research Council (Consejo Superior deInvestigaciones Científicas; CSIC).
References
Angulo-Martínez M, Beguería S (2009) Estimating rainfall erosivity from daily precipitationrecords: a comparison among methods using data from the Ebro Basin (NE Spain). J Hydrol379:111–121
Angulo-Martínez M, López-Vicente M, Vicente-Serrano SM, Beguería S (2009) Mapping rainfallerosivity at a regional scale: a comparison of interpolation methods in the Ebro Basin (NESpain). Hydrol Earth Syst Sci 13:1907–1920
Bagarello V, D’Asaro F (1994) Estimating single storm erosion index. Trans Am Soc Agric Eng37:785–791
Beguería S (2005) Uncertainties in partial duration series modelling of extremes related to thechoice of the threshold value. J Hydrol 303:215–230
Beguería S, Vicente-Serrano SM, López-Moreno JI, García-Ruiz JM (2009) Annual and seasonalmapping of peak intensity, magnitude and duration of extreme precipitation events across aclimatic gradient, North-east Iberian Peninsula. Int J Climatol 29:1759–1779

196 M. Angulo-Martínez and S. Beguería
Brown LC, Foster GR (1987) Storm erosivity using idealized intensity distributions. Trans Am SocAgric Eng 30:379–386
Coutinho MA, Tomás PP (1995) Characterization of raindrop size distributions at the Vale FormosoExperimental Erosion Centre. Catena 25:187–197
Curse R, Flanagan J, Frankenberger B, Gelder D, Herzmann D, James D, Krajenski W, KraszewskiM, Laflen J, Opsomer J, Todey D (2006) Daily estimates of rainfall, water runoff and soilerosion in Iowa. J Soil Water Conserv 61:191–199
Diodato N (2004) Estimating RUSLE’s rainfall factor in the part of Italy with a Mediterraneanrainfall regime. Hydrol Earth Syst Sci 8:103–107
D’Odorico P, Yoo J, Over TM (2001) An assessment of ENSO-Induced patterns of rainfall erosivityin the Southwestern United States. J Clim 14:4230–4242
Domínguez-Romero L, Ayuso Muñoz JL, García Marín AP (2007) Annual distribution of rainfallerosivity in western Andalusia, southern Spain. J Soil Water Conserv 62:390–401
EEA (2000) CORINE land cover 2000. European Environment Agency. http://image2000.jrc.itEsteban-Parra MJ, Rodrigo FS, Castro-Diez Y (1998) Spatial and temporal patterns of precipitation
in Spain for the period 1880–1992. Int J Climatol 18:1557–1574García-Ruiz JM, Arnáez J, White SM, Lorente A, Beguería S (2000) Uncertainty assessment in the
prediction of extreme rainfall events: an example from the Central Spanish Pyrenees. HydrolProcess 14:887–898
Helsel DR, Hirsch RM (1992) Statistical methods in water resources. Elesevier, New York, 522 ppHershfield DM (1973) On the probability of extreme rainfall events. Bull Am Meteorol Soc
54:1013–1018Hosking JRM, Wallis JR (1987) Parameter and quantile estimation for the Generalized Pareto
distribution. Technometrics 29:339–349Hoyos N, Waylen PR, Jaramillo A (2005) Seasonal and spatial patterns of erosivity in a tropical
watershed of the Colombian Andes. J Hydrol 314:177–191Hurrell J (1995) Decadal trends in North Atlantic Oscillation and relationship to regional
temperature and precipitation. Science 269:676–679Hurrell J, Kushnir Y, Ottersen G, Visbeck M (eds) (2003) The North Atlantic Oscillation: climate
significance and environmental impacts. Geophys Monogr Ser, vol 134. AGU, Washington, DCHurrell JW, van Loon H (1997) Decadal variations in climate associated with the North Atlantic
oscillation. Clim Change 36:301–326Jacobeit J (1987) Variations of trough positions and precipitation patterns in the Mediterranean
area. J Climatol 7:453–476Jones PD, Jónsson T, Wheeler D (1997) Extension to the North Atlantic Oscillation using early
instrumental pressure observations from Gibraltar and South-West Iceland. Int J Climatol17:1433–1450
Kutiel H, Maheras P, Guika S (1996) Circulation indices over the Mediterranean and Europeand their relationship with rainfall conditions across the Mediterranean. Theor Appl Climatol54:125–138
Lana X, Burgueño A (1998) Spatial and temporal characterization of annual extreme droughts inCatalonia (Northeast Spain). Int J Climatol 18:93–110
Lasanta T (2003) Gestión agrícola y erosión del suelo en la cuenca del Ebro: el estado de lacuestión. Zubía 21:76–96
Llasat MC (2001) An objective classification of rainfall events on the basis of their convec-tive features. Application to rainfall intensity in the North-East of Spain. Int J Climatol 21:1385–1400
Llasat MC, Barriendos M, Barrera A, Rigo T (2005) Floods in Catalonia (NE Spain) since the 14thcentury. In: Benito G, Ouarda TBMJ, Bárdossy A (eds) Palaeofloods, historical data & climatevariability: applications in flood risk assessment. J Hydrol 313:32–47
Madsen H, Rosbjerg D (1997) The partial duration series method in regional index-flood modeling.Water Resour Res 33:737–746
Maheras P (1988) Changes in precipitation conditions in the western Mediterranean over the lastcentury. J Climatol 8:179–189

Evaluation of the Relationship Between the NAO and Rainfall Erosivity in NE Spain. . . 197
Marshall J, Kushnir Y, Battisti D, Chang P, Czaja A, Dickson R, Hurrell J, McCartney M,Saravanan R, Visbeck M (2001) North Atlantic climate variability: phenomena, impacts andmechanisms. Int J Climatol 21:1863–1898
Moses T, Kiladis GN, Diaz HF, Barry RG (1987) Characteristics and frequency of reversals in meansea level pressure in the North Atlantic sector and their relationship to long-term temperaturetrends. J Climatol 7:13–30
Moulin C, Lambert CE, Dulac F, Dayan U (1997) Control of atmospheric export of dust fromNorth Africa by the North Atlantic Oscillation. Nature 387:691–694
Onori F, De Bonis P, Grauso S (2006) Soil erosion prediction at the basin scale using the reviseduniversal soil loss equation (RUSLE) in a catchment of Sicily (southern Italy). Environ Geol50:1129–1140
Petkovsek G, Mikos M (2004) Estimating the R factor from daily rainfall data in the sub-Mediterranean climate of southwest Slovenia. Hydrol Sci J 49:869–877
Peñarrocha D, Estrela MJ, Millán M (2002) Classification of daily rainfall patterns in aMediterranean area with extreme intensity levels: the Valencia region. Int J Climatol 22:677–695
Rao AR, Hamed KH (2000) Flood frequency analysis. CRC Press, Boca Raton, FLRenard KG, Foster GR, Weesies GA, McCool DK, Yoder DC (1997) Predicting soil erosion
by water: a guide to conservation planning with the Revised Universal Soil Loss Equation(RUSLE). Handbook #703. US Department of Agriculture, Washington, DC
Richardson CW, Foster GR, Wright DA (1983) Estimation of erosion index from daily rainfallamount. Trans Am Soc Agric Eng 26:153–160
Rodó X, Baert E, Comin FA (1997) Variations in seasonal rainfall in southern Europe during thepresent century: relationships with the North Atlantic oscillation and the El Niño–Southernoscillation. Clim Dyn 19:275–284
Rodríguez-Puebla C, Encinas AH, Nieto S, Garmendia J (1998) Spatial and temporal pat-terns of annual precipitation variability over the Iberian Peninsula. Int J Climatol 18:299–316
Romero CC, Baigorría GA, Stroosnijder L (2007) Changes of erosive rainfall for El Niño and LaNiña years in Northern Andean highlands of Peru. Clim Change 85:343–356
Romero R, Guijarro JA, Ramis C, Alonso S (1998) A 30-year (1964–1993) daily rainfalldata base for the Spanish Mediterranean regions: first exploratory study. Int J Climatol 18:541–560
Serrano A, Garcia AJ, Mateos VL, Cancillo ML, Garrido J (1999) Monthly modes of variation ofprecipitation over the Iberian Peninsula. J Clim 12:2894–2919
Shi ZH, Cai CF, Ding SW, Wang TW, Chow TL (2004) Soil conservation planning at the smallwatershed level using RUSLE with GIS. Catena 55:33–48
Siegel S, Castelan NJ (1988) Nonparametric statistics for the behavioral sciences. McGraw-Hill,New York
Van der Knijff JM, Jones RJA, Montanarella L (2000) Soil erosion risk assessment in Italy.European Commission—European Soil Bureau, 52 pp
Van Dijk AIJM, Bruijnzeel LA, Rosewell CJ (2002) Rainfall intensity – kinetic energy relation-ships: a critical literature appraisal. J Hydrol 261:1–23
Vicente-Serrano SM (2005) Las sequías climáticas en el valle medio del Ebro: Factores atmos-féricos, evolución temporal y variabilidad espacial. Consejo de Protección de la Naturaleza deAragón, 277 pp
Vicente-Serrano SM, Beguería S, López-Moreno JI, García-Vera MA, Stepanek P (2010) A com-plete daily precipitation database for north-east Spain: reconstruction, quality control andhomogeneity. Int J Climatol 30:1146–1163
Wischmeier WH (1959) A rainfall erosion index for a universal soil-loss equation. Soil Sci SocAm Proc 23:246–249
Wischmeier WH, Smith DD (1978) Predicting rainfall erosion losses: a guide to conservationplanning. USDA Handbook 537. USDA, Washington, DC

Impacts of the North Atlantic Oscillationon Landslides
José Luís Zêzere and Ricardo M. Trigo
Abstract Western Iberia landslides are mostly triggered by rainfall, as, in fact, aremost landslides worldwide. Results obtained using empirical relationships betweenrainfall amount and duration, and slope instability show that critical rainfall condi-tions for failure are not the same for different types of landslides. While rapid debrisflows are usually triggered by very intense showers concentrated in just a few hours,shallow translational soil slips are most commonly triggered by intense precipita-tion falls within the 1–15 days long range. On the contrary, activity of the moredeeply-seated landslides of rotational, translational and complex types is related tosuccessive weeks of nearly constant rainfall, over periods of 30–90 days. Large-scale patterns such as the El Niño and the North Atlantic Oscillation (NAO) changeslowly and have been shown to have an impact in both the precipitation regime andthe temporal occurrence of different landslide types in different areas of the world.In this work a particular attention is devoted to the impact of NAO on the landslideevents that have occurred in the region located just north of Lisbon between 1956and 2010. Results show that the large inter-annual variability of winter precipitationobserved in Portugal is largely modulated by the NAO mode. The application of a3-month moving average to both NAO index and precipitation time series allowedthe identification of many months with landslide activity as being characterized bynegative average values of the NAO index and high values of average precipitation(above 95 mm/month). Landslide activity in the study area is related to both intense,short duration precipitation events (1–15 days) and long-lasting rainfall episodes(1–3 months). The former events trigger shallow translational slides while the laterepisodes are usually associated with deeper and larger slope movements. The asso-ciation between the NAO and landslide activity is shown to be more evident for thegroup of deep seated landslide events.
Keywords Landslides · Rainfall triggering · Thresholds · NAO
J.L. Zêzere (B)Centre for Geographical Studies, Institute of Geography and Spatial Planning, University ofLisbon, Lisbon, Portugale-mail: [email protected]
199S.M. Vicente-Serrano, R.M. Trigo (eds.), Hydrological, Socioeconomicand Ecological Impacts of the North Atlantic Oscillation in the Mediterranean Region,Advances in Global Change Research 46, DOI 10.1007/978-94-007-1372-7_14,C© Springer Science+Business Media B.V. 2011

200 J.L. Zêzere and R.M. Trigo
1 Introduction
According to Cruden (1991) a landslide can be defined as the movement of a massof rock, earth or debris down a slope. Furthermore, the centre of gravity of theaffected material in a landslide always moves in a downward and outward direc-tion (Terzagui, 1950). The landslide classification proposed by Cruden and Varnes(1996) is the most widely adopted and it considers five landslide types, distinguishedaccording to the type of rupture and displacement mechanisms: fall, topple, slide,lateral spread and flow.
Landslide factors are multiple and usually occur at the same time making it dif-ficult to define in any particular case “what is the cause of the landslide”. Gladeand Crozier (2005) based on previous work by Crozier (1986) and Popescu (1994),proposed the classification of landslide causes in the following classes: predispos-ing factors, preparatory factors and triggering factors. This classification crosseswith three different stability states on slopes defined by the same authors: stability,marginal stability and active instability (Glade and Crozier, 2005).
Landslide predisposing factors are those inherent terrain characteristics (e.g.,slope geometry, soil and rock characteristics) that can be assumed as static atthe short and mid-term and that control the likelihood of landslide occurrencein space. Landslide preparatory and triggering factors are dynamic and can besubdivided in geomorphologic processes, physical processes and anthropogenicprocesses (Popescu, 1994). When acting as preparatory factors, these processes pro-mote the decrease of the stability margin of the slope without starting the slopemovement. When acting as triggering factors, processes are the immediate cause ofslope instability, and it is possible to establish a cause-effect relationship betweentriggering factor occurrence and landslide occurrence. Therefore, it is clear thatgeomorphologic, physical and anthropogenic factors may act both as landslidepreparatory factors and landslide triggering factors depending on process intensityand temporal extent, as well as on the previous stability state of the slope (Gladeand Crozier, 2005).
Rainfall is the most important physical process responsible for the triggering oflandslides in the Mediterranean region, as in most regions worldwide (Wieczorek,1996; Corominas, 2001; Guzzetti et al., 2007). Although the decisive role played byrainfall, there is no general “universal rule” regarding rainfall thresholds related toslope instability, despite the enormous effort done with this goal (e.g. Caine, 1980;Fukuota, 1980; Crozier, 1986; Van Asch et al., 1999; Corominas, 2001; Polemioand Petrucci, 2000; Guzzetti et al., 2007).
The control of rainfall on landslides differs substantially depending upon land-slide depth and kinematics and the affected material. Shallow soil slips and rapiddebris flows are typically activated by short period of very intense rain while deep-seated rotational and translational slides are usually associated with less intenserainfall occurring in period lasting from several weeks to several months (Van Aschet al., 1999). Therefore, even within a single region, different types of slope move-ments may be associated with different rainfall characteristics that produce different

Impacts of the North Atlantic Oscillation on Landslides 201
hydrological triggering conditions (Van Asch et al., 1999; Polemio and Petrucci,2000; Corominas, 2001; Zêzere and Rodrigues, 2002; Trigo et al., 2005).
Low frequency atmospheric patterns are associated with anomalous precipita-tion at the seasonal scale, and this is the main rationale to study the relationshipsbetween the atmospheric circulation patterns and landslide activity triggered byrainfall. Previous studies have related the Southern Oscillation and landslide activ-ity in different parts of the world (Coe et al., 1998; Godt, 1999; Ngecu and Mathu,1999). More recently, the authors have found a significant relationship between theNorth Atlantic Oscillation and the recent landslide-triggered events occurred in theLisbon Region (Trigo et al., 2005; Zêzere et al., 2005). Apparently, this relation-ship is associated with the control that the NAO exerts, at the monthly and seasonalscales, on the storms coming from the North Atlantic Ocean that directly affect theLisbon region (Zêzere et al., 2005, 2008). In this regard we are particularly inter-ested to verify if this link holds for the recent unusual winter of 2009–2010 that hasbeen characterised by high intense precipitation (Vicente-Serrano et al., 2011) andextreme negative NAO values (Cattiaux et al., 2010).
2 Hydrological Triggering Conditions of Landslidesand Relation with Rainfall Patterns
Debris flows, shallow soil slips and deep-seated rotational and translational slidesare among the most common of landslide types triggered by rainfall.
The generation of surface run-off and high peak discharges in first-order moun-tain catchments is a critical triggering mechanism for debris flows (Van Asch et al.,1999). This run-off occurs both on saturated and unsaturated soil conditions andprovides water to debris material that have accumulated in channels, thus increasingthe pore pressure within the debris mass which initiates the debris flow (Van Aschet al., 1999). In such circumstances, the maximum fluid pressure that can be gener-ated in the debris mass is controlled by the infiltration capacity of the soil and thegeometry of the slope (gradient, shape and roughness). The activation of debris flowis typically associated with short-duration (minutes to hours) peak rainfall events.
Shallow translational soil slips are failures occurring on steep slopes at a criticaldepth in general not more than 1–2 m. These landslides are typically triggered bythe rapid infiltration and the unsaturated percolation of water in the thin soil material(colluvium deposits) which overlies impermeable rocks. The critical reduction ofthe soil shear resistance and the consequent slope failure is due to the rapid andtemporary rise of the pore water pressure and the loss of soil apparent cohesionresulting from soil saturation (Gostelow, 1991; Iverson, 2000). Activity of rainfall-triggered shallow translational soil slips are usually associated with intense rainfallaccumulating within the 1–15 days period.
Deep-seated rotational and translational slides are slope failures occurring alonga slip surface located typically at a depth ranging from 5 to 20 m. Materials mobi-lized by these landslides are soils and rocks that yield small effective hydraulic

202 J.L. Zêzere and R.M. Trigo
diffusivities (Iverson, 2000). Deep-seated landslides are triggered by the reduc-tion of shear strength of involved rocks and soils, resulting from the steady riseon the groundwater level (Gostelow, 1991; van Asch et al., 1999; Iverson, 2000).Therefore, when compared with shallow soil slips deep landslides need larger abso-lute amounts of water for triggering conditions, and are associated with largerwindows of antecedent rainfall (Van Asch et al., 1999). Activity of this type of land-slides is usually related to successive weeks of nearly constant rainfall, over periodslasting from 30 to 90 days.
3 Temporal Occurrence of Rainfall-Triggered Landslidesin Lisbon Region and Rainfall Triggering Thresholds
3.1 Rainfall Regime and Landslide Events
The rainfall regime in the Lisbon Region is characterized by high variability at theinter-seasonal and the inter-annual scales. The mean annual precipitation (MAP) atthe reference rain gauge of S. Julião do Tojal is 730 mm where a daily rainfall dataseries is available since 1956 (SJT, Fig. 1). Summer months are noticeably dry andrainfall concentrates in the period lasting from October to March (78% of the totalamount; 72% of the total rainy days).
Fig. 1 Annual precipitation (climatological year) at the reference rain gauge of S. Julião do Tojal(period: 1956/1957–2009/2010). Diamonds: Shallow landslides events; triangles: Deep landslidesevents

Impacts of the North Atlantic Oscillation on Landslides 203
Although the term “landslide event” may be used to characterize the occurrenceof a single landslide, this term has a wider connotation as it is used to describe anumber of individual landslides triggered in a wide area by a single triggering event,such as an earthquake or an intense rainstorm (Crozier and Glade, 1999). Within thisconcept, a landslide event in the Lisbon region is a period (a date) for which at least5 individual landslides are known to have occurred on natural slopes. This number isin accordance with the typical landslide activity observed in the study area (Zêzereet al., 1999).
The dates of landslide activity were reconstructed from field work, archive inves-tigation and interviews with the population living in the study area. A particularattention was given to the particular type(s) of landslide(s) occurred in each event,and a distinction was made between shallow and deep-seated landslides. From1956–1957 to 2009–2010, 25 landslide events were recognized corresponding toa frequency of one event each 2.16 years, although some years were marked by theoccurrence of multiple events (e.g. 1989–1990, 1995–1996, 2009–2010). The totalarea affected by the above mentioned landslide types within each landslide event
Table 1 Landslide events triggered by rainfall in the Lisbon region from 1956 to 2010
Landslideevent #
Date(yyyy/mm/dd)
Critical rainfallamount/durationmm (dd)
Rainfallintensity/durationmm/day (dd)
Return period(years)
Dominantlandslide type
1 1958/12/29 149 (10) 14.9 (10) 2.7 Shallow2 1959/03/09 175 (10) 17.5 (10) 4.4 Shallow3 1967/11/15 137 (1) 137.0 (1) 62 Shallow4 1968/11/15 350 (30) 11.7 (30) 7.6 Deep5 1978/03/04 204 (15) 13.6 (15) 3.9 Shallow6 1979/02/10 694 (75) 9.2 (75) 22 Deep7 1981/12/30 174 (5) 34.7 (5) 14 Shallow8 1983/11/18 164 (1) 164.0 (1) 194 Shallow9 1987/02/25 52 (1) 52.0 (1) 2.1 Shallow
10 1989/11/22 164 (15) 11.0 (15) 2.2 Shallow11 1989/11/25 217 (15) 14.4 (15) 4.7 Shallow12 1989/12/05 333 (30) 11.1 (30) 6.3 Deep13 1989/12/21 495 (40) 12.4 (40) 18 Deep14 1996/01/09 544 (60) 9.1 (60) 11 Deep15 1996/01/23 686 (75) 9.1 (75) 21 Deep16 1996/01/28 495 (40) 12.4 (40) 18 Deep17 1996/02/01 793 (90) 8.8 (90) 27 Deep18 2001/01/06 447 (60) 7.4 (60) 5.1 Deep19 2001/01/09 467 (60) 7.8 (60) 6 Deep20 2006/03/20 156 (4) 39.0 (4) 13 Shallow21 2006/10/27 219 (10) 21.9 (10) 11 Shallow22 2006/11/28 427 (40) 10.7 (40) 9 Deep23 2008/02/18 141 (1) 140.9 (1) 73 Shallow24 2010/01/14 332 (30) 11.1 (30) 6 Deep25 2010/03/09 632 (90) 7.0 (90) 8 Deep
204 J.L. Zêzere and R.M. Trigo
was the criterion used to distinguish between shallow and deep landslide eventsreported in Fig. 1 and Table 1. Shallow (deep) landslide events are characterized bymore than 50% of landslide area associated to slip surfaces depth < 1.5 m (depth> 1.5 m). According to this criterion, 13 deep and 12 shallow landslide events wererecorded. Interestingly, the nature of the events is non-stationary, with significantchanges in frequency of deep and shallow events between the first and second halvesof the period considered. Thus, shallow landslide events were more frequent from1956 until 1989 (9 in 11 cases), while deep landslide events were dominant from1989 to 2010 (11 in 14 cases).
3.2 Absolute Antecedent Rainfall Threshold
Following the approach used previously by the authors (Trigo et al., 2005; Zêzereet al., 2005), the relationship between rainfall and landslide activity was assessedby computing the cumulative absolute antecedent rainfall for the 1–5, 10, 15, 30,40, 60, 75, and 90 consecutive days anteceding each landslide event. The Gumbeldistribution (Gumbel, 1958) was used to derive the return period for each rainfallamount/duration combination. The critical rainfall combination (quantity-duration)responsible for each landslide event is shown in Table 1, and it was obtained, assum-ing as critical pair the combination with the higher return period. We acknowledgethis assumption lacks a physical basis, nevertheless it provides the best discrimi-nation between landslide events and other rainfall periods not related with slopeinstability (Zêzere et al., 2005).
The combination between rainfall intensity and critical rainfall duration for the25 landslide events registered from 1956 to 2010 is shown in Fig. 2. The regressionanalysis shows that rainfall intensity increases exponentially as duration decreases,following the equation Ri = 92.03D–0.594 (r2 = 0.902), where Ri is the rainfall inten-sity in mm/day and D is the duration of rainfall in days. Figure 2 also shows themaximum yearly values for durations of 1, 5, 10, 15, 30, 40, 60, 75 and 90 days thatwere computed for those years without landslide activity. The vast majority of thesevalues lie below the fitted curve, thus confirming that regression curve may be usedas a reliable rainfall intensity – duration threshold for the study area.
The above mentioned regression model was used to derive the minimum dailyrainfall needed to reach the precipitation triggering threshold at the reference raingauge (S. Julião do Tojal), for any of the following consecutive days: 1–5, 10, 15,30, 40, 60, 75 and 90 (Zêzere et al., 2008). This calculation accounts for the contin-uous cumulative absolute antecedent rainfall, and it is shown in Fig. 3 for the timespan lasting from 2000 to 2010. During this period, our model correctly predicted 7landslide events (Landslide events # 18, 19, 20, 21, 22, 23 and 24), and the landslideevent # 25 is the solely “false negative” (i.e., unpredicted landslide event). In addi-tion, there is no evidence of “false positives” (i.e., predicted landslide events thatdid not occur).
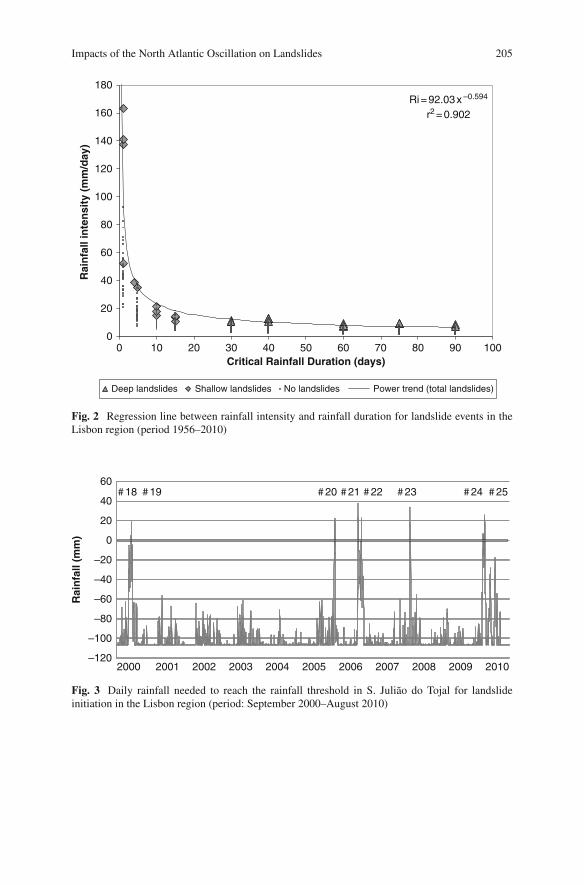
Impacts of the North Atlantic Oscillation on Landslides 205
Ri = 92.03 x –0.594
r2 = 0.902
0
20
40
60
80
100
120
140
160
180
0 10 20 30 40 50 60 70 80 90 100Critical Rainfall Duration (days)
Rai
nfa
ll in
ten
sity
(m
m/d
ay)
Deep landslides Shallow landslides No landslides Power trend (total landslides)
Fig. 2 Regression line between rainfall intensity and rainfall duration for landslide events in theLisbon region (period 1956–2010)
–120
–100
–80
–60
–40
–20
0
20
40
60
Rai
nfa
ll (m
m)
20012000 2002 2003 2004 2005 2006 2007 2008 2009 2010
# 18 # 19 # 20 # 21 # 22 # 23 # 24 # 25
Fig. 3 Daily rainfall needed to reach the rainfall threshold in S. Julião do Tojal for landslideinitiation in the Lisbon region (period: September 2000–August 2010)

206 J.L. Zêzere and R.M. Trigo
Tabl
e2
Cal
ibra
ted
ante
cede
ntra
infa
ll(C
AR
)fo
rla
ndsl
ide
even
tsin
the
Lis
bon
regi
onfr
om19
56to
2010
Lan
dslid
eev
ent#
Dat
e(y
yyy/
mm
/dd)
Dai
lyra
infa
ll(m
m)
3da
ys(m
m)
5da
ys(m
m)
10da
ys(m
m)
15da
ys(m
m)
30da
ys(m
m)
No.
ofpr
evio
usco
nsec
utiv
eda
ysw
ith30
-day
sC
AR
>50
mm
Dom
inan
tla
ndsl
ide
type
119
58/1
2/29
22.0
54.2
73.6
91.7
99.2
108.
56
Shal
low
219
59/0
3/09
45.5
27.5
55.4
82.2
82.2
83.6
4Sh
allo
w3
1967
/11/
1513
7.0
4.1
4.1
10.3
16.3
25.2
0Sh
allo
w4
1968
/11/
1545
.543
.447
.374
.392
.310
7.7
18D
eep
519
78/0
3/04
14.5
43.9
67.1
93.8
105.
010
9.8
8Sh
allo
w6
1979
/02/
1026
.089
.393
.611
0.1
119.
713
3.6
17D
eep
719
81/1
2/30
78.0
75.5
75.5
102.
610
9.5
111.
33
Shal
low
819
83/1
1/18
163.
742
.159
.888
.296
.710
3.8
10Sh
allo
w9
1987
/02/
2551
.822
.235
.436
.046
.552
.11
Shal
low
1019
89/1
1/22
33.5
19.9
50.7
62.9
70.9
72.1
4Sh
allo
w11
1989
/11/
2538
.036
.942
.775
.788
.589
.17
Shal
low
1219
89/1
2/05
30.1
58.1
58.1
78.8
93.7
109.
717
Dee
p13
1989
/12/
2126
.729
.140
.565
.378
.210
0.9
33D
eep
1419
96/0
1/09
66.5
17.8
29.5
54.2
79.5
88.4
17D
eep
1519
96/0
1/23
23.6
36.5
38.7
53.2
78.9
96.8
31D
eep
1619
96/0
1/28
25.5
9.2
30.9
53.7
62.3
85.6
36D
eep
1719
96/0
2/01
24.5
34.5
48.6
69.1
79.9
97.9
40D
eep
1820
01/0
1/06
24.5
22.7
39.1
53.7
79.1
87.4
17D
eep
1920
01/0
1/09
16.0
22.1
38.6
51.9
67.1
85.3
20D
eep
2020
06/0
3/20
42.1
89.5
89.6
89.7
95.9
107.
42
Shal
low
2120
06/1
0/27
26.0
64.4
99.1
126.
813
1.4
132.
16
Shal
low
2220
06/1
1/28
36.5
33.4
58.0
62.8
74.5
79.6
3D
eep
2320
08/0
2/18
140.
90.
00.
00.
36.
26.
60
Shal
low
2420
10/0
1/14
16.6
55.6
56.1
70.4
78.3
99.7
19D
eep
2520
10/0
3/09
29.7
36.1
44.8
62.4
72.9
83.4
15D
eep

Impacts of the North Atlantic Oscillation on Landslides 207
3.3 Calibrated Antecedent Rainfall Thresholds
Due to superficial and sub-superficial drainage, the impact of a particular rainy eventon slope hydrology decreases in time (Canuti et al., 1985; Crozier, 1986). In orderto account this effect in the analysis of rainfall-triggered landslide events, we recon-structed the calibrated antecedent rainfall (CAR) for 3, 5, 10, 15 and 30 days usingthe algorithm proposed by Crozier (1986):
CARx = KP1 + K2P2 + ...KnPn (1)
where CARx is the calibrated antecedent rainfall for day x; P1 is the daily rainfallobserved for the day before day x; Pn is the daily rainfall registered for the n-th daybefore day x; and K (assumed to be 0.9) is the empirical parameter that accountsfor the decrease of the impact of a particular rainy event in time due to drainageprocesses.
Table 2 summarizes the calibrated antecedent rainfall computed with Equation(1) for the 25 landslide events registered in the Lisbon Region. The distinctionbetween shallow and deep landslide events concerning the number of days rele-vant to the antecedent rainfall was confirmed by combining the daily rainfall andthe CAR (Fig. 4). The best result for shallow landslide events was obtained with thecombination between the daily rainfall and the 5 days CAR through the exponentialrule Dr = 151.57e−0.0336CAR (where Dr is the daily rainfall), whereas deep landslideevents are better discriminated by a combined threshold of daily rainfall = 16 mmand 30 days CAR = 80 mm.
Differences on the relevance of antecedent rainfall for shallow and deep landslideevents are also remarkable regarding the number of previous consecutive days with30 days CAR>50 mm (Table 2). This number ranges from 0 to 10 days for dates ofshallow movements occurrence, and increases up to a minimum of 15 days for datescharacterised by deep landslide activity, with the single exception of landslide event#22.
4 Impact of NAO on Precipitation and on Landslide Occurrencein Lisbon Region
Previous works have shown that the phase of the NAO pattern is the most importantto model the temporal precipitation distribution over western Iberia (Hurrell, 1995;Trigo et al., 2004; Zêzere et al., 2005). In fact the authors have shown that the NAOis (statistically) associated with the occurrence of landslide events, particularly thosetriggered by prolonged periods (up to 3 months) of precipitation (Trigo et al., 2005;Zêzere et al., 2005, 2008).
The NAO index used here was developed at the Climatic Research Unit(University of East Anglia, UK) and is defined, on a monthly basis, as the differ-ence between the normalized surface pressure at Gibraltar (southern tip of IberianPeninsula) and Stykkisholmur in Iceland (Jones et al., 1997). The NAO index for

208 J.L. Zêzere and R.M. Trigo
0
20
40
60
80
100
120
140
160
180
0 20 40 60 80 100 120 140 16030-days calibrated antecedent rainfall (mm)
Dai
ly r
ainf
all (
mm
)
80
16
B
y = 151.57e–0.0336 x
020406080
100120140160180
5-days calibrated antecedent rainfall (mm)
Dai
ly r
ainf
all (
mm
)
0 20 40 60 80 100 120 140
A
Fig. 4 Relationship between daily rainfall and 5-days (a) and 30-days (b) calibrated antecedentrainfall (CAR) for landslide events in the Lisbon region (period 1956–2010). Diamonds: valuesassociated with shallow landslides events; triangles: values associated with deep landslides events;small dots: values obtained from the yearly maximum daily rainfall and from the yearly maximumCAR, computed for years without landslide events
winter months presents a positive trend for the last 3 decades of the twentiethcentury, thus the corresponding distribution is dominated by positive values. Inorder to remove this positive bias we have normalized all values of NAO index,at the monthly scale, between 1938 and 2010 (the period with precipitation datafor the nearby SJT series). We apply the same approach developed previously(Trigo et al., 2005; Zêzere et al., 2008) but updating it to the year 2010. Thusa 3-month moving average was applied to filter the original NAO index and SJTprecipitation time series, restricting the analysis to monthly data from the wetseason (NDJFM), with the single exception of the landslide event #21 for whichOctober and September values were considered. October values are used to computeNovember and December averages. Thus, values for February of year n, correspond

Impacts of the North Atlantic Oscillation on Landslides 209
to the rainfall and NAO index averages computed between December of year n–1and February of year n, while values for November of any year are restricted to theOctober and November values for that same year. For landslides episodes that haveoccurred in the first 5 days of the month we only considered the NAO index and pre-cipitation values from the previous 2 months (events 5, 12 and 17). The scatter plotobtained with both filtered time series is shown in Fig. 5, being limited to the winter(NDJFM) months. Small open diamonds represent months where landslide eventsdid not occur (or were not reported). Black circles correspond to months with onlyone recognized landslide event (e.g. February 1996, event 17), while black trianglesrepresent those months with more than one landslide event (e.g. December 1989,events 12 and 13). A number of relevant remarks can be raised in relation to Fig. 5:
1. The linear correlation between both time series is –0.58 (statistically significantat the 1% level) increasing slightly to –0.61 if we restrict the analysis to thosemonths affected by landslide activity represented by the numbered black circlesand triangles (regression line is also represented).
2. All months characterized with landslide events are located above the 3-monthaverage precipitation (horizontal line indicating the threshold of 95 mm/month).Furthermore, with the exception of event #23 all cases are characterized by neg-ative values of the averaged NAO index. Interestingly, this event occurred on the18 February 2008 corresponding to the new all time record of daily precipitationobserved in Lisbon (since 1865), Capital of Portugal located just 14 km south ofSJT (Fragoso et al., 2010).
0
100
200
300
−2−1012
Ave
rag
e p
reci
pit
atio
n
NAO index
3 Month averages (November-March)
14 15 16
22
23
17
12 13
3
2 15
6
4
8
97
18 19
10 11
2024
21
25
Fig. 5 Scatter plot between 3-month moving average NAO index and SJT precipitation time series(November–March), for the period ranging between 1956 and 2010 (270 months). Small opendiamonds: months with no landslide events reported. Black circles: months with one recognizedlandslide event. Black triangles: months with more than one recognized landslide event. Numbersnext to gray symbols represent the landslide episode number as given in Tables 1 and 2

210 J.L. Zêzere and R.M. Trigo
3. The majority of the multiple landslide events episodes (#12 to #16) are character-ized by extremely negative average values of the NAO index (lower than –1) andextremely high values of average precipitation (clearly above 200 mm/month).This prolonged anomalous precipitation regime favors the occurrence of multipledeep landslide events (Table 1).
5 Conclusion
Landslide events occurred since 1956 in the Lisbon region were triggered by rain-fall. Events dominated by shallow soil slips have been related to short periods (1–15days) of intense rainfall, whereas events characterized by the occurrence of deepseated slope movements have been associated to longer periods (30–90 days) of lessintense rain. The distinction between landslide types concerning the number of daysrelevant to the antecedent rainfall was confirmed combining the daily rainfall andthe calibrated antecedent rainfall (CAR) from 3 to 30 days for each landslide event.An exponential rule was identified (Dr = 151.57e−0.0336CAR) for the 5 days CAR,which is a threshold for shallow landslide events, while deep landslide events werebetter discriminated by a combined threshold of daily rainfall = 16 mm and 30 daysCAR = 80 mm.
These different rainfall triggering conditions are consistent with the differenthydrologic processes associated with different types of slope movements. Intenserainfall allows the rapid growth of pore water pressure and the drop of capillar-ity forces that sustain the apparent cohesion of thin soils. Therefore, shallow soilfailures occur within the soil material or at the contact with the underlying lesspermeable bedrock. Long lasting rainfall episodes enable the steady rise of thegroundwater table and the development of positive pore water pressures into thesoil. Consequently, deep seated failures occur in relation to the reduction of shearstrength of affected materials.
Despite the different relationships existing between the activity of shallow anddeep seated landslides and the rainfall triggering conditions, it was possible to derivea single exponential law relating rainfall intensity and the rainfall critical durationfor the total set of landslide events occurred in the Lisbon region from 1956 to 2010.The fitting of the curve to the 25 landslide events is impressive (r2 = 0.9) and thevast majority of rainfall episodes that did not cause landslides lie below the curve,thus confirming the curve as a consistent rainfall intensity/duration threshold for thetriggering of landslides in the study area.
The linear correlation between the 3 month average NAO index and precip-itation is statistically significant (–0.61) for those months characterized by theoccurrence of landslide events. The complete set of landslide events lies abovethe 3-month average precipitation, and 24 in 25 events present negative values ofthe 3-month average NAO index. Taking into account the different rainfall periodsassociated with shallow and deep seated landslides events, the association betweenthe NAO and landslide activity is more evident for the group of deep seated land-slide events. In addition, the majority of months characterized by the occurrence of

Impacts of the North Atlantic Oscillation on Landslides 211
multiple landslide events exhibit extremely high values of average precipitation andextremely negative average values of the NAO index.
However, it must be stressed that it is not so clear-cut to establish the sequenceof physical phenomena that link the NAO configuration with local landslide activ-ity. Without pretending to describe the entire chain of physical processes involvedthese must include; (1) the NAO control of the preferred path for north Atlanticstorm tracks, (2) how these low pressure systems influence the precipitation regimeof western Iberia, (3) to what extent the precipitation anomalies impact local soilmoisture at different temporal scales, and (4) how these changes can be critical forsurpassing water pressure thresholds that can trigger landslides.
Acknowledgements This work was supported by Projects Maprisk – Methodologies for assess-ing landslide hazard and risk applied to municipal planning (PTDC/GEO/68227/2006) andDISASTER – GIS database on hydro-geomorphologic disasters in Portugal: a tool for envi-ronmental management and emergency planning (PTDC/CS-GEO/103231/2008) funded by thePortuguese Foundation for Science and Technology (FCT).
References
Caine N (1980) The rainfall intensity–duration control of shallow landslides and debris flows.Geografiska Annaler 62:23–27
Canuti P, Focardi P, Garzonio CA (1985) Correlation between rainfall and landslides. Bull IntAssoc Eng Geol 32:49–54
Cattiaux J, Vautard R, Cassou C, Yiou P, Masson-Delmotte V, Codron F (2010) Winter2010 in Europe: a cold extreme in a warming climate. Geophys Res Lett 37:L20704.doi:10.1029/2010GL044613
Coe JA, Godt JW, Wilson RC (1998) Distribution of debris flows in Alameda County, Californiatriggered by 1998 El Niño rainstorms: a repeat of January 1982? EOS 79:266
Corominas J (2001) Landslides and climate. Keynote lectures from the 8th international sympo-sium on landslides 4:1–33
Crozier M (1986) Landslides: causes, consequences and environment. Croom Helm, LondonCrozier MJ, Glade T (1999) Frequency and magnitude of landsliding: fundamental research issues.
Z Geomorph NF Suppl-Bd 115:141–155Cruden DM (1991) A simple definition of a landslide. Bull Int Assoc Eng Geol 43:27–29Cruden DM, Varnes DJ (1996) Landslide types and processes. In: Turner AK, Schuster RL (eds)
Landslides: investigation and mitigation. National Research Council, Transportation ResearchBoard, Washington, DC, pp 36–75
Fragoso M, Trigo RM, Zêzere JL, Valente MA (2010) The exceptional rainfall episode registeredin Lisbon in 18 February 2008. Weather 65(2):31–35
Fukuota M (1980) Landslides associated with rainfall. Geotech Eng 11:1–29Glade T, Crozier MJ (2005) The nature of landslide hazard and impact. In: Glade T, Anderson MG,
Crozier MJ (eds) Landslide hazard and risk. Wiley, Chichester, pp 43–74Godt JW (1999) Maps showing locations of damaging landslides caused by El Niño rainstorms,
winter season 1997–98, San Francisco Bay region, CA. USGS http://pubs.usgs.gov/mf/1999/mf-2325/
Gostelow P (1991) Rainfall and landslides. In: Almeida-Teixeira M et al (eds) Prevention andcontrol of landslides and other mass movements. CEC, Bruxels, pp 139–161
Gumbel EJ (1958) Statistics of extremes. Columbia University Press, New YorkGuzzetti F, Peruccacci S, Rossi M, Stark CP (2007) Rainfall thresholds for the initiation of
landslides in central and southern Europe. Meteorol Atmos Phys 98:239–267
212 J.L. Zêzere and R.M. Trigo
Hurrell JW (1995) Decadal trends in the North Atlantic Oscillation: regional temperatures andprecipitation. Science 269:676–679
Iverson RM (2000) Landslide triggering by rain infiltration. Water Resour Res 36:1897–1910Jones PD, Jónsson T, Wheeler D (1997) Extension to the North Atlantic Oscillation using early
instrumental pressure observations from Gibraltar and south-west Iceland. Int J Climatol17:1433–1450
Ngecu WM, Mathu EM (1999) The El-Niño triggered landslides and their socioeconomic impactin Kenya. Environ Geol 38:277–284
Polemio M, Petrucci O (2000) Rainfall as a landslide triggering factor: an overview of recentinternational research. In: Bromhead E, Dixon N, Ibsen M (eds) Landslides in research, theoryand practice. Thomas Telford, London, pp 1219–1226
Popescu M (1994) A suggested method for reporting landslide causes. Bull Int Assoc Eng Geol50:71–74
Terzagui K (1950) Mechanisms of landslides. Geological Society of America (Berkey Volume),pp 83–123
Trigo RM, Pozo-Vázquez D, Osborn TJ, Castro-Díez Y, Gámiz-Fortis S, Esteban-Parra MJ (2004)North Atlantic Oscillation influence on precipitation, river flow and water resources in theIberian Peninsula. Int J Climatol 24:925–944
Trigo RM, Zêzere JL, Rodrigues ML, Trigo IF (2005) The influence of the North AtlanticOscillation on rainfall triggering of landslides near Lisbon. Nat Hazards 36:331–354
Van Asch T, Buma J, Van Beek L (1999) A view on some hydrological triggering systems inlandslides. Geomorphology 30:25–32
Vicente-Serrano SM, Trigo RM, Liberato ML, López-Moreno JI, Lorenzo-Lacruz J, BegueríaS, Morán-Tejeda H, El Kenawy A (2011) The 2010 extreme winter North HemisphereAtmospheric variability in Iberian precipitation: anomalies, driving mechanisms and futureprojections. Clim Res 46:51–65
Wieczorek GF (1996) Landslides triggering mechanisms. In: Turner AK, Schuster RL (eds)Landslides: investigation and mitigation. National Research Council, Transportation ResearchBoard, Washington, DC, pp 76–90
Zêzere JL, Ferreira AB, Rodrigues ML (1999) Landslides in the north of Lisbon region (Portugal):conditioning and triggering factors. Phys Chem Earth, Part A 24:925–934
Zêzere JL, Rodrigues ML (2002) Rainfall thresholds for landsliding in Lisbon area (Portugal). In:Rybar J, Stemberk J, Wagner P (eds) Landslides. A.A. Balkema, Lisse, pp 333–338
Zêzere JL, Trigo RM, Fragoso M, Oliveira SC, Garcia RAC (2008) Rainfall-triggered landslides inthe Lisbon region over 2006 and relationships with the North Atlantic Oscillation. Nat HazardsEarth Syst Sci 8:483–499
Zêzere JL, Trigo RM, Trigo IF (2005) Shallow and deep landslides induced by rainfall in theLisbon region (Portugal): assessment of relationships with the North Atlantic Oscillation. NatHazards Earth Syst Sci 5:331–344

The Impact of the NAO on the Solar and WindEnergy Resources in the Mediterranean Area
David Pozo-Vazquez, Francisco Javier Santos-Alamillos,Vicente Lara-Fanego, Jose Antonio Ruiz-Arias, and Joaquín Tovar-Pescador
Abstract The influence of the NAO on the solar and wind energy resources in theMediterranean area, in particular, and over the whole North Atlantic area, in gen-eral, has been explored based on the analysis of 20 years of reanalysis and satellitedata. The analysis was carried out for the winter and annual periods and provedthe existence of a marked influence of the NAO pattern on the spatial and temporalvariability of the solar and wind energy resources in the study area. Particularly,the NAO signature on the solar/wind energy resources was found to be a north-south dipolar pattern, with the positive/negative centre over the Mediterranean area.Although the spatial patterns obtained are similar, the nature of the relationshipobtained for wind energy was found to be less linear and more complex than thatattained for solar energy. A composite analysis revealed that interannual variabilityof the solar and wind energy resources in the Mediterranean area can reach valuesabove 20% in winter and 10% in the annual case associated with changes in theNAO phase. Finally, the analysis of the spatial patterns of the NAO influence onthe solar and wind energy resources revealed the existence of spatial and local bal-ancing between these two energy resources in the study area. Results are of interestregarding the estimation of the expected interannual variability of the wind farmsand solar plants production in the study region.
Keywords NAO · Balancing renewable energy · Solar energy · Wind energy
1 Introduction
According to the latest estimates, it is expected that the worldwide primary energydemand will increase by 45% and the demand for electricity will increase by 80%between 2006 and 2030 (IEA, 2008). As a consequence, and without a decisiveaction, energy-related greenhouse gases (GHG) emissions will more than double by2050 and the increased oil demand will intensify the concerns over the security ofsupplies. There are different pathways to stabilize GHG concentrations, but a key
D. Pozo-Vazquez (B)Department of Physics, University of Jaén, Jaén, Spaine-mail: [email protected]
213S.M. Vicente-Serrano, R.M. Trigo (eds.), Hydrological, Socioeconomicand Ecological Impacts of the North Atlantic Oscillation in the Mediterranean Region,Advances in Global Change Research 46, DOI 10.1007/978-94-007-1372-7_15,C© Springer Science+Business Media B.V. 2011

214 D. Pozo-Vazquez et al.
issue in all of them is the replacement of fossil fuels by renewable energy sources.European Union (EU) regulations, for example, set a binding target for 20% of theEU’s total energy supply to come from renewable by 2020 (corresponding to a sharpincrease from the modest 6.5% observed in 2007). Furthermore, they set a firm targetof cutting 20% of the EU’s greenhouse gases emissions by 2020 relative to 1990.In this scenario, solar and wind energies -the renewables with the most mature- willnecessarily play a key role.
There are three main solar technologies. The first one is the direct conversionof sunlight into electricity (Photovoltaic, PV effect), the concentrating solar power(CSP) and the solar thermal collectors for heating and cooling (SHC). PV and CSPtechnologies are meant to produce electricity, while SHC can only be used for heat-ing and cooling purposes. PV systems enable direct conversion of sunlight intoelectricity through semi-conductor devices, through the global horizontal irradiance(GHI) they receive. Today, PV provides 0.2% of total global electricity generation,being Germany the leading country in the world, with 5 GW installed capacity, fol-lowed by Spain with above 4 GW (about 4% of the installed capacity). While its useis small today, PV power has a particularly promising future. Actually, global PVcapacity has been increased at an average annual growth rate of more than 40% since2000 and it has significant potential for long-term growth over the next decades.Particularly, PV is projected to provide around 5% of global electricity consump-tion by 2030, rising to 11% by 2050 (IEA, 2010a). In this context, the Mediterraneanarea (France, Italy, Greece) are expected to play a major role (IEA, 2010a). The basicconcept of CSP is relatively simple: CSP devices concentrate energy from the sun’srays to heat a receiver to high temperatures. This heat is then transformed first intomechanical energy (by turbines or other engines) and then into electricity. The solarenergy that CSP plants use is measured as direct normal irradiance (DNI), whichis the energy received on a surface tracked perpendicular to the sun’s rays. CSPdevelopers typically set a bottom threshold for DNI of about 2000 kWh/m2/year.Below that, other solar electric technologies that take advantage of both direct anddiffuse irradiance, such as PV, are assumed to have a competitive advantage. GoodDNI is usually found in arid and semi-arid areas with reliably clear skies, whichtypically lies at latitudes from 15 to 40◦ North or South. As a consequence, oneof the most favorable areas for the CSP technology is the Mediterranean basin.In 2010, the global stock of CSP plants neared 1 GW capacity, mainly in Spain(about 0.5 GW). Projects now in development or under construction in more than adozen countries (including China, India, Morocco, Spain and the United States) areexpected to totalize 15 GW, and CSP is expected to contribute about 5% (1500 GW)of the annual global electricity production in 2050 (IEA, 2010b). Particularly, poten-tial in the Middle East and North Africa would cover about 100 times the currentconsumption of the Middle East, North Africa and the European Union combined(IEA, 2010b). Finally, wind energy is probably the most cost-effective of the renew-able energy technologies. It must be stressed that wind energy was the renewablesource with the fastest growing rate: since 2000, cumulative installed capacity hasgrown at an average rate around 30% per year (Global Wind Energy Council, 2007).In 2008, wind energy provided nearly 20% of electricity consumption in Denmark,

The Impact of the NAO on the Solar and Wind Energy Resources in the. . . 215
more than 11% in Portugal and Spain, over 4% of all EU electricity and nearly 2%in the United States (IEA, 2009). By 2030, wind electricity is estimated to be pro-duced annually from over 1000 GW of wind installed capacity, corresponding to 9%of global electricity production with an expected rising to 12% in 2050 (IEA, 2009).
The Mediterranean area presents some special features regarding the transitionfrom a fossil era to a greener one. In fact the region presents considerable wind andoutstanding solar energy resources that would make this transition easier. Accordingto different studies (DLR, 2007; DESERTEC, 2010; Price Water House Cooper,2010), Europe and North Africa together could produce by 2050 about 80% oftheir electricity needs from renewables, if their respective grids were sufficientlyinterconnected.
1.1 Energy and Meteorology
The expected huge development of the renewable energies in the coming decadeswill demand a corresponding development of the so-called energy meteorologyscience. Energy meteorology includes all the aspects of the meteorology and clima-tology relevant for the renewable energies. In fact, the meteorological and climateinformation is a key issue at the various stages of a renewable energy project,as outlined in Fig. 1. Particularly, in the first stages (project development), theclimate information is required in terms of the resource evaluation. This evalu-ation includes data obtained based on direct measurement, satellites and models
Fig. 1 The relationship between the weather and climate and different activities related to therenewable energy

216 D. Pozo-Vazquez et al.
estimations. Once operating, weather forecasts are needed for the yield integration inthe power grid. This requires information from both satellite (nowcasting) and fore-casts from Numerical Weather Prediction models (forecasting) (Lara-Fanego et al.,2011). Accurate information on expected solar irradiance or wind speed is used forthe management of the electricity grids, the scheduling of conventional power plantsand also for decision making on the energy market. Monthly and seasonal forecastsare also of interest for maintaining operation and strategic planning, as they canpotentially allow the electricity system operators to estimate the energy productionavailability and the electric network operator to conveniently adapt demand andresources (Weisser and Foxon, 2003).
Accurate resource evaluation is a key issue in the first stages of a renewableenergy project. Particularly, as the life span of wind farms or solar plants (bothPV and STPP) is about 20 years, the economic feasibility study of the projectshould be considered an adequate estimation of the interannual variability of theresources. Usually, the resource evaluation is mainly based on field measurementscollected at meteorological stations. Since these measures are expensive and timeconsuming, typically only a few years of data are available for the investmentdecision making (Barbour and Walker, 2008). However, a few years of measure-ments do not generally account for the natural climate variability of the resources.Consequently, the projected production could significantly vary from 1 year toanother and through decades. Therefore, some complementary studies, usuallybased on satellite estimates or model simulations, are necessary for a reliablerenewable energy resources evaluation. Aside from these very important economicaspects, the evaluation of interannual variability is crucial regarding the reliabil-ity of a power system with a high penetration of renewable energy. Particularly, animportant area of research regarding the resources evaluation is the analysis of thebalancing between different renewables. There are two different types of balancing:spatial and local balancing. Spatial balancing takes place if the combined outputof many variable renewable energy plants, based on same or different resources(mainly wind and solar), at different locations over a wide area, is smoother thanthe output of individual power plants (von Bremen, 2008). Note that the spatialbalancing is a consequence of the different weather and climate conditions overlarge regions. On the other hand, local balancing takes place when, within the samelocation, the combined output of two different renewable energy plants, based ondifferent resources (wind and solar), is smoother along time than the output of eachindividual plant. Several studies show that the existence of spatial or local balancingallows increasing the reliability of solar and wind plants yields, provided the gridare sufficiently interconnected (von Bremen, 2008; Cassola et al., 2008; Kemptonet al., 2010).
Although other phenomena, as aerosols or solar cycles, may play a significantrole, interannual variability of the solar radiation is mainly related to changes in thecloud cover associated with changes in the large scale circulation patterns (Sanchez-Lorenzo et al., 2008, 2009; Chiacchio and Wild, 2010; Papadimas et al., 2010).Concerning the wind resources, surface winds are also mainly driven by large scalecirculation. Nevertheless, local features such as surface roughness, local thermal

The Impact of the NAO on the Solar and Wind Energy Resources in the. . . 217
contrast and orography can modify their spatial and temporal features, especiallyin areas of complex topography as the Mediterranean region (Burlando, 2009; Liet al., 2010). On the other side, the North Atlantic Oscillation (NAO) is recognisedas a major actor regarding the interannual variability of the large scale circula-tion in the Mediterranean area, especially during winter (Hurrell et al., 2003).Particularly, the impact of the NAO on the cloud cover variability and on solar radi-ation at the surface at the whole North Atlantic area has been previously described(Trigo et al., 2002; Pozo-Vázquez et al., 2004; Lohmann et al., 2006; Sanchez-Lorenzo et al., 2008, 2009; Chiacchio and Wild, 2010; Papadimas et al., 2010).However, the NAO impact on the wind and, therefore, wind energy resources isalmost unexplored. Therefore, the NAO can plausibly have significant effects on thewind and solar energy resources in the Mediterranean basin which are worth to beanalyzed.
In this work we present an analysis of the impact of the NAO on the solar andwind energy resources in the Mediterranean area. Particularly, the study aims toevaluate the role of the NAO in the interannual variability of the wind and solarenergy. Monthly means of daily integrated wind and solar energy data, coveringthe whole North Atlantic and the Mediterranean area, including the north of Africa,are analyzed. The dataset was derived from satellite retrievals (solar energy) andmeteorological reanalysis (wind energy and cloud cover) and extends over a periodof about 20 years. We first carried out a correlation analysis to explore the linearrelationship between the NAO and the solar and wind energy. An analysis of thecloud cover-NAO correlation is also undertaken. In a second part, the compositeanalysis is used to study the linear and non-linear component of the solar and windenergy anomalies response to the NAO phases. Finally, the eventual existence ofbalancing between the wind and solar energy resources associated with the NAOcycle is explored. The work is organized as follows: Section 2 describes the datasetand the processes used to derive the wind and solar energy data. Section 3 deals withthe results. Finally, in Section 4 some concluding remarks are outlined.
2 Data Description
Two datasets have been used in this work. Firstly, the ERA-Interim reanalysisdataset was used to derive cloud cover data and the wind energy resources. TheERA-interim global reanalysis are the third generation of reanalysis of the EuropeanCenter for Medium Range Weather Forecasting (ECMWF). Original data have aspatial resolution of about 0.7º and a temporal step of 3 h (Simmons et al., 2007).In this work we have analyzed the period 1989–2008. Wind speed at 10 m abovethe surface at 3 h interval was used to estimate daily integrated values of the windenergy based on:
Edaily−wind =8∑
1
(1
2ρv3
)3, (1)

218 D. Pozo-Vazquez et al.
where v is the wind speed every 3 h and ρ is the density of the air at sea level. Notethe energy units are (W·h). Based on these daily integrated wind energy estimates,monthly means values were computed. Finally, winter season and annual mean val-ues were computed based on the monthly values. December through February wereused for winter, while annual values were computed from December of the preced-ing year to November of the considered year. Regarding the cloud cover, daily meanvalues were computed based on the 3 h interval values. Then, monthly mean valuesand winter and annual mean values were computed based on the same procedurethat for the wind data.
Solar energy was derived from the Irradiance at the Surface derived from ISCCPcloud (ISIS) dataset (Lohmann et al., 2006). It consists of 3-hourly values of directnormal and global irradiances at the surface that have been derived by means of one-dimensional radiative transfer computations. The ISIS dataset covers the time period1984–2004, with a spatial resolution of 280 by 280 km. Note that 3-h temporalresolution of ISIS enables the study of daily cycles. The daily integrated solar energyestimates were obtained along the period 1985–2004 based on the global irradiancedata:
Edaily−solar =8∑
1
GHI × 3, (2)
where GHI is the global irradiance every 3 h. As for the wind energy, and based onthese daily integrated solar energy estimates, monthly means values were computedand, then, winter season and annual mean values were obtained.
Both the ERA-interim and the ISIS dataset have a global coverage. In this work,although the analysis has been focused in the Mediterranean region, the study areahas been extended to the whole North Atlantic region, including the north of Africa,from latitude 20º northward.
Finally, the winter and annual NAO index as defined by Hurrell et al. (2003) wasused to monitor the NAO.
3 Results
3.1 NAO-Solar Energy Correlation Analysis
Figures 2a and 2b show the sample correlation coefficients between the NAO indexand the solar energy for the winter and annual cases, respectively. During the win-ter, a dipolar pattern can be observed: while almost the whole Mediterranean regionpresents positive correlations, most part of central and northern Europe presentsnegative values. The highest positive correlation values (0.8) are located over thesouthwest of the Iberian Peninsula. Also over most part of the central and east-ern Mediterranean area high positive values (0.6) are observed. On the other hand,the highest negative correlations are located over the north west of Russia (–0.6)and British Islands (–0.4). Note also the relatively weak, but significant, negative

The Impact of the NAO on the Solar and Wind Energy Resources in the. . . 219
Fig. 2 (a) Correlation between the NAO index and the solar energy for the winter season. Theperiod of analysis covers 2005–2004. Dots indicate negative correlation while continuous lineindicates positive correlation. Shading indicates local statistical significance of the difference at90% confidence level based on a t-test. (b) as in (a) but for the annual data
correlation obtained over Egypt. Results are in agreement with those recently pre-sented by Papadimas et al. (2010), which showed the existence of a Mediterraneansolar radiation spatial variability mode associated with the NAO during the win-ter. Regarding the annual correlation map, it resembles winter case but displacednorth-eastward and with weaker values. Particularly, the highest positive correla-tions (0.6) are found over Poland and the Baltic area. Regarding the Mediterraneanarea, weak but statistically significant positive correlations (0.2) are found over thesouthwest of the Iberian Peninsula and the eastern Mediterranean area and weaknegative correlations over the north of Egypt.
Since interannual variability of the solar radiation is mainly associated with cloudcover, the former NAO-solar energy correlation patterns should resemble the NAO-cloud cover spatial correlation over the study area. Figures 3a and 3b shows thecorrelation between the NAO index and the total cloud cover for the winter and
Fig. 3 (a) Correlation between the NAO index and the cloud cover for the winter season. Theperiod of analysis covers 1989–2008. Dots indicates negative correlation while continuous lineindicates positive correlation. Shading indicates local statistical significance of the difference at90% confidence level based on a t-test. (b) as in (a) but for the annual data

220 D. Pozo-Vazquez et al.
annual cases, respectively. As expected, both the winter and annual patterns are inagreement with those observed in Fig. 2. In particular it should be noted the negativecorrelation pattern covering the majority of the Mediterranean area during winter(Fig. 3a), with the maximum negative values (–0.3) located over the central andeastern sectors. On the other hand, positive correlation values (0.6) are found overIreland. These results are in agreement with the analysis of the cloud-cover NAOrelationship of Trigo et al. (2002). Concerning the annual case (Fig. 3b), negativecorrelation values (about –0.3) are observed over the west of the Iberian Peninsulaand the eastern Mediterranean area, in agreement with the patterns observed inFig. 2b. In any case, correlations are, both for the winter and annual case, weakerthan those obtained for the solar energy.
3.2 NAO-Wind Energy Correlation Analysis
Figure 4a, b show the correlation between the NAO index and the wind energy forthe winter and annual cases, respectively. In both cases, a dipolar pattern can beobserved, with negative correlation values over the whole Mediterranean region andpositive correlations concentrated over central and northern Europe. Noteworthy,the correlations are weaker than those obtained for the solar energy, indicating aweaker linear relationship between the NAO and the wind energy. Note that annualdipolar pattern seems to be shifted south-eastward compared to the winter case.Particularly, for winter, the maximum positive correlations (0.6) are found over thenorth of the British Islands and the Scandinavian Peninsula. For the annual case,these high positive values are also observed in central Europe. On the other hand,the maximum negative values are found over Greece in winter and over the northof Algeria in the annual case. Note the striking feature over the Gibraltar Strait areaduring winter. Over this area, high positive correlation values (0.6) are found while
Fig. 4 (a) Correlation between the NAO index and the wind energy for the winter season. Theperiod of analysis covers 1989–2008. Dots indicate negative correlation while continuous lineindicates positive correlation. Shading indicates local statistical significance of the difference at90% confidence level based on a t-test. (b) as in (a) but for the annual data

The Impact of the NAO on the Solar and Wind Energy Resources in the. . . 221
negative values are found in the rest of the Mediterranean area. This feature, whichdeserves more research in the future, is probably related to the special topographiccharacteristic of this area.
3.3 Solar Energy Composite Analysis
In this section, composite patterns of winter solar energy anomalies are obtainedas a function of the state of the NAO. Data are represented as anomalies (in per-centage) from the mean of complete study period (1985–2004). Figure 5a showsthe composite of solar energy anomalies for winters in which the value of NAOindex was positive (NAO>1) and Fig. 5b for winters in which the NAO index wasnegative (NAO<–1). The differences between positive NAO and normal NAO (i.e.,–1<NAO<1) winters (Fig. 5c) and negative NAO and normal NAO winters (Fig. 5d)are also shown. Finally, the differences between the anomalies during positive andnegative NAO winters (i.e., the differences between Fig. 5c, d) are represented inFig. 5e. Note that Fig. 5c, d, f represent the spatial patterns of the maximum inter-annual changes (from one winter to other) that can be expected in the solar energyresources. During positive NAO winters (Fig. 5a), the solar energy presents pos-itive anomalies over the whole Mediterranean area and negative anomalies overcentral Europe and the north of the British Islands. The spatial pattern of anomaliesobserved during negative NAO winters are similar but of reverse sign (Fig. 5b). Bothpatterns are in agreement with the correlation patterns presented in Fig. 2a. Whencomparing the anomalies during positive NAO and normal NAO winters (Fig. 5c),the whole Mediterranean area presents statistically significant positive anomalies.The maximum values (10–15%) are observed over the Iberian Peninsula, Greece andTurkey. On the other hand, the north of the British Islands presents the highest neg-ative anomalies (about –10%). The comparison between negative and normal NAOwinters (Fig. 5d) shows the existence of statistically significant negative anomalies(–4 to –8%) over the Iberian Peninsula, the south of France and over certain areasof Greece and Turkey. In addition, statistically significant positive anomalies (+4 to+8%) are found over eastern and northern Europe. By comparing the anomalies dur-ing positive and negative NAO winters (Fig. 5d), noticeable interannual changes inthe availability of solar energy during the winter season can be expected in certainareas of the study region. Particularly, over the Iberian Peninsula, the northern partof Greece and Turkey, central Europe and the British Islands, interannual changes inthe solar resources of values up to 15% can be expected associated with interannualchanges in the NAO phase.
Similarly to Figs. 5 and 6 presents the solar energy anomalies associated withthe NAO phases but on annual basis. In general, the annual spatial patterns ofanomalies resemble their winter counterparts but with weaker anomalies. As forthe winter case, statistically significant positive anomalies are found over the wholeMediterranean area when comparing positive NAO and normal NAO years (Fig. 6c),but anomalies are considerable weaker (about 4% compared to 10% of the win-ter case). When comparing negative and normal NAO years (Fig. 6d) statistically

222 D. Pozo-Vazquez et al.
Fig. 5 Composites of winter season observed solar energy anomalies as a function of the NAOphase. (a) During the positive phase (NAO>1). (b) During the negative phase (NAO<–1). (c)Difference between the positive phase and the normal phase (–1<NAO<1). (d) Difference betweenthe negative phase and the normal phase. (e) Differences between the positive and negative phase.Data are anomalies in percentage from the long term mean. Continuous line indicates positiveor zero anomalies and dotted line indicates negative anomalies. Shading indicates local statisticalsignificance of the difference at 90% confidence level based on a t-test
significant negative anomalies (about –3%) are found over the South of France andItaly and positive anomalies (about 2%) over the southeast of the Iberian Peninsula,Tunis and the east of Turkey. The differences between positive and negative NAOyears (Fig. 6e) show that important interannual changes in the availability of solarenergy can be expected in certain areas of the study region, but of a lower magnitude

The Impact of the NAO on the Solar and Wind Energy Resources in the. . . 223
Fig. 6 As in Fig. 5 but for the annual data
than those observed for the winter case. Particularly, in the Mediterranean region,interannual changes of values, between 4 and 8%, can be expected associated withinterannual changes in the NAO. Results are in agreement to Lohmann et al. (2006)analysis of the interannual variability of the GHI in the Mediterranean area.
3.4 Wind Energy Composite Analysis
As in Fig. 5 for the solar energy, Fig. 7 presents the composite patterns of windenergy anomalies during the winter associated with the different phases of the NAO.

224 D. Pozo-Vazquez et al.
Fig. 7 As in Fig. 5 but for the wind energy anomalies
During positive NAO winters (Fig. 7a), positive anomalies are observed over theBritish Isles and the Scandinavian Peninsula, reaching up to 20%. Also positiveanomalies but weaker (+10%) are observed over central Europe, the northwest ofMorocco/Gibraltar Strait area, the north of Egypt and the eastern of Turkey. On theother hand, over the Iberian Peninsula, the central Mediterranean and the Black Seaareas, negative anomalies of values between –5 and –10% are found. When com-paring these anomalies with those observed during normal NAO winters (Fig. 7c),some interesting features are obtained. Particularly, statistically significant and pos-itive values of up to 30% are observed over the British Islands and the Scandinavian

The Impact of the NAO on the Solar and Wind Energy Resources in the. . . 225
area. Positive differences of values between 15 and 30% are observed also overthe northwest of Morocco, central Europe and certain areas of the south and northof Turkey. On the other hand, statistically significant negative differences (–15 to–30%) are found over the Iberian Peninsula, north of Algeria and the northwest ofTurkey. The pattern observed during negative NAO winters (Fig. 7b) is not the oppo-site of that observed during the positive NAO winters. This result is indicative of animportant non-linear relationship between the wind energy and the NAO in the studyarea during winter. Particularly, during negative NAO winters, positive anomaliesare observed over the whole Mediterranean basin (10–20%) and the Scandinavianarea (about 20%), while negative anomalies are observed over the Iberian Peninsula(–10 to –20%). When comparing these anomalies with those found during normalwinters (Fig. 7d), statistically significant positive differences are observed over Italy,Greece and Turkey (+20%) and over the Scandinavian area (+40%). On the otherhand, negative differences are observed over the Iberian Peninsula and the north ofMorocco (–20 to –40%). Finally, the patterns in Fig. 7e indicate that interannualchanges in the winter NAO from positive to negative phase (or vice-versa) maylead to important changes in the wind resources availability. Particularly, over thecentral Mediterranean expected changes from one winter to other can reach about20%, while over Turkey and the northwest of Morocco these changes can reach up40%. Remarkably, and as a consequence of the non-linear influence of the NAO onthe wind resource, anomalies observed in Fig. 7e in the Mediterranean area are ofthe same order of magnitude of those of Fig. 7c, d. Therefore, it can be concludedthat in many areas of this region, as Turkey, Greece or the northwest of Morocco,interannual variability of the wind resources from one winter to other can be reallyhigh. This reflects the marked interannual variability of the NAO: over these areas,wind resources experiment noticeable changes from one winter to another. This hap-pens not only when the NAO changes from the positive to the negative phase, butalso when the NAO changes from a positive or negative phase to a normal phase orvice-versa (Fig. 7c–e).
The composite anomaly patterns for the annual case (Fig. 8) are similar totheir winter counterparts but displaced south-eastward and with weaker anoma-lies. Particularly, as for the winter case, and as may be expected from Fig. 4b, theannual case also presents an important non-linear relationship between the NAOand the wind energy resources. Notably, Fig. 8a, b do not present opposite pat-terns. Statistically significant negative anomalies (about –8%) are found over thecentral Mediterranean area when comparing positive NAO and normal NAO years(Fig. 8c). Positive anomalies are observed over central and northern Europe andover the Iberian Peninsula, with values in the order of 8%. When comparing nega-tive and normal NAO years (Fig. 8d) statistically significant and positive differences(with values about 10%) are found over the central and eastern Mediterranean areas,the north of the Iberian Peninsula and some areas in central and northern Europe.On the other hand, statistically significant negative differences are observed overthe south of the Iberian Peninsula and the north of Morocco and Algeria. Finally,Fig. 8f indicates the existence of an important interannual variability of the windresources in the study region associated with interannual changes in the NAO from

226 D. Pozo-Vazquez et al.
Fig. 8 As in Fig. 7 but for the annual data
positive to negative phase (or vice-versa). Particularly, in the central and easternpart of Mediterranean region, over the Gibraltar Strait area and over the northwestof Morocco, these changes can reach up to 10%. Nevertheless, and as a consequenceof the important non-linear relationship between the wind energy resources and theNAO, these changes are of a lower magnitude than the changes observed when theNAO changes from a positive or negative phase to the normal phase (or vice-versa)(Fig. 8c, d). Similarly to the winter analysis, it can be concluded that in certainareas of the Mediterranean (namely the northwest of Morocco, the Gibraltar Straitand Greece), interannual variability of the wind resources can be really high. Thissituation reflects the fact that wind resources over these areas experiment marked

The Impact of the NAO on the Solar and Wind Energy Resources in the. . . 227
changes from 1 year to other not only when the NAO changes from the positiveto the negative phase, but also when the NAO changes from a positive or negativephase to a normal phase or vice-versa (Fig. 8c–e).
3.5 The NAO and the Balancing of the Solar and Wind EnergyResources
The previous sections revealed that the variability of the solar and wind energyresources in the study region associated with the NAO presents considerable spa-tial differences. Notably, the spatial patterns of the NAO influence on the solarand wind resources reveal in some cases the existence of spatial balancing. Forinstance, the dipolar pattern of the spatial correlation in Fig. 2a indicates the exis-tence of spatial balancing of the solar resources between the central and northernEurope, on one side, and the Mediterranean basin, on the other. Even more, thereexists also a weaker but more interesting (because of the availability of the solarresources) balancing between the north of Egypt and the rest of the Mediterraneanarea. Unfortunately this spatial balancing is not present in the annual analysis(Fig. 2b). Regarding the wind, the dipolar pattern in Fig. 4a also reveals the exis-tence of spatial balancing between northern Europe and the Mediterranean area asearlier highlighted by Pryor et al. (2006). Compared to the winter solar energycase, the strength of this balancing seems to be weaker. In addition, during win-ter, there exists also spatial balancing between the western Mediterranean (Gibraltarstrait) and the rest of the Mediterranean region. Regarding the annual case, andunlike the solar resources, the spatial balancing is also present but displaced south-west-ward (Fig. 4b). Finally, the comparison of Figs. 2a and 4a reveals that theNAO impact on the solar and wind resources over the study area presents a similarnorth-south dipolar pattern but the sign of the dipoles are just opposite. Therefore,it can be concluded the existence of a notably local balancing between the solarand wind resources almost over the whole study region during winter. Regardingthe Mediterranean region, the strength of this balancing seems to be especially highin the central part, over Greece, where correlation between the NAO and the solarenergy is higher than 0.6 (Fig. 2a) and between the NAO and the wind energy withcirca –0.6 (Fig. 4a). For the annual case (Figs. 2b and 4b) the balancing is alsopresent but weaker. Concerning the Mediterranean area, the southwest of the IberianPeninsula, Greece and Turkey present a remarkable balancing. For instance, over thesouthwest of Iberian Peninsula the NAO-solar energy correlation reaches about 0.2while NAO-wind energy correlation is about –0.4.
4 Summary and Conclusions
The influence of the NAO on the solar and wind energy resources in theMediterranean area has been explored based on the analysis of 20 years of reanal-ysis and satellite data. Particularly, the role of the NAO cycle in the interannual

228 D. Pozo-Vazquez et al.
variability of the solar and wind energy resources was analyzed based on correlationand composite analysis. Although the study is focused on the Mediterranean area,for the sake of completeness, the analysed data covered the whole North Atlanticand Mediterranean area, including the north of Africa. The analysis was carriedout twice for the winter and annual periods and aimed to contribute to a betterunderstanding of renewable energy resources in the study region.
Regarding the winter solar energy, a north south dipolar pattern of correlation wasfound, with the positive centre of the dipole over the Mediterranean and the nega-tive one over central and northern Europe. Correlation coefficient over the wholeMediterranean area reached values above 0.6, with the highest value (0.8) over theIberian Peninsula. The annual case presented a correlation map resembling the win-ter case but displaced north-eastward and with weaker values. A similar analysisfor the cloud cover instead of for the solar energy was able to explain the formerresults. In any case, the NAO-cloud cover correlation was found, both for the winterand annual case, to be weaker than those obtained for the solar energy. The compos-ite analysis revealed some additional features of the NAO-solar energy relationship.Particularly, positive anomalies (10–15%) were found over the Iberian Peninsula,Greece and Turkey associated with the positive phase NAO winters. On the otherhand, during negative NAO winters, negative anomalies (–4 to –8%) were foundover the Iberian Peninsula, the south of France, Greece and Turkey. As a conse-quence, over these areas, interannual changes in the winter solar energy resources ofvalues of up to 15% can be expected associated with interannual changes in the NAOphase. Regarding the annual analysis, the composite analysis showed similar resultsbut anomalies were considerable weaker. For instance, the positive NAO years werefound associated with positive anomalies (4%) over the whole Mediterranean area.Negative NAO years were found associated with negative anomalies over the Southof France and Italy (–3%) and positive anomalies (2%) over the southeast of theIberian Peninsula, Tunis and the east of Turkey. As a consequence, for the entireMediterranean region, interannual changes of values between 4 and 8% were foundassociated with interannual changes in the NAO phase.
The NAO-wind energy relationship was found to be considerably more com-plex than the NAO-solar energy one. Particularly, the winter correlation analysisproved the existence of north-south dipolar pattern, with positive values over cen-tral and northern Europe and negative values over the Mediterranean area. For thelatter area, negative correlation values (–0.4 to –0.6) were observed, except overthe Gibraltar Strait area, where positive correlation values were found. The annualcorrelation analysis showed a similar pattern, but shifted south-eastward. Thus overthe Mediterranean area, the maximum negative values were observed over Greece(–0.6) in the winter case and over Algeria (–0.6) in the annual case. Noteworthy,in general the correlations were weaker than for the solar energy case, indicating aweaker linear relationship between the NAO and the wind energy. The compositeanalysis revealed additional features regarding the complex relationship betweenthe NAO and the wind energy in the study area. For instance, the winter anal-ysis proved the existence of positive anomalies (15–30%) over the northwest ofMorocco and the south and north of Turkey, and negative anomalies (–15 to –30%)

The Impact of the NAO on the Solar and Wind Energy Resources in the. . . 229
over the Iberian Peninsula, north of Algeria and the northwest of Turkey associ-ated with the positive phase of the NAO. The composite pattern observed duringnegative NAO winters was not the opposite of the observed during the positiveNAO winters. Particularly, the main features during this negative phase were thepresence of positive anomalies (+20%) over Italy, Greece and Turkey and negativeanomalies (–20 to –40%) over the Iberian Peninsula and the north of Morocco. Asa consequence, notable interannual changes in the winter wind energy resourcesassociated with interannual changes in the NAO phase were found over the centralMediterranean (20%), Turkey and the northwest of Morocco (+40%). The annualcomposite patterns showed to be similar to their winter counterparts but the patternswere displaced south-eastward and the anomalies were weaker. Particularly, overthe central Mediterranean, negative anomalies (–8%) were found associated withthe positive phase of the NAO. During the negative phase, positive anomalies (10%)were found over the central and eastern Mediterranean area and the north of theIberian Peninsula, while negative anomalies (–10%) were found over the south ofthe Iberian Peninsula and the north of Morocco and Algeria. Consequently, inter-annual changes in the annual wind resources of values over 10% were found inthe central and eastern part of Mediterranean region, over the Gibraltar Strait areaand over the northwest of Morocco associated with interannual changes in the NAOphase.
Finally, the analysis of the spatial patterns of the NAO influence on the solar andwind energy resources revealed the existence of spatial and local balancing. Amongothers, the dipolar pattern of the spatial correlation obtained for the solar energy dur-ing winter indicated the existence of spatial balancing of the solar resources betweenthe central and northern Europe and the Mediterranean. However, it should be notedthat this spatial balancing was not present in the annual analysis. The dipolar patternof the winter NAO-wind energy relationship also revealed the existence of spatialbalancing between northern Europe and the Mediterranean area for the wind energy.Nevertheless, compared to the winter solar energy case, the strength of this balanc-ing was found to be weaker. In addition, during winter, spatial balancing betweenthe western Mediterranean (Gibraltar Strait) and the rest of the Mediterranean regionwas also found. Regarding the annual case, and unlike the solar resources, the spa-tial balancing was also present but displaced south-westward. In addition to thespatial balancing found for the wind and the solar energy, a significant local bal-ancing between the solar and wind resources almost over the whole study regionwas found associated with the NAO cycle. Regarding the Mediterranean region andduring winter, the strength of this balancing was found to be especially high in thecentral section. In the annual case the most important local balancing was found overthe southwest of the Iberian Peninsula, Greece and Turkey, although the magnitudewas weaker than in the winter case.
The authors believe that the results above summarized are of interest regardingthe solar and wind energy resources evaluation in the Mediterranean area. In thisregard we would like to emphasise that, in the light of results obtained here, a morein depth assessments of solar and wind resources should be required and that mea-suring solar and wind data covering only a few years should be avoided. This will

230 D. Pozo-Vazquez et al.
provide a better estimation of the expected interannual variability of the renewableresources and, therefore, of the plant production interannual variability.
Acknowledgements The Spanish Ministry of Science and Technology (grant ENE2007-67849-C02-01) and the Andalusian Ministry of Science and Technology (grant P07-RNM-02872) andFEDER funds financed this study. Support is also obtained from the Plan Andaluz de Investigación(Grupo TEP-220). The DLR-ISIS data images were obtained from the Institute of AtmosphericPhysics, German Aerospace Center (DLR) (Lohmann, 2006).
References
Barbour P, Walker S (2008) Wind resource evaluation: Eola Hills. Technical report, EnergyResources Research Laboratory, Department of Mechanical Engineering, Oregon StateUniversity, Corvallis, OR
Burlando M (2009) The synoptic-scale surface wind climate regimes of the Mediterranean Seaaccording to the cluster analysis of ERA-40 wind fields. Theor Appl Climatol 96:69–83
Cassola F, Burlando M, Antonelli M, Corrado FR (2008) Optimization of the regional spatialdistribution of wind power plants to minimize the variability of wind energy input into powersupply systems. J Appl Meteorol Climatol 47:3099–3116
Chiacchio M, Wild M (2010) Influence of NAO and clouds on long-term seasonal variations ofsurface solar radiation in Europe. J Geophys Res 115:D00D22. doi:10.1029/2009JD012182
DESERTEC (2010) DESERTEC Red paper. An overview of the DESERTEC concept. DESERTECorganization. http://www.desertec.org/
DLR (2007) TRANS-CSP. DLR-ITT technical report, Köln, GermanyGlobal Wind Energy Council (2007) Global wind energy council report. http://www.gwec.net/
uploads/media/Global_Wind_2007_Report_final.pdfHurrell JW, Kushnir Y, Visbeck M, Ottersen G (2003) An overview of the North Atlantic
Oscillation. In: Hurrell JW et al (eds) The North Atlantic Oscillation: climate significance andenvironmental impact. Geophys Monogr Ser, vol 134. AGU, Washington, DC, pp 1–35
IEA (2008) World energy outlook. International Energy Agency, OECD PublicationIEA (2009) Technology roadmap. Wind energy. International Energy, OECD PublicationIEA (2010a) Technology roadmap. Solar photovoltaic energy. International Energy, OECD
PublicationIEA (2010b) Technology roadmap. Concentrating solar power. International Energy, OECD
PublicationKempton W, Pimenta FM, Veron DE, Colle BA (2010) Electric power from offshore wind via
synoptic-scale interconnection. Proc Natl Acad Sci 107:7240–7245Lara-Fanego V, Ruiz-Arias JA, Pozo-Vázquez D, Santos-Alamillos F, Tovar-Pescador J (2011)
Evaluation of the WRF model solar irradiance forecasts in Andalusia (southern Spain). SolEnergy, doi:10.1016/j.solener.2011.02.014
Li X, Zhong S, Blan X, Hellman WE (2010) Climate and climate variability of the windpower resources in the Great Lakes region of the United States. J Geophys Res 115:D18107.doi:10.1029/2009JD013415
Lohmann S, Schillings C, Mayer B, Meyer R (2006) Long-term variability of solar direct andglobal radiation derived from ISCCP data and comparison with reanalysis data. Solar Energy80:1390–1401
Papadimas CD, Fotiadi AK, Hatzianastassiou N, Vardavas I, Bartzokas A (2010) Regional co-variability and teleconnection patterns in surface solar radiation on a planetary scale. Int JClimatol 30:2314–2329
Pozo-Vázquez D, Tovar-Pescador J, Gámiz-Fortis SR, Esteban-Parra MJ, Castro-Díez Y (2004)NAO and solar radiation variability in the European North Atlantic region. Geophys Res Lett31. doi:10.1029/2003GL018502

The Impact of the NAO on the Solar and Wind Energy Resources in the. . . 231
Price Water House Coopers (2010) 100% Renewable electricity: a roadmap to 2050 for Europeand North Africa. Price Water House Coopers, London
Pryor S, Barthelmie R, Shoof JT (2006) Inter-annual variability of wind indices across Europe.Wind Energy 9:27–38
Sanchez-Lorenzo A, Calbó J, Brunetti M, Deser C (2009) Dimming/brightening over the IberianPeninsula: trends in sunshine duration and cloud cover and their relations with atmosphericcirculation. J Geophys Res 114:D00D09. doi:10.1029/2008JD011394
Sanchez-Lorenzo A, Calbó J, Martin-Vide J (2008) Spatial and temporal trends in sunshineduration over Western Europe (1938–2004). J Clim 21:6089–6098
Simmons A, Uppala S, Dee D, Kobayashi S (2007) ERA-I: new ECMWF reanalysis products from1989 onwards. ECMWF Newsletter 110:25–35
Trigo RM, Osborn TJ, Corte-Real JM (2002) The North Atlantic Oscillation influence on Europe:climate impacts and associated physical mechanisms. Clim Res 20:9–17
von Bremen L (2008) Large-scale variability of weather dependent renewable energy sources. In:Troccoli A (ed) Management of weather and climate risk in the energy industry. Springer, TheNetherlands, pp 189–205
Weisser D, Foxon T (2003) Implications of seasonal and diurnal variations of wind velocity forpower output estimation of a turbine: a case study of Grenada. Int J Energy Res 27:1165–1179

Index
AAbies alba, 131–133, 135–137, 148, 150Accumulated snow, 4, 73–88Agricultural monitoring, 125Air pollution, 2, 173, 179Alentejo, 124, 126Amarone, 110Amphibians, 5, 157Animal population dynamics, 161Aquatic ecosystems, 154–155, 164Arrival dates, 5, 161–162Atmospheric circulation, 1, 3, 11, 18, 21, 24,
42–44, 51, 53, 62, 68, 74, 83, 109, 114,124, 130, 172–173, 175, 177–178, 184,189, 195, 201
Avifauna, 159Azores, 1, 10, 26, 42, 44, 130, 155, 175,
184, 195
BBarbaresco, 110Barolo, 110Biomass, 91–93, 98, 114, 184Birds
migration, 5, 161–163migration timing, 161population, 159–163
Breeding populations, 159–160Brunello di Montalcino, 110
CCalibrated antecedent rainfall (CAR), 206–208,
210Carbon absorption, 4, 122Chianti Classico, 110Circulation to Environment, 173–175, 177Climate change, 1–2, 15, 19–20, 154, 161, 165,
173, 177–178, 184, 195
Climate model, 11–21, 47, 57, 59, 142, 146,177, 179
Climate variability, 1–3, 15–18, 21, 58, 66,105, 115, 122, 125, 150, 216
Climatic risk, 24Cloud, 1, 24, 107, 120, 131, 133, 135,
137–138, 148–149, 216–220, 228CMIP3, 11, 14, 16–21Cod fisheries, 93Cod stocks, 93, 100Cold-warm, 74Composite analysis, 60, 68, 217, 221–228Concentrating solar power (CSP), 214Conifers, 131, 136, 142, 148Crops, 2, 4, 25, 37, 65–66, 69, 103–111,
115–116, 118–120, 122, 125–126,157
CRU TS3.0, 75
DDebris flow, 200–201Deep-sea fishery, 100Dendrochronological methods, 131, 133Development, 37, 74, 103, 107, 109, 111, 126,
154, 210, 214–215Douro, 3, 47–53Drought
events, 24, 118, 122, 126planning, 37prediction, 37preparedness, 37propagation, 3
Dry conditions, 30, 33, 63, 86Dry spell, 68Dry-wet, 74Durum wheat, 106, 108–109Dust transport, 5, 173, 175Dynaric Alps, 75, 80
233S.M. Vicente-Serrano, R.M. Trigo (eds.), Hydrological, Socioeconomicand Ecological Impacts of the North Atlantic Oscillation in the Mediterranean Region,Advances in Global Change Research 46, DOI 10.1007/978-94-007-1372-7,C© Springer Science+Business Media B.V. 2011

234 Index
EEarlywood, 148Ebro basin, 148–149, 185, 187–188Ecological impacts, 1, 3, 153–165Elevation, 4, 74, 77–78, 83–85, 87–88,
131–132, 149, 185Energy meteorology, 215–217Ensemble, 3, 15–21Environment, 1–3, 5–6, 23–24, 44, 75, 91–92,
100, 103–104, 108–109, 153–154,160–163, 173–178, 187, 195
Environment to Circulation, 174, 177–178Environmental impacts, 1–2, 58, 66, 114, 122,
125, 156, 165, 173EOF, 10, 13, 15, 17, 19–20ERHIN Programme, 75Erosion, 5, 183–184, 187, 195Erosive event, 188Euphrates-Tigris River system, 66Expressed Population Signal (EPS), 133–134External forcing, 3, 11, 15–16, 21, 177, 179Extreme events, 2–3, 11, 23, 53, 115, 190–19
FFish
abundance, 92, 100, 158biomass, 91stocks, 100
Fishery, 2, 4, 91–100, 156–158FISHSTAT, 94–95Forest decline, 129–151Forest types, 130–131
GGeneralized Additive Model (GAM), 94,
96–97Generalized Pareto (GP) probability
distribution, 190, 192–193Grapevine, 105–108Greenhouse gases (GHG), 11, 13, 15, 18, 21,
172, 177–179, 213–214Growth, 5, 104, 114–115, 118–120, 125,
129–151, 157, 210rate, 92, 148, 214
Guadiana, 3, 47–52Gulf of Lions, 93–94, 96, 98, 100Gumbel distribution, 204
HHake, 4, 93–100, 158Hazard, 2, 23, 37Hydroelectricity, 47Hydrologic cycle, 57
Hydrologic variables, 4, 59Hydrological droughts, 36
IIberian Peninsula, 4, 28, 30, 33, 36, 42–43,
51, 53, 60, 75, 78–81, 86–87, 114–116,118–119, 126, 130, 185, 189, 207,218–222, 224–225, 227–229
Interannual variability, 1–2, 4–6, 10, 13, 19,49, 53, 59, 74, 80, 85, 87, 155, 162,176–177, 184–185, 195, 216–217, 219,223, 225–226, 230
Internal variability, 11–12, 15–19, 21, 178–179Iran, 4, 61, 65–67, 69Israel, 4, 58–59, 67–70, 176–177
JJuniperus thurifera, 131–132, 151
KKolmogorov-Smirnov test, 190, 192Kuwait, 4, 67–70
LLake-level variations, 64Land cover types, 116, 118, 126Landslide(s), 2, 5, 199–211
event, 5, 202–211types, 200–201, 203, 206, 210
Lisbon region, 5, 26, 53, 201–210
MMammals, 5, 157Marine fish, 92Mediterranean, 91–100, 103–111, 114–116,
118–119, 122, 129, 131, 136–137, 142,144, 148–151, 153–165, 184–187, 191,193, 195, 200, 213–230
basin, 1, 4–5, 18, 25, 28, 30, 37, 42–44,62, 78–86, 93, 130, 156–158, 162–163,171–179, 214, 217, 225, 227
mountains, 4, 73–88MEDITS database, 92, 97–99Meridional circulation, 184Mesic temperate forests, 136Middle East, 43, 58–62, 66–67, 70, 78,
173, 214Migrants, 161–163Montepulciano wine, 106–107Mountain areas, 74–82, 86–88, 187Multi-model, 3, 11, 14, 16–21

Index 235
NNegative phase(s), 5, 26, 30, 36–37, 43, 53–54,
64–65, 68–69, 156, 158, 160, 175–176,178–179, 195, 222, 225–227, 229
Net primary production (NPP), 114–115,119–122, 125
Nobile di Montepulciano, 110Normalised Difference Vegetation Index
(NDVI), 114–119, 124–126North Africa, 5, 33, 78, 173, 175, 179, 214–215North Atlantic, 1, 5, 13, 44, 51–52, 57, 68,
92–93, 100, 130, 155–156, 176, 179,184, 195, 211, 217, 228
North Atlantic Oscillation (NAO), 1, 3, 9–21,24, 42, 58, 73–88, 100, 105, 114,129–151, 153–165, 175, 184–185, 189,199–211, 217
index, 1–2, 5, 9–21, 25–26, 37, 43–50, 53,60–69, 73–88, 92–93, 96–97, 106–110,114–117, 123, 126, 133, 142, 144–148,150, 159–160, 162, 164, 175–176, 189,207–211, 218–221
pattern, 3, 11, 13–15, 42–44, 51, 53, 87,149, 177, 207, 213
OOman, 4, 67–69Overfishing, 94Ozone, 172–176
PPalmer Drought Severity Index (PDSI), 24,
121Particulate, 175–176Peaks-over-threshold (POT), 190–192Phenology, 105–108, 114, 157, 160–163Photovoltaic (PV) effect, 214, 216Pinus pinaster, 149Plant growth, 114–115, 120, 157Pollution transport, 175Positive phase(s), 1–2, 5, 26, 28, 30, 33, 36–37,
42, 54, 58, 64–65, 68, 114, 150, 156,158, 160–161, 163, 175–179, 184, 195,222, 228–229
Precipitation, 1–5, 24–25, 28, 36, 42–48,51–53, 58–62, 64, 66–69, 74–76,78–82, 84–87, 93, 104–109, 113–115,117–122, 124–126, 130–138, 141–142,144, 146, 148–151, 154, 156, 158–161,173, 176, 179, 185–187, 190, 195,201–202, 204, 207–211
variability, 47, 59–60
Principal component, 10–11, 15, 26, 33–36,58, 61–62, 135–138, 141, 143,145, 148
Principal component analysis (PCA), 26,33–36, 135–137
Pyrenees, 4, 74–75, 79–81, 84–87, 119, 121,131–132, 148, 185–186, 193
RRadial cores, 133Radial growth, 130, 148, 150Rainfall amount, 203–204Rainfall duration, 204–205Rainfall erosivity, 183–195Rainfall event, 183–184, 186–187, 201, 210Rainfall triggering, 202–207, 210Rainsplash, 183Recruitment, 92–94, 158, 160–161Red shrimp, 4, 93, 98, 100Regression coefficient, 11, 15Regression model, 62, 96, 124–125, 204Renewable energy, 214–216, 228Return period, 190, 193–194, 203–204R factor, 184River basin, 43, 48, 52–53, 57, 66River flow, 2–4, 43, 47–54Runoff erosion, 183RUSLE, 184, 189
SSangiovese grapevine, 106Scenario, 2, 11, 15, 18–20, 154, 177, 214Slope instability, 200, 204Sea level pressure (SLP), 3, 10–11, 13–15,
18–21, 44–45, 68, 70, 75, 130, 133,177, 184, 189
Snow cover, 2, 4, 74, 78, 83–84, 88, 118Snow depth, 74–75, 78, 82–87Snowpack, 4, 24, 74–75, 77–78, 83, 85–88Socioeconomic impacts, 3Soil conditions, 201Soil conservation, 184–185Soil moisture, 24, 36–37, 125–126, 157,
184, 211Soil properties, 183Solar energy, 214–215, 217–223, 227–229South Europe, 30Spatial correlation, 44, 219, 227, 229SRES, 11, 14–15, 18–20Standardized Precipitation Evapotranspiration
Index (SPEI), 3, 25–37Standardized Precipitation Index (SPI), 25,
36, 64

236 Index
Streamflow, 4, 43, 58–59, 61–62, 64, 66anomalies, 62, 69
Sulfate deposition, 178Swallows, 161–162Swiss Alps, 74, 77, 87–88Switzerland, 4, 82–84, 87
TTejo, 3, 47–53Temperature, 1, 4, 24–25, 28, 36, 42–43, 48,
53, 58–59, 61–62, 66–70, 74–88, 92,104–107, 109–111, 113–119, 121–122,124–125, 130–131, 133–135, 137–138,141–142, 144, 146, 148–150, 154–158,160–161, 163–164, 172–173, 177–178,186, 214
Temporal scales, 106, 154, 172, 211Terrestrial ecosystems, 157–158, 164Thresholds, 13, 76, 80, 85–86, 133, 146–147,
190, 200, 202–207, 209–211, 214Time scale, 3, 24–31, 33–37, 64, 66–67,
69, 177Trace gases, 5, 172–173, 175, 179Trans-Saharan species, 163Tree growth, 5, 129–151Tree-ring chronologies, 5, 150–151Trend(s), 1–2, 11, 13, 15–18, 21, 42–43, 47,
51–53, 62, 66, 68, 75, 93–94, 100,114–115, 123–124, 130, 133, 135, 141,177–179, 184, 205, 208
Turkey, 4, 28, 30, 33, 36–37, 44, 60–65, 67,69–70, 74–75, 78–80, 82, 86, 221–222,224–225, 227–229
UUSLE, 184
VVal d’Orcia, 108Vegetation activity, 4, 37, 113–126Vegetative cycle, 122–123
WWater availability, 4, 24, 114, 120, 125, 130,
148Water birds, 159Water resources, 2, 24, 37, 43, 47–51, 54, 57,
63, 66, 74–75Wavelet transform, 64Western Mediterranean, 1–2, 4–5, 41–54, 97,
115, 130, 158, 175–176, 179, 184, 227,229
Wet deposition, 176, 178Wet spell, 67–69Wheat, 65–66, 105–106, 108–109, 115, 157
yield, 66, 69, 105–106, 115, 122–126Wind energy, 5, 213–230Wind speed, 216–218Wine quality, 109–110Winter modes, 68, 70, 74–78, 81–82, 86–87
XXylogenesis, 148, 150
YYield, 4, 10, 16, 65–66, 69, 86, 104–106,
115–116, 122–126, 157, 191, 201–202,216
ZZonal circulation, 177–178Zoology, 156