Embed Size (px)
Citation preview

THE ECONOMIC IMPACTS OF THE COMPACT WATER BANK
A THESIS
Presented to
The Faculty of the Department of Economics and Business
The Colorado College
In Partial Fulfillment of the Requirements for the Degree
Bachelor of Arts
By
Burkett Huey
April 2016
THE ECONOMIC IMPACTS OF THE COMPACT WATER BANK
Burkett Huey
April 2016
Economics
Abstract
The Colorado River Compact Water Bank would transfer pre-Colorado River Compact
water used in forage irrigation to post-Compact water users in the event of a Compact
curtailment by fallowing irrigated crops. Several studies indicate that fallowing irrigated
acreage in rural communities reduces total economic activity. This study develops three
scenarios to estimate the indirect effects, or changes in total economic activity, from
fallowing irrigated acreage using IMPLAN, an input-output analysis program. Then I
measure the indirect impacts of a potential lease payment. Finally I add these effects
together to find that the Compact Water Bank would likely increase economic activity in
Montrose County, Colorado.
KEYWORDS: (Rotational Fallowing, Water Transfer, Input-Output Analysis, Compact
Water Bank)
JEL CODE: Q25, Q13

ON MY HONOR, I HAVE NEITHER GIVEN NOR RECEIVED
UNAUTHORIZED AID ON THIS THESIS
Acknowledgements:
I would like to thank my thesis advisor, Mark Smith, for helping me each step of
the way of this long project, and for guiding me when I was lost. I would not have been
able to complete this without his help. I would like to thank Roy Jo Sartin for helping
with my writing style and spending so much time brainstorming and editing with me. I’d
like to thank Ale Chavez for helping with my final edits and formatting. I’d like to thank
Brendan Boepple, Brook Larson, and Eric Perramond at the State of the Rockies for
providing me with an excellent background in Colorado water and funding this project.
I’d like to thank Van Skilling for providing me with funding for my data. Finally I’d like
to thank my family and friends for supporting me throughout this entire project.

Table of Contents
Introduction ......................................................................................................................... 1
Problem ........................................................................................................................... 1
Method ............................................................................................................................ 3
Data ................................................................................................................................. 4
Expected Results ............................................................................................................. 5
Literature Review ............................................................................................................... 7
Water Law Overview ...................................................................................................... 7
Secondary Impacts of Water Markets Literature ............................................................ 9
Empirical Analysis of Water Transfers ......................................................................... 14
Programs to Mitigate Indirect Effects ........................................................................... 16
Contributions of This Study .......................................................................................... 17
Background ....................................................................................................................... 19
Colorado River Interstate Compacts ............................................................................. 19
Compact Water Bank Transfer Mechanism .................................................................. 24
Montrose County .......................................................................................................... 28
Methodology ..................................................................................................................... 33
Input-Output Analysis and IMPLAN............................................................................ 33
Overview of How IMPLAN Processes Rotational Fallowing Programs...................... 36
Model Development for Montrose County ................................................................... 37
Best Case ................................................................................................................... 40
Average Case ............................................................................................................ 41
Worst Case ................................................................................................................ 42
Results ............................................................................................................................... 47
Fallowing Irrigated Acreage ......................................................................................... 49
Best Case: Proportional Fallowing ........................................................................... 50
Best Case: Least Cost Fallowing .............................................................................. 51
Average Case: Proportional Fallowing ..................................................................... 52
Average Case: Least Cost Fallowing ........................................................................ 52
Worst Case: Proportional Fallowing ......................................................................... 53
Worst Case: Least Cost Fallowing ............................................................................ 54
Lease Payments ............................................................................................................. 54
Lease Payment: Household Income .......................................................................... 55
Lease Payment: Agricultural Capital ........................................................................ 56
Net Impacts ................................................................................................................... 56
Sector Analysis ............................................................................................................. 59
Conclusion ........................................................................................................................ 65
Limitations of this Study ............................................................................................... 66
Closing Arguments ....................................................................................................... 68
References: ........................................................................................................................ 69
Appendix A: List of Assumptions .................................................................................... 74
Appendix B: Crop Enterprise Budgets …………...…....Colorado College Online Archive
Appendix C: Impacts of Compact Water Bank…...…... Colorado College Online Archive

List of Figures
Figure 1.1: Map of the western slope of Colorado with pre-Compact water Rights marked
in light green. Montrose County is appropriate to study because of its pre-1922
appropriated and adjudicated water rights. Montrose County is outlined in bold ............. 2
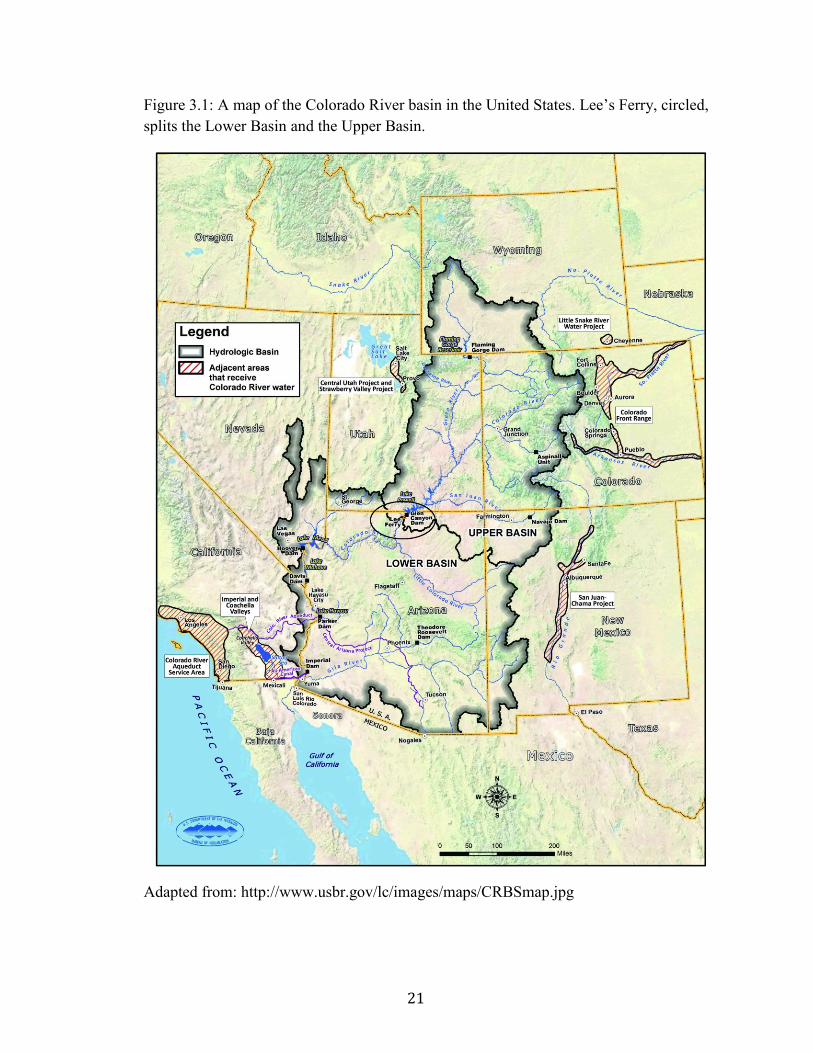
Figure 3.1: A map of the Colorado River basin in the United States. Lee’s Ferry, circled,
splits the Lower Basin and the Upper Basin………………………………………….….21
Figure 3.2: Map of transmountain diversions in Colorado. Many of these diversions move
water from west to east………………………….……………………………………….27
Figure 3.3: Map of the Uncompahgre Valley irrigation project in Montrose
County………………………………………………………………………...………….29
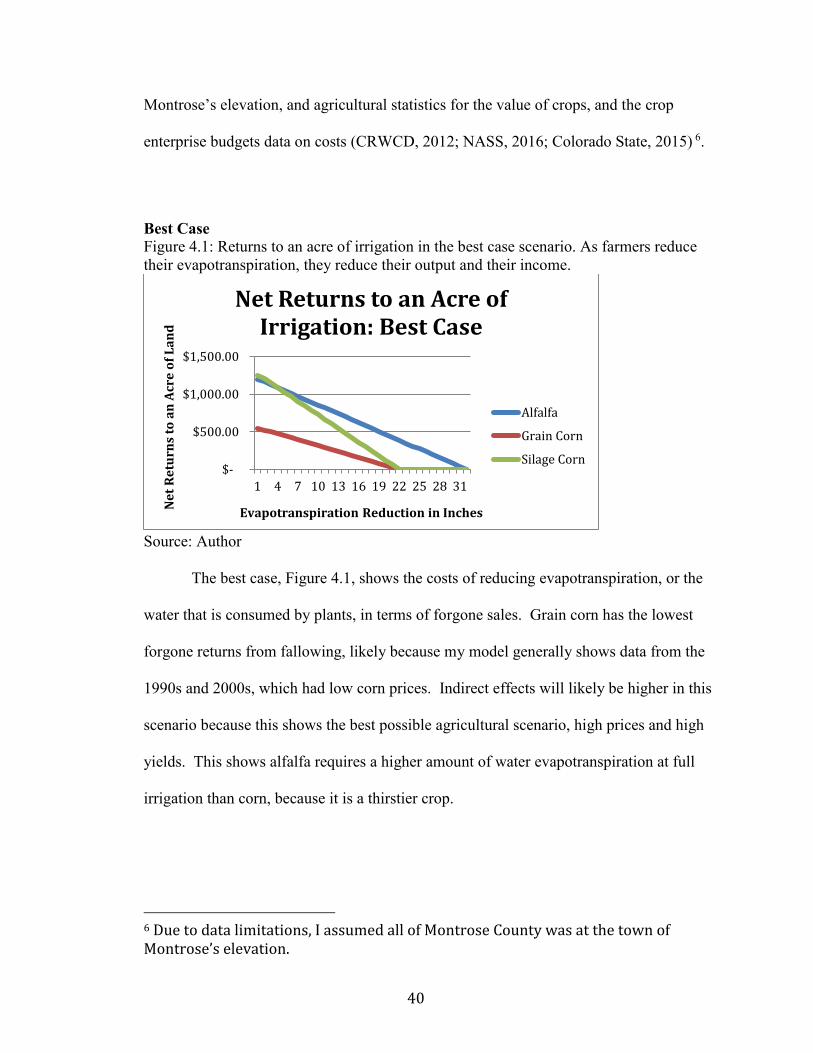
Figure 4.1: Returns to an acre of irrigation in the best case scenario. As farmers reduce
their evapotranspiration, they reduce their output and their income………………..…...40
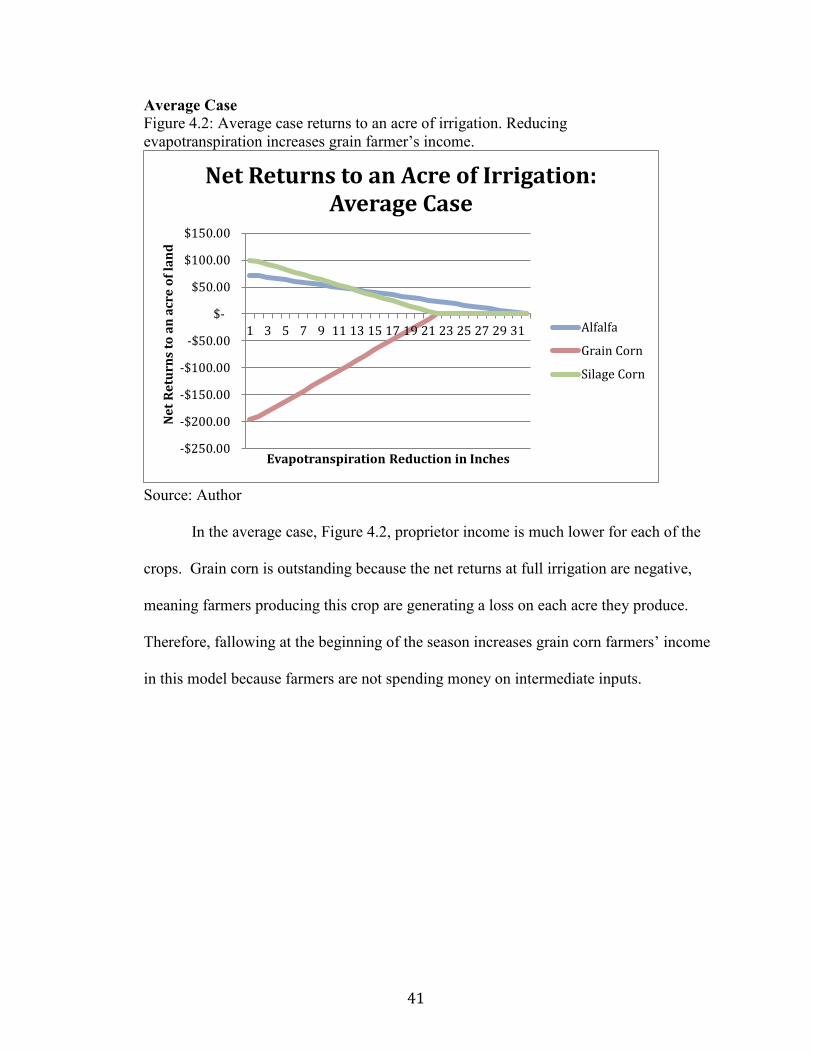
Figure 4.2 Average case returns to an acre of irrigation. Reducing
evapotranspiration increases grain farmer’s income………………………………..……41
Figure 4.3 Worst case returns to an acre of irrigation. Reducing evapotranspiration
increases all irrigator’s income…………………………...……………………………...42

List of Tables
Table 3.1: Supply limited consumptive use by water rights category…………...………24
Table 3.2: Potential categories of Water Bank use. This shows that Front Range
municipalities are dependent on Colorado River water…………………...……………..25
Table 3.3: Fallowing costs incurred by irrigators operating in the Grand and
Uncompahgre Valley for average Minimum and maximum five year commodity
prices………………………………………………………………………...…………...30
Table 4.1: A simplified input-output table. Industries’ output (rows) is used in the
economy as inputs for another industry (columns)……………………….……………...34
Table 4.2 Value of alfalfa and corn in Montrose County under various climatic scenarios
that change price and quantity of output produced……………………………………....38
Table 4.3: Conversion of each crop’s proportion of irrigated acreage to fallowed irrigated
acreage………………………….....……………………………………………………..44
Table 4.4: Least Cost Acres Fallowed, with the percentages of reduced irrigated acreage
in parenthesis…………………………...………………………………………………..44
Table 5.1: Indirect and induced effects from proportional fallowing in the best case
scenario…………………………………………………………………………………..50
Table 5.2: Indirect and induced effects from least cost fallowing in the best case
scenario………………………………………………………………………………..…51
Table 5.3: Indirect and induced effects from proportional fallowing in the average case
scenario...………………………………………………………………………………...52
Table 5.4: Average case indirect and induced effects from fallowing using the least cost
method...………………………………………………………………………………….52
Table 5.5: Worst case proportional fallowing indirect and induced effects from
fallowing…………………………………………………………………………………53
Table 5.6: Worst case least cost indirect and induced effects from fallowing…………..54
Table 5.7: Effects of increasing household spending through a lease payment…………55
Table 5.8: Effects of increasing agricultural capital spending through a lease payment.
…………………………………………………………………………………………...56
Table 5.9: Best case scenario net impacts of fallowing and lease payment…………..…57

Table 5.10: Average case scenario net impacts of fallowing and lease payment………..58
Table 5.11: Worst case scenario net impacts of fallowing and lease payment…………..58
Table 5.12: Top sectors indirectly negatively affected by fallowing in the best case (blue
shading denotes presence on crop enterprise budgets)……………………………….….60
Table 5.13: Top sectors indirectly negatively affected by fallowing in the average case
(blue shading denotes presence on crop enterprise budgets)…………………………….61
Table 5.14: Top sectors indirectly negatively affected by fallowing in the worst case (blue
shading denotes presence on crop enterprise budgets)…………………………………..62
Table 5.15: Top sectors positively impacted by lease payment used in household
spending and BEA’s agricultural production spending pattern…………………….........63

1
Chapter 1:
Introduction
Problem
The Colorado River provides drinking water to nearly 40 million people and
irrigates 5.5 million acres of land both inside and outside its river basin, including the
urban Front Range of Colorado (USBR, 2012). The Colorado River Compact of 1922
governs the river. The Compact divides the Colorado River Basin into the Upper Basin
and Lower Basin, and requires the Upper Basin to deliver 75 million acre-feet of water
every 10 years to the Lower Basin (USBR, 1922). If the Upper Basin does not deliver 75
million acre-feet to the Lower Basin, the Upper Basin must cease using water developed
after the Compact (USBR, 1948). Climate change in the highly variable Colorado River
increases the probability the Upper Basin may be unable to meet Compact’s requirements
and enter a Compact curtailment sometime in the future (USBR, 2012).
The Water Bank Group is working to mitigate risk of not meeting Compact
obligations by introducing a Compact Water Bank. The Compact Water Bank would
compensate pre-Compact water rights holders, mainly irrigators on Colorado’s western
slope, to enter a deficit irrigation rotational fallowing agreement and transfer the saved
irrigation water to municipalities if a Compact curtailment occurs (CRWCD, 2012). The
Compact Water Bank would move water to cities in Front Range river basins to maintain
residential and industrial water use.

2
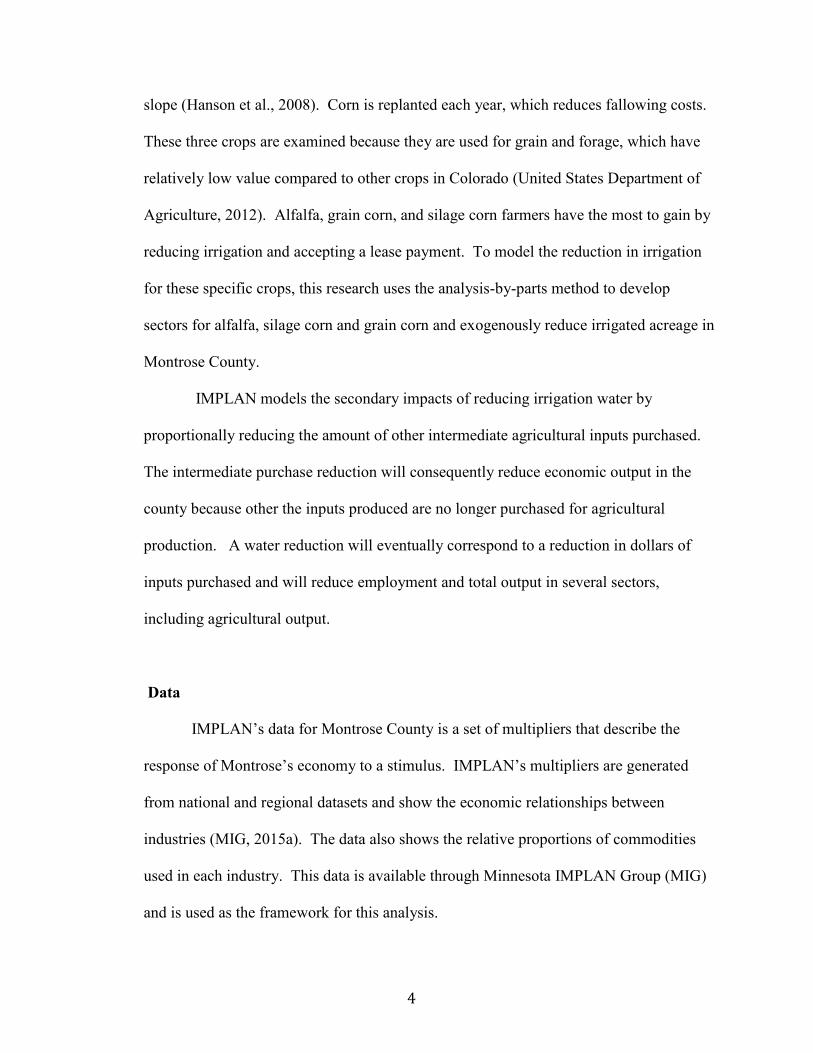
Figure 1.1: Map of the western slope of Colorado with pre-Compact water rights marked
in light green. Montrose County is appropriate to study because of its pre-1922
appropriated and adjudicated water rights. Montrose County is outlined in bold
Adapted from: http://swwcd.org/wp-content/uploads/2014/01/Dan-Birch-Water-Bank-
The-Next-Step.pdf

3
Inter-basin water transfers can generate negative indirect economic impacts to
rural communities (Howe & Goemans, 2003; McMahon & Smith 2012; Thorvaldson &
Pritchett, 2006). I examine Montrose County, an area with pre-Compact water rights that
produces low value forage crops, see Figure 1.1. I compare the indirect losses from a
rotational fallowing agreement to the indirect benefits of lease payments in Montrose
County’s economy so individuals involved in the Compact Water Bank’s development
have better information on the Bank’s effects on those not compensated by lease
payments.
Method
I use input-output analysis to estimate the secondary impacts of water transfers.
IMPLAN (IMpacts for PLANning), an input-output analysis software, can model a
rotational fallowing program through reducing irrigation water available to the economy
and model lease payments as an increase in household spending in Montrose County.
IMPLAN shows the direct effects to the individuals who transfer water, the indirect
effects from “changes in inter-industry purchases as they respond to new demands” in
water transferring industries, and induced effects from “changes in spending from
households as income increases or decreases due to the changes in production” (Schmit et
al., 2011). This study focuses on the indirect and induced effects from fallowing and
lease payments.
I model an irrigation water reduction in three candidate crops examined by the
Colorado River District: alfalfa, silage corn and grain corn. Alfalfa is drought tolerant,
able to grow in deficit irrigation circumstances, and has a large presence on the western
4
slope (Hanson et al., 2008). Corn is replanted each year, which reduces fallowing costs.
These three crops are examined because they are used for grain and forage, which have
relatively low value compared to other crops in Colorado (United States Department of
Agriculture, 2012). Alfalfa, grain corn, and silage corn farmers have the most to gain by
reducing irrigation and accepting a lease payment. To model the reduction in irrigation
for these specific crops, this research uses the analysis-by-parts method to develop
sectors for alfalfa, silage corn and grain corn and exogenously reduce irrigated acreage in
Montrose County.
IMPLAN models the secondary impacts of reducing irrigation water by
proportionally reducing the amount of other intermediate agricultural inputs purchased.
The intermediate purchase reduction will consequently reduce economic output in the
county because other the inputs produced are no longer purchased for agricultural
production. A water reduction will eventually correspond to a reduction in dollars of
inputs purchased and will reduce employment and total output in several sectors,
including agricultural output.
Data
IMPLAN’s data for Montrose County is a set of multipliers that describe the
response of Montrose’s economy to a stimulus. IMPLAN’s multipliers are generated
from national and regional datasets and show the economic relationships between
industries (MIG, 2015a). The data also shows the relative proportions of commodities
used in each industry. This data is available through Minnesota IMPLAN Group (MIG)
and is used as the framework for this analysis.

5
This research creates unique sectors for forage crops through farm enterprise
budgets and agricultural statistics. Farm enterprise budgets show the intermediate inputs
farmers buy, and how much they spend on each input. Specific farm enterprise budgets
for western slope irrigated alfalfa, grain corn, and silage corn are available through
Colorado State University (Colorado State University Agricultural Extension, 2014).
This study uses agricultural statistics coupled with estimates from the Colorado State’s
Agricultural Extension to estimate the total value of each crop’s production, proprietor
income, employment, and employee compensation. Impact analysis of these custom
sectors shows the indirect effects of reduced irrigation water in Montrose County,
Colorado.
Expected Results
I estimate the dollar value of indirect and induced impacts in Montrose County
from instituting a rotational fallowing program and inserting a lease payment. The
analysis estimates the effects of a reduction in irrigation water to producers of
intermediate inputs for forage agriculture and the effects of lease payments. I model the
lease payment as an increase in consumer spending and capital expenditures on
agriculture. I compare the magnitude of the leasing agreement’s positive impacts to the
negative impacts from reducing irrigation water. This research identifies which sectors
will benefit from the lease payments, and which will not. Following McMahon and
Smith (2012), this study shows that a lease payment can indirectly compensate an
agricultural community for fallowing irrigated acreage in certain situations (McMahon &
Smith, 2012). This project’s results could be useful for local stakeholders seeking

6
information on how an irrigation water transfer and lease payment could indirectly
impact Montrose County’s economy and for regional planners seeking to estimate the
indirect value of water used for forage irrigation in Montrose County or similar areas in
the Upper Basin.
This thesis frames the problem of indirect effects resulting from water transfers
through a potential transfer, the Compact Water Bank, and uses input-output analysis to
show if a proposed solution is enough to mitigate the indirect effects. I use previous
research to state a case for measuring indirect effects in water transfers and show lease
payments can compensate for indirect impacts.
7
Chapter 2:
Literature Review
Although most of Colorado’s water is used for irrigation, municipalities are
willing to pay much more for water than farmers or ranchers can generate on a per-unit
basis (Ivanenko & Flynn, 2010; Brewer et al. 2007). Economists have proposed market
solutions to this resource misallocation, but there are serious political barriers to enact
reforms due to indirect economic effects (Considerations for Agricultural to Urban Water
Transfers, 2008).
This literature review uses Colorado’s relevant water law to show limitations in
Colorado’s water market. Then, this review uses water market theory to argue that cities
should compensate for indirect economic effects from inter-basin water transfers.
Finally, the analysis assesses previous studies that use input-output analysis to estimate
the indirect negative effects of water transfers and the indirect positive effects from lease
payments. My goal is to show that negative indirect impacts from water transfers are
significant and that lease payments can generate sufficient indirect positive effects to
compensate for the indirect negative effects.
Water Law Overview
Colorado water law is based on prior appropriation, which originated in mining
communities and evolved to govern all of Colorado’s water (Hobbs, 2004). Prior
8
appropriation manages water through state water ownership, and allows water courts to
distribute ‘rights’ for individuals to put water to ‘beneficial use’1 without owning it
(Hobbs, 2004). The oldest water rights on a particular river are fulfilled first, and
subsequent water rights are fulfilled in order of their appropriation date. Most of
Colorado’s rivers are over appropriated; water courts decreed more water rights than
there is water in the river (Hobbs, 2004; Thorvaldson & Pritchett, 2006). Junior rights
may not be fulfilled if a river does not produce much water in a given year, so senior
rights provide more reliable water. Since most rivers are over-appropriated, new water
development will not solve supply shortages. Cities looking for reliable water purchase
existing water rights.
Colorado water law allows for regulated water right transfers among water users
since an early Colorado Supreme Court case, Strickler v. City of Colorado Springs
(1891). Water rights can be legally transferred after three processes are completed. The
water court must approve the transfer (Hobbs, 2004). Water court measures the historic
consumptive use, water that is consumed and does not return to a stream, to ensure that
the right amount is transferred (Hobbs, 2004). Finally, water courts ensure that
downstream water rights are able to continue diverting their appropriated water (Hobbs,
2004). Water transfers are a lengthy and expensive process and can take several years in
court. Colorado’s water law relates to the Compact Water Bank because the law
regulates and prevents Colorado’s water markets from fully developing.
1 Beneficial use is a legal term to define acceptable purposes for a water right. Examples of beneficial use include irrigation, municipal, and instream flow (Hobbs, 2004).
9
Secondary Impacts of Water Markets Literature
This section begins with a theoretical explanation of indirect effects from water
transfers and then divides the literature on indirect effects of water trading in Colorado
into researchers who agree or disagree with the notion that municipalities should
compensate for indirect effects. My goal is to show that if water transfers generate
significant indirect regional impacts, then the basin-of-origin should be compensated for
the indirect losses.
A general equilibrium model shows why indirect effects exist in water transfers:
job search costs (Bourgeon et al., 2008). The model presents two scenarios after a water
transfer: large and small job search costs for former agricultural workers. The first
scenario predicts that high job search costs decrease regional welfare because agricultural
laborers cannot find work in the non-agricultural sector. Those who believe
municipalities should compensate for negative indirect effects show that after inter-basin
water transfers, laborers and capital are not repurposed productively in the non-
agricultural sector. These researchers use input-output analysis to empirically estimate
indirect effects of water transfers (Howe et al. 1990; Howe & Goemans, 2003;
Thorvaldson & Pritchett, 2006). The second scenario shows that small job search costs
produce an increase in per capita regional welfare after a water transfer. These
researchers believe that the free market will increase total welfare, so municipalities do
not need to compensate for indirect effects because agricultural laborers will easily find
more productive jobs (Young, 1986; Haddad 2000).
Strict neoclassical economic theory states that factors of production are mobile, so
agricultural capital and labor should reallocate to more productive uses easily after a

10
water transfer (Howe, 1998). By this logic, indirect costs are irrelevant because the
indirectly displaced workers have new opportunities for work in more productive sectors.
Neoclassical costs and benefits should go “to whomsoever they may accrue,” in water
transactions because the seller’s losses are offset by larger benefits for the purchasers
(Young, 1986). In the long run, resources will flow towards more productive water uses,
which is a better outcome for society (Young, 1986). The calculation these economists
propose for judging water transfers is that the total direct and indirect benefits should
exceed the total direct and indirect costs, conveyance costs, and transaction costs (Young,
2003). This calculation does not include the timing or location of benefits from the water
transfer. This is efficient when the selling community moves their factors of production
towards buyers to enjoy the direct and indirect benefits from a water transfer.
Neoclassical economists assume indirect impacts are irrelevant because factors of
production move to the highest payers: the water purchasers.
Opposing agricultural economists disagree with classical analysis because the
nature of water transfers and agricultural capital prevents the selling communities from
indirectly enjoying the benefits of water transfers. The benefits from water sales accrue
to far away locations in the future because cities purchase water from several watersheds
and well in advance of need (Howe, 1998). The communities around water-selling
individuals should, by economic logic, move towards the water purchasing location,
because the water purchasing location would be willing to pay more for capital. One
study shows that farmers, as factors of production, choose to stay in the selling location,
which prevents capital from moving to higher value uses (Weber, 1989). This critiques
the neoclassical assumption that factors of production are mobile because “job search and

11
moving costs are real,” and are not accounted in neoclassical economics (Howe, 1998;
Livingston 1995). The costs of inter-basin water transfers accrue to the basin of origin
immediately, which generates unemployment and idle stranded capital, that constitutes “a
real economic loss for the basin of origin” (Howe, 1998).
These economists suggest judging welfare on regional perspective because of
factor immobility (MacDonnell & Rice, 2008; MacDonnell & Howe, 1986). They
believe that regulating transfers can help ensure positive outcomes. Examples of
regulated transfers include lease payments to impacted communities or community funds
that “compensate unprotected parties and for whatever purpose the citizenry prefers”
(MacDonnell & Howe, 1986). These solutions have successfully mitigated indirect
effects when they are applied correctly (McMahon & Smith, 2012).
Strict neoclassical water economists advocate for a water market because market
mechanisms increase efficiency. Markets provide information on scarcity value through
prices and are efficient because individuals with the highest water value to purchase
water (Haddad, 2000). Some economists use Water Strategist, a newsletter containing an
incomplete water transaction dataset, to show how the limited market is developing and
to see if market mechanisms efficiently reallocate water (Brewer et al., 2006; Brown,
2006). Although the available market data is limited, between 1987-2005 western states
recorded a combined total of over 3,200 transactions, market based mechanisms are
effective in reallocating water from low value agriculture to high value urban areas.
Urban areas are willing to pay premium prices for water (Brewer et al., 2006). These
economists argue that market mechanisms generate economically efficient outcomes and
12
should be expanded because these transactions are between willing buyers and willing
sellers (Brewer et al., 2006; Haddad, 2000).
Opposing economists agree reallocating water to higher value uses benefits
society, but contend that large inter-basin water transfers can have large indirect effects to
the basin of origin, which is a market failure (MacDonnell & Rice, 2008; Livingston
1995). These scholars argue large indirect effects do not always occur from water
transfers, but basins-of-origin should be compensated when they experience large indirect
effects (Howe & Goemans, 2003). These compensation programs are examples of
Kaldor-Hicks efficiency because the beneficiaries compensate the water sellers (Haddad,
2000). To estimate the indirect effects from water transfers and thus find the necessary
payment to fully compensate for indirect effects, studies use input-output analysis to
model an economy and “reduce” agricultural output. Specific studies are addressed in the
next section.
Strict neoclassical economists criticize input-output analysis because it overstates
indirect effects. Input-output analysis assumes that consumers and firms can only
consume and produce goods in fixed ratios, and thus cannot substitute relatively less
scarce goods or inputs, which would be capital in the Compact Water Bank, for more
scarce goods, water in the Compact Water Bank (Young 2003). Input-output analysis
assumes that changes in production and consumption decisions only occur because of the
income effect, which inherently overestimates the indirect effects from a reduction in
irrigated acreage (Young, 2003). Other researchers have shown that IMPLAN’s data
does not accurately reflect local conditions because data is based on national averages
(McKean et al. 1998). These scholars present six recommendations to more accurately
13
model an economy: using survey production data, properly allocating proprietor and
property income, correcting agricultural output, fixing regional purchasing coefficients,
adjusting employment impacts based on full-time equivalents, and revising error caused
by price fluctuation (McKean et al. 1998). These researchers argue that input-output
analysis is not a valid estimator of indirect effects because it overstates the effects.
Although this study cannot fix the inherent overstatement of indirect impacts from
using input-output analysis, it corrects for several parts of the input-output program’s
data. This study’s results only apply to the short-run, it shows the indirect effects of
instantaneously making water scarcer in an economy, and assumes that choices that
substitute capital for water, such as improving irrigation systems, take time to enact. This
project applies some of the recommendations: I use farm enterprise budgets for survey
production data, I adjust agricultural output to reflect conditions in Montrose County, and
I use prices from several years to correct for price fluctuation errors. Although input-
output analysis shows water’s maximum possible indirect value, I improve the data to
reduce unnecessary bias. Three recommendations that I could not use due to data
limitations are correcting regional purchasing coefficients, reallocating proprietor and
property income, and basing employment impacts on full-time equivalents. Although
input-output analysis is an overstatement, I contend that the maximum possible value of
water is a useful point of reference. At the maximum possible value of water, it is likely
the community will be at least as well off and likely better off after a water transfer,
which would mitigate indirect impacts in a community.

14
Empirical Analysis of Water Transfers
Previous scholars have used input-output analysis to estimate the indirect value of
water. Since input-output analysis inherently overestimates the value of water, input-
output analysis is suited to show that there are high indirect impacts from water transfers.
I use these studies as a guide on how to perform input-output analysis to show the
indirect impacts of reduced irrigated acreage. These studies also provide context for my
research, and show if the indirect effects are relatively higher in Montrose County than in
other regions. This review investigates previous input-output studies that show the
indirect value of water in Colorado and studies on rotational fallowing programs.
Indirect effects are frequently studied in the Arkansas River basin because the
basin has a history of water transfers that have generated salient indirect effects. Input-
output analysis was first used to estimate indirect effects to the state of Colorado from the
water transfers in Arkansas River Basin on a per acre-foot basis to appraise the indirect
value of water (Howe et al. 1990). Later scholars improved the input-output method by
focusing on regional effects and using enterprise budgets for production functions
(Taylor et al. 1993). Modern studies have compared the indirect impacts within the
Arkansas Valley to other regions and found that indirect effects are larger in the Arkansas
Valley because the transfers are generally out-of-basin and move large blocks of waters
(Howe & Goemans 2003; Thorvaldson & Pritchett, 2006). To show indirect effects on
different population sizes, these studies estimate negative indirect output impacts on a
per-capita basis (Howe & Goemans 2003; Thorvaldson & Pritchett, 2006). The Arkansas
Valley is a “specialized, marginal agricultural community,” so severe negative indirect

15
effects persist because factors of agricultural production have trouble reallocating to more
productive uses after a water transfer (Howe & Goemans, 2003).
The second most frequently studied region is the South Platte because water
transfers have not negatively impacted the economy. Water transfers in the South Platte
are unique because the water-sellers are relatively close to the water purchasers, which
could make it easier for water sellers to enjoy the benefits of water transfers. Some
scholars argue that water transfers in the South Platte have benefited the region because
the water-sellers have better “mobility of resources and employment opportunities”
(Howe & Goemans, 2003). Another study finds that the South Platte have higher indirect
effects from a dollar reduction in irrigated agriculture, but have the lowest negative
impact per capita because its river basin is more populated than other basins
(Thorvaldson & Pritchett, 2006). The South Platte shows the positive potential of
reallocating water to higher value uses.
Researchers use input-output analysis to examine the effects of rotational
fallowing programs, a proposed transfer mechanism for the Compact Water Bank. This
research models the negative indirect effects from water transfers and then modeling the
positive indirect effects of lease payments. Although the Palo Verde Valley is in
California, it is a good case study on the indirect effects of a rotational fallowing. The
study found that the proposed lease payment would not be enough to fully compensate
for negative indirect impacts of a reduction in irrigated acreage, but an appropriate
payment could negate the indirect impacts (M. Cubed, 2002). Another example, a
rotational fallowing program in the Arkansas Valley, shows that the indirect effects are
fully compensated through a lease payment, and has facilitated dryland farming. Dryland

16
farming further increased the benefits to the region (McMahon & Smith, 2012).
Importantly, both studies show farmers spend lease payments on consumer goods, not the
negatively indirectly impacted industries (McMahon & Smith, 2012; M. Cubed, 2002).
Although a community could be fully compensated for indirect effects, it does not mean a
lease payment will allow an economy to remain the same. These studies are closest
models for my current project in Montrose County because they show the indirect
negative and positive effects of a rotational fallowing program.
Programs to Mitigate Indirect Effects
Two methods have been used to mitigate indirect effects from water transfers:
directly paying farmers and setting up a community fund. The first is directly
compensating farmers for indirectly lost output, hoping that farmers will spend extra
money and stimulate the economy. Although IMPLAN assumes farmers act like other
consumers and will spend money on consumer goods, this is not necessarily the case.
Farming is a capital-intensive industry; previous farmers who sold irrigation water in the
Arkansas Valley used the revenue to reduce their farm debt, which “creates no new jobs
in absence of local investment opportunities” (Weber 1989; Howe & Goemans 2003).
Conversely, the revenue could potentially be used to improve the farm equipment, which
would stimulate the indirectly impacted industries. At least two rotational fallowing
programs directly compensate farmers, the Palo Verde Land Management Crop Rotation
and Water Supply Program in Southeastern California and the Arkansas Valley Super
Ditch in Southeastern Colorado. The Compact Water Bank will directly compensate

17
farmers, so although the model shows indirect positive effects to consumer spending
from a lease payment, this may not necessarily be the case (CRWCD, 2012).
The other program to mitigate indirect impacts stems from MacDonnell and
Howe’s (1986) suggestion to create a community fund that would work to mitigate
indirect impacts. The Metropolitan Water District in Los Angeles developed Palo
Verde’s Community Improvement Fund (CIF) to “[provide] funding that will create
economic opportunities” (CIF-Blythe, 2015). The CIF is used for community
development grants, such as hospital projects or funding the Colorado River Fair, and
loans for business owners (CIF-Blithe, 2015). The CIF’s exclusive goal is to create or
maintain employment (CIF-Blythe; Personal Communication with Charles Hull,
February 7th, 2015). The program can only benefit institutions that apply, which limits
the potential recipients (Personal Communication with Charles Hull, February 7th, 2015).
Although the fund is not perfect, it has stimulated economic activity in the Palo Verde
Valley.
Input-output analysis is an imperfect estimator of indirect positive impacts from
lease payments it because cannot exactly model the methods that compensate the basin-
of-origin. Input-output analysis is still a useful tool to estimate the impacts of lease
payments because it shows how changes in income indirectly effect an economy.
Contributions of This Study
This study builds on previous research to expand the current literature to a new
location, shows the impacts of fallowing in various price and output scenarios and uses
18
new methods to examine the effects of a lease payment. This analysis expands the
literature’s geographic scope to a new area: Colorado’s western slope.
Second, this research includes several scenarios to show the impacts of fallowing
in several different climatic conditions. This could be useful because the price and output
of crops produced in Montrose County is not constant. The different climatic scenarios
show the range of possible indirect impacts to Montrose County. Third, this inquiry
models deliberately fallowing specific crops to minimize the forgone proprietor income.
Although it is impossible to know exactly which crops will produce the highest proprietor
income in a given year, this could be a useful tool for estimating the effects of targeting
the lowest value crops.
Fourth, this examination models lease payments to include farm capital
investments. This would useful because it shows the impacts of different lease payment
consumption patterns. If certain consumption patterns generate more output or benefit
the sectors negatively impacted from fallowing, then incentives could be used to
encourage farmers to spend their lease payments in these consumption patterns.

19
Chapter 3:
Background
The Colorado River Compact Water Bank would work within interstate law to
allow high-value users to continue using Colorado River water during an extreme
drought. The Colorado River Compact requires Colorado’s Upper Basin to deliver 75
million acre-feet of water to the Lower Basin every 10 years (USBR, 1922). If a drought
prevents the Upper Basin from delivering enough water, then the law states that the
Upper Basin must entirely cease consumptively using the Colorado River (USBR, 1948).
This curtailment would include Colorado River water used for the Front Range’s
municipal water supply (USBR, 1948; Steger, 2012). The Compact Water Bank would
transfer exempt pre-Compact agricultural water through existing transmountain
diversions to maintain high-value uses, such as municipal water supply. This paper
examines the indirect effects of the Compact Water Bank on Montrose County, an early-
settled forage irrigation community. I focus on Montrose County because it is a likely
source of the Compact Water Bank’s pre-Compact water. To resolve problems stemming
from the Colorado River’s inflexible interstate compacts, the Compact Water Bank would
transfer water from lower value uses, such as Montrose County’s forage irrigation, to
higher value uses during an exceptional drought.
Colorado River Interstate Compacts
The Compact Water Bank would ensure that Colorado could continue to provide
water to residential, commercial and industrial uses during an extreme drought that

20
violates the Colorado River Compact. This section explains the history and terms of
Colorado River’s interstate compacts to show how these inflexible agreements would
negatively impact Colorado’s water supply in an extreme drought.
The rapidly developing West during the early 20th century forced the Colorado
River Compact’s development. Since the United States Supreme Court Case Wyoming v.
Colorado (1922), prior appropriation applies across state boundaries, meaning that water
rights on interstate waterways are fulfilled in order of their adjudication. Following the
Supreme Court’s decision, fast-growing California threatened to quickly establish and
adjudicate water rights on a large portion of the Colorado River. These water rights
would be senior to water rights adjudicated in slower developing states, and could
potentially prevent other states from developing Colorado River water (Gelt, 1997).
California’s fast water development would have spurred further growth in California, but
could have seriously hindered the rest of the Colorado River Basin’s growth. In
response, Delph Carpenter, Colorado’s State Engineer, organized representatives from all
of the Colorado Basin states to create an interstate compact that would guarantee each
state a portion of the Colorado River (Gelt, 1997).
21
Figure 3.1: A map of the Colorado River basin in the United States. Lee’s Ferry, circled,
splits the Lower Basin and the Upper Basin.
Adapted from: http://www.usbr.gov/lc/images/maps/CRBSmap.jpg
22
The negotiations resulted in the Colorado River Compact, but it did not fully
divide the Colorado River between western states. The Compact’s developers divided
the Colorado River at Lee’s Ferry, see Figure 3.1 (USBR, 1922). Then, the Compact’s
developers appropriated about half the river, 7.5 million acre-feet per year, to the Upper
Basin, the states upstream from Lee’s Ferry, and to the Lower Basin, the downstream
states (USBR, 1922). Arizona’s representative aptly complained that the Compact
“doesn’t arrive at any conclusion, … it leaves two divisions to work out their own
salvation” because the Compact does not guarantee each state a portion of the Colorado
River (Gelt, 1997). The Compact’s developers assumed a total river flow of 16.4 million
acre-feet per year, which was an overestimate (Gelt, 1997). The Colorado River’s actual
long-term average is about 13.5 million acre-feet per year (Gelt, 1997). Long-term tree
ring data shows that the Colorado River Basin has long term droughts that drop river
flows below the long term average for extended periods, so natural variation in low flow
periods could challenge flow requirements (Woodhouse et al., 2006). Climate change is
projected to further reduce the Colorado River’s water supply (USBR, 2012). Although
the Upper Basin has a limited ability to create water, it is obligated to deliver 75 million
acre-feet to Lee’s Ferry every 10 years (USBR, 1922). The Colorado River Compact is
inflexible to new situations, but it is the law of the river and unlikely to change.
The Upper Basin Compact of 1948 develops how the Upper Basin States will
respond if they are unable to meet their Colorado River Compact obligations. If the
Upper Basin is unable to produce 75 million acre-feet at Lee’s Ferry, the Basin agreed to
completely stop consumptively using Colorado River water to meet the Colorado River
Compact’s obligations (USBR, 1948). No one in the Upper Basin with post-Compact

23
Colorado River water rights would be able to use water (USBR, 1948). This would be a
Compact curtailment. The only exemptions are Colorado River water rights “perfected
prior to November 24, 1922”, as they are excluded from the requirement to curtail water
use. Since a Compact curtailment has never occurred, there is disagreement over which
rights would be excluded from a Compact curtailment (USBR, 1948). The Water Bank
Group suggests water rights before two dates would not be subject to a Compact
curtailment: water rights appropriated or adjudicated before November 24th, 1922, the
date of the Colorado River Compact, or water rights appropriated or adjudicated before
June 25th 1929, the date of the Boulder Canyon Project Act (CWRCD, 2012). Following
the Colorado Compact Water Bank’s study, this research will assume that water rights
appropriated or adjudicated before June 25th, 1929 would be exempt from a Compact
curtailment (CWRCD, 2012).
To maintain stable water flows, the Bureau of Reclamation built Glen Canyon
Dam above Lee’s Ferry in 1963 (USBR, 2016). The reservoir, Lake Powell, regulates the
river by saving water during high-flow years. Lake Powell then uses the saved water to
discharge at least enough to meet Compact and international requirements, 8.23 million
acre-feet per year (7.5 million acre-feet for the Lower Basin and .73 million acre-feet for
Mexico) (USBR, 2016). If drought continues to lower Lake Powell’s water levels,
eventually Glen Canyon Dam will not be able to release enough water to meet Compact
obligations. Although a Compact curtailment is unlikely in the immediate future, climate
change and long-term variability could at some point reduce Lake Powell’s water level to
a point that threatens the Colorado River Compact.

24
Compact Water Bank Transfer Mechanism
The Compact Water Bank plans to work as an insurance policy against Compact
curtailment. Users with post-Compact Colorado River water rights such as Front Range
cities would “subscribe” to the Compact Water Bank to “avoid or minimize curtailments
of diversions from post-Compact Water Rights” (CRWCD, 2012). The Compact Water
Bank’s developers modeled potential operations in several different ways, but this
background focuses on the objective of using pre-Compact agricultural water to supply a
portion of post-Compact water use. This section describes the Compact Water Bank’s
potential supply and demand, and explains how the bank intends to operate.
Table 3.1: Supply limited consumptive use by water rights category
Retrieved from: http://www.coloradoriverdistrict.org/wp-content/uploads/2015/10/Water-
Bank-Phase-1-Report_Final-DRAFT_June-2012.pdf
25
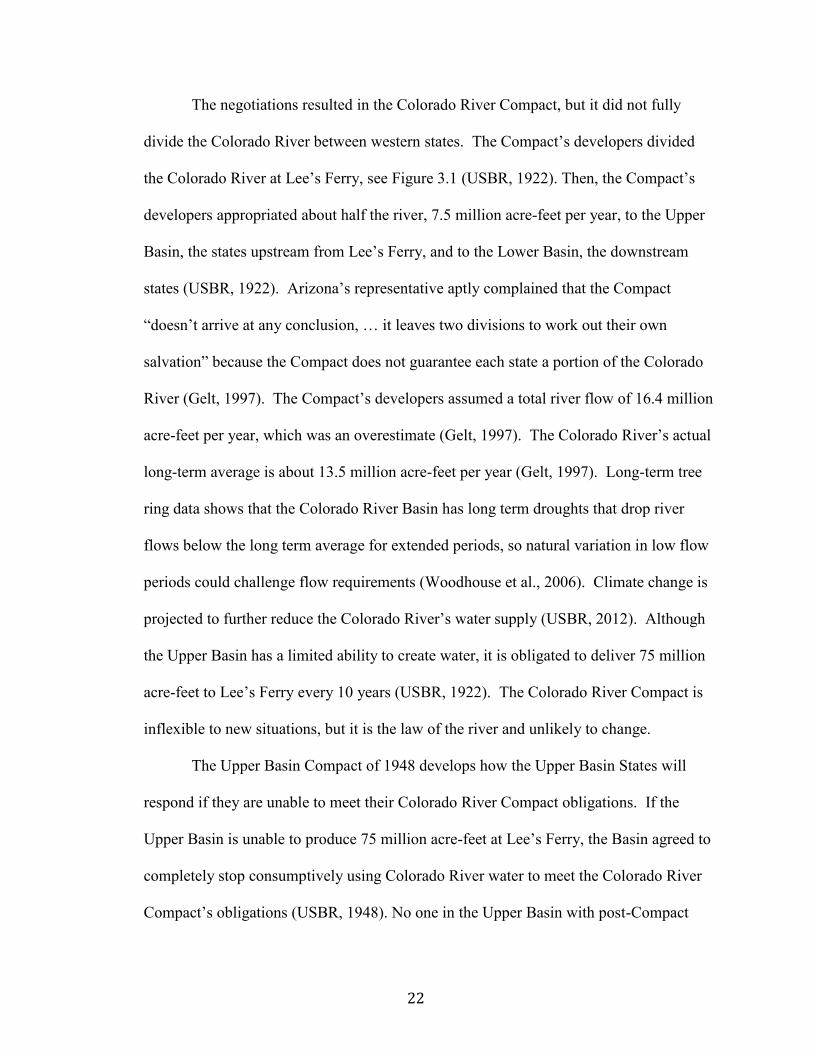
Table 3.2: Potential categories of Water Bank use. This shows that Front Range
municipalities are dependent on Colorado River water.
Retrieved from http://www.coloradoriverdistrict.org/wp-content/uploads/2015/10/Water-
Bank-Phase-1-Report_Final-DRAFT_June-2012.pdf
If a Compact curtailment occurs, the Colorado River Compact Water Bank will
supply post-Compact water users with pre-Compact agricultural water rights from the
western slope. The Compact Water Bank would pay willing irrigators who grow low-
value, fallowable forage crops to stop irrigating their land. Then, the bank would transfer
the saved water to various subscribers. Several crops on Colorado’s western slope can
sustain fallowing: hay, grass pasture, corn, dry beans, and small grains. A comparison
between Tables 3.1 and 3.2 shows that alfalfa and irrigated corn, the crops examined in
this study, use just under 144,000 acre feet per year, which is less than the total post
compact municipal and industrial depletions, 350,000. The Compact Water Bank only
intends to supply a maximum of 90,000 acre-feet to various post-Compact water users if
a Compact curtailment occurs, which could be provided by fallowing irrigated corn and
alfalfa (CWRCD, 2014). The Water Bank Group’s analysis of potential Compact

26
shortages suggests that most shortages would be over 500,000 acre-feet, so this analysis
exclusively models the maximum Compact Water Bank supply scenario (CRWCD,
2012).
Some irrigators are hesitant to participate in the Water Bank because they believe
transferring water would change their agricultural way of life. The Compact Water Bank
attempts to mitigate these concerns. To ensure that the way of life is relatively
unchanged, the Water Bank Group intends to only activate the water bank in a rare
Compact curtailment event. The bank would use alternative transfer mechanisms so
irrigators maintain water right ownership (CRWCD, 2014).
The Colorado Compact Water Bank would be an essential safeguard to
Colorado’s municipal water supply. Table 3.2 shows a list of potential subscribers to the
Compact Water Bank. Front Range municipalities demand the most water because they
are large and dependent on western slope water. Some municipal estimates show that
Denver and Colorado Springs supply 50% and 70% of their municipal water supplies
from the Colorado River Basin, so a sudden Colorado River curtailment would
dramatically reduce the cities’ water supply (Vanderschure, n.d; Steger, 2012). Water
planners suggest the Front Range’s 300,000 acre-foot deficit from a Compact curtailment
in Table 3.2 would supply about 600,000 households’ annual water use (Waskom, 2011).
Municipalities are willing to pay premium prices for water, so these users would most
likely be the top-bidding subscribers to the Water Bank (Brewer et al., 2006). Front
Range municipalities are likely subscribers to the Compact Water Bank because they
would need to replenish their water supply, and are willing to pay the most.
27
Municipal water planners’ concerns about subscribing to the program are risk
based. Municipal water supplies generally look for permanent supplies to ensure a
reliable yield (CRWCB, 2014). Although the Compact Water Bank would not provide
continuous water supply, it would provide water during a sudden supply shock.
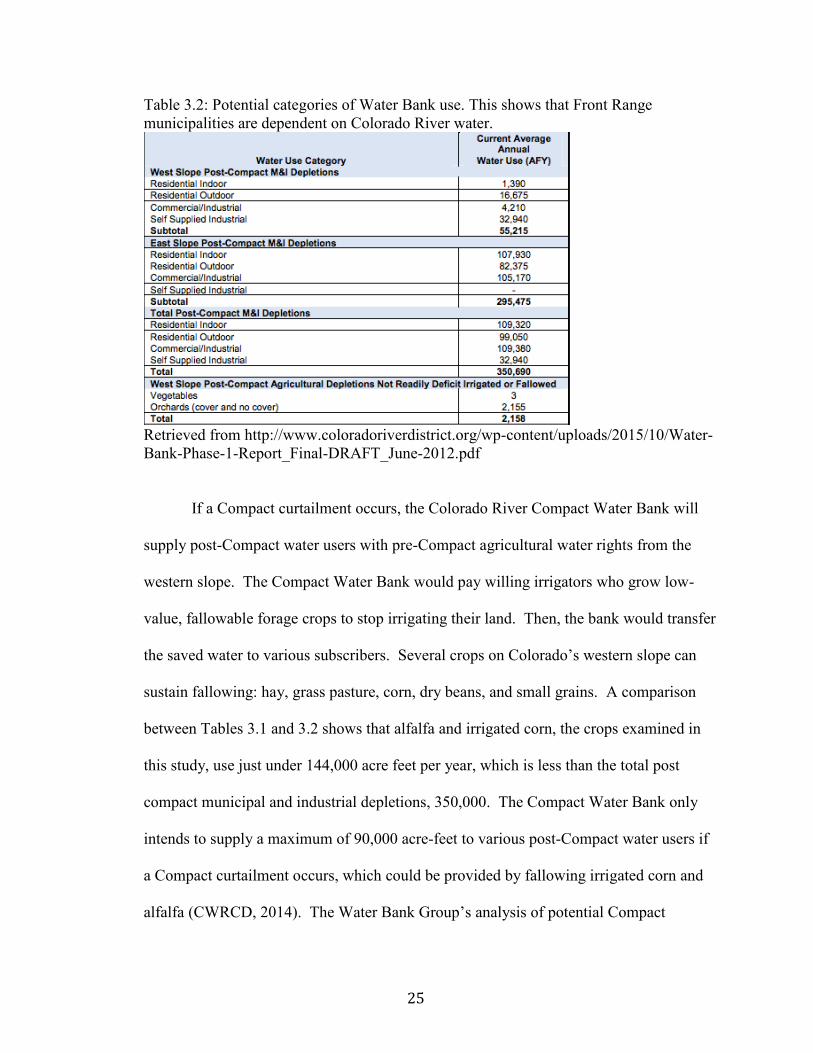
Figure 3.2: Map of transmountain diversions in Colorado. Many of these diversions move
water from west to east.
Retrieved from:
http://water.state.co.us/SurfaceWater/SWRights/PublishingImages/TRANSMTN700.jpg
The Compact Water Bank intends to physically move water to its subscribers
through existing transmountain diversions. Transmountain diversions use tunnels to

28
move water across river basin boundaries. These diversions are generally used to move
water from the wetter western slope to the urban Front Range, as Figure 3.2 shows.
Some transmountain diversions are pre-Compact, such as the Grand River Ditch, and
would not be affected by a Compact curtailment but several major transmountain
diversions use post-Compact water rights, particularly the Adams Tunnel, the Roberts
Tunnel, and the Boustead Tunnel, which collectively transfer over 300,000 acre-feet per
year (Colorado Foundation for Water Education, 2014).
Montrose County
J.W Gunnison first described southwestern Colorado in the 19th Century as “a
desert unfit for cultivation and inhabitation only by savages” (Dudley, 2004). Since then,
southwestern Colorado’s Montrose County has become an agricultural region. Montrose
raises cattle and grows forage feed. The Water Bank Group tested feasibility case studies
in Montrose County and found that farmers use pre-Compact water rights to irrigate low
value crops, which makes the area an ideal water source for the Compact Water Bank.

29
Figure 3.3: Map of the Uncompahgre Valley irrigation project in Montrose County.
Retrieved from:
http://www.waterhistory.org/histories/reclamation/uncompahgre/uncompahgre.pdf
Montrose County is an early-settled farming community with pre-Compact water
rights. Farmers first settled in Montrose County’s Uncompahgre Valley in the late 1800s,
intending to sell food to nearby miners (Dudley 2004). The local Uncompahgre River
naturally has relatively low water flow; water was scarce as the region grew (Dudley
2004). In 1909, the United States Bureau of Reclamation built the Uncompahgre Project,
which uses a large tunnel and canal to supplement the Uncompahgre River with water
from the Gunnison River (Dudley, 2004). This project allows the Valley to irrigate
around 37,000 acres of land with pre-Compact water, shown in Figure 3.3 (Dudley,
2004). Another pre-Compact water right in Montrose County is the Colorado
30
Cooperative Ditch, near Nucla, Colorado that irrigates over 5,000 acres of land
(CRWCD, 2012). Montrose County has substantial pre-Compact water rights; these
ditches use a significant amount of water on each irrigated acre.
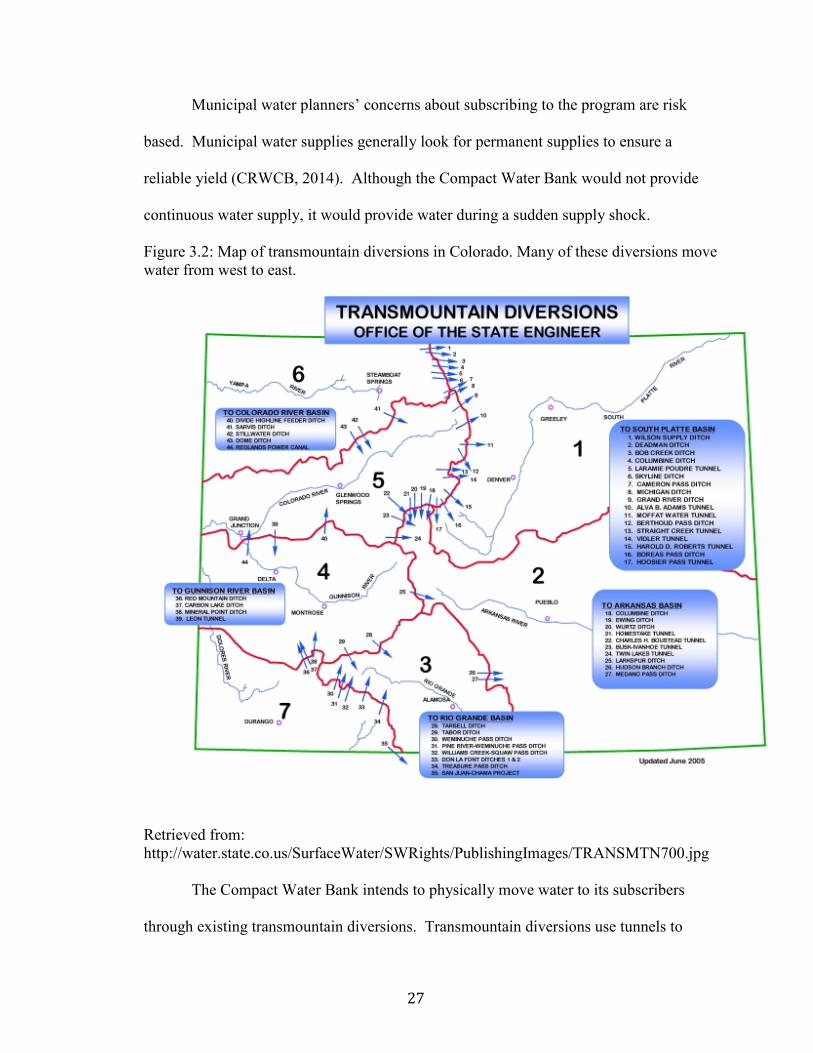
Table 3.3: Fallowing costs incurred by irrigators operating in the Grand and
Uncompahgre Valley for average Minimum and maximum five year commodity prices2.
Retrieved from: http://www.coloradoriverdistrict.org/wp-content/uploads/2015/10/Water-
Bank-Phase-1-Report_Final-DRAFT_June-2012.pdf
Montrose County farms low-value fallowable crops. Montrose County produces
forage crops such as alfalfa, grain corn and silage corn for cattle or sheep feed as shown
in Table 3.1. There are some higher-value crops in Montrose, such as Christmas trees
and berries and nuts, but these crops are less widespread, and are less economically
viable for fallowing programs than forage crops (United States Department of
2 Harvest savings are the costs of agricultural production. Farmers would not need to pay for costs of production if they fallow, so costs of production are saved. Fallowing costs are forgone revenue that irrigators face from fallowing. Fallowing costs depend on the price and quantity of agricultural production.

31
Agriculture, 2012). Forage crops use a significant amount of water. An acre of alfalfa at
the town of Montrose’s elevation requires 30.7 inches of evapotranspiration throughout
the growing season, which adds up over Montrose County’s 18,000 acres of irrigated
alfalfa (CRWCD, 2013; United States Department of Agriculture, 2012). Many irrigators
in the Uncompahgre Project and the Colorado Cooperative ditch sell hay to local ranches,
so the price of the crop is an appropriate measure of the crop’s value, unlike ranches that
grow forage to feed their herd (CRWCD, 2013). A “comparative, order of magnitude”
report on the forgone value from fallowing land in the Uncompahgre Valley and the
nearby Grand Valley shows losses from fallowing alfalfa range from $0 to $195 per acre
and from fallowing corn range from $77 per acre to $743 as shown in Table 3.2
(CRWCD, 2013). Montrose County is predicted to contribute about a third of the
Compact Water Bank’s pre-Compact water supply partially because the county uses its
significant pre-Compact water to irrigate low value crops (Personal Communication with
Chris Treese, November 16th, 2015)
Montrose’s economy is based on agriculture, so examining indirect effects from a
water transfer is appropriate. Colorado’s department of local affairs shows that
agriculture accounts for about 13% of jobs in Montrose County (Colorado Department of
Local Affairs, 2015). The Montrose Chamber of Commerce shows several local indirect
agricultural industries, such as Rocky Mountain Bio-Ag, which produces local organic
herbicides and fertilizer, and Mountain Quality Marketing, a group of agricultural
consultants. These companies would likely be negatively impacted by a decrease in
agricultural activity (Montrose Chamber of Commerce, 2015). Although this is not an
exhaustive list of indirect agricultural industries in Montrose County, it shows that

32
indirect industries are present. Agriculture is one of few industries in the region reporting
a growing labor force (Garner, 2014). Montrose County has indirect agricultural
industries so a water transfer could threaten future economic development.
The Compact Water Bank is an untested program that would benefit the state of
Colorado by providing water for high-value uses during a water crisis. Following Howe
& MacDonnell (1986), this project analysis focuses on the costs and benefits to the
region of origin, Montrose County. The advantage to Montrose County is that willing
participants would receive reliable lease income during an extreme drought. The
disadvantages to Montrose County are that it would reduce agricultural output, which
would reduce the need for farmers to purchase agricultural inputs, and would indirectly
negatively affect Montrose’s economy. Directly, if farmers are willing participants, then
it is implied that they are better off from the program. The following section shows the
methodology for testing if lease payments generate enough indirect consumption to
compensate for the indirect negative effects of the Compact Water Bank.
33
Chapter 4:
Methodology
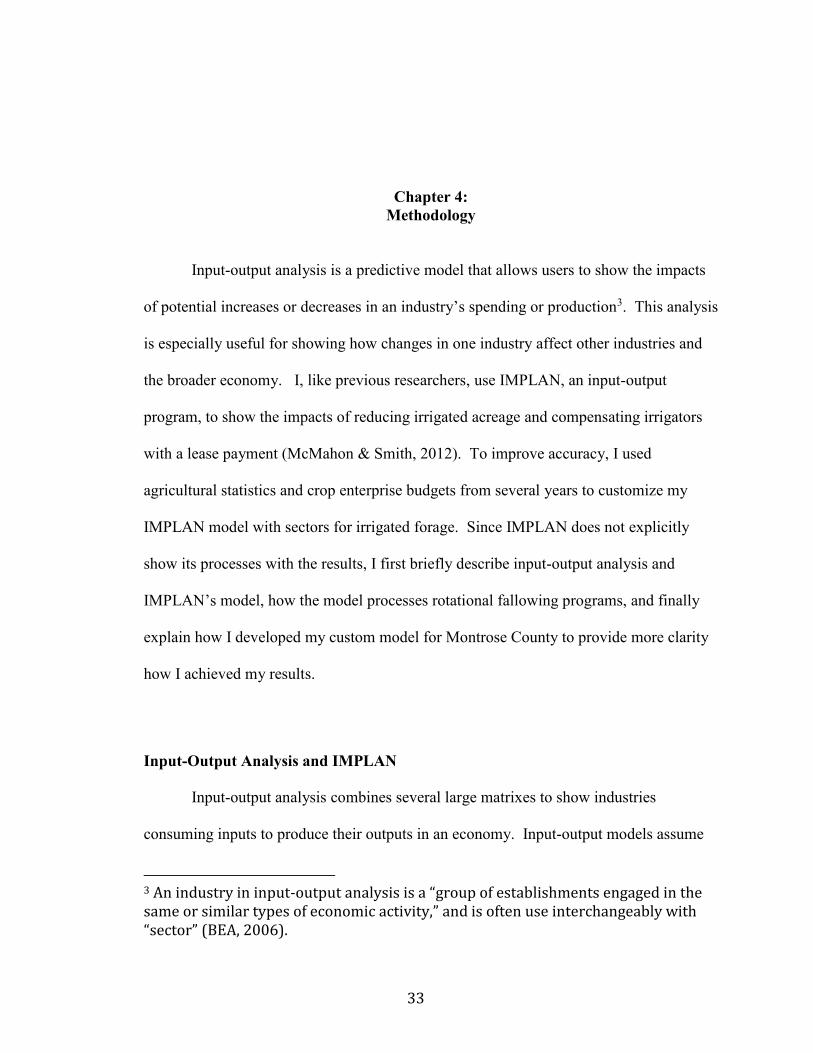
Input-output analysis is a predictive model that allows users to show the impacts
of potential increases or decreases in an industry’s spending or production3. This analysis
is especially useful for showing how changes in one industry affect other industries and
the broader economy. I, like previous researchers, use IMPLAN, an input-output
program, to show the impacts of reducing irrigated acreage and compensating irrigators
with a lease payment (McMahon & Smith, 2012). To improve accuracy, I used
agricultural statistics and crop enterprise budgets from several years to customize my
IMPLAN model with sectors for irrigated forage. Since IMPLAN does not explicitly
show its processes with the results, I first briefly describe input-output analysis and
IMPLAN’s model, how the model processes rotational fallowing programs, and finally
explain how I developed my custom model for Montrose County to provide more clarity
how I achieved my results.
Input-Output Analysis and IMPLAN
Input-output analysis combines several large matrixes to show industries
consuming inputs to produce their outputs in an economy. Input-output models assume
3 An industry in input-output analysis is a “group of establishments engaged in the same or similar types of economic activity,” and is often use interchangeably with “sector” (BEA, 2006).

34
that economic activity can be divided into sectors and then display all sectors on tables to
represent an economy (Miller and Blair, 2009). The tables show transactions between
industries such as a car manufacturer purchasing steel as an input. The model shows
‘final demand’, which would be consumers implicitly demanding steel through
purchasing a cars4 (Miller and Blair, 2009). These demands are compiled among
intermediate and final consumers of all commodities produced in an economy to show all
economic activity.
Table 4.1: A simplified input-output table. Industries’ output (rows) is used in the
economy as inputs for another industry (columns).
Into
Sector 1:
Agriculture
Sector 2:
Manufacturing
Sector 3:
Households
Total
Output
From
Sector 1: Agriculture $50 $40 $110 $200
Sector 2 Manufacturing $70 $30 $150 $250
Sector 3: Households $80 $180 $40 $300
Total Input
$200 $250 $300
Retrieved from: Input-Output Economics (Leontief, 1986).
Table 4.1 shows the relationships between inputs and outputs. The $200 dollars of
agricultural output are used as inputs unequally among agriculture, manufacturing and
households. In this case, households purchase and consume most of agricultural output,
$110. Manufacturers generally consume household output, $150 worth of labor. The
output of one sector is the input to another sector, so this model shows how different areas
of the economy are interconnected. Thus, this model is suited to show how impacts in one
sector are not exclusively borne by the sector: the sector’s producers and consumers are
also impacted.
4 Final Demand is used to denote the last individuals to demand a good in a economy. This term also refers to consumers or government purchasing a good and never reselling it (BEA, 2006)

35
IMPLAN uses a more advanced input-output model to show the interdependence
between industries. The 2014 IMPLAN model divides economies into 536 sectors.
IMPLAN uses several tables such as the “make table” to show the value of commodities
and the industries that produce them and the “use” table to show the industries that
consume commodities and labor through production (BEA, 2006). IMPLAN separately
models final demand through using ‘value added,’ or dollars that go to individuals such as
employees, proprietors or government (MIG, 2015a). IMPLAN then creates consumption
functions for individuals and local government (MIG, 2015a).
IMPLAN has several inherent simplifying assumptions that are essential to
understanding the model’s framework. The first assumption, constant returns to scale is,
“the same quantity of inputs is needed per unit of output, regardless of the level of
production”; large producers and small producers use the same production function (MIG,
2015b). The second, no supply constraints, means that there are “no restrictions to raw
materials,” so a water reduction has to be modeled as a reduction in irrigated acreage
(MIG, 2015b). Water as a natural resource cannot be limited. The third, fixed input
structure, assumes industries must use the same inputs in the same proportions to produce
output. If a producer reduces an input, they must also proportionally reduce other inputs
in their production function because industries cannot substitute any input for another
input (MIG, 2015b). The fourth and fifth, the industry-technology commodity-technology
assumptions, assume that the entire industry uses the same technology to produce outputs
and commodities (MIG, 2015b). Finally, the model is static. Impacts to the model only
show short run effects, before price changes occur (MIG 2015b).

36
Overview of How IMPLAN Processes Rotational Fallowing Programs
This model simulates the Compact Water Bank through modeling the impacts of
fallowing irrigated acreage and increasing spending through a lease payment, which is
similar to previous research (McMahon and Smith, 2012). Reducing irrigated acreage
reduces agricultural output. Previous research shows reducing irrigated acreage also
reduces the amount of indirect inputs irrigators purchase to produce these goods, due to
constant returns to scale and the fixed input structure assumptions (Thorvaldson and
Pritchett, 2006). Demand for intermediate agricultural inputs is smaller and the
producers of intermediate agricultural inputs decrease production to compensate. Now,
the intermediate producers’ lower demand for their inputs reduces production their
indirect industries. In this way, indirect effects continue throughout the economy.
The model shows that indirectly affected industries reduce the amount of labor
they hire based on reduced agricultural demand. This induces a reduction in general
consumption because laborers have less money to purchase consumer goods. The input-
output model will show the indirect and induced effects from fallowing alfalfa, grain
corn, and silage corn.
Since the Compact Water Bank does not currently have a proposed lease
payment, I model the positive effects of a historical lease payment, the Rocky Ford lease
of $528 per acre fallowed (McMahon and Smith, 2012). Previous research shows when
farmers spend lease payments on consumer goods, the industries that benefit from a lease
payment are different from the indirectly negatively effected industries (McMahon and
Smith, 2012).

37
Model Development for Montrose County
I performed an IMPLAN analysis-by-parts study in Montrose County, which
creates custom sectors and changes their productions to show the indirect impacts of a
change in part of a sector. I generated sectors to represent alfalfa, grain corn, and silage
corn in Montrose County and then reduced them to model a fallowing program. I needed
to make several additional assumptions for this study, which are listed in Appendix A.
To provide more clarity on my model’s specifications, this section shows why I edited
the IMPLAN’s model, how I developed a custom model, and the specific actions I used
to show the impacts of reduced irrigated acreage and a lease payment.
MIG creates the IMPLAN software by combining national statistics with local
data, but it does not exactly represent local conditions, particularly on farms. I used 2014
IMPLAN data for Montrose County as the baseline for my analysis. IMPLAN starts by
collecting data from the Bureau of Labor Statistics’ Quarterly Census of Employment to
find local employment, wage and salary data (MIG, 2015a). IMPLAN adjusts the BEA’s
benchmark input-output tables to sum to local data (MIG, 2015a). IMPLAN uses a
variety of data sources including the Consumer Expenditure Survey and Annual Survey
of Manufacturers to develop industry spending patterns and the total industry output.
These are national data-sources that are modified to fit local conditions. MIG admits
some of the data sources, particularly the Bureau of Labor Statistics, have “sparse
coverage of farms,” and recommends combining IMPLAN data with local data if
available more accurately represent local conditions.
I created unique sectors for alfalfa, grain corn, and silage corn to improve
IMPLAN’s representation of Montrose County’s agriculture. I found the output and

38
price for alfalfa, grain corn, and silage corn in Montrose County from 1989-2007 and
2012, the latest complete data available 5 (NASS, 2016). Since Colorado’s silage corn
prices are not available, I used a “quick and dirty method” to find the price of a ton of
silage by multiplying the price of a bushel of grain corn by 8 (Nennich & Hendrix 2012).
Then, I used the CPI to adjust for price inflation and brought all dollar values to the
model year, 2014. I multiplied the price and quantity together to find the total dollar
value of output in Montrose County and divided by the 2012 Census of Agriculture’s
total acreage to find the average dollar value of yield per acre. Due to data limitations on
the quantity of irrigated alfalfa produced, I assumed yield per acre in each particular crop
would be constant in irrigated and non-irrigated land. This simplifies reality, but I do not
believe it will seriously impact the results because non irrigated acreage only accounts for
about 5% of alfalfa, 9% of grain corn, and 5% of silage corn in Montrose County (United
States Department of Agriculture, 2012). I multiplied the average value of yield per acre
by the number irrigated acres in Montrose County to find the value of irrigated output in
Montrose County.
Table 4.2 Value of alfalfa and corn in Montrose County under various climatic scenarios
that change price and quantity of output produced. In millions of dollars.
Climatic Scenario Value of Irrigated
Alfalfa
Value of Irrigated
Grain Corn
Value of Irrigated
Silage Corn
Best $31.9 $12.2 $7.7
Average $11.4 $4.8 $3
Worst $4.3 $1.9 $.9
Source: Author
Since the value of agricultural output varies significantly from year to year, I
constructed three scenarios to show different potential situations. I assumed farmers in
5 Some years have two data points for agricultural production, because the Census of Agriculture and National Agricultural Statistics reported different values. I kept both values in this analysis.

39
Montrose County cannot influence the price of their crops, so I separated price from the
quantity. I created the “best case” scenario with the highest recorded prices and yields,
the “worst case” scenario with the lowest recorded yields and the “average case” scenario
with average yields and price, as Table 4.2 shows.
I used Colorado State’s Crop Enterprise Budgets to appropriate farmers’ spending
between intermediate agricultural inputs (Colorado State Agricultural Extension, 2015).
These budgets show southwestern farmers’ production expenses in dollars for specific
crops on a per-acre basis. Then I followed previous methodology to translate the specific
expenses on farm enterprise budgets into input output sectors, and supplemented the
missing information with a second methodology—please see Appendix B for more
information on sectoring the expenses (Pritchett & Thorvaldson, 2006; Willis and
Holland 1997). I divided the specific expenses by the total per-acre expenses to find the
proportion of each dollar spent on each expense, or each expense’s absorption coefficient,
which will be used for my unique sector’s production function. I calculated employee
compensation from the production function, and calculated proprietor income from
subtracting the total costs from the total value of irrigated output.
Input-output models assume a constant returns to scale and a fixed input cost
structures. If the quantity of one input is reduced by 10%, then the producer must reduce
all other inputs by 10% because irrigators cannot substitute goods. If all input purchases
are reduced by 10% then output is reduced by 10% because of constant returns to scale.
Following these principles, I developed graphs to show linear fallowing costs at the
beginning of the season in each scenario. These graphs’ data are available through
Colorado River Water Conservation District’s data on evapotranspiration at the town of
40
Montrose’s elevation, and agricultural statistics for the value of crops, and the crop
enterprise budgets data on costs (CRWCD, 2012; NASS, 2016; Colorado State, 2015) 6.
Best Case
Figure 4.1: Returns to an acre of irrigation in the best case scenario. As farmers reduce
their evapotranspiration, they reduce their output and their income.
Source: Author
The best case, Figure 4.1, shows the costs of reducing evapotranspiration, or the
water that is consumed by plants, in terms of forgone sales. Grain corn has the lowest
forgone returns from fallowing, likely because my model generally shows data from the
1990s and 2000s, which had low corn prices. Indirect effects will likely be higher in this
scenario because this shows the best possible agricultural scenario, high prices and high
yields. This shows alfalfa requires a higher amount of water evapotranspiration at full
irrigation than corn, because it is a thirstier crop.
6 Due to data limitations, I assumed all of Montrose County was at the town of Montrose’s elevation.
$-
$500.00
$1,000.00
$1,500.00
1 4 7 10 13 16 19 22 25 28 31
Ne
t R
etu
rns
to a
n A
cre
of
La
nd
Evapotranspiration Reduction in Inches
Net Returns to an Acre of Irrigation: Best Case
Alfalfa
Grain Corn
Silage Corn
41
Average Case
Figure 4.2: Average case returns to an acre of irrigation. Reducing
evapotranspiration increases grain farmer’s income.
Source: Author
In the average case, Figure 4.2, proprietor income is much lower for each of the
crops. Grain corn is outstanding because the net returns at full irrigation are negative,
meaning farmers producing this crop are generating a loss on each acre they produce.
Therefore, fallowing at the beginning of the season increases grain corn farmers’ income
in this model because farmers are not spending money on intermediate inputs.
-$250.00
-$200.00
-$150.00
-$100.00
-$50.00
$-
$50.00
$100.00
$150.00
1 3 5 7 9 11 13 15 17 19 21 23 25 27 29 31
Ne
t R
etu
rns
to a
n a
cre
of
lan
d
Evapotranspiration Reduction in Inches
Net Returns to an Acre of Irrigation: Average Case
Alfalfa
Grain Corn
Silage Corn

42
Worst Case
Figure 4.3 Worst case returns to an acre of irrigation. Reducing evapotranspiration
increases irrigator’s income by saving harvest costs.
Source: Author
The worst case scenario, Figure 4.3, has low yields and low prices. All alfalfa,
grain corn, and silage corn farmers, generate losses from irrigating. This scenario is the
best case for fallowing at the beginning of the season through the Compact Water Bank,
because reducing irrigated acreage would save irrigators money.
IMPLAN’s data comes pre-loaded with values for sectors that aggregate corn and
alfalfa among other crops. Corn and other crops are aggregated in ‘grain crops’ and
alfalfa is aggregated with other crops in ‘all other crops’. To exclusively show the effects
of fallowing corn and alfalfa, I disaggregated the value of the crops from IMPLAN’s
sectors. I added custom sectors to IMPLAN’s model and used the industry change
‘activity’ to set the value of output in my scenarios7. I estimated employment by adding
the number of irrigated farms to Dr. Dalstead’s non-proprietor employment estimates8
7 A group of events that change the production of an industry (MIG, 2015c) 8 I assumed all farms were sole proprietorships, so the number of farms would be the number of proprietors. IMPLAN counts proprietors as employees (MIG, 2016).
-$600.00
-$500.00
-$400.00
-$300.00
-$200.00
-$100.00
$-
1 3 5 7 9 11 13 15 17 19 21 23 25 27 29 31
Ne
t R
etu
rns
to a
n a
cre
of
lan
d
Evapotranspiration Reduction in Inches
Net Returns to an Acre of Irrigation: Worst Case
Alfalfa
Grain Corn
Silage Corn
43
(United States Department of Agriculture, 2012; Personal Communication with Norm
Dalstead, January 22nd 2016). Then, I set the values of employee compensation and
proprietor income to the values I calculated from my scenarios and the crop enterprise
budgets. If farmers operate at loss from irrigating, I assumed fallowing at the beginning
of the season would save money and I counted these saved harvest costs as proprietor
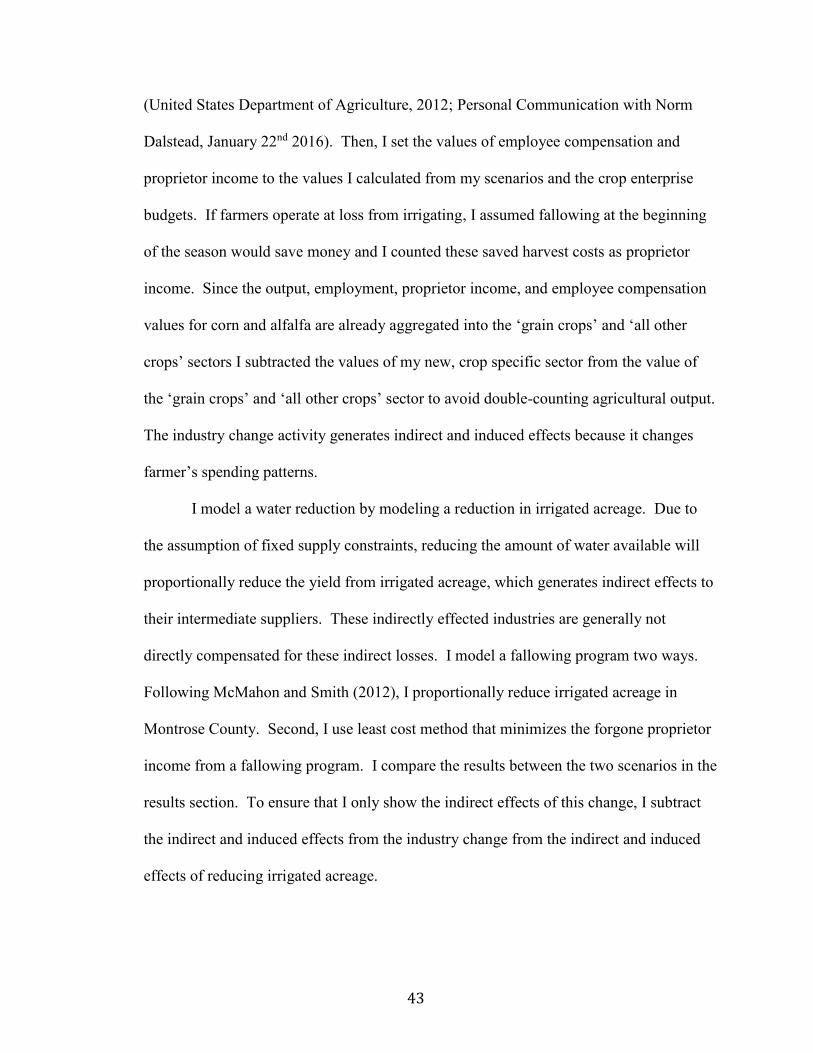
income. Since the output, employment, proprietor income, and employee compensation
values for corn and alfalfa are already aggregated into the ‘grain crops’ and ‘all other
crops’ sectors I subtracted the values of my new, crop specific sector from the value of
the ‘grain crops’ and ‘all other crops’ sector to avoid double-counting agricultural output.
The industry change activity generates indirect and induced effects because it changes
farmer’s spending patterns.
I model a water reduction by modeling a reduction in irrigated acreage. Due to
the assumption of fixed supply constraints, reducing the amount of water available will
proportionally reduce the yield from irrigated acreage, which generates indirect effects to
their intermediate suppliers. These indirectly effected industries are generally not
directly compensated for these indirect losses. I model a fallowing program two ways.
Following McMahon and Smith (2012), I proportionally reduce irrigated acreage in
Montrose County. Second, I use least cost method that minimizes the forgone proprietor
income from a fallowing program. I compare the results between the two scenarios in the
results section. To ensure that I only show the indirect effects of this change, I subtract
the indirect and induced effects from the industry change from the indirect and induced
effects of reducing irrigated acreage.
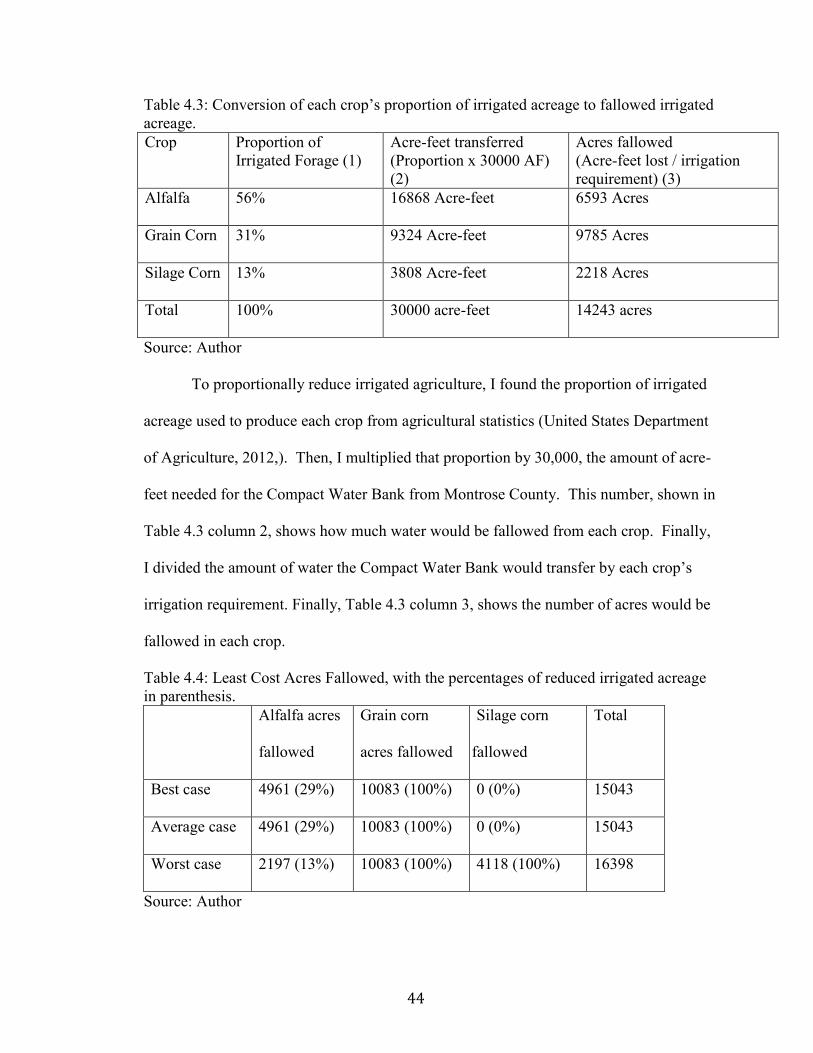
44
Table 4.3: Conversion of each crop’s proportion of irrigated acreage to fallowed irrigated
acreage.
Crop Proportion of
Irrigated Forage (1)
Acre-feet transferred
(Proportion x 30000 AF)
(2)
Acres fallowed
(Acre-feet lost / irrigation
requirement) (3)
Alfalfa 56% 16868 Acre-feet 6593 Acres
Grain Corn 31% 9324 Acre-feet 9785 Acres
Silage Corn 13% 3808 Acre-feet 2218 Acres
Total 100% 30000 acre-feet 14243 acres
Source: Author
To proportionally reduce irrigated agriculture, I found the proportion of irrigated
acreage used to produce each crop from agricultural statistics (United States Department
of Agriculture, 2012,). Then, I multiplied that proportion by 30,000, the amount of acre-
feet needed for the Compact Water Bank from Montrose County. This number, shown in
Table 4.3 column 2, shows how much water would be fallowed from each crop. Finally,
I divided the amount of water the Compact Water Bank would transfer by each crop’s
irrigation requirement. Finally, Table 4.3 column 3, shows the number of acres would be
fallowed in each crop.
Table 4.4: Least Cost Acres Fallowed, with the percentages of reduced irrigated acreage
in parenthesis.
Alfalfa acres
fallowed
Grain corn
acres fallowed
Silage corn
fallowed
Total
Best case 4961 (29%) 10083 (100%) 0 (0%) 15043
Average case 4961 (29%) 10083 (100%) 0 (0%) 15043
Worst case 2197 (13%) 10083 (100%) 4118 (100%) 16398
Source: Author
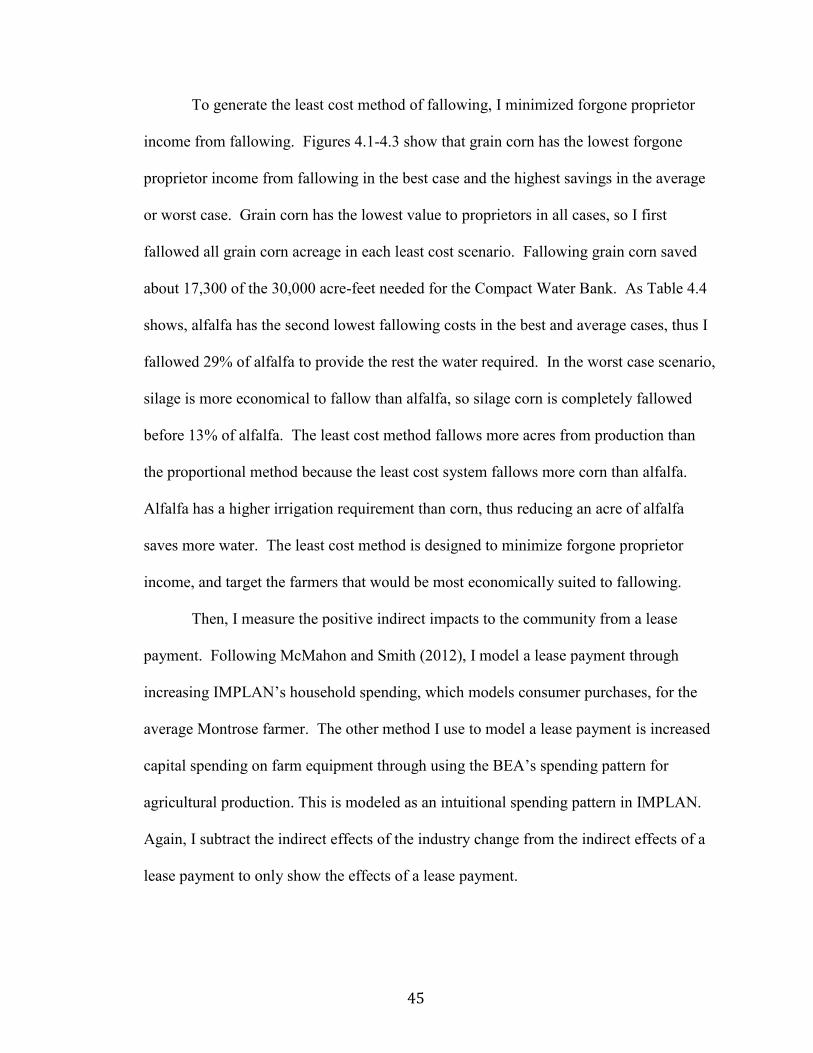
45
To generate the least cost method of fallowing, I minimized forgone proprietor
income from fallowing. Figures 4.1-4.3 show that grain corn has the lowest forgone
proprietor income from fallowing in the best case and the highest savings in the average
or worst case. Grain corn has the lowest value to proprietors in all cases, so I first
fallowed all grain corn acreage in each least cost scenario. Fallowing grain corn saved
about 17,300 of the 30,000 acre-feet needed for the Compact Water Bank. As Table 4.4
shows, alfalfa has the second lowest fallowing costs in the best and average cases, thus I
fallowed 29% of alfalfa to provide the rest the water required. In the worst case scenario,
silage is more economical to fallow than alfalfa, so silage corn is completely fallowed
before 13% of alfalfa. The least cost method fallows more acres from production than
the proportional method because the least cost system fallows more corn than alfalfa.
Alfalfa has a higher irrigation requirement than corn, thus reducing an acre of alfalfa
saves more water. The least cost method is designed to minimize forgone proprietor
income, and target the farmers that would be most economically suited to fallowing.
Then, I measure the positive indirect impacts to the community from a lease
payment. Following McMahon and Smith (2012), I model a lease payment through
increasing IMPLAN’s household spending, which models consumer purchases, for the
average Montrose farmer. The other method I use to model a lease payment is increased
capital spending on farm equipment through using the BEA’s spending pattern for
agricultural production. This is modeled as an intuitional spending pattern in IMPLAN.
Again, I subtract the indirect effects of the industry change from the indirect effects of a
lease payment to only show the effects of a lease payment.
46
I used a $528 lease payment per acre fallowed to show the effects of increased
household income and farm capital expenditures. The proportional method of fallowing
generates a total lease payment of $7,520,0389. The least cost method generates a lease
payment of $7,943,017 in the best and average case, and a higher lease payment of
$8,658,341 in the worst case10. To exclusively show the impacts of a lease payment, I
subtracted the effects of the industry change from the effects of a change in household
spending.
This model is far from perfect, but it improves IMPLAN’s representation of
alfalfa, grain corn, and silage corn farmers in Montrose County. I needed to make several
simplifying assumptions in addition to the general input-output assumptions involving
price, ownership, and yield per acre11. This model improves on IMPLAN’s original
information on Montrose County’s farm related activities by using local data and
production functions. This is especially necessary for agricultural production as some of
their data sources admit to having “sparse coverage of farms.” With this improved
model, I show the indirect impacts of fallowing shock proposed by the Colorado River
Conservation district and examine if the positive impacts from a historical lease payment
would be enough to compensate for these indirect effects.
9 14232 acres fallowed proportionally x 528 = 7,520,038 10 15043 acres fallowed least cost x 528 = 7,943,017 for best and average case 16398 acres fallowed least cost x 528 = 8,658,341 for worst case 11 The assumptions I refer to here are: the price of silage corn is equal to the price of grain corn multiplied by eight, all farms are sole proprietorships, and yield per acre is equal in irrigated and non-irrigated land. A full list of assumptions can be found in Appendix A

47
Chapter 4:
Results
The Compact Water Bank intends to fallow forage crops in Montrose County in
the event of a Compact curtailment, and transfer the saved water to other users around the
state (CWRCB, 2012). This will involve fallowing irrigated acreage and a lease payment
to compensate the farmers. My method of measuring indirect effects, IMPLAN, provides
direct, indirect and induced effects, but I focus on the indirect and induced effects from
the fallowing program. I combine the direct, indirect and induced effects from the
leasing program into one number to simply show the impacts.
This results section first shows the impacts of fallowing irrigated acreage in
Montrose County. I examine three climatic conditions, and model fallowing each crop in
two ways in each condition. This creates six fallowing scenarios:
1. Best Case: Proportional Fallowing:
2. Best Case: Least Cost Fallowing
3. Average Case: Proportional Fallowing
4. Average Case: Least Cost Fallowing
5. Worst Case: Proportional Fallowing
6. Worst Case: Least Cost Fallowing:
The best case shows the best possible scenario for agriculture: high output and
crop prices. The average case has average output and crop prices. The worst case has the
worst output and prices. I fallow each crop proportionally, by percentage of irrigated
forage acreage, and through a least cost method, that minimizes forgone proprietor
income. I analyze each climatic scenario individually to show that the least cost method
reduces the forgone economic activity from fallowing, particularly in the consumer

48
sector, and that if agricultural conditions are bad, fallowing can indirectly benefit an
economy.
Second, I assess the impacts of a $528 lease payment. I model two lease spending
patterns: increased household spending and increased farm capital spending in each of the
six fallowing cases, resulting in twelve test cases. Since several climatic cases fallow the
same amount of land, receive the same lease payment and produce the same indirect
effects, there are only six unique results:12.
1. All Climatic Cases, Proportional Fallowing, lease increases household
spending
2. All Climatic Cases: Proportional Fallowing, lease increases farm capital
spending
3. Best Case/Average Case: Least Cost fallowing, lease increases household
spending
4. Best Case/Average Case: Least Cost fallowing, lease increases farm
capital spending
5. Worst Case: Least Cost fallowing, lease increases household spending
6. Worst Case: Least Cost fallowing, lease increases farm capital spending
All proportional fallowing cases reduces irrigated acreage by the same amount,
so there are only two proportional situations: the extra income could be spent on
household goods or on farm capital. The least cost method of fallowing reduces a
variable amount of acreage, and has four results: lease payments spent on household
goods or farm capital in the best and average case, and lease payments spent on
household goods or farm capital in the worst case. This section analyzes the impacts of
each spending pattern.
12 14232 acres fallowed proportionally x $528 = $7,520,038 for all cases
15043 acres fallowed least cost x $528 = $7,943,017 for best and average case 16398 acres fallowed least cost x $528 = $8,658,341 for worst case
49
Finally, I show net effects of the Compact Water Bank in each case. I use the
output impacts from fallowing and from the lease payments to show that the total impacts
to Montrose County to show in most cases, the Compact Water Bank benefits Montrose
County. Then, I compare the sectors that benefit from the lease payment to the sectors
that are negatively impacted from fallowing to show that lease payments do not
compensate the indirectly negatively impacted sectors.
Fallowing Irrigated Acreage
The Compact Water Bank intends to have forage irrigators fallow their crops in
the event of a Compact curtailment, so that the bank can transfer the saved water
(CWRCB, 2012). Previous research finds that indirect negative effects from fallowing
irrigated acreage can be large in specialized agricultural economies (Howe & Goemans,
2003). Thus, an estimate of the indirect effects from fallowing to uncompensated
industries could be beneficial knowledge for the Compact Water Bank’s developers.
Indirect effects in the following tables are rounded to the nearest thousand. All impacts
to jobs and indirect effects per capita are rounded to the nearest integer. Detailed reports
of the effects of fallowing can be found in Appendix C. In this section, I compare the
short-run indirect impacts of proportional fallowing to least cost fallowing in each
climate condition.

50
Best Case: Proportional Fallowing
Table 5.1: Indirect and induced effects from proportional fallowing in the best case
scenario
Best Case Least
Cost Fallowing
Proportional
Indirect
Proportional
Induced
Proportional Total
Employment -20 -86 -107
Value added -$624,000 -$4,548,000 -$5,173,000
Output -$2,309,000 -$9,725,000 -$12,034,000
Output Per
Capita
-$56 -$238 -$294
Output Per Acre
Fallowed
-$162 -$682 -$844
Source: Author
Proportional fallowing in the best case scenario for agriculture has the largest
negative impacts from fallowing, shown in Table 5.1. Farmers would have generated a
large income in the best case scenario, so induced effects have the highest negative
impacts. Most of the negative effects are to consumer goods, rather than indirect
agricultural inputs, because farmers are no longer able use their high income for
consumptive spending. The specific sectors impacted are addressed in the sector analysis
section. This scenario has high agricultural output and high prices, so fallowing produces
the highest negative indirect effects in Table 5.113. Value added represents forgone
employee, proprietor and government income from fallowing. This scenario shows the
highest opportunity cost for agriculture.
13 In these tables, indirect effects refer to “changes in inter-industry purchases as they respond to new demands of the directly affected industries” (Schmit et al., 2013).

51
Best Case: Least Cost Fallowing
Table 5.2: Indirect and induced effects from least cost fallowing in the best case scenario
Best Case Least
Cost Fallowing
Least Cost Indirect
Least Cost Induced Least Cost Total
Employment -19 -63 -83
Value added -$989,000 -$3,720,000 -$4,709,000
Output -$2,203,000 -$7,137,000 -$9,340,000
Output Per Capita -$54 -$175 -$229
Output Per Acre
Fallowed
-$146 -$474 -$620
Source: Author
In the best case scenario, the least cost method of fallowing, Table 5.2, minimizes
the forgone proprietor income from fallowing. Proprietors have more remaining income
to spend on household consumer goods in the least cost fallowing scenario, Table 5.2,
than in the proportional fallowing scenario, Table 5.1. This effect is represented through
the smaller induced effects14. The proportional method of fallowing reduces the forgone
output by $12 million, Table 5.1, and the least cost method reduces forgone income by
the relatively smaller $9.3 million, Table 5.2. Previous research notes that indirect
effects are more prevalent in sparsely populated regions (Howe and Goemans, 2003).
The indirect effects would be relatively high on sparsely populated Montrose County in
the best case scenario15. The total indirect effects are high compared to previous
estimates in both fallowing methods because this scenario maximizes opportunity cost of
irrigated agriculture by using the highest output and prices recorded (McMahon and
Smith, 2012).
14 In these tables, induced effects refer to “changes in spending from households as income increases or decreases due to the changes in production” (Schmit et al., 2013). 15 The recorded population in Montrose county is 40,873 (Census Quick Facts, 2014)
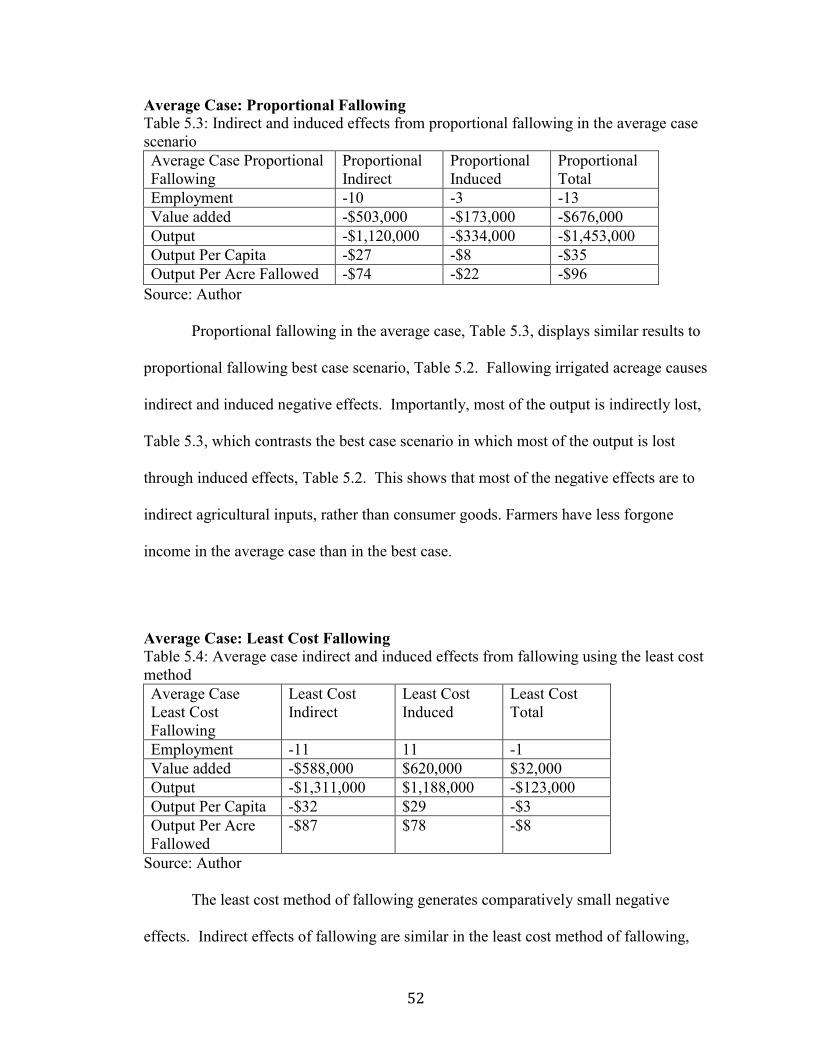
52
Average Case: Proportional Fallowing
Table 5.3: Indirect and induced effects from proportional fallowing in the average case
scenario
Average Case Proportional
Fallowing
Proportional
Indirect
Proportional
Induced
Proportional
Total
Employment -10 -3 -13
Value added -$503,000 -$173,000 -$676,000
Output -$1,120,000 -$334,000 -$1,453,000
Output Per Capita -$27 -$8 -$35
Output Per Acre Fallowed -$74 -$22 -$96
Source: Author
Proportional fallowing in the average case, Table 5.3, displays similar results to
proportional fallowing best case scenario, Table 5.2. Fallowing irrigated acreage causes
indirect and induced negative effects. Importantly, most of the output is indirectly lost,
Table 5.3, which contrasts the best case scenario in which most of the output is lost
through induced effects, Table 5.2. This shows that most of the negative effects are to
indirect agricultural inputs, rather than consumer goods. Farmers have less forgone
income in the average case than in the best case.
Average Case: Least Cost Fallowing
Table 5.4: Average case indirect and induced effects from fallowing using the least cost
method
Average Case
Least Cost
Fallowing
Least Cost
Indirect
Least Cost
Induced
Least Cost
Total
Employment -11 11 -1
Value added -$588,000 $620,000 $32,000
Output -$1,311,000 $1,188,000 -$123,000
Output Per Capita -$32 $29 -$3
Output Per Acre
Fallowed
-$87 $78 -$8
Source: Author
The least cost method of fallowing generates comparatively small negative
effects. Indirect effects of fallowing are similar in the least cost method of fallowing,

53
Table 5.4, to the proportional method of fallowing, Table 5.3, in the average case.
Induced effects from fallowing in Table 5.4 are positive because the least cost method
fallows grain corn. Since grain corn farming caused a loss on operations, completely
fallowing it in the least cost scenario saves proprietor income through saving harvest
costs. I modeled saving harvest costs on loss-producing crops as proprietor income,
which creates positive induced effects without a lease payment.
Worst Case: Proportional Fallowing
Table 5.5: Worst case proportional fallowing indirect and induced effects from fallowing
Worst Case
Proportional Fallowing
Proportional
Indirect
Proportional
Induced
Proportional
Total
Employment -4 +31 +27
Value added -$189,000 $1,804,000 $1,615,000
Output -$420,000 $3,459,000 $3,039,000
Output Per Capita -$10 $85 $74
Output Per Acre
Fallowed
-$26 $211 $185
Source: Author
The proportional worst case scenario, Table 5.5, has higher positive induced
effects than the least cost average case, Table 5.4, from fallowing because all crops
generate a loss in the scenario. The indirect costs of fallowing, representing forgone
agricultural input purchases, are smaller in the worst case than in other cases. This
scenario presumes that farming would not produce much indirect activity without
fallowing. There is a low opportunity cost to fallowing. The positive effects from saved
proprietor income outweigh the negative effects of reduced agricultural input purchases,
so fallowing benefits the economy without a lease payment.

54
Worst Case: Least Cost Fallowing
Table 5.6: Worst case least cost indirect and induced effects from fallowing
Worst Case Least Cost
Fallowing
Least Cost
Indirect
Least Cost
Induced
Least Cost
Total
Employment -5 +34 +29
Value added -$265,000 $1,991,000 $1,726,000
Output -$591,000 $3,818,000 $3,228,000
Output Per Capita -$14 $93 $79
Output Per Acre
Fallowed
-$36 $233 $197
Source: Author
In the least cost worst scenario, Table 5.6, fallowing produces even higher
positive induced effects. This is because I fallowed the crops with the highest operations
loss before fallowing crops with lower operations loss. Again, the induced positive
induced effects from fallowing can outweigh the negative indirect effects of fallowing
without any lease payment.
Lease Payments
An essential component of the Compact Water Bank is compensating irrigators
for fallowing (CWRCB, 2012). The following tables show the direct, indirect, and
induced effects the lease payment as a single value for employment, total value added,
and output. For the six unique lease payment results, I show the effects of increasing
household consumption and agricultural capital spending functions to estimate the effects
of a lease payment. Detailed tables of lease impacts are available in Appendix C. All
proportional cases have the same lease payment and the same impacts, so they are
represented as a single row. Similarly, the best case and average case least cost scenarios
have the same lease payment and are shown as one row for the same reason. This

55
subsection compares the impacts of farmers using lease payments on consumer spending
to using lease payments for agricultural improvements.
Lease Payment: Household Income
Table 5.7: Effects of increasing household spending through a lease payment
Employment Total Value
Added
Output Output per
capita
Output
per acre
Multiplier
Proportional
All Cases
+56 $3,192,000 $6,317,000 $155 $420 0.84
Least Cost
Best
Case/Average
Case
+59 $3,372,000 $6,672,000 $163 $444 0.84
Worst Case
Least Cost
+66 $3,771,000 $7,273,000 $178 $444 0.84
Source: Author
The household spending institutional spending pattern replicates consumer
spending for an average Montrose farmer’s income. Table 5.7 shows that there is not
much difference between the output stimulated by the lease payment from the least cost
method and proportional method of fallowing. The least cost method has slightly higher
positive effects because it fallows more acres and generates a higher lease payment to
Montrose County16. The constant multiplier in Table 5.7 demonstrates the lease payment
for least cost fallowing is not more efficient in generating output. Importantly, the output
multiplier is less than one in Table 5.7, so it would take a lease payment larger than the
output forgone to indirectly compensate a community for fallowing irrigated agriculture.
16 14232 acres fallowed proportionally x $528 = $7,520,038 for all cases
15043 acres fallowed least cost x $528 = $7,943,017 for best and average case 16398 acres fallowed least cost x $528 = $8,658,341 for worst case

56
Lease Payment: Agricultural Capital
Table 5.8: Effects of increasing agricultural capital spending through a lease payment Employment Total Value
added (USD $)
Output
(USD $)
Output per
capita (USD
$)
Output per
acre
Multiplier
Proportional All
Cases
+39
$2,901,000 8,673,000
$212.19 $577 1.15
Least cost Best
Case/Average
Case
+41
$3,064,000 9,161,000
$224.13 $609 1.15
Worst case least
cost
+43 $3,340,000 9,986,000
$244.32 $609 1.15
Source: Author
I used the BEA’s farm production spending pattern to model the effects of
increasing agricultural capital spending, detailed in Table 5.8. The BEA’s farm
production spending pattern represents spending on improving farm equipment and
fixtures. Again, the effects of lease payments spent on agricultural capital spending
stimulate about the same output in proportional fallowing and the least cost fallowing.
For the same lease payment, the agricultural spending pattern stimulates more output, but
less employment than household spending stimulates. The output multiplier in Table 5.8
is greater than one, indicating a dollar lease payment creates more than one dollar of
output in the short run.
Net Impacts
This section provides the net impacts from the Compact Water Bank. It is
important to note that both the climatic conditions and the least cost method of fallowing
are inherently retrospective. In this model, irrigators fallow irrigated acreage before they
know what the climatic conditions will be. This assumes that irrigators know how much
their crop would be worth and how much they would produce at the beginning of the
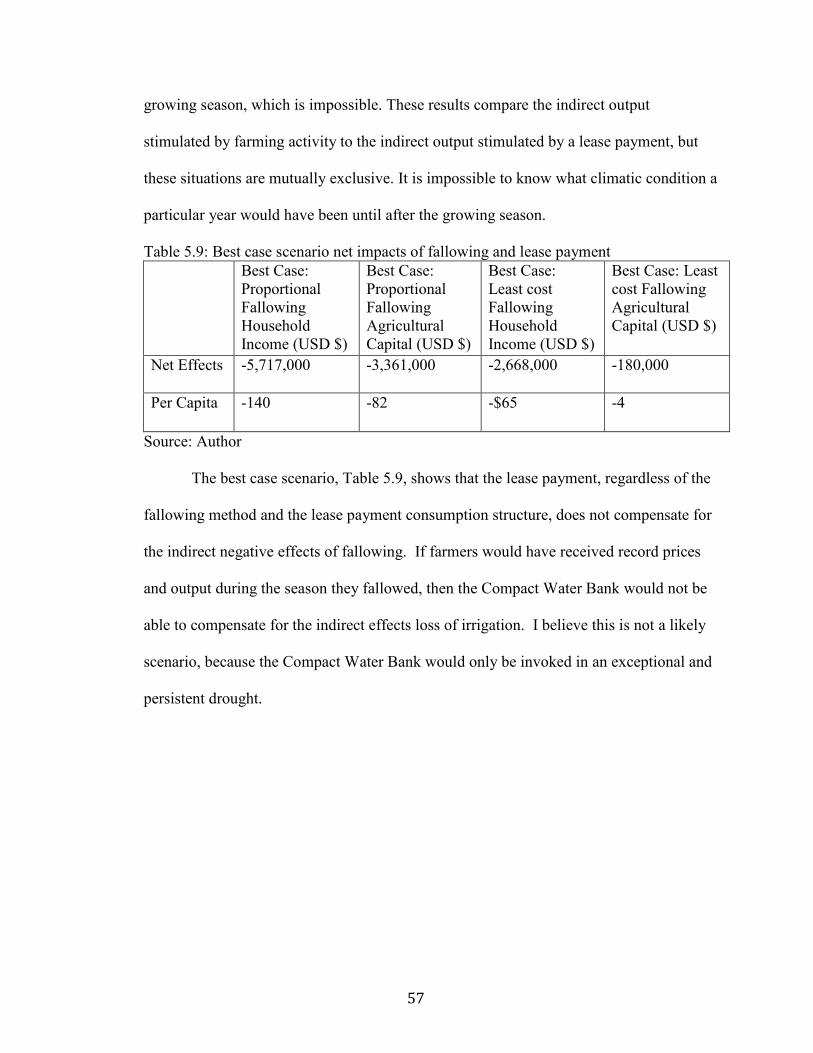
57
growing season, which is impossible. These results compare the indirect output
stimulated by farming activity to the indirect output stimulated by a lease payment, but
these situations are mutually exclusive. It is impossible to know what climatic condition a
particular year would have been until after the growing season.
Table 5.9: Best case scenario net impacts of fallowing and lease payment
Best Case:
Proportional
Fallowing
Household
Income (USD $)
Best Case:
Proportional
Fallowing
Agricultural
Capital (USD $)
Best Case:
Least cost
Fallowing
Household
Income (USD $)
Best Case: Least
cost Fallowing
Agricultural
Capital (USD $)
Net Effects -5,717,000 -3,361,000 -2,668,000 -180,000
Per Capita -140 -82 -$65 -4
Source: Author
The best case scenario, Table 5.9, shows that the lease payment, regardless of the
fallowing method and the lease payment consumption structure, does not compensate for
the indirect negative effects of fallowing. If farmers would have received record prices
and output during the season they fallowed, then the Compact Water Bank would not be
able to compensate for the indirect effects loss of irrigation. I believe this is not a likely
scenario, because the Compact Water Bank would only be invoked in an exceptional and
persistent drought.

58
Table 5.10: Average case scenario net impacts of fallowing and lease payment
Average Case:
Proportional
Fallowing
Household
Income
Average Case:
Proportional
Fallowing
Agricultural
Capital
Average Case:
Least cost
Fallowing
Household
Income
Average Case:
Least cost
fallowing
Agricultural
Capital
Net Effects $4,863,000 $7,219,000 $6,481,000 $8,969,000
Per Capita $119 $177 $159 $219
Source: Author
In the average case, Table 5.10, the Compact Water Bank fully compensates for
indirect negative effects, regardless of the fallowing mechanism or lease payment
spending pattern. This would mean that the output stimulated by a lease payment is more
than the forgone output from fallowing. The Compact Water Bank would generate more
economic activity in Montrose County than irrigating would have produced in the
average case, so it would be good for Montrose County’s economy for forage irrigators to
participate.
Table 5.11: Worst case scenario net impacts of fallowing and lease payment
Worst Case:
Proportional
Fallowing
Household
Income
Worst Case:
Proportional
Fallowing
Agricultural
Capital
Worst Case:
Least cost
Fallowing
Household
Income
Worst Case:
Least cost
fallowing
Agricultural
Capital
Net Effects
$6,270,000 $8,626,000 $7,186,000 $9,898,000
Per Capita $153 $211 $176 $242
Source: Author
In the worst case scenario, Table 5.11, a historical lease payment again fully
compensates for forgone output. The output stimulated by the Compact Water Bank in
excess of irrigating land is greater than in the average case, Table 5.11. This is because
the opportunity cost of irrigating land is smaller; all crops produce a loss from irrigating.
59
This is the best possible outcome for Montrose County from the Compact Water Bank,
because Montrose County would have had a terrible irrigating year, but instead fallowed
and received a lease payment.
Sector Analysis
Previous research found that the indirect industries that fallowing negatively
impacts are not the industries that benefit from a household lease payment (McMahon
and Smith, 2012). This challenges the notion that a leasing program can fully
compensate for forgone output, because some stakeholders are worse off from the
program. This section provides a descriptive sample of the industries that are negatively
affected by fallowing and positively impacted. Although the following tables do not
contain all of the negative impacts and positive impacts, most of the indirect impacts are
accounted for within the tables.

60
Table 5.12: Top sectors indirectly negatively affected by fallowing in the best case (blue
shading denotes presence on crop enterprise budgets)
Best Case Proportional Sectors
Negatively Impacted
Best Case Least Cost Sectors Negatively
Impacted
Owner-occupied dwellings Owner-occupied dwellings
Real estate Real estate
Offices of physicians Insurance agencies, brokerages, and related
activities
Limited-service restaurants Non-depository credit intermediation and
related activities
Non-depository credit intermediation
and related activities Offices of physicians
Wireless telecommunications carriers
(except satellite)
Accounting, tax preparation, bookkeeping,
and payroll services
Other financial investment activities Limited-service restaurants
Insurance agencies, brokerages, and
related activities Other financial investment activities
Positively Impacted Industries: Best
Case Proportional
Positively Impacted Industries: Best
Case Least cost
N/A N/A
Source: Author
Table 5.12 has the top 7 industries are indirectly negatively impacted from a
fallowing program in the best case scenario. To see the full indirect effects of fallowing
and the lease payment see Appendix C. In the best case scenario, no industries are
positively affected because fallowing does not generate any positive induced effects. In
the best case, consumer goods are negatively impacted because most of the forgone
output is proprietor income, which generates induced negative effects and reduces
household consumption. Consumer sectors such as “wireless telecommunications” and
“limited service restaurants” are negatively impacted. Although indirectly several sectors
are present on the production function, these are also broad sectors that are not unique to
agricultural production.

61
Table 5.13: Top sectors indirectly negatively affected by fallowing in the average case
(blue shading denotes presence on crop enterprise budgets)
Average Case Proportional Sectors
Negatively Impacted
Average Case Least Cost Sectors
Negatively Impacted
Insurance agencies, brokerages, and
related activities
Insurance agencies, brokerages, and related
activities
Nondepository credit intermediation
and related activities Scientific research and development services
Scientific research and development
services
Nondepository credit intermediation and
related activities
Accounting, tax preparation,
bookkeeping, and payroll services
Accounting, tax preparation, bookkeeping,
and payroll services
Water, sewage and other systems Water, sewage and other systems
Support activities for agriculture and
forestry Support activities for agriculture and forestry
Owner-occupied dwellings Legal services
Real estate Other local government enterprises
Positively Impacted Industries:
Average Case Proportional
Positively Impacted Industries: Average
Case Least cost
N/A Owner-occupied dwellings
Offices of physicians
Limited-service restaurants
Real estate
Wireless telecommunications carriers (except
satellite)
Source: Author
In the average case, Table 5.13, the indirectly negatively impacted industries are
intermediate inputs to forage agriculture, as shown in Appendix C. Tables 5.3-5.4
estimate the negative indirect impacts are larger than the negative induced impacts in the
average case, so more intermediate agricultural inputs have the large negative impacts
than in the best case. Several of these intermediate agricultural inputs are likely unique to
agriculture, such as “support services for agriculture and forestry”. In the least cost
scenario, as Table 5.4 shows, fallowing produces some indirect positive effects because
fallowing grain corn reduces farm losses in Montrose County. This generates positive
impacts to consumer good sectors, as the bottom section of Table 5.13 shows.

62
Table 5.14: Top sectors indirectly negatively affected by fallowing in the worst case (blue
shading denotes presence on crop enterprise budgets)
Worst Case Proportional Sectors
Negatively Impacted
Worst Case Least Cost Sectors
Negatively Impacted
Scientific research and development
services
Scientific research and development
services
Insurance agencies, brokerages, and related
activities
Insurance agencies, brokerages, and
related activities
Nondepository credit intermediation and
related activities
Accounting, tax preparation, bookkeeping,
and payroll services
Support activities for agriculture and
forestry
Nondepository credit intermediation and
related activities
Water, sewage and other systems Support activities for agriculture and
forestry
Accounting, tax preparation, bookkeeping,
and payroll services
Water, sewage and other systems
Construction machinery manufacturing Construction machinery manufacturing
Beef cattle ranching and farming, including
feedlots and dual-purpose ranching and
farming
Beef cattle ranching and farming,
including feedlots and dual-purpose
ranching and farming
Dairy cattle and milk production Dairy cattle and milk production
Positively Impacted Industries: Worst
Case Proportional
Positively Impacted Industries:
Average Case Least cost
Owner-occupied dwellings Owner-occupied dwellings
Real estate Real estate
Offices of physicians Offices of physicians
Limited-service restaurants Limited-service restaurants
Wireless telecommunications carriers
(except satellite)
Wireless telecommunications carriers
(except satellite)
Source: Author
The worst case scenario, Table 5.14 shows similar results to the average case
scenario. Again, Tables 5.5-5.6 show most negative effects occur to indirect industries,
rather than induced industries. As in the average case, the indirectly impacted sectors are
intermediate agricultural inputs that are unique to agriculture. Additionally, some of the
sectors for which forage production is an input, such as dairy and beef cattle production,
are negatively impacted. Since fallowing increases proprietor income in the worst case,
consumer sectors benefit from fallowing.

63
Table 5.15: Top sectors positively impacted by lease payment used in household
spending and BEA’s agricultural production spending pattern
Household Spending (1) Agricultural Production (2)
Owner-occupied dwellings Construction machinery manufacturing
Real estate Wholesale trade
Offices of physicians Architectural, engineering, and related services
Wireless telecommunications
carriers (except satellite) Truck transportation
Limited-service restaurants
Ornamental and architectural metal work
manufacturing
Electric power transmission and
distribution Owner-occupied dwellings
Wholesale trade Real estate
Other financial investment activities Retail - Motor vehicle and parts dealers
Source: Author
The two lease payment spending patterns do not impact the same sectors, as
shown Table 5.15. Household spending benefits the consumer sectors. These sectors are
indirectly negatively impacted in the best case scenario, but are generally not present on
crop enterprise budgets. The agricultural production spending pattern also does not
generally does not benefit the sectors negatively impacted by fallowing. The exceptions
are real estate and construction machinery manufacturing. Neither lease payment
mechanism is able to compensate the sectors that are negatively impacted by a fallowing
program.
This study modeled the Compact Water Bank as a fallowing and leasing program.
Irrigators could fallow proportionally, or could fallow based on their economic situation.
The results illustrate that when irrigators fallow their least valuable crops, the induced
negative effects from fallowing are smaller than if they fallow their crops proportionally.
This project simulates irrigators spending their lease payments on household
consumption and agricultural capital, which depending on the agricultural situation, could
compensate for indirect negative effects. Both spending patterns do not benefit the

64
indirectly negatively impacted sectors in the worst and average case. The next section
concludes with an assessment of the results and implications of the study.

65
Chapter 5:
Conclusion
The Compact Water Bank is a unique program that would provide water to post-
Compact water users during a persistent drought that prevents these users, such as Front
Range cities, from diverting water. I set out to compare the indirect effects of fallowing
to the indirect benefits of lease payments in Montrose County to examine if a lease
payment could compensate for the indirect losses of fallowed acreage. Depending on the
climatic scenario and fallowing method, Montrose County can be compensated by a
historic lease payment, but the industries that are negatively impacted by fallowing do not
benefit from a lease payment.
In the best case scenario, there is the highest opportunity cost to fallowing the
most foregone output. Most of this forgone output is proprietor income, so consumer
sectors, like restaurants, are the most negatively impacted sectors. The lease payment
does not fully compensate for indirectly lost output because farming generates large
profits and high proprietor incomes. It seems unlikely, however, that during an extreme
and persistent drought that invokes the Compact Water Bank irrigators would receive
record high output and high prices.
In the average and the worst case scenario, Montrose County would be indirectly
better off from a rotational fallowing program than from irrigation. A lease payment
stimulates more consumption than the forgone consumption from fallowing. This effect
occurs regardless of the lease payment consumption pattern. In the worst case scenario,
fallowing saves money from harvest costs, which benefits the economy in the short run
66
without any lease payment. Unfortunately, it is impossible to know the price and output
of a crop in advance due to global climate and market fluctuations.
By fallowing the crops with the lowest dollar value of output before fallowing
other crops, the least cost method of fallowing minimizes the forgone proprietor income.
Although this method assumes that a farmer knows a crop’s value at planting, the results
from least cost fallowing could be a useful tool for planning a short-term water transfer.
If a water planner could predict which farmers would lose the least from fallowing, it
would reduce the negative indirect effects to the broader economy, particularly to
consumer goods.
The lease payment indirectly benefits the economy because individuals spend
their extra income on goods and services. Depending on how farmers spend lease
payments, they benefit the different sectors of the economy. I modeled two consumption
patterns for each scenario: farmers spending lease payments on household consumption
or on farm capital spending. IMPLAN predicts that if farmers spend their lease payments
on consumption goods, sectors that produce consumer goods, such as restaurants, benefit.
If farmers spend lease payments on improving their farm, capital industries such as
machinery manufacturing benefit. In most cases, the lease payments do not benefit the
indirectly negatively impacted sectors, intermediate agricultural inputs.
Limitations of this Study
This study is an estimation of the positive and negative impacts of the Compact
Water Bank. The main limitations of this research are data availability, the assumption of
certainty, and several unaccounted variables in the model.
67
A major limitation of this research, particularly the least cost method of fallowing
and the climatic scenarios is that there is an assumption of certainty in price and
production. Farmers cannot accurately know if prices and output will be high or low in a
given year, if they did, they could choose to fallow during the years they would produce a
loss without the Compact Water Bank.
Some of my assumptions simplify reality. My research used price and output data
for years of 1989-2007, and 2012, which generally have lower corn prices than today.
This year selection biases my model by showing that corn generates lower revenue than it
may actually produce. In addition, I did not have data on silage corn prices or on farm
employment. So I estimated these values. Although silage corn has the smallest irrigated
acreage of the three crops in Montrose County, this still influenced my choices on
fallowing in the least cost method. Data on yield from irrigated and non-irrigated land
was unavailable; thus, I assumed that irrigated acreage and non-irrigated acreage had the
same yield per acre. This assumption implies that there is no benefit to irrigating land in
the high desert, which is inaccurate. These estimations pose an accuracy problem to the
model. As a consequence, future research would benefit from better data that includes all
relevant information. A complete list of assumptions can be found in Appendix A.
There are several real aspects of farming that I was not able to incorporate in this
model, such as crop insurance and debt. If farmers’ losses in the worst case are
subsidized by crop insurance, then the benefits of fallowing are overstated. I was also
unable to show farmers paying off debt with lease payments in this model, which is a real
possibility from lease payments (Weber, 1989).

68
Closing Arguments
The Compact Water Bank can make Colorado and Montrose County indirectly
better off. If a Compact curtailment ever occurred, it would be essential to provide water
to Colorado’s cities because they would suddenly be unable to access over half of their
water resources (Steger, 2012). The Compact Water Bank’s rotational fallowing program
would be an excellent way to provide water in such an immediate shortage situation. The
Bank would allow water to rapidly change uses from agricultural to non-agricultural use,
which is not easy in Colorado’s slow moving water law.
The Compact Water Bank would likely benefit Montrose County. Irrigators
would be compensated for fallowing and the community would likely recover the lost
output, but the benefits would accrue to different sectors. If the Compact Water Bank
could predict which crops would have the lowest dollar value of output, then the forgone
output could be reduced. Although this study does not show how the Compact Water
Bank would exactly compensate the areas with lost output, the program would stimulate
consumption, which reduces indirect effects. This research does not definitively show
that the Compact Water Bank will benefit Montrose County in all scenarios, yet it
suggests that the Compact Water Bank would leave forage irrigation communities
indirectly better off.
69
References
Arkansas Basin Roundtable Water Transfer Guideline Committee. (2008).
Considerations for agriculture to urban water transfers, 28-46. Retrieved from:
http://cwi.colostate.edu/other_files/Ag_Urban_Report_Jan09.pdf
Bourgeon, J.M., Easter, W., Smith, R.B. (2008). Water markets and third-party effects.
American Journal of Agricultural Economics, 90(4), 902-917. Retrieved from:
http://ron-griffin.tamu.edu/x677/readings/BourgeonEtal2008.pdf
Brewer, J., Glennon, R., Ker, A., & Liebcap, G. (2006). 2006 presidential address water
markets in the west: prices trading and contractual forms. Economic Inquiry,
46(2), 91-112. Retrieved from:
http://fiesta.bren.ucsb.edu/~glibecap/Econ%20Inquiry.pdf
Brown, T.C. (2006). Trends in water market activity and price in the western United
States. Water Resources Research, 42(9). Retrieved from:
http://www.southernregion.fs.fed.us/rm/value/docs/trends_in_water_market_activ
ity.pdf
Colorado Department of Local Affairs. (2015). Economic Base Analysis [Data File].
Retrieved from: www.dola.colorado.gov/demog_webapps/ebaParameters.jsf
Colorado Foundation for Water Education. (2014). Citizen’s guide to Colorado’s
transbasin diversions. Retrieved from:
https://issuu.com/cfwe/docs/cfwe_cgtb_web
Colorado River Compact. (1922). Article III. Retrieved from:
https://www.usbr.gov/lc/region/pao/pdfiles/crcompct.pdf
Colorado State University Agricultural Extension. (2015). Crop enterprise budgets.
Retrieved from: http://www.coopext.colostate.edu/ABM/cropbudgets.shtml
Colorado River Water Conservation District. (2012). Colorado River water bank
feasibility study phase 1. Retrieved from:
http://www.coloradoriverdistrict.org/wp-content/uploads/2015/10/Water-Bank-
Phase-1-Report_Final-DRAFT_June-2012.pdf
Colorado River Water Conservation District. (2013). Colorado River water bank
feasibility study phase 2. Retrieved from:
http://www.coloradoriverdistrict.org/wp-content/uploads/2015/10/Water-Bank-
Phase-2-Report_Final-DRAFT_March-2013.pdf
Dalstead, Norman. (2016). Personal Communication to the Author. Grand Junction,
Colorado. January 22nd, 2016.

70
Dudley, S. C. (2004) The first five: a brief history of the Uncompahgre Project
(Gunnison). Retrieved from:
http://www.waterhistory.org/histories/reclamation/uncompahgre/
Garner, E. (2014). Region 10- why do demographics and the economy matter. Colorado
Department of Local Affairs. Retrieved from:
http://www.region10.net/download/DOLA%20-
%20Region%2010%20Demographics.pdf
Gelt, J. (1997). Sharing Colorado River water: history, public policy and the Colorado
River Compact. Arroyo, 10(1). Retrieved from:
https://wrrc.arizona.edu/publications/arroyo-newsletter/sharing-colorado-river-
water-history-public-policy-and-colorado-river
Hanson, B., Bali, K., Orloff, S., Sanden, B., & Putnam, D. (2008). How much water does
alfalfa really need? In Proceedings, 2008 California Alfalfa and forage
symposium and western seed conference, San Diego, CA. UC Cooperative
Extension, Plant Sciences Department, University of California, Davis, CA (Vol.
95616). Retrieved from:
http://alfalfa.ucdavis.edu/+symposium/proceedings/2008/08-265.pdf
Haddad, B.M. (2000) Rivers of gold: Designing water markets to allocate water in
California. Washington, D.C.: Island Press.
Hobbs, G., (2004). A citizen’s guide to Colorado water law. Colorado Foundation for
Water Education, 1-33. Retrieved from:
http://www.colorado.edu/geography/class_homepages/geog_4501_s14/readings/C
G-Law2004.pdf
Horowitz, K., & Planting, M. (2009). Concepts and Methods of the Input-Output
Accounts. United States Department of Commerce, Bureau of Economic
Analysis. Retrieved from: http://www.bea.gov/papers/pdf/IOmanual_092906.pdf.
Howe, C.W., (1998). Protecting public values under tradable water permit systems:
economic efficiency and equity issues. Institute of Behavioral Sciences, 1-26.
Retrieved from: http://www.colorado.edu/ibs/es/howe/chuck2.pdf
Howe, C.W., & Goemans, C. (2003) Water transfers and their impacts: lessons from
three Colorado water markets. Journal of American Water Resources Association
39(5). Retrieved from: http://onlinelibrary.wiley.com/doi/10.1111/j.1752-
1688.2003.tb03692.x/abstract
Howe, C.W., Lazo, J.R., Weber, K.R., The economic impacts of agriculture to urban
water transfers on the area of origin: a case study of the Arkansas river valley in
Colorado. American Journal of Agricultural Economics 74(5). Retrieved from:
http://www.jstor.org/stable/1242532?seq=1#page_scan_tab_contents

71
Hull, Charles. (2016). Personal Communication to the Author. Palo Verde Valley, CA.
February 7th, 2016.
Ivanenko, T., & Flynn, J.L. (2010). Estimated withdrawals and use of water in Colorado,
2005. U.S. Geological Survey Scientific Investigations Report 2010-5002, 1-61.
Retrieved from: http://pubs.usgs.gov/sir/2010/5002/pdf/SIR10-5002.pdf
Leontief, W. (1986). Input-output economics. New York: Oxford University Press.
Livingston, M.L. (1995). Designing water institutions: market failures and institutional
response. Water Resources Management, 9(3). 203-220. Retrieved from:
http://link.springer.com/article/10.1007%2FBF00872129
M. Cubed (2002) Socioeconomic assessment of the proposed Palo Verde irrigation
district land management , crop rotation and water supply program. Retrieved
from:
http://www.energy.ca.gov/sitingcases/sonoran/documents/intervenors/PVID_Soc
io_20020930.PDF
MacDonnell, L.J., & Rice, T.A. (2008) Moving agricultural water to cities: the search for
smarter approaches. Hastings West-Northwest Journal of Environmental Law &
Policy, 14. Retrieved from:
http://papers.ssrn.com/sol3/papers.cfm?abstract_id=2694100
MacDonnell, L.J., & Howe, C.W. (1986) Area-of-origin protection in transbasin
diversions: an evaluation of alternative approaches. University of Colorado law
review, 57. Retrieved from:
http://papers.ssrn.com/sol3/papers.cfm?abstract_id=2694114
MIG. (2015a). U.S data methods and sources. Retrieved from:
http://implan.com/index.php?option=com_content&view=article&id=414:414&ca
tid=163:knowledge-base&Itemid=1878#inter-institutional-transfer-information-
the-social-accounting-matrix
MIG. (2015b). General data information. Retrieved from
http://implan.com/index.php?option=com_content&view=article&id=413:413&ca
tid=163:knowledge-base
MIG. (2015c). The controlled vocabulary of IMPLAN-specific terms. Retrieved from
http://implan.com/index.php?option=com_glossary&id=127&Itemid=12
MIG. (2016) How to perform an analysis-by-parts (ABP) using IMPLAN pro. Retrieved
from: https://www.youtube.com/watch?v=ClqdO9-wqgU&feature=youtu.be
Miller, R. E., & Blair, P. D. (2009). Input-output analysis foundations and extensions.
Cambridge, UK: Cambridge University Press. Retrieved from:
72
http://systemsci.org/wp-content/uploads/group-documents/3/1367894155-input-
outputanalysis.pdf
McMahon, T., & Smith, M. (2012). The Arkansas Valley “super ditch” --- an analysis of
potential economic impacts. Journal of American Water Resources Association
49(1) 151-162. Retrieved from:
http://onlinelibrary.wiley.com/doi/10.1111/jawr.12005/epdf
McKean, J.R., Taylor, R.G, Alward, G. & Young, R.A (1998). Adapting synthesized
input-output models for small natural resource-based region: a case study. Society
& Natural Resources: an International Journal 11(4). 387-399. Retrieved from:
http://www.tandfonline.com/doi/abs/10.1080/08941929809381089
Montrose Chamber of Commerce (2015). Agricultural products and services. Retrieved
from: http://chamber.montrosechamber.com/list/category/agricultural-products-
services-5
Nennich, T., Hendrix, T. (2012). Determining a value for corn silage. Department of
Animal Sciences, Purdue University. Retrieved from:
https://www.extension.purdue.edu/dairy/articles/ValueCornSilage.pdf.
Palo Verde Valley Community Improvement Fund (2015). Retrieved from:
http://www.cif-blythe.com/
Schmit, T. M., Jablonski, B. R., & Kay, D. (2013). A practitioners guide to conducting an
economic impact assessment of regional food hubs using IMPLAN: a step-by-step
approach. Cornell University. Retrieved from:
http://apps.ams.usda.gov/MarketingPublicationSearch/Reports/stelprdc5110439.p
df
Steger, (2012). Denver water overview. Society of American Foresters. Retrieved from:
www.safcowy.org/pdfs/2012_cowysaf_am/Steger_Denver_Water_Overview.pdf
Taylor, R.G., Young, R.A., McKean, J.R. (1993) Economic impacts of agriculture-to-
urban water transfers: a case study of Crowley County, Colorado. Colorado
Water Research Resources Institute, 171. Retrieved from:
http://dspace.library.colostate.edu/webclient/DeliveryManager/digitool_items/cs
u01_storage/2008/09/03/file_2/15628
Thorvaldson, J., & Pritchett, J. (2006). Economic impact analysis of reduced acreage in
four river basins in Colorado. Colorado Water Resources Research Institute.
Retrieved from: http://cwrri.colostate.edu/publications/cr/207.pdf
Treese, C. (2015). Personal Communication to the Author. Glenwood Springs, CO.
November 16th, 2015.

73
United States Department of Agriculture. (2012). 2012 Census volume 1, chapter 1: state
level data, Colorado table 2 market value of agricultural products sold including
landlord’s share and direct sales: 2012 and 2007. Retrieved from:
http://www.agcensus.usda.gov/Publications/2012/Full_Report/Volume_1,_Chapte
r_1_State_Level/Colorado/st08_1_002_002.pdf
United States Department of Agriculture. (2016). National agricultural statistics service:
quick stats. Retrieved from: http://quickstats.nass.usda.gov/.
United States Department of Commerce. (2014). QuickFacts Montrose County Colorado.
Retrieved from: http://www.census.gov/quickfacts/table/PST045215/08085
United States Bureau of Reclamation. (2012). Colorado river basin water supply and
demand study Executive Summary, p. 1-6. Retrieved from:
http://www.usbr.gov/lc/region/programs/crbstudy/finalreport/Executive%20Sum
mary/CRBS_Executive_Summary_FINAL.pdf
United States Bureau of Reclamation. (2016). Glen Canyon dam. Retrieved from:
http://www.usbr.gov/uc/water/crsp/cs/gcd.html
Upper Basin Compact. (1948). Article IV. Retrieved from:
https://www.usbr.gov/lc/region/pao/pdfiles/ucbsnact.pdf
Vanderschure, W. (N.d). Development of new water resources. Interdisciplinary Water
Resources Seminar. Retrieved from:
http://www.cwi.colostate.edu/old/GRAD592/10-29-
Wayne%20Vanderschuere(handouts).pdf
Weber, K.R. (1989). What becomes of farmers who sell their irrigation water?: the case
of water sales in Crowley County, Colorado. Unpublished Paper 1-37.
Willis, D., & Holland, D. (1997). Translating farm enterprise budgets into input output
accounts: another example from Washington state. Department of Agricultural
Economics, Washington State University. Retrieved from:
http://www.agribusiness-
mgmt.wsu.edu/Holland_model/docs/FarmEnterpriseBudgetsIO.pdf.
Young, R.A. (1986). Why are there so few transactions among water users? American
Journal of Agricultural Economics, 68(3). 1143-1151. Retrieved from:
http://www.jstor.org/stable/1241865?seq=1#page_scan_tab_contents
Young, R.A. (2003). Determining the economic value of water: Concepts and methods.
Washington, D.C.: Resources for the Future.

74
Appendix A: List of Assumptions
Constant returns to scale.
No supply constraints.
Fixed input structure
Industry technology assumption
Commodity technology assumption
Static model
Homogenous yield per acre, output for each acre of a particular crop has
the same output as all other acres.
All farms are sole proprietorships that are owned and operated by a single
farmer. Farmers hire additional labor according to Dr. Dalstead’s fixed
proportions.
Farmers are price takers.
The price of silage corn is equal to the price of grain corn multiplied by
eight. (Nennich & Hendrix, 2012)
Fallowing in a situation that would generate a loss from irrigation is
assumed to be proprietor income.
All of Montrose County is at the town of Montrose’s elevation