Embed Size (px)
Citation preview
The pharmaceutical industry is facing unprecedented challenges to its business model. Experienced observers and industry analysts have even predicted its imminent demise1–3. Over the past decade, serious concerns about the industry’s integrity and transparency — for example, around drug safety and efficacy — have been raised, compromising the industry’s image, and resulting in increased regulatory scrutiny4,5. This erosion in confi-dence in the industry and its products has resonated poorly with patients, health-care professionals, payers and shareholders. Indeed, the industry’s price/earnings ratio, a measure of the current valuation of the industry, has decreased below that of the S&P 500 index and has remained more or less flat, as have share prices for the past 7 years.
The industry’s profitability and growth prospects are also under pressure as healthcare budgets become increasingly strained. Generic drugs, although clearly helping to keep drug prices in check, are currently approaching 70% of all prescriptions written in the United States6. Moreover, key patent expirations between 2010–2014 have been estimated to put more than US$209 billion in annual drug sales at risk, resulting in $113 billion of sales being lost to generic substitution7. Indeed, for every dollar lost in declining product revenues due
to patent expirations by 2012, it has been estimated that large-cap pharmaceutical companies will only be able to replace on average 26 cents with new product revenues8.
Simply stated, without a dramatic increase in R&D productivity, today’s pharmaceutical industry cannot sustain sufficient innovation to replace the loss of rev-enues due to patent expirations for successful products. A key aspect of this problem is the decreasing number of truly innovative new medicines approved by the US Food and Drug Administration (FDA) and other major regulatory bodies around the world over the past 5 years (in which 50% fewer new molecular entities (NMEs) were approved compared with the previous 5 years)9. In 2007, for example, only 19 NMEs (including biologics) were approved by the FDA, the fewest number of NMEs approved since 1983, and the number rose only slightly to 21 in 2008. Of the 21 new drugs approved by the FDA in 2008, only 6 were developed by the 15 largest pharmaceutical companies and only 29% would be considered ‘first-in-class’ medicines. In 2009, 24 new drugs were approved, 10 of which were devel-oped by large pharmaceutical companies and only 17% of which could be considered first-in-class. Some have argued that the number of approved ‘mechanistically
Lilly Research Laboratories, Eli Lilly and Company, Lilly Corporate Center, Indianapolis, Indiana 46285, USA. Correspondence to: S.M.P. e-mail: [email protected]:10.1038/nrd3078 Published online 19 February 2010
New molecular entity(NME). A medication containing an active ingredient that has not been previously approved for marketing in any form in the United States. NME is conventionally used to refer only to small-molecule drugs, but in this article we use the term as a shorthand to refer to both new chemical entities and new biologic entities.
How to improve R&D productivity: the pharmaceutical industry’s grand challengeSteven M. Paul, Daniel S. Mytelka, Christopher T. Dunwiddie, Charles C. Persinger, Bernard H. Munos, Stacy R. Lindborg and Aaron L. Schacht
Abstract | The pharmaceutical industry is under growing pressure from a range of environmental issues, including major losses of revenue owing to patent expirations, increasingly cost-constrained healthcare systems and more demanding regulatory requirements. In our view, the key to tackling the challenges such issues pose to both the future viability of the pharmaceutical industry and advances in healthcare is to substantially increase the number and quality of innovative, cost-effective new medicines, without incurring unsustainable R&D costs. However, it is widely acknowledged that trends in industry R&D productivity have been moving in the opposite direction for a number of years. Here, we present a detailed analysis based on comprehensive, recent, industry-wide data to identify the relative contributions of each of the steps in the drug discovery and development process to overall R&D productivity. We then propose specific strategies that could have the most substantial impact in improving R&D productivity.
AnAlysIs
NATURE REvIEwS | Drug Discovery vOlUME 9 | MARch 2010 | 203
© 20 Macmillan Publishers Limited. All rights reserved10
innovative’ and first-in-class NMEs have remained stable at about 5–6 per year. however, the number of potential revenue-generating drugs (innovative or other wise) as a percentage of R&D expenditures has undeniably fallen sharply.
with an estimated $50 billion in collective annual R&D spending by the large pharmaceutical companies, and appropriate allocation over time to the successful discovery and development of NMEs, the average cost for these companies to bring an NME to market is now estimated to be approximately $1.8 billion (see below for details underlying this estimate), and is rising rapidly. Moreover, there is little evidence that the average costs of successfully launching an NME vary significantly between large pharmaceutical or small biotechnology companies10,11.
Although R&D productivity has been declining for a number of years2, the unprecedented combina-tion of reduced R&D output in the form of success-fully launched truly innovative NMEs, coupled with diminishing market exclusivity for recently launched new medicines and the huge loss of revenues owing to generic competition over the next decade, suggest that we may be moving closer to a pharmaceutical ‘ice age’ and the potential extinction of the industry, at least as it exists today12,13. Although this might be welcomed by the industry’s critics, the impact on the health and well-being of patients owing to delayed or even lost opportunities to introduce the next generation of innovative medicines could be devastating. In this regard, we underscore the findings of lichtenberg14 on the effects of medical inno-vation (including controls for the impact of obesity and income), which indicate that ~40% of the 2-year increase in life expectancy measured from 1986–2000 can be attributed to the introduction and use of new drugs. It took approximately 3 years for NME launches to have their maximal impact on longevity — this effect was not observed for non-NME (older) drugs. One can only speculate as to the impact on longevity and quality of life that new drugs now in clinical development for cancer and Alzheimer’s disease might have. without these new medicines, and given the rise in diseases such as diabetes and childhood obesity, it is possible that life expectancy may actually decrease over time15.
Among all the challenges faced by the pharmaceutical industry, we argue that improving R&D productivity remains the most important. The environmental factors that are reducing the industry’s profitability can only be mitigated by substantially and sustainably increas-ing the number and quality of innovative, as well as cost-effective, new medicines; but only if accomplished at reasonable R&D costs. So, the key questions are where, how and by how much can R&D productivity be improved? here, we present a detailed analysis of R&D productivity by first defining and modelling the essential elements of contemporary drug discovery and development that account for the current cost of a new medicine, and discuss the rate-limiting steps of the R&D process that are contributing to reduced R&D productivity. we then propose, and illustrate, ways to improve these factors.
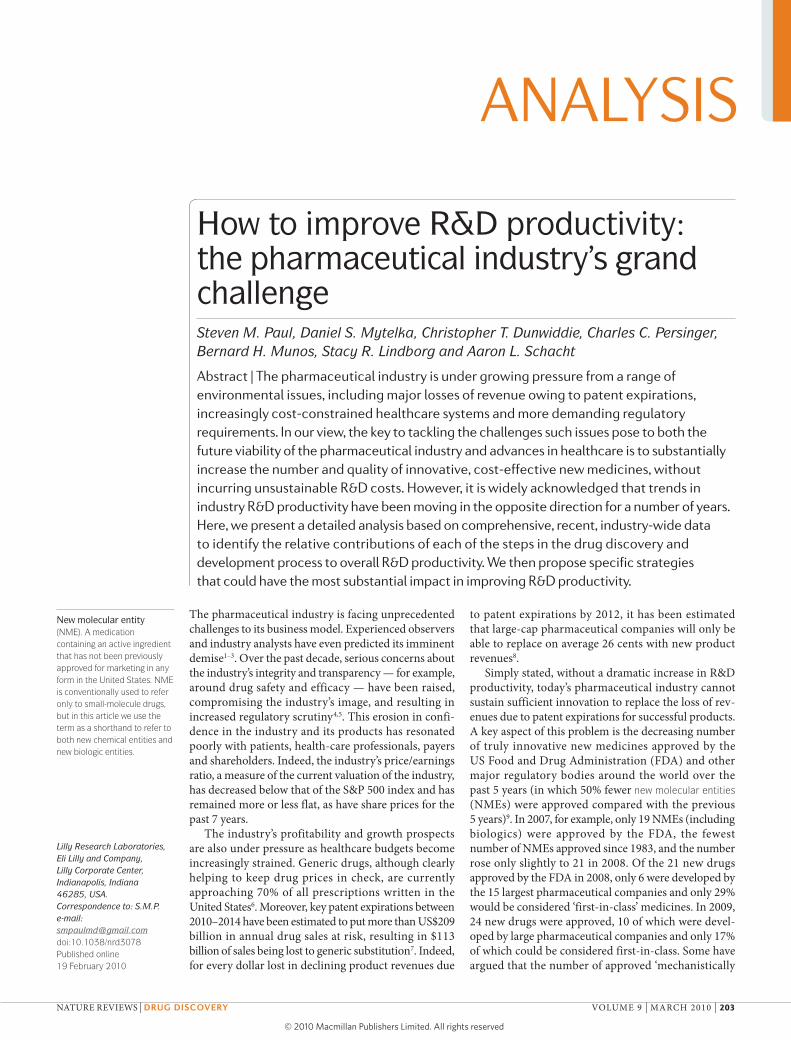
How do we define R&D productivity?R&D productivity can be simply defined as the relation-ship between the value (medical and commercial) created by a new medicine (considered here to be an NME) and the investments required to generate that medicine. however, R&D productivity can in our view best be elaborated in two important dimensions: inputs leading to outputs, or R&D efficiency; and outputs leading to outcomes, or R&D effectiveness (FIG. 1).
R&D efficiency represents the ability of an R&D system to translate inputs (for example, ideas, invest-ments, effort) into defined outputs (for example, inter-nal milestones that represent resolved uncertainty for a given project or product launches), generally over a defined period of time. If launching (gaining regulatory approval and commercializing) an NME is the desired output, how can this be achieved with greater efficiency (that is, at a lower cost)?
R&D effectiveness can be defined as the ability of the R&D system to produce outputs with certain intended and desired qualities (for example, medical value to patients, physicians and payers, and substantial com-mercial value). Thus, R&D productivity can be viewed as an aggregate representation of both the efficiency and effectiveness of the drug discovery and development process; the goal of a highly productive R&D system is to efficiently translate inputs into the most desired and valuable outputs. For a more detailed description of these definitions, see Supplementary information S1 (box). with this definition of R&D productivity in mind, we have further adapted a productivity relationship or ‘pharmaceutical value equation’, which includes the key elements that determine both the efficiency and effec-tiveness of the drug discovery and development process for any given pipeline (see equation 1).
Nature Reviews | Drug Discovery
P α (1)WIP × p(TS) × V
CT × C
R&D productivity (P) can be viewed as a function of the elements comprising the numerator — the amount of scientific and clinical research being conducted simul-taneously, designated here as the work in process (WIP), the probability of technical success (p(TS)) and the value (V) — divided by the elements in the denominator, the cycle time (CT) and cost (C). Each of these parameters can be conceptualized and analyzed on a per project basis (for example, a single drug candidate or WIP = 1) or collectively as a larger portfolio or pipeline of projects or drug candidates. In general, increasing the numerator relative to the denominator will increase productivity and vice versa. Thus, if one could increase the p(TS) (that is, reduce attrition) for any given drug candidate or ideally for a portfolio of drug candidates at a given phase of development, P would increase accordingly. Similarly, for any given level of R&D investment, sub-stantially reducing CT or lowering C (such as unit costs) would increase P.
however, most of the elements comprising equa-tion 1 are inextricably linked to one another and changing one element can often adversely or beneficially affect
A n A ly s i s
204 | MARch 2010 | vOlUME 9 www.nature.com/reviews/drugdisc
© 20 Macmillan Publishers Limited. All rights reserved10
Nature Reviews | Drug Discovery
Inputs
R&D efficiencyMore affordable drugsvia less costly R&D
R&D effectivenessMore value for the patientvia innovative drugs withhigh-quality information
Outputs Outcomes
Cost per launch Value per launch
Capitalized costThis is the out-of-pocket cost corrected for cost of capital, and is the standard accounting treatment for long-term investments. It recognizes the fact that investors require a return on research investments that reflects alternative potential uses of their investment. So, the capitalized cost per drug launch increases out-of-pocket costs by the cost of capital for every year from expenditure to launch.
Out-of-pocket costThis is the total cost required to expect one drug launch, taking into account attrition, but not the cost of capital.
Cost of capitalThis is the annual rate of return expected by investors based on the level of risk of the investment.
another. For example, as discussed below, having suf-ficient pipeline WIP (by phase of development) is crucial given the substantial phase-specific attrition rates. however, increasing WIP (especially late-phase WIP) alone will undoubtedly increase C and may also increase CT, which could further reduce P and diminish productivity.
Finally, although carrying out definitive health out-come studies on late-stage compounds before approval is often highly desirable and increasingly necessary to unequivocally demonstrate value (V) for reimbursement purposes, such studies can substantially increase CT and C, thus also diminishing P. Nevertheless, such studies will also increase V, potentially offsetting any decrease, or even increasing, P.
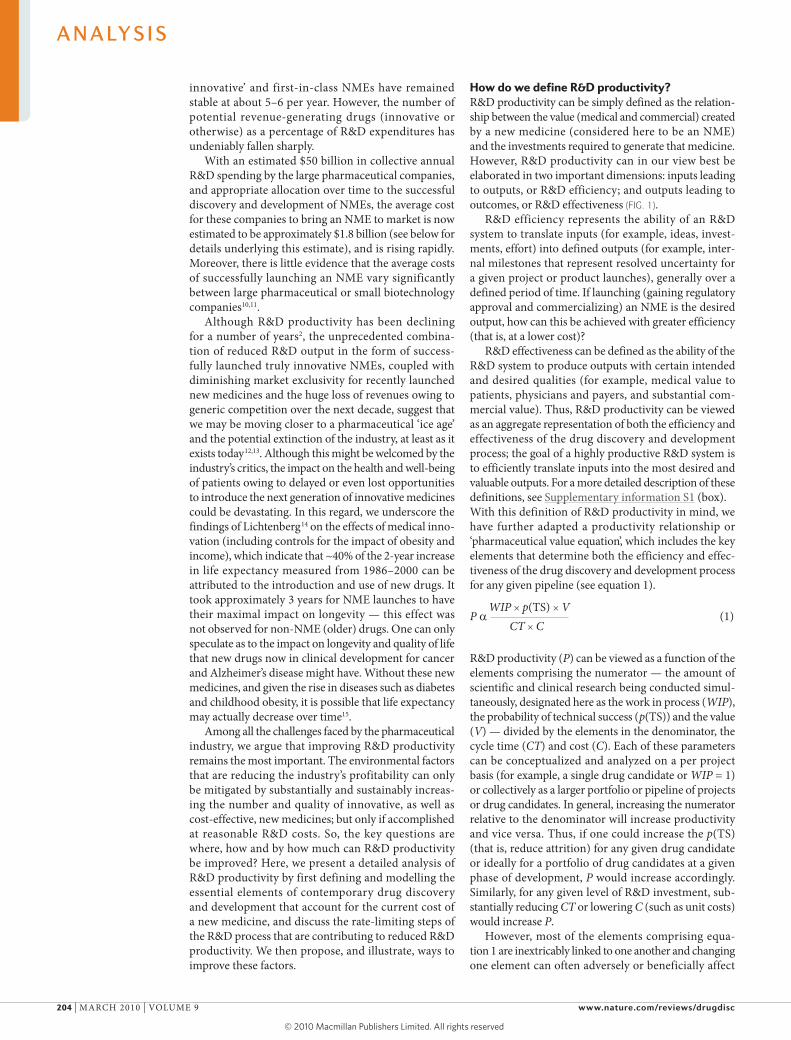
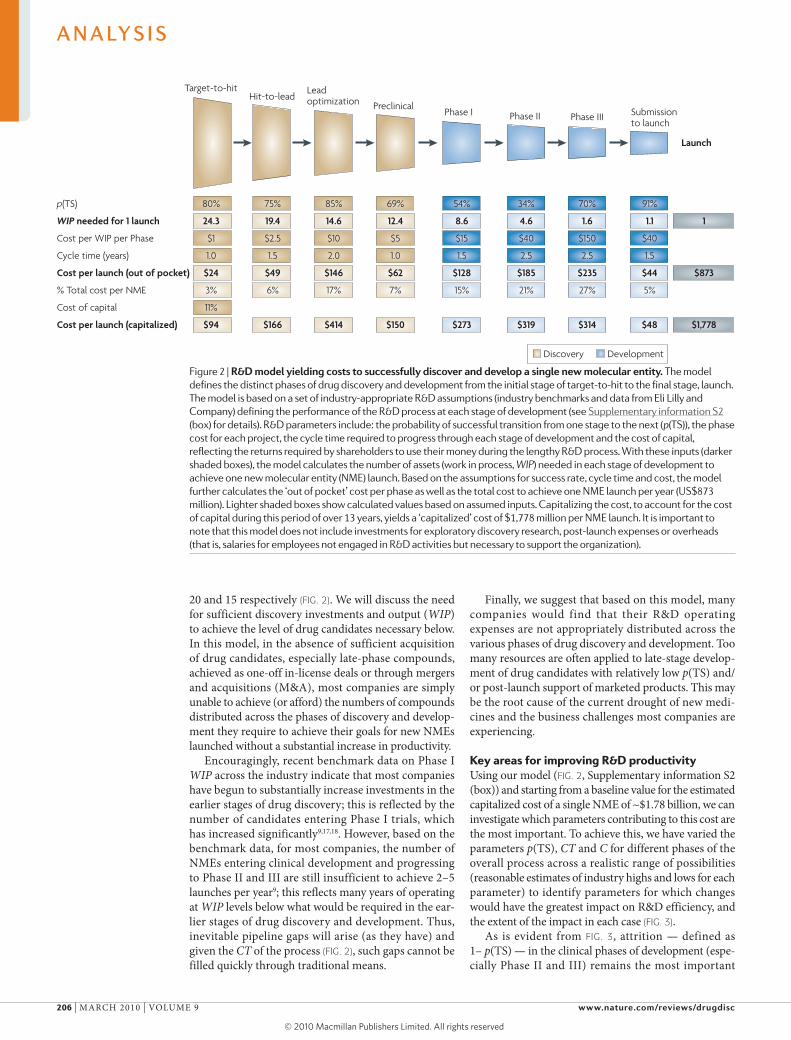
A model of R&D productivityTo inform efforts to increase R&D productivity (P), the key questions include: which of the associated elements have the greatest impact; how might they be improved; and by what magnitude? To help address these questions, we have built an economic model of drug discovery and development which, using industry-appropriate assump-tions, provides the basis for our estimate that the fully capitalized cost of an average NME developed by a typi-cal large pharmaceutical company is currently ~$1.8 billion) (see Supplementary information S2 (box) for details). The model has been constructed using recently available R&D performance productivity data from a group of 13 large pharmaceutical companies, provided by the Pharmaceutical Benchmarking Forum (PBF)16 (see Supplementary information S3 (box)), as well as our own internal data, to closely approximate the key elements of our productivity relationship that underlie R&D efficiency — C, WIP, CT and p(TS) — for each phase of discovery and development (FIG. 2).
we recognize that the estimated cost per NME is highly dependent on a number of economic or financial assumptions. consequently, for our estimated cost of an NME we show both ‘out of pocket’ and ‘capitalized’ costs using a cost of capital of 11% (FIG. 2). Our estimate repre-sents ‘molecule only’ costs and does not include the costs
of exploratory discovery research (target identification and validation) or other ‘non-molecule’ costs (which include overheads, such as salaries for employees that are not engaged in research and development activities but that are otherwise necessary to support the R&D organization; these represent approximately 20–30% of total costs). we discuss comparisons of our estimates with other reported estimates in Supplementary infor-mation S2 (box). however, for modelling purposes, the exact cost per NME is not crucial as long as our assump-tions for each parameter in our model are consistent and represent reasonable estimates. Each R&D organization can (and should) build a similar model based on their own data, which may vary from company to company.
The exact output of the model — the desired number of new launches (and the estimated commercial value per launch) — will depend on business aspirations, ther-apeutic focus and absolute level of R&D investments of a given company. Nonetheless, based on our model, a few key observations can be made.
First, clinical development (Phases I–III) accounts for approximately 63% of the costs for each NME launched (53% from Phase II to launch), and preclinical drug dis-covery accounts for 32%. however, this represents an underestimate of the costs for drug discovery, as we have excluded from our model the earliest phase of discovery research; that is, that prior to target selection. This is because the research required to identify and validate a given target is highly variable, making the underlying parameters difficult to quantify. however, target selec-tion may well be one of the most important determinants of attrition (p(TS)) and thus overall R&D productivity (discussed below).
Second, based on realistic and current assumptions on C, CT, p(TS) and WIP, only 8% of NMEs will success-fully make it from the point of candidate selection (pre-clinical stage) to launch (FIG. 2). It has been suggested that new biologic drugs have a higher probability of launch than small-molecule drugs9,11. For the purposes of our model, we have used 7% for small-molecule drugs and 11% for biologics.
Third, the process of discovering and developing an NME on average required approximately 13.5 years (CT) in 2007 (yearly averages ranged from 11.4 to 13.5 using the PBF study data across 2000–2007). This includes regulatory review but not the time it takes to fully identify and validate a drug target16.
Fourth, based on our model, the number of mol-ecules entering clinical development every year must be approximately 9 (or 11 if all small molecules) to yield a single NME launch per year. Most large companies aspire for 2–5 launches per year and therefore 18–45 Phase I starts (and resulting WIP) would be required annually. however, such numbers are rarely, if ever, achieved even in very large companies. If sustained over several years, this WIP deficit will result in a substantial pipeline gap. If it takes approximately 9 Phase I drug candidates annually to launch 1 NME per year and if these derive exclusively from a given company’s internal discovery efforts, then the number of discovery projects (WIP) from target-to-hit, hit-to-lead and lead optimization is approximately 25,
Figure 1 | Dimensions of r&D productivity. To improve R&D productivity, it is crucial to understand the interdependencies between inputs (for example, R&D investments), output (for example, new molecular entity launches) and outcomes (for example, valued outcomes for patients). This figure outlines the key dimensions of R&D productivity and the goals tied to R&D efficiency and effectiveness. An effective R&D productivity strategy must encompass both of these components. Value will be created by delivering innovative products with high-quality information.
A n A ly s i s
NATURE REvIEwS | Drug Discovery vOlUME 9 | MARch 2010 | 205
© 20 Macmillan Publishers Limited. All rights reserved10
Nature Reviews | Drug Discovery
Launch
p(TS)
WIP needed for 1 launch
Cost per WIP per Phase
Cycle time (years)
Cost per launch (out of pocket)
% Total cost per NME
Cost of capital
Cost per launch (capitalized)
Target-to-hit
80%
24.3
$1
1.0
$24
3%
11%
$94
Hit-to-lead
75%
19.4
$2.5
1.5
$49
6%
$166
Leadoptimization
85%
14.6
$10
2.0
$146
17%
$414
Phase I
54%
8.6
$15
1.5
$128
15%
$273
Phase II
34%
4.6
$40
2.5
$185
21%
$319
Phase III
70%
1.6
$150
2.5
$235
27%
$314
Submissionto launch
91%
1.1
$40
1.5
$44
5%
$48
1
$873
$1,778
Preclinical
69%
12.4
$5
1.0
$62
7%
$150
Discovery Development
20 and 15 respectively (FIG. 2). we will discuss the need for sufficient discovery investments and output (WIP) to achieve the level of drug candidates necessary below. In this model, in the absence of sufficient acquisition of drug candidates, especially late-phase compounds, achieved as one-off in-license deals or through mergers and acquisitions (M&A), most companies are simply unable to achieve (or afford) the numbers of compounds distributed across the phases of discovery and develop-ment they require to achieve their goals for new NMEs launched without a substantial increase in productivity.
Encouragingly, recent benchmark data on Phase I WIP across the industry indicate that most companies have begun to substantially increase investments in the earlier stages of drug discovery; this is reflected by the number of candidates entering Phase I trials, which has increased significantly9,17,18. however, based on the benchmark data, for most companies, the number of NMEs entering clinical development and progressing to Phase II and III are still insufficient to achieve 2–5 launches per year9; this reflects many years of operating at WIP levels below what would be required in the ear-lier stages of drug discovery and development. Thus, inevitable pipeline gaps will arise (as they have) and given the CT of the process (FIG. 2), such gaps cannot be filled quickly through traditional means.
Finally, we suggest that based on this model, many companies would find that their R&D operating expenses are not appropriately distributed across the various phases of drug discovery and development. Too many resources are often applied to late-stage develop-ment of drug candidates with relatively low p(TS) and/or post-launch support of marketed products. This may be the root cause of the current drought of new medi-cines and the business challenges most companies are experiencing.
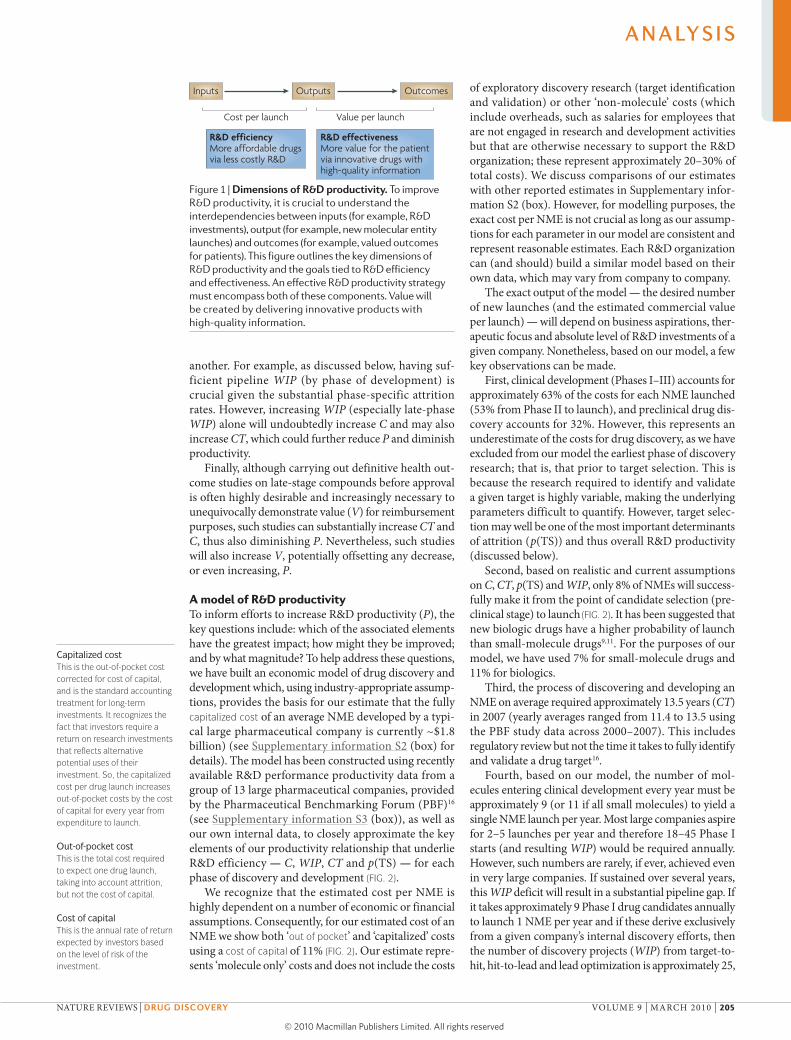
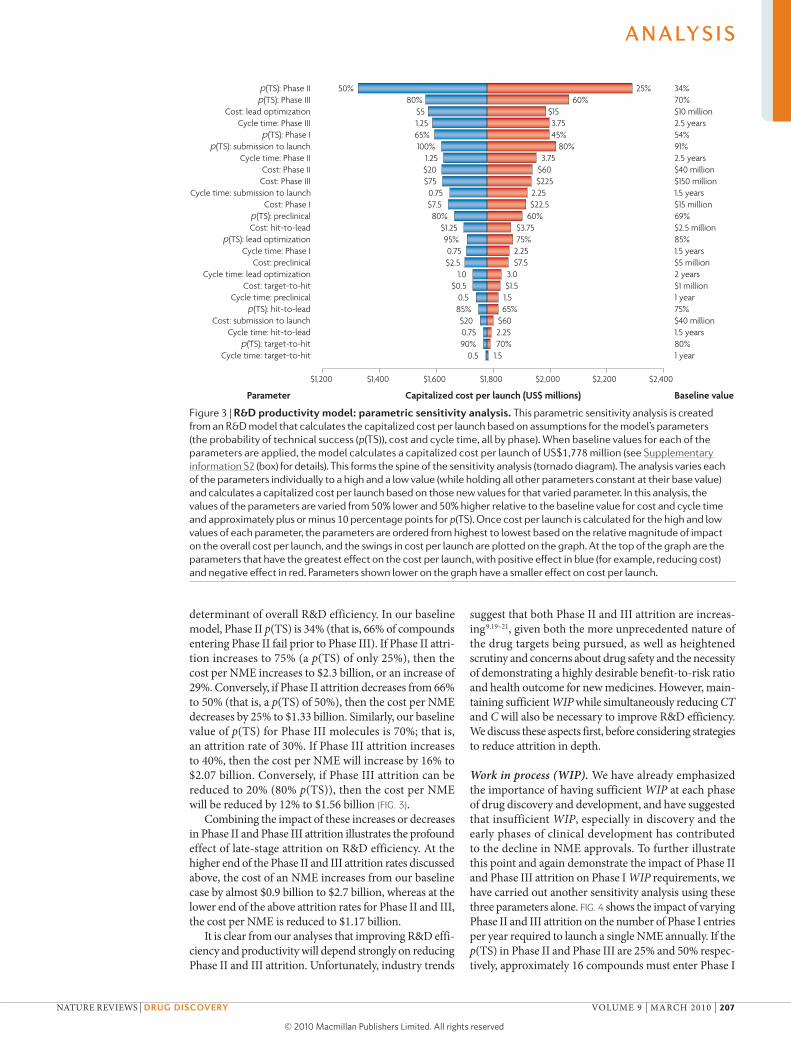
Key areas for improving R&D productivityUsing our model (FIG. 2, Supplementary information S2 (box)) and starting from a baseline value for the estimated capitalized cost of a single NME of ~$1.78 billion, we can investigate which parameters contributing to this cost are the most important. To achieve this, we have varied the parameters p(TS), CT and C for different phases of the overall process across a realistic range of possibilities (reasonable estimates of industry highs and lows for each parameter) to identify parameters for which changes would have the greatest impact on R&D efficiency, and the extent of the impact in each case (FIG. 3).
As is evident from FIG. 3, attrition — defined as 1– p(TS) — in the clinical phases of development (espe-cially Phase II and III) remains the most important
Figure 2 | r&D model yielding costs to successfully discover and develop a single new molecular entity. The model defines the distinct phases of drug discovery and development from the initial stage of target-to-hit to the final stage, launch. The model is based on a set of industry-appropriate R&D assumptions (industry benchmarks and data from Eli lilly and Company) defining the performance of the R&D process at each stage of development (see supplementary information s2 (box) for details). R&D parameters include: the probability of successful transition from one stage to the next (p(Ts)), the phase cost for each project, the cycle time required to progress through each stage of development and the cost of capital, reflecting the returns required by shareholders to use their money during the lengthy R&D process. With these inputs (darker shaded boxes), the model calculates the number of assets (work in process, WIP) needed in each stage of development to achieve one new molecular entity (nME) launch. Based on the assumptions for success rate, cycle time and cost, the model further calculates the ‘out of pocket’ cost per phase as well as the total cost to achieve one nME launch per year (Us$873 million). lighter shaded boxes show calculated values based on assumed inputs. Capitalizing the cost, to account for the cost of capital during this period of over 13 years, yields a ‘capitalized’ cost of $1,778 million per nME launch. It is important to note that this model does not include investments for exploratory discovery research, post-launch expenses or overheads (that is, salaries for employees not engaged in R&D activities but necessary to support the organization).
A n A ly s i s
206 | MARch 2010 | vOlUME 9 www.nature.com/reviews/drugdisc
© 20 Macmillan Publishers Limited. All rights reserved10
Nature Reviews | Drug Discovery
p(TS): Phase IIp(TS): Phase III
Cost: lead optimizationCycle time: Phase III
p(TS): Phase Ip(TS): submission to launch
Cycle time: Phase IICost: Phase IICost: Phase III
Cycle time: submission to launchCost: Phase I
p(TS): preclinicalCost: hit-to-lead
p(TS): lead optimizationCycle time: Phase I
Cost: preclinicalCycle time: lead optimization
Cost: target-to-hitCycle time: preclinical
p(TS): hit-to-leadCost: submission to launch
Cycle time: hit-to-leadp(TS): target-to-hit
Cycle time: target-to-hit
34%70%$10 million2.5 years54%91%2.5 years$40 million$150 million1.5 years$15 million69%$2.5 million85%1.5 years$5 million2 years$1 million1 year75%$40 million1.5 years80%1 year
Capitalized cost per launch (US$ millions)
$1,200 $1,400 $1,600 $1,800 $2,000 $2,200 $2,400
Parameter Baseline value
25%60%
$153.7545%
80%3.75
$60$225
2.25$22.5
60%$3.7575%
2.25$7.5
3.0$1.51.565%
$602.2570%
1.5
50%80%
$51.2565%100%
1.25$20$750.75$7.580%
$1.2595%0.75$2.5
1.0$0.5
0.585%$200.7590%
0.5
determinant of overall R&D efficiency. In our baseline model, Phase II p(TS) is 34% (that is, 66% of compounds entering Phase II fail prior to Phase III). If Phase II attri-tion increases to 75% (a p(TS) of only 25%), then the cost per NME increases to $2.3 billion, or an increase of 29%. conversely, if Phase II attrition decreases from 66% to 50% (that is, a p(TS) of 50%), then the cost per NME decreases by 25% to $1.33 billion. Similarly, our baseline value of p(TS) for Phase III molecules is 70%; that is, an attrition rate of 30%. If Phase III attrition increases to 40%, then the cost per NME will increase by 16% to $2.07 billion. conversely, if Phase III attrition can be reduced to 20% (80% p(TS)), then the cost per NME will be reduced by 12% to $1.56 billion (FIG. 3).
combining the impact of these increases or decreases in Phase II and Phase III attrition illustrates the profound effect of late-stage attrition on R&D efficiency. At the higher end of the Phase II and III attrition rates discussed above, the cost of an NME increases from our baseline case by almost $0.9 billion to $2.7 billion, whereas at the lower end of the above attrition rates for Phase II and III, the cost per NME is reduced to $1.17 billion.
It is clear from our analyses that improving R&D effi-ciency and productivity will depend strongly on reducing Phase II and III attrition. Unfortunately, industry trends
suggest that both Phase II and III attrition are increas-ing9,19–21, given both the more unprecedented nature of the drug targets being pursued, as well as heightened scrutiny and concerns about drug safety and the necessity of demonstrating a highly desirable benefit-to-risk ratio and health outcome for new medicines. however, main-taining sufficient WIP while simultaneously reducing CT and C will also be necessary to improve R&D efficiency. we discuss these aspects first, before considering strategies to reduce attrition in depth.
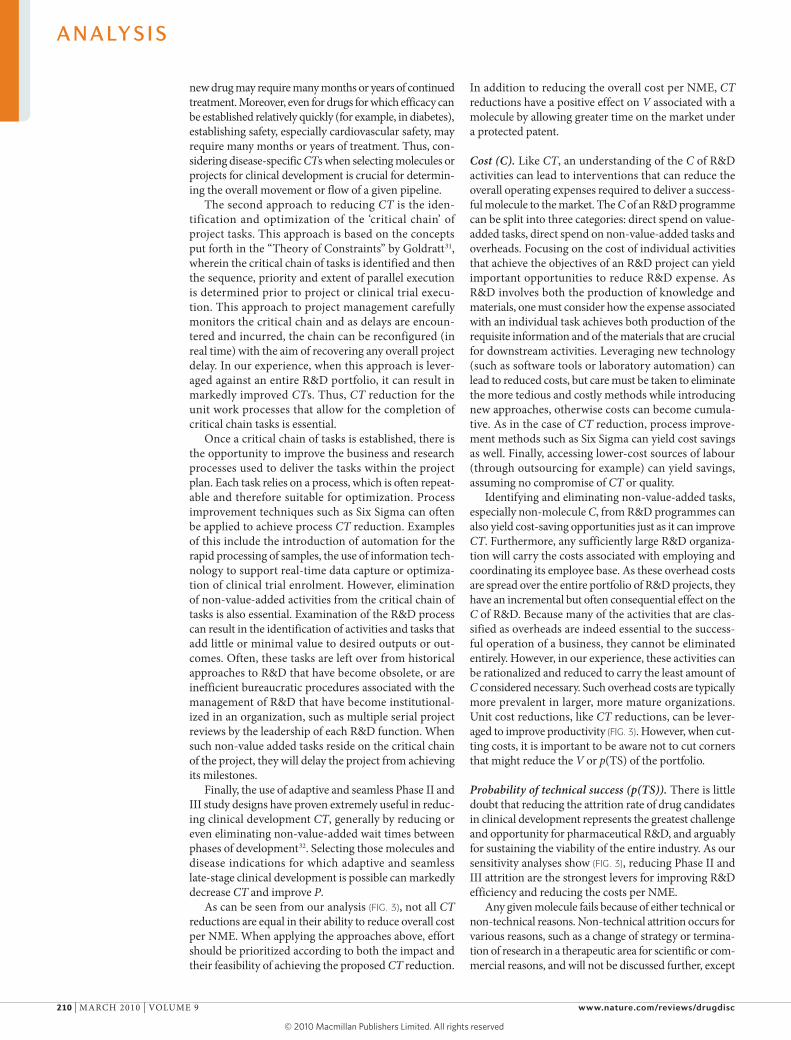
Work in process (WIP). we have already emphasized the importance of having sufficient WIP at each phase of drug discovery and development, and have suggested that insufficient WIP, especially in discovery and the early phases of clinical development has contributed to the decline in NME approvals. To further illustrate this point and again demonstrate the impact of Phase II and Phase III attrition on Phase I WIP requirements, we have carried out another sensitivity analysis using these three parameters alone. FIG. 4 shows the impact of varying Phase II and III attrition on the number of Phase I entries per year required to launch a single NME annually. If the p(TS) in Phase II and Phase III are 25% and 50% respec-tively, approximately 16 compounds must enter Phase I
Figure 3 | r&D productivity model: parametric sensitivity analysis. This parametric sensitivity analysis is created from an R&D model that calculates the capitalized cost per launch based on assumptions for the model’s parameters (the probability of technical success (p(Ts)), cost and cycle time, all by phase). When baseline values for each of the parameters are applied, the model calculates a capitalized cost per launch of Us$1,778 million (see supplementary information s2 (box) for details). This forms the spine of the sensitivity analysis (tornado diagram). The analysis varies each of the parameters individually to a high and a low value (while holding all other parameters constant at their base value) and calculates a capitalized cost per launch based on those new values for that varied parameter. In this analysis, the values of the parameters are varied from 50% lower and 50% higher relative to the baseline value for cost and cycle time and approximately plus or minus 10 percentage points for p(Ts). Once cost per launch is calculated for the high and low values of each parameter, the parameters are ordered from highest to lowest based on the relative magnitude of impact on the overall cost per launch, and the swings in cost per launch are plotted on the graph. At the top of the graph are the parameters that have the greatest effect on the cost per launch, with positive effect in blue (for example, reducing cost) and negative effect in red. Parameters shown lower on the graph have a smaller effect on cost per launch.
A n A ly s i s
NATURE REvIEwS | Drug Discovery vOlUME 9 | MARch 2010 | 207
© 20 Macmillan Publishers Limited. All rights reserved10

Nature Reviews | Drug Discovery
Phas
e I e
ntrie
s (F
HD
s)
20
18
16
14
12
10
8
2
4
6
015 20 25 30 35 40 45 50 55 60 65
Phase II p(TS) (%)
25%
50%
Phase III p(TS) (%)
50%60%70%80%90%Estimate used
in the model
trials each year to yield 1 NME launch. This number decreases proportionately as the rates of Phase II and III attrition decline (FIG. 4). Increasing Phase II and III p(TS) to 50% and 80%, respectively, reduces the number of Phase I entries needed per year by almost two thirds. In other words, and everything else being equal, the same overall R&D investment should yield 2–3 times the number of NMEs at these lower attrition rates.
however, just increasing WIP alone without having sufficient development capacity will probably have a highly deleterious effect on CT. little’s law22, which relates the throughput or flow of a given project to WIP and CT, posits that too much WIP will result in increased CT, especially if development resources become rate-limiting. The ability and need to accurately estimate the development resources required (capacity management) and to carefully and optimally balance WIP throughout the phases of drug discovery and development must be emphasized (see Bunch & Schacht23 for a discussion on capacity management). In the absence of a substantial reduction in attrition, pharmaceutical companies must find more affordable means to increase early-stage WIP and to expeditiously advance these drug candidates through the development stages.
how can pharmaceutical companies substantially increase their pipeline WIP without dramatically increasing C? First, there must be sufficient WIP in the early stages of drug discovery, and especially early drug development (as outlined above). Funding these early-stage (Phase I and II) compounds, especially in the num-bers indicated by our model, must come in part from reducing investments in late-stage development, ideally by redirecting resources from molecules destined to fail
in Phase III (or even Phase Iv). Given the C and CT of a single Phase III unit of WIP ($150 million), almost 10 Phase I molecules ($15 million) can be developed for the same cost, ideally through to proof-of-concept (POc; see discussion of p(TS) below). Reducing late-phase attrition through early POc studies (ideally in Phase I) is therefore crucial to implement this partial solution. The resources (C) saved by lowering Phase III attrition, however, must be redirected to fund sufficient discovery and Phase I/II WIP. Most importantly, advancement into Phase III should be pursued only for those compounds with established efficacy (ideally POc in Phase I and confirmed in Phase II) and a well-defined margin of safety. Ideally, attrition in Phase III should be due pri-marily to the emergence of relatively rare and unforeseen adverse events. Thus, the key is to have sufficient WIP in the early phases of clinical development to effectively triage and select molecules that will have a higher p(TS) in late-stage development.
The question of how to affordably increase WIP, p(TS) and V without substantially increasing C or increasing CT due to capacity constraints and lack of focus is in our view paramount to improve R&D pro-ductivity. This could be accomplished by transforming the R&D enterprise from one that is predominantly ‘owned’, operated and fully controlled by a given com-pany (Fully Integrated Pharmaceutical company or FIPco) to one that is highly networked, partnered and leveraged (Fully Integrated Pharmaceutical Network or FIPNet). Traditionally, large pharmaceutical companies have pursued the discovery, development, manufacture and commercialization of their medicines largely by owning and controlling each component. In part, past reliance on the FIPco model was as much a necessity as a choice. Today, however, the opportunity to partner virtually all elements of R&D through a coordinated and global network or FIPNet could (if effectively managed) substantially improve R&D productivity by affordably enhancing the pipeline from early discovery through to launch. A FIPNet will theoretically allow greater access to intellectual property, molecules, capabilities, capital, knowledge and, of course, talent24–26. Thus, operated as a FIPNet, a given R&D organization will be able to ‘play bigger than its size’ and better leverage its resources to increase WIP across the pipeline, as long as the costs of managing the network do not become prohibitive. Although a full discussion of such a R&D FIPNet is beyond the scope of this article, we would emphasize that it includes many types of partnerships ranging from function-based outsourcing (for example, toxicology or clinical development), to lower C and reduce CT in many cases, to molecule-based risk-sharing partnerships and even partial ownership or equity investments in smaller companies or joint ventures with larger companies. A successfully operated R&D FIPNet should aim to bet-ter leverage and proportionally decrease C to affordably increase pipeline WIP, while simultaneously mitigating financial and technical risks.
Much of the discussion on WIP so far has focused on ensuring that there is sufficient WIP to increase NME approvals while addressing the inter-relatedness of the
Figure 4 | effect of Phase ii and iii probability of technical success on the number of Phase i entries required for one successful launch of a new molecular entity. This analysis shows the number of Phase I entries (first human dose; FHDs) annually required to achieve one new molecular entity (nME) launch per year as a result of modelling baseline assumptions of the probability of technical success (p(Ts)) for the stages of Phase I and submission-to-launch (54% and 91% respectively) over a range of p(Ts) for Phase II and Phase III. Each curve represents a different assumption for the Phase III p(Ts) over the range of 50% to 90%, and the x axis represents varying p(Ts) for Phase II. The number of Phase I entries (FHDs) annually needed to produce one nME launch per year can be viewed on the y axis for any combination of Phase III (individual curve) and Phase II (x axis) p(Ts). For example, at a 70% Phase III p(Ts) (black curve) and a 35% Phase II p(Ts) (on x axis), the required number of Phase I entries is about 8.5.
A n A ly s i s
208 | MARch 2010 | vOlUME 9 www.nature.com/reviews/drugdisc
© 20 Macmillan Publishers Limited. All rights reserved10

Imatinib and trastuzumabImatinib blocks the activity of BCR–ABL, a deregulated tyrosine kinase that results from a chromosomal translocation in patients with chronic myelogenous leukaemia, and trastuzumab blocks the activity of HER2/neu, a receptor tyrosine kinase that is often overexpressed in patients with breast cancer. Patients that are most likely to benefit from each drug can be readily identified before initiating treatment on the basis of the associated biomarkers, which has been invaluable in the development of both drugs and in guiding their use.
Six SigmaA quality management tool that is used to improve the quality of manufacturing and business processes by first identifying and removing the causes of errors or defects, as well as by minimizing variability.
key productivity parameters. however, all R&D WIP represents expense, albeit an expense that is necessary to generate innovative medicines. Publicly traded com-panies have a limit to how much they can invest in R&D as a percent of sales and thus the volume of WIP that is affordable. A common mistake is to focus on increasing WIP without regarding V and p(TS). This can easily happen when metrics and reward systems focus solely on the amount of WIP. Ultimately, more WIP without increases in the V or p(TS) associated with the WIP will ensure more output, but increases in R&D expenses will grow proportionately so the strategy will not result in greater productivity. If V and/or p(TS) could be increased, more output or value would actually be derived from less WIP (and expense). At Eli lilly, we have chosen to focus our view of WIP by adjusting our models to include dimensions of V and p(TS), ensuring we are measuring the value of WIP, not just the amount.
Value (V). The effectiveness of drug discovery and development must be increasingly quantified by estab-lishing at the time of product approval a highly desirable health outcome or economic benefit that can be objec-tively measured in various ways (for example, decreased mortality, morbidity and reduced hospitalizations). Thus, to increase R&D effectiveness it is important to fully understand the ultimate value of a project very early in development and know how this information can be leveraged in individual clinical plans and trade-offs in portfolio decision making.
The determinants of overall value are likely to be different depending on the perspective represented. Patients, caregivers, treating physicians and payers may apply different criteria to determine the value of new drug therapies. For instance, payers are increasingly interested in data from clinical trials with active compa-rators to establish the benefit of a new medicine versus other therapies (especially generic drugs), whereas regu-lators primarily depend on placebo-controlled studies to establish efficacy and safety. To optimize the value of a portfolio, it is important that optimal development plans and strategies for each project are formulated early and well before pivotal registration trials are initiated.
we assume that if a given drug treatment provides a higher benefit-to-risk ratio, the potential value of that treatment will be higher27. Maximizing patient benefit-to-risk ratio and thus potential value can be challenging in many diseases due to substantial clinical and biological heterogeneity. To increase the benefit (and reduce risks) of a drug treatment, it is often important to aim to per-sonalize or tailor the use of the therapy28. An important aid in the pursuit of tailored therapeutics is the identifi-cation of biomarkers that can be used to diagnose the dis-ease and/or identify treatment responders, ideally before or at least after the drug has been given. Biomarkers can also be used to select the right patients, right dose and right duration of treatment, or to avoid exposing patients at risk of a serious adverse event. The use of biomarkers to appropriately select patient subpopula-tions will also have a positive effect on p(TS) in the later stages of clinical development.
To optimize biomarker development and capture value, it is imperative to ensure biomarkers are devel-oped early and ideally are commercially available at the time of launch. Tailoring therapies to specific patient populations that are predicted to respond on the basis of the presence of a biomarker can be used to reduce development costs C, as illustrated by the development of imatinib (Gleevec; Novartis) or in stratifying patient populations for both clinical development and commer-cialization, as for trastuzumab (herceptin; Genentech/Roche). Although many industry pundits have opined that such market segmentation will reduce commercial returns for a given medicine (by reducing market share), so far, the increase in benefit-to-risk (and thus V) has more than offset the reduced market share for many new targeted medicines, especially in oncology.
Cycle time (CT). As is evident from our sensitivity analysis (FIG. 3), reducing both Phase III and Phase II CT are also important levers for improving R&D effi-ciency. Reducing either Phase III or Phase II CT by 50% from our baseline value of 2.5 years to 1.25 years would reduce the C per NME by about $200 million. Similar results were reported by DiMasi29. Although we think such reductions in Phase II and III CT are unrealistic, even more modest reductions in CT will nonetheless have a significant impact on R&D efficiency. Finally, some aspects of R&D CT, such as the time required for regulatory review (submission to launch in FIG. 3) are less amenable to intervention.
Reductions in R&D CT can be achieved in several ways and have long been a goal in the management of any production system. In predictable production systems, such as product manufacturing, CT reduction principles have been mastered and are routinely applied through techniques such as Six Sigma30. In less predictable sys-tems, such as pharmaceutical R&D, such approaches to CT reduction cannot be as broadly adapted, but many of the same principles can be readily applied30.
considerations for reducing the CT of each phase of discovery and development are often project- and phase-specific. Each phase of development consists of a collection of ‘unit processes’, or individual tasks that consume time and resources. The arrangement of these tasks in time and sequence can often be unique to the individual research project owing to the signifi-cant variability introduced by the state of the science associated with the R&D project in question. Because of this inherent variability, CT reduction at a macro level is best achieved through task- and project-specific interventions aimed at reducing non-value added tasks and ‘wait times’ associated with completing the value-added tasks.
we have identified four key approaches for reducing project-specific CTs. The first is portfolio selection. when selecting a portfolio of R&D projects, the inclu-sion of overall project CT as an element of an integrated strategy of portfolio selection should aid in reducing over-all CTs. For example, the CT of pivotal clinical trials are often a function of the disease state or indication being pursued. In some cases, demonstrating the efficacy of a
A n A ly s i s
NATURE REvIEwS | Drug Discovery vOlUME 9 | MARch 2010 | 209
© 20 Macmillan Publishers Limited. All rights reserved10
new drug may require many months or years of continued treatment. Moreover, even for drugs for which efficacy can be established relatively quickly (for example, in diabetes), establishing safety, especially cardiovascular safety, may require many months or years of treatment. Thus, con-sidering disease-specific CTs when selecting molecules or projects for clinical development is crucial for determin-ing the overall movement or flow of a given pipeline.
The second approach to reducing CT is the iden-tification and optimization of the ‘critical chain’ of project tasks. This approach is based on the concepts put forth in the “Theory of constraints” by Goldratt31, wherein the critical chain of tasks is identified and then the sequence, priority and extent of parallel execution is determined prior to project or clinical trial execu-tion. This approach to project management carefully monitors the critical chain and as delays are encoun-tered and incurred, the chain can be reconfigured (in real time) with the aim of recovering any overall project delay. In our experience, when this approach is lever-aged against an entire R&D portfolio, it can result in markedly improved CTs. Thus, CT reduction for the unit work processes that allow for the completion of critical chain tasks is essential.
Once a critical chain of tasks is established, there is the opportunity to improve the business and research processes used to deliver the tasks within the project plan. Each task relies on a process, which is often repeat-able and therefore suitable for optimization. Process improvement techniques such as Six Sigma can often be applied to achieve process CT reduction. Examples of this include the introduction of automation for the rapid processing of samples, the use of information tech-nology to support real-time data capture or optimiza-tion of clinical trial enrolment. however, elimination of non-value-added activities from the critical chain of tasks is also essential. Examination of the R&D pro cess can result in the identification of activities and tasks that add little or minimal value to desired outputs or out-comes. Often, these tasks are left over from historical approaches to R&D that have become obsolete, or are inefficient bureaucratic procedures associated with the management of R&D that have become institutional-ized in an organization, such as multiple serial project reviews by the leadership of each R&D function. when such non-value added tasks reside on the critical chain of the project, they will delay the project from achieving its milestones.
Finally, the use of adaptive and seamless Phase II and III study designs have proven extremely useful in reduc-ing clinical development CT, generally by reducing or even eliminating non-value-added wait times between phases of development32. Selecting those molecules and disease indications for which adaptive and seamless late-stage clinical development is possible can markedly decrease CT and improve P.
As can be seen from our analysis (FIG. 3), not all CT reductions are equal in their ability to reduce overall cost per NME. when applying the approaches above, effort should be prioritized according to both the impact and their feasibility of achieving the proposed CT reduction.
In addition to reducing the overall cost per NME, CT reductions have a positive effect on V associated with a molecule by allowing greater time on the market under a protected patent.
Cost (C). like CT, an understanding of the C of R&D activities can lead to interventions that can reduce the overall operating expenses required to deliver a success-ful molecule to the market. The C of an R&D programme can be split into three categories: direct spend on value-added tasks, direct spend on non-value-added tasks and overheads. Focusing on the cost of individual activities that achieve the objectives of an R&D project can yield important opportunities to reduce R&D expense. As R&D involves both the production of knowledge and materials, one must consider how the expense associated with an individual task achieves both production of the requisite information and of the materials that are crucial for downstream activities. leveraging new technology (such as software tools or laboratory automation) can lead to reduced costs, but care must be taken to eliminate the more tedious and costly methods while introducing new approaches, otherwise costs can become cumula-tive. As in the case of CT reduction, process improve-ment methods such as Six Sigma can yield cost savings as well. Finally, accessing lower-cost sources of labour (through outsourcing for example) can yield savings, assuming no compromise of CT or quality.
Identifying and eliminating non-value-added tasks, especially non-molecule C, from R&D programmes can also yield cost-saving opportunities just as it can improve CT. Furthermore, any sufficiently large R&D organiza-tion will carry the costs associated with employing and coordinating its employee base. As these overhead costs are spread over the entire portfolio of R&D projects, they have an incremental but often consequential effect on the C of R&D. Because many of the activities that are clas-sified as overheads are indeed essential to the success-ful operation of a business, they cannot be eliminated entirely. however, in our experience, these activities can be rationalized and reduced to carry the least amount of C considered necessary. Such overhead costs are typically more prevalent in larger, more mature organizations. Unit cost reductions, like CT reductions, can be lever-aged to improve productivity (FIG. 3). however, when cut-ting costs, it is important to be aware not to cut corners that might reduce the V or p(TS) of the portfolio.
Probability of technical success (p(TS)). There is little doubt that reducing the attrition rate of drug candidates in clinical development represents the greatest challenge and opportunity for pharmaceutical R&D, and arguably for sustaining the viability of the entire industry. As our sensitivity analyses show (FIG. 3), reducing Phase II and III attrition are the strongest levers for improving R&D efficiency and reducing the costs per NME.
Any given molecule fails because of either technical or non-technical reasons. Non-technical attrition occurs for various reasons, such as a change of strategy or termina-tion of research in a therapeutic area for scientific or com-mercial reasons, and will not be discussed further, except
A n A ly s i s
210 | MARch 2010 | vOlUME 9 www.nature.com/reviews/drugdisc
© 20 Macmillan Publishers Limited. All rights reserved10
to say that it can be a considerable (and sometimes sus-tained) source of C and lowered R&D efficiency. Technical attrition, on the other hand, occurs when a molecule fails to meet some important success factor, such as failing to demonstrate the requisite safety margin in Phase I or II or expected efficacy in Phase II or III.
compounds fail for many reasons, but some are more avoidable than others. Poor oral bioavailability, pharmacokinetic properties or toxicity issues that are not predicted by animal pharmacology models or by preclinical ADMET (absorption, distribution, metabo-lism, excretion and toxicity) studies, resulting in over-lap of efficacious and toxic doses (and thus lower than desired margins of safety) are often reasons for Phase I and Phase II attrition.
Given their highly specific target-binding character-istics, fully human or humanized monoclonal antibodies have greatly reduced ‘off-target’ toxicity compared with small molecules, which could help reduce attrition. Any cost-effective approach to predict toxicological liability or undesirable ADME properties preclinically (especially for small molecules) will reduce downstream attrition and several approaches to achieve this are being pursued33. In fact, the number (and percentage) of drug candidates successfully reaching Phase I has increased recently18, in part due to better preclinical characterization with improved ADMET properties.
Indeed, in their analysis of attrition rates based on data from large pharmaceutical companies between 1991–2000, Kola and landis highlighted that poor phar-macokinetic properties or bioavailability had become only a minor cause of overall attrition (≤ 10–20%) by 2000, whereas lack of efficacy and low margins of safety were the major causes of Phase II and III attrition19. Assuming that approaches for filtering out compounds with inappropriate drug-like properties have advanced since the 1990s, it seems likely that the recent increase in later-stage (especially Phase II) attrition is primarily due to the unprecedented nature of the drug targets (that is, the biological mechanisms) being pursued as well as the increasing safety hurdles (greater benefit-to-risk ratio) required for approval in most parts of the world.
however, as discussed above, Phase II and Phase III attrition rates remain unacceptably high: 66% and 30%, respectively, based on the most recent PBF benchmark-ing estimates (FIG. 2). Phase II attrition rates in particular have not improved substantially since those reported for the 1991–2000 period (62% attrition rate in Phase II and 45% in Phase III, with some therapeutic areas exhibit-ing even higher attrition rates)19. As highlighted by Kola and landis, clinical attrition rates during the 1990s were higher for central nervous system (cNS) disorders and oncology, with more than 70% of compounds in oncol-ogy failing in Phase II and 59% failing in Phase III. The higher failure rates in these areas are in part due to the relatively unprecedented nature of the drug targets being pursued and to the lack of animal models with a strong capacity to predict human efficacy.
There are two key approaches to reduce Phase II and III attrition, which ideally need to be carried out in tandem. The first is better target selection (selection
of more validated and druggable targets). The second is the routine pursuit of early POc studies in the clinic, especially in Phase I, for which biomarkers and surro-gate endpoints can often be employed. Although these two approaches to reducing attrition and increasing pro-ductivity have been highlighted by others17,19, we under-score their importance, and discuss how they can best be achieved below.
First, target selection is a key early step in the drug discovery and development process, as it generally occurs 10–15 years before the launch of a new drug and initiates the commitment of substantial time and resources to determine whether the target and the approach to modulating it are viable. Obviously, target identification and validation leading up to target selec-tion are also important factors, and can confer a com-petitive advantage to an R&D organization. It was widely predicted that advances in genomics and proteomics, including those resulting directly from the sequencing of the human genome, would yield an abundance of drug targets34,35. however, although many new potential drug targets have been identified by these approaches, far too few have been fully, or even sufficiently, validated so far to have had much impact on pharmaceutical R&D3. Nevertheless, we believe that validated targets for drug discovery are now materializing rapidly.
Target selection is also related to the second key approach to reducing Phase II and III attrition: estab-lishing early POc. This requires first choosing a drug target and disease state for which establishing POc early (preferably in Phase I) is feasible. The use of biomarkers or surrogate endpoints (if not clinical endpoints) is often essential for such POc studies. These biomarkers or sur-rogates can be as simple as assuring target engagement (for example, cNS receptor occupancy by positron emis-sion tomography scanning for neuropsychiatric drugs) or a desired clinical endpoint (for example, the lowering of blood glucose for diabetes or low density lipoprotein (lDl)–cholesterol for dyslipidaemia). A number of clini-cally relevant endpoints can be ascertained in Phase I (especially in the multidose safety studies or Phase Ib studies), including analgesia, lipid or glucose lowering and weight loss, but developing additional biomarkers of both efficacy and safety for a variety of diseases will be necessary to make early ‘go/no-go’ decisions; such biomarkers are especially needed in oncology.
To illustrate the importance of target selection, cou-pled with early POc clinical trials, we discuss two recently validated targets that in our opinion will probably result in very effective and commercially important drugs. The first target is the secreted circulating protease proprotein convertase subtilisin/kexin type 9 (PcSK9). circulating PcSK9 downregulates hepatic lDl receptors and thus increases serum lDl–cholesterol levels36. Gain-of-function missense mutations in the PcSK9 gene result in autosomal dominant hypercholesterolaemia and prema-ture coronary heart disease (chD)37. conversely, loss-of-function mutations are associated with very low serum lDl–cholesterol and a striking reduction in the incidence of chD38. Moreover, hMG coA reductase inhibitors (statins), which lower lDl–cholesterol, simultaneously
A n A ly s i s
NATURE REvIEwS | Drug Discovery vOlUME 9 | MARch 2010 | 211
© 20 Macmillan Publishers Limited. All rights reserved10

Nature Reviews | Drug Discovery
Preclinicaldevelopment
Launch
$
Phase I
$
Phase II
$ $
Phase III
R&D ‘sweet spot’
$ $$ $
CSFHD FED
PD
Test each scarce molecule thoroughly
Scarcity of drugdiscovery
a Traditional
Preclinicaldevelopment
Launch
POC Confirmation,dose finding Commercialization
Higher p(TS)
CSFHD
PD
• Increase critical information content early to shift attrition to cheaper phase• Use savings from shifted attrition to re-invest in the R&D ‘sweet spot’
Abundanceof drugdiscovery
b Quick win, fast fail
ChorusA virtual approach to drug development that is primarily focused on establishing early proof-of-concept in humans (ideally in Phase I) to reduce attrition at later stages. Chorus’ cost estimate quoted in the text was calculated including the direct and indirect costs for 21 molecules in the Chorus portfolio from 2005–2008 and one from 2004.
increase PcSK9 levels, reducing their potential efficacy in further lowering lDl–cholesterol39. Thus, inhibiting PcSK9 function could dramatically (and safely) reduce lDl–cholesterol as well as augment the beneficial effects of statins. PcSK9 inhibition can conceivably be accom-plished in several ways, but perhaps the most direct is with a neutralizing monoclonal antibody, which as noted earlier, could be developed relatively rapidly and with limited off-target toxicity. Such an antibody has recently been reported by chan and colleagues40 to dramatically lower lDl–cholesterol in both mice and non-human pri-mates. It should now be relatively straightforward to create a humanized (or fully human) neutralizing monoclonal antibody against PcSK9 for human testing. Importantly, POc with this antibody can be achieved rapidly in Phase I studies by simply measuring lDl–cholesterol, perhaps as soon as following administration of a single dose. Recent clinical and epidemiological studies strongly suggest that lowering lDl–cholesterol below currently accepted tar-gets (with or without a statin) may further reduce the incidence of chD41. It is quite possible that a PcSK9 anti-body or some other PcSK9 antagonist could dramatically (and safely) lower lDl–cholesterol and the risk of chD. however, the key point here is that the validation of this target by human genetics and preclinical studies using a potential therapeutic agent in animals, coupled with the ability to establish POc very early in the clinic, will undoubtedly increase the p(TS) of this molecule before it advances into Phase II and III trials.
The second example is the voltage-gated sodium channel type IX alpha subunit (also known as Nav 1.7 or ScN9A). like PcSK9, both gain-of-function and loss-of-function mutations in Nav 1.7 have been identified42. These mutations result in either increased sensitivity to painful stimuli (paroxysmal extreme pain disorder and primary erythermalgia) or channelopathy-associated insensitivity to pain, respectively42. The latter is a rare autosomal recessive disorder in which affected indi-viduals are insensitive to physical pain from birth. Importantly, these individuals have otherwise normal sensory perception, although the consequences of com-plete and persistent insensitivity to pain can be quite detri mental42. Nonetheless, a selective and reversible Nav 1.7 antagonist, perhaps one that inhibits channel activity in a state-dependent manner, will probably prove to be a very effective topical or oral analgesic agent43. Non-selective sodium channel blockers, such as the local anesthetic lidocaine and certain anticonvulsants such as phenytoin and carbamezepine, may in part work through Nav 1.7, but finding more selective antagonists could revolutionize the treatment of pain43. Moreover, as was the case for PcSK9, clinical POc can be rapidly obtained in Phase I using various human pain models.
These two drug targets have one important feature in common. Mutations in their genes cause a loss of function that results in a clinical phenotype (low lDl–cholesterol or insensitivity to pain) that could be mim-icked by a drug with potentially desirable therapeutic consequences. The validation of these two targets derives primarily from human genetics, coupled with a very good (but admittedly still incomplete) understanding of their biological mechanisms and clinical consequences. we estimate that there are now at least a dozen or more drug targets with similar human validation and this number will undoubtedly grow as advances in functional genomics continue to materialize.
Using these two approaches (better target validation and early POc studies) we have estimated that the p(TS) of Phase II compounds can be increased to approxi-mately 50%. As can be seen in our sensitivity analysis (FIG. 3), reducing Phase II attrition by this much will by itself lower the cost per NME by approximately 30%.
In our view, resolution of technical uncertainty early in development, especially whether or not a molecule engages its target and has desired pharmacological activity in humans is necessary to improve R&D productivity. we refer to this as our ‘quick win, fast fail’ paradigm of drug development (FIG. 5), whereby the ‘sweet spot’ of R&D resides prior to Phase II with a heavy emphasis on having sufficient discovery capacity and capability to assure selection of validated targets, and sufficient dis-covery WIP to yield enough good Phase-I-ready mole-cules. A resolute focus and portfolio metric is to establish POc in the clinic very early, preferably in Phase I. This can reliably be achieved for most, but obviously not all, drug candidates.
we have implemented an alternative clinical devel-opment model called Chorus44, which has served as a highly cost-effective means for establishing POc and has, in part, helped to increase the estimated p(TS) of
Figure 5 | The quick win, fast fail drug development paradigm. This figure illustrates the traditional paradigm of drug development (a) contrasted with an alternative development paradigm referred to as quick win, fast fail (b). In this alternative, technical uncertainty is intentionally decreased before the expensive later development stages (Phase II and Phase III) through the establishment of proof-of-concept (POC). This results in a reduced number of new molecular entities (nMEs) advancing into Phase II and III, but those that do advance have a higher probability of success (p(Ts)) and launch. The savings gained from costly investment in late-stage R&D failures are re-invested in R&D to further enhance R&D productivity. Cs, candidate selection; FED, first efficacy dose; FHD, first human dose; PD, product decision.
A n A ly s i s
212 | MARch 2010 | vOlUME 9 www.nature.com/reviews/drugdisc
© 20 Macmillan Publishers Limited. All rights reserved10

Nature Reviews | Drug Discovery
Cost per NME (US$ millions)
2,0001,8001,6001,4001,2001,000800200 400 6000
Cost per NME (baseline)CT (lead optimization–Phase I)
C (Phase I–III)
p(TS) (shift from Phase II to Phase I)
Cost per NME (~28% reduction)CT (Phase II, Phase III)
C (10% across all phases)
p(TS) (Phase III)
Cost per NME (~50% reduction)
our Phase II portfolio to approximately 50%. Moreover, the average C for establishing POc for a single NME in chorus is $6 million compared with $22 million using our more traditional approach. Thus, the epicentre of R&D focus and investment is shifted from the tradi-tional paradigm of resource-intensive Phase III and even Phase Iv clinical trials to one that generates substantially greater ‘shots on goal’ in the form of high-quality drug candidates (WIP) directed towards more validated tar-gets and in which uncertainty surrounding these more unprecedented targets (and mechanisms of drug action) can be resolved earlier by POc studies.
Given that the vast majority of drug candidates are destined to fail (even with reduced attrition) can they fail faster and less expensively? This model obviously requires a redistribution of R&D investments from the later stages of development to the sweet spot illustrated in FIG. 5. This can be achieved if late-phase attrition can be reduced as we have described. For example, as previously modelled, shifting attrition from Phase II or Phase III to Phase I can reduce the cost of drug development29. Our modelling shows that shifting 25% of Phase II attrition to Phase I results in savings of $30 million in out-of-pocket C per NME, which is enough to fund two addi-tional Phase I WIPs. This equates to shifting Phase II p(TS) from 34% to 41% and reducing Phase I p(TS) from 54% to 45%. This cost saving would be multiplied over an R&D portfolio that is aiming to produce more than 1 NME per year and could be increased further if some attrition was shifted from Phase III to Phase I (for example, shifting 25% of Phase III attrition to Phase I results in more than $20 million in additional out-of-pocket savings).
however, one risk of using this quick win, fast fail paradigm is that false-negative POc data (type 2 errors) could offset some or all of the cost savings generated by shifting attrition earlier21. Thus, it is important to ensure that the additional studies that form the basis for the early decision have a relatively low uncertainty, which is not possible for all projects.
Finally, we consider that one of the major contribu-tors to high Phase III attrition is simply premature advancement of NMEs into Phase III; that is, prior to establishing efficacy and an acceptable safety profile in Phase I (POc) and Phase II. The latter is often the result of poor discipline in portfolio management combined with perceived near-term business imperatives.
Summary and additional considerationswithout a substantial increase in R&D productivity, the pharmaceutical industry’s survival (let alone its contin-ued growth prospects), at least in its current form, is in great jeopardy. Much has been written on this subject and multiple contributing factors and potential solutions have been proposed1–3,5. Our econometric model of the current cost of discovering and successfully develop-ing a single new medicine reveals the major contribu-tors to the escalating costs and the declining number of launches. Importantly, our parametric analyses further reveal where the greatest improvements in productivity must occur.
we also offer a number of potential solutions, which if effectively implemented could dramatically reduce costs and importantly increase the flow of truly innova-tive new medicines to patients. For example, using our model parameters (FIG. 2) and sensitivity analyses (FIG. 3), we can elaborate a series of interventions to reduce the cost per NME by 28% and 50% respectively. FIG. 6 illus-trates the potential interventions designed to increase productivity by primarily reducing CT and C, as well as by shifting attrition to early stages of clinical develop-ment, increasing the overall p(TS) in Phase II and III. Although the more extreme case of a 50% reduction in cost per NME is ambitious, it is in our view not unre-alistic and may be necessary to sustain a viable R&D business model.
As the pharmaceutical industry transitions from an era of ‘me-too’ or ‘slightly me-better’ drugs to one of highly innovative medicines that result in mark-edly improved health outcomes, it must, as our model dictates, re-focus its resources (money and talent) on discovery research and early translational medicine. Although the scientific substrate for drug discovery has never been more abundant, a more complete under-standing of human (disease) biology will still be required before many true breakthrough medicines emerge.
we also emphasize that there are other important elements in a highly productive R&D enterprise that are not included in our model, most of which are necessary, although not sufficient to assure success. As underscored by cuatrecasas45, fostering scientific creativity and being opportunistic for serendipitous scientific and medical findings are clearly important elements of past and future success in the pharmaceutical industry. Over-managing or
Figure 6 | Productivity interventions yielding a substantial reduction in the cost per new molecular entity. This analysis shows the potential beneficial effect on capitalized cost per new molecular entity (nME) launch resulting from improvements in a number of R&D parameters (cost, cycle time (CT), probability of technical success (p(Ts))) as calculated using the R&D model described. A 28% reduction in cost per nME could be achieved through the aggregate actions resulting in a 9% reduction in CT from lead optimization to Phase I, a 10%, 15% and 20% reduction in cost for clinical development Phases I, II and III respectively, and a shift in attrition from Phase II to Phase I (decrease p(Ts) in Phase I by 17% and increase p(Ts) in Phase II by 47%). An even larger 50% reduction in cost per nME could be achieved by additionally reducing CT by 20% across Phases II and III, a further reduction in cost by 10% across all phases, and an increase in Phase III p(Ts) by 14% without negatively affecting other parameters.
A n A ly s i s
NATURE REvIEwS | Drug Discovery vOlUME 9 | MARch 2010 | 213
© 20 Macmillan Publishers Limited. All rights reserved10
even micro-managing R&D by those with little scientific–medical expertise or experience in R&D may well have contributed to recent pipeline gaps and reduced R&D productivity45. Moreover, fostering such scientific crea-tivity and medical opportunism is often challenging, and sometimes incompatible with the short-term and often aspirational goals of business-driven enterprises. Most importantly, in our opinion, there is no substitute for scientific and clinical intuition for any successful R&D
organization, whether it be in the initial selection of drug targets, the design of a clinical trial or the interpretation of clinical data in order to advance a molecule into late-phase clinical development. Simply stated, good ‘process’ will never be a substitute for good people or good science. however, we firmly believe that both good process and good science are not only compatible, but together will yield the greatest return on R&D investments and thus, have the greatest impact on R&D productivity.
1. O’Hagan, P. & Farkas, C. Bringing pharma R.&D back to health. Bain Brief [online], http://www.bain.com/bainweb/PDFs/cms/Public/BB_Managing_RandD_HC.pdf (2009).
2. Lindgardt, Z., Reeves, M. & Wallenstein, J. Waking the giant: business model innovation in the drug industry. In Vivo 26, 1–6 (2008).
3. Garnier, J. Rebuilding the R.&D engine in big pharma. Harvard Bus. Rev. 86, 68–76 (2008).A candid assessment by the former CEO of GlaxoSmithKline of the downsides of the industry’s process culture.
4. Angell, M. The Truth about Drug Companies: How They Deceive Us and What to do About It. (Random House Trade Paperbacks, New York, 2005).
5. Chertkow, J. Trends in pharmaceutical portfolio management: strategies to maintain profitability despite adversity. Datamonitor [online] http://www.datamonitor.com (2008).
6. Murray, A., Berndt, E. R. & Cutler, D. M. Prescription drug spending trends in the United States: looking beyond the turning point. Health Affairs w151–w160, (2008).
7. EvaluatePharma Alpha World Preview 2014. Evaluate Pharma report (2009).
8. Goodman, M. Market watch: Pharma industry performance metrics: 2007–2012E. Nature Rev. Drug Discov. 7, 795 (2008).
9. Mathieu, M. P., ed. Parexel’s Bio/Pharmaceutical R&D Statistical Sourcebook 2008/2009. (Parexel International Corporation, Waltham, 2008).
10. Pisano, G. P. Science Business: the Promise, the Reality, and the Future of Biotech. (Harvard Business School Press, Boston, 2006).An insightful retrospective on the biotech industry, and the reasons why it has not yet lived up to its promises.
11. DiMasi, J. A. & Grabowski, H. G. The cost of biopharmaceutical R&D: Is biotech different? Manage. Decis. Econ. 28, 469–479 (2007).A contemporary assessment of the costs to discover, develop and launch new molecular entities.
12. Kola, I. The state of innovation in drug development. Clin. Pharmacol. Ther. 83, 227–230 (2008).
13. Cohen, F. J. Macro trends in pharmaceutical innovation. Nature Rev. Drug Discov. 4, 78–84 (2005).
14. Lichtenberg, F. R. The impact of new drug launches on longevity: evidence from longitudinal, disease-level data from 52 countries, 1982–2001 Int. J. Health Care Finance Econ. 5, 47–43 (2005).
15. Kimball, T. R., McCoy, C. E., Khoury, P. R., Daniels, S. R. & Dolan, L. M. Obesity, diabetes damage young arteries, could shorten life. News release, American Heart Association website [online] http://americanheart.mediaroom.com/index.php?s=43&item=740 (2009).
16. KMR Group. Pharmaceutical Benchmarking Forum [online] http://kmrgroup.com/ForumsPharma.html (2009).
17. Booth, B. & Zemmil, R. Prospects for productivity. Nature Rev. Drug Discov. 3, 451–456 (2004).Booth and Zemmil framed the issue of productivity in the pharmaceutical industry and provide a qualitative discussion of some of the drivers and potential solutions.
18. Hu, M., Schultz, K., Sheu, J. & Tschopp, D. The innovation gap in pharmaceutical drug discovery & new models for R&D success. [online], http://www.kellogg.northwestern.edu/academic/biotech/faculty/articles/NewRDModel.pdf (2007).
19. Kola, I. & Landis, J. Can the pharmaceutical industry reduce attrition rates? Nature Rev. Drug Discov. 3, 711–715 (2004).This article provides an in-depth analysis of attrition by phase and therapy area, and offers a scientific approach to reduce Phase II and Phase III attrition rates.
20. Innovation or Stagnation? Challenge and Opportunity on the Critical Path to New Medical Products [online], http://www.fda.gov/oc/initiatives/criticalpath/whitepaper.html (2004).A seminal paper on the hurdles that must be overcome to reverse the decline in R&D productivity.
21. Peck, R. W. Driving earlier clinical attrition: if you want to find the needle, burn down the haystack. Considerations for biomarker development. Drug Discov. Today 12, 289–294 (2007).
22. Little, J. D. C. A proof of the queuing formula L = λ W. Oper. Res. 9, 383–387 (1961).
23. Bunch, P. R. & Schacht, A. L. Modeling resource requirements for pharmaceutical R.&D. Res. Technol. Manage. 45, 48–56 (2002).
24. Deloitte Touche Tohmatsu. Threading the talent needle: what global executives are saying about people and work. [online], http://www.deloitte.com/assets/ Dcom-Shared%20Assets/Documents/us_talent_ThreadingtheTalentNeedle_final3409.pdf (2009).
25. PricewaterhouseCoopers. The changing dynamics of pharma outsourcing in Asia: are you readjusting your sights? [online], http://www.pwc.com/gx/en/pharma-life-sciences/outsourcing/index.jhtml (2008).
26. Danzon, P. M., Nicholson S. & Pereira N. S. Productivity in pharmaceutical-biotechnology R&D: the role of experience and alliances. J. Health Econ. 24, 317–339 (2005).
27. Gregson, N., Sparrowhawk, K., Mauskopf, J. & Paul, J. Pricing medicines: theory and practice, challenges and opportunities. Nature Rev. Drug Discov. 4, 121–130 (2005).
28. Woodcock, J. The prospects for ‘‘personalized medicine’’ in drug development and drug therapy. Clin. Pharmacol. Ther. 1, 164–169 (2007).
29. DiMasi, J. A. The value of improving the productivity of the drug development process: faster times and better decisions. Pharmacoeconomics 20, 1–10 (2002).
30. Pyzdek, T. The Six Sigma Handbook: The complete guide for greenbelts, blackbelts, and managers of all levels. 2nd revised edition (McGraw-Hill, New York, 2003).
31. Goldratt, E. M. & Cox J. The goal: a process of ongoing improvement. Third edition. (Gower Publishing, Aldershot, 2004).
32. Maca, J., Bhattacharya, S., Dragalin, V, Gallo, P, Krams, M. Adaptive seamless phase II/III designs—background, operational aspects, and examples. Drug Inf. J. 4, 463–473 (2006).
33. Kramer, J. A., Sagart, J. E. & Morris, D. L. The application of discovery toxicology and pathology towards the design of safer pharmaceutical lead candidates. Nature Rev. Drug Discov. 6, 636–649 (2007).
34. Hopkins, A. L. & Groom, C. R. The druggable genome. Nature Rev. Drug Discov. 1, 727–730 (2002).
35. Grenet, O. Significance of the human genome sequence to drug discovery. Pharmacogenomics J. 1, 11–12 (2001).
36. Horton, J. D., Cohen, J. C. & Hobbs, H. H. PCSK9: a convertase that coordinates LDL catabolism. J. Lipid Res. S172–S177 (2009).
37. Abifadel, M. et al. Mutations in PCSK9 cause autosomal dominant hypercholesterolemia. Nature Genet. 34, 154–156 (2003).
38. Cohen, J. C., Boerwinkle, E., Mosley, Jr., T. H. & Hobbs, H. H. Sequence variations in PCSK9, low LDL, and protection against coronary heart disease. N. Engl. J. Med. 354, 1264–1272 (2006).
39. Cao, G., Qian, Y. W., Kowala, M. C. & Konrad, R. J. Further LDL cholesterol lowering through targeting PCSK9 for coronary artery disease. Endocrine, Metabolic & Immune Disorders – Drug Targets. 8, 238–243 (2008).
40. Chan, J.C. et al. A proprotein convertase subtilisin/kexin type 9 neutralizing antibody reduces serum cholesterol in mice and nonhuman primates. Proc. Natl Acad. Sci. USA 106, 9820–9825 (2009).
41. Shepherd, J. et.al. Effect of lowering LDL cholesterol substantially below currently recommended levels in patients with coronary heart disease and diabetes. Diabetes Care 29, 1220–1226 (2006).
42. Drenth, J. P. H. & Waxman, S. G. Mutations in sodium-channel gene SCN9A cause a spectrum of human genetic pain disorders. J. Clin. Invest. 117, 3603–3609 (2007).
43. Krafte, D. S. & Bannon, A. W. Sodium channels and nociception: recent concepts and therapeutic opportunities. Curr. Opin. Pharmacol. 8, 50–56 (2008).
44. Bonabeau, E. N., Bodick, N. & Armstrong, R. W. A more rational approach to new-product development. Harvard Bus. Rev. 86, 96–102 (2008).A review of Eli Lilly’s Chorus model of early drug development and FIPNet strategy.
45. Cuatrecasas, P. Drug discovery in jeopardy. J. Clin. Invest. 116, 2837–2842 (2006).A frank analysis by one of the most successful R&D leaders of problems that have fostered the current innovation crisis.
AcknowledgementsThe authors wish to acknowledge the seminal thought leader-ship on the issue of R&D productivity that A. Bingham has provided to the pharmaceutical industry. In addition, we wish to thank J.S. Andersen and T. Mason for helping frame the productivity concepts expressed in this manuscript, and G. Pisano and J. DiMasi for helpful suggestions and comments.
Competing interests statementThe authors declare competing financial interests: see web version for details.
DATABASESUniProtKB: http://www.uniprot.orgPCsK9 | sCn9A
SUPPLEMENTARY INFORMATIONsee online article: s1 (box) | s2 (box) | s3 (box)
All links Are AcTive in The online PDf
A n A ly s i s
214 | MARch 2010 | vOlUME 9 www.nature.com/reviews/drugdisc
© 20 Macmillan Publishers Limited. All rights reserved10