Embed Size (px)
Citation preview

How to Attract Children and Adults to the Same Beverage through Package Design
By
Jessica Chaidez
Graphic Communication Department
College of Liberal Arts
California Polytechnic State University, San Luis Obispo
2014
Abstract
How to Attract Children and Adults to the Same Beverage through Package Design
Jessica Chaidez
Graphic Communication Department, June 2014
Advisor: Kevin Cooper
The purpose of this study was to determine if children and adults could be attracted to
the same beverage through package design. This study surveyed particpants in the San Luis
Obispo Area on prefernece of different juice labels. The survey asked the preference of dif-
ferent juice labels based on typeface, size and layout of the logo, contrast, type of substrate,
and color. The survey participants were in different age groups ranging from 4 years old to
those over 40 years old.
Results from one hundred sixty-one responses indicated although not all age groups were
attracted to the same elements of a beverage label, patterns did arise in some age groups’ pref-
erences. This data can allow beverage companies to reach a larger target market successfully,
thus increasing sales.

TABLE OF CONTENTS
I. PURPOSE OF STUDy ..........................................................................4 Statement of the problem ........................................................ 4 Significant of problem ..............................................................5 Interest in problem ....................................................................5
II. LITERATURE REVIEW ....................................................................... 6 Packaging in Grocery Stores .................................................... 6 Key Elements in Packaging Design for Beverages ....................7 Typography and layout ..............................................................8 What Children are Attracted to in a Package Design ............8 What Adults are Attracted to in a Package Design ................9 Similarities Between Adults and Children in Packaging influences ..............................................................10 Conclusion ..............................................................................11
III. Methodology ...........................................................................12 Data collection plan ...............................................................12 Data Analysis Plan ..................................................................13
IV. RESULTS ..................................................................................... 14 Typeface Preference ................................................................15 Position and Size Preference .................................................17 Paper Color Preference ..........................................................19 Contrast preference ...............................................................21 Typeface color preference ..................................................... 23
V. CONCLUSIONS ..............................................................................27
REFERENCES .....................................................................................30
APPENDIX ........................................................................................32 Survey ....................................................................................... 32

4
Chapter 1
Purpose of study
Statement of the Problem
There are certain commercial products such as beverages, snacks, cereals, and electronics
that children and adults both consume. However, how does a consumer product company
or advertising agency promote a product to two completely different age groups and target
markets who have different tastes and opinions? There are many attributes consumers are
attracted to in package designs; however, this research focused specifically on the packaging
of beverages. Studies have found children are attracted to certain characteristics of a package
such as bright colors or a variety of different shapes; however, adults might find packages
with darker colors or a minimalistic design more engaging. There are few studies which
provide information on what both children and adults are attracted to in a package design.
The purpose of this research is to find how a consumer product company can design a single
beverage package that attracts both a younger demographic and the older demographic. The
key elements assessed in the success of attracting both children and adults to the same bever-
age package design were color, typography and layout.
5
Significance of the Problem
In a store environment, many consumers are overwhelmed by the amount of choices
with which they are faced. Often, consumers in a hurry will pick a product whose pack-
age stood out the most. Studying children and adults and their reactions to certain designs,
color, typographic, and material choices in beverage packaging will give companies access to
data depicting certain similarities of design both groups are attracted to. Understanding the
key factors in getting the attention of both children and adults will change how companies
design their packages. As a result, these new packages would broaden the scopes of target
markets, allow more consumers to be attracted to the product design– therefore making it
more successful and competitive in the marketplace.
Interest of the Problem
I minored in Industrial Technology Packaging and my Graphic Communication concen-
tration wass Digital Reproduction Technology. I am fascinated in the link between packaging
and design and how they work hand in hand with each other. I think it would be interesting
to test how adults and children are similar in regards to what draws them in to a beverage’s
packaging. Whether it be a certain color that both children and adults like, a type face, or
any other design characteristic the two groups are both attracted to.

6
Chapter 2
Literature Review
Packaging in Grocery Stores
In a grocery store, consumers are faced with thousands of products to choose from. Con-
sumers seldom have the time or the patience to look at every item in the store, so they often
purchase products they are loyal to or try products that are visually stimulating.
Once a customer is in the store, the print and television advertising of a product no lon-
ger matters, because the packaging design will either grab their attention or they will walk
past the product completely (Jacobsen, 2012). With a multitude of choices in a grocery store,
it is imperative that a product stands out from its competition in order to be successful. Con-
sumer product companies and advertising agencies conduct research on target markets and
consumer behavior to better understand consumers’ needs –what they look for in a product,
and what they look for in a package design. These companies spend billions of dollars each
year on research in order to produce products whose package design will encourage consum-
ers to buy the product. For example, according to PepsiCo’s 2011 annual report, costs of
marketing and advertising (including consumer research) for the corporation totaled $3.5
billion in 2011. The corporation had additional plans to increase those costs by $500-$600
million for the 2012 year (PepsiCo, 2011, p. 59, 24). Companies in the beverage industry

7
are aware that strategic packaging communication can potentially attract a larger client base,
thus increasing revenue.
Key Elements in Packaging Design for Beverages
They key elements in a package design that customers pay attention to – either conscious-
ly or subconsciously – are color, typography, and layout. Through these elements, products
are able to establish a personality and attitude that consumers can relate to. According to
Theodore (2001), packaging design must be done with great consideration of the target mar-
ket because “the package must fit consumers’ lifestyles or they will not continue to buy the
product”. Additional research has illustrated the emotional responses from consumers in a
shopping experience. These “emotions, in turn, influence shopping behaviors and outcomes”
(Machleit & Eroglu, 2000, p. 101).
Color
Color can make a package stand out from other products on a shelf. It can grab a cus-
tomer’s attention even if they are too far away to see or read what the product is. Colors on
packaging –if done effectively –have the potential to create a positive emotional response
in consumers. For these reasons, knowledge of color psychology is essential in packaging
communication. Consumer product companies study the affects of color on their target
markets to decide how to design their product. Aslam (2006) states the importance of color
in products and their packaging, as color reveals product attributes and influences customer
perceptions of price, quality, and flavor of food. Color can also function as an association cue
for consumers. Chestin & Mastin Inc. (1987) found common color associations in the USA:
Blue is associated with toys, health foods, dairy foods, desserts and financial ser-
vices, red is related to toys, pizzas and meat entreés, silver is related to dairy foods,
green is related to health foods, vegetable entreés, toys and financial services, yel-
low is related to toys, dairy foods, health foods and desserts and pink is related to
cosmetics and Barbie dolls (as cited in Aslam, 2006, p. 23).

8
Color also has symbolic meaning customers can relate to. For example, in the United
States, blue is a color that represents masculinity and premium quality; black is used to evoke
an expensive taste as well as establish authority; red represents both love and activity (Aslam,
2006,).
Interestingly, the effect of color on consumers changes for different age groups. For ex-
ample, in an article about color preferences in children, Lowenberg (1934) stated that pre-
school children usually preferred yellow and orange colored food (as cited in Walsh, Toma,
Tuveson, & Sondhi, 1990, p.646). On the other hand, adults often will choose a package
with a darker, simpler design.
Typography and layout
Typography and layout involved in a package design contribute to the overall attitude
and attractiveness to a product. Consumers are more often drawn to purchase the most
visually appealing packages. A study on packing and purchase designs found that a majority
of consumers today shop under time pressure and “a package that attracts consumers at the
point of purchase will help them make decisions quickly in-store” (Silayoi & Speece, 2004,
p. 611). These time pressured customers have a tendency to make impulse purchases based
on what catches their eye. In a study on impulse purchases, Karmali (2007) interviewed
Coca Cola’s CEO Muhtar Kend who argued “more than 70 percent of Coke’s sales are due
to [these] impulse purchases” (as cited in Mohan, Sivakumaran, & Sharma, 2013, p. 1711).
In addition to a package being visually attractive, Professor Paul Luna from the Department
of Typography at Reading University also noted the necessity of clear and legible typography
to communicate to consumers what the product is (as cited in Richardson & Dennis, 2003).
What Children are Attracted to in a Package Design
Advertisers have recently started to realize the influence children have in grocery store
purchases. In a study from the British Food Journal done on the packaging of children’s
breakfast cereal, it was stated that children have a high purchasing power. Mcneal (1969)

9
stated that children “may observe, request and select goods with permission while accom-
panying their parents shopping as well as make independent forays to shops themselves” (as
cited in Hill & Tilley, 2002, p.768).
Color psychology changes with age – as does taste in packaging design and what attracts
a consumer visually. It is vital to know what attracts children to packaging, in order to reach
them in the market place. Walker, Hill, & Millman (1973) found “that colors associated
with fruits were strongly linked to favorable taste expectations” (as cited in in Walsh, Toma,
Tuveson, & Sondhi, 1990, p.646). In a similar study, colored paper was used to determine
color preference among children:
Staples (1932) found that red and yellow attracted the most consistent interest
in children under 2 years old. Sharpe (1980) documented red as the most fa-
vored color of children ages 2,3, and 4, as did Staples, who also noted that, after
red, children preferred green and then blue” (as cited in Walsh, Toma, Tuveson,
& Sondhi, 1990, p.646).
In addition to color, a study of packaging for children’s breakfast cereal, products with
cartoon characters such as Tony the tiger on Frosted Flakes were successful in gaining prod-
uct and brand recognition and desire of purchase with children (Hill & Tilley, 2002).
What Adults are Attracted to in a Package Design
While children may be more apt to colorful and bright designs with characters, the tastes of
adult target markets in the beverage industry are also different. Color selection also plays a role
on perceiving the quality of a product. For example, high priced and higher-quality products
directed to a mature, upper middle class target market often have darker colored packaging
(primarily black packages) (Ampuero & Vila, 2006). Especially in the alcoholic sector of the
beverage industry, adults are often drawn to simplicity of packaging and glass materials. Glass
has a quality element that gives a product a premium feel, for which many liquor companies
strive. However, some alcoholic brands have recently crossed into the plastic material world.
For example, United Distillers & Vintners, Stamford, Conn. recently switched from glass to

10
plastic for its TGI Friday’s On the Rocks line of single-serve, ready-to-drink cocktails (Theo-
dore, 2001).
In the wine industry, most wine bottles are similar in shape and material; however, their
labels are what set them apart. According to Franson (2006), there are about 10,000 brands of
wine available in the United States (as cited in Sherman & Tuten, 2011). Colorful wine labels
can be perceived as somewhat frivolous and less serious (Teague, 2004). Labels with different
styles signal different cues to the customer. For example, traditional labels are depicted with
rich, neutral colors that cue high quality. (Elliot & Barth, 2012). When wine is given as a gift,
research found the appearance of the label as well as the brand name are among the most im-
portant purchasing factors (Sherman & Tuten).
Millennials (those aged 9 to 30 accounted for approximately 76 million people in the Unit-
ed States in 2009) are the largest consumer group in the country (Henley, Fowler, Yuan, Stout
& Goh, 2011). In a study on Millennials and wine purchasing, (Thach & Olsen, 2006) stated
the importance of innovative package design and labels during purchase decisions (as cited in
Henley, Fowler, Yuan, Stout, Goh, 2011). According to (Wolf and Thomas, 2007), “The high-
est rated factor for millennials is eye catching… labels [that] draw attention based on… design,
font styles, color, and overall appearance” (as cited in Henley, Fowler, Yuan, Stout, Goh, 2011).
Similarities Between Adults and Children in Packaging Influences
In a study of color psychology, Katz and Breed (1922) documented a shift in preference
to blue as school-age children got older. The researchers also noted blue is a popular color
in both children and adults (as cited in Walsh, Toma, Tuveson, & Sondhi, 1990, p. 652).
Although there were few studies done on the similarities between adults and children in
packaging influences, the topic was further explored and tested in this research with results
in the upcoming chapters.
11
Conclusion
Despite research in colors, typography, and layout, there is a lack of viable research that
depicts similarities of attractiveness to package design in both children and adults. Although
there are different segments in the beverage market for adults and children, the two age
groups do share a commonality in certain types of beverages such as milk, soft drinks, and
juice. Exploring ways to attract both age groups to the same beverage product would benefit
companies competing in the beverage industry. By making a beverage appealing to a broader
range of people, purchasing potential also increases.
12
Chapter 3
Methodology
The goal of this research was to study what children and adults are individually drawn
to in the package design of a beverage, and then explore how to attract both groups to the
same beverage package through the use of design elements such as color, typography, and
layout. With a multitude of products in today’s beverage industry, a beverage needs to stand
out and attract a large audience to be successful. It will benefit a company to expand their
target market to include different age groups such as children and adults. These groups have
different tastes in the design of a package but discovering a common link(s) between the two
groups will increase the amount of potential sales.
The objective of this study was to determine the design elements that successfully attract chil-
dren and adults to the same beverage through package design.
Key elements explored were color, typography, and layout used in the packaging of a beverage.
Data Collection Plan
For the purpose of this study, a survey (see appendix) was administered to six age groups.
Group one had ages ranged from 4-10 years old; group two ranged from 11-14 years old;
group three ranged from 15-18 years old; group four ranged from 19-24 years old, group
five ranged from 26-40 years old, and the last group were those over 41 years old. They

13
survey was administered in person to participants aged 18 years old and younger. Survey re-
spondents older than 18 took the same survye online. Participants were asked questions two
questions about their demographics (age and sex) and 5 questions about prefernce based on
color, layout, and typography.
Data Analysis Plan
The results from the survey and experiment were documented and assessed. The in-
formation was categorized by age of the subjects and prefernce of labels. The relevant data
and results from the experiment were used to verify if there was a link between what children
and adults are attracted to in a beverage package design.

14
Chapter 4
Results
The label preference study was conducted amongst different age groups. The age groups
were the following: 4-10 years old; 11-14 years old; 15-18 years old; 19-24 years old; 25-40
years old; and 40+ years old. Some surveys were printed out and administered at local schools
in San Luis Obispo County. The grade level of children surveyed ranged from pre-kindergarten
to high school. For those aged 19 and older, the same survey was administered online.
The results were organized in the following order: preference of typeface, preference
of position and size, preference of substrate color, preference of color contrast, and prefer-
ence of typeface color. Each age group was analyzed individually, then further discussed
and analyzed in the conclusion. The goal of the label preference study was to discover po-
tential patterns that arise between age groups. The goal of this study was also to determine
if an ideal label could be created to attract both adults and children to the same beverage
through package design.

15
Typeface Preference
(Figure 4.0) The above images were shown to survey respondents and were asked to select their favorite label based on typeface alone.
(Figure 4.1) Results of survey displaying the percentage of each age group’s typeface preference
4-‐10 yrs 11-‐14 yrs 15-‐18 yrs 19-‐25 yrs 26-‐40 yrs 41+ yrs Bold Sans Serif 25.0% 22.8% 13.7% 37.3% 11.0% 33.0%
Script 5.0% 35.8% 27.6% 29.9% 59.2% 41.6%
Modern 55.0% 27.0% 34.5% 11.9% 18.5% 16.7%
Sans Serif 15.0% 14.1% 24.1% 20.9% 7.4% 4.2%
0.0%
10.0%
20.0%
30.0%
40.0%
50.0%
60.0%
70.0%
Percen
tage of P
reference
Typeface

16
Typeface Preference
Most preferred typeface
The group of 11-14 year olds, 26-40 year olds, and 40 years and older all preferred the script
typeface with a preference percentage of 35%, 59.2%, and 41.6%, respectively (reference Fig-
ure 4.1). For the 4-10 year old age group and the 15-18 year old age group, the most preferred
typeface was modern (label C). Label C was preferred by 55% of the 4-10 year old age group
and 34.5% of the 15-18 year old age group. The bold sans serif was preferred by 37.3% of those
between the ages of 19 and 25 years old.
Least preferred typeface
The normal sans serif (label D) had a low preference rating in a large portion of the age
groups. Those aged 11-14 years old, 26-40 years old, and older than 40 years old all preferred
label D the least (reference Figure 4.1). In the 4-10 year old age group, the script typeface was
the least popular option, only receiving a 5% preference rating. The normal sans serif typeface
(label D) was only preferred by 4.2% of those older than 41 years old.

17
Position and Size Preference
(4.3) Survey respondents were asked to select their favorite label based on size and position alone.
(4.4) Chart shows results from survey on preference of position and size of logo

18
Position and Size Preference
Most Preferred
The 4-10 age group preferred the size and position of the smaller horizontally and verti-
cally centered logo on the label (see Figure 4.5). 50% of respondents aged 4-10 years old
chose this smaller, centered logo (Label A). In the 11-14 year old age group and the 26-40
year old age group, label F was the most popular with 25% votes and 51% votes, respectively.
Label F had a large, left aligned vertical logo. The three labels that received the majority of
(Figure 4.5) Graph and chart displays label preference for labels A-D based on position and size
(Figure 4.6) Graph and chart displays label preference for labels E-I based on position and size
4-‐10 yrs 11-‐14 yrs 15-‐18 yrs 19-‐25 yrs 26-‐40 yrs 41+ yrs A 50.0% 13.0% 20.1% 16.4% 3.7% 20.8%
B 30.0% 11.9% 17.2% 15.7% 3.7% 12.5%
C 10.0% 4.3% 10.3% 9.7% 18.5% 12.5%
D 0.0% 6.5% 6.9% 6.0% 0.0% 12.5%
0.0%
10.0%
20.0%
30.0%
40.0%
50.0%
60.0%
Preferen
ce percentage
Posi/on and Size (A-‐D)
4-‐10 yrs 11-‐14 yrs 15-‐18 yrs 19-‐25 yrs 26-‐40 yrs 41+ yrs E 0.0% 1.1% 6.9% 2.2% 0.0% 4.2%
F 0.0% 25.0% 10.3% 11.9% 51.8% 16.7%
G 5.0% 18.4% 6.9% 6.0% 0.0% 4.2%
H 5.0% 8.6% 6.9% 7.5% 7.4% 12.5%
I 0.0% 10.8% 13.8% 24.6% 14.8% 4.2%
0.0%
10.0%
20.0%
30.0%
40.0%
50.0%
60.0%
Preferen
ce percentage
Posi/on and Size (E-‐I)

19
votes in the 19-25 age group were labels A, B, and I – receiving 20.1%, 17.2% and 13.8%
of votes, respectively (see Figures 4.3 and 4.4). Lastly, label A was the most popular in those
aged over 40 years old, receiving a preference of 20.8%.
Least Preferred
The least popular labels across all of age groups were labels D and E (reference Figure
4.3). Label D and E were similar in appearance– each was smaller and aligned to the bottom
in a vertical orientation. Label D had a 0% preference rating in both the 4-10 and the 26-40
age groups. In the 11-14, 15-18, and the 19-25 year old age groups, label D received 6.5%,
6.9%, and 6.0% popularity, respectively. Label E had a 0% popularity rating in the 4-10 year
old age group and the 26-40 age groups. Label E received 1.1% popularity in the 11-14 year
old age group and 6.9% popularity in the 15-18 year old age group. Lastly, label E was pre-
ferred by 2.2% of the 19-25 year old age group and by 4.2% of those older than 40 years old.
Paper Color Preference
(Figure 4.7) The above images were shown to survey respondents whom were asked to select their favorite label based on paper color.
(4.8) Chart shows results from survey on preference of paper color
20
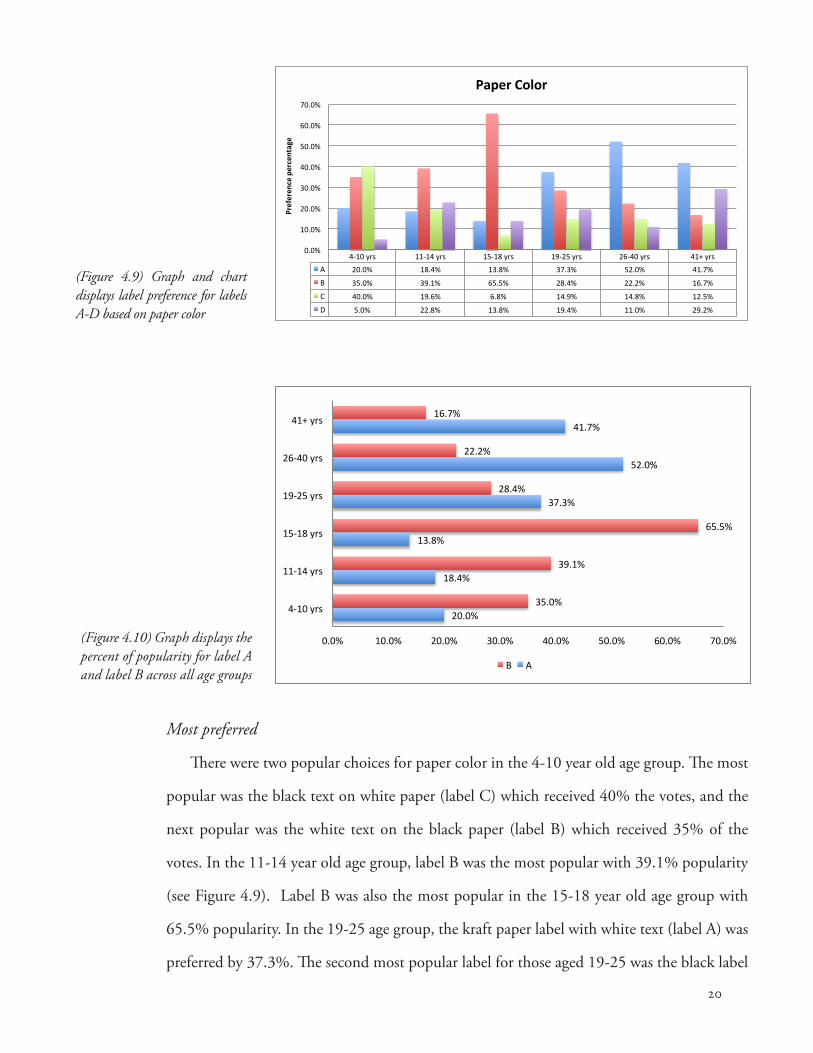
Most preferred
There were two popular choices for paper color in the 4-10 year old age group. The most
popular was the black text on white paper (label C) which received 40% the votes, and the
next popular was the white text on the black paper (label B) which received 35% of the
votes. In the 11-14 year old age group, label B was the most popular with 39.1% popularity
(see Figure 4.9). Label B was also the most popular in the 15-18 year old age group with
65.5% popularity. In the 19-25 age group, the kraft paper label with white text (label A) was
preferred by 37.3%. The second most popular label for those aged 19-25 was the black label
4-‐10 yrs 11-‐14 yrs 15-‐18 yrs 19-‐25 yrs 26-‐40 yrs 41+ yrs A 20.0% 18.4% 13.8% 37.3% 52.0% 41.7%
B 35.0% 39.1% 65.5% 28.4% 22.2% 16.7%
C 40.0% 19.6% 6.8% 14.9% 14.8% 12.5%
D 5.0% 22.8% 13.8% 19.4% 11.0% 29.2%
0.0%
10.0%
20.0%
30.0%
40.0%
50.0%
60.0%
70.0%
Preferen
ce percentage
Paper Color
20.0%
18.4%
13.8%
37.3%
52.0%
41.7%
35.0%
39.1%
65.5%
28.4%
22.2%
16.7%
0.0% 10.0% 20.0% 30.0% 40.0% 50.0% 60.0% 70.0%
4-‐10 yrs
11-‐14 yrs
15-‐18 yrs
19-‐25 yrs
26-‐40 yrs
41+ yrs
B A
(Figure 4.9) Graph and chart displays label preference for labels A-D based on paper color
(Figure 4.10) Graph displays the percent of popularity for label A and label B across all age groups

21
with white text, which was preferred by 28.4% of respondents. The kraft paper label with
white text (label A) was the most popular label in both the 26-40 year age group and those
older than 40 years old. Label A was preferred by 52% of those in the 26-40 years old age
group and by 41.7% of respondents older than 40 years old. On average, labels A and B were
the top two labels selected in each age group. Figure 4.10 depicts their popularity showing a
trend in the younger age groups’ preference of label B and the older age groups’ preference
of label A.
Least preferred
Only 5% of the respondents in the 4-10 year old age group selected label D as their pre-
ferred label. Label D was also the least popular in the 26-40 year old age group. Label C was
the least popular across four age groups: 15-18, 19-26, and 40+ (see Figure 4.9). Both labels
C and D had black text
Contrast preference
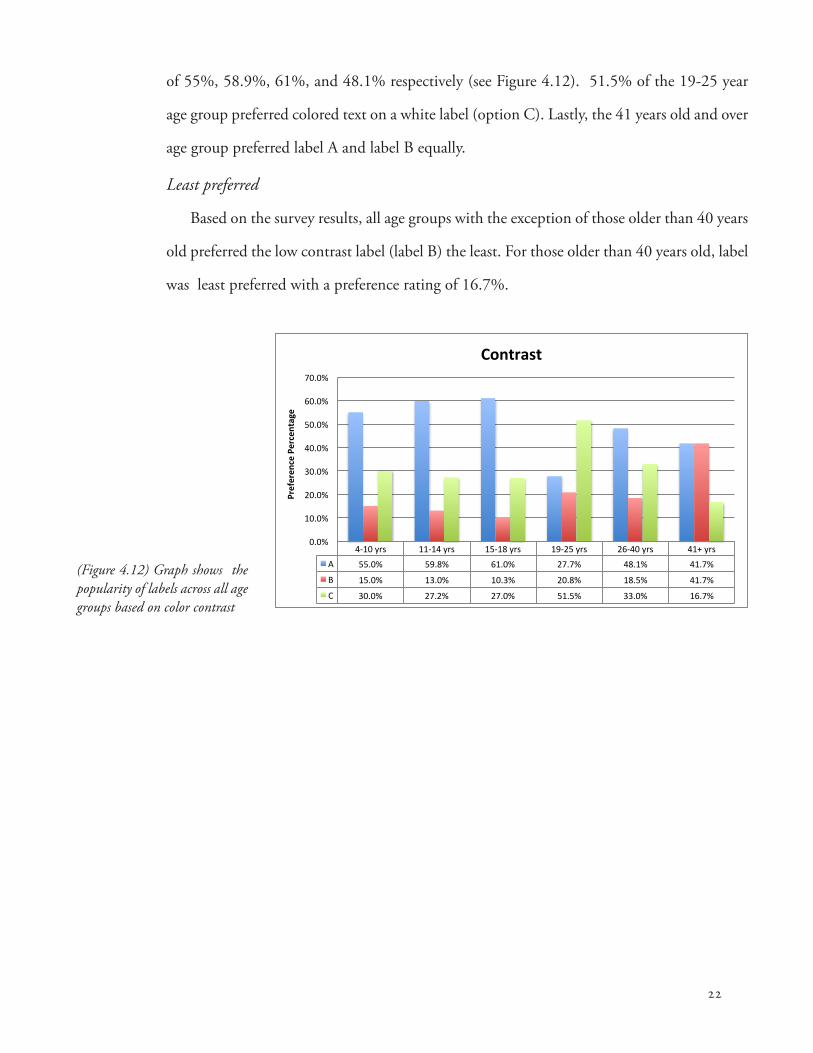
Most preferred
When prompted to choose a label based on contrast between background and text color,
the majority of respondents selected label A– the colorful and high contrasting blue and lime
green label (see Figure 4.11). The 4-10 year age group, the 11-14 year age group, the 15-18
year age group, and the 26-40 year age group preferred label A with a popularity percentage
(Figure 4.11) The above images were shown to survey respondents whom were asked to select their favorite label based on color contrast.
22
of 55%, 58.9%, 61%, and 48.1% respectively (see Figure 4.12). 51.5% of the 19-25 year
age group preferred colored text on a white label (option C). Lastly, the 41 years old and over
age group preferred label A and label B equally.
Least preferred
Based on the survey results, all age groups with the exception of those older than 40 years
old preferred the low contrast label (label B) the least. For those older than 40 years old, label
was least preferred with a preference rating of 16.7%.
4-‐10 yrs 11-‐14 yrs 15-‐18 yrs 19-‐25 yrs 26-‐40 yrs 41+ yrs A 55.0% 59.8% 61.0% 27.7% 48.1% 41.7%
B 15.0% 13.0% 10.3% 20.8% 18.5% 41.7%
C 30.0% 27.2% 27.0% 51.5% 33.0% 16.7%
0.0%
10.0%
20.0%
30.0%
40.0%
50.0%
60.0%
70.0%
Preferen
ce Percentage
Contrast
(Figure 4.12) Graph shows the popularity of labels across all age groups based on color contrast
23
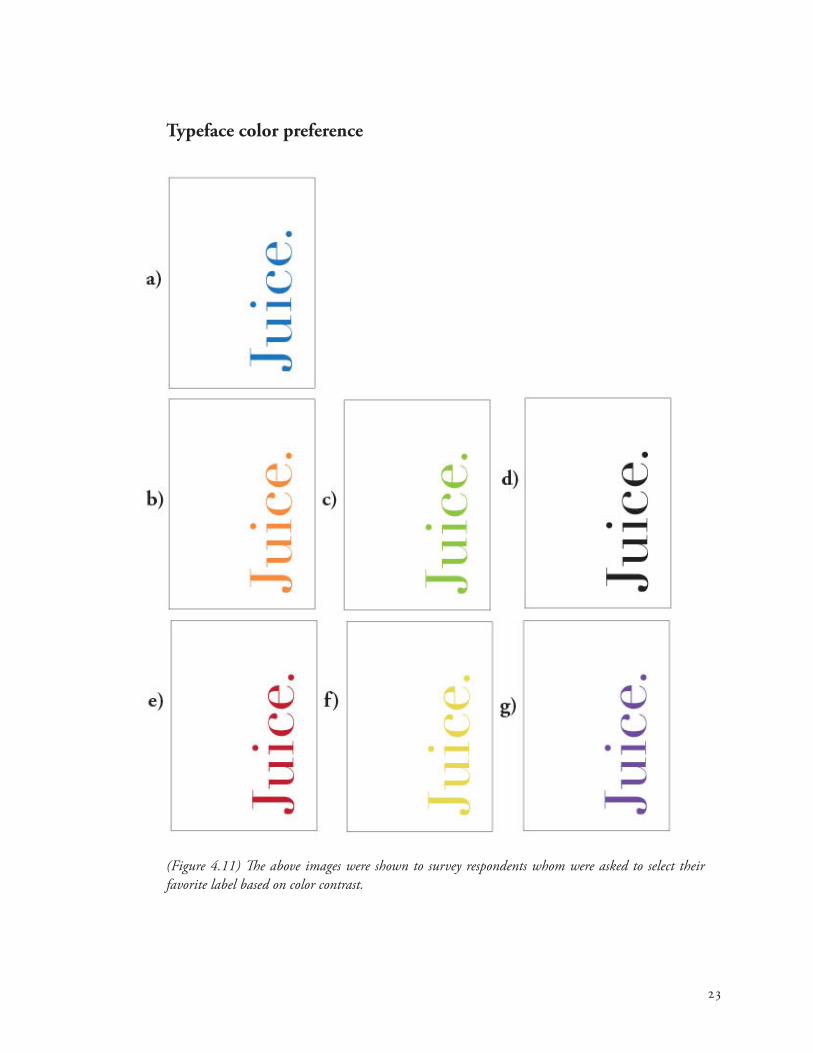
(Figure 4.11) The above images were shown to survey respondents whom were asked to select their favorite label based on color contrast.
Typeface color preference

24
17%
10%
10%
21%
14%
7%
21%
Color: 15-‐18 yrs
A
B
C
D
E
F
G
19%
25%
22%
8%
14%
4% 8%
Color: 19-‐25 yrs
A
B
C
D
E
F
G
4%
39%
26%
18%
0% 9%
4%
Color: 26-‐40 yrs
A
B
C
D
E
F
G
13%
20%
20% 13%
26%
4%
4%
Color: 41+ yrs
A
B
C
D
E
F
G
(Figure 4.15) Preference percentage of typeface color in the 15-17 year old age group
(Figure 4.16) Preference percentage of typeface color in the 19-25 year old age group
(Figure 4.17) Preference percentage of typeface color in the 26-40 year old age group
(Figure 4.18) Preference percentage of typeface color in the 40 year old and over age group
20%
30%
15%
10% 0%
15%
10%
Color: 4-‐10 yrs
A
B
C
D
E
F
G
21%
9%
23% 13%
17%
5%
12%
Color: 11-‐14 yrs
A
B
C
D
E
F
G
(Figure 4.13) This pie chart shows the preference percentage of typeface color in the 4-10 year old age group
(Figure 4.14) This pie chart shows the preference percentage of typeface color in the 11-14 year old age group

25
Typeface color preference
Most preferred
Figure 4.11 illustrates the variety in preference for typeface colors across the different age
groups that were surveyed. Orange was the most popular color of typeface amongst the 4-10
year old group. 30% of the group chose orange (reference Figure 4.13). Orange was also the
most preferred typeface color in the 19-25 age group with a 25.4% popularity. In the 11-14
year age group, the green and the blue typefaces were preferred by 43.5% of the respondents.
22.8% of the students preferred the green typeface and 20.7% preferred the blue typeface
(Figure 4.14). In the 15-18 year age group, black, purple, and blue typefaces were preferred
by a collective 58.6% of survey (Figure 4.15). Black and purple typefaces were each preferred
by 20.7% of respondents and the blue typeface was preferred by 17.2% of respondents. Or-
ange was the most favored typeface color in the 26-40 age group with a 33% popularity. In
the 41and older age group, a red typeface was preferred by 25% of respondents.
A B C D E F G 4-‐10 yrs 20.0% 30.0% 15.0% 10.0% 0.0% 15.0% 10.0%
11-‐14 yrs 20.7% 8.7% 22.8% 13.0% 17.4% 5.4% 11.9%
15-‐18 yrs 17.2% 10.3% 10.3% 20.7% 13.8% 6.9% 20.7%
19-‐25 yrs 18.7% 25.4% 22.4% 8.2% 14.2% 3.7% 7.5%
26-‐40 yrs 3.7% 33.0% 22.2% 14.8% 0.0% 7.4% 3.7%
41+ yrs 12.5% 20.0% 20.0% 12.5% 25.0% 4.2% 4.2%
0.0%
5.0%
10.0%
15.0%
20.0%
25.0%
30.0%
35.0%
Preferen
ce Percentage
Color Preference
(Figure 4.19) Graph and chart show preference of typeface color across all age groups
26
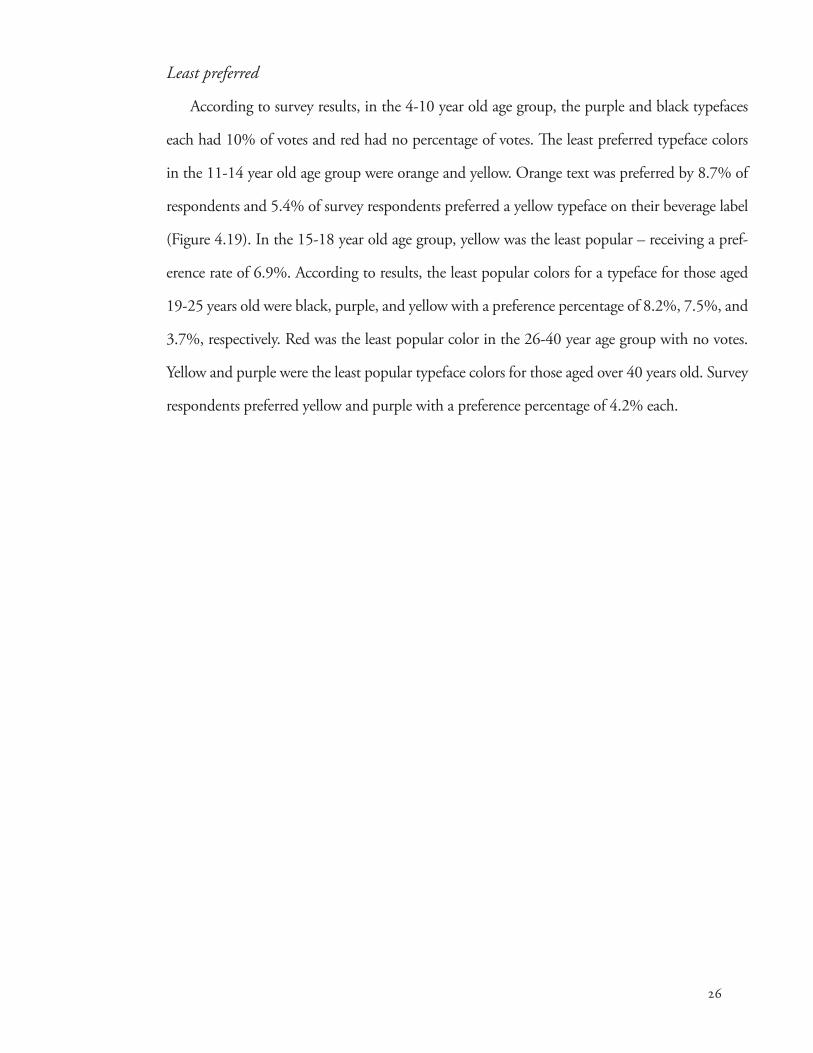
Least preferred
According to survey results, in the 4-10 year old age group, the purple and black typefaces
each had 10% of votes and red had no percentage of votes. The least preferred typeface colors
in the 11-14 year old age group were orange and yellow. Orange text was preferred by 8.7% of
respondents and 5.4% of survey respondents preferred a yellow typeface on their beverage label
(Figure 4.19). In the 15-18 year old age group, yellow was the least popular – receiving a pref-
erence rate of 6.9%. According to results, the least popular colors for a typeface for those aged
19-25 years old were black, purple, and yellow with a preference percentage of 8.2%, 7.5%, and
3.7%, respectively. Red was the least popular color in the 26-40 year age group with no votes.
Yellow and purple were the least popular typeface colors for those aged over 40 years old. Survey
respondents preferred yellow and purple with a preference percentage of 4.2% each.
27
Chapter 5
Conclusion
Although the survey respondents did not prefer consistent package design elements, sig-
nificant patterns did develop between the age groups’ preferences of juice labels.
Overall, the label with a normal san serif was the least popular (label D). The script type-
face was high ranking in five out of the six age groups, except for those aged 4-10 years old.
Additionally, the modern typeface was either first or second in preference amongst five of the
age groups.
According to the survey results, a small horizontally centered logo was preferred on a bev-
erage logo by many respondents (label A). Other preferred labels had logos that were small
and horizontally aligned to the bottom left (label B); large and vertically aligned to the left
(label F); large and horizontally centered at the bottom (label I); and small and horizontally
aligned to the bottom right (label C). The least preferred labels amongst the age groups had
logos that were small and vertically aligned to either the left or right (labels D and E). In-
terestingly of the two labels that were both large and vertically aligned, one was significantly
more popular. Label F which read from the bottom to the top was preferred over label G
which was read from top to bottom (reference Figure 4.3).
A kraft paper label with white text and a black label with white text were both popular
choices amongst all age groups. The kraft paper with white text (label A) was most pre-
28
ferred by those older than 19 years old while the black label with white text (label B) was
most preferred by those aged 18 and younger.
According to survey responses, a label with high contrasting colors was popular for all
age groups questioned. The label with low contrast was least popular, most likely due to
its poor readability.
Yellow and purple colored typefaces were least popular overall (reference Figure 4.19).
The red typeface received no votes in the 4-10 age group and the 26-40 age group. The
green typeface received the highest percent of preference – over 10% or higher for all age
groups (Figure 4.19). The next most popular color typefaces were orange, blue, and black.
In conclusion, a single label consisting of the qualities surveyed would not be success-
ful for all age groups; however, there are individual elements favored by all age groups
that could be applied to a beverage label’s design. Although a script typeface was highly
favored by all except one age group, the modern typeface was popular in all age groups. A
centered horizontal logo was appealing for all age groups. Both the black and white label
and the kraft paper logo with white text were attractive to all age groups. On average, all
age groups preferred a high contrast beverage label. Lastly, a green typeface was not the
number one choice for all age groups, but it ranked high overall in all age groups compared
to the other colors.
Below are three examples of what an “ideal” label would look like based on survey
results. These labels posess elements more than one age group was attracted to. The first
label is on kraft paper with white text. A small, centered modern typeface is used in this
label. The second label is black with white text. The script typeface is small and horizon-
tally aligned to the bottom left. The third label has a modern typeface logo that is large and
vertically aligned to the left. The third label also has high contrasting colors.

29
A beverage label with one or more of these key qualities would likely be popular for
consumers of all ages. If beverage companies designed their labels in a way to attract more
customers, it is projected their sales would be more successful than beverage companies that
target only one target market.
An interesting study for the future might be the same research for different types of bev-
erages such as water or carbonated soft drinks.
Juice
Juice

30
References
Ampuero, O., & Vila, N. (2006). Consumer perceptions of product packaging Journal of
Consumer Marketing, 23(2), pp. 100-112.
Aslam Mubeen (2006), Are you selling the right color? A cross-cultural review of colour as
a marketing cue. Journal of Marketing Communications. 12(1), pp. 15-30.
Mushtaq, U. (2013, March 18). Color psychology. Retrieved from http://dailykashmirim-
ages.com/news-color-psychology-40375.aspx.
Elliot, S., & Barth, J. (2012), Wine label design and personality preferences of millennials.
The Journal of Product and & Brand Management, 21(3), pp. 183-191.
Fuhrman, E. (2009). Labels designed to sell. Beverage Industry, 100(2), 48.
Mohan, G., Sivakumaran, B., & Sharma, P. (2013). Impact of store environment on im
pulse buying behavior. European Journal of Marketing, 47(10), pp. 1711-1732.
Henley, C., Fowler, D., Yuan, J., Stout, B., & Goh, B. (2011). Label design: Impact of
millennials’ perceptions of wine. International Journal of Wine Business Research,
23(1), pp. 7-20.
Hill, H., & Tilley, J. (2002) Packaging of children’s breakfast cereal: Manufacturers versus
children. British Food Journal, 104(9), pp. 776-777.
Hollywood, L., Wells, L., Armstrong, G., & Farley H. (2013). Thinking outside the caton:
Attitudes towards milk packaging. British Food Journal, 115(6), pp. 899-912.
Jacobsen, J. (2012). Clear and concise attention grabbers. Beverage industry, 103(4),54.
Katz, S. E., & Breed, F. S. (1922) The Color Preferences of Children. Journal of Applied
Psychology, 6(3), 255-266. Doi: 10.1037/h0075274.

31
Machleit, K., & Eroglu, S. (2000). Describing and measuring emotional response to shop-
ping experience. Journal of Business Research, 49(2), pp. 101-111.
Mohan G., Sivakumaran, B., & Sharma, P. (2013). Impact of store environment of impulse
buying behavior. European Journal of Marketing, 47(10), pp. 1711-1732.
Penn, C. (2007). Beverage industry’s 2007 packaging survey. Beverage Industry, 98(5), 32.
Richardson, O., & Dennis, C. (2003). Uk vineyards sector case study: Analysis of retail
activities using strategic marketing tools. British Food Journal, 105(9), pp. 634-652.
Sherman, S., & Tuten, T. (2011). Message on a bottle: The wine label’s influence. Interna
tional Journal of Wine Business Research 22(3), pp. 221-234.
Silayoi, P., & Speece, M. (2004). Packaging and purchase decisions. British Food Journal,
106(8), pp. 607-628.
Statia Elliot, J.E. (Joe) Barth, (2012) “Wine label design and personality preferences of mil-
lennials”, Journal of Product & Brand Management, Vol. 21 Iss: 3, pp.183-191
“The power of PepsiCo 2011 annual report”. (2011). http://www.pepsico.com/annual11/
downloads/PEP_AR11_2011_Annual_Report.pdf.
Theodore, S. (2001). Can you judge a beverage by its package? Beverage Industry, 92(2), 36.
Walsh, L. M., Toma, R.B., Tuveson, R.V.,& Sondhi, L. (1990). Color preference and food
choice among children. Journal of Psychology. 124(6), pp. 645-654.
Zaichkowsky, J. L. (2010). Strategies for distinctive brands. Journal of Brand Manage
ment, 17(8), pp. 548-560. doi:http://dx.doi.org/10.1057/bm.2010.12
32
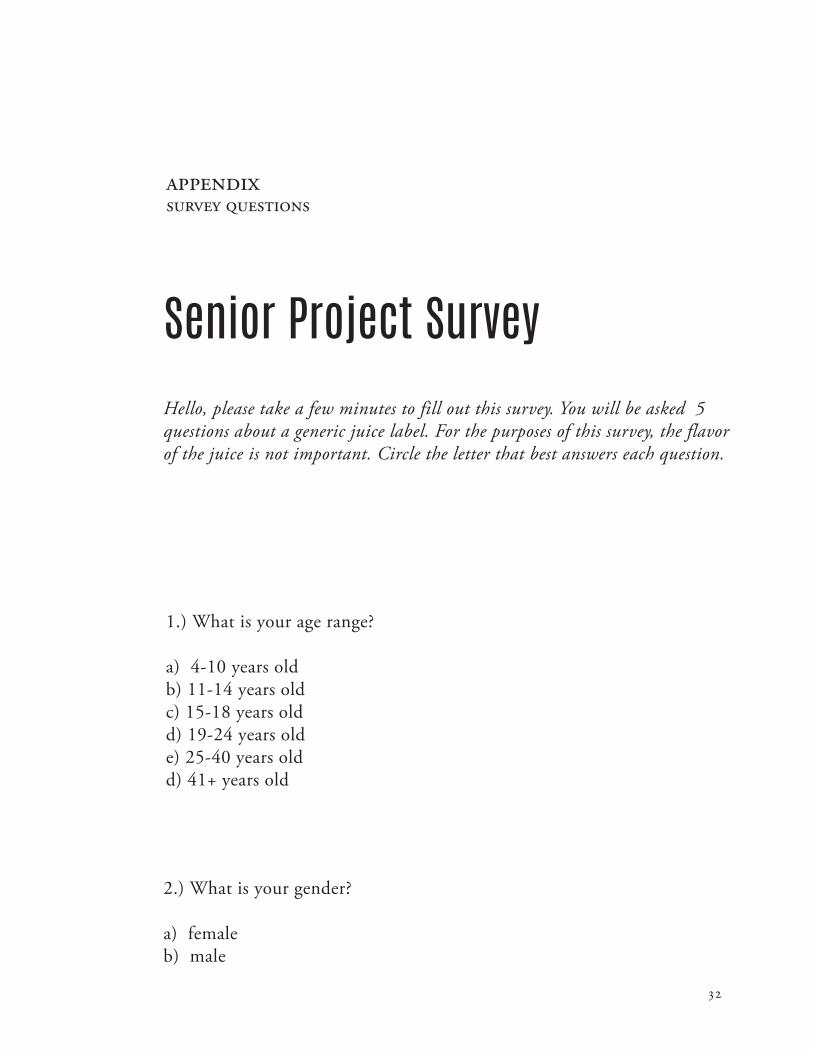
Appendix Survey Questions
Senior Project SurveyHello, please take a few minutes to fill out this survey. You will be asked 5 questions about a generic juice label. For the purposes of this survey, the flavor of the juice is not important. Circle the letter that best answers each question.
1.) What is your age range?
a) 4-10 years oldb) 11-14 years oldc) 15-18 years oldd) 19-24 years olde) 25-40 years oldd) 41+ years old
2.) What is your gender?
a) femaleb) male

33
Juice JUICE
JUICE Juice
3.) Based on typeface alone, please circle the letter of the label you like best.
a)
c)
b)
d)
34
JUICE
JUICE
JUICEJUICE
JUICE
JUICE
JUICE
JUICE JUICE
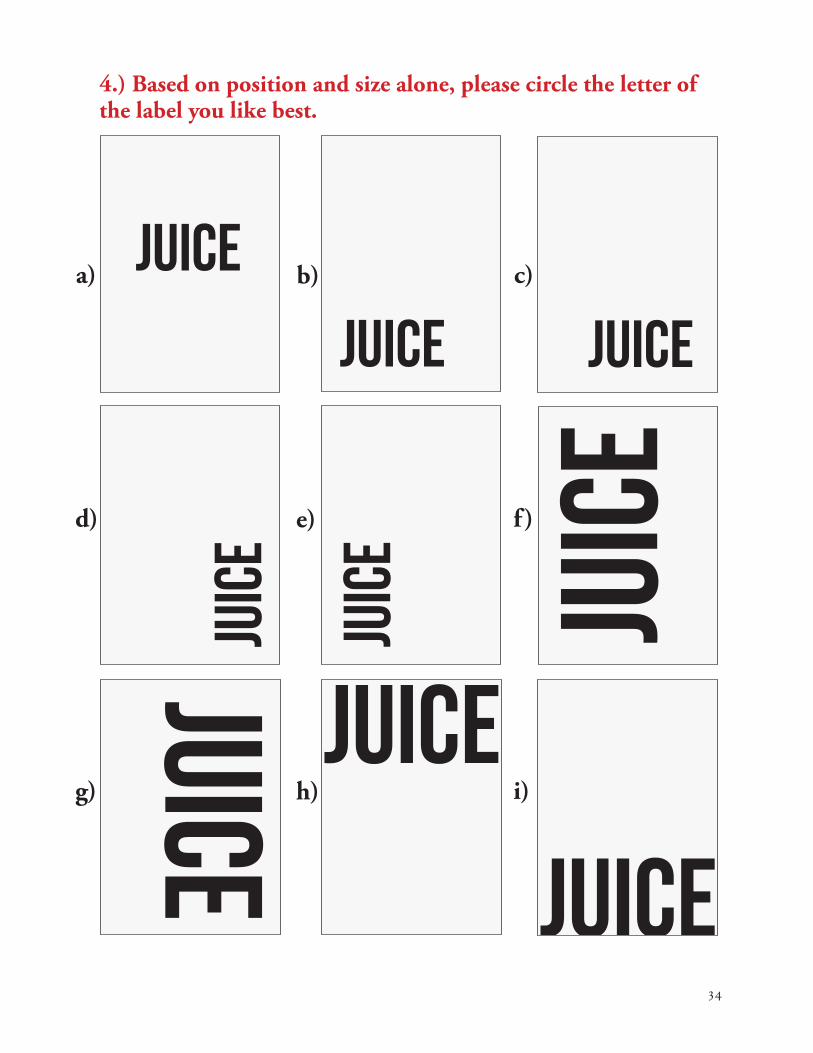
4.) Based on position and size alone, please circle the letter of the label you like best.
a)
d)
g)
b)
e)
h)
c)
f )
i)

35
Juic
e.
Juic
e.
Juic
e.
Juic
e.
5.) Based on paper color alone, please circle the letter of the label you like best.
a)
c)
b)
d)

36
Juic
e.
Juic
e.Ju
ice.
6.) Based on the type color and background, please circle the letter of the label you like best.
a)
c)
b)

37
Juic
e.Ju
ice.
Juic
e.Ju
ice.
Juic
e.Ju
ice.
Juic
e.
7.) Based on type color alone, please circle the letter of the label you like best.
a)
d)
g)
b)
e)
c)
f )