Embed Size (px)
Citation preview

Research Institute of Industrial Economics
P.O. Box 55665
SE-102 15 Stockholm, Sweden
www.ifn.se
IFN Working Paper No. 954, 2013
Hierarchies, the Small Firm Effect, and Entrepreneurship: Evidence from Swedish Microdata
Joacim Tåg, Thomas Åstebro and Peter Thompson

Hierarchies, the Small Firm Effect, and Entrepreneurship:
Evidence from Swedish Microdata
Joacim Tåg*
Research Institute of Industrial Economics (IFN)
Thomas Åstebro**
HEC Paris
Peter Thompson***
Emory University
February 2013
We explore whether the tendency for smaller firms to have fewer hierarchical layers ex-
plains the well-documented inverse correlation between firm size and the rate at which
employees become business owners. Our analysis is based on a Swedish matched employ-
er-employee dataset. Conditional on firm size, employees in firms with more layers are
less likely to enter entrepreneurship, to become self-employed, and to switch to another
employer. The effects of layers are much stronger for business creation than for job-
switching and they are stronger for entrepreneurship than for self-employment. Howev-
er, hierarchies constitute only a partial explanation of the small firm effect. Potential
explanations for the effects of layers are examined. Part of the effect appears to be due to
preference sorting by employees, and part due to employees in firms with fewer layers
having a broader range of skills.
Key words: entrepreneurship; employee mobility; hierarchy, rank, small firm effect.
JEL codes: L26, D20, J20, M50.
*Research Institute of Industrial Economics (IFN), Box 55665, SE-102 15 Stockholm, Sweden. E-
mail: [email protected]. Joacim gratefully acknowledges financial support from Vinnova and the
Jan Wallander and Tom Hedelius Foundation. **HEC Paris, 1 rue de la Liberation, 78351 Jouy-
en-Josas Cedex, France. Email: [email protected]. ***Goizueta Business School, Emory University,
1300 Clifton Road, Atlanta, GA 30322, USA. Email: [email protected].

1
1. Introduction
Compared with their counterparts in large firms, workers in small firms are more like-
ly to separate from their employers (Anderson and Meyer, 1994; Lazear and Shaw,
2008) and those that leave small firms are more likely to become entrepreneurs or
self-employed than those leaving large firms (Wagner, 2004; Dobrev and Barnett,
2005; Gompers et al., 2005; Elfenbein, Hamilton and Zenger, 2010; Chen, 2012). While
higher job separation rates in small firms are in part due to the greater volatility of
jobs and job types in small and young firms (Haltiwanger, Jarmin and Miranda, 2011),
higher rates of entrepreneurship among movers suggests that employees of small
firms are different from their counterparts in large firms. We will follow Elfenbein et
al. (2010) and refer to the greater propensity of employees of small firms to establish
businesses as the small firm effect.
One potential explanation for the small firm effect is the segregation of observable
worker types in to large and small firms. For example, Frederiksen (2006) shows that
women in Denmark are both more likely to separate from their jobs and more likely to
be employed in a small firm. Similarly, separation rates are higher for the less educated
and educational attainment is on average lower in small firms. Because small firms are
younger on average, job tenure is lower and this, too, is associated with higher separa-
tion rates. But these readily observable characteristics of employees in small firms do
not explain higher rates of entrepreneurship: women are markedly less likely to be-
come entrepreneurs than men, and neither tenure nor education are good predictors
of entrepreneurship among movers.
Elfenbein et al. (2010) find evidence of segregation of unobservable worker types.
First, small firms offer greater autonomy and a greater variety of work experiences, so
we might expect that workers with a preference for these work attributes are more
likely to be employed by, and to create, small firms. Elfenbein et al. have a direct meas-
ure of whether individuals in their sample have a desire to become entrepreneurs.
Individuals who do are overrepresented in small firms, and are more likely to subse-
quently establish a business. Second, employees in small firms may have skills that are
especially valuable for the creation of new businesses. These skills may reflect innate
abilities that are better rewarded in small firms so future entrepreneurs select into
small firms, or they may be abilities that are gained as a result of employment in small
firms. Consistent with this hypothesis, Elfenbein et al. find that entrepreneurs with
prior small firm experience have better performance.
Small firms attract individuals with preferences and abilities for entrepreneurship not
just because they are smaller, but because they are different. In particular, small firms
are less bureaucratic, and bureaucracy stifles the accumulation of skills appropriate
for entrepreneurship and repels those with a preference for autonomy and work varie-
ty. Sørensen (2007) reviews the prior literature and sociological arguments for the
negative effects of bureaucracy on entrepreneurship, and examines their implications

2
using Danish microdata. However, lacking direct measures of the extent of bureaucra-
cy, Sørensen associates greater levels of bureaucracy with older and larger firms. As a
result, one cannot infer from his analysis the extent to which varying levels of bureau-
cracy can explain the small firm effect.
In this paper, we use the number of management layers in a firm as an indicator for the
extent of bureaucracy that is independent of firm size, and investigate the extent to
which the correlation between firm size and its hierarchical structure can explain the
small firm effect. Our sample is drawn from Swedish matched employer-employee
dataset, and consists of more than 100,000 firm-level observations and 7 million indi-
vidual-level observations over the period 2001–2008. As our discussion of the data in
Section 2 will make clear, our sample is not a true panel although we do have repeated
observations on both individuals and firms. Following Caliendo and Rossi-Hansberg
(2012) and Caliendo, Monte and Rossi-Hansberg (2012), we identify employees’ ranks
from their job titles and measure the hierarchal structure of the firm by the number of
layers of management it has. Our sample behaves as one would expect from a mean-
ingful measure of hierarchy: upper levels of management contain fewer employees and
pay higher wages than lower levels, and employee transitions are most likely to be to
an adjacent rank.
In Section 3, we demonstrate that a strong small firm effect exists in Sweden, and that
there is a strong correlation between the number of management layers in a firm and
its size. We also show that, conditional on size, employees in firms with more man-
agement layers are less mobile. This is true regardless of the mover’s destination, but
the effect of layers on business creation is much greater than its effect on relocation to
other incumbent firms. We decompose business creation into self-employment and
entrepreneurship, defined by the legal form of business that is created. More layers in
a firm suppress both types of business creation. However, despite the magnitude of the
effect of layers, the small firm effect persists. Our point estimates suggest that the hier-
archical structure of the firm accounts for about one fifth of the small firm effect.
In Section 4, we examine potential explanations for the effect of layers on mobility in
general and business creation in particular. We first look at evidence for the prefer-
ence sorting hypothesis. Individuals with a strong preference for entrepreneurship
should be more willing to establish businesses that yield low financial returns, and
they should also persist in business for longer. We test these implications, and con-
clude that employees of small firms do behave in ways consistent with preference sort-
ing. We then assess whether there are differences in entrepreneurial ability among
employees of firms with different layers of management. We frame our analysis
around Caliendo and Rossi-Hansberg’s information-processing model, which relates
the number of management layers in a firm to the breadth of problems that employees
at different ranks are expected to be able to solve. Although they do not study their
model’s implications for employee separations, we derive and test two implications.
3
First, employees in firms of a given size but with fewer layers should have a higher
propensity to enter entrepreneurship and self-employment and to be more successful
when they do. Our evidence on business creation rates are consistent with the infor-
mation-processing model (but also with preference sorting); our evidence on earnings
do not support the model. Second, the propensity for business creation is greater when
employees of a given rank have more layers beneath them. We find string support for
this prediction.
Our third investigation is an examination of the career concerns model. Hierarchies
offer opportunities for promotion and if the increment to wages that is associated with
a rise in rank is large, the opportunity cost of mobility increases and job separation
rates will decline. We consider three distinct measures of a firm’s wage policy, but find
no evidence to support the career concerns hypothesis. Finally, we explore whether
the model of job mismatching developed in Åstebro, Chen and Thompson (2011) can
explain the effect of layers. In their model, mismatching occurs when employees of
differing skills are put to work together. Such mismatching is more likely in the tails of
the ability distribution so we see greater mobility from the tails. We hypothesize that
layers create a functional separation between agents of high and low ability, and
thereby reduces mismatching problems. We find clear evidence that such mismatching
is occurring in our sample, but no evidence that this explains the effect of layers.
2. The Data
The data are drawn from two distinct sources, one at the firm level and one at the indi-
vidual level. The firm level dataset comes from the IFN Corporate Database (IFNCDB),
which is based on official mandatory accounting data filed to the Swedish Companies
Registration Office. The individual level dataset is based on the Statistics Sweden’s
LISA database drawing on several official registry databases of every person living in
Sweden. From the IFNCDB we extract the annual accounts of firms, and from the LISA
database we obtain information on occupation codes, firm-worker links, worker’s la-
bor income, worker’s capital income, and numerous other worker characteristics. We
make use of firm- and individual-level data for the period 2001–2008.1 We drop dupli-
cated firm-year information (multiple annual accounts can be submitted each year)
and then merge the firm and individual level data. We drop firms active in the health,
education, agriculture and fishing industries, and also firms in the public sector, in
order to focus on private sector firms. Given our focus on hierarchies, we restrict at-
tention to firms with more than 5 employees (we lose 76 percent of all firm-year ob-
servations since most Swedish firms are small). We also restrict attention to individu-
als between the ages of 20 and 60.
1 Accurate occupation data is only available from 2001 and onwards.

4
Because we will construct indicators of employee rank and organizational structure
from information on occupational codes assigned by Statistics Sweden, we further re-
strict our sample to include only firms with sufficient occupation data for its employ-
ees. In the sample of firms with more than 5 employees, 63 percent of all individual-
level observations have accurate occupation data as the occupation data is based on
surveys and does not have complete coverage. Because occupation data is not com-
plete for every year, we drop firm-year observations with fewer than 75 percent of all
employees having accurate occupation data. This involves mainly smaller firms that
are less likely to be sampled by Statistics Sweden and it reduces the firm-year sample
size by another 76 percent. In our final sample, 91 percent of all individual-level ob-
servations have accurate occupation data and it covers 48 percent of all individual-
year observations in the initial dataset.
In each year, we track whether employees remained with their current firm, switched
to another incumbent firm, or created and became primarily occupied in running their
own business. We follow the definition used by Statistics Sweden to define entrepre-
neurs and self-employed. Statistics Sweden defines an individual as being employed in
her own firm in a given year if her total income from her own company (labor and cap-
ital income) is greater than 62.5 percent of all other labor income.2 We define an indi-
vidual as entering entrepreneurship in any given year if the following criteria are sim-
ultaneously fulfilled:
1. Newly occupied in own business. An individual is classified by Statistics Swe-
den as working in her own company in the current year, but had not been in the
previous year.
2. New place of work. The individual’s current firm and establishment identifiers
are different from the previous year, and
3. New firm. No individual in our sample had worked for the current firm in the
previous year.
Statistics Sweden also separates sole proprietorships from limited liability companies.
Because an individual who intends to create a growing company likely will establish a
limited liability company, we characterize agents starting limited liability companies
as “entrepreneurs”, and agents starting sole proprietorships “self-employed”.3
2 Statistics Sweden treats self-employment as the primary occupation even though it may gen-erate less income than other activities, because self-employment typically generates lower hourly wages.
3 The mean size of a limited liability company two years after creation is 5.3 employees with a standard deviation of 8.3, while the mean size of a sole proprietorship is 1.2 employees with a standard deviation of 0.9. Henrekson and Sanandaji (2013) survey the literature on entrepre-neurship and self-employment and demonstrate the importance of separating between entre-preneurs and the self-employed using data on billionaire entrepreneurs.

5
Table 1
Sample size
Year Firms Workers To other firm To self
employment To
entrepreneurship
2001 20,364 1,042,267 155,063 3,061 465
2002 19,051 1,155,587 156,242 3,451 434
2003 13,535 1,079,013 139,370 4,103 1,125
2004 11,831 1,048,657 137,992 4,249 1,103
2005 12,426 1,059,188 140,544 4,329 1,042
2006 13,026 1,060,428 146,305 3,763 1,268
2007 15,516 1,107,941 152,545 4,050 1,537
Total 105,749 7,553,081 1,028,061 27,006 6,974
Table 1 displays numbers on the sample size of the final dataset. It contains 105,749
firm-year observations covering 61 percent of value added and 53 percent of employ-
ment in the Swedish private sector. Of around 7.5 million employee-level observations,
about 14 percent transitions to a new incumbent employer in each year, about 0.36
percent enter self-employment, while just 0.1 percent enters entrepreneurship. The
number of firms in the sample varies considerably across years, likely a result of dif-
ferent sampling of occupation codes over time. Moreover, parts of the surveys are tar-
geted to certain sectors in certain years, which probably accounts for the large jumps
in the number of observations per year.
2.1 Occupation classifications, rank and management layers
Our data on the hierarchical structure of firms are developed out of occupational clas-
sifications obtained from Statistics Sweden’s LISA database. The Swedish Standard
Classification of Occupations 1996 (SSYK) is a Swedish version of the International
Standard Classification of Occupations (ISCO-88). The SSYK data available from the
LISA database come mainly from the official wage statistics survey (Lönestruktur-
statistiken) and from a supplementary survey of firms not included in the official wage
survey. Between the two surveys, at least 40,000 firms are sampled every year. The
sampling design is a rolling panel,4 and all eligible firms are surveyed at least once eve-
ry five years. Not all firms are included in these surveys. The largest excluded category
is of self-employed workers who do not obtain any wage from a limited liability com-
pany, but the surveys also exclude owners who receive payment from their companies
only in the form of dividends.5
4 Except that firms with at least 500 employees are always included.
5 There have been some attempts since 2004 to survey partnerships and sole proprietorships

6
Table 2
Occupational classifications, skill levels, and rank
SYYK Occupational Classification Skill Level Rank
1. Legislators, senior officials & managers NA 3. CEOs: SSYK 121 (Directors and chief
executives), 131 (Managers of small en-
terprises), 111 (legislators and senior
government officials), 112 (senior officials
of special-interest organizations)
2. Senior staff: SSYK 122 (Production and
operations managers), 123 (Other special-
ist managers)
2. Professionals 4 1. Supervisors: SSYK 200-399 (Profes-
sionals, technicians and associate profes-
sionals)
3. Technicians & associate professionals 3
4. Clerks 2 0. Production workers: SSYK 400-999
(Clerks, service workers and shop sales
workers, skilled agricultural and fishery
workers, craft and related trades workers,
plant and machine operators and assem-
blers, and elementary occupations).
5. Service workers & shop sales workers 2
6. Skilled agricultural & fishery workers 2
7. Craft & related trades workers 2
8. Plant & machine operators & assemblers 2
9. Elementary occupations 1
0. Armed forces NA Omitted
The SSYK assigns workers to one of ten main occupational categories, and one of a
large number of subcategories. Statistics Sweden also assigns each of these occupa-
tional categories to one of four skill levels.6 We use the SSYK codes to assign a rank to
each employee (see Table 2). The highest rank, which we label CEOs, consists of direc-
tors, chief executives, managers of small enterprises, and certain other senior officials.
The next two ranks comprise two levels of managements. The more senior, which we
label as “senior staff”, contain production and operations managers and certain other
specialist managers. The less senior, “supervisors”, consists of workers with occupa-
tions classified in the SSYK as professionals, technicians and associate professionals.
The fourth category, “production workers”, comprises clerks, service workers, plant
and machine operators, and other non-supervisory positions. As Table 2 shows, our
but the coverage is extremely limited.
6 Statistics Sweden notes that, although these skill levels have been made operational in terms of the educational categories of the International Standard Classification of Education, they do not imply that the skills necessary to perform the tasks and duties of a given job can be ac-quired only through formal education.
7
rank classifications broadly coincide with the skill levels attributed to these positions
by Statistics Sweden.
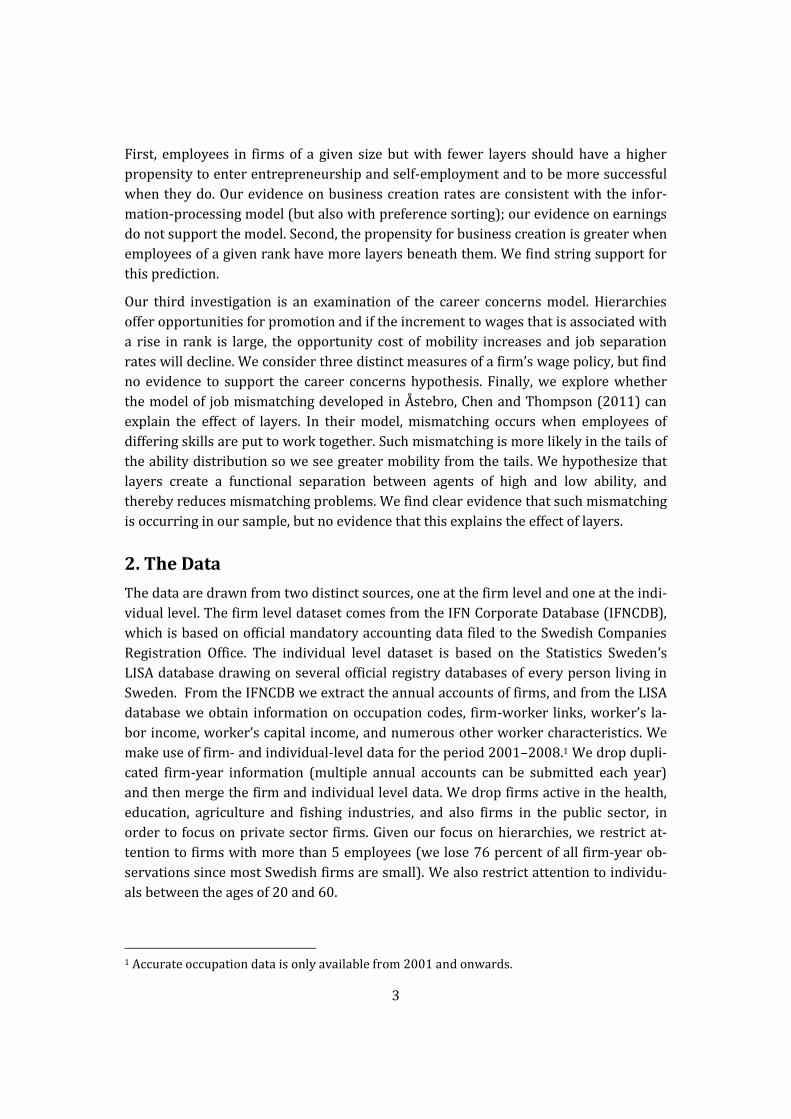
Do our classifications induce patterns consistent with our notions of rank and hierar-
chies? We look first at earnings by rank. The earnings data we use throughout the pa-
per measure each individual’s annual labor income. However, for compactness, we will
generally refer to our earnings measure as the “wage”. Table 3 displays the wage dis-
tribution by rank. Clearly, workers in higher ranks tend to earn more on average than
workers in lower ranks. The same ordering persists at each percentile shown in the
table, with the notable exception of senior staff that earn more than the CEO rank at
the lower percentiles. This reflect in part differences across firms (large firms that pay
more on average are more likely to have senior staff) and in part the tendency of sen-
ior staff to be highly educated. The table also displays that the within-rank wage dis-
tribution is the highest at the top rank and reduces monotonically with lower rank.
Table 4 plots rank transitions (of course the lowest and highest ranks can only transi-
tion in one direction) among workers remaining with the same firm. Transition rates
decline with distance between rank pairs, and most employees do not change rank. For
example, 93.6 percent of production workers are at the same rank three years later,
while 5.4 percent are at the rank of supervisor and less than one percent have attained
either of the two highest ranks. Similarly CEOs are most likely to remain as CEOs;
among those that do switch rank, moving one rank is almost twice as likely as moving
two, and moving two is in turn twice as likely as moving three. Tables 3 and 4 together
suggest that our occupational classifications succeed in capturing a form of distance
consistent with our notion of ranks and hierarchies.
Table 3
Wage distribution across broad occupation classes based on SSYK
Rank Mean Percentiles Wage
Dispersion 10th 25th 50th 75th 90th
3. CEOs and directors 600 232 300 417 669 1,086 1,324
2. Senior staff 540 292 363 469 620 833 775
1. Supervisors 358 201 260 330 421 534 475
0. Production workers 239 127 192 241 288 336 277
Mean 302 151 215 272 348 462 388
Note: Data are in units of 1,000 SEK in 2005 prices.

8
Table 4
Rates of within-company rank transitions
To production
worker
To
supervisor
To
senior staff To CEO
Production worker 93.61 5.44 0.71 0.24
Supervisors 7.63 87.32 4.34 0.71
Senior Staff 4.54 25.55 63.24 7.67
CEO or director 7.10 13.59 22.20 57.11
Transition rates over a three-year period if available; otherwise two years, otherwise one year. Transition rates are very similar if we include employees that switched firms.
Table 5 provides information about within-firm differences in rank populations and in
earnings across ranks. Following Caliendo et al. (2012), a firm-year observation with R
ranks will be said to have L=R s
the probabilities that a lower rank contains more employees than the rank immediate-
ly above it in the firm. In the large majority of cases, the firm’s structure corresponds
to our notion of hierarchies as triangular structures, where higher ranks consist of
small numbers of people supervising larger groups of workers in lower ranks. For ex-
ample, in firms with only one layer of management, the lower of the two ranks in the
firm has more workers in 88 percent of the firm-year observations. Panel B compares
within-firm earnings across ranks. It shows that members of the higher rank earn
more on average than workers in the rank immediately below them in the firm. For
example, in firms with three layers of management, the lowest rank has lower mean
earnings than the next layer in 94 percent of the firm-year observations. These per-
centages are consistent with the earnings distributions summarized in Table 3.
Table 5
Size and wage by layers of management
Layers of management
A
Size
B
Labor Income
0>1 1>2 2>3 0<1 1<2 2<3
1 0.88
0.87
2 0.72 0.90
0.87 0.86
3 0.61 0.92 0.93 0.94 0.92 0.87
The rank numbers do not necessarily correspond to the numbering used in Table 2. For example, a
firm with one CEO and several blue-collar workers will have one layer of management and consist
of workers in ranks 3 and 0. Such firms will appear in the upper left cell of part A.

9
3. Hierarchies and the Small Firm Effect
In this section we explore the relationship between worker mobility, especially into
entrepreneurship and self-employment, and the hierarchical structure of the firm, and
we assess whether the hierarchies offer an explanation for the small firm effect. Table
6, which summarize the raw data on management layers, firm size and earnings, re-
veals patterns consistent with the discussion in section 1. First, firms with more layers
of management tend to be larger, whether size is measured by value added or by the
number of employees. For example, firms with three layers of management have on
average 15 times as many employees as firms with just one layer, and they also pro-
duce 38 percent more value added per worker. Table 6 also documents that firms with
more layers of management pay higher wages. Finally, firms with more layers of man-
agement also have a larger dispersion of wages. If more layers of management, higher
wages and higher wage dispersion all suppress entry into entrepreneurship and self-
employment, then these positive associations between layers, firm size and wages
might well enable hierarchies to explain the firm-size effect.
Table 7 reports the main results of this section. We estimate multinomial logit regres-
sions with four possible outcomes in each year: remain with the current employer,
enter entrepreneurship, enter self-employment, and switch to another employer.
Model A, in columns (1) through (3), includes indicators for firm size, while model B in
the remaining columns adds controls for the number of management layers. The key
result here is that an increase in the number of layers is negatively associated with
mobility of all types, although the effect is much stronger for entry into entrepreneur-
ship and self-employment than it is for moving to another employer. However, the
inclusion of controls for layers has only a modest effect on the estimated impact of firm
size on entry into entrepreneurship and self-employment.
Table 6
Descriptive statistics of sample by layers of management in firm
Layers of
management N
Means Median
Wage Value Added
per worker Employees Wage
Wage
Dispersion
0 21,627 477 13 235 317 225
1 35,245 594 18 253 383 237
2 28,773 717 62 288 457 268
3 20,104 817 268 319 468 295
Total 105,749 646 77 271 406 254
N is the number of firm-year observations. Value added per worker, annual wages and wage
dispersion are in unit of 1,000 SEK at 2005 prices

10
Table 7 Worker Transitions. Multinomial Logit Estimation
Model A Model B
Entrepre-neurship
Self-employment
Other firm Entrepre-neurship
Self-employment
Other firm
(1) (2) (3) (4) (5) (6) CEOs and Directors 1.054*** 0.010 -0.034*** 1.124*** 0.046 -0.030** (0.067) (0.060) (0.012) (0.068) (0.060) (0.012) Senior staff 0.994*** 0.400*** 0.278*** 1.048*** 0.419*** 0.282*** (0.054) (0.036) (0.007) (0.054) (0.037) (0.007) Supervisors 0.748*** 0.259*** 0.031*** 0.776*** 0.269*** 0.033*** (0.039) (0.020) (0.003) (0.039) (0.020) (0.003) Firm layers: 1 -0.250*** -0.200*** -0.042*** (0.061) (0.032) (0.007) Firm layers: 2 -0.336*** -0.243*** -0.078*** (0.060) (0.032) (0.007) Firm layers: 3 -0.461*** -0.215*** -0.055*** (0.063) (0.034) (0.007) Size 50-100 -0.470*** -0.388*** -0.063*** -0.379*** -0.350*** -0.052*** (0.047) (0.026) (0.005) (0.049) (0.027) (0.005) Size 100-500 -0.770*** -0.661*** -0.136*** -0.645*** -0.616*** -0.123*** (0.038) (0.021) (0.004) (0.042) (0.024) (0.004) Size 500-1500 -0.831*** -0.851*** -0.255*** -0.684*** -0.808*** -0.243*** (0.044) (0.025) (0.004) (0.049) (0.029) (0.005) Size >1500 -1.281*** -1.172*** -0.579*** -1.120*** -1.123*** -0.567*** (0.043) (0.023) (0.004) (0.050) (0.028) (0.005) Age (years) 0.152*** 0.107*** -0.080*** 0.152*** 0.107*** -0.080*** (0.012) (0.006) (0.001) (0.012) (0.006) (0.001) Age squared -0.002*** -0.001*** 0.001*** -0.002*** -0.001*** 0.001*** (0.000) (0.000) (0.000) (0.000) (0.000) (0.000) Female -0.855*** -0.653*** -0.094*** -0.850*** -0.650*** -0.093*** (0.039) (0.019) (0.003) (0.039) (0.019) (0.003) Education 0.046*** 0.095*** 0.105*** 0.046*** 0.095*** 0.105*** (0.015) (0.008) (0.001) (0.015) (0.008) (0.001) Log(wage) 0.496*** -0.768*** -0.531*** 0.499*** -0.766*** -0.530*** (0.035) (0.011) (0.002) (0.035) (0.011) (0.002) Tenure (years) -0.086*** -0.134*** -0.156*** -0.085*** -0.134*** -0.156*** (0.010) (0.006) (0.001) (0.010) (0.006) (0.001) Tenure squared 0.001* 0.004*** 0.005*** 0.001* 0.004*** 0.005*** (0.001) (0.000) (0.000) (0.001) (0.000) (0.000) Constant -12.876*** -3.024*** 3.253*** -12.624*** -2.862*** 3.295*** (0.298) (0.128) (0.021) (0.301) (0.130) (0.022) N 6,865,026 6,865,026 6,865,026 6,865,026 6,865,026 6,865,026
Standard errors in parentheses. . *** p<0.01, ** p<0.05, * p<0.1. Size classes are for number of employ-ees. Regressions include 43 industry dummies, 21 county dummies, and year dummies.
Before looking at the key results in more detail, we review the results concerning the
controls in the regressions. As is the case in most samples, tenure is negatively associ-

11
ated with mobility of all kinds,7 while the more educated8 and males are more mobile
regardless of destination. Interestingly, individual wages have impacts that differ by
destination. Individuals with higher wages are less likely to switch to another incum-
bent employer and less likely to enter self-employment. However, a higher wage is
associated with an increase in the propensity to become an entrepreneur. The con-
trasts between these effects of individual wages are not only statistically significant,
they are economically meaningful. For example, a one standard deviation increase in
log income is associated with a decline in the odds of switching employers (relative to
staying with the current employer) of 15 percent, with a decline in the odds of entering
self-employment of 38 percent, but with an increase in the odds of entering entrepre-
neurship of 4.4 percent. Employee age similarly has disparate effects on mobility by
destination. Increasing age raises the probability of entering entrepreneurship and
self-employment until a peak hazard is attained at 43 years of age for entrepreneur-
ship and 48 years for self-employment, after which the hazard declines. In contrast,
increasing age reduces the probability of switching incumbent employers until a mini-
mum hazard is attained at about 47 years of age.
These results for the control variables suggest that mobility is driven by a complex
interplay of multiple forces. For examples: the negative effect of tenure on mobility of
all kinds is consistent both with job matching models (e.g., Jovanovic, 1979) and with
survivor bias caused by unobserved heterogeneity across individuals in the propensity
to move; the initially positive impact of age on business creation might reflect the ef-
fect of wealth constraints that are relaxed as an agent ages and saves, or the conse-
quences of on-the-job learning specific to the demands of business creation; and the
contrast between the effects of individual wages on entrepreneurship and self-
employment recalls the mismatching model of Åstebro, Chen and Thompson (2011), in
which business creation is more likely among agents with especially high and especial-
ly low ability.
We return now to consideration of the main effects of firm size, rank, and management
layers on mobility. Consider first the role of rank. Employees in supervisory positions
are much more likely than production workers (the omitted category) to enter entre-
preneurship, and the propensity to do so rises with each increase in rank. CEOs, direc-
7 The positive coefficients on the quadratic terms indicate a non-monotonic effect of tenure. For entry into entrepreneurship and self-employment the minima are attained at 39 and 18 years of tenure; for movements to another incumbent employer the minimum is at 15 years. Howev-er, the predicted effect of tenure is greater than these minima and extrapolates outside most of our sample observations.
8 Education is on a scale from 1–6 corresponding to: 6. Postgraduate education; 5. Post-secondary education, two years or longer; 4. Post-secondary education, less than two years; 3. Upper secondary education; 2. Primary and lower secondary education; 9 or 10 years; and 1. Primary and lower secondary education, less than 9 years.

12
tors and senior staff are almost three times more likely than production workers to
found a limited liability company, while supervisors are more than twice as likely to do
so (Figure 1 plots the odds ratios). Senior staff and workers with supervisory rank are
also more likely to enter self-employment. The effects are smaller than for entrepre-
neurship, however, and CEOs are no more likely to become self-employed than pro-
duction workers.9 Finally, CEOs and Directors are less likely to switch employers than
production workers, while Senior Staff and Supervisors are more likely to do so than
production workers. In this case, however, the magnitudes of the differences are trivi-
al.
Table 7 contains four indicators for size categories, the omitted category being firms
with fewer than 50 employees. The point estimates reveal a strong negative effect of
increasing firm size on mobility; regardless of destination (see also Figure 2). For ex-
ample, employees in the largest firms are only one third as likely as employees in the
smallest firms to enter entrepreneurship or self-employment, and they are 44 percent
less likely to switch to another employer. The effect of firm size is not limited to a con-
trast between the largest and smallest firms. As Figure 2 illustrates, each change in
firm size class is in almost all cases associated with a similar change in the odds of mo-
bility. Clearly, there is a small firm effect on mobility in general. However, the differen-
tial effect of firm size on movements into business creation relative to movement to
other firms also demonstrates that there is a strong small firm effect on entrepreneur-
ship and self-employment even conditional on job separation. Model B in Table 7 in-
cludes controls for layers of management and shows that, even though we condition on
firm size and employee rank, more layers are associated with less mobility of all kinds
(see Figure 3 for the odds ratios). Business creation rates, especially in entrepreneur-
ship, are strongly affected by adding layers of management. For example, moving from
zero to one layer of management reduces the likelihood of a transition to entrepre-
neurship by 22 percent and the likelihood of a transition to self-employment by 18
percent. There is, however, an interesting contrast between the effects of layers on
entrepreneurship and self-employment. In the former case, each increment to the
number of layers in the firm significantly reduces the odds of entrepreneurship. In the
latter case, movement between zero and any other number of layers reduces self-
employment, but there is no effect of any increment beyond zero layers. The effect of
layers on movement to other incumbent firms, while statistically significant on account
of the large sample size, is small: in the largest estimated effect, when moving from
zero to two layers of management, the relative odds of job switching decline by less
than 8 percent.
9 Supervisors are about 25 percent more likely than production workers to become self-employed. Senior staff is 50 percent and CEOs are less than ten percent more likely to do so.

13
0
1
2
3
4
0
1
2
3
4
Od
ds
Rat
io
Rank
Entrepreneurship
Self-employmentJob switching
Figure 1. Odds Ratios of Mobility, by destination and rank, with 95% confidence intervals. From model A of Table 7.
0
1
0
0.2
0.4
0.6
0.8
1
1.2
Od
ds
Rat
io
Firm Size (no. of employees)
Entrepreneurship Self-employment
Job switching
Figure 2. Odds Ratios of Mobility, by destination and firm size, with 95% confidence intervals. From model A of Table 7.
14
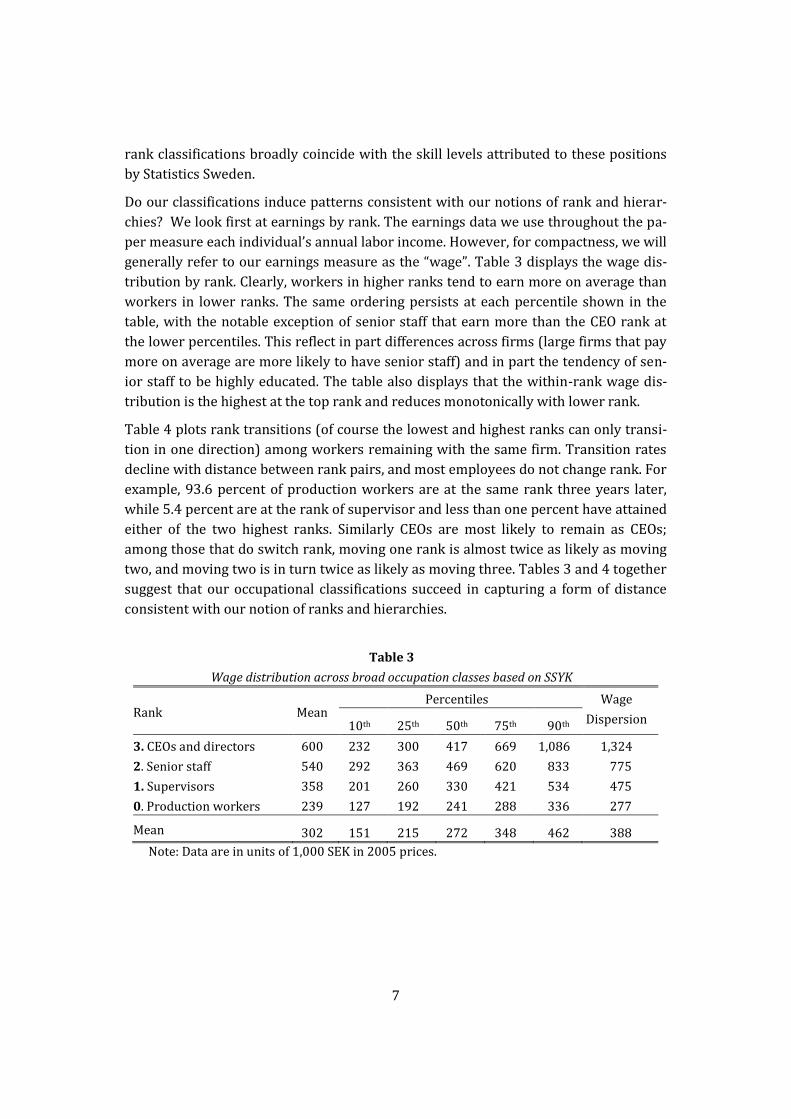
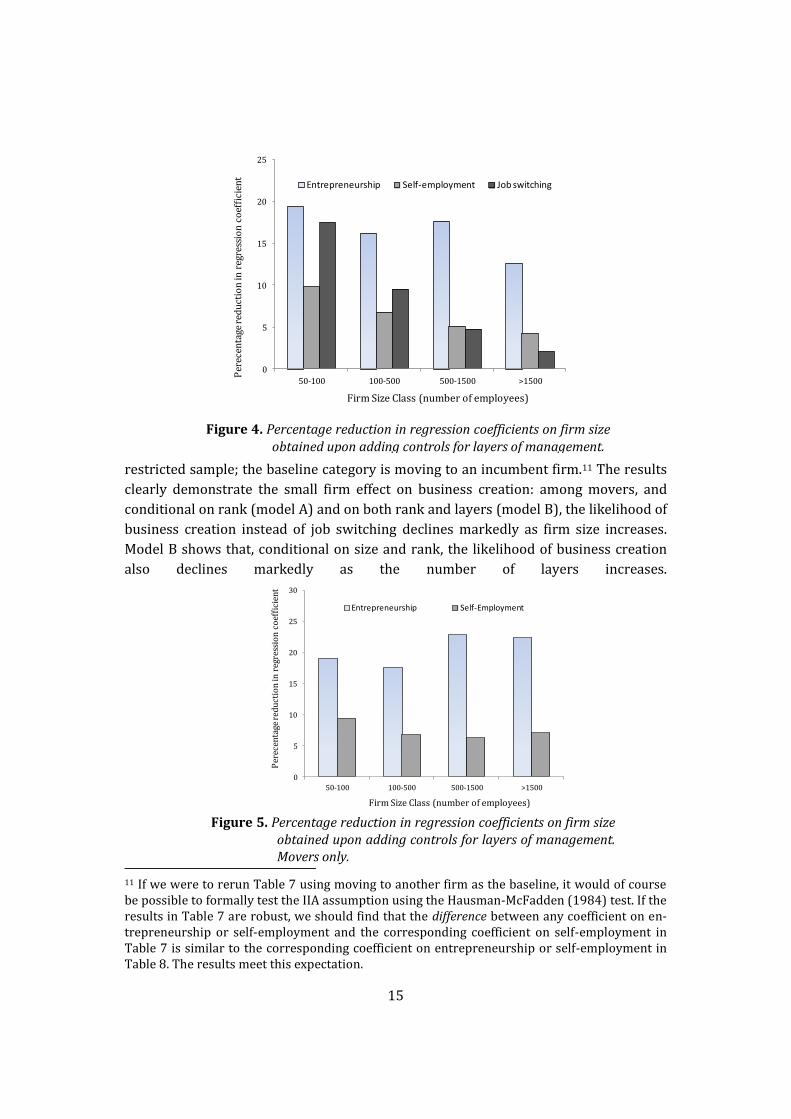
Although management layers have a profound effect on the likelihood of transitions
into entrepreneurship and self-employment, and the number of layers is strongly cor-
related with firm size, adding layers to the regressions explains only a modest fraction
of the small firm effect. All six coefficients for firm size in columns (4) and (5) are
smaller than their counterparts in columns (1) and (2), consistent with our conjecture
that management layers may explain part of the small firm effect. However, the reduc-
tions are rather modest, ranging from 13 to 20 percent for entrepreneurship, 4 to 10
percent for self-employment, and from 2 to 17 percent for job switching (see Figure 4).
10 Thus, although we have found that layers of management have a large effect on the
likelihood of a transition to entrepreneurship and to a somewhat lesser extent on the
likelihood of a transition to self-employment, that layers and firm size are positively
correlated, and that firm size is negatively correlated with mobility, layers explain on
average only about 10 percent of the estimated firm size effect.
Because self-employment and entrepreneurship are likely strong substitutes among
those considering separation from their employer, it is useful to verify the robustness
of the results in Table 7 by restricting the choice set. We do so by examining the odds
of self-employment and entrepreneurship relative to job switching after restricting the
sample to movers. Table 8 reports estimates of multinomial logit estimation on this
10 The largest reduction in coefficient size for job switching is based on a small initial effect: the odds ratio of switching to an incumbent employer for employees in size class 50–100 (relative to less than 50 employees) increases from 0.938 to 0.949 after the addition of controls for lay-ers.
0.5
1.1
0.5
0.6
0.7
0.8
0.9
1
1.1
1 2 3 1 2 3 1 2 3
Od
ds
Ra
tio
Layers of Management
Entrepreneurship Self-employment
Job switching
Figure 3. Odds Ratios of Mobility, by destination and number of layers in employee’s firm, with 95% confidence intervals. From model B of Table 7
15
0
5
10
15
20
25
30
50-100 100-500 500-1500 >1500
Per
ecen
tage
red
uct
ion
in r
egre
ssio
n c
oef
fici
ent
Firm Size Class (number of employees)
Entrepreneurship Self-Employment
restricted sample; the baseline category is moving to an incumbent firm.11 The results
clearly demonstrate the small firm effect on business creation: among movers, and
conditional on rank (model A) and on both rank and layers (model B), the likelihood of
business creation instead of job switching declines markedly as firm size increases.
Model B shows that, conditional on size and rank, the likelihood of business creation
also declines markedly as the number of layers increases.
11 If we were to rerun Table 7 using moving to another firm as the baseline, it would of course be possible to formally test the IIA assumption using the Hausman-McFadden (1984) test. If the results in Table 7 are robust, we should find that the difference between any coefficient on en-trepreneurship or self-employment and the corresponding coefficient on self-employment in Table 7 is similar to the corresponding coefficient on entrepreneurship or self-employment in Table 8. The results meet this expectation.
0
5
10
15
20
25
50-100 100-500 500-1500 >1500
Per
ecen
tage
red
uct
ion
in r
egre
ssio
n c
oef
fici
ent
Firm Size Class (number of employees)
Entrepreneurship Self-employment Job switching
Figure 4. Percentage reduction in regression coefficients on firm size obtained upon adding controls for layers of management.
Figure 5. Percentage reduction in regression coefficients on firm size obtained upon adding controls for layers of management. Movers only.

16
Table 8 Transitions among movers. Multinomial logit estimation
Model A Model B
Entrepreneurship Self-employment Entrepreneurship Self-employment
CEOs and Directors 1.220*** 0.244*** 1.293*** 0.267*** (0.071) (0.062) (0.072) (0.062) Senior staff 0.846*** 0.154*** 0.895*** 0.168*** (0.055) (0.037) (0.055) (0.038) Supervisors 0.734*** 0.220*** 0.762*** 0.228*** (0.039) (0.020) (0.039) (0.020) Firm layers: 1 -0.174*** -0.164*** (0.061) (0.033) Firm layers: 2 -0.285*** -0.191*** (0.061) (0.033) Firm layers: 3 -0.426*** -0.176*** (0.064) (0.034) Size 50-100 -0.487*** -0.329*** -0.394*** -0.298*** (0.048) (0.027) (0.050) (0.028) Size 100-500 -0.741*** -0.531*** -0.610*** -0.495*** (0.038) (0.021) (0.043) (0.024) Size 500-1500 -0.664*** -0.589*** -0.512*** -0.552*** (0.044) (0.026) (0.049) (0.029) Size >1500 -0.746*** -0.567*** -0.579*** -0.527*** (0.043) (0.023) (0.050) (0.028) Age (years) 0.204*** 0.176*** 0.204*** 0.176*** (0.012) (0.006) (0.012) (0.006) Age squared -0.002*** -0.002*** -0.002*** -0.002*** (0.000) (0.000) (0.000) (0.000) Female = 1 -0.826*** -0.545*** -0.822*** -0.543*** (0.039) (0.019) (0.039) (0.019) Education -0.027* 0.006 -0.027* 0.006 (0.015) (0.008) (0.015) (0.008) Log(wage) 0.676*** -0.262*** 0.680*** -0.261*** (0.031) (0.011) (0.031) (0.011) Tenure (years) 0.057*** 0.031*** 0.058*** 0.031*** (0.010) (0.006) (0.010) (0.006) Tenure squared -0.002*** -0.002*** -0.002*** -0.002*** (0.001) (0.000) (0.001) (0.000) Constant -13.766*** -6.001*** -13.565*** -5.867*** (0.288) (0.128) (0.291) (0.130)
N 828,683 828,683 828,683 828,683
Standard errors in parentheses. . *** p<0.01, ** p<0.05, * p<0.1. Size classes are for number of employees. Regres-sions include industry dummies, county dummies, and year dummies.
As already noted, the effect of layers is greater for entrepreneurship than for self-
employment, and in the latter case much of the effect is due to the contrast in self-
employment entry rates between firms with zero layers of management and those

17
with more than zero. Finally, as Figure 5 illustrates, the fraction of the small firm effect
that is explained by layers is somewhat larger when the sample is restricted to movers
than it is in the full sample: Adding layers to the regression induces an average 22 per-
cent decline in the coefficients on size for entry into entrepreneurship, although the
decline remains less than 10 percent for self-employment.
4. Why Hierarchies Matter
In the previous section we found that, conditional on firm size, more layers of man-
agement are associated with less mobility of all kinds. While the magnitude of the im-
pact on movements to other employers is small, more layers markedly suppress rates
of business creation by employees. The contrast between the effects of layers on busi-
ness creation and job switching indicate that the reduced mobility associated with
more layers is not just an artifact of the general correlation between larger firms (with
more layers) and turnover in general. In this section, we consider several candidate
explanations for this finding, and provide some evidence concerning each one.
4.1. Bureaucracy and preferences
There is an extensive literature documenting that some individuals declare, often at an
early stage in their career, a preference to create and operate their own business, and
that such declarations predict entry into entrepreneurship (Hamilton, 2000; Halaby,
2003; Benz and Frey, 2008; Åstebro and Thompson, 2010). Halaby (2003) and Søren-
sen (2007) show that the offspring of self-employed parents, who have on average
much greater entrepreneurial aspirations than the offspring of wage earners, are more
likely to work in smaller and presumably less bureaucratic organizations. Benz and
Frey (2008) have documented that both entrepreneurs and employees of smaller firms
report greater levels of job satisfaction, and that in both cases satisfaction is associated
with having greater autonomy and more rewarding work content. There seems, there-
fore to be an association between the preferences of people who found businesses and
employees of small organizations that might induce a small firm effect.12
Elfenbein et al. (2010) claim that, if preference sorting is the only reason we observe a
small firm effect, then the size of employers should be unrelated to subsequent per-
formance in entrepreneurship and self-employment. By extension, layers of manage-
ment should not predict entrepreneurial performance.13 However, this argument
12 Offsetting this, however, is the likelihood that small firm employment is a substitute for en-trepreneurship among certain types of individuals.
13 Elfenbein et al. report that entrepreneurs previously employed in small firms earn less than those employed by the largest firms, but attribute this to the lower opportunity cost of entre-preneurship among the former group. Once they control for prior wages, they find a 23 percent premium to entrepreneurial earnings among those that left the smallest firms relative to those that left the largest. However, the effect is non-monotonic, with the largest premium occurring

18
strikes us as incomplete. Agents create and then continue to operate businesses if the
total compensation expected from the business exceeds the foregone wage. However,
total compensation from entrepreneurship and self-employment includes a non-
pecuniary component among those with a preference for entrepreneurship. Because
people with such preferences are presumably overrepresented in less-bureaucratic
firms, we may anticipate either or both of (i) a positive relationship between the num-
ber of management layers and subsequent monetary performance in entrepreneur-
ship, and (ii) a negative relationship between the number of management layers and
the likelihood of business survival.
Which of these two possible consequences of preferences matters more depends in
large part on the ability of agents to forecast business earnings. If forecast errors are
large, so entry into business is predicated mostly on the population mean of business
earnings, then there is no mechanism by which agents with a preference for entrepre-
neurship can choose to accept lower income in exchange for the non-pecuniary payoff
that business ownership entails. In this case, monetary business income will not de-
pend upon preferences. However, agents with a preference for entrepreneurship are
more likely to continue operating a business that provides poor financial returns, so
management layers and business survival will be negatively correlated. If, in contrast,
forecast errors are small, agents with a preference for entrepreneurship will elect to
create businesses that are known in advance to offer relatively poor financial returns.
Selection effects imply that they will earn less on average and, more precisely, that
they are more likely to create a business that pays less than they earned in wage em-
ployment. However, because they are on average of worse initial quality, businesses
created by agents with a preference for entrepreneurship do not necessarily survive
longer than those created by agents without such preferences.
To test the thesis of preference sorting, we regress entrepreneurial and self-
employment earnings and survival rates on the size of, and the number of manage-
ment layers in, the business owner’s previous employer. We report the results of these
regressions, separately for entrepreneurs and the self-employed, in Table 9. There is a
positive relationship between the number of layers in the previous employer and an
agent's earnings from entrepreneurship, although this relationship is not apparent for
self-employment. Furthermore, businesses created by agents that left a firm with no
layers of management have higher survival rates, results that hold for both entrepre-
neurship and self-employment. There are no clear patterns between performance and
firm size. The result provide evidence for the existence of both channels through which
preference sorting may affect firm performance, and these effects are more clearly
associated with the hierarchical structure of the firm than they are with firm size.
among entrepreneurs previously employed in medium-sized firms.

19
Table 9 Performance of entrepreneurs, two years after business creation
OLS Regressions
Log(Total income) Survival
Entrepreneurs Self-employed Entrepreneurs Self-employed (1) (2) (3) (4)
CEOs and Directors 0.032 -0.013 -0.030* -0.069*** (0.026) (0.027) (0.018) (0.026) Managers -0.003 -0.032* -0.019 -0.060*** (0.021) (0.016) (0.014) (0.016) Supervisors 0.010 -0.014 0.008 -0.022** (0.015) (0.009) (0.011) (0.009) Firm layers: 1 0.043* 0.004 -0.042** -0.029** (0.024) (0.014) (0.017) (0.014) Firm layers: 2 0.074*** -0.008 -0.049*** -0.036*** (0.024) (0.014) (0.017) (0.014) Firm layers: 3 0.069*** -0.002 -0.047*** -0.038*** (0.025) (0.015) (0.018) (0.014) Size 50-100 -0.018 -0.001 0.016 -0.008 (0.020) (0.012) (0.014) (0.012) Size 100-500 -0.026 0.011 0.021* 0.010 (0.017) (0.011) (0.012) (0.010) Size 500-1500 -0.006 0.018 0.031** -0.010 (0.020) (0.013) (0.014) (0.012) Size 1500> -0.008 0.020 0.020 -0.033*** (0.019) (0.012) (0.014) (0.012) Log(wage) -0.019*** -0.025*** 0.007** -0.002 (0.005) (0.002) (0.003) (0.002) Tenure (years) 0.000*** 0.000*** -0.000*** 0.000 (0.000) (0.000) (0.000) (0.000) Tenure squared -0.005 -0.025*** -0.018 -0.021*** (0.016) (0.008) (0.011) (0.008) Observations 5,769 19,276 5,769 19,276 R squared 0.72 0.76 0.71 0.25
Standard errors in parentheses. *** p<0.01, ** p<0.05, * p<0.1. Regressions include a constant term, and controls for age, age squared, gender, education, industry, county, and year. Total income is the sum of capital and labor income accruing to the individual two years after business creation. Suc-cess is equal to one if a business created in year t is active, in the sense that it has more than one employee (including the founder), two years after business creation.
20
4.2 Information processing
Caliendo and Rossi-Hansberg (2012) develop a general equilibrium model of manage-
ment layers in which output is secured by solving problems, and worker knowledge
and time are key inputs into the production process. Workers on the shop floor (their
context is manufacturing) produce by solving problems that present themselves. If
they have the knowledge, they solve the problem themselves, which yields some out-
put. If they do not have the knowledge they pass the problem up to their supervisor,
who may either solve the problem or pass it up to the next layer of management. Em-
ployees are constrained not only by their knowledge, but also by time. Thus, a supervi-
sor in charge of too many workers, or of workers with too little knowledge, will not be
able to address all the problems that come up the line. Caliendo and Rossi-Hansberg
examine the optimal number of management layers, and size and composition of each
layer, and how these change as a firm experiences an increase in demand.
Firm heterogeneity is an important part of the model, and firms may respond to an
increase in demand in either of two ways. First, they may increase the size and change
the composition of each layer, while holding the number of layers constant. Alterna-
tively, they may add a layer of management, which in turn induces changes in the size
and composition of existing layers. Caliendo and Rossi-Hansberg show that when a
firm expands layers, it increases the number of hours worked at each pre-existing lay-
er. The additional layers enable workers to pass more problems up the line. They
therefore need less knowledge and the average wage declines. Symmetrically, elimina-
tion of layers reduces layer size and raises the average wage within each surviving
layer. In contrast, if a firm expands without increasing layers it must pay higher wages
at each level because time constraints on upper management force workers in lower
layers to solve more of their own problems. Caliendo, Monte and Rossi-Hansberg
(2012) exhaustively examine these predictions of the model using a panel of observa-
tions on the large majority of French manufacturing firms, and find no instance in
which the evidence contradicts the predictions. Tåg (2013) replicates their study and
concludes that the predictions of Caliendo and Rossi-Hansberg (2012) also hold for
Swedish manufacturing firms.
The theory predicts that conditional on firm size, firms with fewer layers employ
workers with the ability to solve a broader range of problems. Consistent with Lazear’s
(2005) Jack-of-all-trades theory, such workers are more likely to enter entrepreneur-
ship and self-employment, and they are likely to perform better when they do. Howev-
er, workers with broader skills are paid a higher wage, which reduces mobility. If we
condition on an individual’s wage, however, employees in firms of a given size but with
fewer layers should have a higher propensity to enter entrepreneurship and self-
employment and be more successful when they do. Similarly, employees of larger
firms with a given number of layers should, conditional on their wage, be more likely
to create a business and be more successful when they do.

21
The evidence from analyses we have already reported is not especially favorable to
these predictions. In Table 8, which estimated business creation rates after controlling
for prior earnings, we saw that while more layers reduce business creation, larger
firms were associated with less entry. The effect of layers is consistent with the model,
but the effect of firm size is not. In the performance regressions of Table 9, we found
that more layers are associated with higher entrepreneurial earnings and lower sur-
vival rates. Both these associations, we concluded, were consistent with preference
sorting; the effect of layers on business earnings is not what the information pro-
cessing model would lead us to expect.
Of course, preference sorting and information processing are not mutually exclusive
theories, so it is quite possible that evidence for the latter theory is confounded by
preference sorting. We can conduct a perhaps sharper test of the information pro-
cessing story. So far, we have controlled in our multinomial logit regressions for rank,
the number of layers and firm size. Of particular note here is the positive effect we
found of higher rank on the likelihood of business creation, and especially of entrepre-
neurship. However, the meaning of a particular rank depends on the hierarchical
structure of the firm. The information processing story implies that the more layers
there are in a firm the greater the difference between the breadth of knowledge of em-
ployees in the highest and lowest ranks. As a result, the likelihood of business creation
of any rank relative to the lowest rank in the firm should be greater the more ranks
that lie between them.
Evidence on this prediction is provided in Table 10, which estimates the effect of rank
on the likelihood of business creation separately for firms with different numbers of
layers. Consistent with the information processing story, we find first that for any giv-
en number of layers in a firm the probability of entering entrepreneurship and self-
employment is greater the higher the relative position. Moreover, the coefficients for
entrepreneurship and self-employment on the top layers are larger the more layers
there are in the firm. This is true for employees in the top ranks as we move from one-
layer to two-layer and then to three-layer firms; and it is also true for employees in the
second highest rank as we move from two to three layers in the firm. These findings
hold both for entrepreneurship and for self-employment and they suggest, consistent
with Caliendo and Rossi-Hansberg (2012), that the span of knowledge of managers is
related to the number of layers beneath them, rather than the title of their rank.
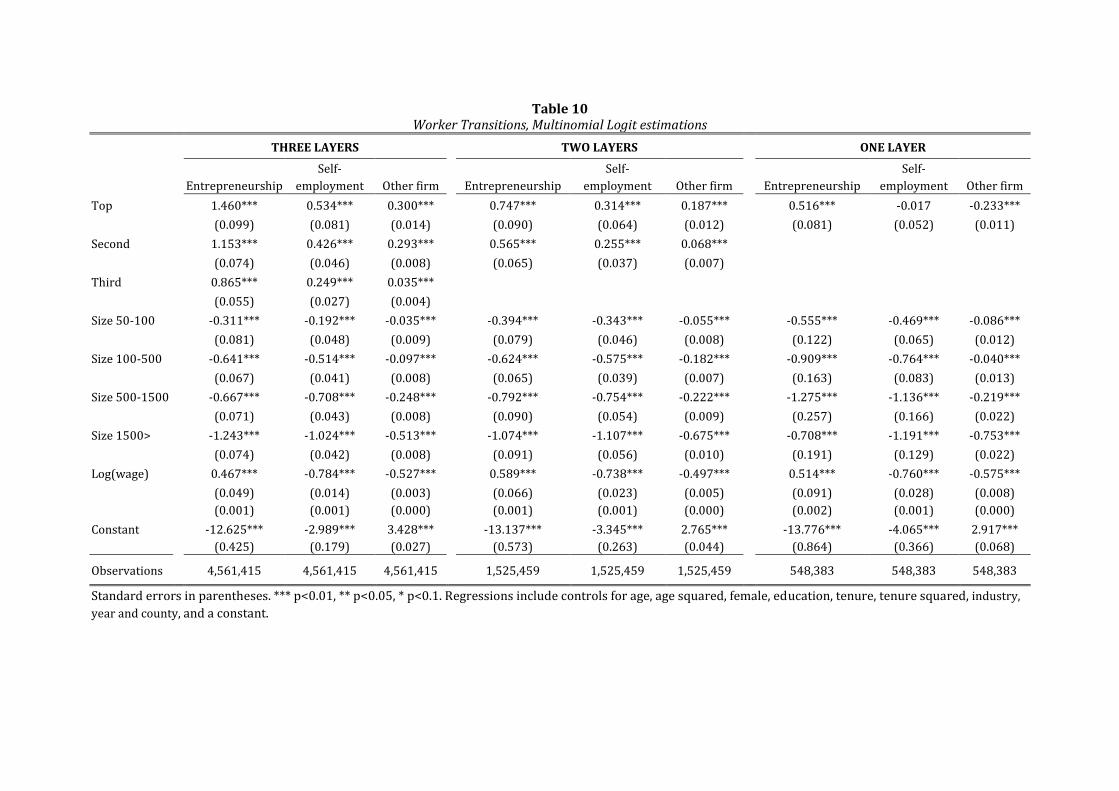
Table 10 Worker Transitions, Multinomial Logit estimations
THREE LAYERS
TWO LAYERS
ONE LAYER
Entrepreneurship
Self-
employment Other firm Entrepreneurship
Self-
employment Other firm Entrepreneurship
Self-
employment Other firm
Top
1.460*** 0.534*** 0.300***
0.747*** 0.314*** 0.187***
0.516*** -0.017 -0.233***
(0.099) (0.081) (0.014)
(0.090) (0.064) (0.012)
(0.081) (0.052) (0.011)
Second
1.153*** 0.426*** 0.293***
0.565*** 0.255*** 0.068***
(0.074) (0.046) (0.008)
(0.065) (0.037) (0.007)
Third
0.865*** 0.249*** 0.035***
(0.055) (0.027) (0.004)
Size 50-100
-0.311*** -0.192*** -0.035***
-0.394*** -0.343*** -0.055***
-0.555*** -0.469*** -0.086***
(0.081) (0.048) (0.009)
(0.079) (0.046) (0.008)
(0.122) (0.065) (0.012)
Size 100-500
-0.641*** -0.514*** -0.097***
-0.624*** -0.575*** -0.182***
-0.909*** -0.764*** -0.040***
(0.067) (0.041) (0.008)
(0.065) (0.039) (0.007)
(0.163) (0.083) (0.013)
Size 500-1500
-0.667*** -0.708*** -0.248***
-0.792*** -0.754*** -0.222***
-1.275*** -1.136*** -0.219***
(0.071) (0.043) (0.008)
(0.090) (0.054) (0.009)
(0.257) (0.166) (0.022)
Size 1500>
-1.243*** -1.024*** -0.513***
-1.074*** -1.107*** -0.675***
-0.708*** -1.191*** -0.753***
(0.074) (0.042) (0.008)
(0.091) (0.056) (0.010)
(0.191) (0.129) (0.022)
Log(wage)
0.467*** -0.784*** -0.527***
0.589*** -0.738*** -0.497***
0.514*** -0.760*** -0.575***
(0.049) (0.014) (0.003)
(0.066) (0.023) (0.005)
(0.091) (0.028) (0.008)
(0.001) (0.001) (0.000)
(0.001) (0.001) (0.000)
(0.002) (0.001) (0.000)
Constant
-12.625*** -2.989*** 3.428***
-13.137*** -3.345*** 2.765***
-13.776*** -4.065*** 2.917***
(0.425) (0.179) (0.027) (0.573) (0.263) (0.044) (0.864) (0.366) (0.068)
Observations
4,561,415 4,561,415 4,561,415
1,525,459 1,525,459 1,525,459 548,383 548,383 548,383
Standard errors in parentheses. *** p<0.01, ** p<0.05, * p<0.1. Regressions include controls for age, age squared, female, education, tenure, tenure squared, industry,
year and county, and a constant.

4.3 Career concerns
A firm may develop a hierarchy to create incentives for employees to exert effort. In par-
ticular, tournament theory (e.g., Lazear and Rosen, 1981; Lazear and Shaw, 2007) explains
that wages are generally associated with jobs rather than with individuals, and that pro-
motion is the reward for employees whose performance exceeds that of their peers. Con-
ditional on size, a firm with more layers offers greater prospects of promotion, so employ-
ees are more likely to remain with the firm. The prospect of promotion also serves as a
form of deferred compensation, which adds a further incentive to remain with a firm.
Thus, the concerns that individuals have for their career prospects may well lie behind the
negative association we have observed between the number of layers and mobility of all
kinds.
Unless employees care about status, the incentives that layers provide to remain with the
firm depend on how much pay increases at the time of promotion. We would therefore
expect a larger within-firm difference in wages across ranks to increase the incentive to
stay in the organization. In model A of Table 11, we test this notion by estimating transi-
tion probabilities as a function of, inter alia, the standard deviation of wages within the
firm. The sample is restricted to firms with at least one layer of management. The regres-
sion also controls for an agent’s own wage and the average wage in the firm, the latter
because we already know that it is correlated with the number of layers. The results are
not what the career concerns model would lead us to expect: the greater the wage disper-
sion the higher the probability of exit to entrepreneurship, self-employment and other
firms. Our results for mobility are the same as those reported by Lazear and Shaw (2008)
across eight countries.
The standard deviation of wages reflects not only the increments to the wage that are se-
cured by promotion to a higher rank but also within-rank dispersion. Although this has
been the usual way in which a firm’s wage policy has been measured, it might be a poor
measure for tests of the career concerns model. In Model B of Table 11 we replace the
standard deviation with the firm’s average between-rank change of wage, estimated
through a linear regression of wage on rank across all employees within the firm. This
measure might more adequately reflect the incentive effects of promotion. However we
continue to find no support for the career concerns model. Although the coefficient on this
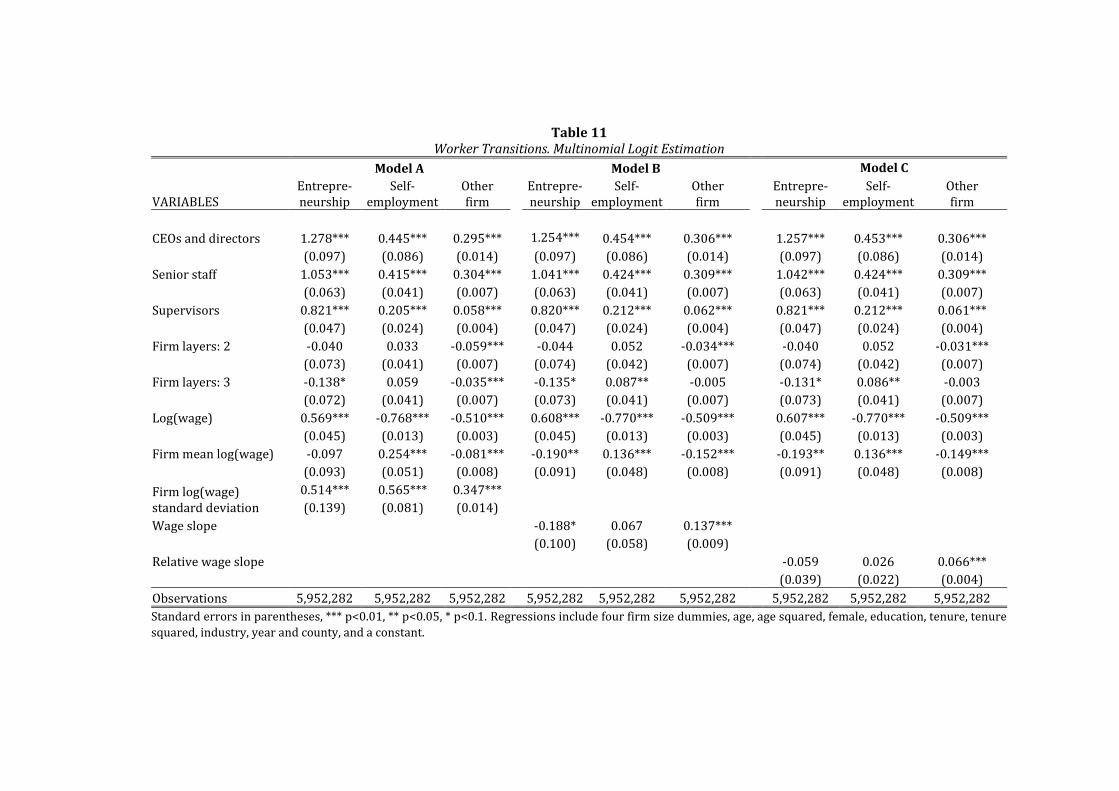
Table 11 Worker Transitions. Multinomial Logit Estimation
Model A Model B Model C
VARIABLES Entrepre-neurship
Self-employment
Other firm
Entrepre-neurship
Self-employment
Other firm
Entrepre-neurship
Self-employment
Other firm
CEOs and directors 1.278*** 0.445*** 0.295*** 1.254*** 0.454*** 0.306*** 1.257*** 0.453*** 0.306***
(0.097) (0.086) (0.014) (0.097) (0.086) (0.014) (0.097) (0.086) (0.014)
Senior staff 1.053*** 0.415*** 0.304*** 1.041*** 0.424*** 0.309*** 1.042*** 0.424*** 0.309***
(0.063) (0.041) (0.007) (0.063) (0.041) (0.007) (0.063) (0.041) (0.007)
Supervisors 0.821*** 0.205*** 0.058*** 0.820*** 0.212*** 0.062*** 0.821*** 0.212*** 0.061***
(0.047) (0.024) (0.004) (0.047) (0.024) (0.004) (0.047) (0.024) (0.004)
Firm layers: 2 -0.040 0.033 -0.059*** -0.044 0.052 -0.034*** -0.040 0.052 -0.031***
(0.073) (0.041) (0.007) (0.074) (0.042) (0.007) (0.074) (0.042) (0.007)
Firm layers: 3 -0.138* 0.059 -0.035*** -0.135* 0.087** -0.005 -0.131* 0.086** -0.003
(0.072) (0.041) (0.007) (0.073) (0.041) (0.007) (0.073) (0.041) (0.007)
Log(wage) 0.569*** -0.768*** -0.510*** 0.608*** -0.770*** -0.509*** 0.607*** -0.770*** -0.509***
(0.045) (0.013) (0.003) (0.045) (0.013) (0.003) (0.045) (0.013) (0.003)
Firm mean log(wage) -0.097 0.254*** -0.081*** -0.190** 0.136*** -0.152*** -0.193** 0.136*** -0.149***
(0.093) (0.051) (0.008) (0.091) (0.048) (0.008) (0.091) (0.048) (0.008)
Firm log(wage) standard deviation
0.514*** 0.565*** 0.347***
(0.139) (0.081) (0.014)
Wage slope
-0.188* 0.067 0.137***
(0.100) (0.058) (0.009)
Relative wage slope
-0.059 0.026 0.066***
(0.039) (0.022) (0.004)
Observations 5,952,282 5,952,282 5,952,282 5,952,282 5,952,282 5,952,282 5,952,282 5,952,282 5,952,282
Standard errors in parentheses, *** p<0.01, ** p<0.05, * p<0.1. Regressions include four firm size dummies, age, age squared, female, education, tenure, tenure
squared, industry, year and county, and a constant.

wage slope variable has the expected sign for entrepreneurship, it continues to have the
wrong sign for self-employment and job switching.
Perhaps we are using the wrong measure of wage dispersion to proxy incentives to stay
and work. The appropriate measure of dispersion as an incentive for an agent to stay with
his current employer may be one that is calculated relative to the dispersion that is found
at other firms that might employ the agent. We explore this possibility next. We use our
measure of the wage slope across ranks, but now we compare it with the slopes of firms
operating in the same industry and year.14 The results, shown as Model C of Table 11 again
fail to offer support for the career concerns.
4.4 Stars and Misfits
Throughout much of our analysis so far, we have seen different results for entry into self-
employment and entrepreneurship. This is particularly so with the various measures of
earnings that we have included: the agent’s own wage is positively associated with entry
into entrepreneurship but negatively with self-employment (Tables 7 and 8); the firm’s
mean wage and between-rank wage slope also have effects of opposite signs (although not
always statistically significant) on entrepreneurship and self-employment (Table 11); and
the number of layers in the firm is positively related to subsequent entrepreneurial earn-
ings but not to self-employment earnings (Table 9). These contrasting impacts suggest
that entrepreneurship and self-employment may be chosen by qualitatively different em-
ployees.
In a recent paper, Åstebro, Chen and Thompson (2011) developed and tested a model in
which workers vary in the degree to which they are well matched to their job. Those that
are poorly matched earn less than they might expect in business creation, and so they
leave. Although workers are treated symmetrically in their model, Åstebro et al. show that
mismatches are more common in the tails of the ability and earnings distributions. In the
lower tail, agents with low ability are more likely to enter self-employment, while in the
upper tail, high-ability agents are more likely to become entrepreneurs. If one is willing to
suppose that low-ability workers creating a business are likely to become self-employed
while their high-ability counterparts are likely to establish limited liability companies, the
mismatching model readily accounts for the contrasting effects of own wage on business
14 The wage slope is based on a regression of labor income on the management layer in a firm and is normalized such that it is relative to the industry-year mean slope. It is positive if the wage slope is higher than industry-year mean and negative otherwise. Because the slope is meaningless in firms with zero layers of management, we drop these firms. We also restrict attention to firms with more than 30 employees to have large enough samples for estimating the wage-rank slope for each firm individually.

26
creation. Among the set of agents at the lower end of the distribution a lower wage is asso-
ciated on average with less ability and a greater likelihood of suffering a job mismatch.
Thus, own wage is negatively correlated with entry into self-employment. In contrast, a
higher wage among agents at the top of the earnings distribution is associated on average
with greater ability, and an increased chance of a mismatch, so own wage is positively
correlated with entrepreneurship.
It is less apparent that the mismatching model can explain the effects of management lay-
ers on mobility. One possible mechanism, however, is that layers create a hierarchy that
induces a functional separation between agents of high and low ability, and thereby re-
duces mismatching problems.15 However, our view is that the main impact of stars and
misfits is to insert some anomalies in our empirical tests of preference sorting, infor-
mation processing, and career concerns as potential explanations for the effects of layers.
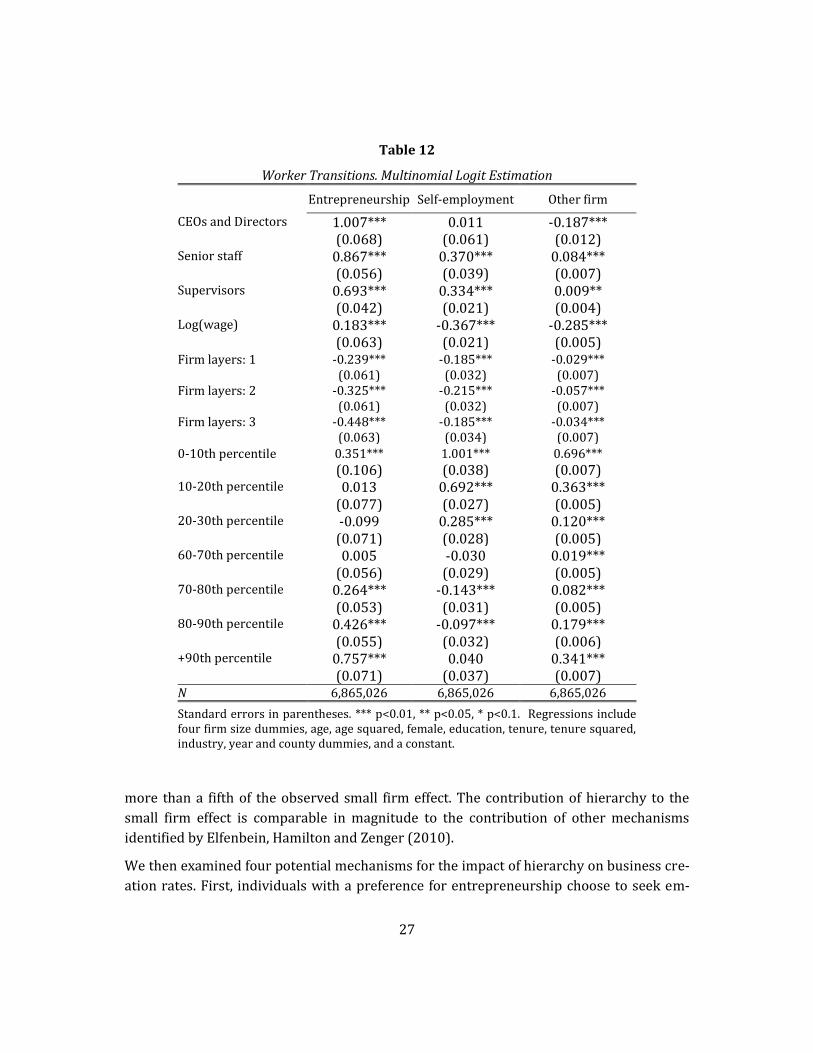
To see whether mismatching might be influencing our results, we examine where in the
wage distribution the probability of exit is the greatest. To do so we create a dummy for
each decile of the wage distribution and examine the effects of these dummies on exit
probabilities, leaving the 40th to the 60th percentile of the wage distribution as the omitted
category. We include each employee’s own wage in the regression to absorb effects on
wage that are not related to within-firm relative ability. The results, which are reported in
Table 12 are quite striking. The probability of remaining in the firm is clearly highest
among those with middling wages while the probability of exit is remarkably higher
among those in the bottom and top quintiles of the earnings distribution. The bottom
quintile is much more likely than those with middling earnings to enter self-employment
or to join another firm, and they are also somewhat more likely to become entrepreneurs.
In contrast, the top earners are much more likely to become entrepreneurs, more likely to
switch jobs, but less likely to become self-employed. These patterns exhibit a noteworthy
consistency with the mismatching model. However, they appear to provide no explanation
for the effect of layers, the coefficients on which are all but identical to those obtained in
our previous regressions.
5. Conclusions
In this paper, we asked whether small firms are more frequent incubators of entrepre-
neurs because they tend to be less hierarchical. We found that hierarchy, at least as we
have measured it in terms of the number of layers of management, is indeed less prevalent
in small firms and is associated with more frequent transitions of employees into self-
employment and entrepreneurship. However, we also found that hierarchy explains no
15 In Åstebro et al. mismatching arises because agents of differing ability may become co-workers and the production function exhibits complementarity in worker abilities.
27
Table 12
Worker Transitions. Multinomial Logit Estimation
Entrepreneurship Self-employment Other firm
CEOs and Directors 1.007*** 0.011 -0.187*** (0.068) (0.061) (0.012) Senior staff 0.867*** 0.370*** 0.084*** (0.056) (0.039) (0.007) Supervisors 0.693*** 0.334*** 0.009** (0.042) (0.021) (0.004) Log(wage) 0.183*** -0.367*** -0.285*** (0.063) (0.021) (0.005)
Firm layers: 1 -0.239*** -0.185*** -0.029*** (0.061) (0.032) (0.007) Firm layers: 2 -0.325*** -0.215*** -0.057*** (0.061) (0.032) (0.007) Firm layers: 3 -0.448*** -0.185*** -0.034***
(0.063) (0.034) (0.007) 0-10th percentile 0.351*** 1.001*** 0.696*** (0.106) (0.038) (0.007) 10-20th percentile 0.013 0.692*** 0.363*** (0.077) (0.027) (0.005) 20-30th percentile -0.099 0.285*** 0.120*** (0.071) (0.028) (0.005) 60-70th percentile 0.005 -0.030 0.019*** (0.056) (0.029) (0.005) 70-80th percentile 0.264*** -0.143*** 0.082*** (0.053) (0.031) (0.005) 80-90th percentile 0.426*** -0.097*** 0.179*** (0.055) (0.032) (0.006) +90th percentile 0.757*** 0.040 0.341*** (0.071) (0.037) (0.007)
N 6,865,026 6,865,026 6,865,026
Standard errors in parentheses. *** p<0.01, ** p<0.05, * p<0.1. Regressions include four firm size dummies, age, age squared, female, education, tenure, tenure squared, industry, year and county dummies, and a constant.
more than a fifth of the observed small firm effect. The contribution of hierarchy to the
small firm effect is comparable in magnitude to the contribution of other mechanisms
identified by Elfenbein, Hamilton and Zenger (2010).
We then examined four potential mechanisms for the impact of hierarchy on business cre-
ation rates. First, individuals with a preference for entrepreneurship choose to seek em-

28
ployment in firms with fewer management layers (preference sorting). Second, employees
in firms with fewer layers have a broader range of skills, and this makes them more fit for
entrepreneurship (ability breadth). Third, multiple layers of management offer promotion
opportunities that do not exist in firms without a hierarchy, thereby suppressing mobility
(career concerns). Finally, skill mismatching is less problematic in firms with a more hier-
archical structure. We found evidence for preference sorting, ability breadth and skill
mismatching, but none for career concerns. However, there remained throughout a sub-
stantial unexplained component of the effect of management layers on business creation
rates.
Our analysis is based on the Swedish matched employer-employee dataset. Conventional
wisdom has it that, along with other Scandinavian countries, Sweden’s labor market is
atypical. This conventional wisdom is now dated, 16 and most employment data reveal that
Sweden is comparable to other OECD countries. While labor mobility remains lower than
average, its wage structure is now much like other high-income countries. In fact, Lazear
and Shaw (2008), show that across several measures such as wage dispersion within
firms, the variance of wage growth rates within firms, and even overall wage dispersion,
Sweden is not remarkably different from seven other countries they study, including the
U.S.A. The environment for new firm formation in Sweden is further not markedly differ-
ent from other countries such as the U.S.A., Brazil or Denmark (Andersson and Klepper,
2013). We thus see no reason why results found in this paper would not be replicated
elsewhere.
References
Anderson, Patricia M., and Bruce D. Mayer (1994): “The extent and consequences of job turno-ver.” Brookings Papers on Economic Activity: Microeconomics, 177–236.
Andersson, Martin, and Steven Klepper (2013): ”Characteristics and performance of new firms and spinoffs in Sweden.” Industrial and Corporate Change, 22(1): 245–80.
Åstebro, Thomas, Jing Chen, and Peter Thompson (2011): “Stars and misfits: Self-employment and labor market frictions.” Management Science, 57(11): 1999–2017.
16 For the majority of the 20th century, annual average wage increases were set by “collective bar-gaining” between the three major labor unions and the three major employers, respectively. How-ever, between 1970 and 1990 centralized control over wages was progressively dismantled, and it was abandoned entirely in 1997. Further deregulations of the Swedish labor market in the early 1990s gave rise to a dual labor market consisting of temporary and permanently employed work-ers. These changes induced an increase in the Gini coefficient for income from 0.199 in 1981 to 0.332 in 2007 (http://www.scb.se/Pages/TableAndChart____163550.aspx). The 2007 figure places Sweden at the OECD average (The Economist, 2013). The percentage of temporary employees in the private sector rose from 8.8 percent in 1997 to 13.1 percent in 2008 (Sveriges Officiella Statistik, 2001; 2012).

29
Åstebro, Thomas, and Peter Thompson (2010): “Entrepreneurs: Jacks of all trades or ho-bos?” Research Policy, 40(5): 637–649.
Benz, Matthias and Bruno S. Frey (2008): “Being independent is a great thing: Subjective eval-uations of self-employment and hierarchy.” Economica, 75(298):362–383.
Caliendo, Lorenzo, Ferdinando Monte, and Esteban Rossi-Hansberg (2012): “The anatomy of French production hierarchies.” Working paper, Yale University.
Caliendo, Lorenzo, and Esteban Rossi-Hansberg (2012): “The impact of trade on organization and productivity.” Quarterly Journal of Economics, 127(3):1393–1467.
Chen, Jing (2012): “The small firm effect and the quality of entrepreneurs.” Working paper, Copenhagen Business School.
Dobrev, Stanislav D. and William P. Barnett (2005): “Organizational roles and transition to entrepreneurship.” Academy of Management Journal, 48(3): 433–449.
Elfenbein, Daniel W., Barton H. Hamilton, and Todd R. Zenger (2010): “The small firm effect and the entrepreneurial spawning of scientists and engineers.” Management Science, 56(4):659–681.
Frederiksen, Anders (2006): “Gender differences in job separation rates and employment
stability: New evidence from employer-employee data.” Institute for the Study of
Labor (IZA) Discussion Paper No. 2147.
Gompers, Paul, Josh. Lerner, and David Scharfstein (2005): “Entrepreneurial spawning: Public corporations and the genesis of new ventures, 1986 to 1999.” Journal of Finance, 60(2): 577–614.
Halaby, Charles N. (2003): “Where job values come from. Family and schooling background, cognitive ability, and gender.” American Sociological Review, 68; 251–278.
Haltiwanger, John, Ron S. Jarmin, and Javier Miranda (2011): “Who creates jobs? Small vs. large vs. young.” Working paper, University of Maryland.
Hamilton, Barton (2000): “Does entrepreneurship pay? An empirical analysis of the returns to self-employment.” Journal of Political Economy, 108(3): 604–631.
Hausman, Jerry, and Daniel McFadden (1984): “Specification tests for the multinomial logit model." Econometrica, 52(5): 1219–1240.
Henrekson, Magnus and Tino Sanandaji, 2013, "Billionaire Entrepreneurs: A Systematic Analy-sis", IFN Working Paper No. 959
Lazear, Edward P., and Sherwin Rosen (1981): “Rank-order tournaments as optimum labor contracts.” Journal of Political Economy, 89(5): 841–64.
Lazear, Edward P. (2005):”Entrepreneurship.” Journal of Labor Economics, 23(4):649-680.
Lazear, Edward P. and Kathryn L. Shaw (2007). "Personnel economics: The economist's view of human resources." Journal of Economic Perspectives, 21(4): 91–114.
Lazear, Edward P. and Kathryn L. Shaw, (2008)” “Introduction: Wage structure, raises and mobility: International comparisons of the structure of wages within and across firms.” In E. Lazear and K. Shaw eds., The Structure of Wages: An International Comparison, Uni-versity of Chicago Press.
Sørensen, Jesper (2007): ‘Bureaucracy and entrepreneurship: Workplace effects on entrepre-

30
neurial entry.” Administrative Science Quarterly, 52; 387–412.
Sveriges Officiella Statistik (2001): Statistiska Meddelanden, AM63 SM 0102, Statistiska Centralbyrån.
Sveriges Officiella Statistik (2012): Statistiska Meddelanden, AM63 SM 1204, Statistiska Centralbyrån.
Tåg, Joacim (2013): “Production Hierarchies in Sweden”, IFN Working Paper No. 963
The Economist (2013): “The ins and the outs. Immigration and growing inequality are making the Nordics less homogeneous.” The Economist, February 2nd, 2013.
Wagner, Joachim (2004): “Are young and small firms hothouses for nascent entrepreneurs?” Applied Economics Quarterly, 50; 379–391.