Embed Size (px)
Citation preview

Hierarchies,theSmallFirmEffect,andEntrepreneurship:EvidencefromSwedishMicrodata
JoacimTåg*
ResearchInstituteofIndustrialEconomics(IFN)
ThomasÅstebro**
HECParis
PeterThompson***
EmoryUniversity
June2013
Weexplorewhetherthetendencyforsmallerfirmstohavefewerhierarchicallayersexplainsthewell‐documentedinversecorrelationbetweenfirmsizeandtherateatwhichemployeesbecome businessowners.Ouranalysis isbasedona Swedishmatched employer‐employeedataset.Conditionalonfirmsize,employeesinfirmswithmorelayersarelesslikelytoenterentrepreneurship,tobecomeself‐employed,andtoswitchtoanotheremployer.Theeffectsoflayersaremuchstrongerforbusinesscreationthanforjob‐switchingandtheyarestrongerforentrepreneurshipthan forself‐employment.However,hierarchiesconstituteonlyapar‐tialexplanationof thesmall firmeffect.Potentialexplanations for theeffectsof layersareexamined.Partoftheeffectappearstobeduetopreferencesortingbyemployees,andpartduetoemployeesinfirmswithfewerlayershavingabroaderrangeofskills.
Keywords:entrepreneurship;employeemobility;hierarchy,rank,smallfirmeffect.JELcodes:L26,D20,J20,M50.
*Research Institute of Industrial Economics (IFN), Box 55665, SE‐10215 Stockholm, Sweden. E‐mail:joacim.tag@ifn.se.JoacimgratefullyacknowledgesfinancialsupportfromVinnovaandtheJanWallanderandTomHedeliusFoundation.**HECParis,1ruedelaLiberation,78351Jouy‐en‐JosasCedex,France.Email:[email protected].***GoizuetaBusinessSchool,EmoryUniversity,1300CliftonRoad,Atlanta,GA30322,USA.Email:[email protected].

1
1. Introduction
Comparedwiththeircounterpartsinlargefirms,workersinsmallfirmsaremorelikelytoseparatefromtheiremployers(AndersonandMeyer,1994;LazearandShaw,2008)andthose that leave small firms aremore likely to become entrepreneurs or self‐employedthanthoseleavinglargefirms(Wagner,2004;DobrevandBarnett,2005;Gompersetal.,2005; Elfenbein, Hamilton and Zenger, 2010; Chen, 2012).While higher job separationratesinsmallfirmsareinpartduetothegreatervolatilityofjobsandjobtypesinsmallandyoungfirms(Haltiwanger,JarminandMiranda,2011),higherratesofentrepreneur‐shipamongmoverssuggeststhatemployeesofsmallfirmsaredifferentfromtheircoun‐terpartsinlargefirms.WewillfollowElfenbeinetal.(2010)andrefertothegreaterpro‐pensityofemployeesofsmallfirmstoestablishbusinessesasthesmallfirmeffect.
Onepotentialexplanationforthesmallfirmeffectisthesegregationofobservableworkertypes into largeandsmall firms.Forexample,Frederiksen(2006)showsthatwomen inDenmarkarebothmorelikelytoseparatefromtheirjobsandmorelikelytobeemployedinasmallfirm.Similarly,separationratesarehigherforthelesseducatedandeducationalattainment isonaverage lower insmall firms.Becausesmall firmsareyoungeronaver‐age,jobtenureislowerandthis,too,isassociatedwithhigherseparationrates.Butthesereadilyobservablecharacteristicsofemployeesinsmallfirmsdonotexplainhigherratesofentrepreneurship:womenaremarkedlylesslikelytobecomeentrepreneursthanmen,andneithertenurenoreducationaregoodpredictorsofentrepreneurshipamongmovers.
Elfenbein et al. (2010) find evidenceof segregationofunobservableworker types. First,smallfirmsoffergreaterautonomyandagreatervarietyofworkexperiences,sowemightexpectthatworkerswithapreferencefortheseworkattributesaremorelikelytobeem‐ployedby, and to create, small firms. Elfenbein et al. have a directmeasure ofwhetherindividualsintheirsamplehaveadesiretobecomeentrepreneurs.Individualswhodoareoverrepresentedinsmallfirms,andaremorelikelytosubsequentlyestablishabusiness.Second,employeesinsmallfirmsmayhaveskillsthatareespeciallyvaluableforthecrea‐tionofnewbusinesses.Theseskillsmayreflectinnateabilitiesthatarebetterrewardedinsmall firmsso futureentrepreneursselect intosmall firms,or theymaybeabilities thatare gained as a result of employment in small firms. Consistent with this hypothesis,Elfenbeinetal.findthatentrepreneurswithpriorsmallfirmexperiencehavebetterper‐formance.
Smallfirmsattractindividualswithpreferencesandabilitiesforentrepreneurshipnotjustbecausetheyaresmaller,butbecausetheyaredifferent.Inparticular,smallfirmsarelessbureaucratic,andbureaucracystiflestheaccumulationofskillsappropriateforentrepre‐neurship and repels thosewith a preference for autonomy andwork variety. Sørensen
2
(2007)reviewsthepriorliteratureandsociologicalargumentsforthenegativeeffectsofbureaucracyonentrepreneurship,andexaminestheirimplicationsusingDanishmicroda‐ta. However, lacking directmeasures of the extent of bureaucracy, Sørensen associatesgreater levels of bureaucracywith older and larger firms. As a result, one cannot inferfromhisanalysistheextenttowhichvaryinglevelsofbureaucracycanexplainthesmallfirmeffect.
Inthispaper,weusethenumberofmanagement layers ina firmasanindicatorfortheextentofbureaucracythatisindependentoffirmsize,andinvestigatetheextenttowhichthecorrelationbetweenfirmsizeanditshierarchicalstructurecanexplainthesmallfirmeffect.Oursample isdrawn fromtheSwedishmatchedemployer‐employeedataset, andconsistsofmore than100,000 firm‐levelobservationsand7million individual‐levelob‐servationsovertheperiod2001–2008.AsourdiscussionofthedatainSection2willmakeclear,oursampleisnotatruepanelalthoughwedohaverepeatedobservationsonbothindividualsandfirms.FollowingCaliendoandRossi‐Hansberg(2012)andCaliendo,MonteandRossi‐Hansberg(2012),weidentifyemployees’ranksfromtheirjobtitlesandmeas‐urethehierarchalstructureofthefirmbythenumberoflayersofmanagementithas.Oursamplebehavesasonewouldexpectfromameaningfulmeasureofhierarchy:upperlev‐elsofmanagementcontainfeweremployeesandpayhigherwagesthanlowerlevels,andemployeetransitionsaremostlikelytobetoanadjacentrank.
In Section 3,we demonstrate that a strong small firm effect exists in Sweden, and thatthereisastrongcorrelationbetweenthenumberofmanagementlayersinafirmanditssize.Wealsoshowthat,conditionalonsize,employees in firmswithmoremanagementlayersarelessmobile.Thisistrueregardlessofthemover’sdestination,buttheeffectoflayersonbusinesscreation ismuchgreater than itseffectonrelocationtoother incum‐bentfirms.Wedecomposebusinesscreationintoself‐employmentandentrepreneurship,definedbythelegalformofbusinessthatiscreated.Morelayersinafirmsuppressbothtypes of business creation. However, despite the magnitude of the effect of layers, thesmallfirmeffectpersists.Ourpointestimatessuggestthatthehierarchicalstructureofthefirmaccountsforaboutonefifthofthesmallfirmeffect.
InSection4,weexaminepotentialexplanationsfortheeffectoflayersonmobilityingen‐eralandbusinesscreationinparticular.Wefirstlookatevidenceforthepreferencesort‐inghypothesis.Individualswithastrongpreferenceforentrepreneurshipshouldbemorewillingtoestablishbusinessesthatyieldlowfinancialreturns,andtheyshouldalsopersistinbusiness for longer.Wetest these implications,andconcludethatemployeesofsmallfirmsdobehaveinwaysconsistentwithpreferencesorting.Wethenassesswhethertherearedifferencesinentrepreneurialabilityamongemployeesoffirmswithdifferentlayersof management. We frame our analysis around Caliendo and Rossi‐Hansberg’s infor‐

3
mation‐processingmodel,whichrelatesthenumberofmanagementlayersinafirmtothebreadthofproblems that employees atdifferent ranksare expected tobeable to solve.Althoughtheydonotstudytheirmodel’simplicationsforemployeeseparations,wederiveandtesttwoimplications.First,employeesinfirmsofagivensizebutwithfewerlayersshouldhaveahigherpropensitytoenterentrepreneurshipandself‐employmentandtobemore successful when they do. Our evidence on business creation rates are consistentwith the information‐processingmodel (but alsowithpreference sorting); our evidenceon earnings do not support the model. Second, the propensity for business creation isgreaterwhenemployeesofagivenrankhavemore layersbeneaththem.Wefindstringsupportforthisprediction.
Ourthirdinvestigationisanexaminationofthecareerconcernsmodel.Hierarchiesofferopportunitiesforpromotionandiftheincrementtowagesthatisassociatedwithariseinrankislarge,theopportunitycostofmobilityincreasesandjobseparationrateswillde‐cline.Weconsiderthreedistinctmeasuresofafirm’swagepolicy,butfindnoevidencetosupport the career concerns hypothesis. Finally, we explore whether the model of jobmismatchingdevelopedinÅstebro,ChenandThompson(2011)canexplaintheeffectoflayers. In theirmodel,mismatchingoccurswhenemployeesofdifferingskillsareput toworktogether.Suchmismatchingismorelikelyinthetailsoftheabilitydistributionsoweseegreatermobilityfromthetails.Wehypothesizethatlayerscreateafunctionalsepara‐tionbetweenagentsofhighandlowability,andtherebyreducesmismatchingproblems.Wefindclearevidencethatsuchmismatchingisoccurringinoursample,butnoevidencethatthisexplainstheeffectoflayers.
2.TheData
Thedataaredrawnfromtwodistinctsources,oneatthefirmlevelandoneattheindivid‐uallevel.ThefirmleveldatasetcomesfromtheIFNCorporateDatabase(IFNCDB),whichisbasedonofficialmandatoryaccountingdata filedto theSwedishCompaniesRegistra‐tionOffice.TheindividualleveldatasetisbasedontheStatisticsSweden’sLISAdatabasedrawingonseveralofficialregistrydatabasesofeverypersonlivinginSweden.FromtheIFNCDBweextract theannual accountsof firms, and from theLISAdatabaseweobtaininformationonoccupationcodes,firm‐workerlinks,worker’slaborincome,worker’scapi‐talincome,andnumerousotherworkercharacteristics.Wemakeuseoffirm‐andindivid‐ual‐leveldatafortheperiod2001–2008.1Wedropduplicatedfirm‐yearinformation(mul‐tipleannualaccountscanbesubmittedeachyear)andthenmergethefirmandindividualleveldata.Wedropfirmsactiveinthehealth,education,agricultureandfishingindustries,
1Accurateoccupationdataisonlyavailablefrom2001andonwards.

4
andalsofirmsinthepublicsector,inordertofocusonprivatesectorfirms.Givenourfo‐cusonhierarchies,werestrictattentiontofirmswithmorethan5employees(welose76percentofallfirm‐yearobservationssincemostSwedishfirmsaresmall).Wealsorestrictattentiontoindividualsbetweentheagesof20and60.
BecausewewillconstructindicatorsofemployeerankandorganizationalstructurefrominformationonoccupationalcodesassignedbyStatisticsSweden,wefurtherrestrictoursampletoincludeonlyfirmswithsufficientoccupationdataforitsemployees.Inthesam‐pleof firmswithmore than5employees,63percentofall individual‐levelobservationshaveaccurateoccupationdata as theoccupationdata isbasedon surveysanddoesnothavecompletecoverage.Becauseoccupationdataisnotcompleteforeveryyear,wedropfirm‐yearobservationswithfewerthan75percentofallemployeeshavingaccurateoccu‐pationdata.ThisinvolvesmainlysmallerfirmsthatarelesslikelytobesampledbyStatis‐ticsSwedenanditreducesthefirm‐yearsamplesizebyanother76percent. Inour finalsample,91percentofallindividual‐levelobservationshaveaccurateoccupationdataanditcovers48percentofallindividual‐yearobservationsintheinitialdataset.
Ineachyear,wetrackwhetheremployeesremainedwiththeircurrentfirm,switchedtoanotherincumbentfirm,orcreatedandbecameprimarilyoccupiedinrunningtheirownbusiness.2WefollowthedefinitionusedbyStatisticsSwedentodefineentrepreneursandself‐employed.StatisticsSwedendefinesanindividualasbeingemployedinherownfirminagivenyear ifher total income fromherowncompany(laborandcapital income) isgreaterthan62.5percentofallother labor income.3Wedefinean individualasenteringentrepreneurshipinanygivenyearifthefollowingcriteriaaresimultaneouslyfulfilled:
1.Newlyoccupiedinownbusiness.AnindividualisclassifiedbyStatisticsSwedenasworkinginherowncompanyinthecurrentyear,buthadnotbeeninthepreviousyear.
2.Newplaceofwork.Theindividual’scurrentfirmandestablishmentidentifiersaredifferentfromthepreviousyear,and
3.Newfirm.Noindividualinoursamplehadworkedforthecurrentfirminthepre‐viousyear.
Statistics Sweden also separates sole proprietorships from limited liability companies.Because an individual who intends to create a growing company likely will establish a
2Employeeexitstounemploymentareignored:theyaretreatedthesameasemployeesremainingwiththeircurrentemployer.3StatisticsSwedentreatsself‐employmentastheprimaryoccupationeventhoughitmaygeneratelessincomethanotheractivities,becauseself‐employmenttypicallygenerateslowerhourlywages.

5
limited liability company,we characterize agents starting limited liability companies as“entrepreneurs”,andagentsstartingsoleproprietorships“self‐employed”.4
Table1
Samplesize
Year Firms Workers TootherfirmToself
employmentTo
entrepreneurship
2001 20,364 1,042,267 155,063 3,061 465
2002 19,051 1,155,587 156,242 3,451 434
2003 13,535 1,079,013 139,370 4,103 1,125
2004 11,831 1,048,657 137,992 4,249 1,103
2005 12,426 1,059,188 140,544 4,329 1,042
2006 13,026 1,060,428 146,305 3,763 1,268
2007 15,516 1,107,941 152,545 4,050 1,537
Total 105,749 7,553,081 1,028,061 27,006 6,974
Table1displaysnumbersonthesamplesizeofthefinaldataset.Itcontains105,749firm‐yearobservationscovering61percentofvalueaddedand53percentofemployment intheSwedishprivatesector.Ofaround7.5millionemployee‐levelobservations,about14percenttransitionstoanewincumbentemployerineachyear,about0.36percententerself‐employment,whilejust0.1percententersentrepreneurship.Thenumberoffirmsinthesamplevariesconsiderablyacrossyears,likelyaresultofdifferentsamplingofoccu‐pationcodesovertime.Moreover,partsof thesurveysaretargetedtocertainsectors incertainyears,whichprobablyaccountsforthelargejumpsinthenumberofobservationsperyear.
2.1Occupationclassifications,rankandmanagementlayers
Ourdataonthehierarchicalstructureoffirmsaredevelopedoutofoccupationalclassifi‐cationsobtainedfromStatisticsSweden’sLISAdatabase.TheSwedishStandardClassifica‐tionofOccupations1996(SSYK)isaSwedishversionoftheInternationalStandardClassi‐ficationofOccupations(ISCO‐88).TheSSYKdataavailable fromtheLISAdatabasecome
4 Themean size of a limited liability company two years after creation is 5.3 employeeswith astandard deviation of 8.3, while themean size of a sole proprietorship is 1.2 employeeswith astandarddeviationof0.9.HenreksonandSanandaji(2013)surveytheliteratureonentrepreneur‐shipandself‐employmentanddemonstrate the importanceofseparatingbetweenentrepreneursandtheself‐employedusingdataonbillionaireentrepreneurs.
6
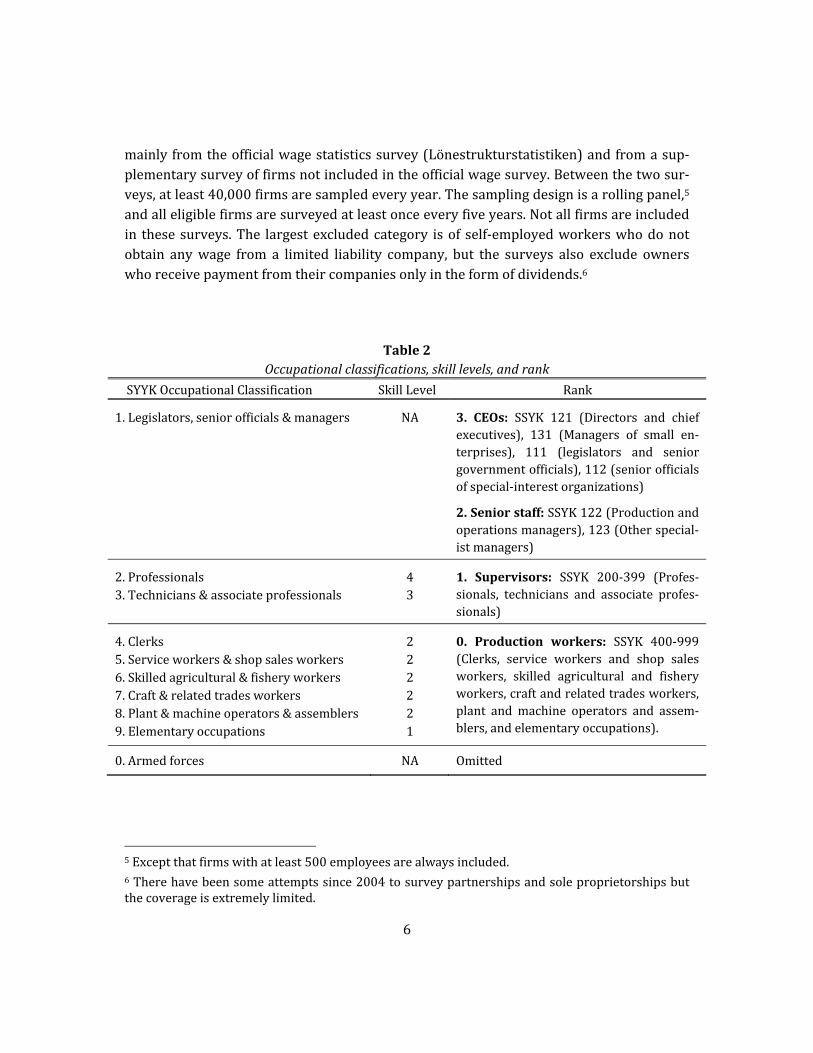
mainlyfromtheofficialwagestatisticssurvey(Lönestrukturstatistiken)andfromasup‐plementarysurveyoffirmsnotincludedintheofficialwagesurvey.Betweenthetwosur‐veys,atleast40,000firmsaresampledeveryyear.Thesamplingdesignisarollingpanel,5andalleligiblefirmsaresurveyedatleastonceeveryfiveyears.Notallfirmsareincludedin thesesurveys.The largestexcludedcategory isof self‐employedworkerswhodonotobtain anywage from a limited liability company, but the surveys also exclude ownerswhoreceivepaymentfromtheircompaniesonlyintheformofdividends.6
Table2
Occupationalclassifications,skilllevels,andrank
SYYKOccupationalClassification SkillLevel Rank
1.Legislators,seniorofficials&managers NA 3. CEOs: SSYK 121 (Directors and chiefexecutives), 131 (Managers of small en‐terprises), 111 (legislators and seniorgovernmentofficials),112(seniorofficialsofspecial‐interestorganizations)
2.Seniorstaff:SSYK122(Productionandoperationsmanagers),123(Otherspecial‐istmanagers)
2.Professionals 4 1. Supervisors: SSYK 200‐399 (Profes‐sionals, technicians and associate profes‐sionals)
3.Technicians&associateprofessionals 3
4.Clerks 2 0. Production workers: SSYK 400‐999(Clerks, service workers and shop salesworkers, skilled agricultural and fisheryworkers,craftandrelatedtradesworkers,plant and machine operators and assem‐blers,andelementaryoccupations).
5.Serviceworkers&shopsalesworkers 26.Skilledagricultural&fisheryworkers 27.Craft&relatedtradesworkers 28.Plant&machineoperators&assemblers 29.Elementaryoccupations 1
0.Armedforces NA Omitted
5Exceptthatfirmswithatleast500employeesarealwaysincluded.6Therehavebeensomeattemptssince2004tosurveypartnershipsandsoleproprietorshipsbutthecoverageisextremelylimited.

7
TheSSYKassignsworkerstooneoftenmainoccupationalcategories,andoneofalargenumberofsubcategories.StatisticsSwedenalsoassignseachoftheseoccupationalcatego‐riestooneoffourskilllevels.7WeusetheSSYKcodestoassignaranktoeachemployee(seeTable2).Thehighest rank,whichwe labelCEOs, consists ofdirectors, chief execu‐tives,managersofsmallenterprises,andcertainotherseniorofficials.Thenexttworankscomprise two levelsofmanagements.Themore senior,whichwe label as “senior staff”,containproductionandoperationsmanagersandcertainotherspecialistmanagers.Thelesssenior, “supervisors”, consistsofworkerswithoccupationsclassified in theSSYKasprofessionals, technicians and associate professionals. The fourth category, “productionworkers”,comprisesclerks,serviceworkers,plantandmachineoperators,andothernon‐supervisorypositions.AsTable2shows,ourrankclassificationsbroadlycoincidewiththeskilllevelsattributedtothesepositionsbyStatisticsSweden.
Doourclassificationsinducepatternsconsistentwithournotionsofrankandhierarchies?Welookfirstatearningsbyrank.Theearningsdataweusethroughoutthepapermeasureeachindividual’sannuallaborincome.However,forcompactness,wewillgenerallyreferto our earningsmeasure as the “wage”. Table 3 displays thewagedistributionby rank.Clearly, workers in higher ranks tend to earnmore on average than workers in lowerranks.Thesameorderingpersistsateachpercentileshowninthetable,withthenotableexceptionofseniorstaffthatearnmorethantheCEOrankatthelowerpercentiles.Thisreflect in part differences across firms (large firms that paymore on average aremore
Table3
WagedistributionacrossbroadoccupationclassesbasedonSSYK
Rank MeanPercentiles Wage
Dispersion10th 25th 50th 75th 90th
3.CEOsanddirectors 600 232 300 417 669 1,086 1,324
2.Seniorstaff 540 292 363 469 620 833 775
1.Supervisors 358 201 260 330 421 534 475
0.Productionworkers 239 127 192 241 288 336 277
Mean 302 151 215 272 348 462 388Note:Dataareinunitsof1,000SEKin2005prices.
7StatisticsSwedennotesthat,althoughtheseskill levelshavebeenmadeoperational intermsofthe educational categories of the International Standard Classification of Education, they do notimplythattheskillsnecessarytoperformthetasksanddutiesofagivenjobcanbeacquiredonlythroughformaleducation.

8
likelytohaveseniorstaff)andinpartthetendencyofseniorstafftobehighlyeducated.The table also displays that thewithin‐rankwage distribution is the highest at the toprankandreducesmonotonicallywithlowerrank.
Table4plotsranktransitions(ofcoursethelowestandhighestrankscanonlytransitioninonedirection)amongworkersremainingwiththesamefirm.Transitionratesdeclinewithdistancebetweenrankpairs,andmostemployeesdonotchangerank.Forexample,93.6percentofproductionworkersareatthesamerankthreeyearslater,while5.4per‐centareattherankofsupervisorandlessthanonepercenthaveattainedeitherofthetwohighest ranks. Similarly CEOs are most likely to remain as CEOs; among those that doswitchrank,movingonerankisalmosttwiceaslikelyasmovingtwo,andmovingtwoisinturntwiceaslikelyasmovingthree.Tables3and4togethersuggestthatouroccupa‐tionalclassificationssucceedincapturingaformofdistanceconsistentwithournotionofranksandhierarchies.
Table4Ratesofwithin‐companyranktransitions
Toproductionworker
Tosupervisor
Toseniorstaff
ToCEO
Productionworker 93.61 5.44 0.71 0.24
Supervisors 7.63 87.32 4.34 0.71
SeniorStaff 4.54 25.55 63.24 7.67
CEOordirector 7.10 13.59 22.20 57.11
Transitionratesoverathree‐yearperiodifavailable;otherwisetwoyears,otherwiseoneyear.Transitionratesareverysimilarifweincludeemployeesthatswitchedfirms.
Table 5 provides information about within‐firm differences in rank populations and inearnings across ranks. Following Caliendo et al. (2012), a firm‐year observationwithRrankswillbesaidtohaveL=R1layersofmanagement.PartAofthetabledocumentsthemeannumberof employees ineach layer,whilepartBprovides theprobabilities thatalowerrankcontainsmoreemployeesthantherankimmediatelyaboveitinthefirm.Inthelargemajority of cases, the firm’s structure corresponds to our notion of hierarchies astriangularstructures,wherehigherranksconsistofsmallnumbersofpeoplesupervisinglargergroupsofworkersinlowerranks.Forexample,infirmswithonlyonelayerofman‐agement, the lowerof the two ranks in the firmhasmoreworkers in88percentof the

9
firm‐yearobservations,andthemeandifferenceinlayersizeis8.3.PanelsCandDcom‐paresearningsacrossranks.Itshowsthatinthegreatmajorityoffirms,membersofthehigherrankearnmoreonaveragethanworkers in therank immediatelybelowtheminthefirm.Forexample,infirmswiththreelayersofmanagement,thelowestrankhaslow‐ermeanearningsthanthenextlayerin94percentofthefirm‐yearobservations. ThesepercentagesareconsistentwiththeearningsdistributionssummarizedinTable3.8
Table5
Sizeandwagebylayersofmanagement
A
MeanSizeofLayerC
MeanWageinLayer
Layersofmanagement Layer0
Layer1
Layer2
Layer3
Layer0
Layer1
Layer2
Layer3
0 10.7 238.2
1 12.0 3.7 230.9 344.8
2 31.3 18.7 3.3 238.2 323.8 491.5
3 127.2 85.2 12.1 3.1 241.6 334.2 505.9 946.9
Total 38.9 28.3 6.9 3.1 236.4 335.1 497.4 946.9
BFractionoffirmswithmore
employeesinlowerrankthaninnexthigherrank.
DFractionoffirmswithlowermeanwageinlowerrankthaninnext
rankup.
Layersofmanagement 0>1 1>2 2>3 0<1 1<2 2<3
1 0.88 0.87
2 0.72 0.90 0.87 0.863 0.61 0.92 0.93 0.94 0.92 0.87
ThelayernumbersdonotnecessarilycorrespondtotheranknumbersusedinTable2.Forexample,afirmwithoneCEOandseveralblue‐collarworkerswillhaveone layerofmanagementandconsistofworkersinranks3and0.Suchfirmswillappearinthesamecellsasfirmswithconsistingonlyof,forexample,ranks3and2.
8The identifiednumberofmanagement layers is inevitably somewhatcrude. Inparticular, zero‐layerfirmswillgenerallyhavesomeoneengagedinmanagerialandsupervisoryfunctions.Howev‐er, theyarenot identifiablewhen, forexample, supervisory functionsareonlya fractionof theiractivitiesandtheirmainworkissimilartothoseofotheremployeesinthefirm.
10
3.HierarchiesandtheSmallFirmEffect
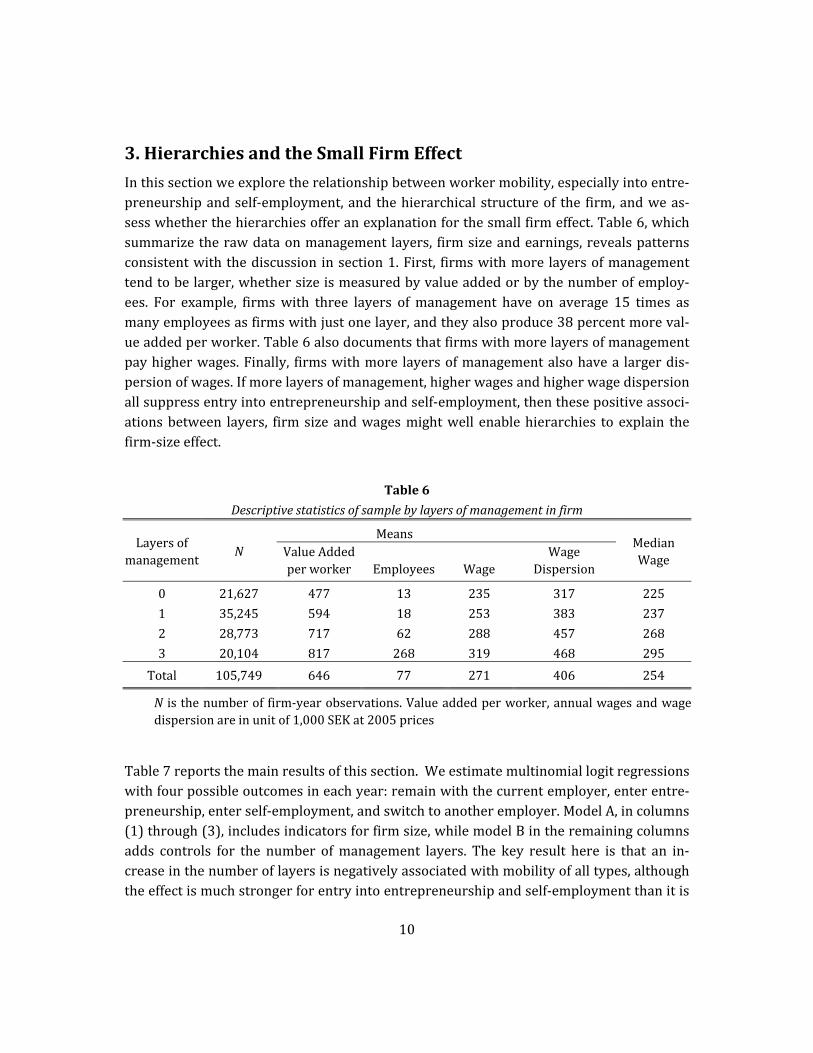
Inthissectionweexploretherelationshipbetweenworkermobility,especiallyintoentre‐preneurshipandself‐employment,and thehierarchicalstructureof the firm,andweas‐sesswhetherthehierarchiesofferanexplanationforthesmallfirmeffect.Table6,whichsummarizetherawdataonmanagement layers, firmsizeandearnings,revealspatternsconsistentwiththediscussion insection1.First, firmswithmore layersofmanagementtendtobelarger,whethersizeismeasuredbyvalueaddedorbythenumberofemploy‐ees. For example, firmswith three layers ofmanagement have on average 15 times asmanyemployeesasfirmswithjustonelayer,andtheyalsoproduce38percentmoreval‐ueaddedperworker.Table6alsodocumentsthatfirmswithmorelayersofmanagementpayhigherwages.Finally, firmswithmore layersofmanagementalsohavea largerdis‐persionofwages.Ifmorelayersofmanagement,higherwagesandhigherwagedispersionallsuppressentryintoentrepreneurshipandself‐employment,thenthesepositiveassoci‐ationsbetween layers, firmsizeandwagesmightwell enablehierarchies to explain thefirm‐sizeeffect.
Table6
Descriptivestatisticsofsamplebylayersofmanagementinfirm
Layersofmanagement
NMeans
MedianWage
ValueAddedperworker Employees Wage
WageDispersion
0 21,627 477 13 235 317 225
1 35,245 594 18 253 383 237
2 28,773 717 62 288 457 268
3 20,104 817 268 319 468 295
Total 105,749 646 77 271 406 254
N isthenumberoffirm‐yearobservations.Valueaddedperworker,annualwagesandwagedispersionareinunitof1,000SEKat2005prices
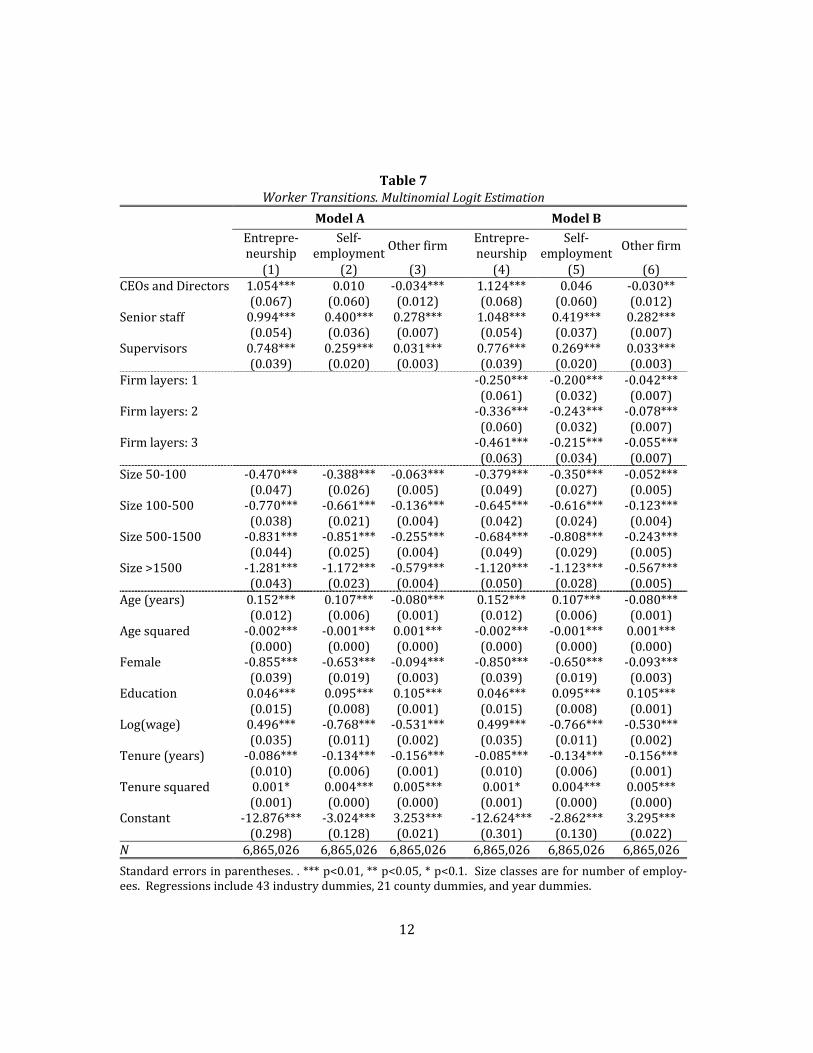
Table7reportsthemainresultsofthissection.Weestimatemultinomiallogitregressionswithfourpossibleoutcomesineachyear:remainwiththecurrentemployer,enterentre‐preneurship,enterself‐employment,andswitchtoanotheremployer.ModelA,incolumns(1)through(3),includesindicatorsforfirmsize,whilemodelBintheremainingcolumnsadds controls for the number ofmanagement layers. The key result here is that an in‐creaseinthenumberoflayersisnegativelyassociatedwithmobilityofalltypes,althoughtheeffectismuchstrongerforentryintoentrepreneurshipandself‐employmentthanitis

11
formovingtoanotheremployer.However,theinclusionofcontrolsforlayershasonlyamodest effect on the estimated impact of firm size on entry into entrepreneurship andself‐employment.
Beforelookingatthekeyresultsinmoredetail,wereviewtheresultsconcerningthecon‐trols in the regressions. As is the case inmost samples, tenure is negatively associatedwithmobilityofallkinds,9whilethemoreeducated10andmalesaremoremobileregard‐lessofdestination.Interestingly,individualwageshaveimpactsthatdifferbydestination.Individualswithhigherwagesarelesslikelytoswitchtoanotherincumbentemployerandless likely to enter self‐employment. However, a higher wage is associated with an in‐crease inthepropensitytobecomeanentrepreneur.Thecontrastsbetweentheseeffectsofindividualwagesarenotonlystatisticallysignificant,theyareeconomicallymeaningful.Forexample,aonestandarddeviationincreaseinlogincomeisassociatedwithadeclineintheoddsofswitchingemployers(relativetostayingwiththecurrentemployer)of15percent,withadeclineintheoddsofenteringself‐employmentof38percent,butwithanincreaseintheoddsofenteringentrepreneurshipof4.4percent.Employeeagesimilarlyhasdisparate effectsonmobilitybydestination. Increasingage raises theprobability ofentering entrepreneurship and self‐employment until a peak hazard is attained at 43yearsofageforentrepreneurshipand48yearsforself‐employment,afterwhichthehaz‐ard declines. In contrast, increasing age reduces the probability of switching incumbentemployersuntilaminimumhazardisattainedatabout47yearsofage.
Theseresultsforthecontrolvariablessuggestthatmobilityisdrivenbyacomplexinter‐playofmultipleforces.Forexamples:thenegativeeffectoftenureonmobilityofallkindsisconsistentbothwithjobmatchingmodels(e.g.,Jovanovic,1979)andwithsurvivorbiascaused by unobserved heterogeneity across individuals in the propensity to move; theinitiallypositiveimpactofageonbusinesscreationmightreflecttheeffectofwealthcon‐straints that are relaxed as an agent ages and saves, or the consequences of on‐the‐joblearningspecifictothedemandsofbusinesscreation;andthecontrastbetweentheeffectsof individual wages on entrepreneurship and self‐employment recalls the mismatching
9 Thepositive coefficients on thequadratic terms indicate a non‐monotonic effect of tenure. Forentry intoentrepreneurshipandself‐employment theminimaareattainedat39and18yearsoftenure;formovementstoanotherincumbentemployertheminimumisat15years.However,thepredictedeffectoftenureisgreaterthantheseminimaandextrapolatesoutsidemostofoursampleobservations.10Educationisonascalefrom1–6correspondingto:6.Postgraduateeducation;5.Post‐secondaryeducation,twoyearsorlonger;4.Post‐secondaryeducation,lessthantwoyears;3.Uppersecond‐aryeducation;2.Primaryandlowersecondaryeducation;9or10years;and1.Primaryandlowersecondaryeducation,lessthan9years.
12
Table7WorkerTransitions.MultinomialLogitEstimation
ModelA ModelB
Entrepre‐neurship
Self‐employment
Otherfirm Entrepre‐neurship
Self‐employment
Otherfirm
(1) (2) (3) (4) (5) (6)CEOsandDirectors 1.054*** 0.010 ‐0.034*** 1.124*** 0.046 ‐0.030** (0.067) (0.060) (0.012) (0.068) (0.060) (0.012)Seniorstaff 0.994*** 0.400*** 0.278*** 1.048*** 0.419*** 0.282*** (0.054) (0.036) (0.007) (0.054) (0.037) (0.007)Supervisors 0.748*** 0.259*** 0.031*** 0.776*** 0.269*** 0.033*** (0.039) (0.020) (0.003) (0.039) (0.020) (0.003)Firmlayers:1 ‐0.250*** ‐0.200*** ‐0.042*** (0.061) (0.032) (0.007)Firmlayers:2 ‐0.336*** ‐0.243*** ‐0.078*** (0.060) (0.032) (0.007)Firmlayers:3 ‐0.461*** ‐0.215*** ‐0.055*** (0.063) (0.034) (0.007)Size50‐100 ‐0.470*** ‐0.388*** ‐0.063*** ‐0.379*** ‐0.350*** ‐0.052*** (0.047) (0.026) (0.005) (0.049) (0.027) (0.005)Size100‐500 ‐0.770*** ‐0.661*** ‐0.136*** ‐0.645*** ‐0.616*** ‐0.123*** (0.038) (0.021) (0.004) (0.042) (0.024) (0.004)Size500‐1500 ‐0.831*** ‐0.851*** ‐0.255*** ‐0.684*** ‐0.808*** ‐0.243*** (0.044) (0.025) (0.004) (0.049) (0.029) (0.005)Size>1500 ‐1.281*** ‐1.172*** ‐0.579*** ‐1.120*** ‐1.123*** ‐0.567*** (0.043) (0.023) (0.004) (0.050) (0.028) (0.005)Age(years) 0.152*** 0.107*** ‐0.080*** 0.152*** 0.107*** ‐0.080*** (0.012) (0.006) (0.001) (0.012) (0.006) (0.001)Agesquared ‐0.002*** ‐0.001*** 0.001*** ‐0.002*** ‐0.001*** 0.001*** (0.000) (0.000) (0.000) (0.000) (0.000) (0.000)Female ‐0.855*** ‐0.653*** ‐0.094*** ‐0.850*** ‐0.650*** ‐0.093*** (0.039) (0.019) (0.003) (0.039) (0.019) (0.003)Education 0.046*** 0.095*** 0.105*** 0.046*** 0.095*** 0.105*** (0.015) (0.008) (0.001) (0.015) (0.008) (0.001)Log(wage) 0.496*** ‐0.768*** ‐0.531*** 0.499*** ‐0.766*** ‐0.530*** (0.035) (0.011) (0.002) (0.035) (0.011) (0.002)Tenure(years) ‐0.086*** ‐0.134*** ‐0.156*** ‐0.085*** ‐0.134*** ‐0.156*** (0.010) (0.006) (0.001) (0.010) (0.006) (0.001)Tenuresquared 0.001* 0.004*** 0.005*** 0.001* 0.004*** 0.005*** (0.001) (0.000) (0.000) (0.001) (0.000) (0.000)Constant ‐12.876*** ‐3.024*** 3.253*** ‐12.624*** ‐2.862*** 3.295*** (0.298) (0.128) (0.021) (0.301) (0.130) (0.022)N 6,865,026 6,865,026 6,865,026 6,865,026 6,865,026 6,865,026
Standarderrorsinparentheses..***p<0.01,**p<0.05,*p<0.1.Sizeclassesarefornumberofemploy‐ees.Regressionsinclude43industrydummies,21countydummies,andyeardummies.

13
modelofÅstebro,ChenandThompson(2011), inwhichbusinesscreationismorelikelyamongagentswithespeciallyhighandespeciallylowability.
We returnnow to considerationof themaineffectsof firmsize, rank, andmanagementlayersonmobility.Considerfirsttheroleofrank.Employeesinsupervisorypositionsaremuchmorelikelythanproductionworkers(theomittedcategory)toenterentrepreneur‐ship,andthepropensitytodosoriseswitheachincreaseinrank.CEOs,directorsandsen‐ior staff are almost three timesmore likely thanproductionworkers to founda limitedliabilitycompany,whilesupervisorsaremorethantwiceaslikelytodoso(Figure1plotstheodds ratios). Seniorstaff andworkerswith supervisory rankarealsomore likely toenter self‐employment.Theeffects are smaller than forentrepreneurship,however, andCEOs are no more likely to become self‐employed than production workers.11 Finally,CEOs andDirectors are less likely to switch employers than productionworkers,whileSeniorStaffandSupervisorsaremorelikelytodosothanproductionworkers.Inthiscase,however,themagnitudesofthedifferencesaretrivial.
Table7containsfourindicatorsforsizecategories,theomittedcategorybeingfirmswithfewerthan50employees.Thepointestimatesrevealastrongnegativeeffectofincreasing
11Supervisorsareabout25percentmorelikelythanproductionworkerstobecomeself‐employed.Seniorstaffis50percentandCEOsarelessthantenpercentmorelikelytodoso.
0
1
2
3
4
0
1
2
3
4
OddsRatio
Rank
Entrepreneurship
Self‐employmentJob switching
Figure1.OddsRatios ofMobility, by destination and rank,with95%confidenceintervals.FrommodelAofTable7.
14
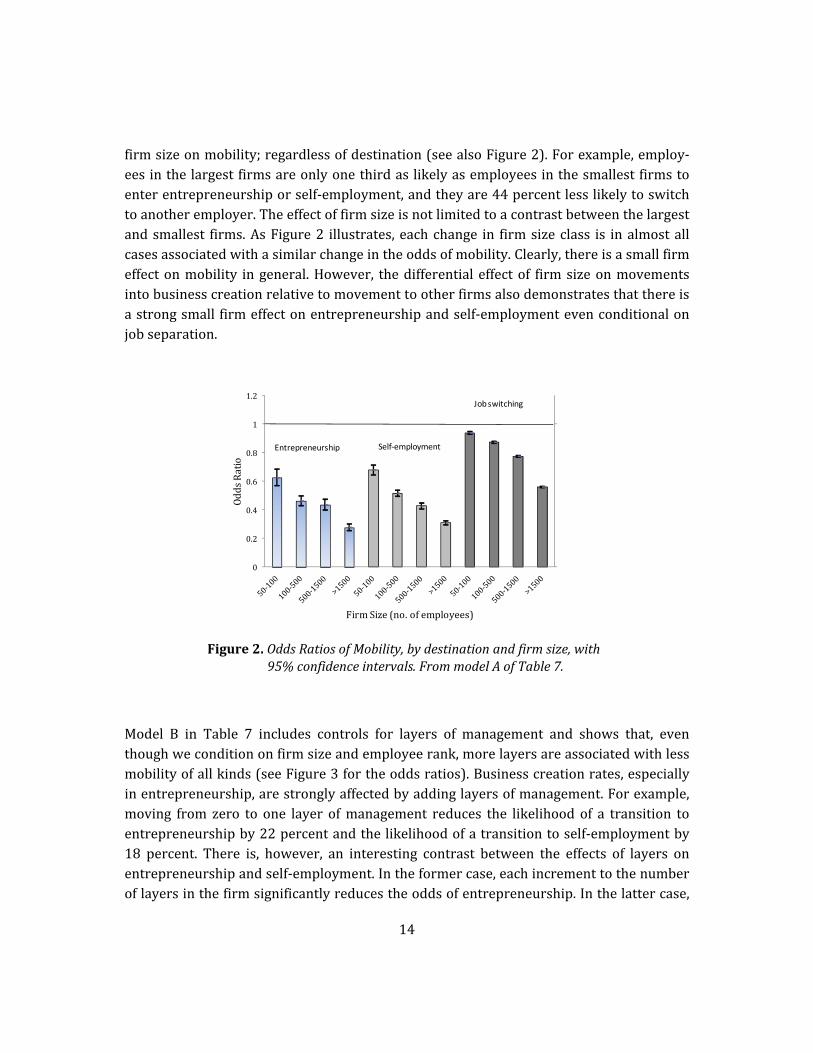
firmsizeonmobility;regardlessofdestination(seealsoFigure2).Forexample,employ‐eesinthelargestfirmsareonlyonethirdaslikelyasemployeesinthesmallestfirmstoenterentrepreneurshiporself‐employment,andtheyare44percentlesslikelytoswitchtoanotheremployer.Theeffectoffirmsizeisnotlimitedtoacontrastbetweenthelargestandsmallest firms.AsFigure2 illustrates,eachchange in firmsizeclass is inalmostallcasesassociatedwithasimilarchangeintheoddsofmobility.Clearly,thereisasmallfirmeffectonmobility ingeneral.However, thedifferential effectof firmsizeonmovementsintobusinesscreationrelativetomovementtootherfirmsalsodemonstratesthatthereisastrongsmall firmeffectonentrepreneurshipandself‐employmentevenconditionalonjobseparation.
Model B in Table 7 includes controls for layers of management and shows that, eventhoughweconditiononfirmsizeandemployeerank,morelayersareassociatedwithlessmobilityofallkinds(seeFigure3fortheoddsratios).Businesscreationrates,especiallyinentrepreneurship,arestronglyaffectedbyaddinglayersofmanagement.Forexample,moving from zero to one layer ofmanagement reduces the likelihood of a transition toentrepreneurshipby22percentandthelikelihoodofatransitiontoself‐employmentby18 percent. There is, however, an interesting contrast between the effects of layers onentrepreneurshipandself‐employment.Intheformercase,eachincrementtothenumberoflayersinthefirmsignificantlyreducestheoddsofentrepreneurship.Inthelattercase,
Figure2.OddsRatiosofMobility,bydestinationandfirmsize,with95%confidenceintervals.FrommodelAofTable7.
0
1
0
0.2
0.4
0.6
0.8
1
1.2
OddsRatio
FirmSize(no.ofemployees)
Entrepreneurship Self‐employment
Job switching

15
movement between zero and any other number of layers reduces self‐employment, butthereisnoeffectofanyincrementbeyondzerolayers.Theeffectoflayersonmovementtootherincumbentfirms,whilestatisticallysignificantonaccountofthelargesamplesize,issmall: in the largest estimated effect, when moving from zero to two layers ofmanagement,therelativeoddsofjobswitchingdeclinebylessthan8percent.
Althoughmanagement layershaveaprofoundeffectonthelikelihoodoftransitionsintoentrepreneurship and self‐employment, and the number of layers is strongly correlatedwithfirmsize,addinglayerstotheregressionsexplainsonlyamodestfractionofthesmallfirmeffect. Allsixcoefficientsforfirmsizeincolumns(4)and(5)aresmallerthantheircounterparts in columns (1) and (2), consistent with our conjecture that managementlayersmayexplainpartofthesmallfirmeffect.However,thereductionsarerathermod‐est, ranging from 13 to 20 percent for entrepreneurship, 4 to 10 percent for self‐employment,andfrom2to17percentforjobswitching(seeFigure4).12Thus,althoughwehavefoundthatlayersofmanagementhavealargeeffectonthelikelihoodofatransi‐
12The largest reduction in coefficient size for jobswitching isbasedona small initial effect: theoddsratioofswitchingtoanincumbentemployerforemployeesinsizeclass50–100(relativetolessthan50employees)increasesfrom0.938to0.949aftertheadditionofcontrolsforlayers.
0.5
1.1
0.5
0.6
0.7
0.8
0.9
1
1.1
1 2 3 1 2 3 1 2 3
OddsRatio
LayersofManagement
Entrepreneurship Self‐employment
Job switching
Figure3.OddsRatios ofMobility, by destination and number oflayersinemployee’sfirm,with95%confidenceintervals.FrommodelBofTable7

16
Figure4.Percentagereductioninregressioncoefficientsonfirmsizeobtaineduponaddingcontrolsforlayersofmanagement.
tiontoentrepreneurshipandtoasomewhatlesserextentonthelikelihoodofatransitiontoself‐employment,thatlayersandfirmsizearepositivelycorrelated,andthatfirmsizeisnegativelycorrelatedwithmobility,layersexplainonaverageonlyabout10percentoftheestimatedfirmsizeeffect.
Becauseself‐employmentandentrepreneurshiparelikelystrongsubstitutesamongthoseconsidering separation from their employer, it is useful to verify the robustness of theresults inTable7by restricting the choice set.Wedo sobyexamining theoddsof self‐employmentandentrepreneurshiprelativetojobswitchingafterrestrictingthesampletomovers.Table8reportsestimatesofmultinomiallogitestimationonthisrestrictedsam‐ple; thebaseline category ismoving to an incumbent firm.13The results clearlydemon‐stratethesmallfirmeffectonbusinesscreation:amongmovers,andconditionalonrank(model A) and on both rank and layers (model B), the likelihood of business creation
13IfweweretorerunTable7usingmovingtoanotherfirmasthebaseline,itwouldofcoursebepossible to formally test the IIAassumptionusing theHausman‐McFadden (1984) test. If the re‐sultsinTable7arerobust,weshouldfindthatthedifferencebetweenanycoefficientonentrepre‐neurshiporself‐employmentandthecorrespondingcoefficientonself‐employment inTable7 issimilar to the corresponding coefficientonentrepreneurshipor self‐employment inTable8.Theresultsmeetthisexpectation.
0
5
10
15
20
25
50‐100 100‐500 500‐1500 >1500
Perecentagereductioninregressioncoefficient
FirmSizeClass(numberofemployees)
Entrepreneurship Self‐employment Job switching

17
Table8Transitionsamongmovers.Multinomiallogitestimation
ModelA ModelB Entrepreneurship Self‐employment Entrepreneurship Self‐employment
CEOsandDirectors 1.220*** 0.244*** 1.293*** 0.267*** (0.071) (0.062) (0.072) (0.062)Seniorstaff 0.846*** 0.154*** 0.895*** 0.168*** (0.055) (0.037) (0.055) (0.038)Supervisors 0.734*** 0.220*** 0.762*** 0.228*** (0.039) (0.020) (0.039) (0.020)Firmlayers:1 ‐0.174*** ‐0.164*** (0.061) (0.033)Firmlayers:2 ‐0.285*** ‐0.191*** (0.061) (0.033)Firmlayers:3 ‐0.426*** ‐0.176*** (0.064) (0.034)Size50‐100 ‐0.487*** ‐0.329*** ‐0.394*** ‐0.298*** (0.048) (0.027) (0.050) (0.028)Size100‐500 ‐0.741*** ‐0.531*** ‐0.610*** ‐0.495*** (0.038) (0.021) (0.043) (0.024)Size500‐1500 ‐0.664*** ‐0.589*** ‐0.512*** ‐0.552*** (0.044) (0.026) (0.049) (0.029)Size>1500 ‐0.746*** ‐0.567*** ‐0.579*** ‐0.527*** (0.043) (0.023) (0.050) (0.028)Age(years) 0.204*** 0.176*** 0.204*** 0.176*** (0.012) (0.006) (0.012) (0.006)Agesquared ‐0.002*** ‐0.002*** ‐0.002*** ‐0.002*** (0.000) (0.000) (0.000) (0.000)Female=1 ‐0.826*** ‐0.545*** ‐0.822*** ‐0.543*** (0.039) (0.019) (0.039) (0.019)Education ‐0.027* 0.006 ‐0.027* 0.006 (0.015) (0.008) (0.015) (0.008)Log(wage) 0.676*** ‐0.262*** 0.680*** ‐0.261*** (0.031) (0.011) (0.031) (0.011)Tenure(years) 0.057*** 0.031*** 0.058*** 0.031*** (0.010) (0.006) (0.010) (0.006)Tenuresquared ‐0.002*** ‐0.002*** ‐0.002*** ‐0.002*** (0.001) (0.000) (0.001) (0.000)Constant ‐13.766*** ‐6.001*** ‐13.565*** ‐5.867*** (0.288) (0.128) (0.291) (0.130)N 828,683 828,683 828,683 828,683
Standarderrorsinparentheses..***p<0.01,**p<0.05,*p<0.1.Sizeclassesarefornumberofemployees.Regres‐sionsincludeindustrydummies,countydummies,andyeardummies.

18
0
5
10
15
20
25
30
50‐100 100‐500 500‐1500 >1500
Perecentagereductioninregressioncoefficient
FirmSizeClass(numberofemployees)
Entrepreneurship Self‐Employment
instead of job switching declinesmarkedly as firm size increases. Model B shows that,conditionalonsizeandrank,thelikelihoodofbusinesscreationalsodeclinesmarkedlyasthenumberoflayersincreases.Asalreadynoted,theeffectoflayersisgreaterforentre‐preneurshipthanforself‐employment,andinthelattercasemuchoftheeffectisduetothe contrast in self‐employment entry rates between firmswith zero layers ofmanage‐ment and thosewithmore than zero. Finally, as Figure 5 illustrates, the fraction of thesmall firm effect that is explained by layers is somewhat largerwhen the sample is re‐strictedtomoversthanitisinthefullsample:Addinglayerstotheregressioninducesanaverage22percentdeclineinthecoefficientsonsizeforentryintoentrepreneurship,alt‐houghthedeclineremainslessthan10percentforself‐employment.
4.WhyHierarchiesMatter
In theprevious sectionwe found that, conditional on firm size,more layers ofmanage‐mentareassociatedwithlessmobilityofallkinds.Whilethemagnitudeoftheimpactonmovementstootheremployersissmall,morelayersmarkedlysuppressratesofbusinesscreation by employees. The contrast between the effects of layers on business creationand job switching indicate that the reducedmobility associatedwithmore layers is notjust an artifact of the general correlation between larger firms (withmore layers) andturnover in general. In this section,we consider several candidate explanations for thisfinding,andprovidesomeevidenceconcerningeachone.
Figure5.Percentagereductioninregressioncoefficientsonfirmsizeobtaineduponaddingcontrolsforlayersofmanagement.Moversonly.

19
4.1.Bureaucracyandpreferences
There is an extensive literature documenting that some individuals declare, often at anearlystageintheircareer,apreferencetocreateandoperatetheirownbusiness,andthatsuch declarations predict entry into entrepreneurship (Hamilton, 2000; Halaby, 2003;BenzandFrey,2008;ÅstebroandThompson,2010).Halaby(2003)andSørensen(2007)showthattheoffspringofself‐employedparents,whohaveonaveragemuchgreateren‐trepreneurial aspirations than theoffspringofwageearners, aremore likely towork insmallerandpresumablylessbureaucraticorganizations.BenzandFrey(2008)havedoc‐umentedthatbothentrepreneursandemployeesofsmallerfirmsreportgreaterlevelsofjob satisfaction, and that inbothcases satisfaction is associatedwithhavinggreater au‐tonomyandmore rewardingwork content. There seems, therefore tobe an associationbetweenthepreferencesofpeoplewhofoundbusinessesandemployeesofsmallorgani‐zationsthatmightinduceasmallfirmeffect.14
Elfenbein et al. (2010) claim that, if preference sorting is the only reasonweobserve asmall firm effect, then the size of employers should be unrelated to subsequent perfor‐mance in entrepreneurship and self‐employment. By extension, layers of managementshouldnotpredict entrepreneurialperformance.15However, thisargument strikesusasincomplete.Agentscreateandthencontinuetooperatebusinessesifthetotalcompensa‐tionexpectedfromthebusinessexceedstheforegonewage.However,totalcompensationfromentrepreneurshipandself‐employmentincludesanon‐pecuniarycomponentamongthosewithapreferenceforentrepreneurship.Becausepeoplewithsuchpreferencesarepresumablyoverrepresentedinless‐bureaucraticfirms,wemayanticipateeitherorbothof(i)apositiverelationshipbetweenthenumberofmanagementlayersandsubsequentmonetaryperformance inentrepreneurship,and(ii)anegativerelationshipbetweenthenumberofmanagementlayersandthelikelihoodofbusinesssurvival.
Whichofthesetwopossibleconsequencesofpreferencesmattersmoredependsinlargepartontheabilityofagentstoforecastbusinessearnings. If forecasterrorsare large,soentry into business is predicatedmostly on the population mean of business earnings,thenthereisnomechanismbywhichagentswithapreferenceforentrepreneurshipcan
14Offsetting this,however, is the likelihoodthatsmall firmemployment isasubstitute forentre‐preneurshipamongcertaintypesofindividuals.15 Elfenbein et al. report that entrepreneurs previously employed in small firms earn less thanthoseemployedbythe largest firms,butattributethistothe loweropportunitycostofentrepre‐neurshipamongtheformergroup.Oncetheycontrolforpriorwages,theyfinda23percentpremi‐umtoentrepreneurialearningsamongthosethatleftthesmallestfirmsrelativetothosethatleftthelargest.However,theeffect isnon‐monotonic,withthelargestpremiumoccurringamongen‐trepreneurspreviouslyemployedinmedium‐sizedfirms.

20
choose to accept lower income in exchange for the non‐pecuniary payoff that businessownershipentails. In this case,monetarybusiness incomewillnotdependuponprefer‐ences.However,agentswithapreferenceforentrepreneurshiparemorelikelytocontin‐ueoperatingabusiness thatprovidespoor financial returns, somanagement layersandbusiness survivalwill be negatively correlated. If, in contrast, forecast errors are small,agents with a preference for entrepreneurship will elect to create businesses that areknown in advance to offer relatively poor financial returns. Selection effects imply thattheywill earn lessonaverageand,moreprecisely, that theyaremore likely to createabusinessthatpayslessthantheyearnedinwageemployment.However,becausetheyareonaverageofworseinitialquality,businessescreatedbyagentswithapreferenceforen‐trepreneurship do not necessarily survive longer than those created by agentswithoutsuchpreferences.
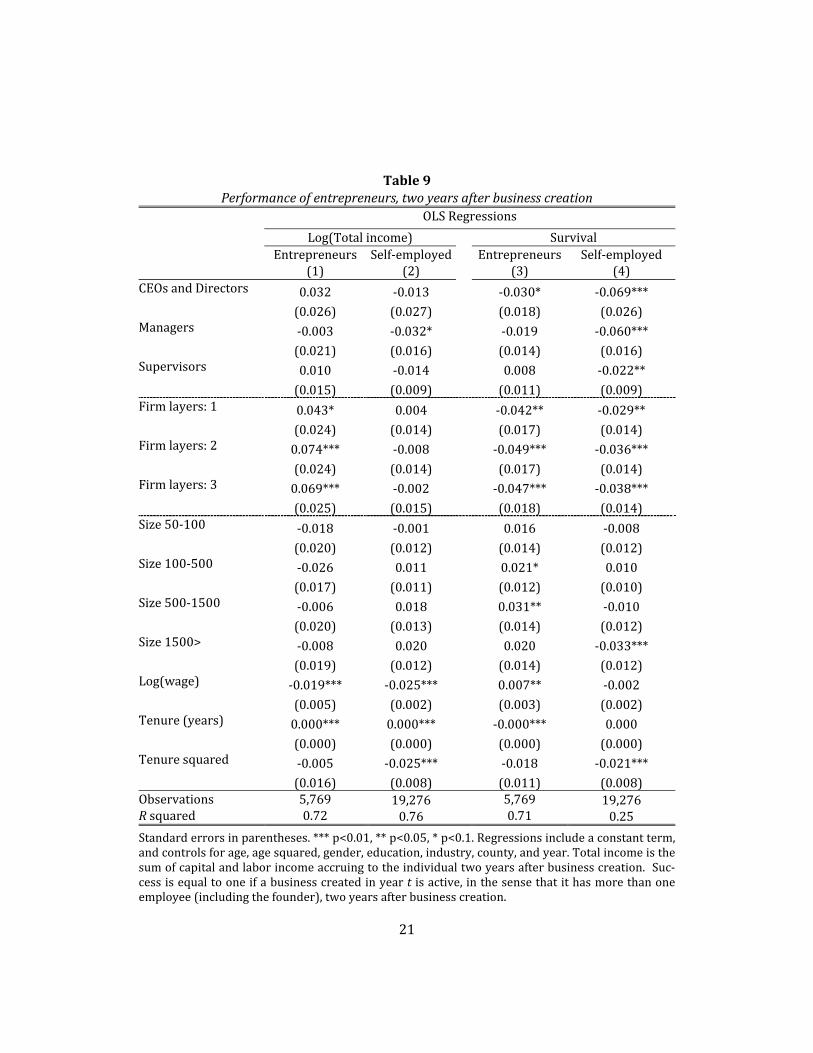
Totestthethesisofpreferencesorting,weregressentrepreneurialandself‐employmentearningsandsurvivalratesonthesizeof,andthenumberofmanagement layers in, thebusinessowner’spreviousemployer.Wereporttheresultsoftheseregressions,separate‐ly for entrepreneurs and the self‐employed, in Table 9. There is a positive relationshipbetweenthenumberoflayersinthepreviousemployerandanagent'searningsfromen‐trepreneurship,although this relationship isnotapparent forself‐employment.Further‐more, businesses createdby agents that left a firmwithno layers ofmanagement havehigher survival rates, results that hold for both entrepreneurship and self‐employment.Therearenoclearpatternsbetweenperformanceand firmsize.The resultprovideevi‐dencefortheexistenceofbothchannelsthroughwhichpreferencesortingmayaffectfirmperformance,andtheseeffectsaremoreclearlyassociatedwiththehierarchicalstructureofthefirmthantheyarewithfirmsize.
4.2Informationprocessing
CaliendoandRossi‐Hansberg(2012)developageneralequilibriummodelofmanagementlayers inwhichoutput is securedbysolvingproblems,andworkerknowledgeand timeare key inputs into the production process.Workers on the shop floor (their context ismanufacturing) produce by solving problems that present themselves. If they have theknowledge, theysolvetheproblemthemselves,whichyieldssomeoutput. If theydonothavetheknowledgetheypasstheproblemuptotheirsupervisor,whomayeithersolvetheproblemorpassituptothenextlayerofmanagement.Employeesareconstrainednotonlybytheirknowledge,butalsobytime.Thus,asupervisorinchargeoftoomanywork‐ers,orofworkerswithtoolittleknowledge,willnotbeable toaddressall theproblemsthat come up the line. Caliendo and Rossi‐Hansberg examine the optimal number of
21
Table9Performanceofentrepreneurs,twoyearsafterbusinesscreation
OLSRegressions
Log(Totalincome) Survival Entrepreneurs Self‐employed Entrepreneurs Self‐employed (1) (2) (3) (4)CEOsandDirectors 0.032 ‐0.013 ‐0.030* ‐0.069*** (0.026) (0.027) (0.018) (0.026)Managers ‐0.003 ‐0.032* ‐0.019 ‐0.060*** (0.021) (0.016) (0.014) (0.016)Supervisors 0.010 ‐0.014 0.008 ‐0.022** (0.015) (0.009) (0.011) (0.009)Firmlayers:1 0.043* 0.004 ‐0.042** ‐0.029** (0.024) (0.014) (0.017) (0.014)Firmlayers:2 0.074*** ‐0.008 ‐0.049*** ‐0.036*** (0.024) (0.014) (0.017) (0.014)Firmlayers:3 0.069*** ‐0.002 ‐0.047*** ‐0.038*** (0.025) (0.015) (0.018) (0.014)Size50‐100 ‐0.018 ‐0.001 0.016 ‐0.008 (0.020) (0.012) (0.014) (0.012)Size100‐500 ‐0.026 0.011 0.021* 0.010 (0.017) (0.011) (0.012) (0.010)Size500‐1500 ‐0.006 0.018 0.031** ‐0.010 (0.020) (0.013) (0.014) (0.012)Size1500> ‐0.008 0.020 0.020 ‐0.033*** (0.019) (0.012) (0.014) (0.012)Log(wage) ‐0.019*** ‐0.025*** 0.007** ‐0.002 (0.005) (0.002) (0.003) (0.002)Tenure(years) 0.000*** 0.000*** ‐0.000*** 0.000 (0.000) (0.000) (0.000) (0.000)Tenuresquared ‐0.005 ‐0.025*** ‐0.018 ‐0.021*** (0.016) (0.008) (0.011) (0.008)Observations 5,769 19,276 5,769 19,276Rsquared 0.72 0.76 0.71 0.25
Standarderrorsinparentheses.***p<0.01,**p<0.05,*p<0.1.Regressionsincludeaconstantterm,andcontrolsforage,agesquared,gender,education,industry,county,andyear.Totalincomeisthesumofcapitalandlaborincomeaccruingtotheindividualtwoyearsafterbusinesscreation.Suc‐cessisequaltooneifabusinesscreatedinyeart isactive,inthesensethatithasmorethanoneemployee(includingthefounder),twoyearsafterbusinesscreation.

22
management layers, and sizeandcompositionof each layer, andhow these changeasafirmexperiencesanincreaseindemand.
Firmheterogeneity is an important part of themodel, and firmsmay respond to an in‐creaseindemandineitheroftwoways.First,theymayincreasethesizeandchangethecompositionofeachlayer,whileholdingthenumberoflayersconstant.Alternatively,theymayaddalayerofmanagement,whichinturninduceschangesinthesizeandcomposi‐tionofexistinglayers.CaliendoandRossi‐Hansbergshowthatwhenafirmexpandslay‐ers, it increases the number of hoursworked at each pre‐existing layer. The additionallayers enable workers to pass more problems up the line. They therefore need lessknowledge and the averagewage declines. Symmetrically, elimination of layers reduceslayer sizeand raises theaveragewagewithineach surviving layer. In contrast, if a firmexpandswithout increasing layers itmust pay higherwages at each level because timeconstraints on uppermanagement forceworkers in lower layers to solvemore of theirownproblems. Caliendo,Monte andRossi‐Hansberg (2012) exhaustively examine thesepredictions of themodel using a panel of observations on the largemajority of Frenchmanufacturing firms, and findno instance inwhich theevidencecontradicts thepredic‐tions.Tåg(2013)replicatestheirstudyandconcludesthatthepredictionsofCaliendoandRossi‐Hansberg(2012)alsoholdforSwedishmanufacturingfirms.
Thetheorypredictsthatconditionalonfirmsize,firmswithfewerlayersemployworkerswith the ability to solve a broader range of problems. Consistent with Lazear’s (2005)Jack‐of‐all‐tradestheory,suchworkersaremorelikelytoenterentrepreneurshipandself‐employment,andtheyarelikelytoperformbetterwhentheydo.However,workerswithbroaderskillsarepaidahigherwage,whichreducesmobility.Ifweconditiononanindi‐vidual’swage,however,employees in firmsofagivensizebutwith fewer layersshouldhave a higher propensity to enter entrepreneurship and self‐employment and bemoresuccessfulwhentheydo.Similarly,employeesoflargerfirmswithagivennumberoflay‐ersarepredictedtohaveaboarderrangeofskills;suchemployeesshould,conditionalontheirwage,bemorelikelytocreateabusinessandbemoresuccessfulwhentheydo.
Theevidencefromanalyseswehavealreadyreportedisnotespeciallyfavorabletothesepredictions.InTable8,whichestimatedbusinesscreationratesaftercontrollingforpriorearnings,wesawthatwhilemorelayersreducebusinesscreation,largerfirmswereasso‐ciatedwith lessentry.Theeffectof layers isconsistentwith themodel,but theeffectoffirmsizeisnot.IntheperformanceregressionsofTable9,wefoundthatmorelayersareassociatedwithhigherentrepreneurialearningsand lowersurvivalrates.Boththeseas‐sociations,weconcluded,wereconsistentwithpreferencesorting;theeffectoflayerson

23
businessearningsisnotwhattheinformationprocessingmodelwouldleadustoexpect.
Ofcourse,preferencesortingandinformationprocessingarenotmutuallyexclusivetheo‐ries,soitisquitepossiblethatevidenceforthelattertheoryisconfoundedbypreferencesorting.Wecanconductaperhapssharpertestoftheinformationprocessingstory.Sofar,wehavecontrolledinourmultinomiallogitregressionsforrank,thenumberoflayersandfirmsize.Ofparticularnotehereisthepositiveeffectwefoundofhigherrankonthelike‐lihoodofbusinesscreation,andespeciallyofentrepreneurship.However,themeaningofaparticular rank depends on the hierarchical structure of the firm. The information pro‐cessing story implies that themore layers there are in a firm the greater thedifferencebetweenthebreadthofknowledgeofemployeesinthehighestandlowestranks.Asare‐sult,thelikelihoodofbusinesscreationofanyrankrelativetothelowestrankinthefirmshouldbegreaterthemoreranksthatliebetweenthem.
EvidenceonthispredictionisprovidedinTable10,whichestimatestheeffectofrankonthe likelihoodofbusinesscreationseparately for firmswithdifferentnumbersof layers.Consistentwiththeinformationprocessingstory,wefindfirstthatforanygivennumberof layers in a firm the probability of entering entrepreneurship and self‐employment isgreater the higher the relative position.Moreover, the coefficients for entrepreneurshipand self‐employmenton the top layers are larger themore layers there are in the firm.This is true foremployees inthetopranksaswemove fromone‐layerto two‐layerandthentothree‐layer firms;andit isalsotrueforemployeesinthesecondhighestrankaswemovefromtwotothreelayersinthefirm.Thesefindingsholdbothforentrepreneur‐ship and for self‐employment and they suggest, consistent with Caliendo and Rossi‐Hansberg(2012),thatthespanofknowledgeofmanagersisrelatedtothenumberoflay‐ersbeneaththem,ratherthanthetitleoftheirrank.
4.3Careerconcerns
Afirmmaydevelopahierarchytocreateincentivesforemployeestoexerteffort.Inpar‐ticular,tournamenttheory(e.g.,LazearandRosen,1981;LazearandShaw,2007)explainsthatwagesaregenerallyassociatedwithjobsratherthanwithindividuals,andthatpro‐motionistherewardforemployeeswhoseperformanceexceedsthatoftheirpeers.Con‐ditionalonsize,afirmwithmorelayersoffersgreaterprospectsofpromotion,soemploy‐eesaremore likely toremainwith the firm.Theprospectofpromotionalsoservesasaform of deferred compensation, which adds a further incentive to remain with a firm.Thus,theconcernsthatindividualshavefortheircareerprospectsmaywellliebehindthenegativeassociationwehaveobservedbetweenthenumberof layersandmobilityofallkinds.

Table10WorkerTransitions,MultinomialLogitestimations
THREELAYERS TWOLAYERS ONELAYER
EntrepreneurshipSelf‐
employment Otherfirm EntrepreneurshipSelf‐
employment Otherfirm EntrepreneurshipSelf‐
employment Otherfirm
Top 1.460*** 0.534*** 0.300*** 0.747*** 0.314*** 0.187*** 0.516*** ‐0.017 ‐0.233***
(0.099) (0.081) (0.014) (0.090) (0.064) (0.012) (0.081) (0.052) (0.011)
Second 1.153*** 0.426*** 0.293*** 0.565*** 0.255*** 0.068***
(0.074) (0.046) (0.008) (0.065) (0.037) (0.007)
Third 0.865*** 0.249*** 0.035***
(0.055) (0.027) (0.004)
Size50‐100 ‐0.311*** ‐0.192*** ‐0.035*** ‐0.394*** ‐0.343*** ‐0.055*** ‐0.555*** ‐0.469*** ‐0.086***
(0.081) (0.048) (0.009) (0.079) (0.046) (0.008) (0.122) (0.065) (0.012)
Size100‐500 ‐0.641*** ‐0.514*** ‐0.097*** ‐0.624*** ‐0.575*** ‐0.182*** ‐0.909*** ‐0.764*** ‐0.040***
(0.067) (0.041) (0.008) (0.065) (0.039) (0.007) (0.163) (0.083) (0.013)
Size500‐1500 ‐0.667*** ‐0.708*** ‐0.248*** ‐0.792*** ‐0.754*** ‐0.222*** ‐1.275*** ‐1.136*** ‐0.219***
(0.071) (0.043) (0.008) (0.090) (0.054) (0.009) (0.257) (0.166) (0.022)
Size1500> ‐1.243*** ‐1.024*** ‐0.513*** ‐1.074*** ‐1.107*** ‐0.675*** ‐0.708*** ‐1.191*** ‐0.753***
(0.074) (0.042) (0.008) (0.091) (0.056) (0.010) (0.191) (0.129) (0.022)
Log(wage) 0.467*** ‐0.784*** ‐0.527*** 0.589*** ‐0.738*** ‐0.497*** 0.514*** ‐0.760*** ‐0.575***
(0.049) (0.014) (0.003) (0.066) (0.023) (0.005) (0.091) (0.028) (0.008)(0.001) (0.001) (0.000) (0.001) (0.001) (0.000) (0.002) (0.001) (0.000)
Constant ‐12.625*** ‐2.989*** 3.428*** ‐13.137*** ‐3.345*** 2.765*** ‐13.776*** ‐4.065*** 2.917***(0.425) (0.179) (0.027) (0.573) (0.263) (0.044) (0.864) (0.366) (0.068)
Observations 4,561,415 4,561,415 4,561,415 1,525,459 1,525,459 1,525,459 548,383 548,383 548,383
Standarderrorsinparentheses.***p<0.01,**p<0.05,*p<0.1.Regressionsincludecontrolsforage,agesquared,female,education,tenure,tenuresquared,industry,yearandcounty,andaconstant.

25
Unlessemployeescareaboutstatus,theincentivesthatlayersprovidetoremainwiththefirmdependonhowmuchpay increases at the timeof promotion.Wewould thereforeexpecta largerwithin‐firmdifference inwagesacrossranksto increase the incentive tostayintheorganization.InmodelAofTable11,wetestthisnotionbyestimatingtransi‐tionprobabilitiesas a functionof, interalia, the standarddeviationofwageswithin thefirm.Thesampleisrestrictedtofirmswithatleastonelayerofmanagement.Theregres‐sion also controls for an agent’s ownwage and the averagewage in the firm, the latterbecausewealreadyknowthatitiscorrelatedwiththenumberoflayers.Theresultsarenotwhatthecareerconcernsmodelwouldleadustoexpect:thegreaterthewagedisper‐sion the higher the probability of exit to entrepreneurship, self‐employment and otherfirms.OurresultsformobilityarethesameasthosereportedbyLazearandShaw(2008)acrosseightcountries.
Thestandarddeviationofwagesreflectsnotonlytheincrementstothewagethatarese‐curedbypromotion to ahigher rankbut alsowithin‐rankdispersion.Although thishasbeentheusualwayinwhichafirm’swagepolicyhasbeenmeasured, itmightbeapoormeasure for tests of the career concernsmodel. InModelB of Table 11we replace thestandard deviation with the firm’s average between‐rank change of wage, estimatedthrough a linear regression ofwage on rank across all employeeswithin the firm. Thismeasuremightmore adequately reflect the incentive effects of promotion.Howeverwecontinuetofindnosupportforthecareerconcernsmodel.Althoughthecoefficientonthiswageslopevariablehastheexpectedsignforentrepreneurship, itcontinuestohavethewrongsignforself‐employmentandjobswitching.
Perhapsweareusingthewrongmeasureofwagedispersiontoproxyincentivestostayandwork.Theappropriatemeasureofdispersionasanincentiveforanagenttostaywithhiscurrentemployermaybeonethatiscalculatedrelativetothedispersionthatisfoundatother firmsthatmightemploytheagent.Weexplorethispossibilitynext.Weuseourmeasureofthewageslopeacrossranks,butnowwecompareitwiththeslopesoffirmsoperating in the same industry and year.16 The results, shown asModel C of Table 11,againfailtooffersupportforthecareerconcerns.
16Thewageslopeisbasedonaregressionoflaborincomeonthemanagementlayerinafirmandisnormalizedsuchthatitisrelativetotheindustry‐yearmeanslope.Itispositiveifthewageslopeishigherthanindustry‐yearmeanandnegativeotherwise.Becausetheslopeismeaninglessinfirmswithzerolayersofmanagement,wedropthesefirms.Wealsorestrictattentiontofirmswithmorethan30employeestohavelargeenoughsamplesforestimatingthewage‐rankslopeforeachfirmindividually.
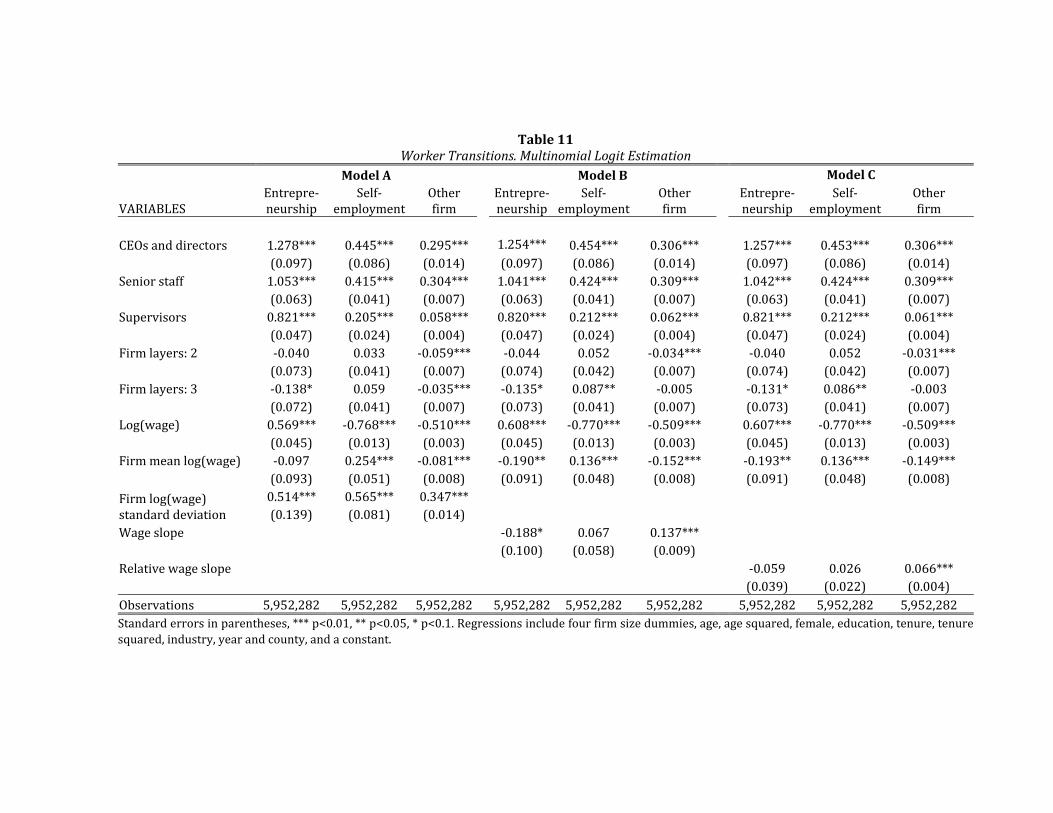
Table11
WorkerTransitions.MultinomialLogitEstimation ModelA ModelB ModelC
VARIABLESEntrepre‐neurship
Self‐employment
Otherfirm
Entrepre‐neurship
Self‐employment
Otherfirm
Entrepre‐neurship
Self‐employment
Otherfirm
CEOsanddirectors 1.278*** 0.445*** 0.295*** 1.254*** 0.454*** 0.306*** 1.257*** 0.453*** 0.306***
(0.097) (0.086) (0.014) (0.097) (0.086) (0.014) (0.097) (0.086) (0.014)Seniorstaff 1.053*** 0.415*** 0.304*** 1.041*** 0.424*** 0.309*** 1.042*** 0.424*** 0.309***
(0.063) (0.041) (0.007) (0.063) (0.041) (0.007) (0.063) (0.041) (0.007)Supervisors 0.821*** 0.205*** 0.058*** 0.820*** 0.212*** 0.062*** 0.821*** 0.212*** 0.061***
(0.047) (0.024) (0.004) (0.047) (0.024) (0.004) (0.047) (0.024) (0.004)Firmlayers:2 ‐0.040 0.033 ‐0.059*** ‐0.044 0.052 ‐0.034*** ‐0.040 0.052 ‐0.031***
(0.073) (0.041) (0.007) (0.074) (0.042) (0.007) (0.074) (0.042) (0.007)Firmlayers:3 ‐0.138* 0.059 ‐0.035*** ‐0.135* 0.087** ‐0.005 ‐0.131* 0.086** ‐0.003
(0.072) (0.041) (0.007) (0.073) (0.041) (0.007) (0.073) (0.041) (0.007)Log(wage) 0.569*** ‐0.768*** ‐0.510*** 0.608*** ‐0.770*** ‐0.509*** 0.607*** ‐0.770*** ‐0.509***
(0.045) (0.013) (0.003) (0.045) (0.013) (0.003) (0.045) (0.013) (0.003)Firmmeanlog(wage) ‐0.097 0.254*** ‐0.081*** ‐0.190** 0.136*** ‐0.152*** ‐0.193** 0.136*** ‐0.149***
(0.093) (0.051) (0.008) (0.091) (0.048) (0.008) (0.091) (0.048) (0.008)
Firmlog(wage)standarddeviation
0.514*** 0.565*** 0.347***(0.139) (0.081) (0.014)
Wageslope ‐0.188* 0.067 0.137***(0.100) (0.058) (0.009)
Relativewageslope ‐0.059 0.026 0.066***(0.039) (0.022) (0.004)
Observations 5,952,282 5,952,282 5,952,282 5,952,282 5,952,282 5,952,282 5,952,282 5,952,282 5,952,282Standarderrorsinparentheses,***p<0.01,**p<0.05,*p<0.1.Regressionsincludefourfirmsizedummies,age,agesquared,female,education,tenure,tenuresquared,industry,yearandcounty,andaconstant.

27
4.4StarsandMisfits
Throughoutmuch of our analysis so far,we have seen different results for entry into self‐employmentandentrepreneurship.Thisisparticularlysowiththevariousmeasuresofearn‐ingsthatwehaveincluded:theagent’sownwageispositivelyassociatedwithentryintoen‐trepreneurshipbutnegativelywithself‐employment(Tables7and8);thefirm’smeanwageandbetween‐rankwageslopealsohaveeffectsofoppositesigns(althoughnotalwaysstatisti‐cally significant) on entrepreneurship and self‐employment (Table 11); and the number oflayersinthefirmispositivelyrelatedtosubsequententrepreneurialearningsbutnottoself‐employmentearnings(Table9).Thesecontrastingimpactssuggestthatentrepreneurshipandself‐employmentmaybechosenbyqualitativelydifferentemployees.
In a recent paper, Åstebro, Chen and Thompson (2011) developed and tested a model inwhichworkersvaryinthedegreetowhichtheyarewellmatchedtotheirjob.Thosethatarepoorlymatchedearnlessthantheymightexpectinbusinesscreation,andsotheyleave.Alt‐houghworkersaretreatedsymmetricallyintheirmodel,Åstebroetal.showthatmismatchesaremorecommoninthetailsoftheabilityandearningsdistributions.Inthelowertail,“mis‐fits”with lowabilityaremore likely toenterself‐employment,while intheuppertail,high‐ability“stars”aremorelikelytobecomeentrepreneurs.Ifoneiswillingtosupposethatlow‐abilityworkerscreatingabusinessarelikelytobecomeself‐employedwhiletheirhigh‐abilitycounterpartsarelikelytoestablishlimitedliabilitycompanies,themismatchingmodelreadilyaccountsforthecontrastingeffectsofownwageonbusinesscreation.Amongthesetofagentsatthelowerendofthedistributionalowerwageisassociatedonaveragewithlessabilityandagreaterlikelihoodofsufferingajobmismatch.Thus,ownwageisnegativelycorrelatedwithentryintoself‐employment.Incontrast,ahigherwageamongagentsatthetopoftheearningsdistribution isassociatedonaveragewithgreaterability,andan increasedchanceofamis‐match,soownwageispositivelycorrelatedwithentrepreneurship.
It is lessapparentthatthemismatchingmodelcanexplaintheeffectsofmanagementlayersonmobility.Onepossiblemechanism,however,isthatlayerscreateahierarchythatinducesafunctionalseparationbetweenagentsofhighandlowability,andtherebyreducesmismatch‐ing problems.17However, our view is that themain impact of stars andmisfits is to insertsomeanomaliesinourempiricaltestsofpreferencesorting,informationprocessing,andca‐reerconcernsaspotentialexplanationsfortheeffectsoflayers.
Toseewhethermismatchingmightbeinfluencingourresults,weexaminewhereinthewage
17InÅstebroetal.mismatchingarisesbecauseagentsofdifferingabilitymaybecomeco‐workersandtheproductionfunctionexhibitscomplementarityinworkerabilities.

28
distributiontheprobabilityofexitisthegreatest.Todosowecreateadummyforeachdecileofthewagedistributionandexaminetheeffectsofthesedummiesonexitprobabilities,leav‐ingthe40thtothe60thpercentileofthewagedistributionastheomittedcategory.Weincludeeachemployee’sownwageintheregressiontoabsorbeffectsonwagethatarenotrelatedtowithin‐firmrelativeability.Theresults,whicharereportedinTable12arequitestriking.Theprobabilityofremaininginthefirmisclearlyhighestamongthosewithmiddlingwageswhile
Table12
WorkerTransitions.MultinomialLogitEstimation Entrepreneurship Self‐employment Otherfirm
CEOsandDirectors 1.007*** 0.011 ‐0.187*** (0.068) (0.061) (0.012)Seniorstaff 0.867*** 0.370*** 0.084*** (0.056) (0.039) (0.007)Supervisors 0.693*** 0.334*** 0.009** (0.042) (0.021) (0.004)Log(wage) 0.183*** ‐0.367*** ‐0.285*** (0.063) (0.021) (0.005)Firmlayers:1 ‐0.239*** ‐0.185*** ‐0.029*** (0.061) (0.032) (0.007)Firmlayers:2 ‐0.325*** ‐0.215*** ‐0.057*** (0.061) (0.032) (0.007)Firmlayers:3 ‐0.448*** ‐0.185*** ‐0.034***
(0.063) (0.034) (0.007)0‐10thpercentile 0.351*** 1.001*** 0.696*** (0.106) (0.038) (0.007)10‐20thpercentile 0.013 0.692*** 0.363*** (0.077) (0.027) (0.005)20‐30thpercentile ‐0.099 0.285*** 0.120*** (0.071) (0.028) (0.005)60‐70thpercentile 0.005 ‐0.030 0.019*** (0.056) (0.029) (0.005)70‐80thpercentile 0.264*** ‐0.143*** 0.082*** (0.053) (0.031) (0.005)80‐90thpercentile 0.426*** ‐0.097*** 0.179*** (0.055) (0.032) (0.006)+90thpercentile 0.757*** 0.040 0.341*** (0.071) (0.037) (0.007)N 6,865,026 6,865,026 6,865,026
Standarderrorsinparentheses.***p<0.01,**p<0.05,*p<0.1. Regressionsincludefourfirmsizedummies,age,agesquared,female,education,tenure,tenuresquared,industry,yearandcountydummies,andaconstant.

29
theprobabilityofexitisremarkablyhigheramongthoseinthebottomandtopquintilesoftheearningsdistribution.Thebottomquintileismuchmorelikelythanthosewithmiddlingearn‐ingstoenterself‐employmentortojoinanotherfirm,andtheyarealsosomewhatmorelikelytobecomeentrepreneurs.Incontrast,thetopearnersaremuchmorelikelytobecomeentre‐preneurs,morelikelytoswitchjobs,butlesslikelytobecomeself‐employed.Thesepatternsexhibitanoteworthyconsistencywiththemismatchingmodel.However,theyappeartopro‐videnoexplanation for theeffectof layers, thecoefficientsonwhichareallbut identical tothoseobtainedinourpreviousregressions.
5.Conclusions
In thispaper,weaskedwhethersmall firmsaremore frequent incubatorsofentrepreneursbecausetheytendtobelesshierarchical.Wefoundthathierarchy,atleastaswehavemeas‐ureditintermsofthenumberoflayersofmanagement,isindeedlessprevalentinsmallfirmsandisassociatedwithmorefrequenttransitionsofemployeesintoself‐employmentanden‐trepreneurship.However,wealso found thathierarchyexplainsnomore thana fifthof theobservedsmallfirmeffect.ThecontributionofhierarchytothesmallfirmeffectiscomparableinmagnitudetothecontributionofothermechanismsidentifiedbyElfenbein,HamiltonandZenger(2010).
Wethenexamined fourpotentialmechanisms for the impactofhierarchyonbusinesscrea‐tionrates.First, individualswithapreference forentrepreneurshipchoose toseekemploy‐mentinfirmswithfewermanagementlayers(preferencesorting).Second,employeesinfirmswithfewerlayershaveabroaderrangeofskills,andthismakesthemmorefitforentrepre‐neurship(abilitybreadth).Third,multiplelayersofmanagementofferpromotionopportuni‐tiesthatdonotexistinfirmswithoutahierarchy,therebysuppressingmobility(careercon‐cerns).Finally,skillmismatchingis lessproblematicinfirmswithamorehierarchicalstruc‐ture.We found evidence for preference sorting, ability breadth and skill mismatching, butnone for career concerns. However, there remained throughout a substantial unexplainedcomponentoftheeffectofmanagementlayersonbusinesscreationrates.
OuranalysisisbasedontheSwedishmatchedemployer‐employeedataset.Conventionalwis‐domhas it that,alongwithotherScandinaviancountries,Sweden’s labormarket isatypical.Thisconventionalwisdomisnowdated,18andmostemploymentdatarevealthatSwedenis
18Forthemajorityofthe20thcentury,annualaveragewageincreasesweresetby“collectivebargain‐ing”betweenthethreemajorlaborunionsandthethreemajoremployers,respectively.However,be‐tween1970and1990centralizedcontroloverwageswasprogressivelydismantled,anditwasaban‐donedentirelyin1997.FurtherderegulationsoftheSwedishlabormarketintheearly1990sgaverise

30
comparable to otherOECD countries.While labormobility remains lower than average, itswage structure is now much like other high‐income countries. In fact, Lazear and Shaw(2008),showthatacrossseveralmeasuressuchaswagedispersionwithinfirms,thevarianceofwagegrowthrateswithinfirms,andevenoverallwagedispersion,Swedenisnotremarka‐blydifferentfromsevenothercountriestheystudy,includingtheU.S.A.TheenvironmentfornewfirmformationinSwedenisfurthernotmarkedlydifferentfromothercountriessuchastheU.S.A.,BrazilorDenmark(AnderssonandKlepper,2013).Wethusseenoreasonwhyre‐sultsfoundinthispaperwouldnotbereplicatedelsewhere.
ReferencesAnderson,PatriciaM.,andBruceD.Mayer(1994):“Theextentandconsequencesofjobturnover.”
BrookingsPapersonEconomicActivity:Microeconomics,177–236.
Andersson,Martin,andStevenKlepper(2013):”CharacteristicsandperformanceofnewfirmsandspinoffsinSweden.”IndustrialandCorporateChange,22(1):245–80.
Åstebro,Thomas,JingChen,andPeterThompson(2011):“Starsandmisfits:Self‐employmentandlabormarketfrictions.”ManagementScience,57(11):1999–2017.
Åstebro, Thomas, and Peter Thompson (2010): “Entrepreneurs: Jacks of all trades or ho‐bos?”ResearchPolicy,40(5):637–649.
Benz,MatthiasandBrunoS.Frey(2008):“Beingindependentisagreatthing:Subjectiveevalua‐tionsofself‐employmentandhierarchy.”Economica,75(298):362–383.
Caliendo, Lorenzo, Ferdinando Monte, and Esteban Rossi‐Hansberg (2012): “The anatomy ofFrenchproductionhierarchies.”Workingpaper,YaleUniversity.
Caliendo,Lorenzo,andEstebanRossi‐Hansberg(2012):“Theimpactoftradeonorganizationandproductivity.”QuarterlyJournalofEconomics,127(3):1393–1467.
Chen,Jing(2012):“Thesmallfirmeffectandthequalityofentrepreneurs.”Workingpaper,Copen‐hagenBusinessSchool.
Dobrev,StanislavD.andWilliamP.Barnett(2005):“Organizationalrolesandtransitiontoentre‐preneurship.”AcademyofManagementJournal,48(3):433–449.
Elfenbein,DanielW.,BartonH.Hamilton,andToddR.Zenger(2010):“Thesmall firmeffectandtheentrepreneurialspawningofscientistsandengineers.”ManagementScience,56(4):659–681.
Frederiksen,Anders(2006):“Genderdifferencesinjobseparationratesandemploymentstability:Newevidencefromemployer‐employeedata.”InstitutefortheStudyofLabor(IZA)Discus‐
to a dual labormarket consisting of temporary and permanently employedworkers. These changesinduced an increase in the Gini coefficient for income from 0.199 in 1981 to 0.332 in 2007(http://www.scb.se/Pages/TableAndChart____163550.aspx). The 2007 figure places Sweden at theOECD average (TheEconomist, 2013). The percentage of temporary employees in the private sectorrosefrom8.8percentin1997to13.1percentin2008(SverigesOfficiellaStatistik,2001;2012).

31
sionPaperNo.2147.
Gompers, Paul, Josh. Lerner, and David Scharfstein (2005): “Entrepreneurial spawning: Publiccorporations and the genesis of newventures, 1986 to 1999.” JournalofFinance,60(2):577–614.
Halaby,CharlesN.(2003):“Wherejobvaluescomefrom.Familyandschoolingbackground,cogni‐tiveability,andgender.”AmericanSociologicalReview,68;251–278.
Haltiwanger,John,RonS.Jarmin,andJavierMiranda(2011):“Whocreatesjobs?Smallvs.largevs.young.”Workingpaper,UniversityofMaryland.
Hamilton,Barton(2000):“Doesentrepreneurshippay?Anempiricalanalysisofthereturnstoself‐employment.”JournalofPoliticalEconomy,108(3):604–631.
Hausman,Jerry,andDanielMcFadden(1984):“Specificationtestsforthemultinomiallogitmod‐el."Econometrica,52(5):1219–1240.
Henrekson,MagnusandTinoSanandaji(2013):"Billionaireentrepreneurs:Asystematicanalysis."IFNWorkingPaperNo.959.
Jovanovic,Boyan(1979):“Jobmatchingandthetheoryofturnover.”JournalofPoliticalEconomy,87(5,Part1):972‐990.
Lazear,EdwardP.,andSherwinRosen(1981): “Rank‐order tournamentsasoptimumlaborcon‐tracts.”JournalofPoliticalEconomy,89(5):841–64.
Lazear,EdwardP.(2005):”Entrepreneurship.”JournalofLaborEconomics,23(4):649‐680.
Lazear,EdwardP. andKathrynL. Shaw (2007). "Personnel economics:Theeconomist's viewofhumanresources."JournalofEconomicPerspectives,21(4):91–114.
Lazear,EdwardP.andKathrynL.Shaw,(2008)”“Introduction:Wagestructure,raisesandmobili‐ty: International comparisons of the structure of wages within and across firms.” In E.LazearandK.Shaweds.,TheStructureofWages:AnInternationalComparison,UniversityofChicagoPress.
Sørensen,Jesper(2007):‘Bureaucracyandentrepreneurship:Workplaceeffectsonentrepreneur‐ialentry.”AdministrativeScienceQuarterly,52:387–412.
Sveriges Officiella Statistik (2001): Statistiska Meddelanden, AM63 SM 0102, StatistiskaCentralbyrån.
Sveriges Officiella Statistik (2012): Statistiska Meddelanden, AM63 SM 1204, StatistiskaCentralbyrån.
Tåg,Joacim(2013):“ProductionHierarchiesinSweden”,IFNWorkingPaperNo.963
TheEconomist(2013):“Theinsandtheouts.ImmigrationandgrowinginequalityaremakingtheNordicslesshomogeneous.”TheEconomist,February2nd,2013.
Wagner, Joachim(2004):“Areyoungandsmall firmshothouses fornascententrepreneurs?”Ap‐pliedEconomicsQuarterly,50:379–391.