Embed Size (px)
Citation preview

IEEE POWER ENGINEERING SOCIETY ENERGY DEVELOPMENT AND POWER GENERATING COMMITTEE
HARNESSING UNTAPPED GEOTHERMAL POWER
IEEE 2002 Summer Power Meeting, Chicago, Monday, July 22, 2002 Sponsored by: - International Practices for Energy Development and Power Generation Subcommittee Chair: Tom Hammons, Glasgow University, Scotland, UK Co-Chair: Peter Meisen, GENI, San Diego, USA Track 1: Securing New/Alternate Sources of Energy The Panel Session discussed the current state of harnessing geothermal power for medium and large-scale generation of electricity (and for space heating) worldwide. Panelists reviewed current, potential, probable and possible developments both in developed and developing countries in near future and long term. Technology of harnessing geothermal power now and future was presented. Economics, availability, and reliability of geothermal plants was also reviewed. 1 Principal contributors included: 1. Valgardur Stefansson, Orkustofnun, National Energy Authority of Iceland, Reykjavik,
Iceland 2. Arni Gunnarsson, Landsvirkjun, National Power Company, Reykjavik, Iceland 3. Jay Nathwani, Department of Energy, Idaho Operations Office, Idaho Falls, ID, USA 4. Joel Renner, Idaho National Engineering and Environmental Laboratory, Idaho, USA 5. R. Gordon Bloomquist, Washington State University Cooperative Extension Energy
Program, Olympia, Washington, USA 6. Daniel N. Schochet, Vice President, ORMAT Technologies, Inc., Sparks, Nevada, USA 7. R. Gerald Nix, National Renewable Energy Laboratory, Golden, Colorado, USA 8. Ed Hoover, Sandia National Laboratory, USA 9. Karl Urbank, VP of Technical Services, Calpine Corporation, Middleton, CA, USA 10. Kenneth H. Williamson, UNOCAL Corporation, CA 11. William E. Lewis, Power Engineers, Inc., Hailey, Idaho, USA Each Panelist spoke for approximately 20 minutes. Each presentation was discussed immediately following the respective presentation. There was a further opportunity for discussion of the presentations following the final presentation. The Panel Session was organized by Tom Hammons, Chair, International Practices for Energy Development and Power Generation (University of Glasgow, UK)* and Peter Meisen,
* Tom Hammons, Chair, International Practices Subcommittee, Glasgow University, 11C Winton Drive,
Glasgow G12 0PZ, Scotland, UK, Tel: +44 141 339 7770, E-mail: [email protected] ** Peter Meisen, President, Global Energy Network Institute (GENI), c/o World Trade Center of San Diego,
1250 Sixth Ave Suite 901, San Diego, CA 92101 USA, Tel: +1 619 595 0139, Fax: +1 619-595-0403, E-mail: [email protected], WEB: www.geni.org
1

President, Global Energy Network Institute (GENI), SanDiego, CA, USA**. The Panel Session was moderated by Tom Hammons (University of Glasgow). The following presentation summaries are included in this document. (1) Global Perspective on Geothermal Energy
Valgardur Stefansson (2) Geothermal Power Production in Iceland
Arni Gunnarsson (3) Geothermal Technologies Program
Jay Nathwani (4) Geothermal Energy in the United States Joel L. Renner (5) Direct Use Geothermal Energy
R. Gordon Bloomquist (6) A Developers Perspective: Eighteen Years of Field Experience with Innovative
hGeothermal Power Plants Daniel N. Schochet
(7) Signigficantly Improving the Geothermal Power Plant – A DOE-Industry Partnership
R. Gerald Nix (8) Geothermal Drilling R&D Overview Ed Hoover and John Finger (9) Update on the Geysers and other Geothermal Opportunities
Karl Urbank (10) Large Scale, Private Sector Geothermal Power Development in SE Asia Kenneth H. Williamson (11) Geothermal Power Plant Design: Not Rocket Science. But Not a Gas Turbine Either
William E. Lewis Panelist Contact Information
2

(1) GLOBAL PERSPECTIVE ON GEOTHERMAL ENERGY Valgardur Stefansson, Orkustofnun, Reykjavik, Iceland
Abstract The energy consumption in the world is now a little over 400 EJ per year. Available energy resources in the world are large, and energy shortage is not expected in the foreseen future. On the other hand, most (86 %) of the energy used in the world at present is coming from finite energy resources, whereas renewable energy sources are more suitable for sustainable development. The highest share of the use of renewable energy resources is in Iceland, where renewable energy comprises approximately 70% of the primary energy resources and approximately 30% is derived from fossil fuels. This unique position has been achieved by an extensive and advanced use of geothermal energy in Iceland. On the worldwide basis, geothermal energy is considered to have the largest technical potential of the renewable energy sources. Furthermore, the production price of geothermal energy is favorable as compared to all other energy sources. Introduction Most of the renewable energy sources presently used and under development in the world are in one way or another connected to the energy that the Earth is receiving from the Sun (hydro, biomass, solar- and wind energy). Most of the energy resources used in the world at present (86%) are coming from finite energy sources embedded in the crust of the Earth (oil, gas, coal, and uranium). Only one energy resource of the crust is renewable, namely geothermal energy. The source of geothermal energy is the continuous energy flux flowing from the interior of the Earth towards its surface. The use of finite energy sources is not in good harmony with the concept of sustainable development and most countries are aiming at increasing the use of renewable energy sources at the expense of the finite energy resources. International agreements like the Kyoto Protocol aims at this objective. Geothermal energy has many desirable properties that make it suitable as a replacement for fossil fuels. This Section summarizes the energy consumption in the world and the estimate of available energy resources to meet the energy demand. It is shown that the technical potential of geothermal energy is very large and that the production price of geothermal energy is very favorable as compared to other energy sources. World Energy Consumption Consumption of energy is one of the characteristics of the present society. Table 1 shows the worldwide consumption of primary energy in the year 1999.
3

Table 1. World Energy Consumption in 1999
EJ Gtoe % Fossil fuels 322 7.68 79.2 Nuclear 28 0.66 6.8 Renewables 57 1.36 14.0
Total 407 9.70 100 Source: IEA 2001 For the world, the use of renewable energy sources is only 14% of the primary energy sources, whereas finite energy sources (fossil fuels and nuclear) comprise 86%. It is interesting to note that the consumption of renewable energy sources is even lower in the developed countries than in the world as the whole. This is due to the fact that the use of traditional fuel wood is more common in the developing countries than in the more affluent OECD countries. The share of fossil fuels is higher in the OECD countries than for the world as a whole. Most of the worldwide use of nuclear energy takes place in the OECD countries. Table 2 illustrates primary energy supply in the OECD countries in 1999. Figure 1 shows relative contribution of energy sources in the world, in the OECD countries, and in Iceland. Table 2. Primary Energy Supply in OECD Countries in 1999 EJ Gtoe % Fossil fuels 181 4.32 82.7 Nuclear 24 0.58 11.0 Renewables 14 0.33 6.3 Total 219 5.23 100
Source: IEA 2001
Figure 1. Relative Contribution of Energy Sources in the World in the OECD Countries, and Iceland. One industrialized country, Iceland, has succeeded in raising the share of renewable energy sources up to 70%. The main reason for this exceptionally high share is the advanced use of geothermal energy.
4

The process of changing the energy consumption from fossil fuels to the present high level of renewable energy use in Iceland has taken about a half a century to realize as seen in Figure 2. It is interesting to note that the change from fossil fuels to renewable energy sources in Iceland was driven by economical factors. The change was realized because it is more economical for Iceland to use the indigenous renewable energy sources, geothermal and hydro, than to import fossil fuels.
Figure 2. Proportional use of Energy Sources in Iceland. It is considered desirable to increase the use of renewable energy sources at the expense of the use of the finite energy resources. Such development would promote the idea of sustainable development (Bruntland, 1987 [1]) and at the same time such development is expected to reduce the man-made emission of greenhouse gases. The benefit of the high level of renewables in Iceland is obvious in Figure 3. The figure shows the relation between the CO2 emission per capita and the energy supply per capita in 135 countries of the world. There is a very pronounced linear relationship between these parameters for almost all countries with a notable exception of Iceland. Iceland has a very high energy consumption per capita, but the emission of greenhouse gases is only one third of the emission characterized by other countries in relation to the energy consumption.
5
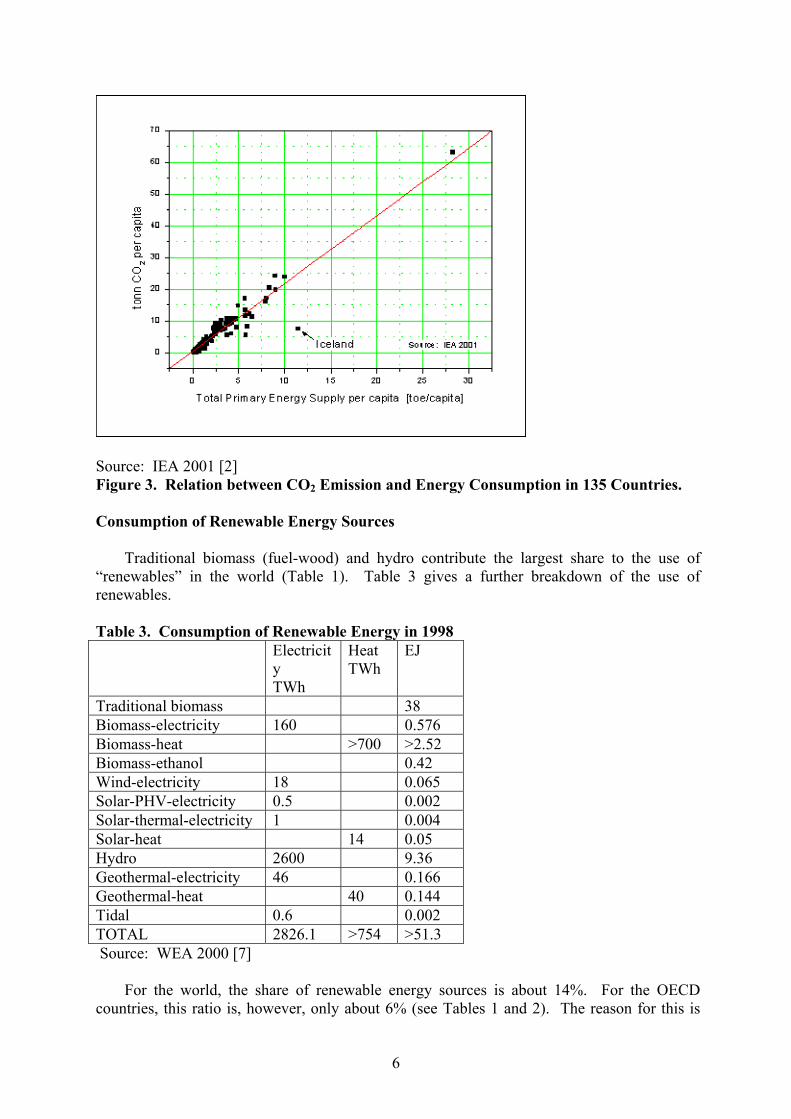
Source: IEA 2001 [2] Figure 3. Relation between CO2 Emission and Energy Consumption in 135 Countries. Consumption of Renewable Energy Sources Traditional biomass (fuel-wood) and hydro contribute the largest share to the use of “renewables” in the world (Table 1). Table 3 gives a further breakdown of the use of renewables. Table 3. Consumption of Renewable Energy in 1998 Electricit
y TWh
Heat TWh
EJ
Traditional biomass 38 Biomass-electricity 160 0.576 Biomass-heat >700 >2.52 Biomass-ethanol 0.42 Wind-electricity 18 0.065 Solar-PHV-electricity 0.5 0.002 Solar-thermal-electricity 1 0.004 Solar-heat 14 0.05 Hydro 2600 9.36 Geothermal-electricity 46 0.166 Geothermal-heat 40 0.144 Tidal 0.6 0.002 TOTAL 2826.1 >754 >51.3 Source: WEA 2000 [7] For the world, the share of renewable energy sources is about 14%. For the OECD countries, this ratio is, however, only about 6% (see Tables 1 and 2). The reason for this is
6

that about 80% of the consumption of renewable energy sources in the world is the use of biomass (Table 3) and that the use of traditional biomass is more common in the developing countries than in the OECD countries. Figures 4 and 5 show the use of renewable energy sources for heating purposes (Figure 4) and for the generation of electricity (Figure 5).
Figure 4.
Figure 5 Forfrom difgeneratihoweverat presen Consum
World Consumption of Heat from Renewable Energy Sources in 1998.
. Electricity Generated from Renewable Energy Sources in 1998.
heating purposes, the largest contribution of renewable energy sources is coming ferent forms of biomass (Figure 4), whereas hydro is giving the largest share to the on of electricity (Figure 5). The main lesson learned from these considerations is, , that aside from hydro and biomass, the contribution of renewable energy sources is t a very small fraction of the energy consumption in the world.
ption of Geothermal Energy
7
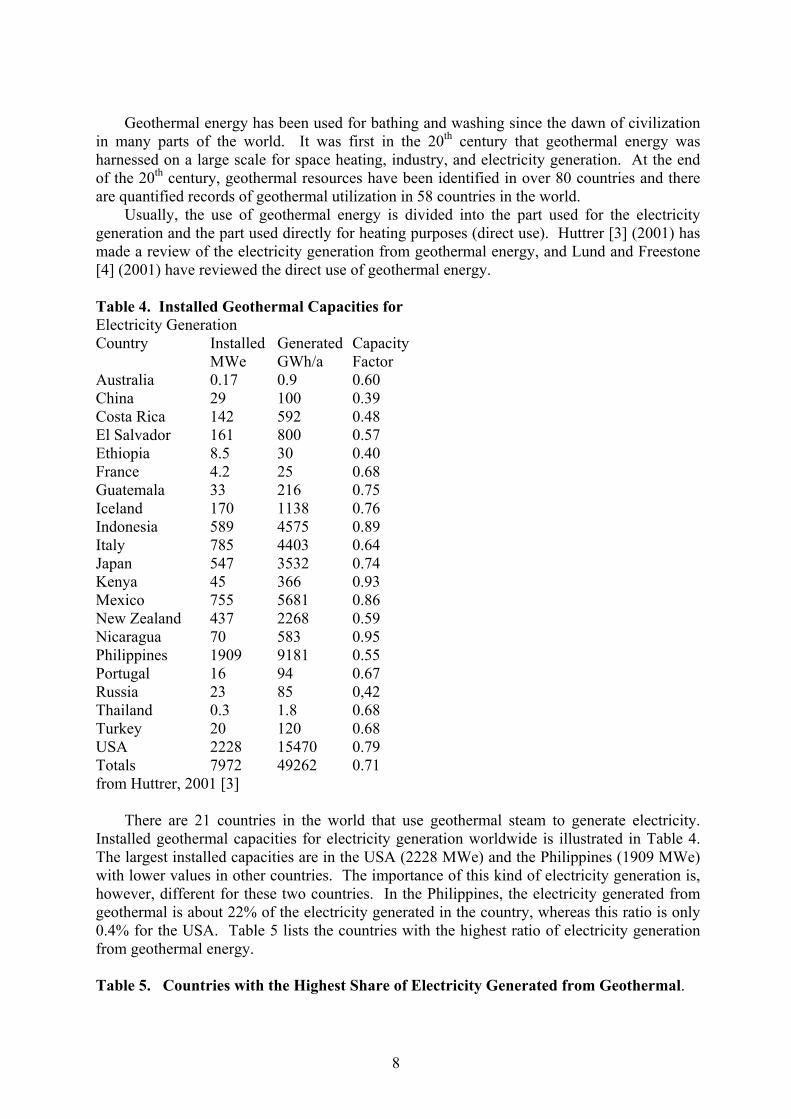
Geothermal energy has been used for bathing and washing since the dawn of civilization in many parts of the world. It was first in the 20th century that geothermal energy was harnessed on a large scale for space heating, industry, and electricity generation. At the end of the 20th century, geothermal resources have been identified in over 80 countries and there are quantified records of geothermal utilization in 58 countries in the world. Usually, the use of geothermal energy is divided into the part used for the electricity generation and the part used directly for heating purposes (direct use). Huttrer [3] (2001) has made a review of the electricity generation from geothermal energy, and Lund and Freestone [4] (2001) have reviewed the direct use of geothermal energy. Table 4. Installed Geothermal Capacities for Electricity Generation Country Installed Generated Capacity MWe GWh/a Factor Australia 0.17 0.9 0.60 China 29 100 0.39 Costa Rica 142 592 0.48 El Salvador 161 800 0.57 Ethiopia 8.5 30 0.40 France 4.2 25 0.68 Guatemala 33 216 0.75 Iceland 170 1138 0.76 Indonesia 589 4575 0.89 Italy 785 4403 0.64 Japan 547 3532 0.74 Kenya 45 366 0.93 Mexico 755 5681 0.86 New Zealand 437 2268 0.59 Nicaragua 70 583 0.95 Philippines 1909 9181 0.55 Portugal 16 94 0.67 Russia 23 85 0,42 Thailand 0.3 1.8 0.68 Turkey 20 120 0.68 USA 2228 15470 0.79 Totals 7972 49262 0.71 from Huttrer, 2001 [3] There are 21 countries in the world that use geothermal steam to generate electricity. Installed geothermal capacities for electricity generation worldwide is illustrated in Table 4. The largest installed capacities are in the USA (2228 MWe) and the Philippines (1909 MWe) with lower values in other countries. The importance of this kind of electricity generation is, however, different for these two countries. In the Philippines, the electricity generated from geothermal is about 22% of the electricity generated in the country, whereas this ratio is only 0.4% for the USA. Table 5 lists the countries with the highest ratio of electricity generation from geothermal energy. Table 5. Countries with the Highest Share of Electricity Generated from Geothermal.
8

COUNTRY
Ratio of Electricity Generated from Geothermal Resources, %
Philippines 22 El Salvador 20 Nicaragua 17 Iceland 15 Costa Rica 10 Kenya 8 New Zealand 6 Indonesia 5 On average, the capacity factor of the geothermal generation listed in Table 4 is 0.71. This is a relatively high capacity factor as compared with other renewable energy sources, and many geothermal power plants are operated as base load with a capacity factor of 0.95 or higher. Table 6 shows the world average capacity factors for different renewable energy sources. Table 6. Capacity Factors for Electricity Generation. World Average Capacity Factors for
Electricity Generation Geothermal 0.71 Hydro 0.42 Solar – thermal 0.30 Solar – PV 0.15 Wind 0.19 Source: WEC 1998 [6] Geothermal energy is available at all times throughout the year, whereas the availability of other renewable energy sources is in general much lower. Direct application of geothermal energy involves a wide variety of end uses. The main types of direct use are bathing, space heating, greenhouses, fish farming, and in industry. Direct application can use both high- and low-temperature geothermal resources and is therefore much more widespread in the world than the electricity production. Direct application is, however, more site specific for the market, as steam and hot water is rarely transported long distances. The longest geothermal hot water pipeline in the world is in Iceland (63 km). The production cost for direct utilization is highly variable, but commonly lower than 2 UScents/kWh. Table 7 shows the world’s direct use of geothermal energy in the year 1999.
Table 7. Direct use of Geothermal Energy Country Installed Production Capacity MWt GWh/a Factor China 2282 10531 0.53 Japan 1167 7482 0.73 USA 3766 5640 0.17
9

Iceland 1469 5603 0.44 Turkey 820 4377 0.61 New Zealand 308 1967 0.73 Georgia 250 1752 0.8 Russia 308 1707 0.63 France 326 1360 0.48 Sweden 377 1147 0.35 Hungary 473 1135 0.27 Mexico 164 1089 0.76 Italy 326 1048 0.37 Romania 152 797 0.60 India 80 699 1.00 Switzerland 547 663 0.14 Serbia 80 660 0.94 Slovak Republic 132 588 0.51 other countries 2118 4731 0.25 Total 15145 52976 0.40 from Lund and Freeston, 2001 [4] The large variation in the capacity factors in Table 7 is due to the different utilization mode of the direct use of geothermal energy. In the USA and Switzerland, ground coupled heat pumps are the main sources of geothermal energy and the capacity factors for those countries are relatively low. Where geothermal energy is used for heating purposes in a moderate climate, the capacity factors are frequently in the range 0.4-0.7. The high capacity factors reported for India and Serbia might not be realistic. In addition to the volcanic zones of the Earth, where the geothermal resources are most obvious, a large amount of hot water is presently pumped from aquifers in deep sediments (China, Hungary, Germany). These geothermal resources have frequently been discovered as a result of prospecting for oil and gas. Figure 6 shows a typical setup for this kind of geothermal exploitation. Auxiliary heating equipment is frequently installed to serve as peak load at the coldest days of the year.
10

Figure 6. Use of Geothermal Energy in Neustadt-Cleve in Germany. In areas where deep water bearing formations can not be found, the heat of the Earth can be extracted by shallow ground source heat pumps. It is estimated that some 100,000 such heat pumps are now in use in Northern Europe and some 400,000 in USA. The total capacity of heat pumps in Europe and USA is close to 6000 MW of heat.
11

From Lund 2001 [5] Figure 7. Geothermal Heat Pumps: Ground Coupled Closed Loop Types. Figures 7 and 8 show the two basic modes of ground source heat pumps. Heat is extracted from the ground either by closed loops (Figure 7) or by open loops (Figure 8). The use of ground source heat pumps would be especially economical in countries where most of the heating is by electricity. With the installment of geothermal heat pumps, each homeowner could reduce the electricity bill considerably (most likely by a factor of two or three).
From Lund 2001[5] Figure 8. Geothermal Heat Pumps: Ground Coupled Open Loop Types.
Direct use of geothermal energy in the countries in Northern Europe and America is expected to increase markedly in the near future. It should be noted that this form of energy use is of considerable importance in many countries, and that there are favorable conditions to increase the direct use of geothermal energy in all countries in these regions. World Energy Resources In dealing with the availability of energy resources, a clear distinction has to be made between the renewable energy sources and the finite energy sources. The finite sources, fossil fuels and nuclear, are fixed amounts of energy stored in the Earth’s crust, whereas the
12
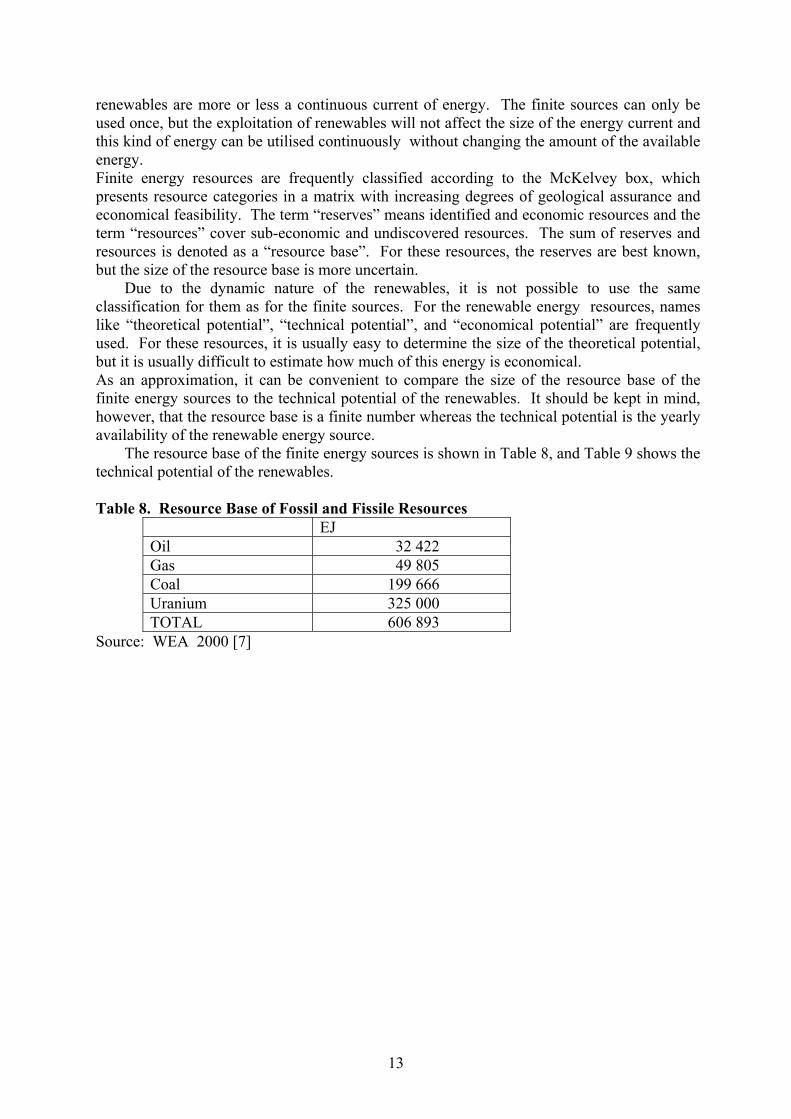
renewables are more or less a continuous current of energy. The finite sources can only be used once, but the exploitation of renewables will not affect the size of the energy current and this kind of energy can be utilised continuously without changing the amount of the available energy. Finite energy resources are frequently classified according to the McKelvey box, which presents resource categories in a matrix with increasing degrees of geological assurance and economical feasibility. The term “reserves” means identified and economic resources and the term “resources” cover sub-economic and undiscovered resources. The sum of reserves and resources is denoted as a “resource base”. For these resources, the reserves are best known, but the size of the resource base is more uncertain. Due to the dynamic nature of the renewables, it is not possible to use the same classification for them as for the finite sources. For the renewable energy resources, names like “theoretical potential”, “technical potential”, and “economical potential” are frequently used. For these resources, it is usually easy to determine the size of the theoretical potential, but it is usually difficult to estimate how much of this energy is economical. As an approximation, it can be convenient to compare the size of the resource base of the finite energy sources to the technical potential of the renewables. It should be kept in mind, however, that the resource base is a finite number whereas the technical potential is the yearly availability of the renewable energy source. The resource base of the finite energy sources is shown in Table 8, and Table 9 shows the technical potential of the renewables. Table 8. Resource Base of Fossil and Fissile Resources
EJ Oil 32 422 Gas 49 805 Coal 199 666 Uranium 325 000 TOTAL 606 893
Source: WEA 2000 [7]
13

Figure 9. The Resource Base for Fossil and Fissile Energy Resources. Table 9. Technical Potential of Renewable Energy Sources
EJ PER YEAR Hydropower 50 Biomass 276 Solar energy 1575 Wind energy 640 Geothermal energy 5000 TOTAL 7600
Source: WEA 2000 [7]
14
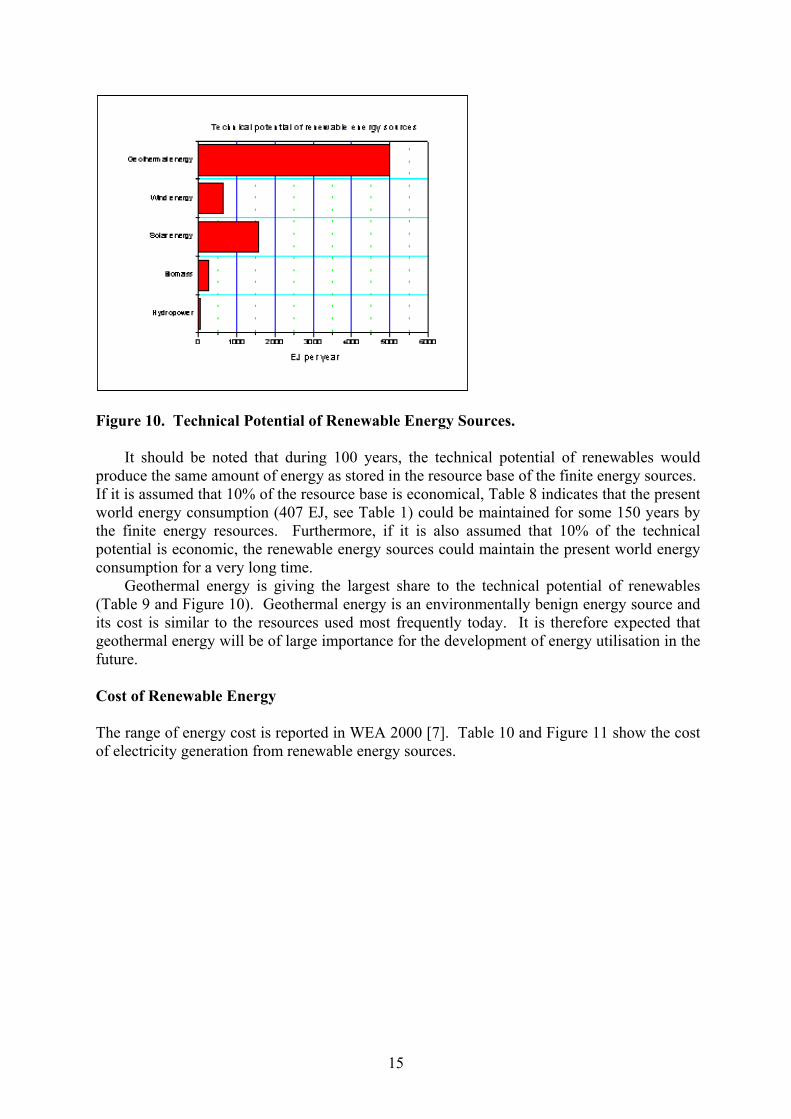
Figure 10. Technical Potential of Renewable Energy Sources.
It should be noted that during 100 years, the technical potential of renewables would produce the same amount of energy as stored in the resource base of the finite energy sources. If it is assumed that 10% of the resource base is economical, Table 8 indicates that the present world energy consumption (407 EJ, see Table 1) could be maintained for some 150 years by the finite energy resources. Furthermore, if it is also assumed that 10% of the technical potential is economic, the renewable energy sources could maintain the present world energy consumption for a very long time. Geothermal energy is giving the largest share to the technical potential of renewables (Table 9 and Figure 10). Geothermal energy is an environmentally benign energy source and its cost is similar to the resources used most frequently today. It is therefore expected that geothermal energy will be of large importance for the development of energy utilisation in the future. Cost of Renewable Energy The range of energy cost is reported in WEA 2000 [7]. Table 10 and Figure 11 show the cost of electricity generation from renewable energy sources.
15

Table 10. Current Installment Cost and the Cost of Electricity Generation Installment Cost
USD/kW Energy Cost US cent/kWh
Biomass 900 – 3 000 5 – 15 Solar photovoltaic 5000 – 10 000 25 - 125 Solar thermal 3 000 – 4 000 12 – 18 Hydro 1000 – 3 500 2 – 10 Geothermal 800 – 3 000 2 – 10 Wind 1100 - 1700 5 – 13 Tidal 1700 - 2500 8 – 15 Source: WEA 2000 [7] The installment cost and the energy cost for the generation of heat is shown in Table 11 and the energy cost for heat from renewable energy sources is presented in Figure 12. Table 11. Current Installment Cost and Energy Cost for Heat Generation Installment Cost
USD/kW Energy Cost UScent/kWh
Biomass 250 – 750 1 – 5 Solar heat 500 - 1700 3 - 20 Geothermal 200 - 2000 0.5 – 5 Source: WEA 2000 [7] Tables 10 and 11 and Figures 11 and 12 show clearly that the price of geothermal energy is favorable as compared to other energy sources, both renewable and finite energy sources. Conclusions • The share of renewable energy sources in the world energy consumption is small, and apart from traditional biomass (fuel wood) and hydro, the present contribution of renewables is almost negligible. • Estimated availability of energy resources in the world is large and energy shortage is not expected in the near future. • It is desirable to replace the use of finite energy resources with the use of renewable energy sources. • Iceland has demonstrated that it is not only possible but also very economical to use hydro and geothermal energy instead of fossil fuels. • Geothermal energy contributes a substantial part to the electricity generation in some countries. • The availability of geothermal energy is much higher than for other renewable energy sources. • Direct use of geothermal energy can be applied in every country of the world. • Geothermal energy seems to have the largest technical potential compared to other renewable energy sources. • The cost of geothermal energy is favorable compared to other energy sources. Acknowledgements
16
The author thanks Hjalti Franzson for reviewing the manuscript and suggesting improvements in the presentation. References [1] Bruntland, Gro Harlem, Chairman of the World Commission on Environment and Development, 1987: Our Common Future, Oxford University Press, Oxford, 400 p. [2] IEA 2001: Key World Energy Statistics from the IEA. 2001 Edition. [3] Huttrer, G.W., 2001: The status of world geothermal power generation 1995-2000. Geothermics, Vol. 30, no.1, pp. 1-27. [4] Lund, J.W. and Freeston, D.H., 2001: World-wide direct uses of geothermal energy 2000. Geothermics, Vol. 30, no.1, pp. 29-68. [5] Lund J.W., 2001: Geothermal heat pumps – An overview. GHC Bulletin, March 2001, pp. 1-2. [6] WEC 1998: Survey of Energy Resources 1998. 18th Edition, World Energy Council. [7] WEA 2000: World energy assessment: energy and the challenge of sustainability. Ed. by J. Goldemberg. United Nation Development Programme, United Nations Department of Economic and Social Affairs, World Energy Council, 2000, 508 pages. Valgardur Stefansson received a Fil.Dr. Degree in nuclear physics from the University of Stockholm, Sweden, in 1973. He joined Orkustofnun in Iceland in 1973. In the beginning he served as geophysicist in geothermal prospecting, but from 1975 he started to build up the geothermal logging and reservoir-engineering unit within Orkustofnun. He was the head of the geothermal logging unit 1975-1985 and served simultaneously as Deputy Director of the Geothermal Division of Orkustofnun 1979-1985. During 1985 – 1990, Stefansson served as Interregional Advisor on Geothermal Energy at the Department of Technical Co-operation for Development at the United Nations in New York. He returned to Orkustofnun in 1990 where he has been the head of the Geothermal Reservoir Group (1990-1996) and the Chief Project Manager since 1996. Stefansson has served as Geothermal Advisor in 21 countries outside Iceland. He has published more than 90 scientific papers in international journals.
17
(2) GEOTHERMAL POWER PRODUCTION IN ICELAND Arni Gunnarsson, The National Power Company of Iceland
Iceland’s Unique Position.
Iceland is situated on the mid Atlantic ridge that stretches from the south of the Atlantic to the north. The lows coming from Labrador in Canada on their way over Iceland and on towards the European continent draw water from the Atlantic Ocean, bring it to Iceland and drop a lot of it on the country. The middle interior of Iceland is uninhabited and consists mostly of barren mountainous plateau and glaciers with very economical hydro and reservoir sites.
The ridge forms the boundary between the American plate and the Eurasian plate. The plates are drifting apart approximately 2 cm every year. This movement results in volcanic activity where magma is intermittently oozing out as well as earthquakes. This situation represents the greatest power resource in Iceland with tremendous amounts of geothermal energy.
ICELAND’S PRIMARY POWER CONSUMPTION
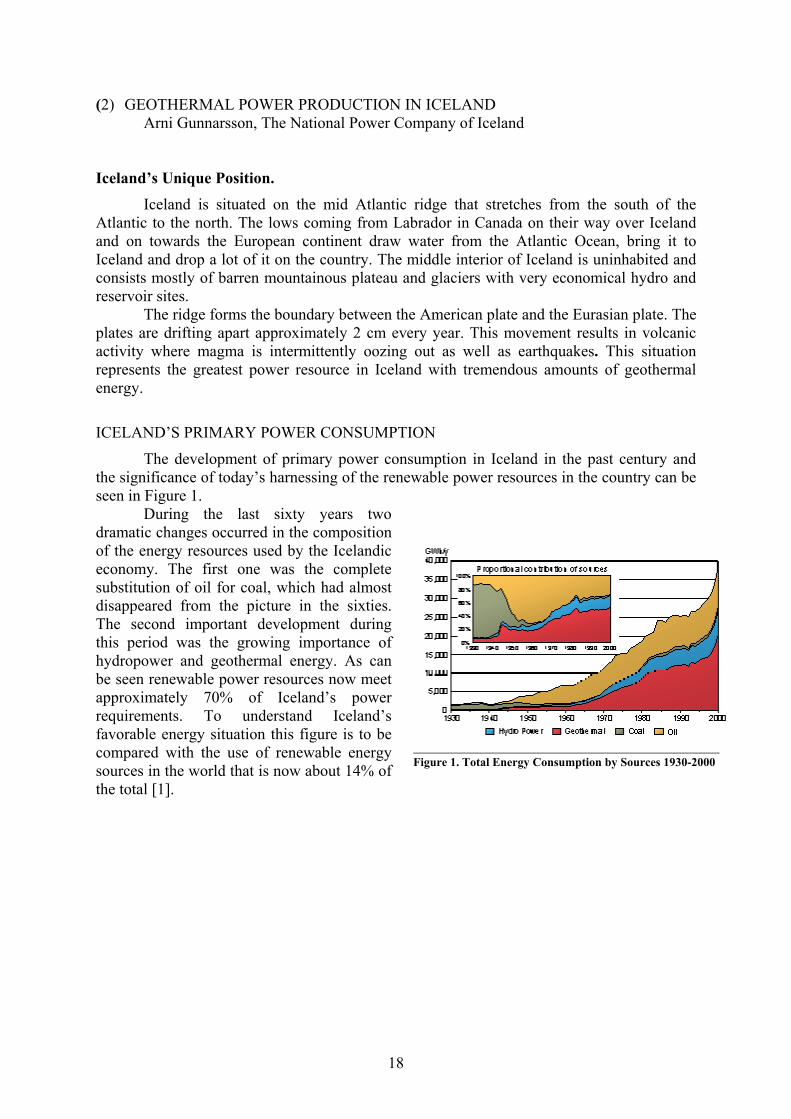
The development of primary power consumption in Iceland in the past century and the significance of today’s harnessing of the renewable power resources in the country can be seen in Figure 1.
During the last sixty years two dramatic changes occurred in the composition of the energy resources used by the Icelandic economy. The first one was the complete substitution of oil for coal, which had almost disappeared from the picture in the sixties. The second important development during this period was the growing importance of hydropower and geothermal energy. As can be seen renewable power resources now meet approximately 70% of Iceland’s power requirements. To understand Iceland’s favorable energy situation this figure is to be compared with the use of renewable energy sources in the world that is now about 14% of the total [1].
Figure 1. Total Energy Consumption by Sources 1930-2000
18

Figure 2 summarizes the current situation of the consumption of primary energy in Iceland. 49% comes from geothermal sources, 18% from hydropower and the rest 33% from oil, mainly used by the transport sector and the fishing fleet and coal, used in the industrial smelters.
Real initiatives have already been taken in Iceland to investigate the feasibility for eventually replacing the use of fossil fuels in Iceland with "hydrogen based fuels" and create the world’s first hydrogen economy.
Figure 2. Total Primary Energy Consumption 2001
Figure 3 shows the estimated electrical power production potential, based on current economical and environmental constraints, and its current utilization. The total power potential is estimated to be 50 TWh/year (50,000,000 MWh/year), thereof 30 TWh/year come from hydropower and 20 TWh/year from the geothermal resources [2]. This is not much weighted on the world's scale, but considering the size of the Icelandic population of 280,000 this represents a great potential on per capita basis.
Figure 3. Electrical Power Potential and Utilisation 2001 Today the public market utilizes only 35% of the produced electricity; the remainder goes to the power intensive industry. It can also be seen that only 17% of the total power potential is utilized, thereof only 8% of the geothermal potential and 23% of the hydropower. This leads one to reflect on what possibilities the future will hold in store for Iceland.
Production of Electricity in Iceland
Figure 4. Electricity Production 1970-2001
The development of electricity production in Iceland over the last 30 years is shown in Figure 4. During the last three decades the annual increase has been about 16% per year, rising from the level of 1.6 TWh/year in 1970 to 8.5 TWh/year in 2001.
Iceland is a highly electrified country. Practically 100% of the population has access to electricity. Total gross consumption of electricity has now climbed to approximately 28 MWh per capita, hence Iceland ranks first in the world with Norway close in the second place, see Figure 5 [2].
19
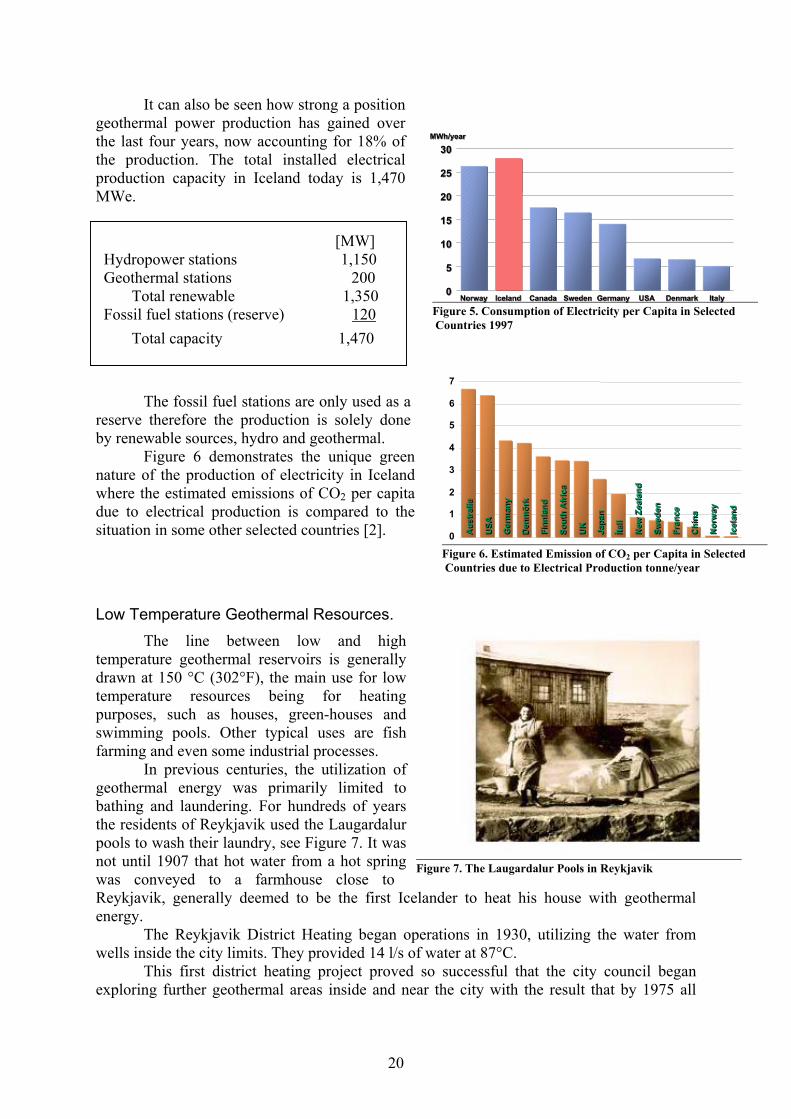
It can also be seen how strong a position geothermal power production has gained over the last four years, now accounting for 18% of the production. The total installed electrical production capacity in Iceland today is 1,470 MWe.
0
1
2
3
4
5
6
7
Aus
tralia
Aus
tralia
USAUSA
Ger
man
yG
erm
any
Den
mör
kD
enm
örk
Finn
land
Finn
land
Sout
h A
fric
aSo
uth
Afr
ica
UKUK
Japa
nJa
pan
Ítali
Ítali
New
Zea
land
New
Zea
land
Swed
enSw
eden
Fran
ceFr
ance
Chi
naC
hina
Nor
way
Nor
way
Icel
and
Icel
and
MWh/yearMWhMWh/year/year
NorwayNorwayNorway IcelandIcelandIceland CanadaCanadaCanada SwedenSwedenSweden GermanyGermanyGermany USAUSAUSA DenmarkDenmarkDenmark ItalyItalyItaly000
555
101010
151515
202020
252525
303030
[MW] Hydropower stations 1,150 Geothermal stations 200 Total renewable 1,350
Figure 7. The Laugardalur Pools in Reykjavik
Figure 6. Estimated Emission of CO2 per Capita in Selected Countries due to Electrical Production tonne/year
Figure 5. Consumption of Electricity per Capita in Selected Countries 1997
Fossil fuel stations (reserve) 120 Total capacity 1,470
The fossil fuel stations are only used as a reserve therefore the production is solely done by renewable sources, hydro and geothermal.
Figure 6 demonstrates the unique green nature of the production of electricity in Iceland where the estimated emissions of CO2 per capita due to electrical production is compared to the situation in some other selected countries [2].
Low Temperature Geothermal Resources.
The line between low and high temperature geothermal reservoirs is generally drawn at 150 °C (302°F), the main use for low temperature resources being for heating purposes, such as houses, green-houses and swimming pools. Other typical uses are fish farming and even some industrial processes.
In previous centuries, the utilization of geothermal energy was primarily limited to bathing and laundering. For hundreds of years the residents of Reykjavik used the Laugardalur pools to wash their laundry, see Figure 7. It was not until 1907 that hot water from a hot spring was conveyed to a farmhouse close to Reykjavik, generally deemed to be the first Icelander to heat his house with geothermal energy.
The Reykjavik District Heating began operations in 1930, utilizing the water from wells inside the city limits. They provided 14 l/s of water at 87°C.
This first district heating project proved so successful that the city council began exploring further geothermal areas inside and near the city with the result that by 1975 all
20
houses in the area of the capital were heated with geothermal energy comprising more than half the nation's population of 280,000 inhabitants or approximately 26,000 houses.
Figure 8. Sources of Energy for Spacing Heating
Other communities in Iceland, having access to geothermal reservoirs, followed closely the development in Reykjavik.
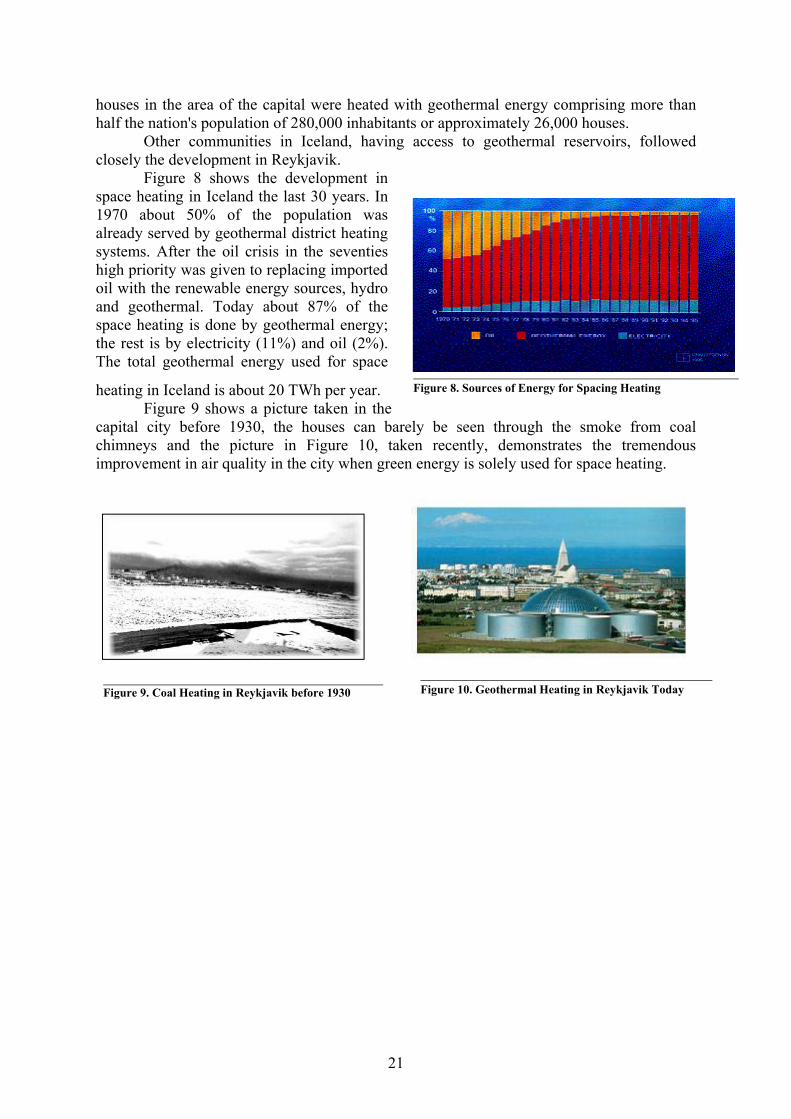
Figure 8 shows the development in space heating in Iceland the last 30 years. In 1970 about 50% of the population was already served by geothermal district heating systems. After the oil crisis in the seventies high priority was given to replacing imported oil with the renewable energy sources, hydro and geothermal. Today about 87% of the space heating is done by geothermal energy; the rest is by electricity (11%) and oil (2%). The total geothermal energy used for space
heating in Iceland is about 20 TWh per year. Figure 9 shows a picture taken in the
capital city before 1930, the houses can barely be seen through the smoke from coal chimneys and the picture in Figure 10, taken recently, demonstrates the tremendous improvement in air quality in the city when green energy is solely used for space heating.
Figure 10. Geothermal Heating in Reykjavik Today Figure 9. Coal Heating in Reykjavik before 1930
21

High Temperature Geothermal Resources
Figure 11 shows how the active volcanic zone stretches from the Reykjanes peninsula in the southwest to the northeast coast of Iceland on which its high temperature geothermal resources are located. Altogether, 18 geothermal high temperature reservoirs have been identified, indicated with red dots, with an estimated electrical production capacity of 2500 MWe, or approximately 20 TWh/year, based on current economical and environmental constraints. Many believe that this is a conservative estimate.
The exploration of high-temperature fields in Iceland has mainly been for the purposes of electrical generation and for district heating systems in CHP plants.
Figure 11. Geology and High Temperature Geothermal Resources of Iceland
Today four high temperature fields are utilized:
• Krafla geothermal power station 60 MWe. • Bjarnaflag power station 3 MWe. • Svartsengi CHP station 45 MWe, 150 MWt. • Nesjavellir CHP 90 MWe, 200 MWt.
Currently three new reservoirs are in the early stage of test drilling.
Harnessing the high-temperature fields requires great care and technical complexity, as may be understood from the following typical reservoir characteristics:
• Temperature: 200 – 350 °C. • Static wellhead pressure: 30 – 90 bar. • Mixed flow of steam and water. • Reservoir depth: 1,000 – 2,500 m. • Directional drilling is used successfully.
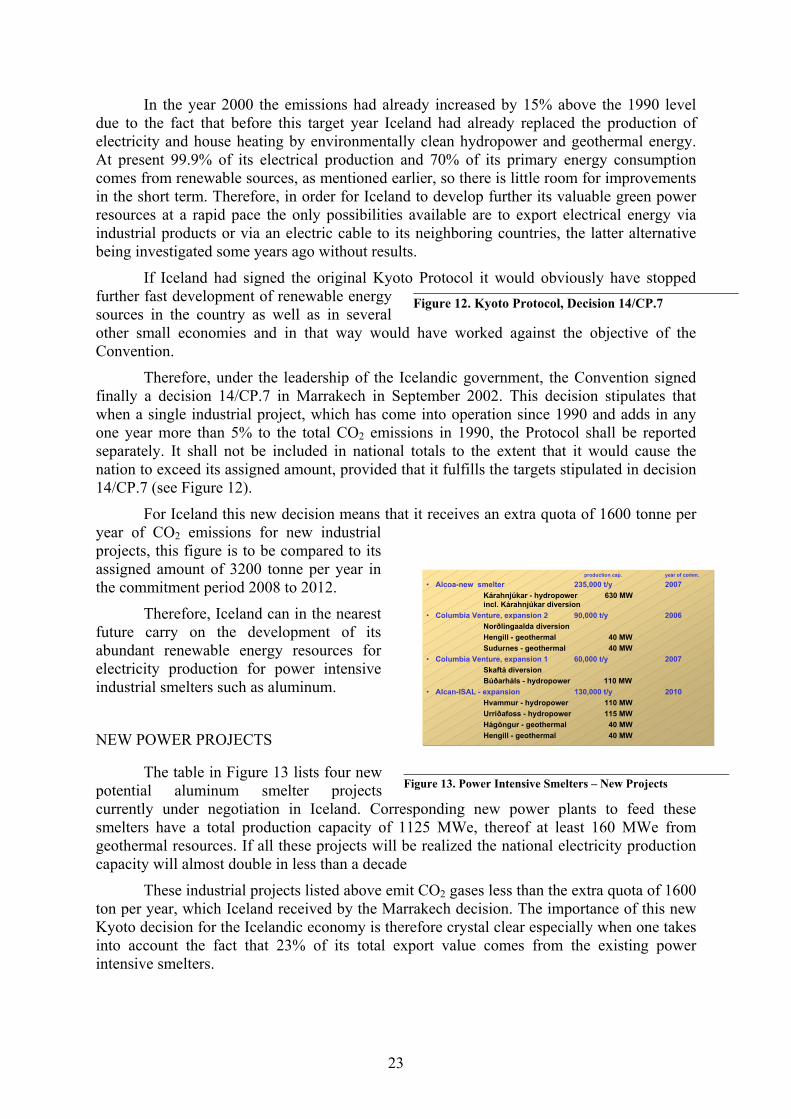
Valid for small economies when a single industrial project addsmore than 5% to its total CO2 emission in 1990.
These emissions shall not be included in national totals,provided that:
• The total CO2 emission of the nation were less than0.05% of the world’s total CO2 emission in 1990;
• Renewable energy is used, resulting in a reduce ingreenhouse gas emission per unit of production;
• Best environmental practice is followed and bestavailable technology is used to minimise processemissions;
A typical cost example for a 2,000 m deep high-temperature geothermal well is approximately US$1.5 million for a vertical well and US$2.5 million for a directional one. The production from the various wells differs a lot; a single good well can produce steam to generate up to 15 MWe of electricity.
THE KYOTO PROTOCOL
The Kyoto Protocol from 1997 stipulated originally that Iceland shall not increase its overall emission of greenhouse gases by more than 10% above 1990 level in the commitment period 2008-2012.
22
In the year 2000 the emissions had already increased by 15% above the 1990 level due to the fact that before this target year Iceland had already replaced the production of electricity and house heating by environmentally clean hydropower and geothermal energy. At present 99.9% of its electrical production and 70% of its primary energy consumption comes from renewable sources, as mentioned earlier, so there is little room for improvements in the short term. Therefore, in order for Iceland to develop further its valuable green power resources at a rapid pace the only possibilities available are to export electrical energy via industrial products or via an electric cable to its neighboring countries, the latter alternative being investigated some years ago without results.
Figure 12. Kyoto Protocol, Decision 14/CP.7
If Iceland had signed the original Kyoto Protocol it would obviously have stopped further fast development of renewable energy sources in the country as well as in several other small economies and in that way would have worked against the objective of the Convention.
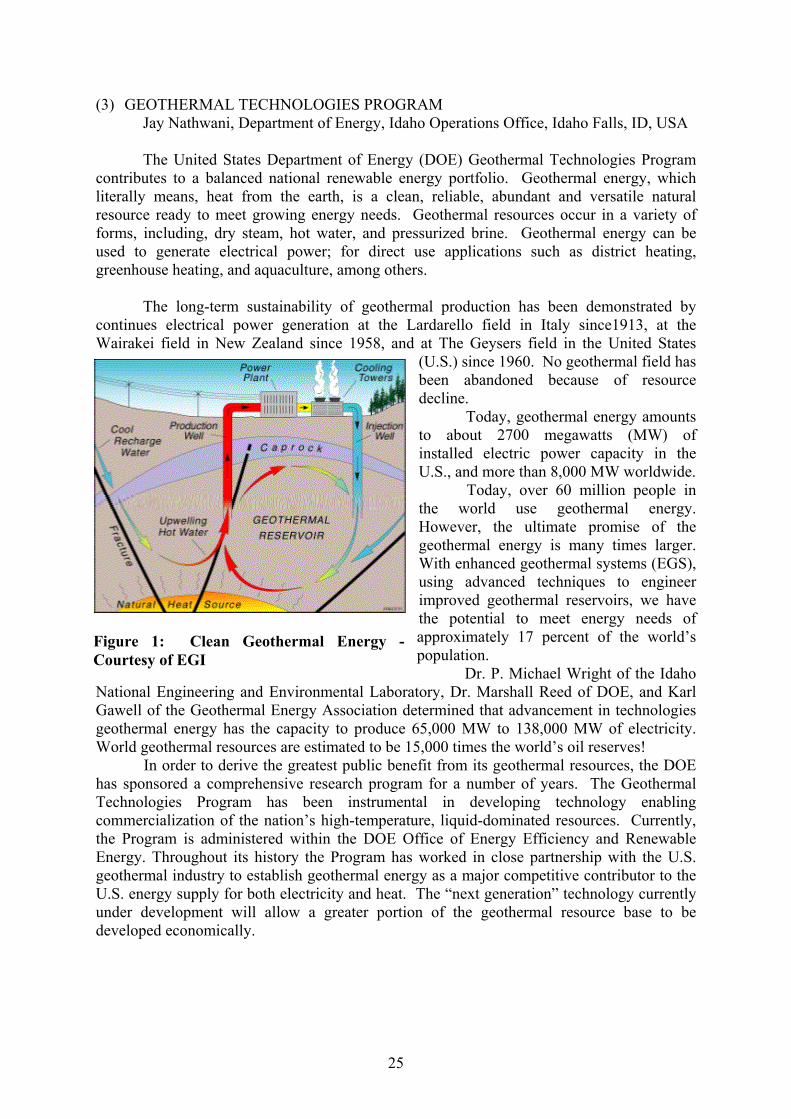
production cap. year of comm.
• Alcoa-new smelter 235,000 t/y 2007Kárahnjúkar - hydropower 630 MWincl. Kárahnjúkar diversion
• Columbia Venture, expansion 2 90,000 t/y 2006Norðlingaalda diversion Hengill - geothermal 40 MWSudurnes - geothermal 40 MW
• Columbia Venture, expansion 1 60,000 t/y 2007 Skaftá diversion
Búðarháls - hydropower 110 MW• Alcan-ISAL - expansion 130,000 t/y 2010
Hvammur - hydropower 110 MWUrriðafoss - hydropower 115 MWHágöngur - geothermal 40 MW
Hengill - geothermal 40 MW
Therefore, under the leadership of the Icelandic government, the Convention signed finally a decision 14/CP.7 in Marrakech in September 2002. This decision stipulates that when a single industrial project, which has come into operation since 1990 and adds in any one year more than 5% to the total CO2 emissions in 1990, the Protocol shall be reported separately. It shall not be included in national totals to the extent that it would cause the nation to exceed its assigned amount, provided that it fulfills the targets stipulated in decision 14/CP.7 (see Figure 12).
For Iceland this new decision means that it receives an extra quota of 1600 tonne per year of CO2 emissions for new industrial projects, this figure is to be compared to its assigned amount of 3200 tonne per year in the commitment period 2008 to 2012.
Therefore, Iceland can in the nearest future carry on the development of its abundant renewable energy resources for electricity production for power intensive industrial smelters such as aluminum.
NEW POWER PROJECTS
Figure 13.The table in Figure 13 lists four new
potential aluminum smelter projects currently under negotiation in Iceland. Corresponding new power plants to feed these smelters have a total production capacity of 1125 MWe, thereof at least 160 MWe from geothermal resources. If all these projects will be realized the national electricity production capacity will almost double in less than a decade
Power Intensive Smelters – New Projects
These industrial projects listed above emit CO2 gases less than the extra quota of 1600 ton per year, which Iceland received by the Marrakech decision. The importance of this new Kyoto decision for the Icelandic economy is therefore crystal clear especially when one takes into account the fact that 23% of its total export value comes from the existing power intensive smelters.
23

Iceland's clean and renewable energy resources allow ample room for expansion in the future that can help in reducing pollution and the greenhouse effect on the earth's atmosphere. That is surely our common purpose.
Geothermal Know-How and Experience. In conclusion, Iceland has something to teach the rest of the world in geothermal
utilization.
The Geothermal Training Programme of the United Nations University (UNU) has operated in Iceland since 1979 with six months annual courses for professionals from developing countries. The aim of the programme is to assist developing countries with significant geothermal potential to build up groups of specialists that cover most aspects of geothermal exploration and development. From the beginning a total number of 227 scientists and engineers from 35 countries have completed the six-month courses.
References [1] IEA 2001: Key World Energy Statistics from the IEA, 2001 Edition.
[2] Mariusson, J.M. 2001, Iceland’s Power Potential, Landsvirkjun.
Arni Gunnarsson has served as the geothermal project manager for the National Power Company in Iceland from the beginning of 2002. He served as a chief engineer for more than 11 years for the Reykjavik Municipal District Heating Services, the biggest operator of geothermal power and heat production in Iceland (90 MWe, 900 MWt). For the last 10 years he has worked as a private consultant engineer. Founder and owner of the Icelandic Geothermal Engineering Ltd., a geothermal engineering and contracting company, the Companies key success has been deep well line-shaft pump design and installations, mainly for export. He holds a B.Sc. in Mechanical Engineering from the University of Iceland, a M.Sc. in Mechanical Engineering from the Royal Institute of Technology (KTH), Stockholm, Sweden; and a B.Sc. in Business Administration from the Handelshögskolan in Stockholm.
24
(3) GEOTHERMAL TECHNOLOGIES PROGRAM Jay Nathwani, Department of Energy, Idaho Operations Office, Idaho Falls, ID, USA
The United States Department of Energy (DOE) Geothermal Technologies Program
contributes to a balanced national renewable energy portfolio. Geothermal energy, which literally means, heat from the earth, is a clean, reliable, abundant and versatile natural resource ready to meet growing energy needs. Geothermal resources occur in a variety of forms, including, dry steam, hot water, and pressurized brine. Geothermal energy can be used to generate electrical power; for direct use applications such as district heating, greenhouse heating, and aquaculture, among others.
The long-term sustainability of geothermal production has been demonstrated by continues electrical power generation at the Lardarello field in Italy since1913, at the Wairakei field in New Zealand since 1958, and at The Geysers field in the United States
(U.S.) since 1960. No geothermal field has been abandoned because of resource decline.
Today, geothermal energy amounts to about 2700 megawatts (MW) of installed electric power capacity in the U.S., and more than 8,000 MW worldwide.
Today, over 60 million people in the w
d’s opula
National Engineering and Environmental Labora
order to derive the greatest public benefit from its geothermal resources, the DOE has spo
orld use geothermal energy. However, the ultimate promise of the geothermal energy is many times larger. With enhanced geothermal systems (EGS), using advanced techniques to engineer improved geothermal reservoirs, we have the potential to meet energy needs of approximately 17 percent of the worlFigure 1: Clean Geothermal Energy - pCourtesy of EGI tion.
Dr. P. Michael Wright of the Idaho tory, Dr. Marshall Reed of DOE, and Karl
Gawell of the Geothermal Energy Association determined that advancement in technologies geothermal energy has the capacity to produce 65,000 MW to 138,000 MW of electricity. World geothermal resources are estimated to be 15,000 times the world’s oil reserves!
In nsored a comprehensive research program for a number of years. The Geothermal
Technologies Program has been instrumental in developing technology enabling commercialization of the nation’s high-temperature, liquid-dominated resources. Currently, the Program is administered within the DOE Office of Energy Efficiency and Renewable Energy. Throughout its history the Program has worked in close partnership with the U.S. geothermal industry to establish geothermal energy as a major competitive contributor to the U.S. energy supply for both electricity and heat. The “next generation” technology currently under development will allow a greater portion of the geothermal resource base to be developed economically.
25
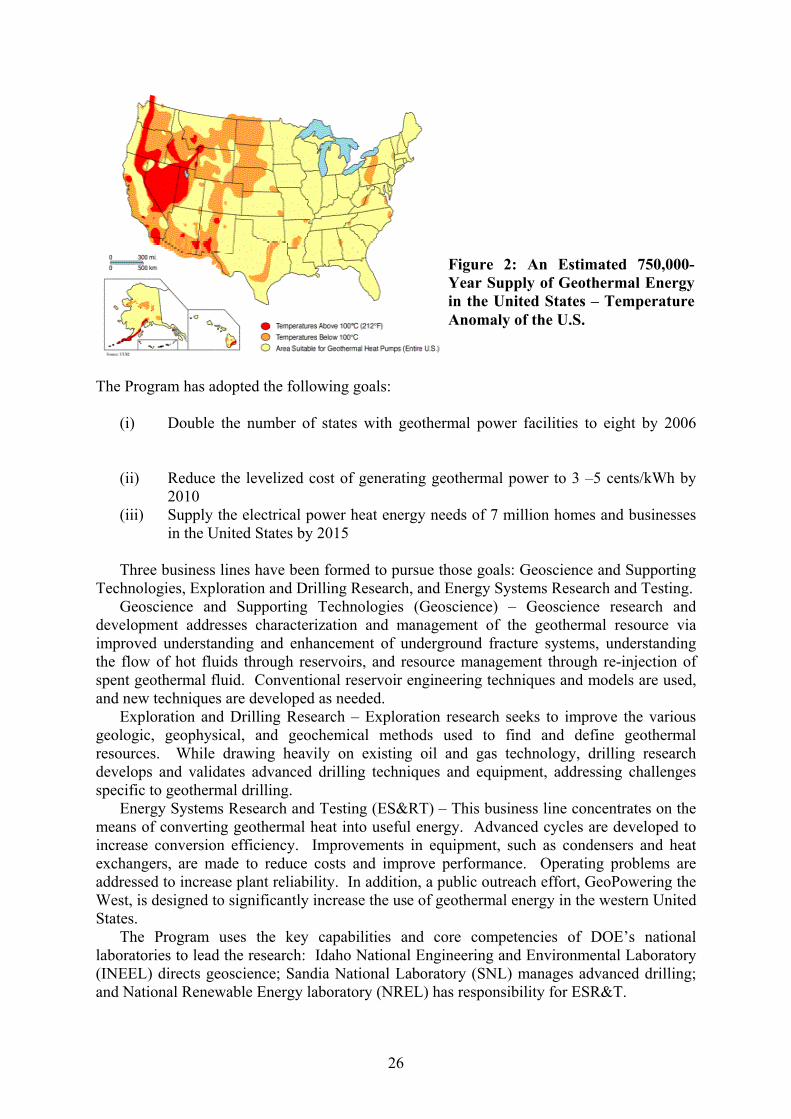
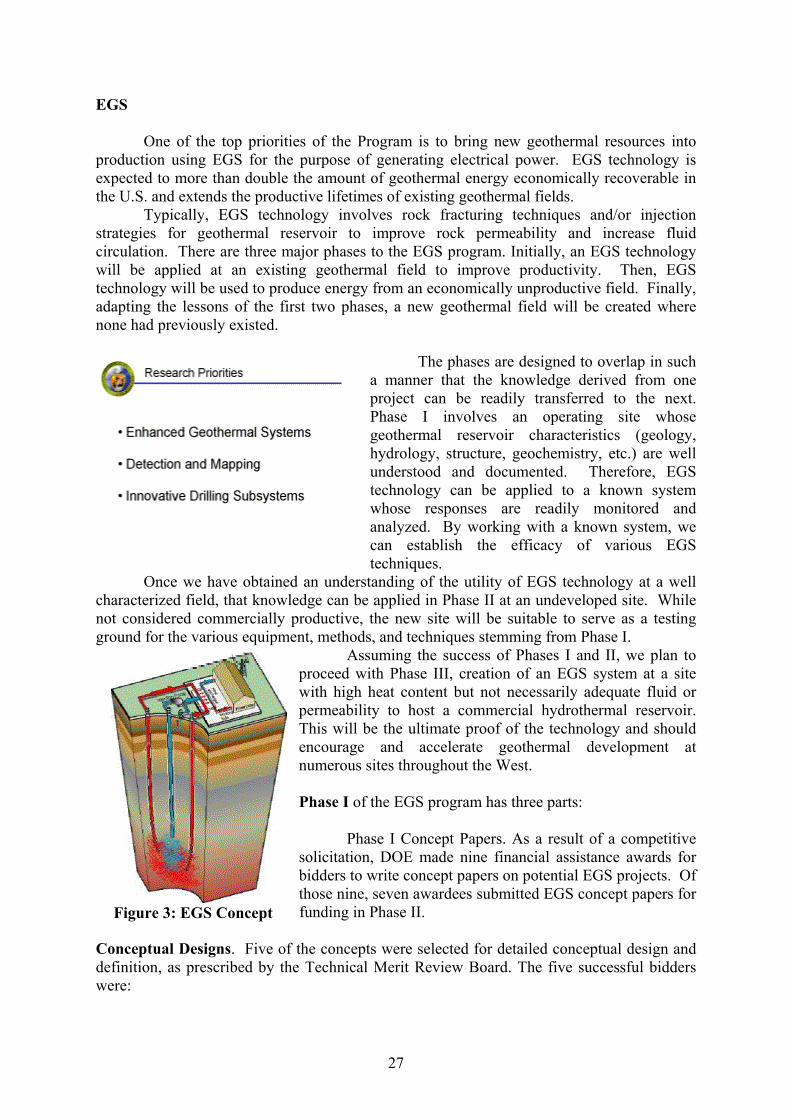
Figure 2: An Estimated 750,000-Year Supply of Geothermal Energy in the United States – Temperature Anomaly of the U.S.
The Program has adopted the following goals:
(i) Double the number of states with geothermal power facilities to eight by 2006
(ii) Reduce the levelized cost of generating geothermal power to 3 –5 cents/kWh by 2010
(iii) Supply the electrical power heat energy needs of 7 million homes and businesses in the United States by 2015
Three business lines have been formed to pursue those goals: Geoscience and Supporting
Technologies, Exploration and Drilling Research, and Energy Systems Research and Testing. Geoscience and Supporting Technologies (Geoscience) – Geoscience research and
development addresses characterization and management of the geothermal resource via improved understanding and enhancement of underground fracture systems, understanding the flow of hot fluids through reservoirs, and resource management through re-injection of spent geothermal fluid. Conventional reservoir engineering techniques and models are used, and new techniques are developed as needed.
Exploration and Drilling Research – Exploration research seeks to improve the various geologic, geophysical, and geochemical methods used to find and define geothermal resources. While drawing heavily on existing oil and gas technology, drilling research develops and validates advanced drilling techniques and equipment, addressing challenges specific to geothermal drilling.
Energy Systems Research and Testing (ES&RT) – This business line concentrates on the means of converting geothermal heat into useful energy. Advanced cycles are developed to increase conversion efficiency. Improvements in equipment, such as condensers and heat exchangers, are made to reduce costs and improve performance. Operating problems are addressed to increase plant reliability. In addition, a public outreach effort, GeoPowering the West, is designed to significantly increase the use of geothermal energy in the western United States.
The Program uses the key capabilities and core competencies of DOE’s national laboratories to lead the research: Idaho National Engineering and Environmental Laboratory (INEEL) directs geoscience; Sandia National Laboratory (SNL) manages advanced drilling; and National Renewable Energy laboratory (NREL) has responsibility for ESR&T.
26
EGS
One of the top priorities of the Program is to bring new geothermal resources into production using EGS for the purpose of generating electrical power. EGS technology is expected to more than double the amount of geothermal energy economically recoverable in the U.S. and extends the productive lifetimes of existing geothermal fields.
Typically, EGS technology involves rock fracturing techniques and/or injection strategies for geothermal reservoir to improve rock permeability and increase fluid circulation. There are three major phases to the EGS program. Initially, an EGS technology will be applied at an existing geothermal field to improve productivity. Then, EGS technology will be used to produce energy from an economically unproductive field. Finally, adapting the lessons of the first two phases, a new geothermal field will be created where none had previously existed.
The phases are designed to overlap in such
a manner that the knowledge derived from one project can be readily transferred to the next. Phase I involves an operating site whose geothermal reservoir characteristics (geology, hydrology, structure, geochemistry, etc.) are well understood and documented. Therefore, EGS technology can be applied to a known system whose responses are readily monitored and analyzed. By working with a known system, we can establish the efficacy of various EGS techniques.
Once we have obtained an understanding of the utility of EGS technology at a well characterized field, that knowledge can be applied in Phase II at an undeveloped site. While not considered commercially productive, the new site will be suitable to serve as a testing ground for the various equipment, methods, and techniques stemming from Phase I.
Assuming the success of Phases I and II, we plan to proceed with Phase III, creation of an EGS system at a site with high heat content but not necessarily adequate fluid or permeability to host a commercial hydrothermal reservoir. This will be the ultimate proof of the technology and should encourage and accelerate geothermal development at numerous sites throughout the West.
Figure 3: EGS Concept
Phase I of the EGS program has three parts:
Phase I Concept Papers. As a result of a competitive solicitation, DOE made nine financial assistance awards for bidders to write concept papers on potential EGS projects. Of those nine, seven awardees submitted EGS concept papers for funding in Phase II.
Conceptual Designs. Five of the concepts were selected for detailed conceptual design and definition, as prescribed by the Technical Merit Review Board. The five successful bidders were:
27

1. University of Utah’s Energy and Geoscience Institute (EGI), Utah; 2. DOSECC, Utah; 3. Maurer Engineering, Inc., Texas; 4. Americulture, Inc., New Mexico; and 5. Lightning Dock Geothermal, Inc., New Mexico.
After further consideration of the conceptual designs as submitted by the five candidates,
the Technical Merit Review Board recommended the design by EGI. The selection of EGI for a follow-on award was announced in a press release on April 29, 2002. DOE will provide approximately $4.5 million over the next five years to support the $12 million effort to increase energy production in the Coso geothermal field, located about 25 miles north of
Ridgecrest, California, on the China Lake Naval Air Weapons Station.
EGI proposed the “Creation of an Enhanced Geothermal System through Hydraulic and Thermal Stimulation” at Coso with the field’s operator, Coso Operating Company (COC) as an industrial partner.
EGI will test EGS technology, involving both injection and production wells, on the perimeter of the Coso field. Investigators will collect
and evaluate geochemical, geophysical, geomechanical, petrophysical, and borehole-image data to first select and then hydraulically stimulate an injection well. Concurrently, models
will be developed to predict the response of the selected well to the stimulation. These models will be revised during the project as
information is generated on the well’s response to the stimulation and testing. A production well will be designed, drilled, and, if necessary, also hydraulically stimulated. A circulation test will be conducted, which will incorporate tracer testing to characterize the flow processes between the coupled wells. COC will provide EGI with the wells and infrastructure for field experiments, and will design the hydraulic stimulation tests. Other project participants include Geomechanics International, the Navy's Geothermal Program Office, the U.S. Geological Survey, Kansas State University, Halliburton, and Pinnacle Technologies.
Figure 4: Hydro-Fracturing Rock to Mine Heat using Doublet – Courtesy of EGI
DOE Secretary Spencer Abraham stated in the press release accompanying the award to EGI, “Developing and demonstrating this enhanced geothermal system technology advances the President’s National Energy Plan goals of deploying next generation technology and increasing renewable energy production on Federal lands. The new system is expected to add about 15 megawatts of electrical capacity – enough to power 11,250 homes – to the 270 megawatts now being generated at the site.” Phase II
The goal of Phase II of the EGS program is to produce electricity from a currently unproductive field. Geothermal resources developed under this Phase will be in areas of
28

known thermal potential, as determined by the drilling of wells or other means, but which have not produced economical amounts of geothermal energy. Sites proposed for EGS development must be hydrologically and geologically separate from established geothermal fields, generally more than five kilometers away from the nearest commercially productive well. The successful completion of Phase II will result into a new geothermal electrical plant.
On March 01, 2002, DOE issued a solicitation asking for proposals to conduct work under Phase II. Two successful proposals are as follows: Calpine, INC.
The EGS concept presented in this project is to further develop existing stimulation technology required to extract energy from the reduced permeability zones in geothermal reservoirs. Calpine will develop a combination of stimulation technologies that could be used to enhance presently non-commercial or marginally commercial geothermal reservoirs. Improving permeability would decrease the number of production and injection wells required for a given plant size. This in turn would lower the cost and the environmental impact of development, resulting in better economic benefits to power producers and consumers. ORMAT Nevada, Inc.
ORMAT will establish the feasibility of the EGS concept by developing an EGS system that will provide geothermal fluid to sustain the operation of a power plant, delivering commercial electricity to a utility or power consumer. Initially, the project relies upon proven technology for reservoir characterization, defining the conceptual hydrogeologic model of the Desert Peak EGS reservoir, preparing well designs, drilling plans, fracturing programs, resource testing programs, forecasts of heat extraction rates, as well as power plant designs, economic analyses, environmental, regulatory and mitigation plans, and a project implementation plan and budget. Then, ORMAT will demonstrate the feasibility of creating a fracture network to support the initial power plant, by drilling, logging, hydraulic fracturing and testing of the reservoir. And, finally they will construct and operate the facility employing EGS technology for commercial power generation. The Desert Peak East EGS Project if successful, will not only will present a blueprint for similar developments at many areas within the US Basin and Range province, but also will expand the potential for development of many such EGS resource areas worldwide. Phase III
DOE will initiate Phase III of the EGS program in FY 2005, after projects under the earlier phases are well underway. Detection and Mapping
Another program priority is Detection and Mapping. This priority is being met by three distinct initiatives as follows:
(i) Geothermal Resource Exploration and Definition (ii) Coordination with U.S. Geological Survey for resource assessment (iii) Exploration technology development
29

Detection and Mapping seeks to reduce the risks of development through an exploration research program and cost-shared exploration drilling. Exploration research is developing new tools to find geothermal resources, particularly development of exploration techniques that can locate resources not associated with surface manifestations such as thermal springs.
The GRED involves cooperative projects to find, evaluate, and define additional geothermal resources throughout the western United States. The ultimate goal is to aid in the development of geographically diverse resources and increase electrical power generation from those resources.
The United States Geological Survey (USGS) also conducts research in support of the DOE geoscience program. USGS research includes studies of heat flow, geochemistry of geothermal systems, and in-situ stress measurements in geothermal systems. In 2003, the USGS expects begin a new assessment of the geothermal resources contained in the Great Basin of the United States.
Innovative Drilling
The program’s third priority is an Innovative Drilling. Innovative drilling primarily addresses and innovative sub system, Diagnostics-while-Drilling (DWD), which incorporates electronic communication between the drilling platform and the drill bit. Other related drilling research includes following areas:
Hard-Rock drill bit technology development will yield an understanding of chatter dynamics that result in DEFINE (PDC) bit damage. DWD will be used to better understand and control downhole dynamics to avoid those damaging conditions. Lost-circulation control and high-
temperature instrumentation research likewise have important synergisms with DWD program. GeoPowering the West
DOE's GeoPowering the West (GPW) activity works with the U.S. geothermal industry, power companies, industrial and residential consumers, and federal, state, and local officials to provide technical and institutional support and limited, cost-shared funding to
state-level activities. GPW increases state and regional awareness of
opportunities to enhance local economies and strengthen our nation's energy security while minimizing environmental impact by demonstrating the benefits of geothermal energy.
GPW helps a state or region create a regulatory and economic environment that is more favorable for geothermal and other renewable energy development by identifying barriers to development and working with others to eliminate them.
30

Geothermal energy represents a major economic opportunity for the American West, an area characterized by a steadily increasing population that requires reliable sources of heat and power. GPW is pursuing this opportunity by: Bringing together national, state, and local stakeholders for state-sponsored
geothermal development workshops; Working with public power companies and rural electric cooperatives to promote use
of geothermal power; Promoting increased federal use of geothermal energy; Helping American Indians identify and develop geothermal resources on tribal lands;
and Sponsoring educational workshops.
Conclusion:
The emphasis of the Program is on challenges that pose greater risk than can normally be addressed independently by industry, but which have a proportionately higher return. New technologies can improve the economics of future developments. Geothermal energy has the potential to meet the Nation’s rapidly increasing need for energy. Geothermal energy is clean, reliable, and a plentiful renewable energy alternative for us. Jay Nathwani has an earned Master of Science degree in Mechanical Engineering from California State University. He join US DOE in 1991. Since then he has held several different positions, from Software Application Manager to Geothermal Project Leader, with DOE. Currently, as Geothermal Project Leader, he is responsible for research and development in Geoscience, Enhanced Geothermal Systems, and Energy System Research and Testing. He provides project management support for the national geoscience program and supports HQ on various tasks. He also monitors solicitations and technical merit reviews for Geothermal and Superconductivity program.
31

(4) GEOTHERMAL ENERGY IN THE UNITED STATES*
Joel L. Renner, Idaho National Engineering and Environmental Laboratory, Idaho Falls, Idaho, USA1
Introduction The word "Geothermal" comes from the combination of the Greek words gê, meaning earth, and thérm, meaning heat. Geothermal resources are concentrations of the earth’s heat, or geothermal energy, that can be extracted and used economically now or in the reasonable future. Currently, only concentrations of heat associated with water in permeable rocks can be exploited. Heat Flow Temperature increases with depth in the earth at an average of 25ºC/km. So, if the average surface temperature is 20ºC, the temperature at 3 km is only 95ºC. Although direct-use applications of geothermal energy can utilize temperatures as low as about 35ºC, the minimum temperature suitable for electrical generation is about 125ºC. However, spatial variations of the thermal energy within the deep crust and mantle of the earth give rise to concentrations of thermal energy near the surface of the earth that can be used as an energy resource. Heat is transferred from the deeper portions of the earth by conduction through rocks, by movement of hot deep rock toward the surface, and by deep circulation of water. In older areas of continents, such as much of North America east of the Rocky Mountains, heat flow is generally 40 to 60 mWm-2 (milliwatts per square meter). This heat flow coupled with the thermal conductivity of rock in the upper 4 km of the crust yields subsurface temperatures of 90 to 110ºC at 4-km depth in the Eastern United States. Heat flow within the Basin and Range (west of the Rockies) is generally 70-90 mWm-2, and temperatures are generally greater than 110ºC at 4 km. There are large variations in the western United States, with areas of heat flow greater than 100 mWm-2 and mountain areas such as the Cascades and Sierra Nevada of generally lower heat flow. The large rainfall on the Cascades may suppress flow of heat to the surface in this relatively young volcanic area. Tectonic Controls The unifying geologic concept of plate tectonics provides a generalized view of geologic processes that move concentrations of heat from deep within the earth to drillable depths. The heat can be related to movement of magma within the crust, particularly when associated with recent volcanism, or deep circulation of water in active zones of faulting. Figure 1 shows the major plate boundaries, where much of the geothermal exploration occurring worldwide is focused, since most of the current volcanic activity of the earth is located near plate boundaries associated with spreading centers and subduction zones.
1 Work supported by the U.S. Department of Energy, Assistant Secretary for Energy Efficiency and Renewable Energy, Office of Geothermal Technologies, under DOE Idaho Operations Office Contract DE-AC07-99ID13727.
32

Solid, bold lines are extensional boundaries, hachured lines are zones of convergence with the hachures on the overriding plate, and dotted lines indicate translational or diffuse plate boundaries. Figure 1. Major Tectonic Plates of the World The brittle and moving plates of the lithosphere (crust and upper mantle) are driven by convection of plastic rocks beneath the lithosphere. Convection causes the crustal plates to break and move away in opposite directions from zones of upwelling hot material. Magma moving upward into a zone of separation brings with it substantial amounts of thermal energy. But most spreading zones are within ocean basins and unsuitable for geothermal development. The ocean spreading centers give rise to the mid-oceanic ridges. Rifting of the earth’s crust can also occur in continental blocks. Two of the better-known examples are the East African Rift and the Rio Grand Rift in New Mexico. These rifts contain young volcanism and host several large geothermal systems. Where continental plates converge, they crumple against each other. An example is the Himalayas, formed by the collision of the Indian and Asian plates. More commonly, a continental and oceanic plate converge, causing the oceanic plate to be thrust or subducted under the continental plate because the oceanic plate is denser. The subduction causes melting near the leading edge of the subducted plate. As a result, lines of volcanoes form parallel to the plate boundary and above the subducting plate. Translational plate boundaries, which are locations where plates slide parallel to each other, may develop extensional troughs known as pull-apart basins, e.g., the Salton Trough of Southern California [1, p. 131]. Volcanism associated with the Salton Trough generated the heat in the Salton Sea, Cerro Prieto, and Imperial Valley geothermal fields. Tensional features further north on the San Andreas and related faults may be the cause of the volcanism thought to be the heat source for The Geysers geothermal field about 90 miles north of San Francisco. A third source of elevated heat flow and volcanism are “hot spots.” Several important geothermal systems are associated with recent volcanism caused by hot spots: Yellowstone, U.S.A., the geothermal fields in Iceland, and those of the Azores. Geothermal resources also have been developed in areas of anomalously high temperatures with no apparent active volcanism, such as the Basin and Range physiographic
33
province in the western United States. Although the tectonic framework of the Basin and Range is not fully understood, the elevated heat flow of the region is likely caused by a thinner than average continental crust undergoing tensional spreading. Elevated heat flow and deep circulation along recently active faults has generated many geothermal sites exploited in Nevada. Although there is no evidence of mid-level crustal magmatic activity, it cannot be ruled out. Several geothermal fields, however, are associated with recent volcanism along the margins of the Basin and Range. The Coso and Mammoth Lake fields in California and the Cove Fort and Roosevelt fields in Utah are examples. Areas of the world with geothermal potential are shown in Figure 2. As expected, much of the world’s potential for geothermal energy is associated with areas of volcanism caused by subduction and crustal spreading. Types of Geothermal Systems All commercial geothermal production is currently restricted to hydrothermal systems. Most hydrothermal resources contain water as liquid, but higher temperatures or lower pressures can create conditions where steam and water or only steam is the continuous phase in the reservoir. Successful, sustainable, geothermal energy usage depends on injection back into the reservoir of the maximum quantity of produced fluid to augment natural recharge of hydrothermal systems. Other types of geothermal systems have been investigated for energy production: (1) Geopressured-geothermal systems contain water with somewhat elevated temperatures (above normal gradient) and with pressures well above hydrostatic for their depth. Most such resources in the United States are located along the Gulf Coast. (2) Magmatic systems, with temperatures from 600 to 1400°C are associated with magmatic bodies beneath the surface of the earth. (3) Hot dry rock geothermal systems, with temperatures from 200 to 350°C, are subsurface zones with low initial permeability and little water. These types of geothermal systems cannot be used economically for the production of energy at this time. U.S. Geothermal Energy Potential A U.S. Geological Survey (USGS) circular assessing the geothermal potential of the United States provides an explanation of the terminology used to define the various categories of resources [2]. Resource base is all of the thermal energy contained in the earth. Accessible resource base is that part of the resource base shallow enough to be reached by production drilling. Resources are those portions of the accessible base that can be used at some reasonable future time. Reserves are that portion of the resource that has been identified and that can be used under current economic conditions. Reserves and resources are divided into categories of identified and undiscovered, based on our knowledge of the certainty of their existence.
34

Figure 2. Areas of the World with Potential for Producing Electricity using Geothermal Energy. The USGS published assessments of the moderate (90–150°C) and high-temperature (>150°C) geothermal resources of the United States in 1975 [3] and 1979 [2] and published an estimate of low-temperature (<90°C) resources in 1983 [4] (see Table 1). The USGS assessment of low-temperature resources [4] estimated the beneficial heat in discovered and undiscovered hydrothermal systems less than 90°C to be about 41 and 30 GWt for 3 years. The USGS [2] estimated that the identified high-temperature hydrothermal resource would operate power plants with an aggregate capacity of 23,000 MW(e) (megawatt electrical) for 30 years. The total U.S. hydrothermal resource, inferred from knowledge of earth science, was estimated to be 95,000 to 150,000 MW(e) for 30 years. Recent advances in the technology for converting geothermal energy into electricity have lowered the temperature needed for economic electrical production. As a result, lower-temperature resources will be included in the next USGS estimate of geothermal energy suitable for electrical production. The USGS intends to initiate a new assessment of U.S. geothermal resources in 2003, beginning with those in the Great Basin. Geothermal Energy Use in the United States The worldwide capacity for electrical generation using geothermal energy is 7,974 MW(e) of generating capacity on line in 21 countries [5,6] (see also Stefansson this volume). The current net capacity in the United States is 2222 MW(e). CalEnergy recently submitted a proposal to the California Energy Commission to construct a 185 MW(e) power plant at their Salton Sea field. Total generation in the United States was 15,470 GWh in 1999 [5,6]. Electricity is produced in California (7 fields), Hawaii (1 field), Nevada (9 fields), New Mexico (1 field), and Utah (2 fields). Table 2 lists the power production in the operating fields of the United States. This use of geothermal energy displaces over 30 million barrels of imported oil per year.
35

Table 1. Geothermal Energy Estimate for the United States (Modified from [2] and [4]). Electricity/Heat Producible for Resource Accessible Resource Base 30 years x 1018 Joules x 1018 Joules Hydrothermal Identified <90°C 41 GWt 87 27,000,000 >90°C 400 1,650 >150°C 23,000 MW(e) 950 90–150°C 42 x 1018 Joules 700 Undiscovered <90°C 30 GWt 66 7,200,000 >90°C 72 K to 127 K MW(e) 2,000 8,000 Geopressured 270-2,800 107,000 (thermal energy only) Thermal Energy Conductive 33,000,000 to 10 km 17,200,000 to 7 km 3,300,000 to 3 km Igneous related 101,000 to 10 km
Operating Conditions for Electrical Generation Most geothermal fields are liquid-dominated, meaning that water at high temperature and under high pressure but still in liquid form is the pressure-controlling medium filling the fractured and porous rocks of the reservoir. In liquid-dominated geothermal systems used for electrical production, water comes into the wells from the reservoir, and the pressure decreases as the water moves toward the surface, allowing part of the water to boil. Since the wells produce a mixture of steam and water, a separator is installed between the wells and the power plant to separate the two phases. The flashed steam goes into the turbine to drive the generator, and the water is injected back into the reservoir. A flashed-steam power plant is depicted in Figure 3. In several geothermal fields, the wells only produce steam. In these vapor-dominated fields, the separators and the system for handling the separated water are not needed. These systems are more economical, but unfortunately they are also rare. Only two of the currently operating fields in the world, Larderello, Italy, and The Geysers, United States, are vapor-dominated.
36
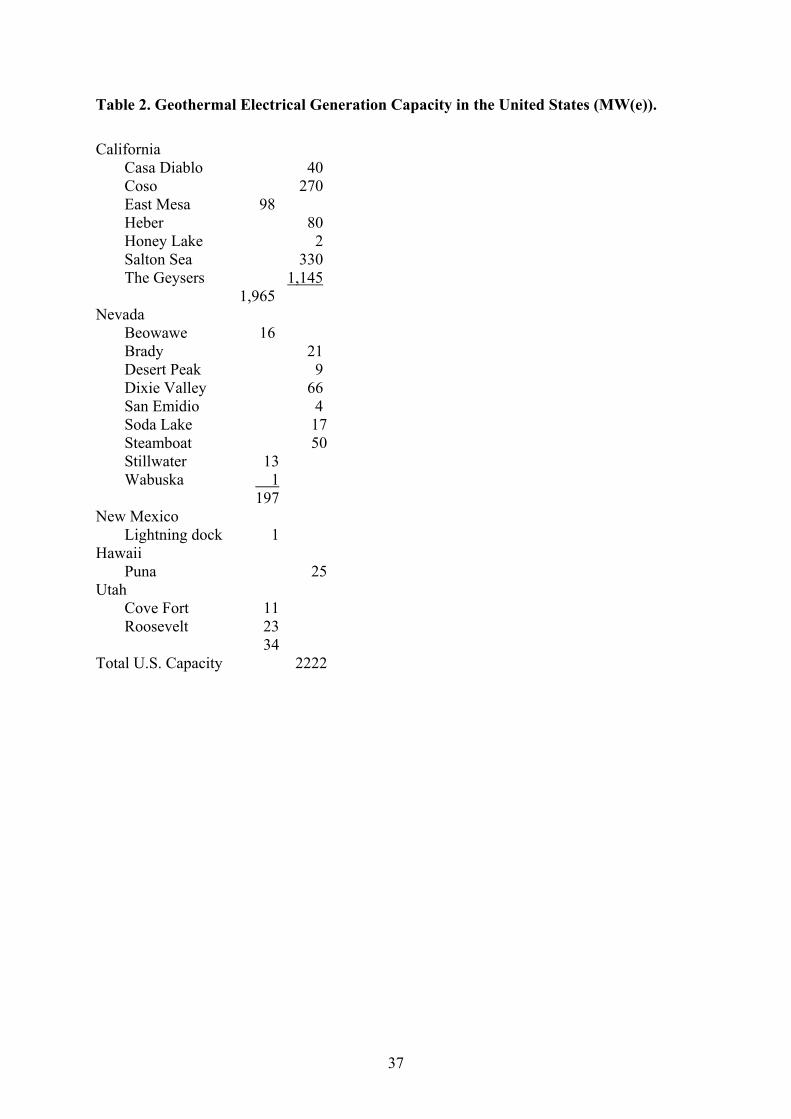
Table 2. Geothermal Electrical Generation Capacity in the United States (MW(e)). California Casa Diablo 40 Coso 270 East Mesa 98 Heber 80 Honey Lake 2 Salton Sea 330 The Geysers 1,145 1,965 Nevada Beowawe 16 Brady 21 Desert Peak 9 Dixie Valley 66 San Emidio 4 Soda Lake 17 Steamboat 50 Stillwater 13 Wabuska 1 197 New Mexico Lightning dock 1 Hawaii Puna 25 Utah Cove Fort 11 Roosevelt 23 34 Total U.S. Capacity 2222
37

Figure 3. Schematic of a Flashed-Steam Power Plant.
Many water-dominated reservoirs below 175°C used for electricity are pumped to prevent the water from boiling as it is circulated through heat exchangers to heat a secondary liquid that then drives a turbine to produce electricity (Figure 4). Binary geothermal plants have no emissions because all of the produced geothermal water is injected back into the underground reservoir. The number of identified lower-temperature geothermal systems is many times greater than the reserves of high-temperature fluids, providing an economic incentive to develop more efficient binary power plants. For electrical generation, typical geothermal wells in the United States have production-casing pipe in the reservoir with an inside diameter of 29.5 cm, and flow rates usually range between 150,000 and 350,000 kg/hr of total fluid [7]. The Geysers geothermal field in California has only steam filling fractures in the reservoir, and, in 1987 (approximately 30 years after production began), the average well flow had decreased to 33,000 kg/hr of dry steam supplying the maximum field output of 2000 MW(e) [7]. Continued pressure decline has decreased the production to about 1400 MW(e). Recently, however, injection of treated sewage water from communities near The Geysers has augmented the fluid in the field, and the decline has been decreased and in some areas temporarily reversed. Since 1997, about 5200 gallons per minute has been injected into the south-eastern portion of The Geysers, and in 2002 an additional 1,000 gallons per minute will be injected into the south-eastern portion of the field.
38
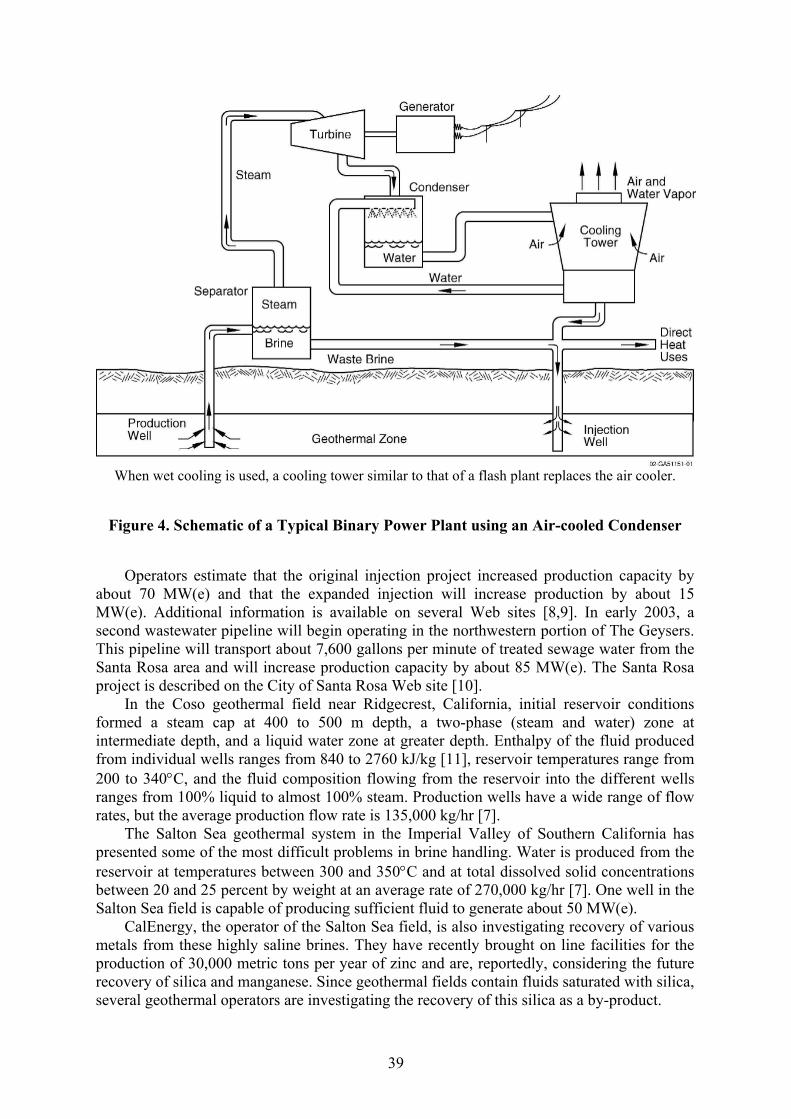
When wet cooling is used, a cooling tower similar to that of a flash plant replaces the air cooler.
Figure 4. Schematic of a Typical Binary Power Plant using an Air-cooled Condenser
Operators estimate that the original injection project increased production capacity by about 70 MW(e) and that the expanded injection will increase production by about 15 MW(e). Additional information is available on several Web sites [8,9]. In early 2003, a second wastewater pipeline will begin operating in the northwestern portion of The Geysers. This pipeline will transport about 7,600 gallons per minute of treated sewage water from the Santa Rosa area and will increase production capacity by about 85 MW(e). The Santa Rosa project is described on the City of Santa Rosa Web site [10]. In the Coso geothermal field near Ridgecrest, California, initial reservoir conditions formed a steam cap at 400 to 500 m depth, a two-phase (steam and water) zone at intermediate depth, and a liquid water zone at greater depth. Enthalpy of the fluid produced from individual wells ranges from 840 to 2760 kJ/kg [11], reservoir temperatures range from 200 to 340°C, and the fluid composition flowing from the reservoir into the different wells ranges from 100% liquid to almost 100% steam. Production wells have a wide range of flow rates, but the average production flow rate is 135,000 kg/hr [7]. The Salton Sea geothermal system in the Imperial Valley of Southern California has presented some of the most difficult problems in brine handling. Water is produced from the reservoir at temperatures between 300 and 350°C and at total dissolved solid concentrations between 20 and 25 percent by weight at an average rate of 270,000 kg/hr [7]. One well in the Salton Sea field is capable of producing sufficient fluid to generate about 50 MW(e). CalEnergy, the operator of the Salton Sea field, is also investigating recovery of various metals from these highly saline brines. They have recently brought on line facilities for the production of 30,000 metric tons per year of zinc and are, reportedly, considering the future recovery of silica and manganese. Since geothermal fields contain fluids saturated with silica, several geothermal operators are investigating the recovery of this silica as a by-product.
39

Direct Use Geothermal resources provide energy for agricultural uses, heating, industrial uses, and bathing. Fifty-five countries had 16,209 MW(t) (megawatt thermal) of total capacity for direct use in 1999 [12,13]. The total energy used is estimated at 162,000 TJ/y (terajoules per year). The U.S. capacity for direct use is about 3,766 MW(t), and approximately 5,640 GWH per year are used [12,13] (see also Stefansson this volume (Section 1)). The use of geothermal energy for direct uses is dominantly in the western states of Alaska, Arizona, California, Colorado, Hawaii, Idaho, Montana, Nevada, New Mexico, Oregon, Texas, Utah, Washington, and Wyoming. However, warm waters are also used for pools and spas and some space heating in Alabama, Arkansas, Georgia, Louisiana, Mississippi, New York, South Dakota, Texas, Virginia, and West Virginia. Warm water, at temperatures above 20°C, can be used directly for a host of processes requiring thermal energy. Thermal energy for swimming pools, space heating, and domestic hot water are the most widespread uses, but industrial processes and agricultural drying are growing applications of geothermal use (see Table 3). The cities of Boise, Idaho; Elko, Nevada; Klamath Falls, Oregon; and San Bernardino and Susanville, California; have geothermal district-heating systems where a number of commercial and residential buildings are connected to distribution pipelines circulating water at 54 to 93°C from the production wells [14].
Table 3. Direct use in the United States (modified from [15]). Capacity (MW[t]) Use (TJ/y) Agriculture 268 4,232 Balneology 107 2,497 District heating 99 624 Space heating 92 947 Heat pumps 4,800 12,000 Total U.S. 5,366 20,302
The use of geothermal energy through ground-coupled heat-pump technology has almost no impact on the environment and has a beneficial effect in reducing the demand for electricity. Geothermal heat pumps use the reservoir of constant temperature, shallow groundwater, and moist soil as the heat source during winter heating and as the heat sink during summer cooling. The energy efficiency of geothermal heat pumps is about 30 percent better than that of air-coupled heat pumps and 50 percent better than electric-resistance heating. Depending on climate, advanced geothermal heat pump use in the United States reduces energy consumption, and correspondingly, power-plant emissions by 23 to 44 percent compared to advanced air-coupled heat pumps, and by 63 to 72 percent compared to electric-resistance heating and standard air conditioners [16]. Environmental Constraints Geothermal energy is one of the cleaner forms of energy now available in commercial quantities. Use of geothermal energy avoids the problems of acid rain and greatly reduces greenhouse-gas emissions and other forms of air pollution. Potentially hazardous elements produced in geothermal brines are almost always injected back into the producing reservoir.
40

Land use for geothermal wells, pipelines, and power plants is small compared to land use for other extractive energy sources such as oil, gas, coal, and nuclear. Geothermal development projects often co-exist with agricultural land uses including crop production or grazing. The low life-cycle land use of geothermal energy is many times less than the energy sources based on mining such as coal and nuclear, which require enormous areas for mining and processing before fuel reaches the power plant. Low-temperature applications usually are no more intrusive than is a water well. Geothermal development serves the growing need for energy sources with low atmospheric emissions and other proven environmental safety. All known geothermal systems contain aqueous carbon dioxide species in solution. When a steam phase separates from boiling water, CO2 is the dominant (over 90 percent by weight) noncondensable gas. In most geothermal systems, noncondensable gases make up less than five percent by weight of the steam phase. For each megawatt-hour of geothermal electricity produced in the United States, the average emission of CO2 is about 18% of that emitted when natural gas is burned to produce electricity. A comparison of fossil and geothermal emissions is shown in Table 4. Binary plants have no emissions, since all of the produced fluid is injected back into the reservoir.
Table 4. Geothermal and Fossil Fuel CO2 Emissions in kg CO2 per kWh (Data from [17]). Geothermal Coal Petroleum Natural Gas 0.082 0.968 0.709 0.468
Hydrogen sulfide can reach moderate concentrations of up to two percent by weight in the separated steam phase from some geothermal fields. This gas presents a pollution problem because it is easily detected by humans at concentrations of less than 1 part per million in air. H2S concentrations are only high enough to require control at The Geysers, California, Coso, California, and Steamboat Springs, Nevada. Either the Stretford process or an incineration and injection process is used in geothermal power plants to keep H2S emissions below 1 ppb (part per billion). Use of the Stretford process in many of the power plants at The Geysers results in the production and disposal of about 13,600 kg of sulfur per megawatt of electrical generation per year. The incineration process burns the gas removed from the steam to convert H2S to SO2, the gases are absorbed in water to form SO3
-2 and SO4-2 in solution, and iron chelate is used
to form S2O3-2 [18]. The major product from the incineration process is a soluble thiosulfate,
which is injected into the reservoir with the condensed water used for the reservoir pressure-maintenance program. Sulfur emissions for each megawatt-hour of electricity produced in 1991, as SO2 by plant type in the United States was 9.23 kg from coal, 4.95 kg from petroleum, and 0.03 kg from geothermal flashed-steam (from data of [19]). Because the high pressures of combustion are avoided, geothermal power plants have none of the nitrogen-oxide emissions common from fossil fuel plants. For each megawatt-hour of electricity produced in 1991, the average emission of nitrogen oxides by plant type in the United States was 3.66 kg from coal, 1.75 kg from petroleum, 1.93 kg from natural gas, and zero from geothermal (from data of [19]). Conclusion Geothermal energy provides a major economic source of base-load electrical energy for the western United States as well as a clean source of energy for direct use over a broad area
41

of the United States. Geothermal energy produces about 2% of the electricity in Utah, 6% of the electricity in California, and 10% of the electricity in Northern Nevada. Further information concerning geothermal energy is available on many Web sites. Among the more informative are [20-25]. References [1] P. Keary and F. J. Vine, Global Tectonics, 2nd Edition, Blackwell Science Ltd., London, 1996. [2] L. J. P. Muffler, ed., “Assessment of Geothermal Resources of the United States—1978,” U.S. Geological Survey Circular 790, 1979. [3] D. E. White and D. L. Williams, “Assessment of Geothermal Resources of the United States—1975,” U.S. Geological Survey Circular 726, 1975. [4] M. J. Reed, “Assessment of Low-Temperature Geothermal Resources of the United Sates—1982,” U.S. Geological Survey Circular 892, 1983. [5] G. W. Huttrer, “The Status of World Geothermal Power Generation 1995–2000,” Proceedings of the World Geothermal Congress 2000, Kyushu-Tohoku, Japan, International Geothermal Association, Auckland, N.Z., pp. 23–38, May 28–June 10, 2000. [6] G. W. Huttrer, “The Status of World Geothermal Power Generation 1995–2000,” Geothermics, v. 30, pp.1-27. [7] M. G. Mefferd, “76th Annual Report of the State Oil & Gas Supervisor: 1990,” California Division of Oil & Gas Publication 6, Sacramento, 1991. [8] http://geysers-pipeline.org/index.htm [9] http://www.energy.ca.gov/geothermal/fact_sheets/Lake_County_SEGIS.pdf [10] http://ci.santa-rosa.ca.us/geysers/ [11] P. Hirtz, J. Lovekin, J. Copp, C. Buck, and M. Adams, “Enthalpy and Mass Flowrate Measurements for Two-Phase Geothermal Production by Tracer Dilution Techniques,” Proceedings, 18th Workshop on Geothermal Reservoir Engineering, Stanford University, SGP-TR-145, v. 18, pp. 17–27, January 1993. [12] J. W. Lund and D. H. Freeston, “Worldwide Direct Uses of Geothermal Energy 2000,” Proceedings of the World Geothermal Congress 2000, Kyushu-Tohoku, Japan, International Geothermal Association, Auckland, N.Z., pp. 1–22, May 28–June 10, 2000. [13] J. W. Lund and D. H. Freeston, “Worldwide Direct Uses of Geothermal Energy 2000,” Geothermics, v. 30, pp. 29–68, 2001. [14] K. Rafferty, K., “A Century of Service: The Boise Warm Springs Water District System,” Geothermal Resources Council Bulletin, v. 21, no.10, pp.339–344, 1992. [15] J. W. Lund and T. L. Boyd, “Geothermal Direct Use in the United States Update,” Proceedings of the World Geothermal Congress 2000, Kyushu-Tohoku, Japan, International Geothermal Association, Auckland, N.Z., pp. 297–305, May 28–June 10, 2000. [16] M. L’Ecuyer, C. Zoi, and J. S. Hoffman, “Space Conditioning: The Next Frontier,” U.S. Environmental Protection Agency, EPA430-R-93-004, Washington, D.C., 1993. [17] K. K. Bloomfield and J. N. Moore, “Production of Greenhouse Gases from Geothermal Power Plants,” Geothermal Resource Council Transactions, V. 23, pp. 221–223, 1999. [18] S. A. Bedell and C. A. Hammond, “Chelation Chemistry in Geothermal H2S Abatement,” Geothermal Resources Council Bulletin, v. 16, no. 8, pp. 3–6, 1987. [19] J. G. Colligan, “U.S. Electric Utility Environmental Statistics, Electric Power Annual 1991,” U.S. Department of Energy, Energy Information Administration, DOE/EIA-0348(91), Washington, D.C., 1993. [20] http://geothermal.marin.org/ [21] http://www.eren.doe.gov/geothermal
42

[22] http://www.geothermal.org [23] http://www.geotherm.org [24] http://www.oit.edu/~geoheat [25] http://iga.igg.cnr.it/index.php Joel Renner has spent most of his career working with geothermal energy. He began his career with the U. S. Geological Survey in 1970 and was a co-author of the Hydrothermal Convection Systems chapter of the first USGS assessment of the geothermal resources of the United States in 1975. Mr. Renner was also a co-author of a chapter on low-temperature geothermal resources in the central and eastern United States in the 1982 USGS assessment of low-temperature geothermal resources of the U.S. Mr. Renner joined the Idaho National Engineering and Environmental Laboratory in 1985 and has managed the INEEL geothermal program since 1986. INEEL’s program includes research on geothermal exploration, reservoir engineering, and electrical generation using geothermal resources. He also acts as the DOE national laboratory lead for the geo-science segment of the DOE Geothermal Program.
43

(5) DIRECT USE GEOTHERMAL ENERGY R. Gordon Bloomquist, Washington State University Cooperative Extension Energy Program, Olympia, Washington, USA
Utilization
Although historically the direct use of geothermal resources has been on a small scale and even on an individual basis, recent projects have focused more and more on the developments of major district heating systems, greenhouses or aquaculture complexes or major industrial uses. Heat pumps utilizing very low-temperature geothermal fluids (120°) have extended geothermal developments into traditionally non-geothermal countries such as Denmark, Sweden, Switzerland and large areas of the mid-western and eastern U.S. (Lund, 2002 [1]).
Worldwide (Lund and Freeston, 2000 [2]) the installed capacity of direct geothermal utilization as of 2000 was 16,200 MWe and the energy use was approximately 162,000 TJ/year distributed among 60 countries. This amounted to a savings of an equivalent of 11.4 million tones of fuel oil per year. The world wide distribution of direct use of geothermal energy is shown in Figure 1 (Chandrasekharam and Bundschuh (eds), 2002 [3]).
Internationally the largest uses of geothermal energy are for space heating (37%), 75 percent of which is in district heating systems and for swimming, bathing and balneology (22%) (Chandrasekharam and Bundschuh (eds), 2002 [3]). Direct Uses
The Lindal diagram (Figure 2) indicates the temperature ranges suitable for various direct uses of geothermal energy. Typically, agriculture and aquaculture use the lowest temperature resources. Space heating generally requires temperatures above 50°C, although temperatures as low as 40°C may be adequate in certain cases. Geothermal heat pumps can allow the use of temperatures as low as 4-6°C to provide space heating. Cooling, industrial processes and dehydration normally require temperatures above 100°C. Refrigeration based on ammonia absorption is possible at approximately 180°C. At temperatures over 110-120°C electrical generation also becomes economically viable, and there is increased interest in coupling geothermal electrical generation and direct uses. The electrical generation may be either topping or bottoming cycle depending upon the requirements of the direct use application. Space Conditioning
Space conditioning includes the provision of heating and/or cooling. Space conditioning is one of the most widespread uses of geothermal energy, and although in a number of areas it may be feasible on an individual basis (home or commercial building) it is more commonly provided through a district or central energy system. Cooling applications are rare, but with new advances in absorption technology more widespread uses (especially in warmer climates) may become more economically attractive.
The use of geothermal heat pumps has greatly expanded the geographic distribution of geothermal for space conditioning. Since geothermal heat pumps may use resources as low as 4-6°C, few areas of the world could not employ this technology, and it has already seen wide use in such traditionally non-geothermal countries as Sweden and Switzerland.
44

District Heating
District energy systems provide steam, hot water or chilled water from one or multiple production plants to multiple residential, commercial, institutional or industrial users through a network of pipes. Although the geothermal well field is the primary source of heat, many systems employ fossil fuel boilers and/or thermal storage facilities for peaking and backup.
Geothermal district heating systems are in operation in at least 12 countries including Iceland, France, Poland, Hungary, Turkey, Japan, China, Romania, Italy, the United States, Sweden and Denmark.
The first known geothermal district heating system was built in Chaudes-Aigues Cantal, France in the 14th century (Bloomquist, 1988 [4]) and is still in operation today. The first system in the United States was the Artisan Hot and Cold Water Company built in Boise, Idaho in 1892.
By far the most famous geothermal district heating system in the world is the system supplying nearly 98% of the residents of Reykjavik, Iceland. The installed capacity is 830 MWe and is designed to meet the heating load down to -10°C (Figure 3). During colder periods the increased load is met by large storage tanks and an oil-fired peaking plant (Ragnarsson, 2000 [5]).
In France, 61 geothermal district heating systems supply over 500,000 people. Agriculture and Aquaculture Applications
Agriculture, including greenhouses and soil warming, and aquaculture uses of geothermal energy are increasing rapidly. They are particularly widespread since they require heating at the lower end of the temperature range where there is an abundance of geothermal resources (Chandrasekharam and Bundschuh (eds), 2002 [3]).
Numerous commercially marketable crops have been raised in geothermally heated greenhouses in Hungary, Russia, New Zealand, Japan, Iceland, Italy, China and the United States. These include vegetables such as cucumbers and tomatoes, flowers (both potted and bedded) ornamental house plants, tree seedlings and cacti. Other plants such as asparagus have benefited from soil warming, allowing a premium product to reach the market ahead of competitors. Using geothermal energy for heating reduces operating costs (which can account for 35% of the product cost and allows for optimum productivity - Figure 4) and allows for operation in colder climates when commercial greenhouses would not normally be economical.
Aquaculture applications for the use of geothermal energy include raising catfish, freshwater prawns, tilapia, eels and tropical fish. Using geothermal heat allows for better control of water temperature than promoting optimum product (Figure 5). Aquaculture operations have been successful in the United States, Japan, New Zealand and China (Chandrasekharam and Bundschuh (eds), 2002 [3]). Industrial Applications
Although many industrial applications of geothermal energy are possible (See Figure 2) actual use is extremely limited. The oldest known industrial use dates back to the 1790’s in Larderello, Italy where boric acid and other borate compounds are still extracted today. Other major industrial uses include the drying of diatomaceous earth at a facility in Iceland, use in the pulp and paper industry in New Zealand, agricultural product dehydration in the United States, and enhanced gold extraction through heap leaching also in the United States.
45

Swimming, Bathing and Balneology
For centuries, geothermal hot springs have been used for bathing and for the associated health benefits by the Romans, Chinese, Ottomans, Japanese, Europeans and Indians of both North and South America. Today in Japan, more than 2700 hot springs resorts host an estimated 100 million guests every year. The waters are promoted for digestive system troubles (Chandrasekharam and Bundschuh (eds), 2002 [3]). Many sick and crippled people come for rehabilitation and physical therapy.
Popular and often famous geothermal spas in Romania, the former Czechoslovakia, China, Germany, England and the United States attract increasing numbers of guests looking for health and relaxation. Future Developments
Because of the worldwide occurrence of low to moderate temperature geothermal resources ideal for a broad range of direct use applications, the potential for substantially increased use seems very promising. Future developments will depend upon:
• Increased resource information • Increased knowledge of potential uses • Prices of competing fuels, e.g. oil and gas • The establishment of clear legal, institutional and regulatory framework conducive to
geothermal development on a country by country basis • Availability of capital, especially in the developing countries
Heat Pumps (14.33%)Bathing (22.15%)
Snow Melting/Air Cond. (0.60%)Others (0.59%)
Space Heating (36.85%)
Industrial (6.50%)
Ag. Drying (0.59%)
Aquaculture (6.64%)
Greenhouses (11.75%)
Source: Lund 2002 [1] Figure 1. Distribution of Direct Use of Geothermal Energy Worldwide
46

200
180
160
140
120
100
80
60
40
20
0
Re frigeration by ammonia a bsorbti on
Ca nning of food
D ryi ng of fish meal
Alumi na vi a Baye r’s proce ss
D ige st ion in pa per pulp
Evapora ti on in sugar refi ning
Evaporation
D ryi ng and c ur ing of ce ment bl oc k
Drying of a gricultura l productsD ryi ng of stock fish
Spac e heati ng (buildi ng a nd gre enhouses)Cold stora ge
A ir condi tioning
A nima l husbandry
Soil wa rming
Sw imm ing pools, de-icing
Fish fa rming
CONV EN TIONA LELECTRICGENERATION
BINARY F LUIDELECTRICG ENERATION
SPACE HEATINGWITH H EAT PUMPS
OC OF
300
350
250
200
50
100
150
Source: Lund 2002 [1] Figure 2. Lindal Diagram indicating Temperature Range for Direct Use of Geothermal Energy
Ellidaár Field180 kg/s
LineshaftPumps
PumpingStation
Vent
890C 890C
960C
LineshaftPumps
Storage Tanks
800C
Peaking Station
350C
Heating
800C
Heating
Mixing
350C
800C 350C1250C 1250C
Mixing Heating
VentLineshaftPumps
Laugarnes Field290 kg/s
Drains
Source: Lund 2002 [1] Figure 3. Heating System for Geothermal Energy in Reykjavik, Iceland
47

0 5 10 15 20 25 3530 40
32 50 68 86 104
0
25
50
75
100
125
Te mp erature 0C
Te mp erature 0F
C U CU M BER
LETTU C E TO MAT O
Source: Lund 2002 [1] Figure 4. Geothermal Energy Use in Agriculture
Temperature 0C
Temperature 0F
0 10 20 30 40
32
Cows
68 86 104
100
80
60
40
20
0
50
Trout
Shrimp Catfish
Chickens
Source: Lund 2002 [1] Figure 5. Geothermal Energy Use for Aquaculture References
48

[1] Lund, J.W., 2002. Direct Heat Utilization of Geothermal Resources. Geothermal Energy Resources for Developing Countries. D. Chandrasekharam & J. Bundschuh, 2002.
[2] Lund, J.W. and D.H. Freeston, 2000. Worldwide Direct Use of Geothermal Energy 2000. Proceedings of the World Geothermal Congress, 2000, Japan.
[3] Chandrasekharam and Bundschuh (eds), 2002. Direct Heat Utilization of Geothermal Resources, Geothermal Energy Resources for Developing Countries, Swets and Zeitlinger, Lisse, Netherlands, pp 129-147.
[4] Bloomquist, R. Gordon, 1988. District Heating Development Guide. Washington State Energy Office.
[5] Ragnarsson, A., 2000. Iceland Country Update. Proc. Of the World Geothermal Congress, 2000, Japan.
R. Gordon Bloomquist received Masters and Ph.D. degrees in Geology and Geochemistry from the University of Stockholm. He began his energy career with the Oregon Institute of Technology in 1978, and while there, coordinated a six-state geothermal assessment program for the U.S. Department of Energy. Dr. Bloomquist, now with the Washington State University Cooperative Extension Energy Program, is in charge of the state’s geothermal and district heating/cooling programs, as well as serving as coordinator for geothermal.
Dr. Bloomquist was one of the founders and original board members of the International Geothermal Association where he continues as Chairman of the Education Committee. He has also served as board member and President of the Geothermal Resources Council. Dr. Bloomquist has been an adjunct professor at the International School of Geothermics in Pisa, Italy, since 1988. Dr. Bloomquist has authored over 100 articles and books on the fields of district energy and geothermal applications.
49
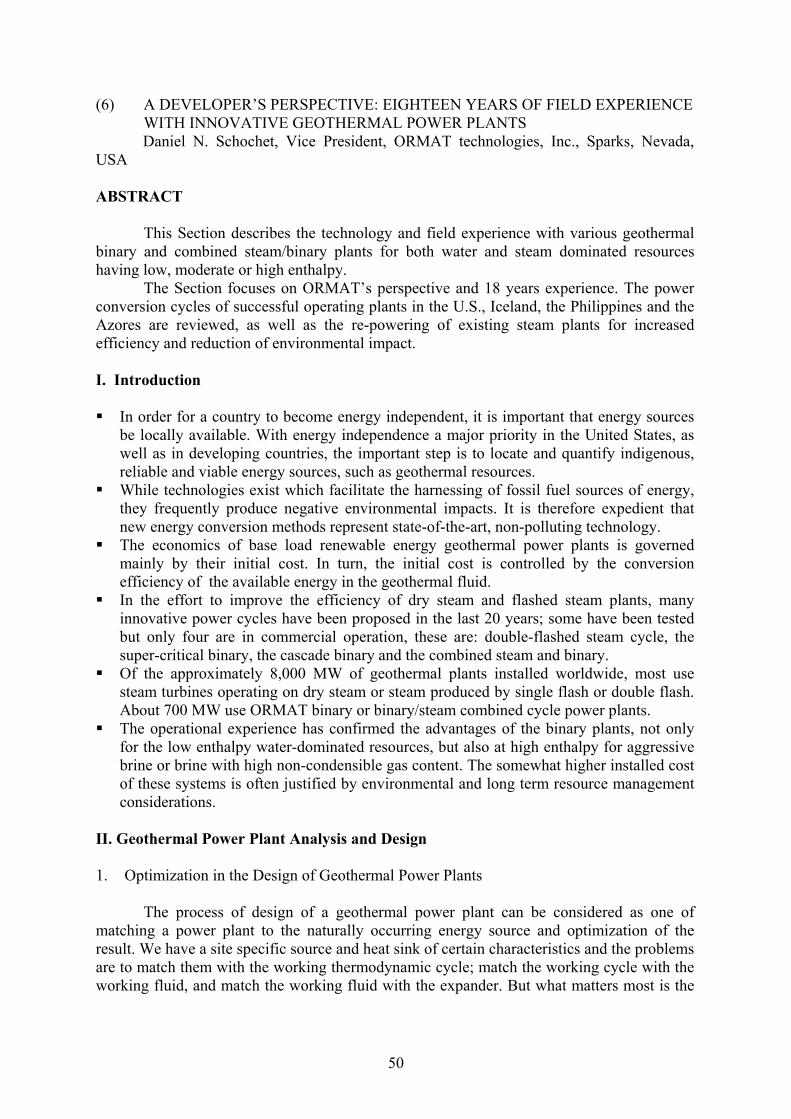
(6) A DEVELOPER’S PERSPECTIVE: EIGHTEEN YEARS OF FIELD EXPERIENCE WITH INNOVATIVE GEOTHERMAL POWER PLANTS Daniel N. Schochet, Vice President, ORMAT technologies, Inc., Sparks, Nevada,
USA ABSTRACT
This Section describes the technology and field experience with various geothermal binary and combined steam/binary plants for both water and steam dominated resources having low, moderate or high enthalpy.
The Section focuses on ORMAT’s perspective and 18 years experience. The power conversion cycles of successful operating plants in the U.S., Iceland, the Philippines and the Azores are reviewed, as well as the re-powering of existing steam plants for increased efficiency and reduction of environmental impact. I. Introduction In order for a country to become energy independent, it is important that energy sources
be locally available. With energy independence a major priority in the United States, as well as in developing countries, the important step is to locate and quantify indigenous, reliable and viable energy sources, such as geothermal resources.
While technologies exist which facilitate the harnessing of fossil fuel sources of energy, they frequently produce negative environmental impacts. It is therefore expedient that new energy conversion methods represent state-of-the-art, non-polluting technology.
The economics of base load renewable energy geothermal power plants is governed mainly by their initial cost. In turn, the initial cost is controlled by the conversion efficiency of the available energy in the geothermal fluid.
In the effort to improve the efficiency of dry steam and flashed steam plants, many innovative power cycles have been proposed in the last 20 years; some have been tested but only four are in commercial operation, these are: double-flashed steam cycle, the super-critical binary, the cascade binary and the combined steam and binary.
Of the approximately 8,000 MW of geothermal plants installed worldwide, most use steam turbines operating on dry steam or steam produced by single flash or double flash. About 700 MW use ORMAT binary or binary/steam combined cycle power plants.
The operational experience has confirmed the advantages of the binary plants, not only for the low enthalpy water-dominated resources, but also at high enthalpy for aggressive brine or brine with high non-condensible gas content. The somewhat higher installed cost of these systems is often justified by environmental and long term resource management considerations.
II. Geothermal Power Plant Analysis and Design 1. Optimization in the Design of Geothermal Power Plants
The process of design of a geothermal power plant can be considered as one of matching a power plant to the naturally occurring energy source and optimization of the result. We have a site specific source and heat sink of certain characteristics and the problems are to match them with the working thermodynamic cycle; match the working cycle with the working fluid, and match the working fluid with the expander. But what matters most is the
50
optimisation of the whole system, involving the most important process of trading-off a loss or gain for an optimal techno-economic performance.
Let us now consider, in the case of the geothermal power plant, the various matching processes and their impact not only on efficiency, but also on the environment, on the long-term pressure support and geothermal resource availability. 2. Optimisation of Prime Movers.
The usual definition of thermal efficiency, considered as the ratio between the net work done by the fluid and the total heat input to the cycle, can be misleading in assessing the suitability of a given cycle in a heat engine. A concept of paramount importance in evaluating the suitability of a particular cycle for use in a heat engine is that of work ratio, which may be defined as the ratio of the net work output of the cycle to the total positive (expansion) work of the cycle.
If there is very little negative work, as in a typical vapor cycle, where only liquid of small specific volume has to be pumped back into the boiler, the work ratio will be nearly unity. By contrast, this ratio is lower in a super critical cycle where a large portion of the positive work of the turbine is used to drive the feed pump. Taking into account all these practical implications of work ratio, it can be seen that in many ways the concept of work ratio can be regarded as almost more important that the concept of ideal cycle efficiency. 3. Heat Cycle Considerations
In a geothermal power plant, which uses no externally supplied fuel, the effectiveness of the heat usage directly impacts upon the total capital cost of the plant. Ideally, the most effective way to produce power from the available energy in the geothermal fluid is to convert it, in the power cycle, adiabatically and reversibly to the temperature of the cooling medium.
To compare the efficiency of the different conversion systems it is of course necessary to consider the output net of power plant internal usage, such as for cycle pumps, production pumps, injection pumps, cooling systems and non-condensible gas extraction power consumption. 4. Resource Considerations
The decline of production in the Larderello, Geysers and Wairakei fields has focused attention on the necessity for long-term pressure support by re-injecting as much geothermal fluid as possible.
In brines rich in carbonates, avoiding flash by use of secondary loops or of downhole and booster pumps reduces both the fouling of the heat exchangers and scaling of the injection wells. 5. Environmental Considerations
The factors impacting the environment are: Non condensible gases (mainly H2S) released by steam. Discharged fluids such as the separated brine (carrying off heavy metals) and blowdown
from the cooling towers (chemicals). Leakage of secondary fluid (especially in case of CFCs).
51

Noise and visual impact. III. Review of Experimental Plants
The cycles are reviewed per status of their reduction to practice. The detailed descriptions of the different systems and the scope of their development are given in the referenced papers [1~15]. 1. Proposed Systems Trilateral cycle – Of the binary total flow systems [8]; the most well conceived is the
trilateral cycle [4], which was also partially tested. Absorption and absorption/regenerative cycles – of the different cycles proposed [9], the
most advanced system is the Kalina cycle [10], which was tested on an energy recovery plant. A demonstration is yet to be made in a geothermal power plant to prove the practicality of the concentration variations, the high pressure of the system, and other factors.
2. Tested Systems The total flow steam cycle (bi-phase) [11], although conceptually elegant and
theoretically efficient, did not make it to sustained commercial operation in its prior trials, mainly because of clogging in the nozzles.
The direct heat exchanger usage [12] encountered serious problems of fouling and excessive hydrocarbon fluid loss.
Hybrid systems [13]: This is a complex system combining internal combustion engines with heat recovery from the hot brine and exhaust. Tests have yet to demonstrate the validity of the concept.
IV. Innovative Power Plants in Commercial Operation (see Table 1) 1. Low Enthalpy Resources (100ºC to 160ºC)
The binary Organic Rankine System is often utilized to convert the resource heat to electrical power for low enthalpy resources (Figure 1). The hot brine or geothermal steam is used as the heating source for a secondary (organic) fluid, which is the working fluid of the Rankine cycle. Two such plants have been built by Barber Nichols Inc., one by Turboden and 17 by Ormat. Some of these units are used in repowering existing power plants.
In the early 80’s, to increase the power output from a given brine resource by increasing the thermal cycle efficiency, the super-critical cycle using isobutane was pioneered by the Ben Holt Company and a cascade concept was developed by Ormat. The super-critical cycle may be slightly more efficient than the cascading cycle, but the cascading system has the advantage of lower operating pressures and lower parasitic loads (cycle pumps). Turboden of Italy and Barber Nichols built one plant of 1 MW each.
At the Ormesa I power plant in Southern California, a three level arrangement was employed resulting in increased efficiency, or power output gain, of about 10% over that achievable with a parallel arrangement of the OEC units. The gross brine utilization rate of this 166ºC resource was 76 kg/kWh. Another 7 such Ormat plants are in operation (Figure 2) as well as 3 using the Ben Holt super critical technology.
52

In the mid 80’s Ormat introduced the Integrated Two level Unit (ITLU) as a means of lowering the complexity and cost of the plant. Initially, an air-cooled plant at Stillwater in Nevada and five other operating projects used ITLU’s, which eliminated the need for long brine headers and numerous valves which exist in the previous design. In all of the above arrangements, a modular approach was employed so that high plant availability factors of 98% and above were achievable.
Figure. 1 – Air Cooled Binary Geothermal Power Plant Diagram
Figure. 2 – Ormesa II Geothermal Power Plant
53

Table 1 – Ormat Innovative Power Plants - Reference List - Country Customer or Utility Total
Capacity (MW)
No. of Power Plants
Capacity of Plants (MW) Largest Smallest
USA SCE – Southern California Edison SPC – Sierra Pacific Power Company HELCO – Hawaiian Electric Company
113.2 50.0 30.0
5 6 1
40.0 15.0 30.0
10.0 0.7
Argentina EPEN – Ente Provincial de Energia Neuquen 0.7 1 0.7 China Tibet Bureau for Industry and Power 1.0 1 1.0 Iceland Sudurnes Regional Heating Corp. 9.1 2 5.2 3.9 Italy ENEL – Ente Nazionale Per L’Energia Electrica 0.7 1 0.7 Philippines NPC – National Power Corporation
PNOC – Philippines National Oil Co. 15.0 174.0
1 2
15.0 125.0
49.0
Mexico CFE – Comision Federal de Electricidad 3.0 2 1.5 New Zealand
BOP – Bay of Plenty Electricity Board Rotokawa Generation Ltd.
6.1 27.0
2 1
3.5 2.6
Thailand EGAT – Electricity Generating Authority of Thailand
0.3 1 0.3
Azores SOGEO – Sociedade Geotermica dos Açores 5.2 1 5.2
54

2. Moderate Enthalpy Resources (160ºC to 190ºC)
For moderate enthalpy two-phase resources where the steam quality is between 10 to 30%, the binary plants are efficient and cost effective. Furthermore, when the geothermal fluid has a high non-condensible gas (NCG) content, even higher efficiency can be obtained than with condensing steam turbines [14].
This binary two-phase configuration is used in the Sao Miguel power plant in the Azores (Figure 3). Separated steam containing NCGs is introduced in the vaporizer heat exchanger to vaporize the organic fluid. The geothermal condensate at the vaporizer exit is then mixed with the hot separated brine to provide the preheating medium of the organic fluid (Figure 4).
Since the onset of silica precipitation is related to its concentration in the brine, dilution of the brine with the condensate effectively lowers the precipitation temperature at which silica crystallizes. This lower temperature added 3.5 MW of heat to the cycle representing 20% of the total heat input. This additional heat is utilized at the same thermal efficiency as the remaining heat due to the nature of the combined steam-brine cycle. Since the cycle efficiency is about 17%, this low temperature heat produces about an additional 600 kW.
The second solution to better utilize the resource was the use of a regenerative cycle [15] by the addition of a recuperator heat exchanger between the organic turbine and the air-cooled condenser, since the organic vapor tends to superheat when the vapor is expanded through the turbine. In this case the recuperator reduces the amount of heat that must be added to the cycle from the external source, thereby reducing the amount of brine flow rate required. This results in reduction of about 7% of the total heat input as required to produce the design level of power output.
Figure 3 – Sao Miguel Geothermal Power Plant
55

Figure 4 - Two Phase Binary Geothermal Power Plant Diagram 3. High Enthalpy Resources (over 190ºC)
To best utilize a steam dominated resource Ormat developed a Geothermal Combined Cycle Unit (GCCU) where the steam first flows through a back pressure steam turbine and them is condensed in the organic turbine vaporizer (Figure 5). The condensate and the brine are used to preheat the organic fluid, as in the two-phase binary configuration above.
Figure 5 – Two Phase Geothermal Combined Cycle Power Plant Diagram
56

Figure 6 – Svartsengi Exhaust Steam Recovery Project, Iceland
This concept was first used in 1989 in repowering a back pressure steam plant in
Iceland (Figure 6), then with ten 3 MW GCCU in Hawaii in 1992. A plant using four 30 MW GCCU for a total net capacity of 125 MW is in operation in the Philippines and a 27 MW plant in New Zealand (Figure 7)
Figure 7 – PNZ Rotokawa Plant in New Zealand
V. Conclusions
As indicated in Table 1, Ormat has designed, installed and put into commercial operation 30 innovative geothermal power plants since 1984, with a total installed capacity of 500 MW. These power plants have accumulated over 12 million hours of operation as of June 1, 1998, thus demonstrating the maturity of the technology. The Organic Rankine Cycle technology over this 18 year period has evolved to encompass Ormat’s supply and installation of operating cost effective geothermal steam binary combined cycle power plants
57

which are specifically designed for geothermal applications. These applications include power plants for new projects with the utilization of low enthalpy (100ºC to 160ºC), moderate enthalpy (160ºC to 190ºC) and high enthalpy resources (over 190ºC), as well as power plants for the repowering of existing geothermal projects. VI. References [1]. D’AMELIO L. L’Impiego di Vapori ad Alto Peso Molecolare in Piccole Turbine, Napoli
1935. [2]. TABOR H, BRONICKI L. Turbine for Small Solar Power Package, UN Conference,
New Sources of Energy, Rome 1961. [3]. WILSON S.S. and RADWAN M.S, Appropriate Thermo Dynamics for Heat Engine
Analysis & Design: Int. J. Mech. Eng. Educ., Vol.5, No., 1977. [4]. BARNEA J. The Future of Small Energy Resources, UNITAR 1981. [5]. KESTIN J. and DIPIPPO R. DOI: Sourcebook on the Production of Electricity from
Geothermal Energy, 1980. [6]. BRONICKI L. Organic Vapor Turbogenerators Using Locally Available heat Sources –
25 Years of Industrial Experience: 14th Congress of the World Energy Conference, Montreal, 1989.
[7]. HU LIANGGUANG GU CHUJUN, FAN WENBO, WANG ZHAN and ZHANG FENGSHAN: a Comparison of Energy Use Efficiency of Total Flow and Flashed Steam Methods for Geothermal Power Generation: Geothermal Resources Council, Transactions, Vol. II. October 1987.
[8]. SAULSON S.H. and ROSENBLATT J.H. Achievable Improvements in Geothermal Power Generation Cycle: Geothermal Resources Council, Transactions, Vol. 12, October 1988.
[9]. LEIBOWITZ H.M. and MARKUS D.W. Economic Performance of Geothermal Power Plant using the Kalina Cycle Technology: Geothermal Resources Council, Transactions, Vol.14, Part II, August 1990.
[10]. ALGER T.W. Lawrence Livermore Laboratory, University of California Livermore, California 94550, USA, Performance of Two-phase Nozzles for Total-flow Geothermal Impulse Turbines: GRC 1975.
[11]. HLINAK A.J., LOBACH J.L. and NICHOLS K.E. Operational and Field Test Results from the 500 kW Direct Contact Pilot Plant at East Mesa: GRC Conf. of Small Scale Geoth. Power Plant, June 14-16, 1982, Long Beach, CA.
[12]. CAMBELL R.G. Construction and Planned Operation of a Hybrid Cycle Power Plant on a Geopressured Well: Geothermal Resources Council, Transaction, Vol. 13, October 1989.
[13]. KRIEGER Z. and MORITZ HUS Patent 4.5785.3, 1986 [14]. FLYNN, TOM Geothermal Sustainability, Heat Utilization and Advanced Binary
Technology: Geothermal Resources Council,Vol. 26, 1997. [15]. HENNAGIR, TIMOTHY L. Philippines Fast Track: Independent Energy Europe, 1997
Daniel N Schochet is Vice President, Ormat International Inc. His professional experience 1975 to present is: Various positions within the ORMAT group of Companies, including Director of International Marketing, Vice President General Manager of ORMAT Nevada, and Vice President Business Development. Assignments have included directing marketing and customer service operations, establishing geothermal development division and managing geothermal project development operations in the USA and elsewhere. Since 1980 these activities included managing geothermal resource acquisition and assessment,
58

permitting, defining exploration, drilling and testing regimes, feasibility studies, conceptual definition of power plant systems, project financing, permitting and regulatory relationships, and developing new project opportunities.
Member of the Board of Directors of the Geothermal Energy Association (International Vice President), Member of the Board of Directors of the Geothermal Resources Council, Member of the Board of Directors of the International Geothermal Association, and company representative for the National Association of Corrosion Engineers and the Power Sources Manufacturers Association.
1953 to 1975: Held a number of technical and management positions in the aerospace, electrical power and biomedical research industries. Assignments included aerospace engineering and research, reliability engineering, management of engineering testing and evaluation laboratories, international project management and international marketing.
Education: Master of Science, Electrical Engineering (MSEE), Columbia University School of Engineering, New York; Bachelor of Electrical Engineering (BEE), Cooper Union School of Engineering, New York, NY.
59
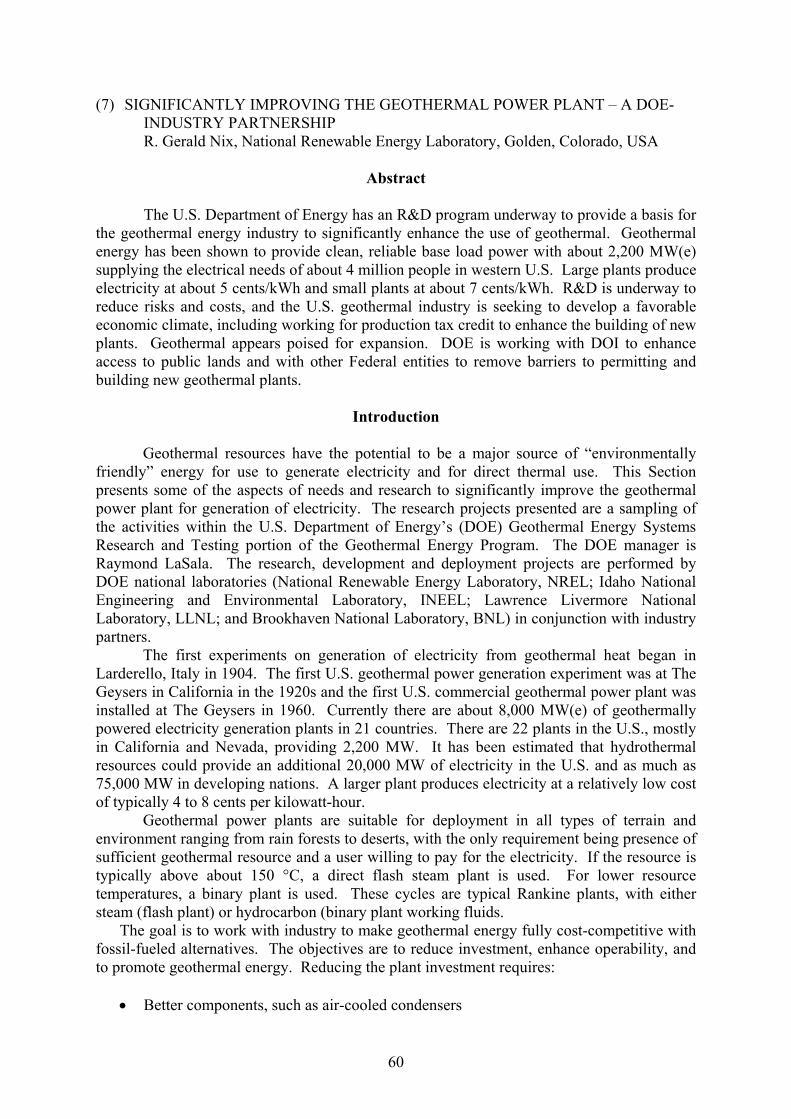
(7) SIGNIFICANTLY IMPROVING THE GEOTHERMAL POWER PLANT – A DOE-INDUSTRY PARTNERSHIP R. Gerald Nix, National Renewable Energy Laboratory, Golden, Colorado, USA
Abstract
The U.S. Department of Energy has an R&D program underway to provide a basis for
the geothermal energy industry to significantly enhance the use of geothermal. Geothermal energy has been shown to provide clean, reliable base load power with about 2,200 MW(e) supplying the electrical needs of about 4 million people in western U.S. Large plants produce electricity at about 5 cents/kWh and small plants at about 7 cents/kWh. R&D is underway to reduce risks and costs, and the U.S. geothermal industry is seeking to develop a favorable economic climate, including working for production tax credit to enhance the building of new plants. Geothermal appears poised for expansion. DOE is working with DOI to enhance access to public lands and with other Federal entities to remove barriers to permitting and building new geothermal plants.
Introduction
Geothermal resources have the potential to be a major source of “environmentally
friendly” energy for use to generate electricity and for direct thermal use. This Section presents some of the aspects of needs and research to significantly improve the geothermal power plant for generation of electricity. The research projects presented are a sampling of the activities within the U.S. Department of Energy’s (DOE) Geothermal Energy Systems Research and Testing portion of the Geothermal Energy Program. The DOE manager is Raymond LaSala. The research, development and deployment projects are performed by DOE national laboratories (National Renewable Energy Laboratory, NREL; Idaho National Engineering and Environmental Laboratory, INEEL; Lawrence Livermore National Laboratory, LLNL; and Brookhaven National Laboratory, BNL) in conjunction with industry partners.
The first experiments on generation of electricity from geothermal heat began in Larderello, Italy in 1904. The first U.S. geothermal power generation experiment was at The Geysers in California in the 1920s and the first U.S. commercial geothermal power plant was installed at The Geysers in 1960. Currently there are about 8,000 MW(e) of geothermally powered electricity generation plants in 21 countries. There are 22 plants in the U.S., mostly in California and Nevada, providing 2,200 MW. It has been estimated that hydrothermal resources could provide an additional 20,000 MW of electricity in the U.S. and as much as 75,000 MW in developing nations. A larger plant produces electricity at a relatively low cost of typically 4 to 8 cents per kilowatt-hour.
Geothermal power plants are suitable for deployment in all types of terrain and environment ranging from rain forests to deserts, with the only requirement being presence of sufficient geothermal resource and a user willing to pay for the electricity. If the resource is typically above about 150 °C, a direct flash steam plant is used. For lower resource temperatures, a binary plant is used. These cycles are typical Rankine plants, with either steam (flash plant) or hydrocarbon (binary plant working fluids.
The goal is to work with industry to make geothermal energy fully cost-competitive with fossil-fueled alternatives. The objectives are to reduce investment, enhance operability, and to promote geothermal energy. Reducing the plant investment requires:
• Better components, such as air-cooled condensers
60

• Lower cost materials and inexpensive coatings • Better cycles
Reducing O&M (operations and maintenance) costs can be achieved through actions to:
• Control brine chemistry • Better instruments for tighter controls • Improved emissions control.
Efficiency can be enhanced by:
• Improved off-design operation • Reduced parasitic losses • Improved cycles.
Plant revenue can be enhanced by:
• Co-production of a valuable by-product • Direct use of cascaded brine, first to produce electricity then as a thermal source. The potential impacts of power plant Research and Development are shown in Table 1.
TABLE 1. POTENTIAL IMPACTS OF POWER PLANT RESEARCH AND DEVELOPMENT. Technical Area Percent Reduction in Cost of Electricity Heat Exchangers 8 to 10% Cycle Efficiency 5 to 7% Enhancement of Off-design Operation 3 to 5% Reduced O&M 2 to 3%
Aggregated, these improvements have potential for 18 to 25% reduction in COE or about 1¢/kWh reduction in cost of electricity
Typical Research and Development Projects – A Sampling of Projects from a Larger Program
Enhanced Heat Transfer in Air-Cooled Condensers
A typical research and development project is on air-cooled condensers. For
conventional high fin heat exchanger tubes, the air becomes somewhat stagnant as it flows across the fin, resulting in a relatively low heat transfer rate. The idea is to disrupt the flow to renew the boundary layer, resulting in an enhancement of the heat transfer rate at constant pressure drop. This should reduce the size and the cost of the air-cooled condensers. Two concepts are being pursued with one using a transpired fin where the cooling air is forced to flow through the fin to enhance heat transfer. The photograph in Figure 1 shows a typical mock up. Another concept is to use vortex generators to direct the flow into relatively ineffective zones to enhance the heat transfer, as shown below.
61

(a) Transpired Fin Concept (b) Vortex Enhancement Concept
Figure 1. (a) A Transpired Fin where the Cooling Air is Forced to Flow through the Fin to Enhance Heat Transfer, and (b) Use of Vortex Generators to Direct Flow into Relatively Ineffective Zones to Enhance Heat Transfer
Both concepts have common elements:
• They provide a mechanism to enhance heat transfer by about 30% • Parasitic energy loss is held constant, leading to a smaller heat exchanger • Computational fluid dynamics (CFD) has been extensively used to define workable
designs • Each researcher is working with an industrial partner. Researchers are Charles Kutscher (NREL, transpired fin) and Manohar Sohal (INEEL,
vortex enhancement). The bottom line is that either concept has the potential to reduce the cost of generated electricity by about 0.5 cents per kWh. MATERIALS RESEARCH
Some geothermal waters (brines) are aggressively corrosive toward containment materials. This may require the use of premium alloys with net effect of increasing the investment, and perhaps increasing the maintenance cost because of reduced equipment lifetimes. The concept is to develop corrosion resistant coatings that can be cheaply applied to inexpensive base materials such as carbon steel, with an end performance equal to or better than premium alloys while significantly reducing the cost.
Toshi Sugama of BNL and Keith Gawlik of NREL have developed and applied modified polyphenylene sulfide (PPS) coatings that result in PPS coated carbon steel that out performs premium alloys in applications such as heat exchangers. Some of the modifying agents include addition of Kevlar fibers to enhance abrasion and erosion resistance, carbon fibers to enhance thermal conductivity, and Teflon to reduce surface fouling. A typical coated coupon is shown below:
62

: Figure 2. Typical Coated Coupon using Applied Modified Polyphenylene Sulfide (PPS) Coatings that result in PPS Coated Carbon Steel that Out-Performs Premium Alloys in Applications such as Heat Exchangers.
Field-testing has proven the concept and has shown the superior performance and the lower costs of PPS coated carbon steel compared to higher alloys such as Inconel. Bob Curran and Sons of Houston, TX have now commercialized PPS coatings. This research was recognized by an R&D-100 award in 2002. BETTER INSTRUMENTS FOR REAL TIME MONITORING OF GEOTHERMAL PROCESSES
Judy Partin of INEEL is performing research with an objective to lower cost of geothermal power by developing instrumentation for the real-time detection and control of various process stream parameters (H2S, HCl, steam quality, CO2). The status of the research is:
• Field testing is underway of a laser spectroscopy technique to measure H2S in the gas stream entering/leaving Stretford unit
• Lab tested laser spectroscopy technique to measure HCl; a field test is planned • Detection sensitivity 0.5 to 5 ppm depending upon species and process stream
conditions • New laser technology will provide sensitivity to measure H2S levels in cooling tower
stacks • A patent has been applied for a steam quality monitor.
Figure 3 shows a laboratory setup for a laser-based instrument.
63
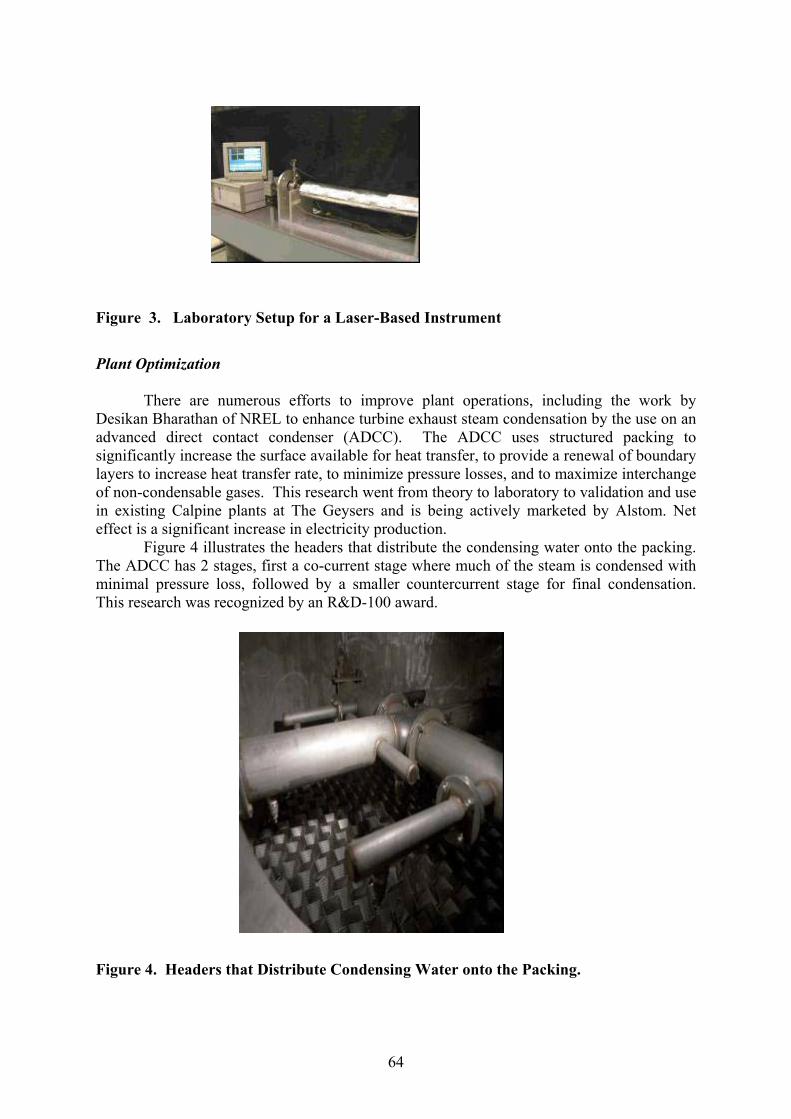
Figure 3. Laboratory Setup for a Laser-Based Instrument Plant Optimization
There are numerous efforts to improve plant operations, including the work by Desikan Bharathan of NREL to enhance turbine exhaust steam condensation by the use on an advanced direct contact condenser (ADCC). The ADCC uses structured packing to significantly increase the surface available for heat transfer, to provide a renewal of boundary layers to increase heat transfer rate, to minimize pressure losses, and to maximize interchange of non-condensable gases. This research went from theory to laboratory to validation and use in existing Calpine plants at The Geysers and is being actively marketed by Alstom. Net effect is a significant increase in electricity production.
Figure 4 illustrates the headers that distribute the condensing water onto the packing. The ADCC has 2 stages, first a co-current stage where much of the steam is condensed with minimal pressure loss, followed by a smaller countercurrent stage for final condensation. This research was recognized by an R&D-100 award. Figure 4. Headers that Distribute Condensing Water onto the Packing.
64

Gregory Mines of INEEL is performing engineering analyses and research to define how to best mitigate the negative impacts of off-design operation. A geothermal power plant is designed for specific conditions, but actual operating conditions are different from the design conditions, such as changing ambient air temperature for air-cooled plants, declining brine flows, temperatures or steam pressures. The initial research is focusing on binary plants. Analyses have shown that cycle irreversibility associated with turbine performance and parasitic losses has large impact on plant performance at off-design conditions. This argues for very careful design and operation of the plant. Actions and technologies are being defined that allow parasitics to be managed and that increase the operational flexibility to allow load following. The research is identifying methods of minimizing turbine irreversibility. The engineering analysis is being extended to steam plants. REMOVAL OF NON-CONDENSABLE GASES FROM BINARY POWER PLANTS
Charles Mohr of INEEL has a project to enhance the efficiency and improve the operations of organic working fluid binary power plants by using selectively permeable membranes for low energy removal of non-condensable gases from the working fluids. Currently used removal techniques include refrigeration techniques that are both equipment and energy intensive. Several types of membranes are being considered, including those that selectively pass gases such as nitrogen and oxygen while retaining hydrocarbons, and those that selectively pass the hydrocarbons while retaining the air constituents. This project has been piloted in the laboratory and is currently under field test at the Steamboat Plant operated by Advanced Thermal Systems near Reno, NV. The technique shows significant promise and the suppliers of geothermal binary power plants are beginning to consider widespread use in new plants and retrofit of the equipment to existing plants. SILICA AND METALS EXTRACTION
Researchers Mow Lin of BNL and William Bourcier of LLNL have complementary projects on the removal and recovery of minerals such as silica, and metals such as lithium from geothermal brines. The objective is to produce a valuable by-product that will give rise to another revenue stream for the plant, in effect reducing the cost of the produced electricity. The industrial partners are Caithness Corporation working with Mow Lin at the Dixie Valley, NV plant; and CalEnergy and Mammoth Pacific working with William Bourcier at their Salton Sea and Mammoth Lakes plants in California. Precipitated silica is potentially a valuable by-product. Silica removal also minimizes scaling in surface facilities and during reinjection. A large demand currently exists for precipitated silica that can be used as rubber additives, desiccants, polishing compounds, paint and cement additives, odor control products, materials handling agents, and in insulation and filtration products. Researchers are learning how to produce silica from geothermal brines with the right properties for these applications. These projects are currently in the field piloting stage. The best example of a metals recovery is that of CalEnergy with the recovery of zinc at their Salton Sea Plant. The research by Mow Lin was recognized by an R&D-100 award in 2001.
Small-Scale Geothermal Power Plant -Field Verification Projects
DOE is examining the economics and performance of relatively small geothermal power plants, typically of the size of about 1 MW(e). There are objectives of investigating both innovative cycles and significant enhancements to existing cycles. One project, managed by Keith Bennett of DOE, is the construction of a 1 MW Kalina plant at
65

AmeriCulture in Lordsburg, NM. The Kalina cycle uses an ammonia-water working fluid to allow closer approaches to equilibrium and higher efficiencies than a cycle that uses a single working fluid. The industrial partner is Exergy, Inc. The status of this project is that the environmental assessment has been completed and the plant design is underway. A substantial fraction of the electricity will be used by AmeriCulture in their fish hatchery that will also use the brine for thermal heating.
Another project is a mixed hydrocarbon working fluid binary plant to be built at Empire Farms in Empire, NV. Charles Kutscher of NREL manages the project and the industrial partner is Empire Farms, Inc. The environmental assessment has been completed for this plant and the plant is in the design stage. GeoPowering the West Summary
As with any green energy form that is competing with conventional fossil fuels, it is
important to communicate to the public, to potential users and to potential suppliers the very positive benefits of using geothermal energy. GeoPowering the West is a grass-roots educational outreach to catalyze the increased use of geothermal energy, both as electricity and as heat. Goals are to:
• Double the number of states, from 4 to 8, with geothermal electric power production
facilities; and • Supply the electrical power or heat of 7 million homes and businesses in the U.S. by
2015.
The agencies of the U.S. government are the largest energy users within the Country; so one attempt is to aggregate the Federal load to provide opportunities for implementation of environmentally beneficial and sustainable energy forms such as geothermal energy. Another major effort is to identify and encourage removal of barriers to use of geothermal energy. This is especially important in geothermal resource rich states such as Nevada where about 86% of the land is publicly owned. DOE is working with the Department of the Interior (DOI) to ease access to public lands managed through the Bureau of Land Management and with the U.S. Department of Agriculture for lands managed by the U.S. Forestry Service.
The primary mechanism of GeoPowering the West is to accomplish objectives through state and local outreach groups. The tools of the outreach groups are resource maps, publications and special efforts to involve entities such as Native Americans. The state working groups can draw resources from DOE and its national laboratories, while interfacing directly with potential geothermal energy suppliers and potential users to encourage increased application of geothermal energy. Gerry Nix is a chemical engineer by training, and manages the NREL Geothermal Energy Program with emphasis on Energy Systems Research and Testing. He has more than 30 years of experience in industry and in federally funded research and development. Gerry spent 11 years with DuPont in research, development, and consulting, and has been with NREL for 22 years in renewable energy research and development. He has a professional engineering degree in petroleum-refining engineering from the Colorado School of Mines and a Ph.D. in chemical engineering from the University of Minnesota.
66

(8) GEOTHERMAL DRILLING R&D OVERVIEW Ed Hoover and John Finger, Sandia National Laboratories, Albuquerque, NM 87185-
1033, USA ABSTRACT
Drilling is a critical element of the entire life-cycle of geothermal development: exploration, production, injection, and well maintenance. The cost of drilling, logging, and completing geothermal wells is high compared to that of oil and gas because the rock is typically very hard, formations are highly fractured, and the temperatures encountered are very high. Because these costs often account for more than half of the total capital required for a geothermal power project, reductions in the cost of drilling and completing wells can have a very large impact on a project's overall commercial viability. Some of the techniques for reducing these costs include drilling faster, experiencing less idle time, increasing bit or tool life, achieving higher overall success rates, and producing more per-well via the use of multi-laterals. The mission of DOE’s geothermal drilling program is to develop cost-cutting technologies for accessing geothermal resources. The development of high-temperature instrumentation, lost circulation technology, hard-rock drill bit technology, and advanced drilling systems are all directed toward achieving this goal. Some of the technologies developed include improved PDC bits, "Dewarless" high temperature instrumentation, slimhole drilling, polyurethane grout for lost circulation, acid-resistant cement, acoustic telemetry, and diagnosis-while-drilling (DWD). Introduction
Geothermal drilling uses the same basic elements as land-based oil and gas drilling – rotary drill rigs, blowout preventers, drill strings and drill bits – but geothermal resources are found in formations that are much more difficult to drill than those typical of the hydrocarbon industry. Geothermal rocks are typically very hard, fractured, and abrasive; formations are under-pressured and often contain corrosive fluids; hole diameters are large compared to oil and gas; and the drilling environment is often extremely hot and corrosive. Oil and gas drilling technology is supported by a vast service industry because the target resources are very valuable and wide spread. Conversely, geothermal fluids (hot water and/or steam) have lower unit value and require unique tools not needed to access hydrocarbon resources. Because of the limited "market pull," there is little commercial motivation for the oil and gas service industry to develop the technology required to more efficiently drill the hard, hot geothermal formations. The Department of Energy (DOE) Geothermal Program is structured to address these shortcomings and spur research and development in a variety of areas pertaining to the reduction of drilling costs. R&D Program The DOE's overall objective for the geothermal drilling program is to develop cost-cutting technologies for accessing geothermal resources in order to reduce the high up-front costs associated with drilling exploration and production wells and reduce the perceived financial risk associated with the development of new geothermal resources. The program's goal is to reduce geothermal drilling cost by an average of 25 to 50% by the year 2008. Figure 1 shows current drilling costs for domestic geothermal sites, illustrating the average cost and variability, largely due to formation differences at the various sites.
67

Figure 1 - Well Costs for Various Geothermal Reservoirs.
A reduction of geothermal well construction costs requires a multi-faceted program with a focus on both near term, incremental improvements of conventional drilling elements as well as long term, revolutionary improvements. The five primary areas of research and development are described in more detail below. High Temperature Instrumentation - Downhole measurements are commonly required during drilling operations as well as during reservoir evaluation after the well is drilled and completed. Conventional electronic components, however, require protection from the intense heat encountered in geothermal environments. This is especially true for geothermal drilling operations where temperatures can exceed 300°C. A Dewar, or vacuum flask, that encloses the circuit boards, has traditionally provided protection against heat for short periods of time. This protection is inadequate, however, because eventually the inside of the flask will heat up and necessitate the withdrawal of the tool from the hole in order to avoid catastrophic failure. DOE is currently working with industry to commercialize the high temperature electronic components required for inherently temperature-hard tools. Some of the components being developed and characterized by DOE include capacitors, resistors, DC-DC power converters, pressure sensors, inclinometers, Silicon-on-Insulator (SOI) active devices, and batteries. For example, Honeywell now offers a custom SOI Application Specific Integrated Circuit (ASIC) that downhole tool manufacturers can utilize to build a geothermal drilling and/or logging tools. To further accelerate the pace of development, DOE also develops and demonstrates special purpose tools that are aimed at developing confidence in these new technologies. The performance of a completely "Dewarless" pressure-temperature tool is shown in Figure 2.
68
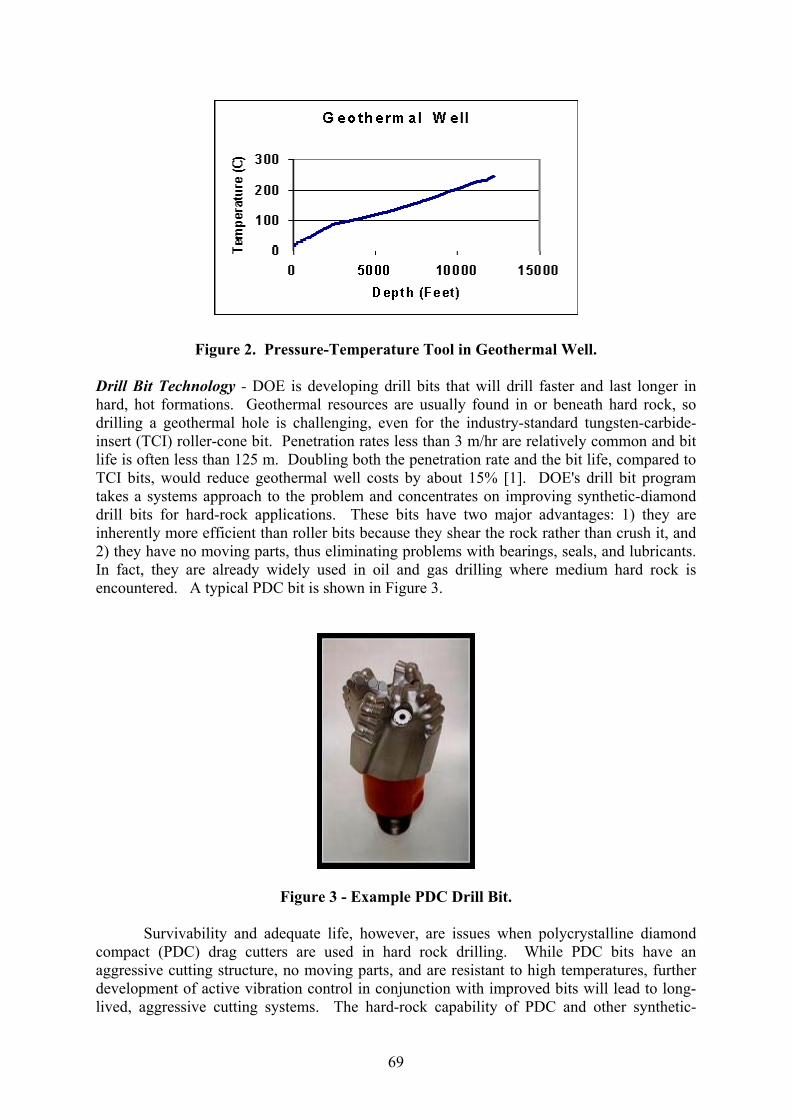
Figure 2. Pressure-Temperature Tool in Geothermal Well. Drill Bit Technology - DOE is developing drill bits that will drill faster and last longer in hard, hot formations. Geothermal resources are usually found in or beneath hard rock, so drilling a geothermal hole is challenging, even for the industry-standard tungsten-carbide-insert (TCI) roller-cone bit. Penetration rates less than 3 m/hr are relatively common and bit life is often less than 125 m. Doubling both the penetration rate and the bit life, compared to TCI bits, would reduce geothermal well costs by about 15% [1]. DOE's drill bit program takes a systems approach to the problem and concentrates on improving synthetic-diamond drill bits for hard-rock applications. These bits have two major advantages: 1) they are inherently more efficient than roller bits because they shear the rock rather than crush it, and 2) they have no moving parts, thus eliminating problems with bearings, seals, and lubricants. In fact, they are already widely used in oil and gas drilling where medium hard rock is encountered. A typical PDC bit is shown in Figure 3.
Figure 3 - Example PDC Drill Bit.
Survivability and adequate life, however, are issues when polycrystalline diamond compact (PDC) drag cutters are used in hard rock drilling. While PDC bits have an aggressive cutting structure, no moving parts, and are resistant to high temperatures, further development of active vibration control in conjunction with improved bits will lead to long-lived, aggressive cutting systems. The hard-rock capability of PDC and other synthetic-
69

diamond drag bits has been steadily improving over the years, and the DOE program is striving to accelerate the pace of development.
DOE's hard rock drill bit research is focused on PDC cutter wear mechanisms and materials, characterization and control of self-induced PDC bit vibration, mudjet augmented PDC bits, and full-scale PDC bit test and evaluation. One of the key facilities at Sandia used to support this work is shown in Figure 4.
Figure 4 - Hard Rock Drill Facility at Sandia Labs Wellbore Integrity - Lost circulation, characteristic of the fractured, under-pressured formations where geothermal fluids are found, accounts for about 15% of the cost of the average geothermal well. DOE’s rolling float meter (RFM) accurately measures outflow or mud returns, giving much faster indication of a fluid loss or a "kick.” This technology has been transferred to industry. Historically, lost circulation treatment for geothermal wells has relied almost entirely on cement, but DOE has developed two major devices for quickly sealing loss zones: 1) a drillable straddle packer, which is inflated with cement in a loss zone, thus ensuring accurate placement of the plug, and 2) polyurethane foam, which is placed in a loss zone by drill-pipe-conveyed tubing. In a 2001 field test, polyurethane foam enabled resumption of drilling in a well that had been abandoned after 24 cement plugs failed to cure the lost circulation. New tools and materials for reliably detecting and plugging lost zones in geothermal wells are needed to keep drilling costs to a minimum. Advanced Drilling Systems - Advanced control systems based on real-time data are required to reduce drilling and exploration costs. Real-time controls will enable improvements in other aspects of drilling such as bits, vibration control, geo-steering, etc. and can ultimately contribute to large reductions in drilling costs via large improvements in decision making. Development of this type of real-time "smart" drilling technology has the potential to make a revolutionary improvement in future drilling operations. This capability will ultimately allow the driller to determine whether he is operating at optimum performance, whether a problem is immediate or imminent, and whether the drilling hardware is in good condition.
Diagnostics-while-Drilling (DWD) is a longer-term effort aimed at revolutionizing geothermal drilling through development and commercialization of modern drilling control systems based on high-speed data telemetry from the bit to the surface and vice-versa. While the Diagnostics-while-Drilling (DWD) effort was kicked-off as a separate and distinct activity in FY00, it is closely linked to several other elements of the overall program. For example, DWD will help realize the benefits of polycrystalline diamond compact (PDC) bits for drilling hard geothermal formations. The hard-rock drill bit technology program area is developing the understanding of chatter dynamics that result in PDC bit damage. DWD will
70

be used to control downhole dynamics to avoid those damaging conditions. Likewise, the lost-circulation and high-temperature instrumentation areas each has an important relationship to the DWD program. The prototype DWD system was successfully demonstrated under actual field drilling conditions at GRI/Catoosa facility near Tulsa, OK in August 2002. A real-time data rate of 200,000 bits/s allowed the driller to "see" what was actually happening downhole and make the appropriate adjustment in surface controlled drilling parameters in real-time. Additional tests are planned for FY03 using a number of different "hard-rock" PDC bits. Near-Term Technology - This element of the program focuses on assisting industry in the development of near-term technologies for reducing geothermal drilling costs through cost-shared projects, field testing and technology transfer. The current emphasis is on specialized cements and grouts to improve the long-term stability of geothermal wells, especially for more acidic formations. Cement around casing in geothermal wells is subject to degradation from a combination of high temperature, thermal cycling, and exposure to carbon dioxide. Because poor cement quality can lead to casing failure, consequences of this degradation can be disastrous. DOE's Brookhaven Lab has developed a high-performance, environmentally friendly cement for geothermal well casings. This cement, commercialized by Halliburton under the name ThermaLock, is made mostly of recycled fly ash and has an estimated life of twenty years in geothermal conditions, compared to approximately one year for standard cements. Summary Choosing the proper metric for technical performance is not straightforward. Cost-per-foot is a very common measure, but it is defective for two major reasons: drilling costs are extremely variable by area (see Figure 1) so that comparing costs in the Geysers and in the Imperial Valley is not realistic, and drilling cost is affected by many factors unrelated to technology. Drilling actually tracks the price of crude oil very closely because as energy prices rise, it becomes viable to drill deeper, more expensive wells. A way of normalizing this cost while accounting for inflation is to compare the cost of drilling a geothermal well with a similar (depth and location) oil well. Figure 5 shows that over the twenty-year period 1980-2000, technology improvements have lowered the cost of geothermal wells from approximately 1.75 times to 1.4 times that of an oil well. Technology improvements have also worked to lower the cost of oil and gas drilling.
71

Figure 5 - Geothermal Drilling Cost Compared to Oil and Gas Drilling Some of the science and technology related breakthroughs associated with this program
including PDC bits, RFM, polyurethane foam, acoustic telemetry, HT electronics, slimhole drilling demonstrations, insulated drill pipe, and improved cement. In addition, some of the historical highlights associated with the Geothermal Drilling Research Program are shown in Table 1.
Polycrystalline Diamond Compact (PDC) bits are probably the single most important success story of geothermal drilling research. General Electric (developer of the synthetic-diamond process) had made an attempt to apply the PDC concept to drilling, but early attempts were successful only in the softest rocks. DOE was instrumental in broadening this technology’s application to the point that PDC bits are used for one-third of oil and gas drilling and represent a $200+million/year market in the U.S. PDC bits hold all the major bit-performance records (e.g., 55,000 m drilled with one bit, rate-of-penetration > 670 m/hour) and are especially useful in high-cost drilling because of their ability to reduce time spent drilling. An independent study of technology impacts (S. Falcone, “Technology Transfer Impact Profiles”, School of Public Administration, University of New Mexico, November 1995) estimated a benefit-to-cost ratio for this research of 125:1, demonstrating extraordinary payback to the nation for DOE’s investment.
In addition to the wide spread use of PDC bits within the drilling community today, a rolling float meter has been made commercially available, ThermaLock cement enjoys wide spread use within the industry, high-temperature SOI electronics are commercially available, acoustic telemetry technology has been licensed to industry; insulated drill pipe and LEAMS are commercially available, most of the elements to deploy polyurethane foam for lost circulation purposes are commercially available, and slimhole drilling is now common practice for exploration within the geothermal industry.
The single most important barrier to commercialization and deployment is the small size of the geothermal industry. The number of geothermal wells drilled each year is less than 0.1% of the number of oil and gas wells, so it is clear that manufacturers and service companies can quickly identify their market. There are three factors that may mitigate this problem: (1) because geothermal problems are often more difficult that oil and gas problems, hardware developed and tested for geothermal use is sometimes considered “premium” grade, and therefore more reliable, for other drilling, (2) rising energy prices may expand the geothermal market – there is already some evidence of this in California and Nevada, and (3) deep gas drilling now regularly encounters hard rock and temperatures above 225OC, so this may be a new market for what were previously considered “geothermal” tools.
72

TABLE 1 - HISTORICAL R&D HIGHLIGHTS
DATE ACTION OUTCOME
1978 Begin development of high-temperature electronics
Development of heat-shielded electronics for borehole televiewer and other logging tools. Change in emphasis to memory tools as temperature requirements increase. Development of silicon-on-insulator (SOI) technology allows indefinite operation at 300OC without heat-shield.
1978 Evaluate feasibility of PDC for drilling SNL instrumental in bringing GE synthetic diamond technology to drilling applications. Performance in hard rock is improving. PDC bits are $200M+/year industry.
1979 Investigation of high-temperature drilling fluids
Dramatically improved understanding of high-temperature mud chemistry. Developed high-temperature drilling mud, commercialized by Baroid.
1979 Initiated analytic and experimental support of PDC bit development
Supported field and laboratory experiments of various manufacturers’ bits. Developed PDCWEAR code for cutter layout and bit profile. Analytic and experimental support of improved cutter materials and designs.
1983 Initiated Lost Circulation Material (LCM) evaluation
Many LCMs evaluated and qualified for use at high temperature, but this program de-emphasized when the large, fractured nature of most geothermal lost circulation became better understood.
1988 Initiated evaluation of lost circulation instrumentation
Rolling-float-meter (RFM) developed to accurately measure outflow; this tool now commercially available. Qualified acoustic flow meters (Doppler, transit-time) for accurate inflow measurement.
1988 Initiated development of acoustic telemetry
Principle demonstrated by analysis and field/laboratory, experiments. Technology licensed to industry. Acoustic MWD tool under construction.
1997 Workshops to define requirements for revolutionary drilling improvement
Decision to focus on high-speed, real-time, downhole data. Development of Diagnostics-While-Drilling (DWD) concept. DWD prototype under construction.
2001 Development of Lost Circulation remedies Have demonstrated drillable straddle packer in the laboratory and full-scale experiments. Successfully demonstrated polyurethane foam to enable resumption of development at Rye Patch NV.
Reference [1]. D. Glowka, "The Role of R&D in Geothermal Drilling Cost Reduction," Geothermal
Resources Council Transactions, Vol. 21, 1997, pp. 405-410. Ed Hoover joined Sandia National Laboratories in 1978 and has managed the Geothermal Research Department for the past year. Prior to assuming responsibility for the geothermal program at Sandia, he was been involved in a variety of different technical projects including renewable energy analysis, geothermal drilling, systems research, nuclear weapon safeguards and security, and advanced military systems. Sandia's geothermal program includes research on drilling technology, high temperature instrumentation and downhole tools, as well as geothermal exploration techniques. He holds a BS in Nuclear Engineering from the Kansas State University and an MS in Mechanical Engineering from Colorado State University.
73

(9) UPDATE ON THE GEYSERS, AND OTHER GEOTHERMAL OPPORTUNITIES Karl Urbank, Vice President, Technical Services, Calpine Corp, Middleton, CA, USA
First, the History of Calpine’s role in The Geysers geothermal field is discussed.
Then, an update on the status of The Geysers including recent upgrades and future plans are reviewed. Then geothermal energy’s role in U.S. and world power industries is discussed.
74
Calpine’s Role Leading Independent Power Producer North American Focus Significant Development Program Proven Track Record Selected International Market Opportunities
A Vertically Integrated Power Generation Organization
3,593 Professionals in 100 Locations
Calpine Environmental Performance Characteristics of Geothermal Power Generation Geothermal Fields Geothermal Contribution
• 2,200 MW in U.S. - 8,000 MW Worldwide • The Geysers Produces 2/5 of U.S. Geothermal Generation
CO2 Emissions Comparison Benefits of Geothermal Power
Renewable and Sustainable Generates Continuous, Reliable Baseload Power Conserves Fossil Fuels and Contributes to Diversity in Energy Sources Reduces Dependence on Imported Fuels
Challenges of New Geothermal Power
• Cost and Risk of Exploration for Resource • Fuel Source is Bought Up Front for Life of Plant • Long Tap Lines to Existing Transmission
The Geysers
Generating Electricity Since 1960 21 Power Plants 425 Production Wells, 53 Injection Wells, and Capacity to Generate About 930 MW 30 Square Miles in Lake and Sonoma Counties
Calpine’s Geothermal Operations The Geysers Geothermal Field Geysers Power Plant Geysers Production and Injection History
75

Calpine Unit Areas Total Keys to Sustainability
Improve Energy Conversion Efficiency Drill for New Steam Recharge the Reservoir Reduce Operating Costs
Geysers Sustainability Projects
Optimize Turbine Steam Paths Optimize Gas Removal Systems Increase Hydrogen Sulfide Abatement Capacity Add Steam Pipeline Interconnections Drill for New Steam Optimize Injection Allocation Supplement Injection Sources
Successes to Date
Since the 1999 consolidation of The Geysers, Calpine has added 92 MW of additional
capacity through investments in the plants and steamfield. Future Plans at The Geysers
Continue with Turbine and Gas Removal System Optimization Increase Amount of Water Import from Santa Rosa Test Capability to Drill Deeper Injection Wells into Higher Temperature Areas
Outside the Geysers Glass Mounting –Medicine Lake
• Largest Known Undeveloped Geothermal Resource in the United States
Glass Mountain Location Map Glass Mountain KGRA
76
• 1971 - Designated by US Geological Survey (USGS) • 1980s - Resource leased & explored • 1990s - Permit applications filed initiating environmental review • 2000 - Environmental Impact Statement/Report for Fourmile Hill approved by
USFS, BLM and Siskiyou County • 2001 - CalEnergy leases purchased by Calpine, including Telephone Flat project • 2002 - Confirmation drilling & testing commenced by Calpine
Current Geothermal Contribution
2,200 MW in U.S.
Recommendations to Promote Growth of Geothermal
Support Production Tax Credits & Renewable Portfolio Standard Improve Processing of Lease & Permit Applications Characterize Geothermal Development Impacts in Advance Support Advanced Technologies through Research Support Development through Power Purchase Agreements
Karl Urbank is Vice President – Technical Services for Calpine Corporation’s geothermal operations. He is responsible for the engineering, permitting, environmental compliance and health and safety functions at The Geysers and for geothermal development projects outside The Geysers. Mr. Urbank has worked at The Geysers since 1982 in various engineering and management roles. During this period he has participated in the financing, permitting, design, construction and operation of geothermal and gas-fired power generation facilities and their associated pipelines and transmission lines. Prior to 1982, Mr. Urbank worked for San Diego Gas and Electric on the development of techniques to economically produce power from the highly saline geothermal fluids in the Imperial Valley of California. Mr. Urbank has a Bachelor of Science degree in Mechanical Engineering from Cal Poly, San Luis Obispo and is a registered professional engineer in California.
77

(10) LARGE SCALE, PRIVATE SECTOR GEOTHERMAL POWER DEVELOPMENT IN SE ASIA
Kenneth H. Williamson, Unocal Corporation, Santa Rosa, CA 95401, USA Introduction
Seventy-five percent of the 8 GWe worldwide installed geothermal power capacity[1] is produced from twenty geothermal fields with more than 100 MWe of installed generating capacity (Figure 1). Eight geothermal fields have more than 300 MWe and three of these were developed by Unocal Corporation in South East Asia (Figure 2). Unocal also operates a 110 MWe field at Wayang Windu, Java, Indonesia, and two other large fields [2] have been discovered and await development in Sarulla, North Sumatra. The main features and resource issues that developed in the three largest fields during their years of operation are described below. The main resource characteristics of the fields at startup are shown in Table 1. Geothermal energy represents 15% and 2% of the installed generation base in the Philippines and Indonesia respectively (Table 2).
A cost issue peculiar to power projects using geothermal energy is that drilling wells can be considered analogous to buying fuel, so effectively ten or more year’s worth of “fuel” needs to be purchased in advance so the plant can be fully loaded at startup. As drilling and generating technologies improve and exploitation costs continue to be reduced, more of the geothermal resource base worldwide will become economic to develop [3]. A significant advantage for geothermal developers is emerging as the carbon credit marketplace forms, since plants using geothermal power typically produce an order of magnitude less CO2 than fossil-fueled power plants. Salak, Indonesia
The Salak Field, Indonesia [4] began generation of 110 MWe in early 1994 and was expanded to 330 MWe in 1997. A total of 14 TWh have been generated from Salak to date. To generate that amount of energy, a coal plant would have had to release 11,000 tonnes of CO2 into the atmosphere. Carbon credits totaling 4,000 tonnes were sold to the World Economic Forum in 2002 from the Salak Field.
The field (Figure 3) is located on the western flank of Mount Salak, 60 kilometers south of Jakarta, West Java, Indonesia. Unocal has explored and operated the field since 1982 under a joint operating contract with the Indonesian National Oil Company (Pertamina). Resource temperatures range from 225°C to 311°C, and the known reservoir area is 17 km². The fluid is a neutral pH sodium chloride brine, with dissolved solid content of 1.3 wt % and a dissolved gas content of 0.1 - 0.4 wt % mostly comprising carbon dioxide. In response to production, a steam cap formed in the eastern part of the reservoir.
Steam and electricity are both sold under contract to the Indonesian Electric Utility (PLN). Units 1, 2 & 3, comprised of three 55 MWe Ansaldo turbine generators, are operated by PLN using steam supplied by Unocal. Units 4, 5 & 6, comprised of three 55 MWe Fuji turbine generators, are operated by Unocal and the electricity generated is sold to PLN.
The field has performed as expected since the 220 MWe expansion in 1997 with no makeup steam production wells required until 2003 (Figure 4). An injection well used during 1994 - 1997, which caused cooling at nearby production wells, was shut in and later converted successfully to a producer.
78

MakBan, Philippines
The MakBan field [5] is situated 70 km southeast of Manila, on the Philippine island of Luzon. Unocal has explored and operated the field under a contract with the Philippine National Power Company (NPC). Operation began at 110 MWe in 1979, and the field capacity was expanded to 330 MWe by 1984 and again to 426 MWe by 1996.
The reservoir (Figure 5) was initially liquid-dominated with temperatures between 250°C and 330°C, and the production area is about 7 km² and roughly circular in shape. The reservoir fluid at MakBan is neutral-pH sodium chloride brine with an average of 0.7 wt% total dissolved solids and 0.4 wt% non-condensable gas.
The wells supply steam and brine to NPC who operate the power plants, with a combined installed capacity of 426 MWe. Plant A, with two 55 MWe steam turbine units, was completed and commissioned in 1979. Plant B followed in 1980 and then Plant C in 1984, both with two 55 MWe turbine units. Plants D and E, each with two 20 MWe turbine units, were commissioned in 1995-6. In addition, three binary units utilizing hot brine are operating with a combined capacity of 16 MWe (Figure 5).
Exploitation caused widespread boiling in the reservoir and steam production decline rates have been relatively low. Other responses to exploitation include injection fluid return, migration of marginal fluids into the production area, and influx of surface waters into the upper portion of the reservoir. Observed cooling in the western part of the production area prompted a change in the injection strategy. Several injectors were shut in and the brine was piped to new injectors farther west in 1992, correcting the problem. The shut-in injectors were subsequently converted to production. Tiwi, Philippines
The Tiwi field [6] is located in southern Luzon, near the city of Legaspi, on the northeastern flank of Mt. Malinao (Figure 6). The Philippine Commission on Volcanology discovered steam in a shallow well in 1968. Unocal began exploring in 1972 and committed to the first 110 MWe power plant in 1974. Tiwi started production of electricity at 110 MWe in 1979 and was subsequently expanded to 330 MWe in 1982.
The reservoir temperature ranges from 235-310°C, and the neutral pH sodium chloride brine has 1% total dissolved solids and 0.7% non-condensable gases. Prior to exploitation, Tiwi was a liquid reservoir locally overlain by a shallow steam cap. Corrosive acid-sulfate-chloride water occurs in isolated aquifers along the southwestern margin and eastern sector of the reservoir of otherwise neutral pH fluid. Fluid withdrawal and the resultant pressure decrease formed a broad two-phase zone throughout the reservoir. By early 1987, cold water influx into the eastern margin of the field had quenched or reduced steam output in 49 of the 125 production wells. Steam declines were mitigated by drilling in the western sector, by well workovers and acid stimulations, and by improvements in the steam gathering system.
Conclusions
In SE Asia, Unocal has successfully developed 3 fields larger than 330 MWe, two of
which have been producing power for 23 years and the third for 8 years. During the past 23 years, resource-related production problems developed and were solved: injection breakthrough in the case of MakBan, by shifting injectors further from production; enthalpy degradation due to cold aquifer influx in the case of Tiwi by developing a western extension of the field.
79
A total of 94 TWh have been generated to date from Salak, MakBan and Tiwi, and this has displaced fossil generation which would have caused 76 million tonnes of CO2 emissions into the atmosphere. Exploration by Unocal has delineated another 400 MWe in the Sarulla block in Indonesia, ready for development once pricing, financial and legal issues have been resolved.
Indonesia in particular has an abundance of untapped geothermal resources. The Government of Indonesia[7] estimates the geothermal resource potential of their country at approximately 20 GWe, more than twenty-five times the current installed capacity. REFERENCES [1] G.W.Huttrer, "The status of world geothermal power generation 1995-2000.", Proceedings World Geothermal Congress 2000, Kyushu - Tohoku, Japan, May 28 - June 10, 2000 PP 23-37, 2000. [2] R. P. Gunderson, N. Ganefianto, K.L.Riedel, L. Sirad-Azwar, S. Suleiman, " Exploration results in the Sarulla Block, North Sumatra, Indonesia", Proceedings World Geothermal Congress 2000, Kyushu - Tohoku, Japan, May 28 - June 10, 2000 PP 1183 - 1188, 2000. [3] K.H.Williamson, R.P.Gunderson, G.M.Hamblin, D.L.Gallup, K.Kitz, "Geothermal Power Technology", Proc. IEEE vol. 89, no.12, pp 1783-1792, 2001. [4] R. Soeparjadi, G. Horton and B. Wendt, " A review of the Gunung Salak geothermal expansion project", The 20th New Zealand Geothermal Workshop 11-13 November, 1998. [5] W.C. Clemente, F.L. Villadolid-Abrigo, "The Bulalo geothermal field, Philippines: reservoir characteristics and response to production", Geothermics Volume 22 Pages 381-394 ,1993. [6] D. T. Gambill, D.B. Beraquit, " Development history of the Tiwi geothermal field, Philippines", Geothermics, volume 22, pp 403-416, 1993. [7] Sayogi Sudarman, Suroto Kris Pudyastuti, Suhariyanto Aspiyo, "Geothermal Development Progress in Indonesia: Country Update 1995 - 2000", Proceedings World Geothermal Congress 2000, Kyushu - Tohoku, Japan, May 28 - June 10, 2000 pp 455-460, 2000.
Table 1. Resource Characteristics of Four Large Geothermal Fields Operated in SE Asia by Unocal Corporation
Field Name Plant size Temperature Dissolved Dissolved Productive MW °C Solids wt% Gases wt% Area km2 Salak 330 225 - 311 1.3 0.1 17 Wayang Windu 110 250 - 310 2.2 0.2 10 MakBan 426 250 - 330 0.7 0.4 7 Tiwi 330 235 - 310 1.0 0.7 18
80

Table 2. Electric Power Generation in the Philippines and Indonesia.
Philippines* Indonesia* Population (millions) 77 million 209 million Installed capacity (GW) 13 GW 38 GW+ Geothermal capacity (MW) 1,909 MW 765 MW * 2001 estimates + includes captive power Table shows population, total installed generating capacity, and installed geothermal generating capacity for each country.
The 20 named fields with installed capacity of greater than 100 MW represent about 6 GW, and two thirds of this comes from the US, the Philippines, and Mexico. Figure 1. Worldwide Distribution of Approximately 85 Geothermal Fields Developed for the Production of Electricity.
81

Sarulla fields are awaiting development. Figure 2. Geothermal Fields in SE Asia Operated by Unocal: MakBan 426 MW, Tiwi 330 MW, Salak 330 MW, Wayang Windu 110 MW.
From Lund 2001 High elevations are darker tones Figure 3 Map of the Salak Geothermal Project.
82

igure 4. Monthly Generation from the Salak Units Operated by Unocal 1997 - 2002. F
High elevations are lighter tones.
igure 5 Map of the MakBan Geothermal Project F
83

High elevations are lighter tones. Figure 6 Map of the Tiwi Geothermal Project Kenneth H. Williamson received a Ph.D. degree in geophysics from Imperial College, U.K. He then worked with the British Geological Survey for five years, carrying out geothermal research and exploration, mainly in the Caribbean and South Pacific. He joined Union Oil Company of California (Unocal), Santa, Rosa, CA, in 1981, where he has worked for 20 years on geothermal projects in the U.S., Latin America, Europe, and Asia. He is currently general Manager of Unocal's Geothermal Technology and Services Group.
84
(11) GEOTHERMAL POWER PLANT DESIGN: NOT ROCKET SCIENCE. BUT NOT A GAS TURBINE EITHER William E. Lewis, Power Engineers, Inc., Hailey, Idaho USA
Geothermal plant design is not really rocket science. It is not even like rocket science in difficulty or abstruseness if you have done it before and have managed to learn from the experience. However, geothermal engineering work is not gas turbine work either, and there are a number of engineering issues that are specifically relevant to power plants which use geothermal resources.
In the case of geothermal plants, the local resource essentially defines the power plant. The resource and its characteristics essentially force the selection of the technology and the sizing of the plant. In the geothermal world, we cannot have a plant that exceeds the energy supply available from the resource, at least in a long-term situation. And the intransigent nature of geothermal energy availability drives the technology selection because the plant designer must necessarily deal with the temperature, flow and constituents that emerge from the well. There is no way to change suppliers or order up a higher grade of fuel. So the geothermal plant engineer must fit the technology to the wild stuff likely to emerge from the well or pipe over the likely lifetime of the plant. TECHNOLOGIES IN COMMON USE
Briefly, the geothermal energy conversion technologies in practical use are: • Binary – For moderate and low temperature liquid dominated resources. Binary plants
typically pump the liquid through heat exchangers which transfer the energy to a secondary fluid which is vaporized and run through a turbine to generate power. A binary plant is very like a refrigerator running backwards.
• Dry Steam – With minor cleanup, directly use the reservoir steam in a steam turbine for power generation. This is the Geysers or Lardarello type of resource, the acme of geothermal potential. Unfortunately, this kind of geothermal resource is rare.
• Flash Plants – For moderate to high temperature liquid-dominated resources. Flash plants, a common kind of geothermal power plant, typically allow the liquid to flash to a two-phase liquid and vapor stream in the well-bore and then separate the steam and liquid at some point between the wells and the plant. The flash plant then uses the resulting steam to drive a steam turbine.
Differences Between Geothermal Plants of all Species and Gas Turbine Plants
The technology approaches noted above are proven for geothermal applications, but there are significant differences, in design practice, between geothermal plants and gas turbines.
The general component categories which comprise a geothermal power plant are as follows:
• Substation/interconnect line/interconnect station • The power plant itself • Production well(s) and gathering system • Injection well(s) and injection system
85

A geothermal plant will have a substation and some type of interconnect, a transmission line and interconnect station similar to any gas turbine or other power plant. A geothermal development will have the power plant which accomplishes the conversion of thermal energy into electrical energy – instead of from chemical energy, in the case of a fired plant. A geothermal plant’s “fuel source,” which is the production wells and gathering system, may be located right at the plant, especially if it is a small plant with one or two wells. But if it is a larger facility, chances are it will require fluid from numerous wells. Injection wells and the injection systems which feed them are common in geothermal power plants, but they are not used in every instance, especially for smaller plants. Plants which re-inject spent fluids usually do so to cleanly dispose of resource fluids and to help recharge the underground reservoir and avoid depletion. SUBSTATION CONSIDERATIONS
Most of the geothermal-specific engineering issues related to the substation – and to electrical distribution in general, for that matter – are due to ambient conditions. It is not uncommon to have low concentrations of hydrogen sulfide (H2S) in the air around geothermal power plants. Even if the plant itself has no emissions, geothermal plants are oftentimes located near natural geothermal manifestations such as hot springs which can result in ambient hydrogen sulfide.
Copper and its alloys, along with silver and cadmium, are very susceptible to corrosion by H2S and should be specifically excluded in all specifications for geothermal equipment exposed to the atmosphere. Typically, aluminum bus is used in the geothermal plant substation for this reason. Little things such as transformer drain valves can sneak into the supply chain even though the specification excludes them, so the vendor supply needs to be reviewed very carefully. Exposed copper for terminations should be tinned to protect it in the substation as well as elsewhere in the facility. The bushings may require a longer creep length, because many geothermal plants are located in areas with high ambient dust and/or contaminant loading. OUR SUBJECT HERE: FLASH PLANTS
Now we come to the power plant itself. Remember, the plant has to match the resource. Some of the issues addressed here are pertinent to any type of power plant, but as there are other papers on the Geysers dry steam resources and on binary plants being presented at this distinguished forum, this discussion which follows will focus on flash plant technologies.
On a per-megawatt basis, geothermal plants are typically physically larger than gas turbine plants. For a single-flash plant, the steam and liquid are only separated once and the resulting “moderate” pressure steam stream is sent to the turbine. In the case of a dual-flash plant, the plant flashes (or separates) the liquid twice, so the turbine is supplied with two separate streams: a high- pressure steam supply, and a low-pressure steam supply.
Pressure regimes in the geothermal world reveal another difference, compared to more conventional plants. High-pressure steam – in the geothermal world – is typically in the range of 100 to 150 psia, not 900 or 1,000+ psia as you would expect to see in the HP system of a gas turbine combined cycle plant or conventional fired steam plant. This makes everything bigger – piping, vessels, valves, etc. Because the volume of steam is higher and more mass is required to realize a given amount of energy, capital costs are much higher on a dollar per megawatt basis. As compensation, geothermal plants do have a very high availability and capacity factors. Recent reports on the Mindanao and Miravalles III flash plants gave availabilities in excess of 99%.
86
BASELOAD SUPERSTARS, BUT DUBIOUS PEAKERS
Unlike simple-cycle gas turbines, geothermal plants do not make good peakers. From a totally cold start, they are slow to start up due to all the large piping and equipment. In addition, they are supplied by wells which do not like to be started and stopped. Wells are quirky creatures. The wells may have several thousand feet of casing in the ground, so if they are regularly cycled between hot and cold, the well may be damaged or fail due to the contraction and expansion of the casing. Geothermal plants can be designed to allow the output to be varied somewhat to provide some degree of load following, but this practice can negatively impact the overall efficiency and capital cost of the plant. So a geothermal flash plant is happiest working in a baseload mode. SITING ISSUES
Considering siting issues, an engineer or owner looking to site a gas turbine looks for a site near a gas pipeline and a transmission line. A site that, the engineers and owners hope, has water to spare. But the siting criteria for a geothermal plant are different. A geothermal plant must be located near the resource as the hot fluids can not be piped any considerable distances without unacceptable heat losses. Now because a geothermal flash plant is not a full Rankine cycle (in a geothermal plant, the boiler is missing) and we are just taking the flash fraction off the liquid stream and running it through the turbine, we do not have to recycle the condensed steam back to the boiler. (There is no boiler.)
This means we can – and typically do – use the condensate as a supply for the cooling water system. Typically, wet systems are used for flash plants with a cooling tower with either a direct contact or surface condenser, and the condensate is used as the make-up for the cooling tower. NONCONDENSABLES AND GEOTHERMAL PRACTICE
Another difference between geothermal flash plants and gas turbine plants is that geothermal steam usually has higher noncondensable gas concentrations to deal with. The range of concentrations reported for geothermal steam spreads from something like a few tenths of a percent by mass to up to 2-3% or even somewhat higher. The noncondensable gas (NCG) contained in geothermal steam is primarily CO2 although it typically has H2S and small fractions of other gases. The high NCG content means that a geothermal flash plant will have a much larger and more complex gas extraction system than one would find in a typical gas turbine combined cycle plant where the noncondensables are primarily small quantities resulting from in-leakage.
Therefore, instead of the small, relatively inexpensive steam jet system you would see in a gas turbine combined cycle project, you have a large, expensive, multiple-stage system which commonly use two stages of jets followed by a vacuum pump or three stages of jets.
Material selection is problematic in geothermal NCG extraction system as, in addition to the carbon dioxide, H2S and other gases from the wells, there is often oxygen in-leakage due to the fact that the condenser is operating at a vacuum. Titanium has been used in this application but L grade (low carbon) stainless steels have provided good service.
H2S impacts the design of air conditioned spaces such as the control rooms and electrical rooms. The incoming air supply filter must be designed to remove the H2S to keep it out of the electrical and control elements.
87

Figure 1 illusstrates the Cerro Prieto IV facility, owned by Comisión Federal de Electricidad, of México. This large facility – 4 X 25 MW, Mitsubishi turbines, single-flash – located at the Cerro Prieto field near Mexicali. This is a large but comparatively simple flash plant with two-phase flow from the wells separated in separators outside the plant boundaries; the steam goes to the turbine, and the separator liquids are injected or disposed of.
Figure 1. Cerro Prieto IV 4x25MW Facility, Owned by Comisión Federal de Electricidad, of México. Production Wells and Gathering System
As we noted earlier, the resource supply effectively defines the plant. The technology, the enthalpy, chemistry, non-condensable gas content, the silica content – all these factors work to force the plant technology selection. Often this selection is obvious; sometimes, when the resource temperature falls within the intermediate ranges, the selection is not so obvious. The flash plant that is being discussed here would be applied to medium-enthalphy to high-enthalpy resources.
The heart of the production wells and gathering system design is founded upon a definition (or an assumption) of the wellfield and production fluid characteristics. Typically the resources people will drill the wells, test them and provide the resource data to the power plant people. Ideally, the gathering system and plant engineer begins with a full detailed assessment of the wellfield capacity and resource characteristics. Often, however, the gathering system and plant engineer has to work with a less highly evolved data set.
Once the engineer has the well data in hand, the first thing he or she would do is consider the flash points. Using a thermodynamic analysis which considers the resource and the applicable heat rejection conditions, the irreversibilities in the system are minimized. In our business we occasionally see people – especially those not familiar with the handling of liquid-dominated flash plant technology – doing odd things such as running vast numbers of
88

modeling and simulation runs to try and find the optimum flash points and thereby minimize the well flow while maximizing power plant output. In fact, we recently saw a requirement for this kind of multi-run analysis in a conceptual design specification issued by one of our clients in Costa Rica.
This is valiant work, but not necessary. In fact, if one knows the resource characteristics and the heat rejection conditions, the engineer can sit down (or even stand) and calculate the optimum flash points from the thermodynamic principles in a few minutes. So the time and cost of computer simulations are typically not required.
With a liquid-dominated resource for a flash plant, each production well typically supplies two-phase flow up out of the well. At this point a separator is used to separate the two phases. The emerging steam is supplied to the turbine and the emerging liquid is either routed for injection or disposal, or in the case of a dual-flash plant, is flashed again in another flash vessel/separator to produce low pressure steam for the LP turbine or turbine stage. The liquid emerging from this LP separator/flash vessel would be routed to injection for disposal.
After the optimum flash points are selected, other considerations such as potential for scaling due to silica must be addressed. This may force the selection of a single flash plant versus the more efficient dual-flash approach, to keep the waste brine at a higher temperature and silica at a lower concentration to avoid scaling in the injection system.
Next, for a two-phase flow system, engineering considerations for pressure drop and for maintaining the appropriate flow regime in the well and gathering system must be addressed. So what does two-phase flow look like in a geothermal well and gathering system? Typically we try to achieve a flow regime called “annular mist,” in which the liquid is dispersed around the outside wall of the pipe with steam and mist drops in the middle. In this regime, the flow is relatively stable and flowing with most of the steam inside the ring of liquid.
In this regime (there are other names for this regime, but “annular mist” is the one we like) the engineer can be less acutely concerned with problems with slugging or hammering the piping, which can occur in a system that is not designed appropriately. Now a significant problem with this is that maintaining this regime takes energy. Sufficient energy needs to be provided up front and then conserved throughout the gathering system piping so that this efficient flow regime can survive from the well to the separator without allowing the formation of slugs or hammers along the way, and without occasioning pressure drop and energy loss.
So the gathering system design needs to integrate the gathering system design with the well field pressure curves. Well pressure curves look somewhat like pump curves. (Surely you are familiar with those.) So as we decrease the wellhead pressure we expect to increase the flow out of that well. In geothermal practice, each well has its own characteristics. So in the project development process, the geothermal engineer fervently hopes that he or she gets resource and well curve data for several wells – or when dreams come true, real data on the full field – to use as the starting point to design the gathering system and the plant.
So in two-phase flow piping, maintaining the flow regime to avoid slugs and pipe hammering and to minimize pressure drop is a vital concern. The wise gathering system engineer will attempt to use the wellfield terrain to assist with gathering system design: in particular, with stress analysis, and with design and location of separators.
Piping design needs to take into account features which help reduce pressure drop and thereby conserve the efficient annual mist flow regime and also support and control the piping in handling stresses. Two-phase lines commonly use 45° elbows in loops and typically laterals coming into joints rather than 90° elbows and tees. One can use 90° elbows, but 45° degree elbows and laterals will avoid gratuitous pressure drop while at the same time provide an in-pipe environment more friendly to the desired flow regime. A 90° elbow configuration has a tendency to separate the fluids because of the higher mass of the liquid will separate out as it
89

goes around the curve, in a sort of centrifuge effect. By contrast, a 45° configuration involves shorter travel time around the curve, and separation is typically not so significant, and the liquid seems to readily re-disperse into an annular flow regime downstream from the elbow.
For large plants, geothermal wellfields can occupy large pieces of territory. If the wells are located a long distance from the plant, good design practice will dictate field separation to avoid long runs of two-phase piping. By this point, of course, the engineer has chosen the flash point pressures that are the optimum for the plant in question.
Now if it seems that two-phase supply will burn up too much pressure drop getting to the plant because the wells are a long way away, the wily geothermal engineer will design high-pressure separation in the field. After the two phases are separated, we can design the steam piping to be as large as we want and thereby minimize steam pressure drop, without concern for maintaining an efficient annular mist flow regime. (In two-phase line design, line size is a critical factor in conservation of the flow regime.) So field separation is often a controlling factor in reducing steam pressure drop and realizing optimized system performance.
The geothermal plant engineer also typically needs to consider well performance decline in her or his design. Geothermal fields change over time as resources flow out or are pumped out. Not surprisingly, new wells in a new resource are always expected to be better at first, and worse later. Resources decline, wells and underground formations scale up, etc. So our geothermal engineer wouldn’t want to design the system and plant for the absolute best case that exists right at the start of production. In the geothermal business, we typically try to optimize the plant systems for the expected life of the plant, using the resource engineers’ forecasts and educated guesses about the life cycle production profile for the resource.
This points out yet another area in which geothermal plant design differs strikingly from design practice for gas turbine plants. Natural gas is a highly engineered product whose characteristics are thoroughly known. The quality of gas arriving at a gas turbine plant site is predictable and dependable. The engineer knows exactly what is going to occur when the valve is opened, in terms of the heat content of the gas and how much pressure and how much is available. But in our geothermal plant we are dealing with a resource that can change. In addition, it almost certainly will change to some extent over the plant life. So optimizing the whole development for this changing resource supply is part of the geothermal engineer’s considerations in plant design. ANOTHER GEOTHERMAL ASPECT: PRE-PURCHASED FUEL
In the geothermal world, gathering and injection systems are a significant piece of total facility costs – maybe 30%-40%. (Typically, some portion of this outlay has to be made even before the project is a go, to confirm if the resources are even there. For this reason, financing geothermal developments is considered to be an extreme sport in banking circles.) So essentially what a geothermal plant owner is doing, when she or he is developing a wellfield and building a gathering system, is pre-purchasing the fuel for the plant lifetime. Yes, there are often residual royalties and other costs, and maintenance costs for the field, and often in-fill wells drilled and installed during the plant lifetime. So there are additional costs, but most of the “fuel” supply cost for a geothermal plant is paid for up front. This makes the capacity cost for a geothermal plant look high, but the tradeoff is potentially sweet: the geothermal plant – unlike its gas turbine cousins – is intrinsically and significantly hedged against fuel cost volatility.
A two-phase flow schematic for a 30MW plant gathering system is illustrated in Figure 2. In this system we elected to do part of the two-phase flow separation in the field for those wells located a long distance from the plant. We’ve elected to do this because at this location, the plant is located uphill at some distance from the wellfield. Steam passes uphill more
90
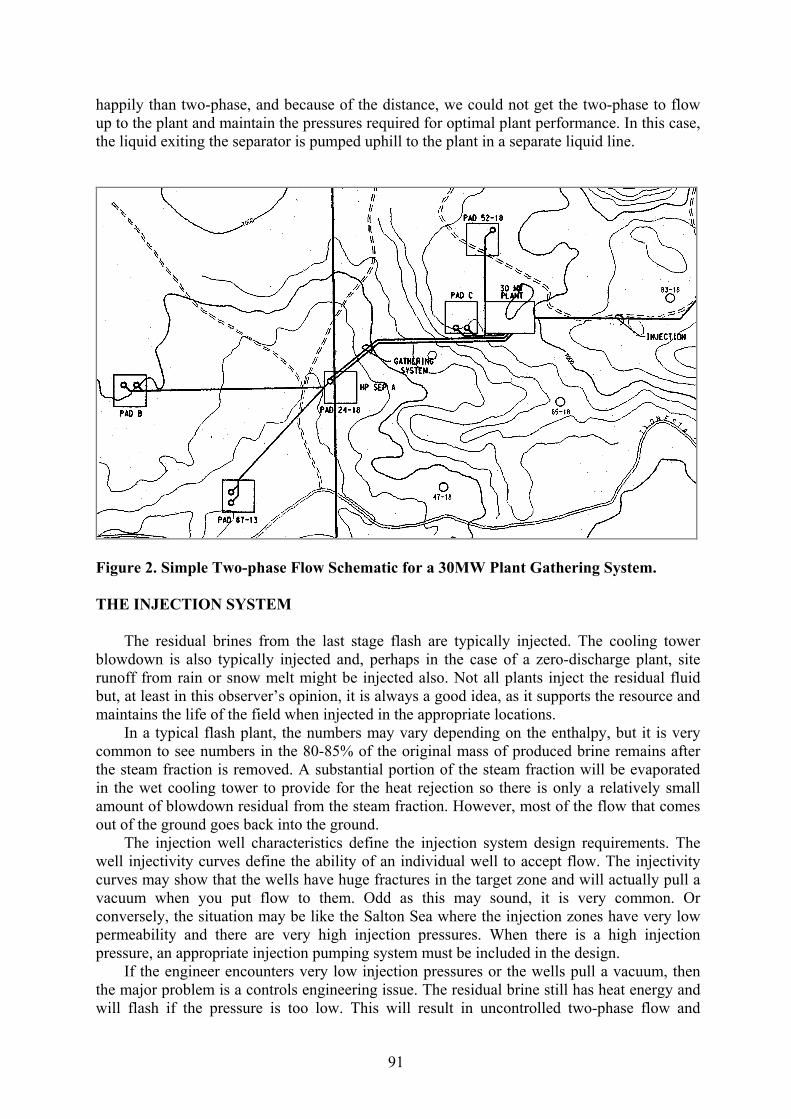
happily than two-phase, and because of the distance, we could not get the two-phase to flow up to the plant and maintain the pressures required for optimal plant performance. In this case, the liquid exiting the separator is pumped uphill to the plant in a separate liquid line.
Figure 2. Simple Two-phase Flow Schematic for a 30MW Plant Gathering System. THE INJECTION SYSTEM
The residual brines from the last stage flash are typically injected. The cooling tower blowdown is also typically injected and, perhaps in the case of a zero-discharge plant, site runoff from rain or snow melt might be injected also. Not all plants inject the residual fluid but, at least in this observer’s opinion, it is always a good idea, as it supports the resource and maintains the life of the field when injected in the appropriate locations.
In a typical flash plant, the numbers may vary depending on the enthalpy, but it is very common to see numbers in the 80-85% of the original mass of produced brine remains after the steam fraction is removed. A substantial portion of the steam fraction will be evaporated in the wet cooling tower to provide for the heat rejection so there is only a relatively small amount of blowdown residual from the steam fraction. However, most of the flow that comes out of the ground goes back into the ground.
The injection well characteristics define the injection system design requirements. The well injectivity curves define the ability of an individual well to accept flow. The injectivity curves may show that the wells have huge fractures in the target zone and will actually pull a vacuum when you put flow to them. Odd as this may sound, it is very common. Or conversely, the situation may be like the Salton Sea where the injection zones have very low permeability and there are very high injection pressures. When there is a high injection pressure, an appropriate injection pumping system must be included in the design.
If the engineer encounters very low injection pressures or the wells pull a vacuum, then the major problem is a controls engineering issue. The residual brine still has heat energy and will flash if the pressure is too low. This will result in uncontrolled two-phase flow and
91

potentially cause scaling and hammering of the injection pipeline. This can be addressed by including in the design an appropriate pressure control system at the injection well. SUMMARY • Although innovations continue, flash plants and other geothermal energy conversion
technologies are well proven. Design practice for the above-ground portion of geothermal plants has come a long way, as evidenced by the fact that the costs are similar or even less on a cost-per-MW basis than they were 20 some years ago when I first started in this business.
• Each geothermal plant is resource-specific. Each plant has to be designed to fit its resource. The plant’s capabilities and of course the contractual and environmental requirements also have to be considered.
• Geothermal plants are very high-capacity and high-availability generation plants. They are not the type of renewable resource where the consumer has to wait, MCC in hand, for the wind to blow or the sun to shine.
• Geothermal plants are environmentally friendly. They don’t require large amounts of space and have few or no emissions.
• The risk for geothermal plants is up-front in the resource. This is a major problem with geothermal development, since it costs a lot of money to find out if a resource exists of sufficient quality and durability to support a plant. Of course, the countervailing benefit is that once we have the plant in place, we have “pre-purchased” the fuel. We then have some measure of freedom; we are not subject to the variability – or even fears of variability – in gas price or gas availability that gas turbine plants face.
Bill Lewis, P.E., a chemical engineer and a principal at POWER Engineers, Inc., is one of the foremost geothermal power system engineers in the world. He has more than 22 years of study and design supervision experience in advanced geothermal system design – binary, flash systems and hybrid systems – and the development of innovative processes for scaling and corrosion control for geothermal applications. He is particularly skilled in cycle evaluation and design, equipment sizing, materials selection, and capital cost estimating for geothermal power systems. He is also an expert in the design of two-phase geothermal resource piping systems. His background includes work for many new plants and plant projects in Iceland, the Philippines, the Caribbean, Mexico, Guatemala and Chile, as well as all the major resource areas in the U.S.
He received a B.S. in Chemical Engineering from the University of Idaho in 1975, and is licensed as a professional engineer in the states of Idaho, Utah, Nevada, Wyoming, North Dakota, Oregon, California and Washington. His recent publications include: • “A Stream in the Desert: A DOE-Funded Design Study for Pioneer Baseload Application
of an Advanced Geothermal Binary Cycle at a Utility Plant in Western Utah,” Proceedings, World Renewable Energy Congress, 2002, and Transactions, Geothermal Resources Council, 2002.
• “Energy From Below: Economical, Reliable Geothermal Power,” Renewable Energy 2001, World Renewable Energy Network, pp. 135-138.
• “Report from the Field: A New Generation of Geothermal Turbine-Generator Plants for Baseload Utility Service,” Proceedings, World Renewable Energy Congress, 2000.
92

• “Mexico’s Growing Power Grid: A Working Laboratory for Geothermal Power Applications,” Proceedings, Latin America Power 2000 in Venezuela.
• “Terrestrial Fire: The Promise and the Prominence of Geothermal Power Generation in Latin America,” Proceedings, Latin America Power ’97, Caracas, Venezuela.
E N D of Panel Summaries
93

PANELIST CONTACT INFORMATION: (1) Valgardur Stefansson
Chief Project Manager Orkustofnun (National Energy Authority of Iceland) Grensasvegur 9 108 Reykjavik Iceland Tel: +354-569-6000 Fax: +354-568-8896 E-mail: [email protected]
(2) Arni Gunnarsson
Engineering and Construction Department Project Manager - Geothermal Power Generation Landsvirkjun (National Power Company of Iceland) Haaleitisbraut 68 103 Reykjavik Iceland.
E-mail: [email protected] Tel - +354-515 9171
Gsm - +354-824 7979 Fax - +354-515 9004
(3) Allan Jelacic (Jay Nathwani)
Geothermal Team Leader Office of Wind and Geothermal Technologies U.S. Department of Energy 1000 Independence Ave. SW Washington, DC 10585 USA Tel: 202-586-6054
Fax: 202-586-8185 E-mail: [email protected]
(3) Susan Norwood???
GeoPowering the West National Coordinator Office of Wind and Geothermal Technologies U.S. Department of Energy USA (202) 586-4779 E-mail: [email protected]
94

(4) Joel L. Renner Idaho National Engineering and Environmental Laboratory P.O. Box 1625 2525 Fremont Avenue Idaho Falls, ID 83415-3830 Tel: 208-526-9824 Fax.: 208-526-0969 E-mail: [email protected]@inel.gov
(5) R.Gordon Bloomquist, Ph.D.
Senior Scientist Washington State University Cooperative Extension Energy Program 925 Plum Street SE Town Square Building 4 P.O. Box 43165 Olympia, Washington 98504-3165
USA Tel: 360-956-2016 Fax: 360-956-2030 E-mail: [email protected]
(6) Daniel N Schochet
Vice President Ormat International Inc
+1 775 356 9029 E-mail: [email protected] (7) R. Gerald Nix, Ph.D.,P.E.
Manager, NREL Geothermal Project National Renewable Energy Laboratory
Golden Colorado USA
Tel: 303-384-7566 Fax: 303-384-7540 E-mail: [email protected]
(8) Ed Hoover
Geothemal Research Dept. Sandia National Laboratories MS 1033 PO Box 5800 Albuquerque, NM 87185 Phone: 505-844-7315 Fax: 505-844-3952 E-mail: [email protected]
95
(9) Karl Urbank
Vice President – Technical Services Geothermal Operations Calpine Corporation 10350 Socrates Mine Road Middletown, CA 95461 Voice: (707) 431-6034 Fax: (707) 431-6246 E-mail: [email protected] Administrative Assistant: Linda Kalmar, (707) 431-6236
(10) Ken Williamson
General Manager, Unocal Corporation, International Energy Operations, Geothermal Technology & Services 1160 N. Dutton Avenue, Suite 200, Santa Rosa, CA95401 tel: 707-521-7627 mobile: 707-799-5260 fax: 707-521-7604 email: [email protected]
(11) William E. Lewis
Bill Lewis, P.E. POWER Engineers, Inc. P.O. Box 1066 Hailey, Idaho 83333 USA Tel: +1 208-788-3456 Fax: +1 208-788-2082 E-mail: [email protected]
96