Embed Size (px)
Citation preview

RELATION OF AVIAN EGG WEIGHT TO BODY WEIGHT
H. RAHN, C. V. PAGANELLI, AND A. A•
JUST over 50 years ago Heinroth (1922) published the first extensive list of egg weights and adult body weights for 427 species of birds. Since then additional data have appeared and the most extensive list can now be found in SchSnwetter's (1960-72) monumental description of bird eggs. With these as a major backlog, and data for the Fringillidae (Areadon 1943); the Sphenisciformes, Anseriformes, and Procellariiformes (Lack 1968); and Falconiformes (Mebs 1964), more than 800 egg weight- body weight correlates are now available.
Our endeavor has been to describe the relationship between egg weight and body weight in mathematical terms that are amenable to further refinements when additional data became available. We have not been
concerned with explaining the relationship as Lack (1968) has done in his elegant analysis, but have rather attempted to find out what common principles might emerge from this particular relationship.
Our analytical approach is basically the same as suggested originally by Huxley (1923-24), namely to plot log (egg weight) against log (body weight) and to derive a regression equation that expresses egg weight, W, as a function of body weight, B, raised to a power: W : aB ø. The additional data now available allow one to obtain individual
regression equat•ens for many orders and families. As Amadon (1943) had anticipated in his review of Huxley's analysis and as Lack (1968) has recently shown for many orders and families, each group of related birds has its characteristic proportionality constant, a. On the other hand, our analysis indicates that the power, b, is most likely the same for all groups, namely 0.675. In addition, the relation of incubation time to body weight is derived (Rahn and Ar 1974); incubation time is shown to be proportional to body weight raised to the 0.166 power. Thus a 10-fold increase in body weight is in general associated -with a 4.73-fold increase in egg weight and a 1.47-fold increase in incubation time.
ME•tIODS or ANALYSIS
For each order, and in the case of Passeriformes for each family, the paired values of egg weight and body weight were converted to common logarithms, and the regression of log egg weight on log female weight was derived by linear least-squares analysis. In the ordinary method of least squares, it is assumed that the independent variable (here log B) is not subject either to biological variation or to errors of mea- surement. The residual scatter of the points around the regression line is therefore ascribed entirely to deviations of the dependent variable (here log W) from the
750 The Auk 92: 750-765. October 1975

October 1975] Avian Egg and Body Weights 751
Order Families (mean) mx a b -+ g
Laridae 12 Alcidae 7
Strigidae
BucconSdae 3
•z-a•m•.dae 47
'Z•z'd•dae 79
15 1,500
1
lg,000 2
(6,333) 32,000 0.633 0.633 0.059 1.15 0.97
91,500
lg,000
(46,125) 91,500 0.354 0.725 0.074 1.19 0.93
33•000 41,000
(1,351) 8,290 0.717 0.734 0.068 1.17 0.99
2,000 (3,613) 6,000 0.374 0.690 0.024 1.06 0.99
Z20 (1,422) 10,200 0.641 0.673 0.095 1.24 0.93
95 (2,091) 11,300 0.741 0.633 0.073 1.18 0.98
45 (807) 3,000 0.484 0.640 0.082 1.21 0.96
50 (1,338) 5,000 0.697 0.634 0.052 1.13 0.99
23 (255) 1,500 0.513 0.725 0.051 1.15 0.98
35 (313) 2,000 0.206 0.759 0.101 1.26 0.94
13 (314) 1,050 0.234 0.724 0.067 1.17 0.99
75 (694) 2,500 0.717 0.603 0.056 1.14 0.99
9 (451) 3,500 0.629 0.608 0.081 1.21 0.98
21 (95) 305 0.560 0.536 0.116 1.31 0.83
4.8 (33) 175 0.340 0.677 0.087 1.22 0.91 12.6 (39) 68 0.256 0.811 0.073 1.18 0.96 12.5 (26) 75 0.452 0.647 0.066 1.16 0.92
7.5 (26) 67 0.350 0.722 0.067 1.17 0.95 16 (38) 73 0.210 0.819 0.053 1.13 0.97
4.8 (Z1) 57 0.316 0.709 0.051 1.13 0.97 12 (30) 60 0.478 0.531 0.056 1.14 0.83 11 (19) 40 0.254 0.687 0.063 1.16 0.87 10 (40) 113 0.323 0.693 0.066 1.16 0.96 1S (34) 55 0.341 0.649 0.051 1.13 0.88
8 (13) 19 0.182 0. 890 0.041 1.10 0.96 10 (48) 175 0.317 0.691 0.063 1.16 0.96 14 (23) 52 0.404 0.584 0.054 1.13 0.80 22 (42) 78 0.440 0.575 0.037 1.09 0.88 lZ (25) 41 0.413 0.786 0.010 1.02 0.99
Fig. 1. Parameters of regression equations for 17 orders and various families. Values for B, body weight, and W, egg weight, are in grams. The columns from left to right indicate: (2) The number of species. (3, 4, 5) The range and mean values of body weights. (6, 7) The values of a and b in Eq. 1. (8) SEE, standard error of estimate. The values in this column when added to and subtracted from
log W give the 68% confidence limits for the values of log W. (9) 68% CL : confidence limits. When W is multiplied and divided by the values in this column, the resulting figures give the 68% confidence limits. (10) Correlation coefficient.

752 RAm% I>AGAi•ELLI, Ai•D AR [Auk, Vol. 92
line. In fact biological variation occurs in both body weight and egg weight, so that the ordinary method of least squares is not strictly applicable. But the scatter of the points about the fitted lines is usually small enough so that the tendency of the least-squares method to underestimate the true slope does not seriously bias the results. The standard error of estimate of log W, defined as the root-mean-square of the residual deviations of the points from the line in the log W direction, will accordingly be used as a measure of random scatter. The cor- relation coefficients between log W and log B have also been calculated.
The regression equation was of the form:
log W ---- log a q- b log B (1) or
W__--a-B b
where W is the egg weight in grams, a is a proportionality constant, B is the body weight in grams, and b is the exponent of B (the slope of the regression line on a log-log plot). The standard error of estimate (SEE) was calculated for log W. The antilogarithm of SEE can be expressed as a factor by which W is multiplied or divided to yield confidence limits around W. For example, if the SEE in log W is --+0.08, then for W ---- 100 g, 68% of the values of W on the average will He between 100 X antilog 0.08 or 1.2, and 100 + 1.2 (i.e. between 83 and 120 g).
Fig. 1 lists, according to orders and in the Passeriformes according to families, the number of species, the range and mean values of body weight, values of a and b in Eq. 1, the standard error of estimate of log W; the 68% confidence limits for W, expressed by the symbol X, and the correlation coefficient, r, between W and log B.
]DISCUSSION
Our objectives were first of all to determine whether or not a linear regression existed between log W and log B for the different orders and families. Huxley (1923-24) averaged class intervals (from Heinroth's data) and made log-log plots of egg weight rs. female weight to obtain his slopes. Probably because of insufficient data and his practice of averaging class intervals, he concluded that the slope was nearly 1.0 at lower body weight, but tended to become progressively less as the body weight increased. If this were indeed the case, a related group of birds with a large weight range would require more than one linear regression equation to describe the relationship between log W and log B. To investigate this possibility, we plotted regression lines for indi- vidual values, rather than averages, for 9 nonpasserine orders in Fig. 2 and for 9 families of Passeriformes in Fig. 3. As will be noted, the in- dividual points scatter relatively evenly around the calculated regression lines and there is no tendency for values in the lower weight range to fall above, or for values in the high weight range to fall below, the common regression line. Therefore, we believe that a single regression equation is indeed a valid expression of the relation between log egg weight and log body weight over the weight range observed.

October 1975] Avian Egg and Body Weights 753
I ' ' ............ '•w=a(awP a _b Gruiformes 0.70 0.63
Columbiformes 0.• 0.76
lg 3 57 log • kg 10kg Female Weight
Falconiformes 0,74 0.63
Psittaciformes 02.3 0.72
Coraciiformes 0.63 0.61
G<311iformes 0.48 0,64
Cl'•radriiformes 0.61 0:73
Strigiformes 0.72 0.60
Anseriformes 0.43 0.75
Fig. 2. Egg weight as a function of body weight in nine orders of birds to illustrate the scattering of individual values around the calculated regression lines. These values are based upon the data of SchSnwetter (1960-71).
Is THERE A COMMON REGRESSION EQUATION FOR ALL BIRDS?
In addition to the individual regression equations for the 17 orders of birds listed in Fig. 1, a common regression equation was derived for all 809 values; it is:
W = 0.277 B ø.'7ø (2)
The SEE in log W is --- 0.150; or the 68?; confidence limits are X 1.41 W. The correlation coefficient between log W and log B is 0.973.

754 RAn•, PAOA•ELLZ, AIq'D AR [Auk, Vol. 92
lO
10 3 5 ? 10 10 100 Female Weight, g
Fig. 3. Egg weight as a function of body weight in nine families of Passeriformes to illustrate the scattering of individual values around the calculated regression lines. Values for Fringillidae from Amadon (1943), remainder from Schibnwetter (1960-71).
The exponent of 0.770 appears to be greater than the average ex- ponent of the 17 individual orders, which is 0.666 --- 0.061 (SD).
Such a discrepancy can be explained as shown in Fig. 4. Most of the lines in the figure have similar slopes but different intercepts. In addition, each line covers a different weight range, such that the larger the value of body weight the more the egg weight range is shifted up- ward. It now becomes important to ascertain the probability that the slopes (b), as well as the intercepts (a), do not differ significantly among the individual orders.
TI-IE SLOPES AMONG DIFFERENT ORDERS
We tested the slopes of each of the individual regression lines (Fig. 1) for nonparallelism by analysis of variance (Bliss 1967), which showed

October 1975] Avian Egg and Body Weights 755
15
-- /• 1 Procelloriiformes -- 2 Charadr[iforrnes 3 Anseriforrnes
4 Falconiformes 5 Gruiforrnes
16 6 Sphe•isciforrnes -- / 7 Strigiforrnes --
/ 8 Coracliforrne$
/ 9 Reliloe -- 10 Galliforraes
11 Ciconiiforraes __ 12 Posserlformes t3 Columbitorraes
14 Piciformes --
15 Psittaciforrnes
• 16 Cucullformes
1•oo
lOC
(D
1c
t0 t0 t 10 * 10 '• 10 s
Body Weight, g
Fig. 4. Regression lines of egg weight as a function of body weight for 15 orders of birds based upon the equations in Fig. 1 and the mean slope of the few data available for the parasitic Cuculiformes (SchiSnwetter, 1960-72).
that the slopes do not differ significantly from one another (P > 0.99). The common slope has a value of 0.675 with 95% confidence limits of -- 0.015. As in this test the contribution of each order was weighted
by the number of observations for that order, one can appreciate that the individual values of the slopes for orders with few observations have relatively little effect upon the common slope and its variance. A com- mon slope for all birds of 0.675 suggests that eventually all regression equations should ideally be based not on orders of birds, but upon sub- groups of orders or families. For example, the observed deviation of the slope from 0.675 in orders such as Charadriiformes or the Procellariiformes

756 RAHN, PAGANELLI, AND A• [Auk, Vol. 92
is most likely caused by the fact that the families within these orders have (1) different values of a and (2) cover different weight ranges.
Considering a common slope, b = 0.675, for all orders of birds is of considerable interest as it tells us that as a general rule egg weight in- creases in proportion to the surface of the female. Doubling body weight increases egg weight by about 62%, and a 10-fold increase in body weight increases the egg weight nearly 5-fold.
It is of interest to note that Brody (1945: 482) plotted the egg weight-body weight relationship for 30 species of domestic and wild birds and obtained the following regression equation:
W = 0.258 B ø'73 (3)
He expla/ned the slope of 0.73 as follows: "This increase in egg weight with W ø.va rather than with W •'ø indicates to the writer that the total
metabolism parallels the basal metabolism, and what is true for egg production is likely to be true of other production processes. A similar result was found for milk production in rats, goats, cattle, and man." It should be recalled that when we pooled all our 809 species and fitted a regression equation without regard to orders and families, as Brody did, we obtained a regression equation similar to his, namely W = 0.277 B ø'77ø. But as noted above, the probability is high that a single equation cannot adequately describe the relation between egg weight and body weight for all orders and families. Thus the relationship of egg weight to body weight cannot be argued as a function of metabolic rate, but rather is more nearly related to the surface area of the female.
The proportionality constants among different orders.--Inspection of the intercepts or proportionality constants, a, in Fig. 1 shows rather large differences among the various orders. This indicates that variation in egg size among different orders can be quite large, a fact that has been well-appreciated since the time of Heinroth. The analysis of variance (Bliss 1967) indicates a probability of less than 0.001 that the pro- portionality constants do not differ among the 17 orders. Thus valid comparisons among all orders can be made when one considers egg size at the same body weight. In Fig. 4, which shows the regression lines for all these orders, note that most groups include a 100 g body weight and this therefore becomes a convenient point for comparison. The egg weights for 13 orders are shown in order of increasing egg weight in Fig. 5, ranging from 4.5 g in the parasitic Cuculiformes (estimated from the data of Scht3nwetter) to 21 g in Procellariiformes. The egg weight for Anseriformes was obtained by extrapolation, as the smallest body weight for this group was 220 g. For the orders with large body weight, Ratitae (which does not include Apterygiformes), Sphenisciformes, etc., one can
October 1975] Avian Egg and Body Weights 757
16 Cuculiformes
15 Psittaciformes
14 Piciformes
t3 Columbiformes i2 Passeriformes
10 Galliformes
8 Corociiformes
7 Strigiformes 5 Gruiformes
4 Falconiformes
3*Anseriformes
2 Choradriiformes
1 Procelloriiformes
Egg Weight, at I00 g Body Weight 5 iO i5 20 25
,,•1,•,•1,•,,I,,,,I,,•,
I
;/ . ,
5 iO i5 20 25
Fig. 5. Comparison of egg weights at 100 g body weight in 13 orders of birds. The egg weight for Anseriformes was obtained by extrapolation, as the lowest body weight of 220 g was considered near enough for valid comparison. Cross-hatched columns represent nidifugous orders.
obtain the egg weight by extrapolation to a body weight of 100 g. Such values fall within the range shown in Fig. 5.
In Fig. 5, the 68% CL calculated from Fig. 1 are shown. While it is apparent that no significant difference in egg weight exists at a 100 g body weight between adjacent orders as given in the figure, it is equally apparent that a real difference in egg weights exists between orders occupying the extreme positions in the figure. Thus the ratio between the largest and the smallest mean egg weights for all birds with a body weight of 100 g is 21/4.5 or 4.7.
In Fig. 5 the columns for the nidifugous birds are hatched. It will be noted that these are well distributed among those of the nidicolous birds. Thus the commonly made statement that eggs of nidifugous birds are relatively larger than those of nidicolous species has no firm basis in fact.
R•,^T•w EGG WmGHTS ^•ON• TH• P^ss•I•I•OI•s
So far we have concerned ourselves with the proportionality constants among various orders. It is of interest to inquire to what extent similar considerations apply among the various families within a large order

758 R•a•, P^•^•ELLZ, ^•D AR [Auk, Vol. 92
I I I I I 1 I ,• 11 ," 17_
'A$$ERIFORME$
I. Fringillidae
n g 295 :3.4
1:3 6.0 2. Formicariidae 22 4.1 :3. Furnar/idae 8 4.1 4. Dendrocolaplldae 7 4.0 5. Troglodytidae 8 $.8 6. Tyrann;dae 47 :3.5 7. Campephagidae 9 3.4 8. Got ingidae 7 :5.4 9. Turdidae 79
I0. Laniidae •:5 :•.1 I I ß Pycnonotidae 17 :5.1 I::'. Molacillldae 25 2,9 I$. Alaudldae 20 2.9 14. Hirundinidae I0 2.6
t0 20 30 40 60 80 100
Body Weight, g Fig. 6. Egg weight-body weight regression lines for some families of Passeriformes
listed in Fig. 1. As all families span the body weight of 30 g (except the Troglo- dytidae), egg weights may be compared at this point and are shown in the table (insert). The mean egg weights for these 14 families range from 2.6 to 6.0 g or 8.7 to 20% of the body weight; 3.4 g represents the average value calculated for all 295 species. The number of observations for each regression = n.
such as the Passeriformes. (As SchSnwetter's publication of this order is still not complete, some families are missing in our compilation. Still the 14 passerine families in Fig. 1 provide a sufficient insight into the variability.)
Fig. 6 shows the regression lines for seven families. The other seven families were omitted to avoid graphical confusion, but their regression lines all fall between lines 1 and 14. It will be noted in Fig. 1 that all the families except Troglodytidae include 30 g in their range of body weights. This value is, therefore, a convenient common reference for comparing average egg weights. These are shown in descending order in the inset of Fig. 6 from the largest average egg size of 6.0 g for
October 1975] Avian Egg and Body Weights 759
I I I I ! I I I I I I I I I I I I I I I I I I
4
100 6 .?
C• -'•,•g./ I 2. Ans retni 24 74 • •/' or I ;•. Merglni 12 7;•
9 •' I 4. Todornini 19
ELI 6. Ayfhyini 14 62 r' I 5. Somoter'Hni 4 65 7 ß
7, Anatini 45 59 8. Dendrocygnini 8 54 9. Cairinlni II
I I I I I I I I I I I I I I I I I I I I It t00 t000 10,000
Body Weight, g Fig. 7. Egg weight-body weight regression lines for various tribes of the family
Anatidae. Each group spans a body weight of 1000 g (except for the Anserini). This point was chosen for comparison of egg weights listed in the table (insert). The largest average eggs are found in the Oxyurini (101 g), the smallest in the Cairinini (53 g). The mean value for all Anatidae eggs is 69 g. All data from Lack (1968).
Fringillidae to 2.6 g for the Hirundinidae. The average egg weight for the order as a whole is 3.4 g. Thus with the information presently avail- able the ratio between the largest and smallest mean egg weights in this order is 6/2.6 or 2.3.
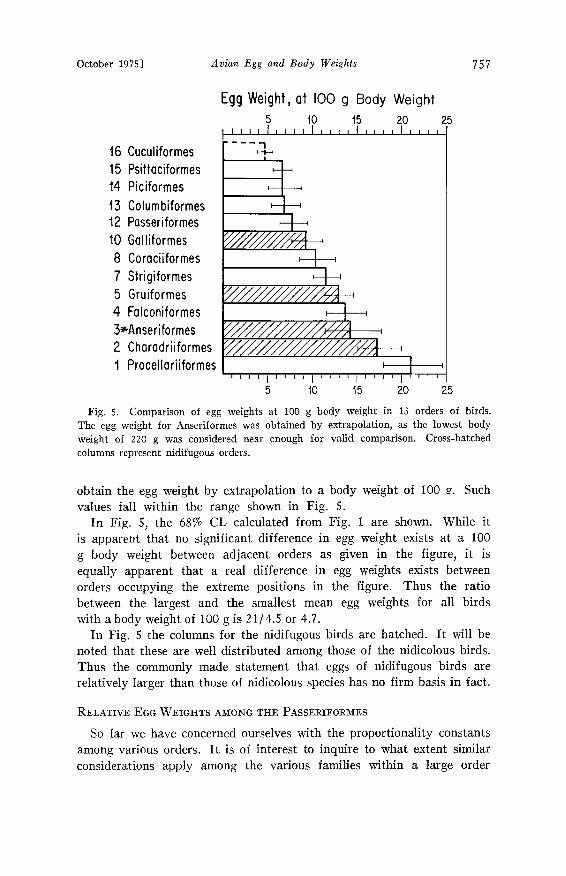
RELATIVE EOO WEmHTS AMONG TI-IE ANATIDAE
On the basis of egg weight-body correlates for 149 species of the family Anatidae, Lack (1968) plotted on semilog coordinates egg weight against body weight for various genera or tribes. By this method he was able to show characteristic differences of relative egg weight between various groups. From his data we computed regression equations for each group, most of which are plotted in Fig. 7. It will be noted that with the exception of the Anserini all include a weight of 1000 g, which was therefore chosen to make an evaluation of relative egg weight. In the inset of Fig. 7, egg weights for nine different groups are shown in decreasing order of egg weight. These range from an average value of

760 RA•IN, PAGANELLI, AND A• [Auk, Vol. 92
101 g for the Oxyurini to 53 g in the Cairinini. The average egg weight for 149 species of the family Anatidae is 69 g. The 2-fold difference in egg weight between the Oxyurini and the Cairinini is highly significant and provides a good example of the relative egg weight difference within a family.
CLUTCH SIZE, EGG WEIGHT, AND BODY WEIGHT
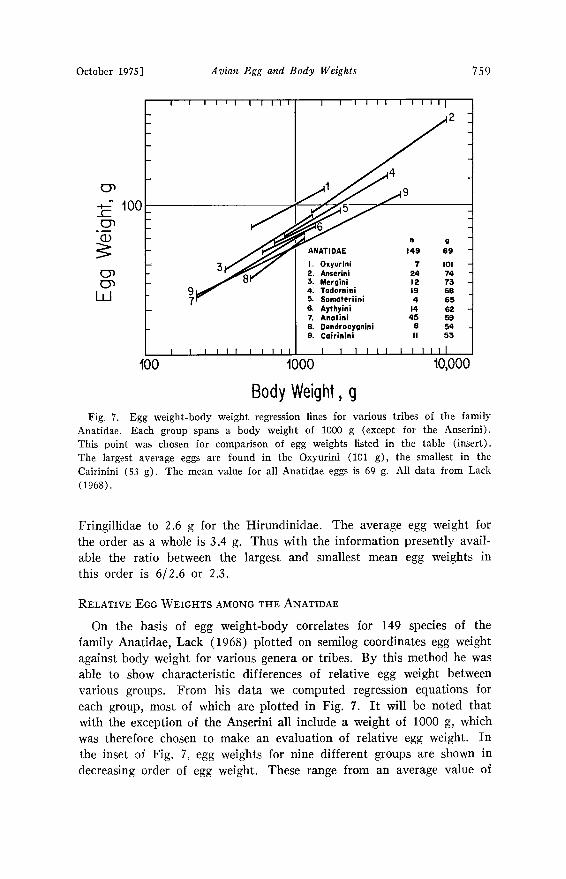
Lack (1968) provided extensive data that allow one to examine the relationship between clutch weight and body weight for the Anatidae and Phasianidae. The individual values of the product C.W (where C --- number of eggs in a clutch and W --- weight in grams for a single egg are plotted as a function of body weight in Fig. 8. The regression equations are as follows:
Anatidae C'W = 13.6 B ø-•7 n ---- 149, SEE -+ 0.128, r --- 0.81 (4) Phasianidae C.W-- 6.0 B ø-Sa• n= 50, SEE-+ 0.180, r = 0.80 (5)
The exponent for both groups is nearly 0.5, that is, total clutch weight (C.W) is proportional to the square root of body weight. Furthermore, the average clutch weight is about twice as large (13.6/6.0) in the Anat- idae as in the Phasianidae over the common body weight range.
That the exponent is the same for both groups may be coincidental. Its deviation from the typical value of 0.67 for a single egg indicates that the number of eggs in a clutch must decrease as body weight in- creases. In fact the overall decrease of clutch size can be calculated. As
W = 0.641 B ø-67a in the Anatidae (see Fig. 1)
then from Eq. 4:
13.6 B C: -- 21.2 B -ø'•6 (6)
0.641 B ø'e7s
The negative exponent of 0.156 indicates that for each 10-fold increase in body weight the average clutch size decreases by 30%. For the Phasianidae the calculated decrease in clutch size is nearly identical (28%) as C = 15.2 B -ø.•.
Table 1 gives numerical values predicted by these equations for the Anatidae and Phasianidae. The first and last values under B
represent the smallest and largest body weight values reported by Lack for each family. In the Anatidae• for example, this represents a 50-fold increase in body weight, which is associated with a 14-fold increase in the weight of the individual eggs; but clutch size becomes reduced to nearly ¬ (54%) and thus the clutch weight increases only 7.6 times. We also notice that the clutch weight is equal to body
October 1975] Avian Egg and Body Weights 761
Anatidae'o C.W: •3.6 B '5•573, o* - Phasianidae o C.W:6.0 B. ß - ß I •'""•' 1000
• •;.x,,-•. o'.• :.
• ß •%," ß 8 o o .%/OOo ø o . I • .• ½ o -
o o 100 1000 10,000
150 ....... • ........... • ..........
0 8O
• 60 -
• Phasianidae•• - • 40 _ g 2o
400 4ooo •o,ooo
Body Weight, g
lowe• •p• expresses •e totM e• m•s • • pe•ce•t o• bod• wei•kt plotted t•e bod• weight. •o• dkc•io•, see text.
weight in the smallest species (100% of body weight) but is reduced to about ¬ (16% of body weight) in the largest species. Very similar changes are shown for the Phasianidae.
CLUTCH WEIGHT EXPRESSED AS PERCENT BODY WEIGHT
It is of interest to examine clutch weight (C'W) when this value is expressed as percent of body weight, B, as it denotes in relative terms

762 RAHN, PAGANELLI, AND A• [Auk, Vol. 92
TABLE 1
PREDICTED RELATIONSI•IIPS FOR ANATIDAE AND P•IASIANIDAE •
B W C (C.W) (C.W/B) .100 g g (number) g %
Anatidae
Phasianidae
200 23 9.3 210 105
500 42 8.0 338 68
1000 67 7.2 483 48
5000 198 5.6 1111 22
10,000 315 5.0 1589 16
45 5 8.7 46 102
100 9 7.8 70 70
500 27 6.2 165 33
1000 43 5.6 239 24
3000 90 4.8 429 14
•B = body weight; W = egg weight: C = number of eggs in clutch; (C.W) = the total egg mass of clutch; and C(W/B) X 100, which expresses the latter value as percent of body' weight.
the caloric energy the female must expend prior to incubation. This relationship is shown in the lower graph of Fig. 8. As Lack (1968) already pointed out for the Anatidae, the smaller the body weight, the larger is total egg mass relative to female body weight. The slope of this relationship is identical for the Phasianidae. For other groups the slope will depend upon the change in clutch size with body weight. In the Procellariiformes this slope will be equal to (0.734 - 1.00) or -0.266, as the clutch number = 1 in this order.
As body weight decreases, total egg mass of the Anatidae and Phasianidae approaches the weight of the female (see Table 1) and in individual species exceeds it. For 10 species of the Fringillidae (Amadon 1943) we have obtained clutch sizes and calculated that the clutch weight (C'W) varies between 95 and 110% of the body weight. In the smaller Charadriiformes similar values can be obtained. Thus i[
would appear the total egg mass (C.W), at least in these species, will normally not exceed the weight of the female, which may represent a physiological limit. On the other hand, in the Columbidae which lay either 1 or 2 eggs, the largest total egg mass relative to body weight is only 8 or 14%, respectively.
PERCENT EGG WEIGHT AS A FUNCTION OF BODY WEIGHT
The egg weight-body weight ratio (or percent egg weight) as a function of body weight is of interest as at the extremes of the weight range certain biological limits can be anticipated. If we divide both sides of our allometric equations by body weight, we can plot the percent egg

October 1975] Avian Egg and Body Weights 763
30 9 9O
\ Egg Weight, % Incubation, doys/
25- \\\ 27.7 B-ø'23 9.1 B o. 167 /////t 75 ß \ / f /
• \\\ //I / //I i • • 20- 6o •
• •5- '
Body Weight
Fig. 9. Semilog plot of percent egg weight and incubation time for birds in general as a function of body weight from 2.5 g to 1000 kg. Dotted lines span the 68% CL.
weight against body weight, which yields on a log-log plot negative slopes equal to b-1.0. The regression equation is:
W% = 27.7 B -ø'23ø (7)
and in this instance is based upon all our data without consideration of individual behavior of each order of birds. In other words, it provides an overall view of the decline of the percent egg weight as a function of body weight and the 68% confidence limits (Fig. 9). The body weight range is terminated at 2.5 g as this is probably the lower limit for homeothermic birds and mammals. At the upper end of the body weight scale we have gone to 1000 kg, which we believe is a good estimate of the average weight of the larger extinct Aepyornithidae. This estimate is twice as large as that of Areadon (1947), and is obtained by extrapola- tion of the egg weight-body weight equation of the ratires (Fig. 1) and the egg weights reported by Sch6nwetter (.1960-70), which averaged 8.7 kg (n = 23). Thus the maximal body weight ratio 'among birds is about 400,000, while the maximal reported egg weight ratio is about 50,000.
INCUBATION PERIOD AS A FUNCTION OF BODY WEIGttT
Fig. 9 plots incubation period as a function of body weight. As reported by Rahn and Ar (1974) the incubation time as a function of

764 RAItN, PAGANELLI, AND AR [Auk, Vol. 92
egg weight is I ---- 12.03 W ø.2•7 where I = incubation period in days. Substituting the general egg weight-body weight equation W -• 0.277 B ø.77ø into the equation above and solving for I we obtain:
I---- 12 (0.277 Bø-77ø) ø-2•7
or I = 9.105 B ø'•67 (8)
This relationship with its 68% confidence limits is shown in Fig. 9. The regression is terminated below 11 days of incubation because this appears to be the shortest reliably reported incubation time (Nice 1954). By extrapolation we can estimate that the longest incubation periods average about 90 days, a figure that agrees with previous pre- dictions of Needham (1931), Worth (1940), and Rahn and Ar (1974) for Aepyornithidae based upon incubation period-egg weight relationships.
ACKNOWLEDGMENTS
We express sincere thanks te Douglas S. Riggs for the many hours he so generously spent to help us with statistical evaluation of the data. We also thank Phyllis Parisi for her competent assistance in the statistical computations.
SUmmArY
The relation of egg weight as a function of adult body weight was examined in more than 800 species of birds. Plotting the individual values separately for various orders and families on a log-log scale provides a satisfactory description for the allometric equation where egg weight --- a.body weight •. The power function, b, appears to be common for all the orders and families and is equal to 0.67 or %. The proportionality constant, a, varies and is characteristic for each group.
Relative egg sizes can be compared among different orders, families, and tribes at a specific body weight common to. each particular group. Thus the relative egg weight for 13 orders at 100 g body weight varies from 21% for the Procellariiformes to 4.5% for the parasitic Cuculiformes. At 30 g body weight the relative egg size among 14 families of Passeri- formes ranges from 20% in the Fringillidae to 8.7% in the Hirundinidae and for 9 tribes of the family Anatidac from 10% for the Oxyurini to 5% for the Cairinini at 1000 g body weight.
The relation of clutch weight and number of eggs to. body size is described for the families Anatidae and Phasianidae. In these two
families the increase in clutch weight is proportional to the square root of body weight. When clutch weight is expressed as percent of body weight this value is inversely proportional to body weight. The maximal value is equal to. 100% where clutch weight equals or slightly exceeds the body weight of the female. A similar value was obtained for eight

October 1975] Avian Egg and Body Weights 765
species of the family Fringillidae and may represent a physiological limit of energy production prior to incubation for these birds.
Incubation time can also be expressed as a function of body weight and is equal to nearly 9 times the body weight raised to the 0.167 power. On the other hand, egg weight as noted above is proportional to the % power of the body weight and when expressed as percent of body weight the power function is (% - 1.0) or -%. Thus as a general rule, a 10- fold increase in body weight is associated with a 46% increase in incuba- tion time, a 4.7 times larger egg weight, or a reduction of the percent egg weight to 0.59 of the previous value.
LITERATURE CITED
1943. Bird weights and egg weights. Auk 60: 221-234. 1947. An estimated weight of the largest known bird.
AiV/'AD 0N• D. A•L4DON, D. Condor 49:
159-164.
BLISS, C. I. 1967. Statistics in biology, vol. 1. New York, McGraw-Hill. BRODY, S. 1945. Bioenergetics and growth. New York, Reinhold Publ. Co.
(Reprinted 1964, New York, Hafner Publ. Co.) HEINROTIt, O. 1922. Die Beziehungen zwischen Vogelgewicht, Eigewicht, Gelege-
gewicht und Brutdauer. J. Ornithol. 70: 172-285. HUXLEY, J. S. 1923-24. On the relation between egg weight and body weight in
birds. J. Linnean Soc., London 36: 457-466. LACK, D. 1968. Ecological adaptations for breeding in birds. London, Methuen
& Co.
MEBS, T. 1964. GreifvSgel Europas. Stuttgart, Kosmos-Franckh Verlag. NEEDaA•, J. 1931. Chemical embryology, vol. 1. Cambridge, England, Cam-
bridge Univ. Press. NINE, M.M. 1954. Incubation periods throughout the ages. Centaurus 3: 311-369. RAaN, H., ANO A. AR. 1974. The arian egg: incubation time, water loss and nest
humidity. Condor 76: 147-152. ScaiSNwETTER, M. 1960-72. Handbuch der Oologie, Lief. 1-19 (W. Meise, Ed.).
Berlin, Akademie Verlag. WORTa, C.B. 1940. Egg volumes and incubation periods. Auk 57: 44-60.
Department of Physiology, School of Medicine, State University of New York at Buffalo, Buffalo, New York 14214. Present address of third author: Department of Zoology, Tel-Aviv University, Tel-Aviv, Ramat- Aviv, Israel. Accepted 17 September 1974.