Embed Size (px)
Citation preview

Arch Argent Pediatr 2020;118(2):117-124 / 117
Growth references for weight, height, and body mass index for Ecuadorian children and adolescents aged 5-19 years
ABSTRACTIntroduction. The assessment of growth during childhood and adolescence is a critical component of health care at all levels, but it is also part of nutritional status diagnosis and the timely detection of related conditions. Ecuador lacks national growth references, so it has decided to adopt the international standards proposed by the World Health Organization. The objective of this study was to develop national references for weight, height, and body mass index for children and adolescents.Methods. Ecuadorian schoolchildren and adolescents aged 5-19 years were studied between 1999 and 2012. The LMS method for cross-sectional data, which uses the Box-Cox transformation to normalize data distribution at each age, was applied to estimate the 3rd, 10th, 25th, 50th, 75th, 90th, and 97th centiles for weight, height, and body mass index.Results. A total of 5934 healthy subjects (2788 boys and 3146 girls) participated. Boys were heavier and taller than girls. In all cases, values increased with age. At 18 years old, the differences between sexes averaged 8 kg and 12.5 cm.Conclusion. The tables and curves obtained with this study are the first descriptive growth references for Ecuadorian children and adolescents aged 5-19 years. They are relevant for nutritional assessment. Their use at the primary level of care will aid in nutritional status diagnosis, which has traditionally been done based on the World Health Organization’s international standards.Key words: height, body mass index, adolescent, growth charts, Ecuador.
http://dx.doi.org/10.5546/aap.2020.eng.117
To cite: Tarupi W, Lepage Y, Felix M L, Monnier C, et al. Growth references for weight, height, and body mass index for Ecuadorian children and adolescents aged 5-19 years. Arch Argent Pediatr. 2020;118(2):117-124.
INTRODUCTIONPhysical growth is one of the most
useful instruments in the nutritional and health surveillance of children at the primary level of care.1 Although the growth pattern for children younger than 5 years, resulting from a multicenter study, provides a single international reference corresponding to the best description of physiological growth, 2 this is not the case of growth references for children and adolescents aged 5-19 years3,4 based on the United States population. These curves are far from depicting the growth characteristics of childhood and adolescence, a period of life during which genetic, socioeconomic, and geographical influences are fully expressed. In this regard, several studies have demonstrated how growth and maturation patterns at this age vary greatly among and within populations.5-11
Growth assessment impl ies comparing the measures reached by an individual based on a standard. It has been argued that, if available, national growth standards may be more adequate to assess growth deviations and abnormal growth.10,12
Unl ike other countr ies , l ike Argentina,13 Venezuela,14 Colombia,15 the United Kingdom, 16 Japan, 17 and Belgium,18 to date, Ecuador lacked national growth references for children and adolescents aged 5-19 years; therefore, at the time, the United States international growth standards were recommended for their use in this country.3,4 Since there is no global growth reference for the 5-19 age group, the availability of national references is considered
Wilmer Tarupi, MSc.a*, Yvan Lepage, M.D.b, María L. Felix, M.D.a, Claude Monnier, M.D.b, Roland Hauspie, M.D.(†)c, Mathieu Roelants, M.D.d, Ricardo Hidalgo, M.D.a and Martine Vercauteren, M.D.b
a. School of Health Sciences Eugenio Espejo, Universidad Tecnológica Equinoccial de Quito (UTE), Quito, Ecuador.
b. Laboratoire d’Anthropologie et de Génétique Humaine, Université Libre de Bruxelles, Brussels, Belgium.
c. Vrije Universite it Brussel, Brussels, Belgium.
d. Katholieke Universiteit Leuven, Leuven, Belgium.
E-mail address:Wilmer Tarupi, MSc.: [email protected]
Funding: This study was funded by the University Development Commission (Commission Universitaire pour le Développement, CUD) (Belgium) and Universidad UTE (Ecuador). There are no conflicts of interest, and the manuscript was read and approved by all authors.
Conflict of interest: None.
Received: 3-26-2019Accepted: 10-8-2019
Original article
118 / Arch Argent Pediatr 2020;118(2):117-124 / Original article
critical. In this regard, the objective of this study was to develop national references for weight, height, and body mass index (BMI) for Ecuadorian children and adolescents aged 5-19 years.
MATERIALS AND METHODS Sample
This was a descriptive, cross-sectional study done in schoolchildren and adolescents aged 5 to 19 years. Data were collected across three periods: a) 1999;19 b) 2007-2009,20 and c) 2011-2012,11 in the three continental regions of Ecuador, specifically, the cities of Quito and Tulcán (Andean region), Santa Elena (coastal region), and Tena (Amazon region). This way, the different Ecuadorian and regional ethnic groups (with their ecological differences) would be represented. Galápagos is the fourth region of Ecuador, but its population is very small. Both public and private schools in each city were randomly selected based on the school registry provided by the provincial education boards. Participants were recruited at the schools using a random sample stratified by age, sex, and place of residence (Table 1).
Weight and standing height were measured inside the classroom using the anthropometric technique proposed by the World Health Organization (WHO).21,22 Height was measured to the nearest 1.0 mm using a portable stadiometer (GPM Anthropological Instruments, Switzerland). Weight was measured at the nearest 0.1 kg using a manual scale (Health-o-Meter® HLT Scale), which was periodically calibrated. During the first two periods, measurements were obtained by the research team members and authors of this article, who were experienced in anthropometry. During the third period, there was room for the creation of a learning-teaching space with students from the school of medicine
of Universidad Tecnológica Equinoccial de Quito (UTE), who received previous training on how to make the measurements. The intra- and inter-observer technical error of measurement (TEM) was 0.54 % and 1.7 %, respectively. Measurements were obtained only once. All participants received the relevant feedback about their body measurements.
The date of birth was available for most participants in the official school records. Age and sociodemographic data were provided by parents and adolescents through a questionnaire. The central statistical analysis was done at the UTE, where data were digitalized and subjected to a comprehensive quality analysis. Suspicious values (due to rare measurement or typographical errors) were eliminated or corrected (as long as possible). The first step in data processing was to create dispersion plots and charts to exclude atypical values. Any observation above +3 standard deviations (SDs) and below -3 SDs of the sample median value was excluded before developing the growth references. As a result, 26 observations for males (0.9 %) and 49 observations for females (1.5 %) were excluded. Due to logistic limitations, the anthropometric data of these participants were not confirmed.
Children who were not of Ecuadorian nationality (18 observations), who had chronic conditions (8 observations) or who were receiving medications that may affect growth (6 observations) were excluded from the study.
Data analysisThe Least-Mean-Square algorithm (LMS)
method23 for cross-sectional data was used to estimate weight, height, and BMI percentiles. This allowed to adjust the asymmetry using a Box-Cox transformation (L), which normalized data distribution at each age, considering the median (M) and the coefficient of variation of distribution (S). Data adjustment allowed for L, M, and S values to change smoothly at the x-axis (in this case, age), so that they could be representative of the population with smoothed curves plotted based on the y-axis (weight, height, and BMI). At each age, weight, height, and BMI distribution was summarized into three coefficients: L, M, and S, where L accounted for the symmetry; M, for the median; and S, for the coefficient of variation for each age and sex. These parameters were estimated based on the penalized maximum likelihood method.24-26These curves were then estimated using an iterative
Table 1. Distribution of individuals by sex and year of observation
Place Boys Girls TotalQuito, 1999 459 629 1088Quito, 2007 730 520 1250Quito, 2009 344 381 695Quito, 2011 256 448 704Santa Elena, 2011 537 535 1072Tulcán, 2012 233 209 442Tena, 2012 229 454 683Total 2788 3146 5934

Growth references for weight, height, and body mass index for Ecuadorian children and adolescents aged 5-19 years / 119
Height (centimeters)Boys are taller than girls in all age ranges;
the difference is more evident as of 13 years old. The reference percentiles for height-for-age in boys and girls are shown in Table 3, together with the M and S values, which provided the best fit to develop the growth references. The LMS models that provided the best fit were LMS (edf(λ) = 0, edf(μ) = 5, edf(σ) = 3) for boys and LMS (edf(λ) = 3, edf(μ) = 5, edf(σ) = 3) for girls. The curves for boys and girls were modeled without bias (edf = 0, and L was set at 1).
Weight (kilograms)Boys are heavier than girls in all age ranges; the
difference is more evident as of 15 years old. The references for weight-for-age in boys and girls are shown in Table 4. The LMS models that provided the best fit to develop the weight references were LMS (edf(λ) = 2, edf(μ) = 5, edf(σ) = 3) for boys and LMS (edf(λ) = 3, edf(μ) = 5, edf(σ) = 3) for girls. A positive asymmetry (L was below 1) was observed at all ages and in both sexes, so the lower centiles were relatively closer to the median, whereas the upper extreme percentiles were relatively more distant from the median.
Body mass indexThe references for BMI-for-age in boys and
girls are shown in Table 5. The LMS models that provided the best fit to develop the BMI references were LMS (edf(λ) = 3, edf(μ) = 5, edf(σ) = 3) for
algorithm that included penalized cubic splines, where the smoothing level was determined by assigning the number of equivalent degrees of freedom (edf).
The adequate number of edf was selected as per Pan and Cole’s description,27 based on deviation,23 Q-tests,28 and the worm plot.29 LMS curves smoothing and the acceleration and deceleration points of the mean curve were verified by inspecting their derivatives. The final models were validated by comparing the expected and observed proportions of observations in a set of percentile bands by age class, with a chi-square goodness-of-fit test (grid test).30 No significant deviations in expected frequencies were observed (p > 0.1 for all models). All curves were adjusted and validated with the package of functions in R.31
The T test was done to compare height, weight, and BMI in the different age groups of the three samples. Such detailed, comparative statistical analysis of the centiles in the three samples showed that, both graphically and statistically, there were no significant differences in the growth status of children in these three data groups: 1. Quito, 1999, 2. Quito, 2007, and Quito, 2009, and 3. Quito, 2011, Santa Elena, 2011, Tulcán, 2012, and Tena, 2012 (p ≥ 0.05). Therefore, data from all sub-samples were combined to obtain an overall, larger sample that would allow to estimate the percentile lines more accurately.
Ethical considerationsThe study was carried out in accordance with
the guidelines established by the Declaration of Helsinki, and a written informed consent was obtained from all participating children’s and adolescents’ parents or legal guardians. The protocol was approved by the Ethics Committee of both associated institutions: the University Development Commission (Commission Universitaire pour le Développement, CUD) from Belgium and the UTE Review Board from Ecuador.
RESULTSThe study sample was made up of 5934
participants (3146 girls and 2788 boys) (Table 2). Boys were heavier and taller than girls. At 18 years old, the differences between sexes averaged 8 kg and 12.5 cm.
The required level of smoothing was described in terms of edf, which were selected considering the penalized minimum deviation and maintaining the LMS order.
Table 2. Distribution of participants by age
Age Boys Girls Total 5 69 67 130 6 163 187 350 7 149 183 332 8 156 279 435 9 164 209 373 10 213 268 481 11 224 239 463 12 342 323 665 13 306 281 587 14 286 286 572 15 251 253 504 16 188 230 418 17 182 213 395 18 63 88 151 19 32 40 66 Total 2788 3146 5934

120 / Arch Argent Pediatr 2020;118(2):117-124 / Original article
boys and LMS (edf(λ) = 3, edf(μ) = 5, edf(σ) = 3) for girls. Compared to weight, BMI showed a more positive asymmetry but a smaller coefficient of variation.
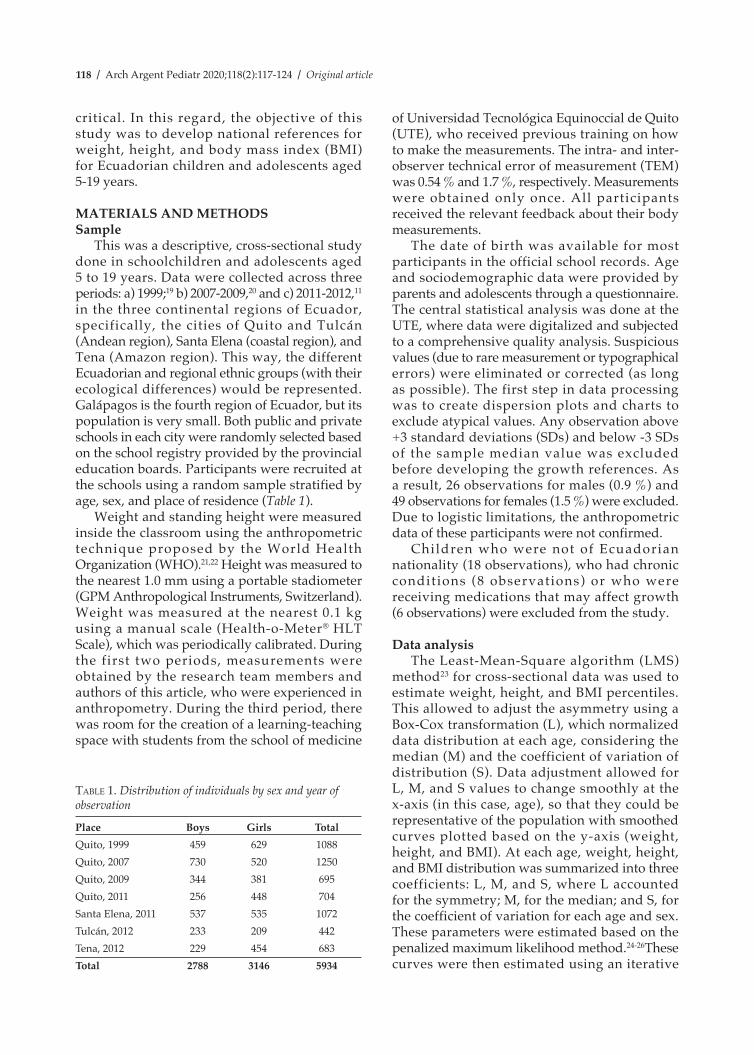
The information included in the tables was represented in curves using percentiles32 (Annexes 1, 2, 3, and 4). In all cases, values increased with age. The design of the reference curves was the same as that adopted in Norway, Luxembourg, and Algeria.
The reference curves for girls also show the distribution in age centiles at the time of
Table 3. Height (cm) of children aged 5-19 years, Ecuador
AGE in years L M (p50) S p3 p10 p25 p75 p90 p97
BOYS
5 1 105.8 0.047 96.4 99.4 102.4 109.2 112.3 115.3 6 1 111.6 0.047 101.7 104.8 108 115.1 118.3 121.5 7 1 117.2 0.047 106.8 110.1 113.5 121 124.4 127.7 8 1 122.8 0.048 111.7 115.2 118.8 126.7 130.3 133.9 9 1 127.8 0.049 115.9 119.7 123.5 132 135.9 139.7 10 1 132.6 0.050 119.9 123.9 128 137.1 141.2 145.2 11 1 137.5 0.051 124.2 128.5 132.8 142.3 146.6 150.8 12 1 142.7 0.052 128.6 133.1 137.7 147.8 152.4 156.9 13 1 148.3 0.054 133.2 138 142.9 153.7 158.6 163.4 14 1 154.9 0.052 139.5 144.4 149.3 160.4 165.4 170.3 15 1 160.5 0.048 145.9 150.5 155.2 165.7 170.4 175 16 1 163.8 0.043 150.3 154.6 159 168.6 173 177.3 17 1 165.4 0.041 152.7 156.7 160.8 170 174.1 178.2 18 1 165.9 0.040 153.4 157.4 161.4 170.4 174.5 178.5 19 1 166.0 0.039 153.6 157.5 161.6 170.5 174.5 178.5
GIRLS
5 1 104.2 0.054 93.6 97 100.4 108.1 111.5 114.9 6 1 110.4 0.050 99.9 103.3 106.7 114.2 117.6 120.9 7 1 115.7 0.048 105.2 108.5 111.9 119.5 122.9 126.2 8 1 120.9 0.047 110.1 113.5 117 124.8 128.3 131.7 9 1 126.3 0.047 114.9 118.5 122.2 130.4 134 137.7 10 1 132.2 0.048 120.1 123.9 127.9 136.5 140.4 144.3 11 1 138.9 0.049 126.1 130.1 134.3 143.4 147.6 151.7 12 1 144.5 0.048 131.3 135.5 139.8 149.2 153.4 157.6 13 1 148.8 0.045 136.1 140.1 144.2 153.4 157.5 161.5 14 1 151.4 0.042 139.2 143.1 147 155.8 159.7 163.6 15 1 152.6 0.041 140.7 144.5 148.3 156.8 160.6 164.4 16 1 153.0 0.040 141.2 145 148.8 157.2 161 164.7 17 1 153.1 0.040 141.4 145.1 148.9 157.3 161 164.8 18 1 153.2 0.040 141.5 145.2 149 157.4 161.1 164.9 19 1 153.4 0.040 141.8 145.5 149.3 157.6 161.3 165
cm: centimeters; L: Box-Cox power transformation; S: generalized coefficient of variation; M: 50th percentile; P3: 3rd percentile; P10: 10th percentile; P25: 25th percentile; P75: 75th percentile; P90: 90th percentile; P97: 97th percentile.
menarche in the Ecuadorian population, based on the methodology developed by Lepage.33 This tool helps to assess the normality of the maturation rate in girls.
DISCUSSIONIn this article, we present cross-sectional
growth references for height, weight, and BMI for the Ecuadorian population based on a representative sample of children and adolescents aged 5-19 years. The sample was representative because it provided an adequate social and

Growth references for weight, height, and body mass index for Ecuadorian children and adolescents aged 5-19 years / 121
geographical representation by means of a strict sampling design.
The data used to develop these curves were collected in different periods, and this may be considered a limitation of the study. However, a comparative statistical analysis of data from the three periods showed that there was no significant difference in the growth pattern of the children in these groups. In addition, the scientific literature provides a history of studies that combined population samples, as the one published by Tanner.34 For this reason,
we decided to combine the data from the three periods mentioned above to obtain a larger sample that would allow to estimate percentile lines in a more accurate manner. Actually, most likely, the Ecuadorian population does not show a detectable secular trend in the period between the three surveys.
To assess the normality of a child’s height/weight, it is necessary to have reference data for percentiles P3 and P97 estimated as accurately as possible. Precisely, such extreme percentiles are the ones used to refer a child for a potential
Table 4. Weight (kg) of children aged 5-19 years, Ecuador
AGE in years L M (p50) S p3 p10 p25 p75 p90 p97
BOYS
5 -1.09 17.6 0.179 13.2 14.3 15.7 20 22.9 26.8 6 -1.01 20.1 0.178 15.1 16.4 18 22.9 26.1 30.3 7 -0.93 22.8 0.178 17 18.5 20.3 25.9 29.5 34.1 8 -0.84 25.5 0.182 18.9 20.6 22.7 29 33.1 38.2 9 -0.74 28.3 0.190 20.6 22.6 25.1 32.4 37.1 42.9 10 -0.62 31.5 0.202 22.4 24.8 27.6 36.3 41.8 48.7 11 -0.49 35.1 0.215 24.3 27.1 30.5 40.8 47.2 55.2 12 -0.37 38.9 0.222 26.4 29.6 33.6 45.4 52.5 61.2 13 -0.29 43 0.218 29.2 32.9 37.3 50 57.6 66.6 14 -0.26 47.9 0.202 33.4 37.3 41.9 55.1 62.7 71.5 15 -0.27 52.6 0.183 37.8 41.9 46.6 59.7 67.1 75.6 16 -0.3 56.1 0.167 41.5 45.6 50.2 62.9 70 78 17 -0.32 58.4 0.152 44.4 48.3 52.8 64.8 71.4 78.8 18 -0.34 59.8 0.140 46.4 50.2 54.4 65.8 71.9 78.8 19 -0.35 60.6 0.132 47.8 51.4 55.5 66.4 72.2 78.7
GIRLS
5 -0.91 16.9 0.176 12.6 13.7 15.1 19.1 21.7 25 6 -0.87 19.3 0.172 14.5 15.8 17.3 21.8 24.7 28.2 7 -0.84 21.7 0.171 16.3 17.7 19.4 24.5 27.6 31.6 8 -0.83 24.3 0.177 18.1 19.7 21.7 27.6 31.3 35.9 9 -0.72 27.4 0.191 19.8 21.8 24.2 31.3 35.9 41.5 10 -0.45 31.1 0.208 21.7 24.1 27.1 35.9 41.3 47.8 11 -0.15 35.4 0.216 23.8 27 30.6 41 47 53.8 12 0 39.7 0.213 26.6 30.2 34.4 45.9 52.2 59.4 13 -0.14 43.8 0.196 30.5 34.1 38.4 50 56.6 64 14 -0.37 47 0.174 34.5 37.9 41.9 53.1 59.4 66.8 15 -0.54 49.2 0.158 37.3 40.6 44.4 55 61.1 68.2 16 -0.66 50.6 0.147 39.2 42.3 45.9 56.1 62 68.8 17 -0.72 51.4 0.140 40.3 43.4 46.9 56.7 62.4 69 18 -0.76 51.8 0.137 40.9 43.9 47.4 57 62.6 69.1 19 -0.77 52 0.135 41.2 44.2 47.6 57.2 62.7 69.1
kg: kilograms; L: Box-Cox power transformation; S: generalized coefficient of variation; M: 50th percentile; P3: 3rd percentile; P10: 10th percentile; P25: 25th percentile; P75: 75th percentile; P90: 90th percentile; P97: 97th percentile.

122 / Arch Argent Pediatr 2020;118(2):117-124 / Original article
additional medical examination. The data set on which references were based is large and representative enough of the study population to warrant the best estimation possible of the P3 and P97 percentile lines. In addition, the percentiles used in the current reference curves have been estimated based on the most advanced techniques, i.e., the LMS method developed by Tim Cole.23
Growth references provide authorities with information about children’s growth status and are critical to identify groups and individuals at
Table 5. Body mass index (BMI, kg/m2) of children aged 5-19 years, Ecuador
AGE in years L M (p50) S p3 p10 p25 p75 p90 p97
BOYS 5 -3.35 15.8 0.094 13.8 14.3 15 17 18.5 20.7 6 -2.74 16.2 0.107 13.8 14.4 15.2 17.6 19.2 21.7 7 -2.23 16.6 0.119 13.8 14.5 15.4 18.1 20 22.7 8 -1.82 17 0.132 13.8 14.6 15.6 18.7 20.8 23.6 9 -1.49 17.4 0.142 13.9 14.8 15.9 19.4 21.6 24.6 10 -1.23 18 0.141 14.1 15.1 16.3 20.1 22.5 25.6 11 -1.04 18.5 0.147 14.3 15.4 16.8 20.7 23.2 26.4 12 -0.91 19 0.148 14.6 15.8 17.2 21.3 23.8 27 13 -0.81 19.5 0.147 15 16.2 17.6 21.8 24.3 27.4 14 -0.73 20 0.142 15.4 16.7 18.1 22.3 24.7 27.6 15 -0.66 20.5 0.146 15.9 17.2 18.6 22.7 25 27.8 16 -0.58 20.9 0.139 16.4 17.6 19.1 23.1 25.3 27.8 17 -0.49 21.3 0.133 16.8 18.1 19.5 23.4 25.5 27.9 18 -0.4 21.7 0.127 17.2 18.5 19.9 23.7 25.7 27.9 19 -0.31 22 0.122 17.6 18.9 20.3 23.9 25.8 27.9
GIRLS
5 -1.88 15.6 0.116 12.9 13.6 14.5 16.9 18.6 20.7 6 -1.65 15.9 0.121 13.1 13.9 14.7 17.4 19.1 21.2 7 -1.46 16.3 0.128 13.2 14 15 17.8 19.6 21.9 8 -1.29 16.7 0.136 13.4 14.3 15.3 18.4 20.4 22.8 9 -1.12 17.2 0.144 13.6 14.5 15.7 19.1 21.2 23.8 10 -0.96 17.8 0.130 13.8 14.9 16.1 19.8 22 24.7 11 -0.83 18.4 0.133 14.2 15.3 16.6 20.5 22.8 25.6 12 -0.75 19 0.133 14.7 15.8 17.2 21.2 23.5 26.3 13 -0.69 19.8 0.150 15.3 16.5 17.9 22 24.3 27.1 14 -0.65 20.5 0.145 15.9 17.2 18.6 22.7 25 27.7 15 -0.62 21.1 0.139 16.5 17.8 19.2 23.2 25.5 28.1 16 -0.58 21.6 0.134 17 18.3 19.8 23.7 25.9 28.3 17 -0.54 21.9 0.129 17.5 18.7 20.2 24 26.1 28.5 18 -0.5 22.2 0.124 17.8 19.1 20.5 24.2 26.3 28.5 19 -0.47 22.5 0.120 18.1 19.4 20.8 24.4 26.4 28.6
L: Box-Cox power transformation; S: generalized coefficient of variation; M: 50th percentile; P3: 3rd percentile; P10: 10th percentile; P25: 25th percentile; P75: 75th percentile; P90: 90th percentile; P97: 97th percentile
risk for disease or requiring urgent care.35 Growth curves are used in the detection, surveillance, and follow-up of children’s and adolescents’ health, and are adequate to detect nutritional disorders.36 These references are a useful tool for the static and dynamic diagnosis of growth disorders, to track growth in surveillance systems, and analyze and report growth data and trends in different populations.37
Reference curves , deve loped for the Ecuadorian population, allow to detect children whose height/weight is above or below the

Growth references for weight, height, and body mass index for Ecuadorian children and adolescents aged 5-19 years / 123
“normal variation” (in general, above or below the P97 or P3, respectively). Such curves constitute a reliable tool only if they correctly represent the population, i.e., if data may be considered a representative sample of the population. For this reason, reference curves based on a study population always have a better performance than any other type of curves.
The reference curves published by the WHO are of great value as a common global reference that enables countries to establish their growth status. However, the WHO curves may hardly be representative of all other populations, especially during puberty and adolescence, when genetic, geographical, and socioeconomic differences are fully expressed. They are very useful for countries that lack their own growth data to develop local reference curves.12
It is worth noting some of the limitations of this study, such as the small number of data corresponding to the extreme ages (5 and 19 years), which did not prevent us from achieving a good fit. In fact, based on the statistical analysis, the models meet the assumption of normality after performing the power transformation.
Since at that time there was no global growth reference for this age group, these new curves should be used in the clinical practice in Ecuador as a complement of growth assessment, which, to date, has been done based exclusively on international tools.
CONCLUSIONThe tables and curves obtained with this study
are the first descriptive growth references for Ecuadorian children and adolescents aged 5-19 years; therefore, they may be used as a national, supplementary instrument for growth assessment and serve as the starting point for further research about this topic in Ecuador. n
AcknowledgmentsWe would like to thank the more than
6000 children and adolescents, and their parents, for participating in the surveys, the schools, and the local authorities of the cities of Tulcán, Tena, Quito, and Santa Elena. Also, we want to thank the students of the school of medicine of the School of Health Sciences Eugenio Espejo, UTE, for their help with the collection of anthropometric measurements. Finally, we thank Professor Horacio Lejarraga for his contributions to the final manuscript.
REFERENCES1. Lejarraga H. Consideraciones sobre el uso de tablas de
crecimiento en Argentina. Arch Argent Pediatr. 2007; 105(6):545-51.
2. WHO Multicentre Growth Reference Study Group. WHO Child Growth Standards based on length/height, weight and age. Acta Paediatr. 2006; (Suppl 450):76-85.
3. Hamill PV, Drizd T, Johnson CL, Reed RB, et al. NCHS Growth Curves for children, Birth–18 years. United States. Vital Health Stat 11. 1977; (165):1-74.
4. De Onis M, Onvango AW, Borghi E, Sivam A, et al. Development of a WHO growth references for school-aged children and adolescents. Bull World Health Organ. 2007; 85(9):660-7.
5. Kulaga Z, Litwin M, Tkaczyk M, Rózdzynka A, et al. The height-, weight-, and BMI-for-age of Polish school-aged children and adolescents relative to international and local growth references. BMC Public Health. 2010; 10:109.
6. Rosario AS, Schienkiewitz A, Neuhauser H. German height references for children aged 0 to under 18 years compared to WHO and CDC growth charts. Ann Hum Biol. 2011; 38(2):121-30.
7. Sánchez González E, Carrascosa Lezcano A, Fernández García JM, FerrándezLongás A, et al. Estudios españoles de crecimiento: situación actual, utilidad y recomendaciones de uso. An Pediatr (Barc). 2011; 74(3):193.e1-16.
8. So HK, Nelson EA, Sung RY, Ng PC. Implications of using World Health Organization growth reference (2007) for identifying growth problems in Hong Kong children aged 6 to 18 years. Hong Kong Med J. 2011; 17(3):174-9.
9. Atalah S, Loaiza S, Taibo M. Estado nutricional en escolares chilenos según la referencia NCHS y OMS 2007. Nutr Hosp. 2012; 27(1):1-6.
10. Orden A, Apezteguía M. Weight and height centiles of Argentinian children and adolescents: a comparison with WHO and national growth references. Ann Hum Biol, 2016; 43(1):9-17.
11. Tarupi WA, Lepage Y, Hauspie R, Félix ML, et al. Estudio transversal del crecimiento infantil y de adolescentes en Ecuador. Rev Argent Antropol Biol. 2019; 21(2):e006.
12. Milani S, Buckler JM, Kelnar CHJ, Benso L, et al. The use of local reference growth charts for clinical use or a universal standard: a balanced appraisal. J Endocrinol Invest. 2012; 35(2):224-6.
13. Lejarraga H, Orfila G. Estándares de peso y estatura para niñas y niños argentinos desde el nacimiento hasta la madurez. Arch Argent Pediatr. 1987; 85(4):209-22.
14. López de Blanco M, Izaguirre de Espinoza I, Macias de Tomei C. Crecimiento y maduración física, bases para el diagnóstico y seguimiento clínico. Madrid: Panamericana; 2013.
15. Duran P, Merker A, Briceño G, Colón E, et al. Colombian References growth curves for height, weight, body mass index and head circumference. Acta Paediatr. 2016; 105(3):116-25.
16. Wright CM, Booth IW, Buckler JMH, Cameron N, et al. Growth reference charts for use in the United Kingdom. Arch Dis Child. 2002; 86(1):11-4.
17. Kagawa M, Tahara Y, Moji K, Nakao R, et al. Secular changes in growth among Japanese children over 100 years (1900-2000). Asia Pac J Clin Nutr. 2011; 20(2):180-9.
18. Roelants M, Hauspie R, Hoppenbrouwers K. References for growth and pubertal development from birth to 21 years in Flanders, Belgium. Ann Hum Biol. 2009; 36(6):680-94.
19. Monnier C, Vercauteren M, Susanne C. Estudio de crecimiento de la población escolar de Quito (Ecuador). Antropo. 2003; 5:9-20.

124 / Arch Argent Pediatr 2020;118(2):117-124 / Original article
20. Monnier C, Hauspie R, Cruz Albornoz J. Estudio del crecimiento y desarrollo de niños ecuatorianos residentes en Quito, según su origen social. Tsafiqui, 2011; 2(2):129-42.
21. World Health Organization. Physical status: the use of and interpretation of anthropometry: Report of a WHO Expert Committee. Geneva: WHO; 1995.
22. World Health Organization. Multicentre Growth references Study Group. WHO child growth standards: length/height-for-age, weight-for-age, weight-for-length, weight-for-height, and body mass index-for age: methods and development. Geneva: WHO; 2006.
23. Cole TJ, Green PJ. Smoothing reference centile curves: the LMS method and penalised likelihood. Stat Med. 1992; 11(10):1305-19.
24. Cole TJ. Using the LMS method to measure skewness in the NCHS and Dutch national height standards. Ann Hum Biol. 1989; 16(5):407-19.
25. Cole TJ. The LMS method for constructing normalized growth standards. Eur J Clin Nutr. 1990; 44(1):45-60.
26. Cole TJ. Constructing growth charts smoothed across time and space. In: Hauspie R, Lindgren G, Falkner F. Essays on Auxology presented to James Mourilyan Tanner. UK: Castlemead; 1995.Pages76-88.
27. Pan H, Cole TJ. A comparison of goodness of fit tests for age-related reference ranges. Stat Med. 2004; 23(11):1749-65.
28. Royston P, Wright EM. Goodness-of-fit statistics for age-specific reference intervals. Stat Med. 2000; 19(21):2943-62.
29. Van Buuren S, Fredriks M. Worm plot: A simple diagnostic
device for modelling growth reference curves. Stat Med. 2001; 20(8):1259-77.
30. Healy M, Rasbash J, Yang M. Distribution-free estimation of age-related centiles. Ann Hum Biol. 1988; 15(1):17-22.
31. R Core Team. R: A language and environment for statistical computing. R Foundation for Statistical Computing, Vienna, Austria. 2018. [Accessed on: September 9th, 2019]. Available at: https://www.R-project.org/.
32. Lejarraga H. ¿Qué son los percentilos? Rev Hosp Niños (B Aires). 1974; 16(63):45-7.
33. Lepage Y, Tarupi W, Campbell J, Monnier C, et al. Edad de la menarquia en Ecuador. Antropo. 2014; 31:1-8.
34. Tanner J, Whitehouse R, Takaishi M. Standards from birth to maturity for height, weight, height velocity and weight velocity: British children, 1965. II. Arch Dis Child. 1966; 41(220):613-35.
35. De Onis M, Garza C, Victoria CG, Onyango AW, et al. The WHO Multicentre Growth References Study: Planning, study design, and methodology. Food Nutr Bull. 2004; 25(1 Suppl.):S15-26.
36. Fayter D, Nixon J, Hartley S, Rithalia A, et al. Effectiveness and cost-effectiveness of height-screening programmes during the primary school years: a systematic review. Arch Dis Child. 2008; 93(4):278-84.
37. De Onis M, Garza C, Victoria CG, Bhan MK, et al. The WHO Multicentre Growth Reference Study: Rationale, planning, and implementation. Food Nutr Bull. 2004; 25(Suppl 1):S3-89.

Growth references for weight, height, and body mass index for Ecuadorian children and adolescents aged 5-19 years / I
Annex 1. Ecuador, height- and weight-for-age, 5-19 years old. GIRLS
.

II / Arch Argent Pediatr 2020;118(2):117-124 / Original article
Annex 2. Ecuador, body mass index, 5-19 years old. GIRLS
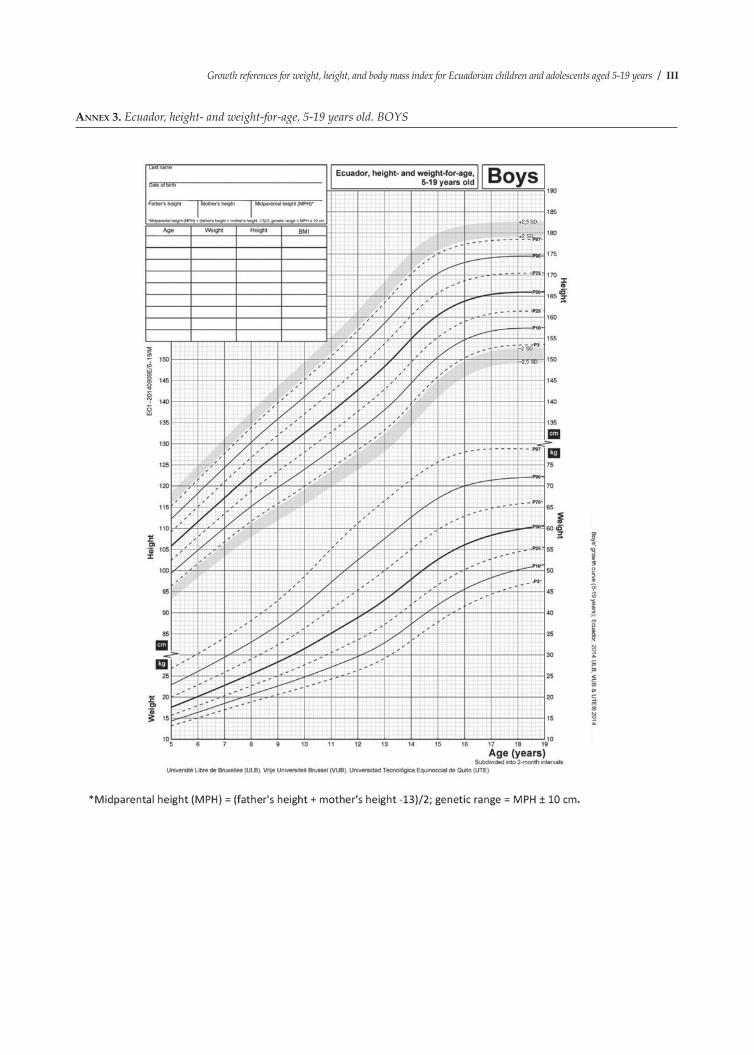
Growth references for weight, height, and body mass index for Ecuadorian children and adolescents aged 5-19 years / III
Annex 3. Ecuador, height- and weight-for-age, 5-19 years old. BOYS
.

IV / Arch Argent Pediatr 2020;118(2):117-124 / Original article
Annex 4. Ecuador, body mass index, 5-19 years old. BOYS