Embed Size (px)
Citation preview
Human Resouroes Development and Operations Policy
June 19
0~ 2 7
G L'OBU "A L I N DICA";"A T OuRS O F.NU muI N A I T I ..... N A L RISK .II
NICROFICHE COPY
Report No. :12170 TyPe: (MIS)Title: GLOBAL INDICATORS OR NUTRITIONAuthor: GALLOWAY, RAEExt.: 0 Room: Dept.:HRO WORKING PAPER JUNE 1993
Rae Galloway
Papa. a nnthsuiamnaifommlpubhicatimof theWaldBDa ilneypas smuy adunapolisd results analyss dhatis hWkdsltadoaiaara
hdisusi and commait chdai and th uwe oif such a pape should take accomntof iu provi*soal chaactr. The fir.dngs, inzepratatiai. ad wandWu=s
eqspsad in thi pae an aiendy thoe of the ahosw(s) and shudnot vhe atunbltd inany manmw to fth Worl Dank to ito afflaemd oqm;*a or to
memibus ofts Baof ciExe e Dito.. or th countries ty r Le' s '
Pub
lic D
iscl
osur
e A
utho
rized
Pub
lic D
iscl
osur
e A
utho
rized
Pub
lic D
iscl
osur
e A
utho
rized
Pub
lic D
iscl
osur
e A
utho
rized
Pub
lic D
iscl
osur
e A
utho
rized
Pub
lic D
iscl
osur
e A
utho
rized
Pub
lic D
iscl
osur
e A
utho
rized
Pub
lic D
iscl
osur
e A
utho
rized
Global Indicators of Nutritional Risk (1)
byRae Galoway
Abstract
These tables were developed to help World Bank staff working in Operations in assessingthe nutrition situation in developing countries. Indicators for nutritional risk include low birthweight, anthropometric measures, and breastfeeding prevalence. Of these, anthropometry ismost commonly used because physical size, which it measures, is a good indicator of overallnutritional risk. Where available, information is presented on the percentage of children underfive who are stunted, wasted and underweight. Stunting is a measure of chronic malnutrition,wasting is a measure of acute malnutrition and underweight is a composite of stunting andwasting figures. While low birth weight and breastfeeding prevalence figures are less directmeasures of nutritional status, they can give some indication of the nutritional risk of smallchildren. Low birth weight figures have the extra added advantage of giving evidence formaternal malnutrition.
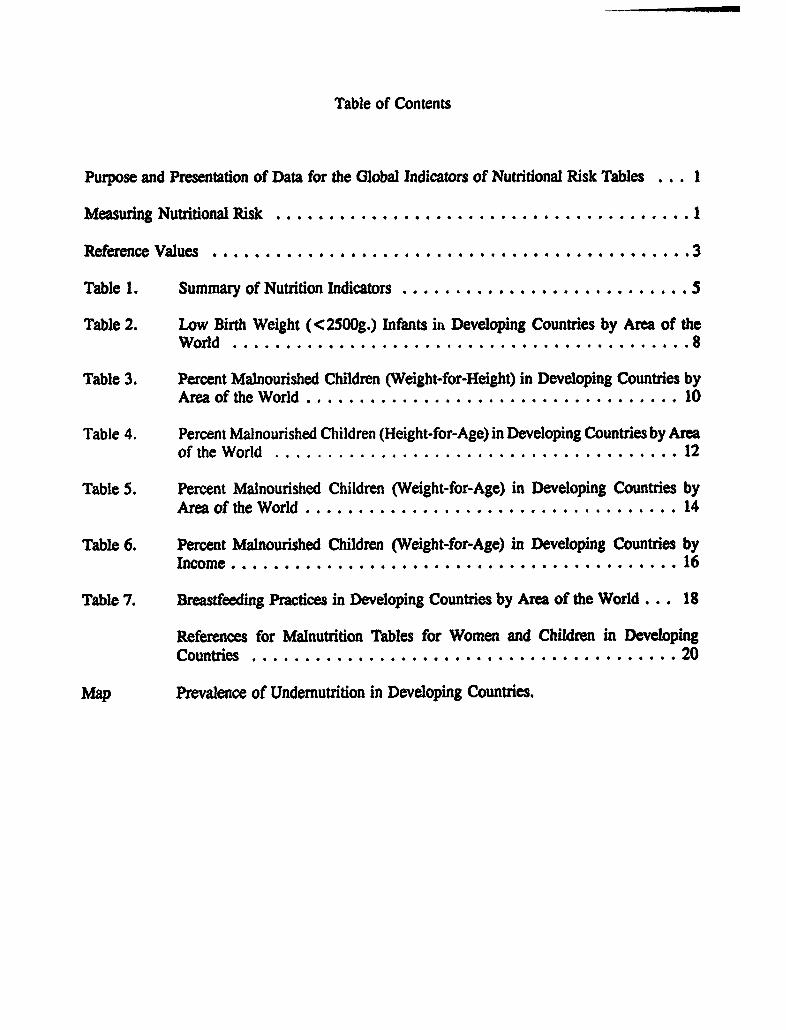
Table of Contents
Purpose and Presentation of Data for the Global Indicators of Nutritional Risk Tables ... 1Measuring Nutritional Rislk ....... I * 4....... * .. 4...*4 * *..... 4 4 1Reference Values ........................................
3Table 1. Summary of Nutrition Indicators .... ..................... STable 2. Low Birth Weight (<2500g.) Infants il Developing Countries by Area of theWorld
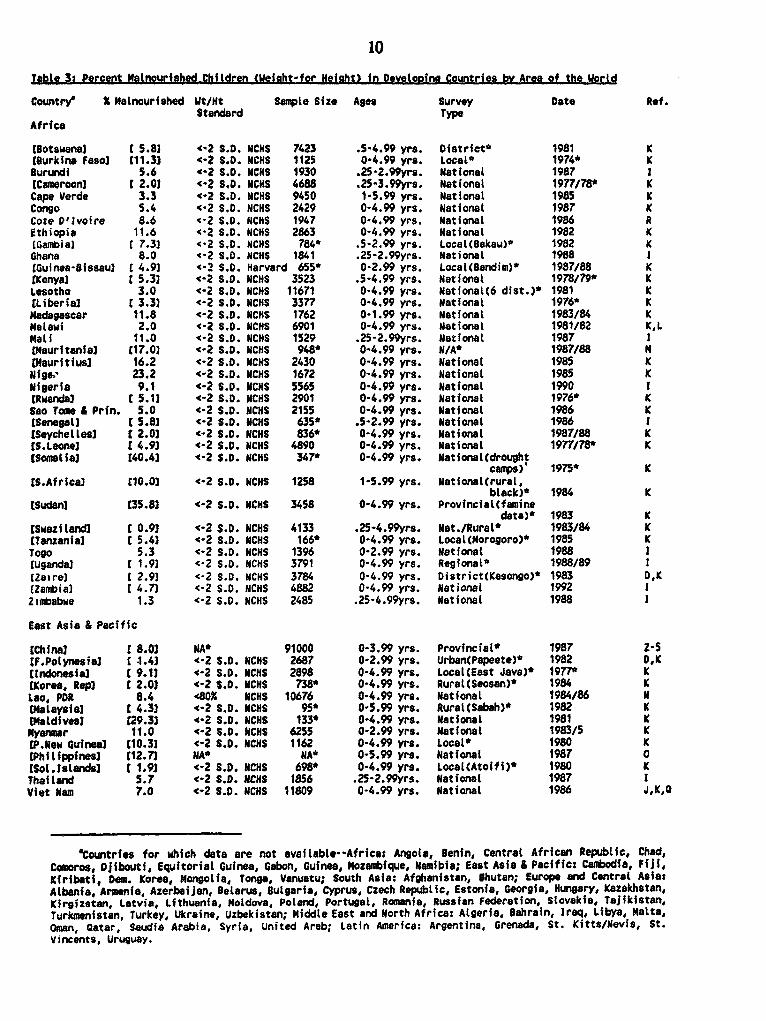
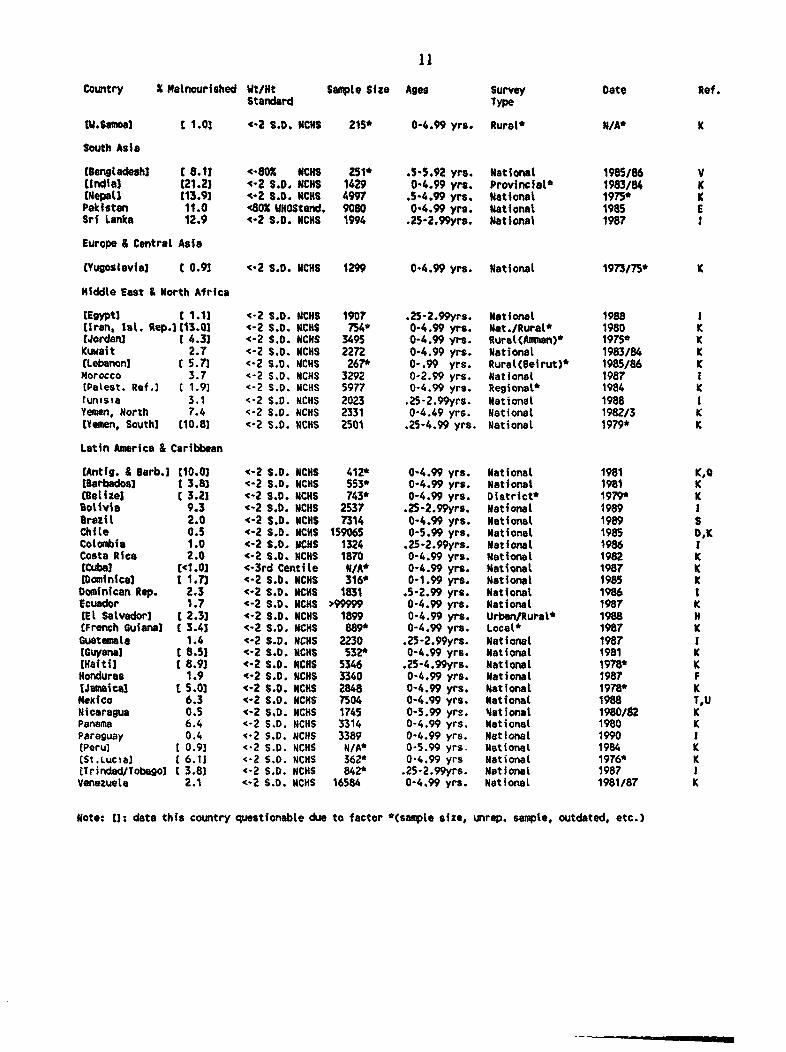
.... 8Table 3. Percent Malnourished Children (Weight-for-Height) in Developing Countries byArea of the World .......
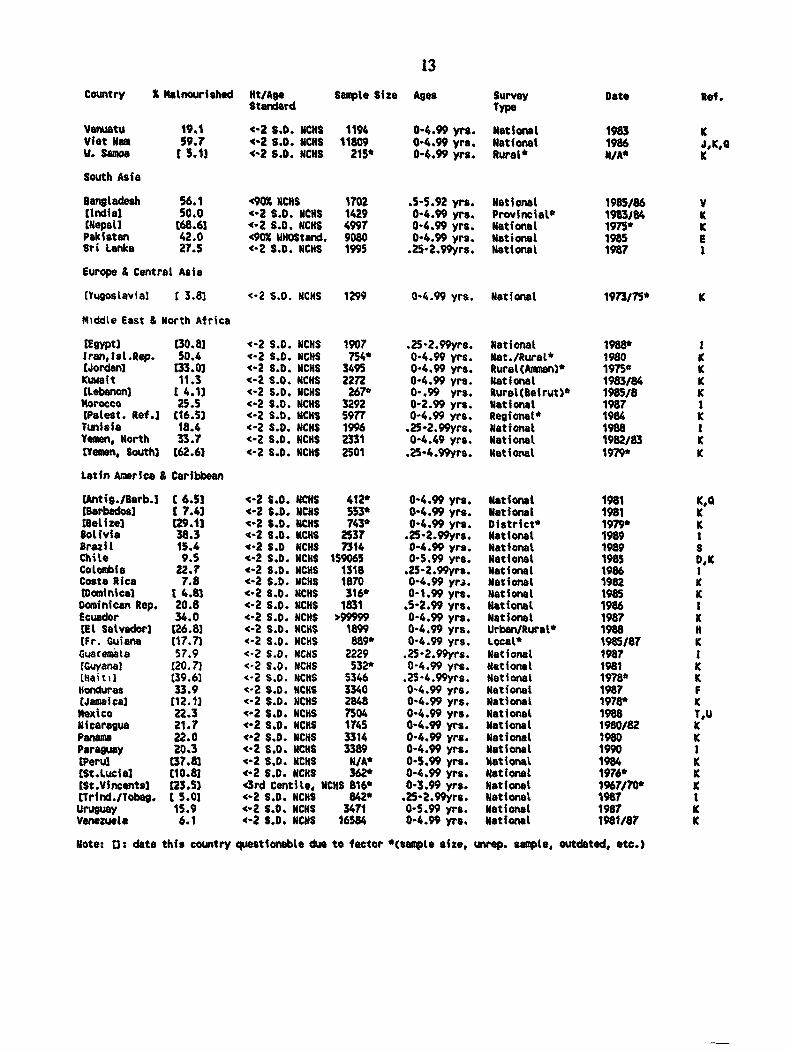
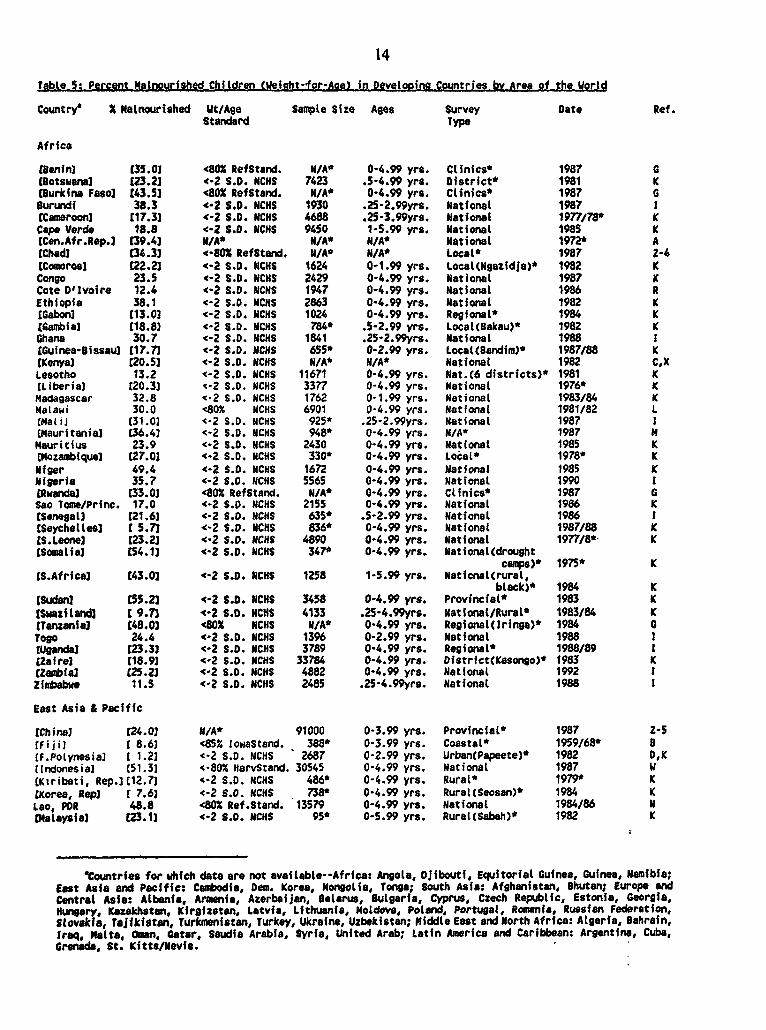
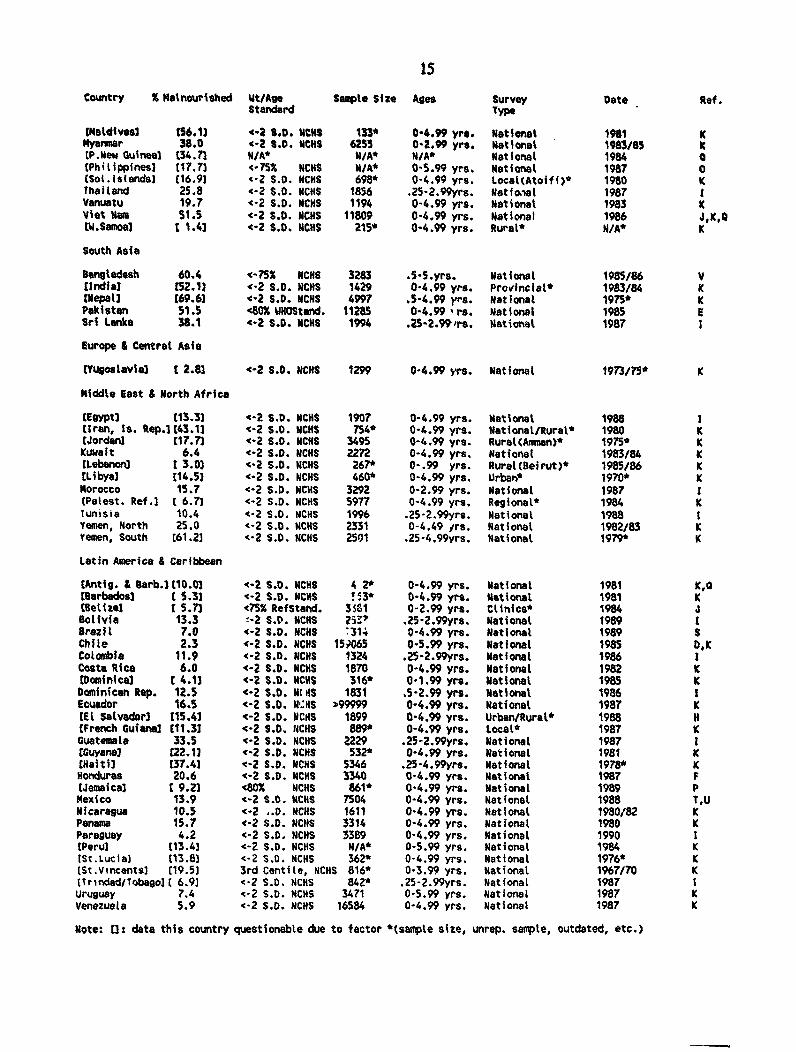
10Table 4. Percent Malnourished Children (Height-for-Age) in Developing Countries by Areaof the World ... 12Table 5. Percent Malnourished Children (Weight-for-Age) in Developing Countries byArea of the World .1.........14
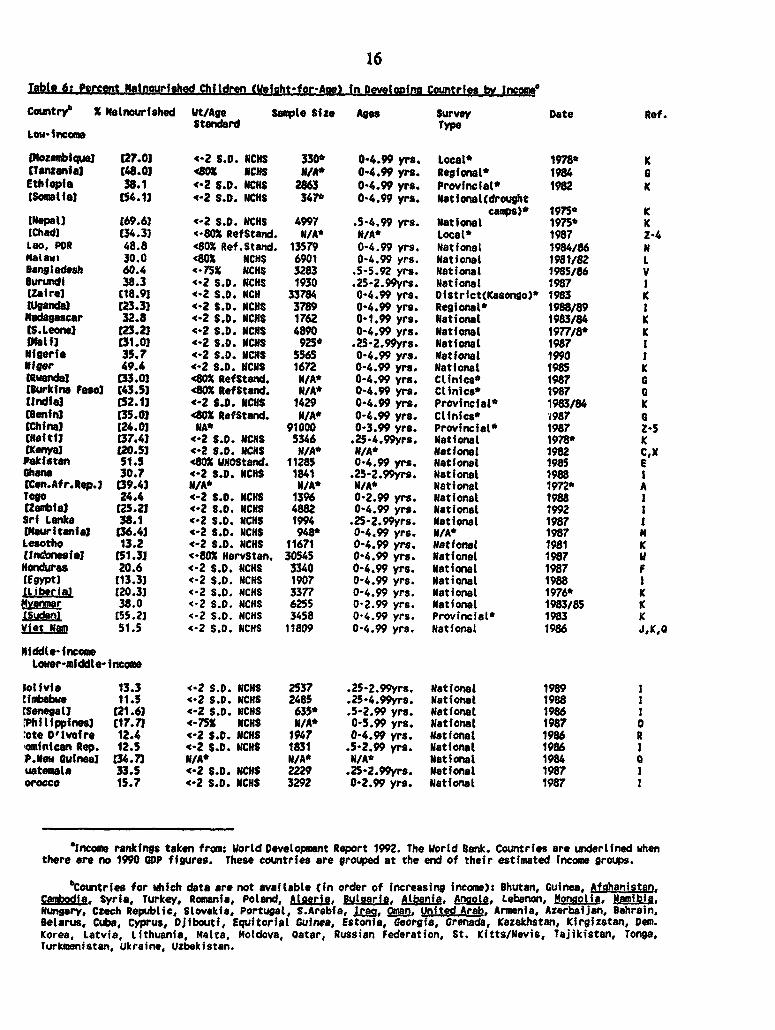
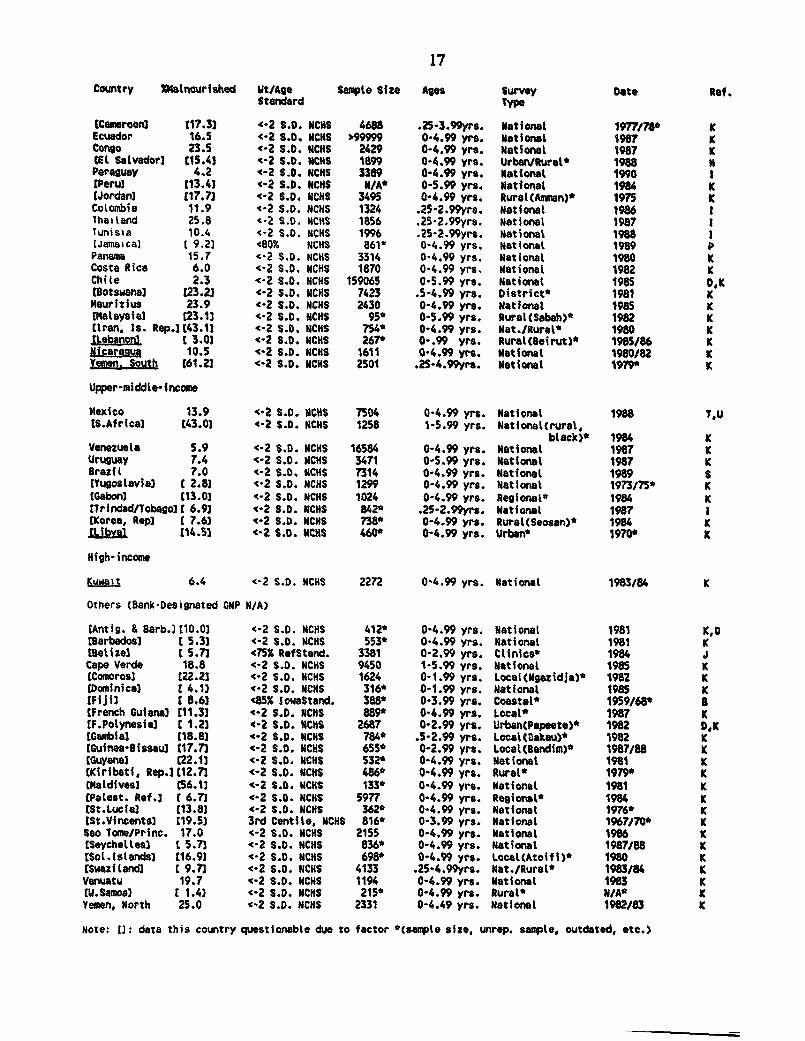
Table 6. Percent Malnourished Children (Weight-for-Age) in Developing Countries byIncome ......................16
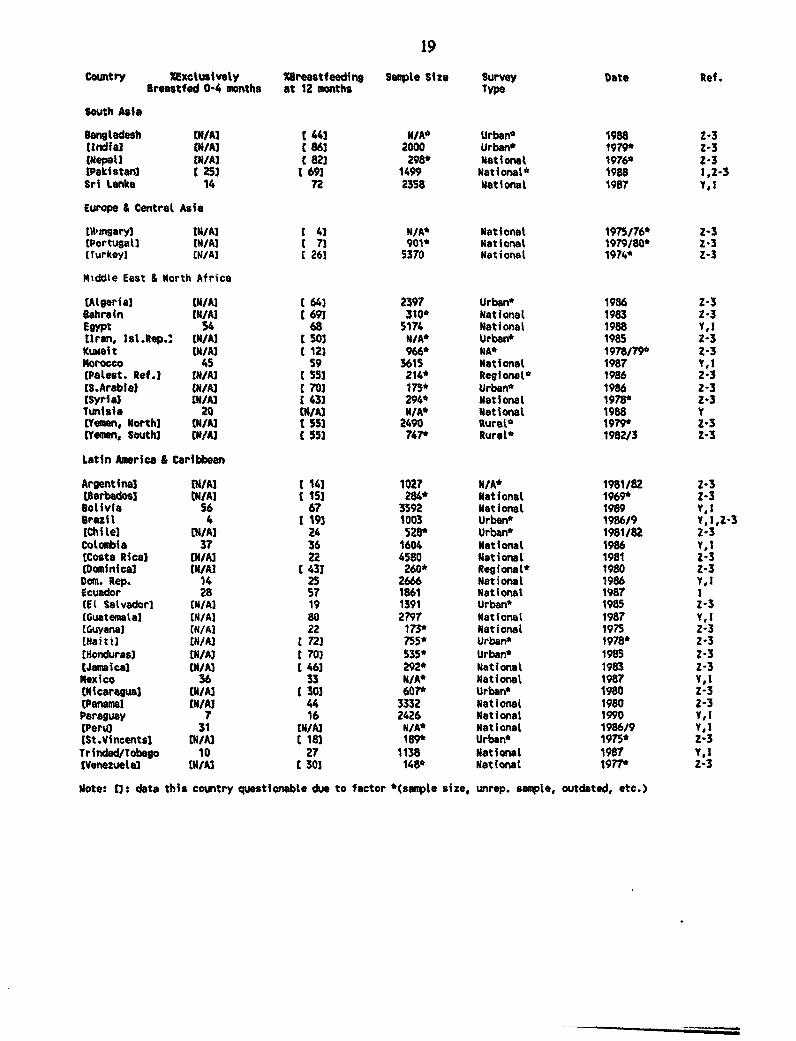
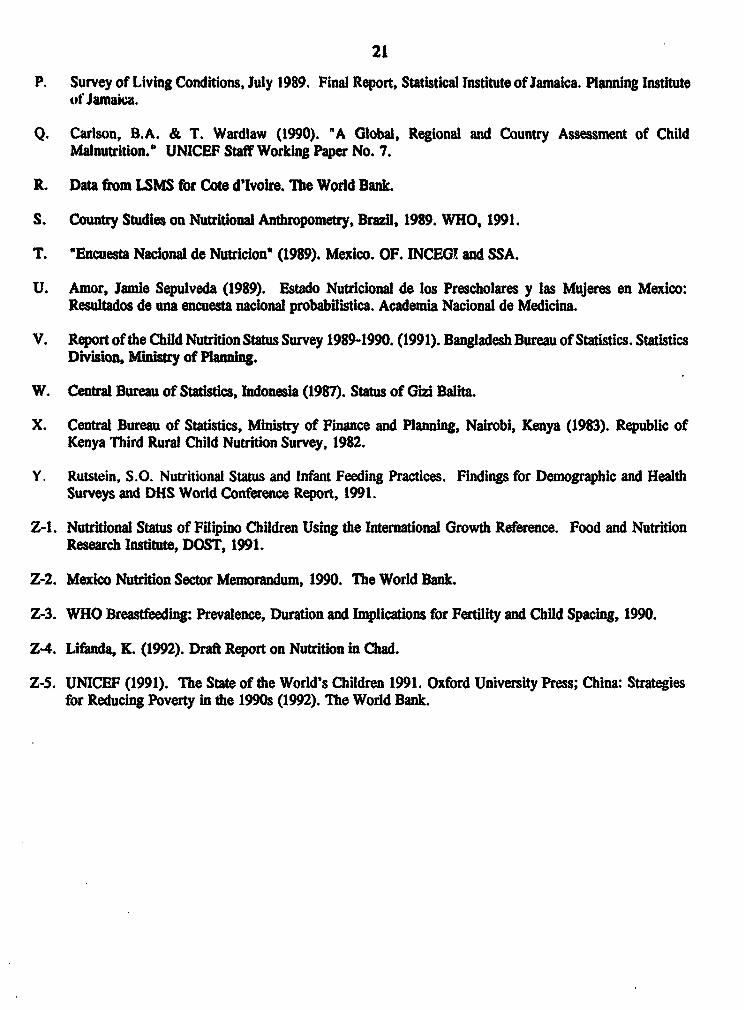
Table 7. Breastfeeding Practices in Developing Countries by Area of the World... 18References for Malnutrition Tables for Women and Children in DevelopingCountries...
.. ............... 20Map Prevalence of Undernutrition in Developing Countries.
Purpose and Presentation of Data for the Global Indicators of Nutritional Risk Tables
This is the second edition of the global indicators of nutitional risk tables. In the firsteditiscn only underweight data (weight/age) for children under five were presented. These datahave been updated and appear by region of the world (Table 5) and by income (Table 6). Inorder to present a more comprehensive view of malnutrition in developing countries, several newindicators have been included in this edition. Measures for acute malnutrition or wasting(weight/height) and chronic malnutrition or stunting (height/age) have been added (Tables 3 &4). Low birth weight figures, often used as an indicator of maternal malnutrition, are alsopresented (Iable 2).
Breastfeeding prevalence information (Table 7) has been included because it constitutesthe key food source for young infants and because the decline in breastfeeding and use ofbreastmilk substitutes increases the risk of infection and malnutritioni. In addition, over-dilutingbreastmilk substitutes, which is common in families that don't have enough money to buyadequate supplies, can lead to malnutrition because the child does not receive the calories andnutrients needed for proper growth. A summary of all the data is presented in Table 1. Inaddition to nutrition indicators, child mortality rates (for years 1990 and 2025) are shown.'
Only data that are nationally representative, relatively recent (since 1980), have anadequate sample size (n> 1,000 or studies that are statistically representative of the populationfor small countries), and supply information on the standards and ages used are consideredreliable. The country and data are qualified by brackets [O when one or more of these items isdeficient. the deficient characteristic is starred. For a few countries there are several studiesto choose from. If national data were available prior to 1980, considerably more recent, lessextensive data were chosen, if available. These tables have been sent to Bank staff workingin Operations and their comments are reflected in this publication. To explain anthropometryas a measure of nutritional status, there is a brief discussion below on anthropometric measures.
Measuring Nutritional Risk
Nutritional risk is measured for the individual. There are several acceptable measuresof nutritional risk: anthropometry, dietary intake, biochemical markers of the nutrients (protein,fat, carbohydrates, water, vitamins and minerals), and clinical signs of nutritional deficiency.Of these, anthropometry is the most commonly used because physical size, which it measures,is a good indicator of overall nutritional risk. Anthropometric measurements are also objective,relatively easy to collect, and, like other indicators of nunritional risk, can be compared againstestablished international standards. Anthropometric indicators are age-specific and includeheight (or length), weight, weight for height, arm circumference, head circumference, andskinfold thickness. Because growth is sensitive to nutritional deficiency, these measurementsare frequently used on growing children to measure nutritional status over time.
tChild mortality data were compiled by Ms. My Vu in the Population Policy Advisory Service of the WorldBank.
2
Anthropometry is also being used to ascertain and monitol status and
predict birth outcomes? such as birthweight, maternm a, and complicatons during labor.
While national data on maternal nutrition ing anthroponetric measures are virtually
non-existent, efforts are being m gather this type of information. For example, the
Demographic H ealn to coUlect height and weight data on women in future
surveys3. --
Anthropometric indicators can be used for any age as one-time measures to assess the
magnitude and distribution of malnutrition of a population group. Height measures secular
changes over dme. These secular changes are attibuted to improvements in the quality of life'
including diet.
Weightfor height (wasting) is a measure of acute nutritional well-being. When children
are faced with chronic but moderate nutritional deficiency or have chronic infections they grow
less in both weight and height. As the severity and duration of nutritional deficiency increases,
children cease to grow altogether, tissue reserves are broken down to supply energy, and the
process of wasting occurs.$ Children 12-24 months of age show a peak prevalence of
inadequate weight-height because of high diarrheal burden, inadequate food during weaning,
anorexia from bouts of diarrhea or infection and increased losses during episodes of infection.
High weight for height is called obesity. Obesity data are not available for most developing
countries, but because overnutrition is an emerging problem, it is anticipated that more attention
will be given to expressing this information in the future.
Heightfor age (stunting) is a measure of linear growth. Nutritional deprivation rapidly
affects skeletal growth and results in stwing. Growth is compromised usually from low intakes
of food and frequent bouts of infection. In most developing countries, the proportion of stunting
in children increases up to the age of 24 to 36 months and then remains constant.' Children
who are stunted at the age of te will probably be small adults.7
Weightfor age (underweight) is a composite of weight for height and height for age.
Beue of the difficulty of assessing height accurately, weight for age has been the most
2 Matemal andhopomey for prediction of pregnancy outcomes: Memorandum from a USAIDAVHO/PARO
MotherCar meeting. Bull. WHO 69(5):523-532.
3Elizabeth Sommerfelt, DHS, person communication, June, 1992.
Martorell, R. (1985). Child growth retardation: a discussion of its causes and its relationship to health. In:
(K. Blaxter & J.C. Waterlow, eds.). Nutrition Adaptation in Man, London & Paris: John Libbey.
'Martorell. R. (1985). op. cit.
'WHO, 1986, op. cit.
WMartorell, R. (1990). Importance of childhood retadation for adult body size. Statement prepared for the
Expert Meeting of Economic Consequences of Health Programs in LDCs, Committee on Population, National
Academy of Sciences, June 25-26.
commonly used measure of nutritional status and has been widely used in clinics for growthmonitoring. In very small children weight is as sensidve a measure of nutritional status asheight. In older children, low weight for age largely reflects stunting, because weight for heightis usually normal.
When assessing nutritional status, it is best to examine the indicators for both stunting(height for age) and wasting (weight for height) in children8, although these alone do not revealnutritional problems related to micronutrient deficiencies. Low weights and heights may be theresult of non-dietary factors as well. A good picture of protein-energy malnutrition problemsof a community can be obtained using these indicators nonetheless.
Low birth weight infants are those born with weights less than 2500 g. Infants may below birth weight because of prematurity or because of intra-uterine growth retardadion. Eightypercent of the low birth weights in developing countries are full-term but small for gestationalage, suggesting intra-uterine growth retardadon. Because the growth of the fetus is dependenton the nutritional status of the mother, the percentage of low birth weight in a country can alsobe used as an indicator of maternal malnutrition. The combination of low prepregnancy weightand poor weight gain during pregnancy put women at the greatest risk for delivering a low birthweight infante. It is likely that her own nutritional stores are compromised as well.Breasfeeding prevalence information is most useful if it is presented at different periodsin the infant's life; however, the pearentage of mothers breastfeeding at any point does not giveinformation on the quality or duration of breastfeeding. Exclusive breastfeeding during the first0 to 4 months is recommended because breastmilk is the only food required for the propergrowth of infants during this period and because the introduction of other foods or water canincrease the risk of infection and also reduce the suclding response and production of breastmilk.When the child is 4-6 months old, solid foods sho ld be introduced but breastfeeding shouldcontinue to at least 2 years.
Reference Values
The anthropometric reference standards are based on a population of well-nourishedchildren. Several different reference values have been used historically for anthropometricmeasurements (height for age, weight for age, and weight for height). The U.S. National Centerfor Health Statistics (NCHS) standard is now adopted by the World Health Organization as theglobal reference standard. There has always been some controversy about genetic differencesbetween populations and the appropriateness of references from Western countries for childrenin developing countries. Some countries have, as a result, developed their own references.
Waterlow, LC., R. Buzins, W. Ketler, I. Lane, M.Z. Nicbaman & L. Tanner (1977). he presention anduse of heigt and weight dat for comparing the nutritional statw of groups of childn undet the sge of 10 years.Bulletin of the Wotld Health Organizaton SS(4):489-498.
'Matenal anthropometry, 1991, op. cit.
4
From a variety of studies, it is clear that well-nourished children prioi to puberty have the same
growth potential regardless of ethnic group although there is variation in body size between
social classes which is true for both industrial and developing countries."0
Data for malnutrition should be presented as distributions--the proportion of the
population failing below a specified centile, standard deviation or Z-score. The next best
presentation is the percent falling under a given percent of the reference median. They should
not be represented as population medians or means. The reference distribution is normal with
2.3% of healthy children falling . standard deviations below the median (-2Z). If significantly
more than 2.3% of children fall below -2Z then there is probably an under-nutrition problem.
If significantly more than 2.3% of children are above +2Z (weight for height) then there is
probably an over-nutrition problem (obesity).
In the past most anthropometric data were expressed as proportions of children falling
below a specified percent of the median. Children falling below 80% of the NCHS median
weight for age or weight for height and 90% of the median height for age were classified as
malnourished. (Some researchers may use the Gomez classification of weight for age (<60%
of the median {severe}; 61-75% of the median {moderate); 76-90% of the median (mild);
>90% of the median (normal)). The variance of different indicators changes at different ages.
Hence, 80% of the median height for aget may mean much more severe malnutrition at age one
than at age five. The Z-score system normalizes the anthropometric measures for these age-
specific variances.
There is a direct relationship between centiles and standard deviations. Minus 2 standard
deviations is identical to 2.27th centile and -1.88 standard deviations is equal to the third
centile'. In growth monitoring, weight is usually plotted against age. Cutoffs for well-
nourished and malnourished children are used as reference curves, but the child's previous
growth patterns becomes the real reference. The child may, because of past nutritional insult,
be stunted and below the reference curve, but may be growing at a normal rate altbough
remedial action can sometimes restore them to the normal range for their age. That child is not
currently at high nutritional risk. If the child later experiences a sudden drop away from the
expected growth curve, the child needs attention to correct the cause of the problem.
'°Martorell, R. & J.P. Habicht (1986). Growth in early childhood in developing countries. (F. Falkner & J.M.
Tannr. eds.) Hfoman growth: A Comprehensive Treatise. Second edition. Volume 3. Methodology: Ecological,
Genetic, and Nutritional 4ffects on Growth. New York and London: Plenum Press.
"WHO, 1986, op. cit.
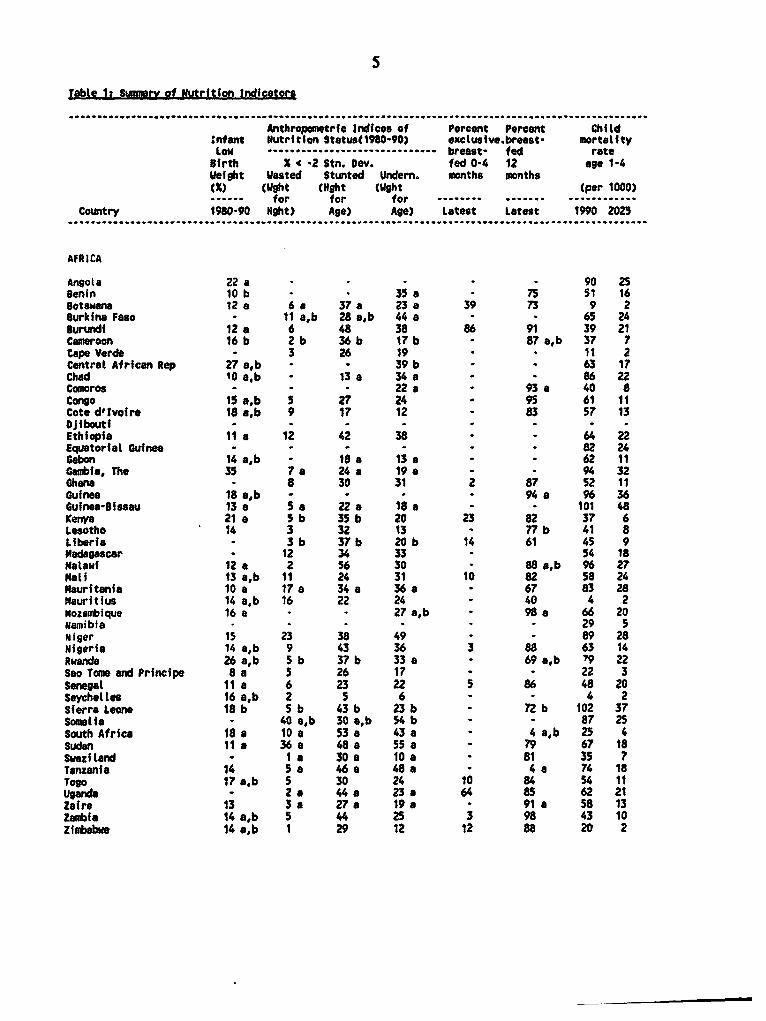
Table 1: SI.mrv of Nutrition Irdicators.. *... .... .................................................................
Anthropcamtrio Indiros of Percent Percent Child?nfant Nutrition Ststus(198090) exclusive.breast- mortalityLow .............................. breast- led rateBirth % 4 -2 Stn. Dev. fed 0-4 12 age 1-4Ueight Wasted Stunted Undern. months monthstX) (Ught (lght (Wlght
(per 1000).1-- for for for ........ ....... ............
Country 1980-90 Nght) Age) Age) Latest Latest 1990 2025..............................
.......................................................................................
AfRICA
Angola 22 a
-90 25
Benin 10 b 35'a 75 51 16
Botswana 12 a 6a 37 a 23a 39 73 9 2
surkina Faso - 11 a,b 28 a,b 44 a - 65 24Surundi
12 a 6 48 38 86 91 39 21Cameroon
16 b 2b 36 b 17 b 87 a,b 37 7Cape Verde
3 26 19 * 11 2Central African Rep 27 a,b 39 b - 63 17Chad
O a.b - 13a 34 a- 86 22
Comoros - - 22 a 93 a 40 8
Congo 15a,b 5 27 24 95 61 11
Cote dlwvoire 18 a,b 9 17 12 83 57 13ojibouti fEthiopia
II a 12 42 38 - 64 22-quatorial Guinea
- - *- 82 24Gabon
14 a,b 18.a 13a- 62 11
Gambia, The 35 7 a 24a 19a - - 94 32Ghana
- 8 30 31 2 87 52 11Guinea 18 a,b - - - - 94 a 96 36Gui nea-Dissau 13 a 5 a 22 a 18 a - 101 48IKenya
21 a 5b 35b 20 23 82 37 6Lesotho
14 3 32 13 - 72b 41 8Liberia
3 b 37 b 20b 14 61 45 9Madagascar
- 12 34 33 54 18
Malawi 12 a 2 56 30 - 88 a,b 96 27
Hali 13 a,b 11 24 31 10 82 58 24
Mauritania 10 a 17 a 34 a 36 a 67 83 28
Mauritius 14 a,b 16 22 24 - 40 4 2
Mozambique 16 a
27 a,b - 98 a 66 20Namibia
* 29 5
Niger 15 23 38 49
89 28Nigeria
14 a,b 9 43 36 3 88 63 14Rwanda
26 a,b Sb 37 b 33a 69 a,b '9 22Sao Tom and Principe 8 a 5 26 17 - 22 3Senegal
t1 a 6 23 22 5 86 48 20Seychelles
16 a,b 2 5 6 - - 4 2Sierra Leone 18 b 5b 43b 23b - 72 b 102 37Somalia
- 40 a,b 30 a,b 54b 87 25
South Africa 18 a 10a 53a 43a 4 a,b 25 4Sudan
1t a 36a 48a 55a - 79 67 18Swaziland
- Ia 30a 10a 81 35 7Tanzania
14 5a 46a 48a 4 a 74 18Togo
17 a,b 5 30 24 10 84 54 11Uganda
- 2a 44a 23a 64 85 62 21Zaire
13 3a 27 a 19a 91 a 58 13Zamaia
14 a,b 5 44 25 3 98 43 10Zinbabwe
14 a,b 1 29 12 12 88 20 2
6
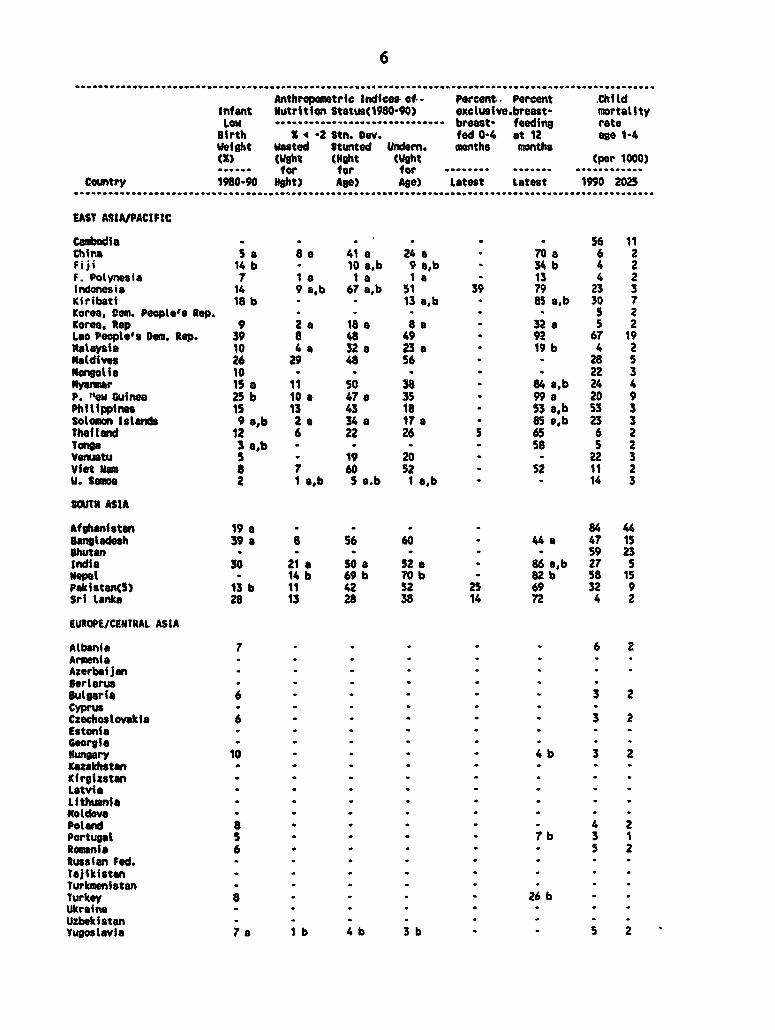
Anthroponetric Indfco& of - Perent. Percent Ch1Id
Infant Nutrition Status(1980*90) exclusive.breast- mortaoUty
Low .... * .----- breast- feeding rate
eSrth X -2 Stn. Dev. fed 0*4 at 12 age 1-4
weight wasted Stunted tndern. months months
WX) (Wght (ight CWght (per 1000)
for for for . -- . . .
Country 198090 light) Age) Age) Ltest Latest 190 2025
......................................................................................................
EAST ASIA/PACIFIC
Casbodia 56 11
China 5a 8 a 41 a 24 a TO a 6 2
Fiji 14b 10 a,b 9 a,b - 34 b 4 2
F. Polynesia 7 ta I a a - 13 4 2
Indonesia 14 9a,b 67 a,b 51 39 79 23 3
Kiribati 18 b ` 13 a,b 85 a,b 30 7
Korea, Com. People's Rep. .5
2
Koreoa, Rep 9 2a la as - 32 a 5 2
Lao People s Dem. Rep. 39 8 48 49 92 67 19
Malaysia 10 4a 32 a 23 a 19 b 4 2
Naldives 26 29 48 56 - 28 5
ongolia 10 -- 3
Nyanmar ISa 11 50 38 84 a,b 24 4
P. "e Guinea 25b 10. 47 . 35 99 a 20 9
PhIlippines 15 13 43 18 53 a,b 53 3
Solomon slands 9 s,b 2a 34 a 1T a 85 a,b 23 3
Thaflend 12 6 22 26 5 65 6 2
Tona 3 a,b - 58 5 2
venuatu S 19 20 22 3
Vot 11m 8 7 60 52 52 11 2
v. Samoa 2 1a,b 5 a.b l a,b - 14 3
=17TR ASIA
Afghanistan 19 a - -84 44
Dangladesh 39 a 8 56 60 44a 47 15
shutan 59 23
India 30 21a 0 a S2 a- 86 a,b 27 5
Na a 14b 69 b T0 b 82 b 58 15
Pakistan(S) 13 b 11 42 32 25 69 32 9
SriL anka 28 13 28 38 14 72 4 2
EUROPE/CENTRAL ASIA
Albania 7 - - 6 2
ArmeniaAzerbaijan
- - -
SerlarusBulgaria 6 - - - 3 2
Cyprus a - -
a -
Czechoslovakla 6 -- 3 2
Estonia . .
GeorgiaHungary 10 - - 4 b 3 2
KazakhstanKirgiastanLastYl Lithuania Notda
.
Potand 8 a a . - 4 2
Portugal S I b 3 1
Roanfan 6 - - 5 2
Russian Fed.TajikistanTurkmenstanTurkey 8 - a - 26 b
UkraineUzbekistanYugoslavia a lb 4b 3 b - 5 2
7
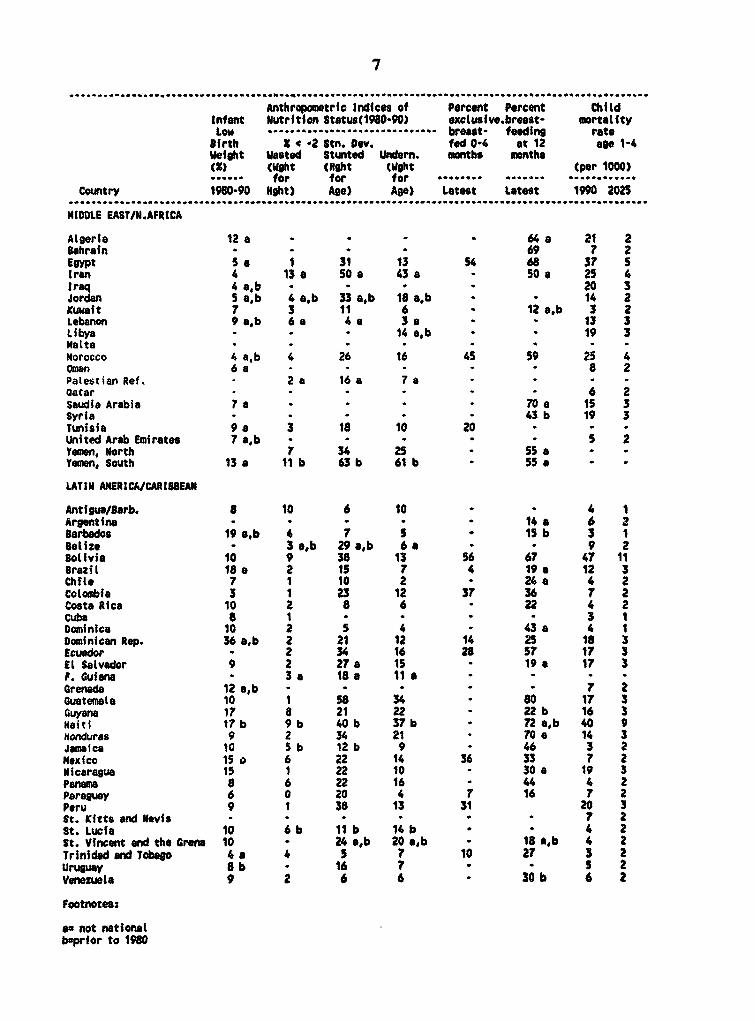
Anthropometric Indices of Percent percent ChildInfant Nutrition Status(1980-90) exeltsIve.breast- mortalityLow -.-. ------- ---- breast- feedine rateSirth X ' 2 8tn. Oev. fed 0-4 at 12 use 1-4Weight Wasted Stunted Undern. months months(X) (Wght (lght (Wght (per 1000)* -- for for for *------- .-.-.- ............Country 1980-90 Hght) Age) Age) Latest Latest 1990 2025......................................................................................................
MIDDLE EAST/N.AFRICA
Algeria 12a 64* - a 21 2Bahrain - * 69 7 2Egypt Sa 1 31 13 54 68 37 SIran 4 13a 50a 43a - SOa 25 4Iraq 4a,b * - 20 3Jordan 5a,b 4 a,b 33 a,b 18 a.b 1 14 2Kuwaft 7 3 11 6 12 *.b 3 2Lebanon 9a,b 6 a 4a 3a 13 3Libya - 14 a,b 19 3Malta * * - - *Morocco 4 a,b 4 26 16 45 59 25 4Oman 6a - 8 2Palestian Ref. 2 a 16 a 7 a - -Qatar * - - - 6 2Saudia Arabia 7 a 70 a IS 3Syria * - * 43 b 19 3Tunisia 9 a 3 18 tO 20United Arab Emirates 7 a,b * - 5 2temen, North 7 34 25 SS aYemen, South 13 a 1Ib 63b 61b 55a -
LATtN AMERICk/CARIIDEAN
AntigualBarb. 8 10 6 10 4 1Argentina - - 14 a 6 2Barbados 19 a,b 4 7 5 * 15b 3 1Belize 3a,b 29 a,b 6 a 9 2Bolivia 10 9 38 13 56 67 47 11Brazil I8 a 2 1S 7 4 19 a 12 3ChIle 7 1 tO 2 24 a 4 2Colombia 3 1 23 12 37 36 7 2Costa Rica 10 2 8 6 22 4 2Cuba 8 I 3 1Dominica 10 2 5 4 43 a 4 1Oominican Rep. 36 a,b 2 21 12 14 25 18 3Ecuador * 2 34 16 28 ST 17 3El Salvador 9 2 27 a 15 19 a 17 3F. Guiana 3 18 a 11I aGrenada 12 a,b - * 7 2Guatemala 10 I 58 34 80 17 3Guyana 17 8 21 22 22 b 16 3Haiti 17 b 9b 40b 37 b * n a,b 40 9Honduras 9 2 34 21 70 a 14 3Jamalca 10 5b 12b 9 46 3 2Mexico t5o 6 22 14 36 33 ? 2Nicaragua 15 1 22 10 - 30 a 19 3Panams 8 6 22 16 444 2Paraguay 6 0 20 4 7 16 7 2Peru 9 1 38 13 31 20 3St. Kitts and Nevis - * * 7 2St. Lucia 10 6b 11b 16 b 4 2St. Vincent and the Grena 10 24 a,b 20 a,b 1S a,b 4 2Triniddand TbT go 4 a 4 5 7 10 27 3 2Uruguay 8 b 16 7 5 2Venezuela 9 2 6 6 30b 6 2
Footnotes:
an not nationalbaprior to 1980

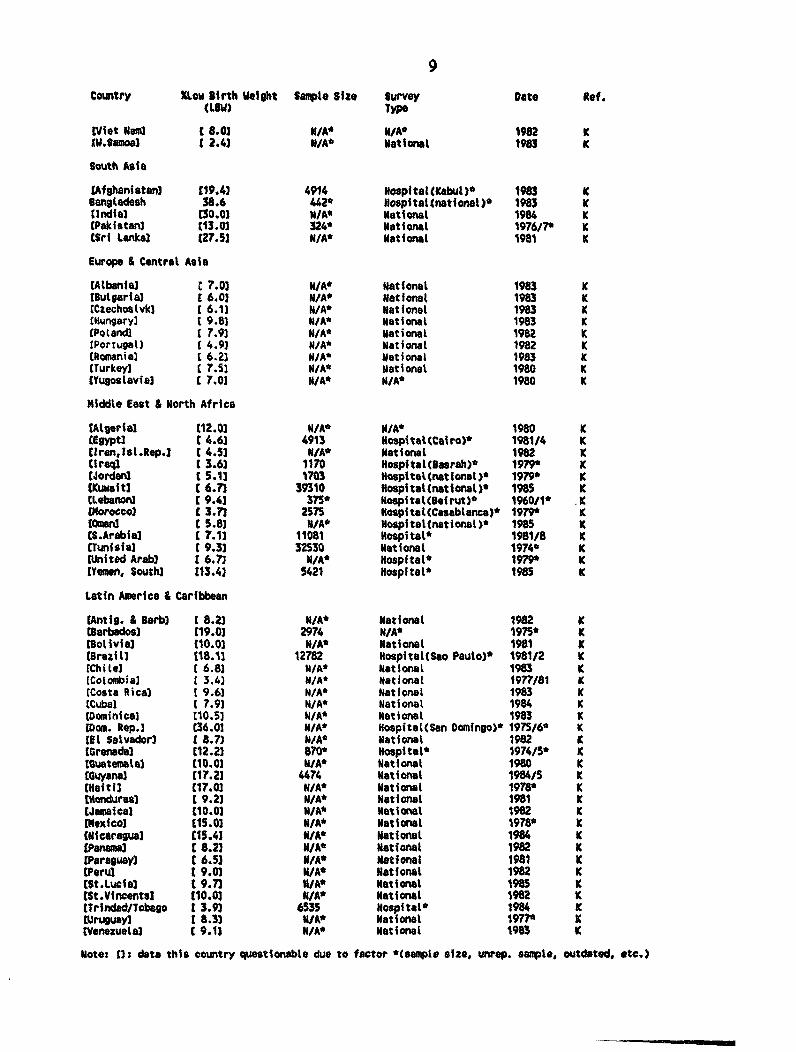
Table 2: Lo. glrth Weiaht t,2508 ql tnfants in Ovgtoofina CoSntrres p Reefon of tho World
Coumtry' X Low Birth Weight Samptl Size Survey type Date Ref.
Atrica
[Angolal 122.51 N/A* Hospital(Cabinds)* 1982 K
[SeninJ I 9.61 134243 Rocords(nationak)# 1973/76* K
(Botswana) 111.93 1134 HospitaLt(Gaborone)* 1981/84 K
lOurundi3 112.03 2762 Hospital(Bujumbura)* 1980/1 K
tCameroon1 116.51 N/A* Hospitat(national), %/A* K
(Cen.Afr.Rep.l (27.03 19496 Hospital' 1973* K
(Chad] t10.51 3000 Hospital* 1965* K
(Congo) tiS.Ol 943* Hospital* 1964' K
lCote d'lvoirel £18.51 11572 Nospital(Akhoupe/Cocody) 1977/78* K
(Ethiopia] t10.93 16675 Hospital(Addis Ababa)* 1982 K
MGabon) 014.41 7032 Hospital' 1970/2* K
Gaobial 135.01 N/A' National 1982 K
EGuinea t18.01 N/A* N/A' 1963* K
CGuinea-sissau 113.03 N/A* "opsita' 1981/2 K
[Kenya] 120.73 40* Hospital' 1984 K
(Lesotho] t14.4U 1094 HospitalCnatfonal)* 1983 K
£Malawi3 E1Z.01 N/A* HospitalCnationel)' 1981 K
[mali) 112.7? N/A' Hospital(Bamako)* N/A* K
IMauritania] [10.51 15844 Hospital(national)' 1987 K
(Mauritius) [13.61 13982 "ospital(government)' 1978' K
INozaubiquel 15.73 10492 Nospitalt(national)' 1981 K
Oliger) t15.0} N/A* National 1981 K
[Nigeria2 114.13 5970 Hospital(Zaria)* N/A' K
(Rwanda] t25.51 1641 Hospitat(Butare)" 1974* K
(Sao Tome/P.) t 7.51 3156 Hospital(national)* 1982 K
[Senegal) E11.01 8528 HospitaltDakar)* 1981 K
(Seychelles) [16.01 1131 Hospital(national)" 1977* K
S. Leonel (17.91 N/A* National 1978' K
%S.Africa] 117.7) 7029 Cape Town, Blacks* 1982 K
[Sudan) 111.01 2088 Hospitat(Juba)* 1983 K
(Tanzanial (13.5) N/Af National 1984 K
(Togo] £16.91 13324 Records(north/southregions)* 1977' K
(Zaire] t13.0] N/A* National 1982 K
12atal 114.2 2401 mospitalt(Kitwe)' 1971/2* y
tZiidbabwel £14.51 495* Hospitat(Satisbury) 197i /3* K
East Asia & Pacific
tChinal t 4.71 7159 Hospftat(8eijing)* 1982 K
[fijil [13.9) N/A* National 1979* K
IF.Polynesial t 7.3) N/A' National 1984 K
t1ndonesia3 114.0) N/A* National 1980 K
IKiribatil t18.0) N/A* National 1979' K
tKorea, Repl t 9.2) N/A' National 1981 K
ELao, PORI [39.3) NI/A National 1984 K
Malaysia] 110.01 N/A' National 1982/4 K
[Maldives] t26.03 N/A' National 1982 K
[mongolia) (10.0) N/A' National 1983/4 K
t[yarmarl 114.93 4749 Regional(urban)* 1981/4 K
CP.New Cuineal 125.03 N/A' National 1979* K
CPhilippines3 [15.4) N/A* National 1983 K
(Sol.lstandsl t 8.6) 175* Records(W.Province)* 1978/9* K
tThai land) [12.33 I/A' National 1982 K
(Tonga) 1 2.8) N/A' Records(urban)* 1979* K
(Vanuatu] [ 4.73 NIA" Nationat 1983 K
Countries for which data are not available--Africa: Burkina faso, Cape Verde, Comoros, Djibouti,
Equitorial Guinea, Ghana, Liberia, Madagascar, Namibia, Somalia, SwaziLand, Uganda; East Asia and Pacific:
Cambodia. Dem. Korea; South Asia: Shutan, Nepal; Europe and Central Asia: Armenia Azerbalfan, etlarus, Cyprus,
C2ech Republic, Estonia, Georgia, Kazakhstan, Kirgizetan, Latvia, Lithuania, Moldova, iussian federation,
Slovakia, tajikistan, Turkmenistan, Ukraine, Uzbekistan; Middle East and North Africa: Sahrain, Libya, Malta,
Palestian Refugees, Qatar, Syria, North Yemen; Latin America- Argentina, Belize, Ecuador, french Guiana, St.
Ki tts/Novis.
9
Country %Low Birth Welght Sample Size Survey Date Ret.
(LOW) 1ype
(Viet Nodi c 8.01 N/A' V/A* 1982 K
J.Samoeal 1 2.43 N/A* National 1983 K
South Asia
[Afghanistan) 119.4) 4914 Hospital(Kabul)* 1983 K
Bangladesh 38.6 442* Nospital(national)' 1983 K
(Indial t30.01 N/A' National 1984 K
(Pakistan) tt3.01 324* National 1976/7* K
[Sri Lankal 127.53 N/A* National 1981 K
Europe & Central Asia
[AlbanIal c 7.01 N/A' National 1983 K
tBulgaria) 1 6.03 N/A* National 1983 K
tCzechoslvkl t 6.13 N/A* National 1983 K
(Hungary] t 9.83 N/A* National 1983 K
[Potandl l 7.93 N/A* National 198U K
tPortugall t 4.91 N/A* National 1982 K
ERomanial t 6.23 N/A* National 1983 K
(Turkey] t 7.51 N/A* National 1980 K
tYugoslavial c 7.01 N/A* N/A* 1980 K
Middle East & North Africa
[Algerial t12.01 N/A* N/A* 1980 K
Egypti t 4.63 4913 Kospital(Cairo)* 1981/4 K
tIran,lsL.Rep.l t 4.51 N/A' National 1982 K
[IraqC t 3.63 1170 Nospitalt(Barah)' 1979* K
tJordan) l 5.1) 1703 mospital(national)' 1979* K
Kuwit) t(6.73 39310 Hospital(national)* 1985 K
[Lebarwon C 9.43 375* Nospitaltleirut)* 1960/1* K
[Morocco) [ 3.73 2575 Hospital(Casablanca)* 1979* K
Oman)r c S.83 N/A* Hospital(national)' 1985 K
CS.Arabia] E 7.11 11081 Hospital* 1981/8 K
[Tunisial C 9.31 32530 National 1974* K
(United Arab] t 6.73 N/A* Hospital* 1979' K
[Yemen South] 113.41 5421 Hospital' 1985 K
Latin America & Caribbean
[Antig. & Barb] 1 8.23 N/A* National 1982 K
[Barbadosl t19.01 2974 N/A* 1975* K
[Bolivial [10.03 N/A' National 1981 K
(Brazil] [18.11 12782 Hospitalt(Sao Paulo)* 1981/2 K
[Chitdl t 6.81 N/A* National 1983 K
iColombiaj 1 3.41 N/A* Nationat 1977/81 K
(Costa Rica) 1 9.63 N/A* National 1983 K
lCubal t 7.9l N/A* National 1984 K
tDominica] [10.51 N/A* National 1983 K
tDom. Rep.] (36.01 N/A* Hospital(San Oomingo)* 1975/6* K
tEl Ssavadorl I 8.73 N/A* National 1982 K
tGrenadsl [12.23 870* Hospital* 1974/5* K
tIluatemWal E10.03 N/A* National 1980 K
tGuyanal (17.23 4474 National 1984/S K
(Haiti) t17.01 N/A' National 1978* K
tHondurasl E 9.21 N/A* National 1981 K
tJamaical [10.01 N/A* National 1982 K
CMexicol [1S.03 N/A' National 1978* K
[Nicaragual (S1.43 N/A' National 1984 K
tPanama [ 8.23 N/A' National 1982 K
[Paraguay) [ 6.53 N/A' National 1981 K
(Perul 1 9.03 N/A* National 1982 K
[St.Lucial [ 9.73 N/A' National 1985 K
(St.VMneentsa (10.03 N/A' National 1982 K
ttrindad/Tobago 1 3.9) 6535 Hospital' 1984 K
[Uruguayl t 8.3) N/A' National 1977* K
[Venezuela) c 9.1) N/A' National 1983 K
Note: [l: data this country questionable due to factor '(sample size, unrep. sample, outdated, etc.)
10
Table 3i Percent Matnourished Children (Weight-for Heifht) in Develooino Countries by Area of the wortdCountry X ZsMnourished Wt/Nt Sanple Size Ages Survey Date Ref.Standard TypeAfrica
(Botswana) t 5.81 <-2 S.D. NCHS 7423 .5-4.99 yrs. District* 1981 K(Burkina Faso] (11.33 <-2 S.D. NCHS 1125 0 4.99 yrs. Local' 1974' KBurundi 5.6 <-2 S.D. NCHS 1930 .25-2.99yrs. National 1987 1(Cameroonl C 2.01 <-2 S.D. NCHS 4688 .25-3.99yrs. National 1977/78* KCape Verde 3.3 '-2 S.D. NCHS 9450 1-5.99 yrs. National 1985 KCongo 5.4 '-2 S.D. NCHS 2429 0-4.99 yrs. National 1987 KCote OlIvoire 8.6 '-2 S.D. NCHS 1947 0-4.99 yrs. National 1986 REthiopia 11.6 4-2 S.D. NCHS 2863 0-4.99 yrs. National 1982 K(Gambial t 7.31 -2 S.D. NCHS 784* .5-2.99 yrs. Local(8akau)' 1982 KGhana 8.0 '-2 S.D. NCHS 1841 .25-2.99yrs. National 1988 1(Guinea-Bissau] t 4.91 '-2 S.D. Harvard 655* 0-2.99 yrs. Local(Bandim)* 1987/88 K(Kenya] t 5.31 4-2 S.D. NCHS 3523 .5-4.99 yrs. National 1978/79* KLesotho 3.0 4-2 S.D. NCHS 11671 0-4.99 yrs. National(6 dist.)* 1981 KtLiberiaJ t 3.31 4-2 S.D. NCHS 3377 0-4.99 yrs. National 1976* KMadagasear 11.8 4-2 S.D. NCHS 1762 0-1.99 yrs. National 1983/84 KNalawi 2.0 4-2 S.D. NCHS 6901 0-4.99 yrs. National 1981/82 K,LMali 11.0 4-2 S.D. NCHS 1529 .25-2.99yrs. National 1987 1(Mauritania) (17.01 4-2 S.D. NCHS 948* 0-4.99 yrs. N/A* 1987/88 MEMauritiusl 16.2 4-2 S.D. NCHS 2430 0-4.99 yrs. National 1985 KNige, 23.2 <-2 S.D. NCNS 1672 0-4.99 yrs. National 1985 KNigeria 9.1 *-2 S.D. NCHS 5565 0-4.99 yrs. National 1990 1[Rwanda] C5.11 4-2 S.D. NCHS 2901 0-4.99 yrs. National 1976* KSao Tome & Prin. 5.0 4-2 S.D. NCHS 2155 0-4.99 yrs. National 1986 KISenegall C 5.81 4-2 S.D. NCHS 635' .5-2.99 yrs. National 1986 1(Seychelles) t 2.03 <-2 S.D. NCHS 836* 0-4.99 yrs. National 1987/88 K(S.Leonel C 4.91 '-2 S.D. NCRS 4890 0-4.99 yrs. National 1977/78* KISomalial (40.41 <-2 S.D. NCHS 347* 0-4.99 yrs. National(droughtcamps) 1975* KMS.Africa] (10.01 <-2 S.D. NCHS 1258 1-5.99 yrs. National(rural,black)* 1984 KESudanJ (35.81 4-2 S.D. NCHS 3458 0-4.99 yrs. Provincial(famine
data)* 1983 K(Swaziland] C 0.91 '-2 S.D. NCHS 4133 .25-4.99yrs. Nat./Rural* 1983/84 KfTan2anial 5.41 '-2 S.D. NCHS 166* 0-4.99 yrs. Local(Norogoro)* 1985 KTogo 5.3 '-2 S.D. NCHS 1396 0-2.99 yrs. National 1988 1(uganda] C 1.91 -2 S.D. NCHS 3791 0-4.99 yrs. Regionalt 1988/89 1(Zaire] t2.91 -2 S.D. NCNS 3784 0-4.99 yrs. District(Kasongo)* 1983 D,K(Zambia] l 4.71 4-2 S.D. NCHS 4882 0-4.99 yrs. National 1992 1Zimbabwe 1.3 <-2 S.D. NCHS 2485 .25-4.99yrs. National 1988 1East Asia & Pacific
(Chinal t 8.01 NA* 91000 0-3.99 yrs. Provincial* 1987 Z-5(F.Polynesifa 1C.41 <-2 S.D. NCHS 2687 0-2.99 yrs. Urban(Papeete)* 1982 D,K(Indonesia C 9.13 <-2 S.D. NCHS 2898 0-4.99 yrs. Local(East Java)* 1977* KEKorea, Rep] t 2.03 4-2 S.D. NCHS 738* 0-4.99 yrs. Rural(Seosan)* 1984 KLao, PDR 8.4 <80% NCHS 10676 0-4.99 yes. National 1984/86 NMalaysia] t 4.31 <-2 S.D. NCHS 95* 0-5.99 yrs. Rural(Sabah)W 1982 Kiasidivesl (29.31 4-2 S.D. NCHS 133* 0-4.99 yrs. National 1981 KNyarmar 11.0 '-2 S.D. iiCHS 6255 0-2.99 yrs. National 1983/5 KtP.New Guinedl (10.31 '-2 S.D. NCHS 1162 0-4.99 yrs. Local* 1980 KtPhilippinesl (12.73 NA* NA* 0-5.99 yes. National 1987 0tSol.islandsl t1.9I '-2 S.D. NCHS 698* 0-4.99 yrs. Local(Atoifi)* 1980 KThailand 5.7 <-2 S.D. NCHS 1856 .25-2.99yrs. National 1987 IViet Nam 7.0 '-2 S.D. NCHS 11809 0-4.99 yrs. National 1986 J,K,Q
Countries for which data are not available--Africa: Angol,, 8enin, Central African Republic, Chad,Comoros, Ojibouti, Equitorial Guinea, Gabon, Guinea, Mozambique, Namibia; East Asia & Pacific: Cambodia, Fiji,Kiriboti, Dem. Korea, Mongolia, Tonga, Vanuatu; South Asia: Afghanistan, Bhutan; Europe and Central Asia:Albania, Armenia, Azerbaijan, Belarus, Bulgaria, Cyprus, Czech Republic, Estonia, Georgia, Hungary, Kazakhstan,Kirgizatan, Latvia, Lithuania, Moldova, Poland, Portugal, Reoania, Russian Federation, Slovakia, Tajikistan,Turkmenistan, Turkey, Ukraine, Uzbekistan; Middle East and North Africa: Algeria, Bahrain, Iraq, Libya, Malta,Oman, Qatar, Saudia Arabia, Syria, United Arab; Latin America: Argentina, Grenada, St. Kitts/Nevis, St.Vincents, Uruguay.
11
Country X Malnourished Wt/Nt Sample Size Ages Survey Date Ref.
Standard Type
[W.Smmoal [ 1.03 '-2 S.D. NCHS 215* 0-4.99 yrs. Rural* N/A* K
South Asia
(tangladeshl C 8.13 A-8= OCHS 251* .5.5.92 yrs. National 1985/86 V
Elndial t21.2J '-2 S.D. NCHS 1429 0-4.99 yrs. Provincial* 1983/84 K
[Nepal) [13.93 <-2 S.D. NCHS 4997 .5-4.99 yrs. National 1975* K
Pakistan 11.0 4<0 WHOStand. 9080 064. yrs. National 1985 E
Sri Lanka 12.9 *-2 S.D. NCHS 1994 .25-2.99yrs. National 1987 1
Europe & Central Asia
(Yugoslavia] t 0.91 '-2 S.D. NCHS 1299 0-4.99 yrs. National 1973/75* K
Middle East & North Africa
tEsypt) [ 111 -2 S.D. NCHS 1907 .25-2.99yrs. National 1988 1
tIran, aIt. Rep.[1t3.01 <-2 S.D. NCHS 754' 0-4.99 yrs. Nat./Rural* 1980 K
[Jordan] t 4.3l -2 S.D. NCRS 3495 0-4.99 yrs. RuraltAnsan)' 1975' K
Kuwait 2.7 <-2 S.D. NCHS 2272 0-4.°9 yrs. National 1983/84 K
(Lebanonl t 5.71 <-2 S.D. NCHS 26?P 0-.99 yrs. Rural(Beirut)* 1985/86 K
Morocco 3.7 '-2 S.D. NCHS 3292 0-2.99 yrs. National 1987 1
[PaLest. Ref.) C 1.9] '-2 S.D. NCHS 5977 0-4.99 yrs. Regional* 1984 K
Tunisia 3.1 <-2 S.D. NCHS 2023 .25-2.99yrs. National 1988 1
Yemen, North 7.4 <-2 S.D. NCHS 2331 0-4.49 yrs. National 1982/3 K
tYemen, South) [10.83 -2 S.D. MCIS 2501 .25-4.99 yrs. National 1979* K
Latin America & Caribbean
[Antig. & Barb.] [10.0) <-2 S.D. NCNS 412P 0-4.99 yrs. Uational 1981 K,Q
[Barbadosl t 3.81 (-2 S.D. NCHS 553* 0-4.99 yrs. National 1981 K
[Belize] t 3.2) '-2 S.0. NCHS 743* 0-4.99 yrs. District* 1979* K
Bolivia 9.3 '-2 S.D. NCHS 2537 .25-2.99yrs. National 1989 1
Brazil 2.0 '-2 S.D. NCHS 7314 0-4.99 yrs. National 1989 S
Chite 0.5 -2 S.D. NCHS 159065 0-5.99 yrs. National 198S D,K
Colombia 1.0 <-2 S.D. NCHS 1324 .25-2.99yrs. National 1986 1
Costa Rice 2.0 -2 S.O. NCHS 1870 0-4.99 yrs. National 1982 K
(Cuba] [1.0) <-3rd Centile N/A* 0-4.99 yrs. National 1987 K
[Dominica] [1.7) C-2 S.D. NCHS 316e 0-1.99 yrs. National 1985 K
Dominican Rep. 2.3 <-2 S.D. NCHS 1831 .5-2.99 yrs. National 1986 1
Ecuador 1.7 '-2 S.D. NCHS *99999 0-4.99 yrs. National 1987 K
tEl Satvadorl E 2.3) <-2 S.D. NCHS 1899 0-4.99 yrs. Urban/Rural* 1988 H
EFrench Guiana) E 3.4) --2 S.D. MCHS 889* 0-4.99 yrs. Local* 1987 K
Gu4temala 1.4 4-2 S.D. NCHS 2230 .25-2.99yrs. National 1987 1
[Guyanal 1 8.5) <-Z S.D. NCHS 532* 0-4.99 yrs. National 1981 K
(Haiti] t 8.93 <-2 S.D. NCHS 5346 .25-4.99yrs. National 1978' K
Honduras 1.9 <-2 S.D. NCHS 3340 0-4.99 yrs. National 1987 F
IJamaical [ 5.03 <-2 S.D. NCRS 2848 0-4.99 yrs. National 1978* K
Mexico 6.3 C-2 S.D. UCHS 7504 0-4.99 yrs. National 1988 T,U
Nicaragua 0.5 -2 S.D. NCHS 1745 0-5.99 yre. 'ational 1980/82 K
Panama 6.4 <-2 S.D. NCHS 3314 0-4.99 yrs. Nationat 1980 K
Paraguay 0.4 <-2 S.D. NCHS 3389 0-4.99 yrs. National 1990 1
tPeru] 1 0.91 -2 S.D. NCHS N/A' 0-5.99 yrs. National 1984 K
(St.Lucial t 6.11 -2 S.D. NCHS 362' 0-4.99 yrs National 1976* K
(Trindad/Tobago) E 3.8] -2 S.D. NCHS 842* .25-2.99yrs. National 1987 1
Venezuela 2.1 <-2 S.D. NCHS 16584 0-4.99 yrs. Notional 1981/87 K
Mote: El: data this country questionable due to factor '(sample size, unrep.
sample, outdated, etc.)
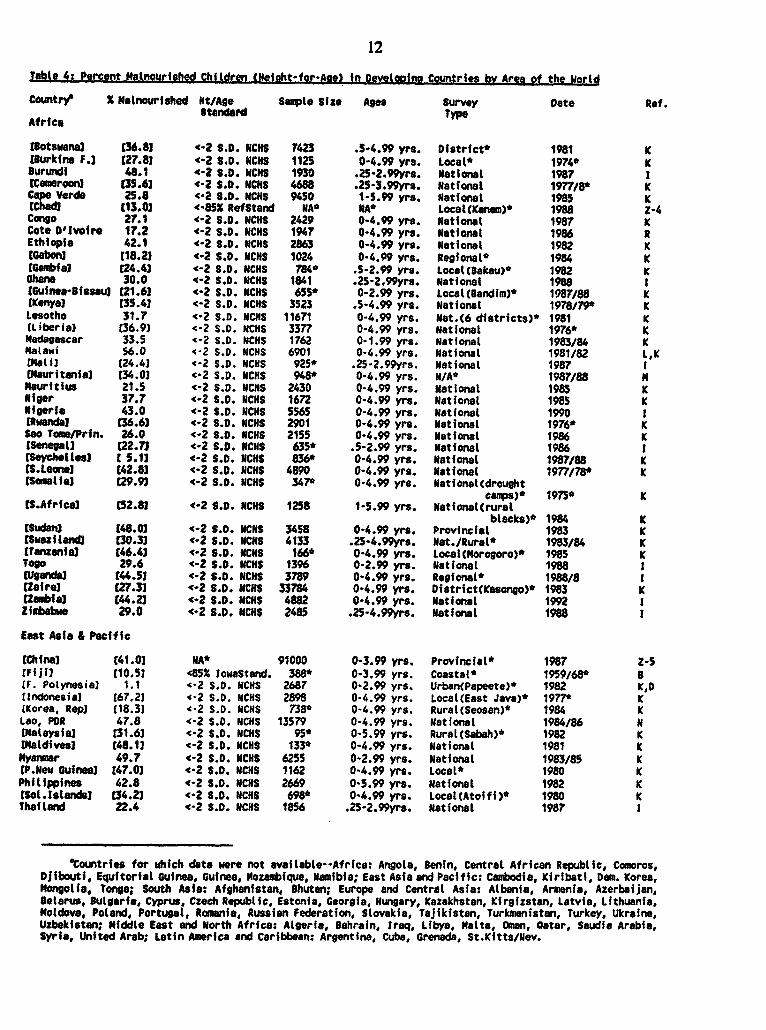
12Table 4- Percent Malnourished Chfidren tNeioht-ftor-*Ae) in Develoning Countries bv Area of the WorldCountr?^ X talnourished Nt/Age Sample size Ages Survey Date Ref.Standard Type
t[otswanaJ t36.81 '-2 S.D. NCHS 7423 .S-4.99 yrs. District* 1981 K[lurkina F.] £27.81 4-2 S.D. NCNS 1125 0-4.99 yrs. Local* 1974* K8urundi 48.1 4-2 S.D. NCR$ 1930 .25-2.°9yrs. National 1987 1tcamroon) t35.63 '-2 S.D. NCHS 4688 .25-3.99yrs. National 1977/8* KCape Verds 25.8 -2 S.D. NCHS 9450 1-5.99 yrs. Natfonal 1985 KtChad [13.01 <-85X RefStand NAe NA* Local(Kanam)* 1988 Z-4Congo 27.1 '-2 S.0. NCHS 2429 0-4.99 yrs. National 1987 KCote D0Ivoire 17.2 '-2 S.D. NCHS 1947 0-4.99 yrs. National 1986 REthiopia 42.1 '-2 S.D. NCNS 2863 0-4.99 yrs. National 1982 K(Gabon] [18.21 '-2 S.D. NCHS 1024 0-4.99 yrs. Regional* 1984 K[Gambia) £24.41 '-2 S.D. NCNS 784* .5-2.99 yrs. LocaltCakau)' 1982 KGhana 30.0 '-2 S.D. NCRS 1841 .25-2.99yrs. National 1988 1[Gufnea-Sissau3 t21.63 <-2 S.D. NCN$ 655* 0-2.99 yrs. Localt(andim)* 1987/88 K[Kenya) [35.41 '-2 S.D. NCHS 3523 .5-4.99 yrs. National 1978/79* KLesotho 31.7 '-2 S.D. NCHS 11671 0-4.99 yrs. Nat.(6 distrfcts)* 1981 K(Liberia] (36.9l -2 S.D. NCHS 3377 0-4.99 yrs. National 1976* KMadagascar 33.5 '-2 S.D. NCHS 1762 0-1.9 yrs. National 1983/84 KMalawi S6.0 '-2 S.D. NCHS 6901 0-4.99 yrs. National 1981/82 L,KtMalil [24.4) -2 S.D. NCHS 925* .25-2.99yrs. National 1987 1[Mauritanial t34.03 .2 S.D. NCHS 948* 0-4.99 yrs. N/A* 1987/88 MMauritius 21.5 '-2 S.D. NCHS 2430 0-4.99 yrs. National 1985 KNfger 37.7 '-2 S.D. NCNS 1672 0-4.99 yrs. National 1985 KNigerfa 43.0 '-2 S.D. NCHS 5565 0-4.99 yrs. National 1990 1[RWanda) [36.61 '-2 S.D. NCNS 2901 0-4.9 yrs. National 1976* KSao Tome/Prin. 26.0 <-2 S.D. NCRS 2155 0-4.99 yrs. National 1986 K[Senegall [22.7 -2 S.D. NCHS 635* .5-2.99 yrs. National 1986 1[Seychelles) [ 5.13 -2 S.D. NCHS 836* 0-4.99 yrs. National 1987/88 K[S.Lean"l t42.8l -2 S.0. NCHS 4890 0-4.99 yrs. National 1977/78* K[Somalial [29.93 <-2 S.D. NCHS 347' 0-4.99 yrs. National(droughtcamps)* 1975* K[S.Afrfcal [52.81 '-2 S.D. OCNS 1258 1-S.99 yrs. National(ruralblacks)* 1984 K[Sudan) 148.03 '-2 S.D. NCNS 3458 0-4.°9 yrs. Provincial 1983 K[Swazilancd [30.33 <-2 S.D. NCHS 4133 .25-4.99yrs. Nat./Rural* 1983/84 K[Tanzanifa [46.41 c-2 S.D. NCHS 166* 0-4.99 yrs. Localt(Morogoro)* 1985 KToo* 29.6 *-2 S.D. NCHS 1396 0-2." yrs. National 1988 I[Ugandal t44.51 '-2 S.D. UCNS 3789 0-4.99 yrs. Regional* 1988/8 1[Zairel t27.3l '-2 S.D. UCHM 33784 0-4.99 yrs. Distrfct(Kasongo)* 1983 KEZambiaf t44.23 '-2 S.D. NCHS 4882 0-4.99 yrs. National 1992 1ZimabWe 29.0 <-2 S.D. NCHS 2485 .25-4.99yrs. National 1988 1
East Asia & Pacific
(Chinal [41.01 NA* 91000 0-3.99 yrs. Provincial* 1987 Z-5(FiJi) [10.5) <852 lowaStand. 388* 0-3.99 yrs. Coastal* 1959/68* B(F. Polynesia] 1.1 '-2 S.D. NCHS 2687 0-2.99 yrs. Urban(Papeete)* 1982 K,D(Indonesia) t67.21 '-2 S.D. NCHS 2898 0-4.99 yrs. Local(East Java)* 1977* K(Korea, Rep) 118.31 '-2 S.D. NCNS 738* 0-4.99 yrs. Rural(Seosan)* 1984 KLao, POR 47.8 '-2 S.D. NCHS 13579 0-4.99 yrs. National 1984/86 N(Malaysia) £31.6l '-2 S.D. NCHS 95* 0-5.99 yrs. Rural(Sabah)* 1982 K[Maldives] [48.13 '-2 S.D. NCHS 133* 0-4.99 yrs. National 1981 KNyanmar 49.7 '-2 S.0. NCHS 6255 0-2.99 yrs. National 1983/85 K(P.New Guinea) [47.03 '-2 S.D. MCHS 1162 0-4.99 yrs. Local* 1980 KPhilippines 42.8 *-2 S.D. NCHS 2669 0-5.99 yrs. National 1982 K[Sol.lstandsl [34.23 '-2 S.D. NCHS 698* 0-4.99 yrs. Local(Atoiffi) 1980 KThailand 22.4 '-2 S.D. NCRS 1856 .25-2.99yrs. National 1987 1
*Countries for which dats were not available--Africa: Angola, Benin, Central African Republi,e Comoros,Djibouti, Equitorial Guinea. Guinea, Hozanbique, Namibia; East Asia and Pacific: Cambodia, Kiribati, Dem. Korea,Mongolia Tonga; South Asia: Afghanistan, Bhutan; Europe and Central Asia: Albania, Armenia, Azerbaijan,Belarus, Bulgaria, Cyprus, Czech Republic, Estonia, Georgia, Hungary, Kazakhstan, Kirgizstan, Latvia, Lithuania,Moldova, Poland, Portugal, Romania, Russian Federation, Slovakia, Tajikistan, Turkmenistan, Turkey, Ukraine,UWbekistan; Middle East and North Africa: Algeria, Bahrain, Iraq, Libya, Malta, Cman, Qatar, Saudia Arabia,Syria, United Arab. Latin America and Caribbean: Argentina, Cuba, Grenada, St.Kitts/Nev.
13
Country X Malnourished Mt/Age Sanple Size Ages Survey Date
Ref.
Standard
Type
avanatu 19.1 4-2 S.D. NCHS 1194 0-4.99 yrs. National
1983 K
Viet Nam 59.7 '-2 S.O. NCHS 11809 0-4.99 yrs. National 1986
J,K,O
W. Sauoa 1 5.11 4-2 S.D. ICHS 215' 0-4.99 yrs. Rural* Il/A*
K
South Asia
Bangladesh 56.1 c905 NCHS 1702 .S-5.92 yrs. National
1985/86 V
(Indial 50.0 *-2 S.D. NCHS 1429 0-4.99 yrs. ProvIncial*
t983/84 K
(Nepat] t68.61 -2 S.D. NCHS 4997 0-4.99 yrs. National
1975* K
Pakistan 42.0 <90X WIoStand. 9080 0-4.99 yrs. National
1985 E
Sri Lanka 27.5 <-2 S.D. NCHS 1995 .25-2.99yrs. National 1987
1
Europe & Central Asia
(Yugoslavial t 3.81 -2 S.D. NCHS 1299 0-4.99 yrs. Nationat
1973/75* K
Middle East & North Africa
[Egypt] [30.81 <-2 S.D. NCHS 1907 .25-2.99yrs. National
1988* 1
Iran,1sl.Rep. 50.4 v-2 S.D. NCNS 754' 0-4.99 yrs. fat./Ruralt
1980 K
(Jordan) [33.01 *-2 S.D. NCRS 3495 0-4.99 yrs. Rural(Amamner
1975* K
Kuwait 11.3 '-2 S.O. NCHS 2272 0-4.99 yrs. National
1983/84 K
[Lebanon) t 4.13 -2 S.D. NCHS 267* 0-.99 yrs. Ruralsteirut)*
1985/8 K
Morocco 25.5 <-2 S.D. NCHS 3292 0-2.99 yrs. National
1987 1
[Palest. Ref.l [16.531 -2 S.D. MCHS 5977 0-4.99 yrs. Regional* 1984
K
Tunisia 18.4 '-2 S.D. NCNS 1996 .25-2.99yrs. National
1988 1
Yemen North 33.7 <-2 S.D. NCHS 2331 0-4.49 yrs. National 1982/83
K
[Yemen, South] [62.61 4-2 S.D. NCHS 2501 .25-4.99yrs. National 1979*
K
Latin America & Caribbean
tAntig./Barb.1 C 6.51 < 2 S.O. NCRS 412* 0-4.99 yrs. National
1981 K.0
[Barbados] t 7.43 c-2 S.D. NCHS 553* 0-4.99 yrs. National
1981 K
[Belize] [29.11 <-2 S.D. NCHS 743* 0-4.99 yrs. District*
1979' K
Bolivia 38.3 <-2 S.O. NCR$ 2537 .25-2.99yrs. National
1989 1
8razil 15.4 <-2 S.D NCRS 7314 0-4.99 yra. National
1989 S
Chile 9.5 '-2 S.D. NCHS 159065 0-5.99 yrs. National
198S D,K
Colonbia 22.7 <-2 S.D. MCHS 1318 .25-2.99yres. National
1986 1
Costa Rica 7.8 '-2 S.D. NCHS 1870 0-4.99 yra. National 1982
K
tDominica] ( 4.8] <-2 S.D. NCNS 316* 0-1.99 yrs. National
1985 K
Dominican Rep. 20.8 '-2 S.D. NCHS 1831 .5-2.99 yrs. National 1986
1
Ecuador 34.0 <-2 S.D. NCMS >999.9 0-4.99 yrs. National
1987 K
[El Salvadorl (26.81 <-2 S.D. NCHS 1899 0-4.99 yrs. Urban/Rural' 1988
H
(Fr. Guiana (17.7] -2 S.D. NCHS 889* 0-4.99 yrs. Local* 1985/87
K
Guatemata 57.9 -2 S.D. NCHS 2229 .25-2.9.yrs.
National 1987
t
(Guyanal [20.7] (-2 S.D. NCHS 532* 0-4.99 yrs. National
1981 K
Itaiti] (39.63 '-2 S.D. NCHS 5346 .25-4.99yrs. National
1978* K
Monduras 33.9 '-2 S.D. MCHS 3340 0-4.99 yrs. National
1987 F
Jamaica] 112.11 '-2 S.D. HCHS 2848 0-4.9 yrs. National
1978* K
Nexico 22.3 i-2 S.D. NCHS 7504 0-4.99 yrs. National
1988 T.U
Nicaragua 21.? <-2 S.O. NCHS 1745 0-4.99 yrs. National
1980/82 K
Panama 22.0 <-2 S.D. NCNS 3314 0-4.99 yrs. National
1980 K
Paraguay 20.3 (-2 S.O. NCNS 3389 0-4.99 yrs. National
1990 I
EPerul t37.81 < 2 S.D. NCNS NIA* 0-S." yrs. National
1984 K
[St.Lucfal [10.81 <-2 S.D. NCNS 362* 0-4.99 yrs. National
1976* K
tSt.Vincentsl t23.S 3rd Centile, ICNS 816* 0-3.99 yrs. National
1967/70' K
tTrind./Tobag. 1 5.01 <-2 S.D. NCHS 842* .25-2.99yrs. National
'198?
Uruguay 1S.9 <-2 S.O. mCHS 3471 0-5.99 yrs. National
1987 K
Venezueta 6.1 '-2 S.D. NCO$ 16584 0-4.99 yrs. Natiatl
1981/87 K
Note: tn: data this country questionable due to factor *(samiple size. unrep. sample, outdated, etc.)
14Table 5: Percent Malnourished Children (Weluht-for-Aae) in Develooina Countries by Area of the WorldCountry X Malnourished Wt/Age Sample Size Ages Survey Date Ref.Standard TypeAfrica
[8enfnl [35.0l <80X RefStand. N/A' 0-4.99 yrs. Clinics* 1987 6(SotsNanal 123.21 '-2 S.D. NCHS 7423 .5-4.99 yrs. District' 1981 K(Burkina Faso] t[43.5 4<0X RefStand. N/A* 0-4.99 yrs. Clinics* 1987 0Burundi 38.3 '-2 S.D. NCHS 1930 .25-2.99yrs. National 1987 1(Cameroon] t17.33 '-2 S.D. NCHS 4688 .25-3.99yrs. National 1977/78* KCape Verde 18.8 '-2 S.D. NCHS 9450 1-5.99 yrs. National 1985 K[Cen.Afr.Rep.l 39.41 U/A* N/A* N/A* National 1972* AtChadl [34.31 <-80X RefStand. N/A* N/A' Local* 1987 2-4[Comorosl [22.21 <-2 S.D. NCOS 1624 0-1.99 yrs. Local(Ngazidja)* 1982 KCongo 23.5 <-2 S.D. NCRS 2429 0-4.99 yrs. National 1987 KCote D'lvoire 12.4 '-2 S.D. NCNS 1947 0-4.99 yrs. National 1986 REthiopia 38.1 '-2 S.D. NCHS 2863 0-4.99 yrs. National 1982 KtGabonl (13.01 '-2 S.D. NCHS 1024 0-4.99 yrs. Regional' 1984 K(Gambia] [18.83 4-2 S.D. NCHS 784' .5-2.99 yrs. Local(Sakau)* 1982 KGhana 30.7 -2 S.D. NCHS 1841 .25-2.99yrs. National 1988 1[Guinea-Bfssaul [17.71 '-2 S,D. NCHS 655* 0-2.99 yrs. Localt(andim)* 1987/88 K[Kenya] [20.53 t-2 S.D. MCHS N/A* N/A* National 1982 C,XLesotho 13.2 '-2 S.D. NCHS 11671 0-4.99 yrs. Nat.(6 districts)* 1981 K(Liberia] (20.33 '-2 S.D. NCHS 3377 0-4.99 yrs. National 1976* KMadagascar 32.8 -2 S.D. NCHS 1762 0-1.99 yrs. National 1983/84 KMalawi 30.0 c80% NCHS 6901 0-4.99 yrs. National 1981/82 L(Mati (31.0) 4-2 S.D. NCHS 925* .25-2.99yrs. National 1987 1EMauritania] [36.43 4-2 S.D. NCHS 948* 0-4.99 yrs. N/A* 1987 NMauritius 23.9 -2 S.D. NCHS 2430 0-4.99 yrs. National 1985 KCMozambiqus] E27.03 '-2 S.D. NCHS 330* 0-4.99 yrs. Local* 1978* KNiger 49.4 '-2 S.D. NCHS 1672 0-4.99 yrs. National 1985 KNigeria 35.7 <-2 S.D. NCHS 5565 0-4.99 yrs. National 1990 I[Rwandal (33.03 '80X RefStand. N/A* 0-4.9 yrs. Clinics* 1987 CSao Tome/Princ. 17.0 '-2 S.D. NCHS 2155 0-4.99 yrs. National 1986 K[Senegal] [21.63 '-2 S.D. NCHS 635* .5-2.99 yrs. National 1986 1[Seychelles] [ 5.71 '-2 S.D. NCHS 836* 0-4.99 yrs. National 1987/88 K[S.Leonel [23.23 '-2 S.D. NCHS 4890 0-4.99 yrs. National 1977/8* K[Somalial [54.13 4-2 S.D. NCHS 347* 0-4.99 yrs. National(droughtcamps)* 1975* K[S.Africa3 [43.03 '-2 S.D. NCHS 1258 1-5.99 yrs. Nationalrrural,black)* 1984 K[Sudan] [55.23 '-2 S.D. NCHS 3458 0-4.99 yrs. Provincial* 1983 KtSwaitland] [ 9.73 -2 S.D. NCHS 4133 .25-4.99yrs. National/Rural* 1983/84 K[Tanzania) t48.03 '80% NCHS N/A' 0-4.99 yrs. Regional(Iringa)* 1984 0Togo 24.4 '-2 S.D. NCHS 1396 0-2.99 yrs. National 1988 1[Uganda3 [23.33 i-2 S.D. NCHS 3789 0-4.99 yrs. Regional* 1988/89 1Zaifre3 [18.93 '-2 S.D. NCHS 33784 0-4.99 yrs. Dfstrfct(Kasongo)* 1983 K[Zambial (25.23 -2 S.D. NCHS 4882 0-4.99 yrs. National 1992 1Zimbabwe 11.5 <-2 S.D. NCHS 2485 .25-4.99yrs. National 1988 1
East Asia & Pacific
[China] t24.01 N/A* 91000 0-3.99 yrs. Provincial* 1987 Z-5[Fiji) t 8.61 '85X lowaStand. 388* 0-3.99 yrs. Coastal* 1959/68* B(F.Polynesial 1 1.23 '-2 S.D. NCHS 2687 0-2.99 yrs. Urban(Papeete)* 1982 D,K(Indonesia] (51.31 4-80X narvStand. 30545 0-4.99 yrs. National 1987 W[Kiribati, Rep.]1t2.71 <-2 S.D. NCHS 486* 0-4.99 yrs. Rural* 1979* KlKorea, Rep] [ 7.63 <-2 S.D. NCHS 738* 0-4.99 yrs. Ruralt(Seosan)* 1984 KLao, PDR 48.8 <802 Ref.Stand. 13579 0-4.99 yrs. National 1984/86 N[Malaysial (23. 1 '-2 S.D. NCNS 95' 0-5.99 yrs. Rural(Sabah)* 1982 K
'Countries for uhich data are not available--Africa: Angola, Djibouti. Equitorial Guinea, Guinea, Namibia;East Asia and Pacific: Cambodia, Dem. Korea, Mongolia, Tonga; South Asia: Afghanistan, Bhutan; Europe andCentral Asia: Albania, Armenia, Azerbaijan, lelarus, Bulgaria, Cyprus, Czech Republic, Estonia, Georgia,Nungary, Kazakhstan, Kirgizstan, Latvfa, Lithuania, Noldova, Poland, Portugal, Romania, Russian Federation,Slovekfa, tajikistan, Turkmenfstan, Turkey, Ukraine, Uzbekistan; Middle East and North Africa: Algeria, Bahrain,Iraq, Malta, oman, Oatar, Saudia Arabia, Syria, United Arab; Latin AmerIca and Caribbean: Argentina, Cuba,Grnenda, St. Kitts/Nevis.
15
Country X Malnourished Ut/Age
Sanple Size Ages Survey
Date Ref.
Standard
TYPe
[Naldiveel 506.13 '-2 S.D. NCRS 133* 0-4.99 yra. National
1981 K
Nyatnar 38.0 '-2 S.C. NCHS 6255 0-2.99 yrs. National
1983/85 K
EP.New Guineal t34.71 N/A*
N/A* N/A* National
1984 a
(Philippines] t17.7]
<-7S NCHS N/A* 0-5.99 yrs. National 1987
0
tSol.lslandsl (16.9l
4-Z S.D. NCNS 698* 0-4.99 yrs. Local(Atoifi)* 1980
K
Thailand 25.8 '-2 S.O. NCHS 1856 .25-2.99yrs.
Natio.,al 1987
1
Vanuatu 19.7 < 2 S.D. NCHS 1194 0-4.99 yrs. National
1983 K
Viet Nam 51.5 <-2 S.D. NCHS 11809 0-4.99 yrs. National 1986
J,K,O
EIW.Samoa3 t 1.4) -2 S.O. NCHS 215* 0-4.99 yrs. Rural*
N/A* K
South Asia
Bangladesh 60.4 <-752 NCHS 3283 .5-5.yrs.
National 1985/86
V
tindia) [52.13
-2 S.D. NClS 1429 0-4.99 yrs. Provincial* 1983/84
K
tNepal) 169.61
4-2 S.D. NCHS 4997 .5-4.99 yrs. National 1975*
K
Pakistan 51.5 402 WHOStand. 11285 0-4.99 *rs. National
1985 E
Sri Lanka 38.1 '-2 S.D. NCHS
1994 .23-2.99"rs. National
1987
Europe & Central Asia
tYugoslavia] t 2.81 '-2 S.D. NCtS 1299 0-4.99 yrs. National
1973/75* K
Middle East S North Africa
tEgyptl [13.31
'-2 S.D. NCHS 1907 0-4.99 yrs. National 1988
1
(Iran, Is. Rep.lt43.11 '-2 S.O. NCHS 754* 0-4.99 yra. National/Rural'
1980 K
(Jordan] (17.71
-2 S.O. NCHS 3495 0-4.99 yrs. Rural(Ammt n)* 1975* K
Kuwait 6.4 '-2 S.D. NCHS 2272 0-4.99 yrs. National
1983/84 K
ELebanon] t 3.0] '-2 S.D. NCRS 267* 0-.99 yrs. Ruralt(Beirut)*
1985/86 K
[Libyal [14.53
<-2 S.D. NCHS 460* 0-4.99 yrs. Urban' 1970*
K
Morocco 15.7 -2 S.D. NCHS 3292 0-2.99 yrs. National
1987 1
[Palest. Ref.] t 6.71 <-2 S.D. NCHS 5977 0-4.99 yrs. Regional* 1984
K
Tunisia 10.4 '-2 S.D. NCHS 1996 .25-2.99yrs.
National 1988
1
Yeen, North 25.0 '-2 S.O. UC1HS 2331 0-4.49 irs. National 1982/83
K
Yemen, South t61.21 -2 S.D. NCHS 2501 .25-4.99yrs.
National 1979*
K
Latin America & Caribbean
EAntig. & Barb.][10.0) --2 S.D. NCHS 4 2* 0-4.99 yrs. National
1981 K,Q
EBarbados] t 5.3l '-2 S.D. UCHS !43* 0-4.99 yrs. National
1981 K
tBelizel t 5.7]
'75% RefStand. 3301 0-2.99 yrs. Clinics*
1984 3
Botivia 13.3 !-2 S.D. NCHS
25!' .25-2.99yrs. National
1989 1
BrazIl 7.0 '-2 S.D. NCNS 31. 0-4.9 yrs. National
1989 S
Chile 2.3 <-2 S.D. NCHS 159065
0-5.99 yrs. National 1985
D,K
Colombia 11.9 <-2 S.D. NCHS 1324 .25-2.99yrs.
National 1986
1
Costa Rica 6.0 <-2 S.D. NCHS 1870 0-4.99 yrs. National 1982
K
tDominical 1 4.1] <-2 S.D. NCHS 316* 0-1.99 yrs. National
1985 K
Dominican Rep. 12.5 '-2 S.D. Ni AS 1831 .5-2.99 yrs. National 1986
1
Ecuador 16.5 4-2 S.D. N:HS >99999
0-4.99 yrs. National 1987
K
EEl Salvadorl [15.41 <-2 S.D. NCHS 1899 0-4.99 yrs. Urban/Rural*
1988 v
(French Guianal (11.31 <-2 S.D. NCHS 889' 0-4.99 yrs. Local*
1987 K
Guatemala 33.5 <-2 S.D. NCHS 2229 .25-2.99yrs.
National 1987
t
tGuyanal [22.11 <-2 S.D. NCHS 532* 0-4.99 yrs. National
1981 K
tHaiti) (37.41
'-2 S.D. NCNS 5346 .25-4.99yrs. National
1978* K
Honduras 20.6 '-2 S.D. NCHS 3340 0-4.99 yes. National
1987 f
EJamaical C 9.2]
'80X NCHS 861* 0-4.99 yrs. National 1989
P
Mexico 13.9 '-2 S.D. UCHS 7504 0-4.99 yrs. National
1988 T.U
Nicaragua 10.5 <-2 -D. NCHS 1611 0-4.99 yrs. National
1980/82 K
Panama 15.7 <-2 S.D. NCHS 3314 0-4.°9 yrs. National
1980 K
Paraguay 4.2 <-2 S.D. HCHS 3389 0-4.99 yrs. National
1990
UPerul t13.41
<-2 S.D. NCHS N/A* 0-5.99 yrs. National 1W
K
tSt.Lucial 013.83
4-2 S.D. NCHS 362* 0-4.99 yrs. National 1976*
K
lSt.Vincentsl [19.5] 3rd Centile, NCHS 816* 0-3.99 yrs. National
1967/70 K
Itrindad/Tobago]l 6.91 c-2 S.D. NCHS 842* .25-2.99yrs.
National 1987
1
Uruguay 7.4 c-2 S.D. NCHS 3471 0-5.99 yrs. National
1987 K
Venezuela 5.9 c-2 S.D. NCHS 16584 0-4.99 yrs. National
1987 K
Note: n : data this country questionable due to factor *(sample size, unrep. sample, outdated, etc.)
16Table 6; Percsnt Nalnourished Children (Ueiaht-for-Aae) in ReveloDing Countries by IncomeCo.tre X Malnourished Ut/Age Sample Size Ages Survey Date Ref.Standard Type
[Nozeabiquel t27.01 -2 S.D. NCHS 330* 0-4.99 yrs. Local* 1978' K(Tanzanial (48.01 I=0 NCN$ M/A* 0-4.99 yrs. Regional' 1984 aEthiopia 38.1 '-2 S.D. NCHS 2863 0-4.99 yrs. Provincial' 1982 KlSomatia 1:54.12 '-2 S.D. NCHS 347' 0-4.99 yrs. Nationaltdroughtcamps)* 1975* KtNepal) 169.61 '-2 S.0. NCHS 4997 .5-4.99 yrs. National 1975* K(Chad) (34.31 <-802 RefStand. N/A* N/A* Locat* 1987 Z-4Lao, POR 48.8 480 Ref.Stand. 13579 0-4.99 yrs. National 1984/86 NMalawt 30.0 480 NCHS 6901 0-4.99 yrs. National 1981/82 LBangladesh 60.4 '-75X NCNS 3283 .5-5.92 yrs. National 1985/86 VBurundi 38.3 <-2 S.D. NCHS 1930 .25-2.99yrs. National 1987 1(Zaire) (18.91 <-2 S.D. NCR 33784 0-4.99 yrs. District(Kasongo)* 1983 KtUgandu) 123.31 '-2 S.D. NCHS 3789 0-4.99 yrs. Regional* 1988/89 1Madagascar 32.8 *-2 S.D. NCHS 1762 0-1.99 yrs. National 1983/84 K(S.Leo*eW t23.22 '-2 S.D. NCRS 4890 0-4.99 yrs. National 1977/8* Kmalif [31.01 '-2 S.D. NCHS 925' .25-2.99yrs. National 1987 1Nigeria 35.? '-2 S.D. NCIS S565 0-4.99 yrs. National 1990 1NIger 49.4 '-2 S.D. NCN$ 1672 0-4.99 yrs. National 1985 KtRwandal c33.03 480S RefStand. N/A* 0-4.99 yrs. Ctlinics' 1987 aIBurkina Faso] 143.53 '802 RefStand. N/A* 0-4.99 yrs. Clinics* 1987 0tindial (52.11 <-2 S.D. NCNS 1429 0-4.99 yrs. Provincial* 1983/84 Ktlenino 35.03 *80% RefStand. N/A* 0-4.99 yrs. Clinics* 1987 0(China) t24.01 NA* 91000 0-3.99 yrs. Provincial* 1987 Z-5(HOitf) 137.43 '-2 S.D. NCHS 5346 .25-4.99yrs. National 1978* K(Keny (:20.52 <-2 S.D. NCNS N/A' N/A' National 1982 C,XPakistan 51.5 <80% UHOStand. 11285 0-4.99 yrs. National 1985 EGhana 30.7 '-2 S.D. NCHS 1841 .25-2.99yrs. National 1988 1lCan.Afr.Rep.] t39.42 N/A* N/A* N/A' National 1972* ATogo 24.4 <-2 S.D. NCHS 1396 0-2.99 yrs. National 1988 1t2ambuia (25.21 <-2 S.D. NCHS 4882 0-4.99 yrs. National 1992 JSri Lanka 38.1 '-2 S.D. NCHS 1994 .25-2.99yrs. National 1987 1mauritanfa 1t36.4U -2 S.D. NCHS 948* 0-4.99 yrs. N/A' 1987 NLesotho 13.2 '-2 S.D. NCNS 11671 0-4.99 yrs. National 1981 KIndaonesfIa (51.31 <-802 NarvStan. 30545 0-4.99 yrs. National 1987 vHonduras 20.6 <-2 S.D. 3CHS 3340 0-4.99 yrs. National 1987 F(Egypt] (13.33 '-2 S.D. NCHS 1907 0-4.99 yrs. National 1988 1tLiberial (20.32 '-2 S.D. NCHS 337Z 0-4.99 yrs. National 1976* KMYamr 38.0 '-2 S.D. NCHS 6255 0-2.99 yrs. National 1983/85 KtSudan] tS5.2) < -2 S.D. NCHS 3458 0-4.99 yrs. Provincial* 1983 KViet Nam 51.5 <-2 S.D. NCHS 11809 0-4.99 yrs. National 1986 J,K,Q
Middle-incomeLower-middle-income
lolivia 13.3 c-2 S.D. 3CHS 2537 .25-2.99yrs. National 1989 1tifbabwe 11.5 '-2 S.0. NCHS 2485 .25-4.99yrs. National 1988 1senegal 1:21.63 <-2 S.D. NCHS 635* .5-2.99 yrs. National 1986 rPhilippines3 (17.72 '-75% NCHS N/A* 0-5.99 yrs. National 1987 0'ote ODlvoire 12.4 *-2 S.D. NCNS 1947 0-4.99 yrs. National 1986 Romfnican Rep. 12.5 <-2 S.D. NCHS 1831 .5-2.99 yrs. National 1986 1P.New Guineal t34-7J N/A' N/A' N/A' National 1984 Ouatemala 33.5 '-2 S.D. NCHS 2229 .25-2.99yrs. National 1987orocco 15.7 <-2 S.D. NCHS 3292 0-2.99 yrs. National 1987 1
Income rankings taken from: World Development Report 1992. The World Bank. Countries are underlined whenthere are no 1990 GWP figures. These countries are grouped at the end of their estimated income groups."Countrfes for which data are not available (in order of increasing Income): Bhutan, Guinea, Afahanistan,Cambodia Syria, Turkey, Romanis, Poland, Algeria, Bulgaria, Alhnia, Ancol Lebanon, Monolioa, Namibia,Hungary, Czech Republic, Slovskis, Portugal, S.Arabia, Iraa, Oman, United Arab, Armenia, Azerbaijan, Bahrain,Belarus, Cuba, Cyprus, Djibouti, Equitorial Guinea, Estonia, Georgia, Grenada, Kazakhstan, Kirgizstan, Dem.Korea, Latvia, Lithuania, Malta, Moldova, Qatar, Russian Federation, St. Kitts/Nevis, Tajikistan, Tonga,Turkmenistan. Ukraine, Uzbekistan.
17
Country %tialncurished It/Age
Sample Size Ages Survey
Date Ref.
Standard
Type
(Cameroon) £17.31 *-2 S.D. NC0S 4688 .25-3.99yrs.
National 1977/78'
K
Ecuador 16.5 4-2 S.0. NCHS >99999 0-4.99 yrs. National
1987 K
Congo 23.5 *-2 S.D. NCHS 2429 0-4.99 yrs. National
1987 K
EEl Salvadorl £15.41 1-2 S.D. NCHS 199 0-4.99 yrs. Urban/Rural* 1988
H
Paraguay 4.2 -2 S.D. NCHS 3389 0-4.99 yrs. National
1990 I
(Peru) E13.43 (-2 S.D. NCRS NWA* 0-5.99 yrs. National
1984 K
(Jordan] £17.73
-2 S.D. NCNS 3495 0-4.99 yrs. Rural(Anumn)* 1975
K
CoLombia 11.9 i-2 S.D. NCHS 1324 .25-2.9
9yrs. National 1986
1
Thailand 25.8 -2 S.D. NCOS 1856 .25-2.99yrs.
National 1987
1
Tunisia 10.4 (-2 S.D. NCHS 1996 .25-2.99yrs.
National 1988
1
(Jamaica] l 9.21 <80% NCHS 861' 0-4.99 yrs. National
1989 p
Panama 15.7 <-2 S.D. NCHS 3314 0-4.99 yrs. National
1980 K
Costa Rica 6.0 -Z S.O. NCHS 1870 0-4.99 yrs. National 1982
K
Chite 2.3 (-2 S.0. NCHS 159065 0-5.99 yrs. National
1985 O,K
tsotswanal l23.21 '-2 S.D. NCHS 7423 .5-4.99 yrs. District*
1981 K
Mauritius 23.9 '-2 S.D. NCHS 2430 0-4.99 yrs. National
1985 K
(malaysial M23.13 (-2 S.D. NCHS 95* 0-5.99 yrs. Rural(Sabah)'
1982 K
(tran, Is. Rep.1143.13 -2 S.D. NCHS 754* 0-4.99 yrs. Nat./Rural*
1980 K
MeanoM t 3.01 '-2 S.D. NCHS 267* 0-.99 yrs. Rural(Ceirut)*
1985/86 K
Nlcaragua 10.5 '-2 S.D. NCHS 1611 0-4.99 yrs. National
1980/82 K
Yea en.Sciuth £61.21 '-2 S.D. NCHS 2501 .25-4.99yrs.
National 1979*
K
Upper-middle- income
Mexico 13.9 4-2 S.D. NCRS 7504 0-4." yrs. National
1988 T,U
£S.Africal t43.01 '-2 S.D. RCHS 1258 1-5.99 yrs. National(rurat,black)* 1984
K
Venezuela 5.9 '-2 S.D. NCHS 16584 0-4.99 yrs. National
1987 K
Uruguay 7.4 (-2 S.D. NCHS 3471 0-5.99 yrs. National
1987 K
Brazil 7.0 (-2 S.D. MCHS
7314 0-4.99 yrs. National 1989
S
(Yugoslavial E 2.83
-2 S.D. NCHS 1299 0-4.99 yrs. National 1973/75*
K
EGabon) £13.03 (-2 S.D. NCHS 1024 0-4.99 yrs. Regionalt*
1984 K
[Trindad/Tobago l£ 6.93 *-2 S.D. NCHS 842' .25-2.99yrs. National
1987 1
£Korea, Rep] E 7.63 '-2 S.D. NCHS 738* 0-4.99 yrs. Rural&Seosan)* 1984
K
.Likb1w £141.53 (-2 S.D. MCHS 460* 0-4.99 yrs. Urban*
1970* I
High- income
Kuwait 6.4 '-2 S.D. NCHS 2272 0-4.99 yrs. National
1983/84 K
Others (Bank-Designated GNP N/A)
(Antig. & Barb.) £10.01 '-2 S.D. NCHS 412* 0-4.99 yrs. National 1981
K O
EBarbadosl E 5.31 <-2 S.D. NCHS 553' 0-4.99 yrs. National
1981 K
(Belizel t 5.71 (75% RefStand.
3381 0-2.99 yrs. Clinics* 1984
J
Cape Verde 18.8 (-2 S.D. NCHS 9450 1-5.99 yes. National 1985
K
(Camorosl £22.23 (-2 S.D. NCHS 1624 0-1.99 yrs. Locat(Ngazidja)*
1982 K
£Dominical t 4.13 (-2 S.D. NCHS 316* 0-1.99 yrs. National
1985 K
(Fijil t 8.61 45% lcwaStand.
388* 0-3.99 yrs. Coastal' 1959/68*
a
(French Guiana] 111.33
-2 S.D. UCHS 889* 0-4.99 yrs. Local* 1987
K
tF.Polynesial t 1.21 '-2 S.D. NCHS 2687 0-2.99 yrs. UrbanCPapeete)*
1982 D K
EGambial £18.83
'-2 S.D. NCHS 784* .5-2.99 yrs. Local(Bakau)W 1982
K
(Guinea-Bissau] (17.71 <-2 S.D. NCHS 655* 0-2.99 yrs. Locat(Bandim)*
1987/88 K
(Guyana) E22.13
-2 S.D. MCNS 532* 0-4.99 yrs. National
1981 K
EKiribati, Rep.l £12.71 '-2 S.D. NCHM 486* 0-4.99 yrs. Rural* 1979'
K
(Maldivesl E56.13 '-2 S.D. NCHS 133* 0-4.99 yrs. National
1981 K
tPalest. Ref.l E 6.73 <-2 S.D. RCHS 5977 0-4.99 yrs. Regionat* 1984
K
ESt.Lucial t13.81 '-2 S.D. NCHS 362* 0-4.99 yrs. National
1976* K
(St.Vincentdj £19.51 3rd Centile, NCHS 816* 0-3.99 yrs. National
1967/70* K
Sao Tome/Princ. 17.0 4-2 S.D. NCHS 2155 0-4.99 yrs. National 1986
K
(Seychelles) t 5.73 (-2 S.D. NCHS 836* 0-4.99 yrs. National
1987/88 K
tSol.tIslands] £16.93 -2 S.D. NCHS 698* 0-4.99 yrs. Local(Atoif1)*
1980 K
ESwazi land) 1 9.73 <-2 S.D. NCHS 4133 .25-4.99yrs. Nat./Rural' 1983/84
K
Vanuatu 19.7 '-2 S.D. NCHS 1194 0-4.99 yes. National
1983 K
£U.Samoal £1.41 '-2 S.D. NCHS 215* 0-4.99 yes. Rural*
N/A' K
Yemen, North 25.0 '-2 S.D. NC0S 2331 0-4.49 yes. National 1982/83
K
Note; 1I: data this country questionable due to factor '(sample size, unrep. sample, outdated, etc.)
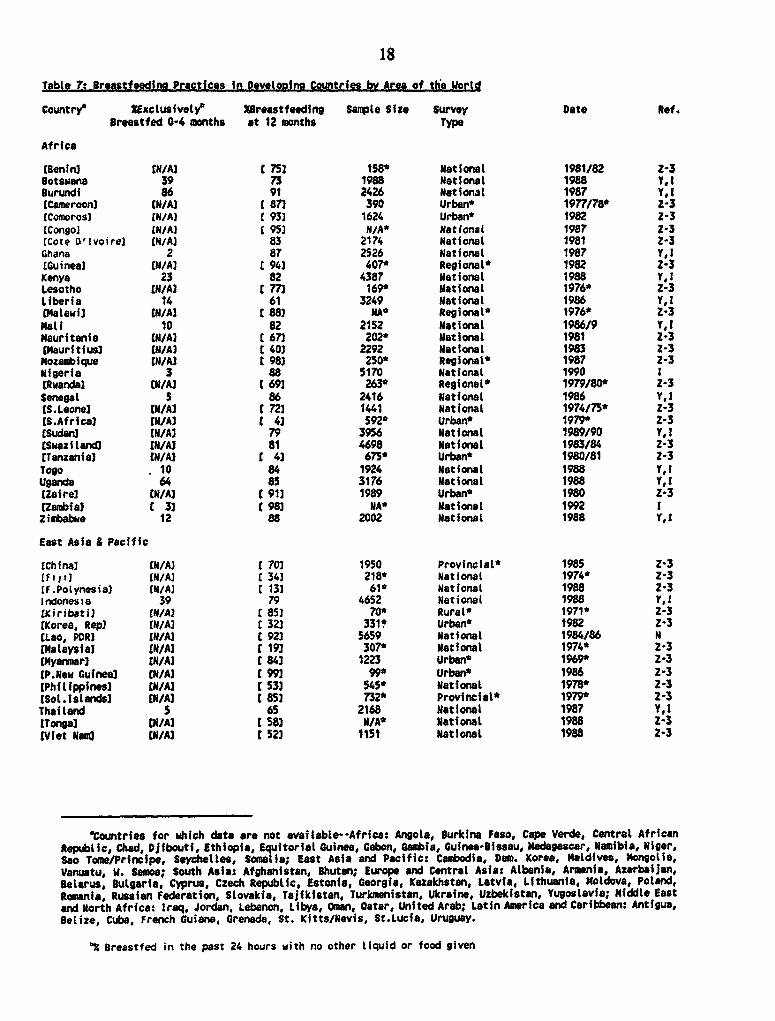
18Table 7s Breastfeedina Practices in Develoaino Countries by Area of the WortdCountry %Exclusivel? Xreastfeeding Sample Size Survey Date Ref.oreastfed 0-4 months at 12 months TypeAfrica
(Benin) EN/Al t 75) 58s* National 1981/82 Z-3Sotswana 39 73 1988 National 1988 Y,lBurundi 86 91 2426 Natioral 1987 Y,ltCameroonl N/A) t 87) 390 Urban* 1977/78* Z-3(Comoros] EN/A] t 93] 1624 Urban* 1982 2-3ECongo] EN/Al t 95) N/A* National 1987 Z-3(Cote ODlvoirel tN/A) 83 2174 National 1981 Z-3Ghana 2 87 2526 National 1987 Y,lLGuineal EN/A] I 94) 407* Regional* 1982 Z-3Kenya 23 82 4387 National 1988 YElLesotho EN/Al t 77) 169* National 1976* Z-3Liberia 14 61 3249 National 1986 Y,ltMalawil EN/Al C 88l NA* Regional* 1976* 2-3Mali 10 82 2152 National 1986/9 Y,lMauritania WN/A] t 671 202* National 1981 2-3tMauritius] EN/Al t 40) 2292 National 1983 Z-3Mozambique IN/Al C 983 250* Regional* 1987 Z-3Nigeria 3 88 5170 National 1990 I(Rwanda] IN/Al I 69) 263* Regional' 1979/80* Z-3Senegal 5 86 2416 National 1986 Y,irS.Leonel EN/Al I 72) 1441 National 1974/7'* Z-3(S.Africal [N/Al t 43 592* Urban* 1979* 2-3(Sudan) EN/Al 79 3956 National 1989/90 Y,lISWa2iland) EN/Al 81 4698 National 1983/84 Z-3[Tanzania] EN/Al t 4) 675* Urban* 1980/81 2-3Togo 10 84 1924 National 1988 Y,IUganda 64 85 3176 National 1988 Y,ItZairel EN/A) t 91) 1989 Urban* 1980 2-3tZambia) t 31 c 98) NA* National 1992 1Zimbabwe 12 88 2002 National 1988 r,IEast Asfa & Pacific
(China] EN/A) l 70) 1950 Provincial* 1985 Z-3Fijit EN/Al t 34) 218* National 1974* Z-3(F.Polynesial EN/Al I 13) 61* National 1988 Z-3Indonesia 39 79 4652 National 1988 Y,lEKiribati) EN/A) E 85) 70* Rural* 1971* Z-3(Korea, Repl EN/A) t 32) 331' Urban* 1982 Z-3(Lao, PORI IN/A) t 921 5659 National 1984/86 NtMalaysial IN/Al C 19) 307* National 1974* 2-3Nyarwoar) EN/Al t 84) 1223 Urban' 1969* Z-3EP.New Guineal tN/A) l 993 99' Urban* 1986 2-3(Philippines] IN/Al t 531 545* National 1978* 2-3ISot.Islandsl IN/Al t 853 732* Provincial* 1979* 2-3Thailand 5 65 2168 National 1987 Y,lnTongda EN/A) t 58) N/A' National 1988 z-3EViet Namn EN/Al t 523 1151 National 1988 Z-3
TCountries for which data are not available--Africa: Angola, Burkina faso, Cape Verde, Central AfricanRepublic, Chad, ojibouti, Ethiopia, Equitorial Guinea, Gabon, Gambia, Guinea-Bissau, Madagascar, Namibia, Niger,Sao Tome/Principe, Saychelles, Somalia; East Asia and Pacific: Cambodia, Dem. Korea, Maldives, Mongolia,Vanustu, W. Samoa; South Asia: Afghanistan, Bhutan; Europe and Central Asia: Albania, Armenia, Azerbaijan,Belarus, Bulgaria, Cyprus, Czech Republic, Estonia, Georgia, Kazakhstan, Latvia, Lithuania, Noldova, Poland,Romania, Russian Federation, Slovakia, Talikistan, Turkmenfstan, Ukraine, Uzbekistan, Yugoslavia; Middle Eastand North Africa: Iraq. Jordan. Lebanon, Libya, Oman, Qatar, United Arab; Latin America and Caribbean: Antigwu,Belize, Cuba, French Guiana, Grenada, St. Kitts/Nevis, St.Lucia, Uruguay.
'7 Breastfed in the past 24 hours with no other liquid or food given
19
Country XExclusively XBreastfeeding
Sample Size Survey Date
Ref.
Greastfed 0-4 months at 12 months Type
South Asia
8angladesh [N/Al
t 441 N/A* Urban*
1988 Z-3
tCndfal [NIA)
C 86l 2000 Urban*
1979* Z-3
tNepal) [N/Al
C 823 298' Nationat
1976* Z-3
tPakistan) t 25)
1 693 1499
National* 1988
1,2-3
Sri Lanka 14
72 2358 National
1987 Y l
Europe & Central Asia
tH ngary) [N/Al
t 41 N/A*
Notional 1975176*
Z-3
(Portugal] EN/Al
C 7n 901* National
1979/80* Z-3
(Turkeyl EN/Al
C 261 5370
National 1974*
Z-3
Middte East & North Africa
EAlgorial [N/AI
I 64) 2397
Urban* 1986
Z-3
Bahrain [N/Al
C 691 310*
National 1983
Z-3
Egypt 54
68 5174
National 1988
Y l
tIran, Isl.Rep.: tN/Al
t SO) N/A*
Urban* 1985
Z-3
Kuwait IN/Al
[12) 966*
NA* 1978/79'
Z-3
Norocco 45
59 3615
National 1987
r I
tPalest. Ref.) CM/A) C SS1
214* Regional' 1986
Z-3
IS.Arabia) CN/Al
C 701 175* Urban'
1986 Z-3
(Syria] [N/Al
C 43) 294*
National 1978*
2-3
Tunisia 20
WN/A] N/A*
National 1988
Y
[Yemen, North) tN/Al
t 551 2490
Rural* 1979*
Z-3
[Yemen South] Cl/Al
t 55J 747*
Rural' 1982/3
Z-3
Latin America & Caribbean
Argentina) EN/Al
t14) 1027
N/A* 1981/82
Z-3
[Barbadosi EN/A)
[ 151 284*
National 1969*
Z-3
Bolivia 56
67 3592
National 1989
Y,l
Brazil 4
[191 1003
Urban* 1986/9
Y 1lZ-3
[Chile) [N/Al
24 528*
Urban* 1981/82
2-3
Colt0mbia 37
36 1604
National 1986
YVl
ECosta Rica) CN/Al
22 4580
National 1981
2-3
(Dominical CM/Al
C 431 260* Regional'
1980 Z-3
Dom. Rep. 14
2S 2666
National 1986
YVl
Ecuador 28
57 1861
National 1987
1
(El Salvadorl EN/Al
19 1391
Urban* 1985
Z-3
[Guatemala) EN/Al
80 2797
National 1987
Y,t
(Guyanaj CN/Al
22 173* National
1975 Z-3
(Haiti] [N/Al
t 72] 755* Urban*
1978* Z-3
(Honduras) tN/A)
1 70l 535*
Urban* 1985
Z-3
EJamaica) EN/Al
t 461 292*
National 1983
Z-3
Mexico 36
33 N/A'
National 1987
Y l
tNicaragual tN/A)
I 30) 607* Urban*
1980 Z-3
[Panama) CN/Al
44 3332
National 1980
Z-3
Paraguay 7
16 2426
National 1990
Y l
[Peru) 31
[N/A) N/A*
National 1986/9
Y,l
tSt.Vincentsl [N/Al
t 18) 189* Urban*
1975* Z-3
Trindad/Tobago 10
27 1138
National 1987
YVl
Venezuela IN/A1
C 30) 148* National
1977* Z-3
Note: C): data this country
questionable due to factor *(sanple size,
unrep. sample, outdated, etc.)
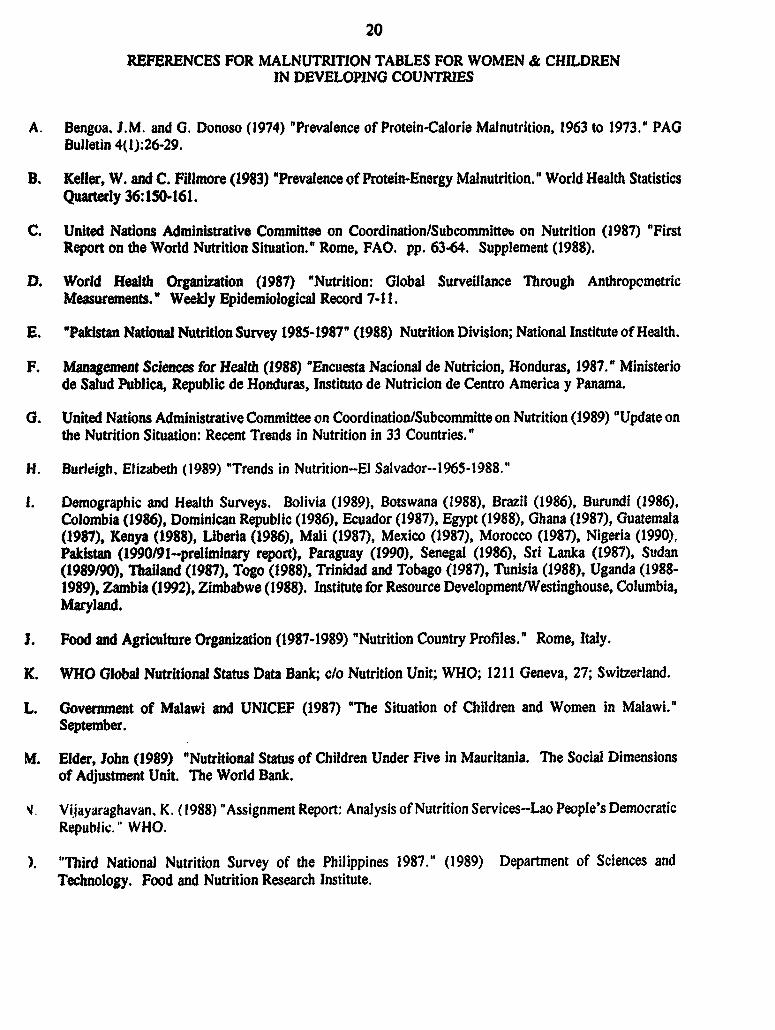
20REFERENCES FOR MALNUTRITION TABLES FOR WOMEN & CHILDRENIN DEVELOPING COUNTRIES
A. Bengoa, J.M. and G. Donoso (1974) "Prevalence of Protein-Calorie Malnutrition, 1963 to 1973." PAGBulletin 4(1):26-29.
B. Keller, W. and C. PFilmore (1983) "Prevalence of Protein-Energy Malnutrition." World Health StatisticsQuarterly 36:150-161.
C. United Nations Administrative Committee on Coordinatlon/Subcommittee on Nutrition (1987) "FirstReport on the World Nutrition Situation." Rome, FAO. pp. 63-64. Supplement (1988).D. World Health Organization (1987) "Nutrition: Global Surveillance Through AnthropometricMeasurements." Weeldy Epidemiological Record 7-11.E. -Pakistan National Nutrition Survey 1985-1987" (1988) Nutrition Division; National Institute of Health.F. Management Sciences for Health (1988) "Encuesta Nacional de Nutricion, Honduras, 1987." Ministeriode Salud Publica, Republic de Honduras, Instituto de Nutricion de Centro America y Panama.G. United Nations Administrative Committee on Coordination/Subcommitte on Nutrition (1989) "Update onthe Nutrition Situation: Recent Trends in Nutrition in 33 Countries."H. Burleigh, Elizabeth (1989) "Trends in Nutrition--El Salvador--1965-1988."1. Demographic and Health Surveys. Bolivia (1989), Botswana (1988), Brazil (1986), Burundi (1986),Colombia (1986), Dominican Republic (1986), Ecuador (1987), Egypt (1988), Ghana (1987), Guatemala(1987), Kenya (1988), Liberia (1986), Mali (1987), Mexico (1987), Morocco (1987), Nigeria (1990),Pakistan (1990/91-preliminary report), Paraguay (1990), Senegal (1986), Sri Lanka (1987), Sudan(1989/90), Thailand (1987), Togo (1988), Trinidad and Tobago (1987), Tunisia (1988), Uganda (1988-1989), Zambia (1992), Zimbabwe (1988). Institute for Resource Development/Westinghouse, Columbia,Maryland.
J. Food ad Agriculture Organization (1987-1989) "Nutrition Country Profiles." Rome, Italy.K. WHO Global Nutritional Status Data Bank; clo Nutrition Unit; WHO; 1211 Geneva, 27; Switzerland.L. Government of Malawi and UNICEF (1987) "The Situation of Children and Women in Malawi."September.
M. Elder, John (1989) "Nutritional Status of Children Under Five in Mauritania. The Social Dimensionsof Adjustment Unit. The World Bank.
q. Vijayaraghavanl K. (1988) 'Assignment Report: Analysis of Nutrition Services-Lao People's DemocraticRepublic." WHO.
). "Third National Nutrition Survey of the Philippines 1987." (1989) Department of Sciences andTechnology. Food and Nutrition Research Institute.
21
P. Survey of Living Conditions, July 1989. Final Report, Statistical Institute of Jamaica. Planning Instituteof Jamaica.
Q. Carlson, B.A. & T. Wardlaw (1990). 'A Global, Regional and Country Assessment of ChildMalnutrition." UNICEF Staff Working Paper No. 7.
R. Data from LSMS for Cote t'Ivoire. The World Bank.
S. Country Studies on Nutrtional Anthropometry, Brazil, 1989. WHO, 1991.
T. *Encuesta Nacional de Nutricion" (1989). Mexico. OF. INCEG. and SSA.
U. Amor, Jamie Sepulveda (1989). Estado Nutricional de los Prescholares y las Mujeres en Mexico:Resultados de una encuesta nacional probabilistica. Academia Nacional de Medicina.
V. Report of the Child Nutrition Status Survey 1989-1990. (1991). Bangladesh Bureau of Statistics. StatisticsDivision, Ministry of Planning.
W. Central Bureau of Statistics, Indonesia (1987). Stas of Gizi Balita.
X. Central Bureau of Statistics, Ministry of Finance and Planning, Nairobi, Kenya (1983). Republic ofKenya Third Rural Child Nutrition Survey, 1982.
Y. Rutstein, S.O. Nutritional Status and Infant Feeding Practices. Findings for Demographic and HealthSurveys and DHS World Conference Report, 1991.
Z-1. Nutritional Status of Filipino Children Using the International Growth Reference. Food and NutritionResearch Institute, DOST, 1991.
Z-2. Mexico Nutriton Sector Memorandum, 1990. The World Bank.
Z-3. WHO Breastfeeding: Prevalence, Duration and Implications for Fertlity and Child Spacing, 1990.
Z4. Lifanda, K. (1992). Draft Report on Nutrition in Chad.
Z-5. UNICEF (1991). Ihe State of the World's Children 1991. Oxford University Press; China: Strategiesfor Reducing Poverty in the 1990s (1992). The World Bank.
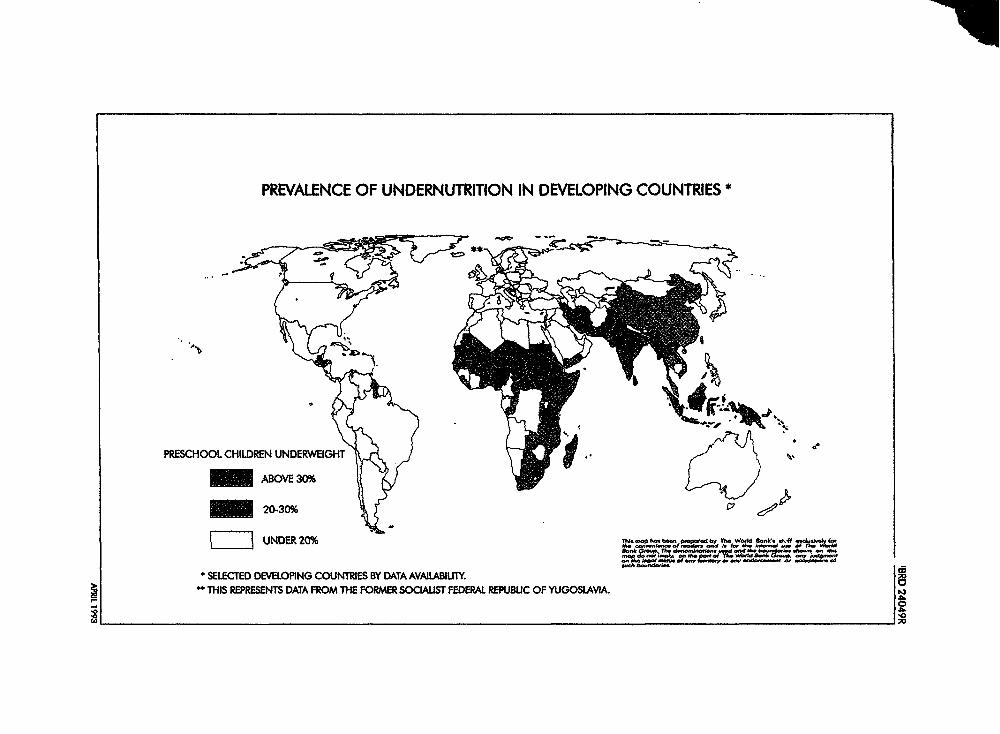
PREVALENCE OF UNDERNUTRITION IN DEVELOPING COUNTRIES *
PRESCHOOL CHILDREN UNDERWEIG.
lAEtOVE 309G%
_ 20-3096\ . ~~~~~~~~~~~~~~~~~~~~~~~~~~~~~~~~~~~~~~~R
l UNDER 20% === = _ w _ _
SELECTED DEVELOPING COUNTRIES BY DATA AVAILABIITY. to4*THIS REPRESENTS DATA FROM THE FORMER SOCLAUST FEDERAL REPJBLIC OF YUGOSLAVI
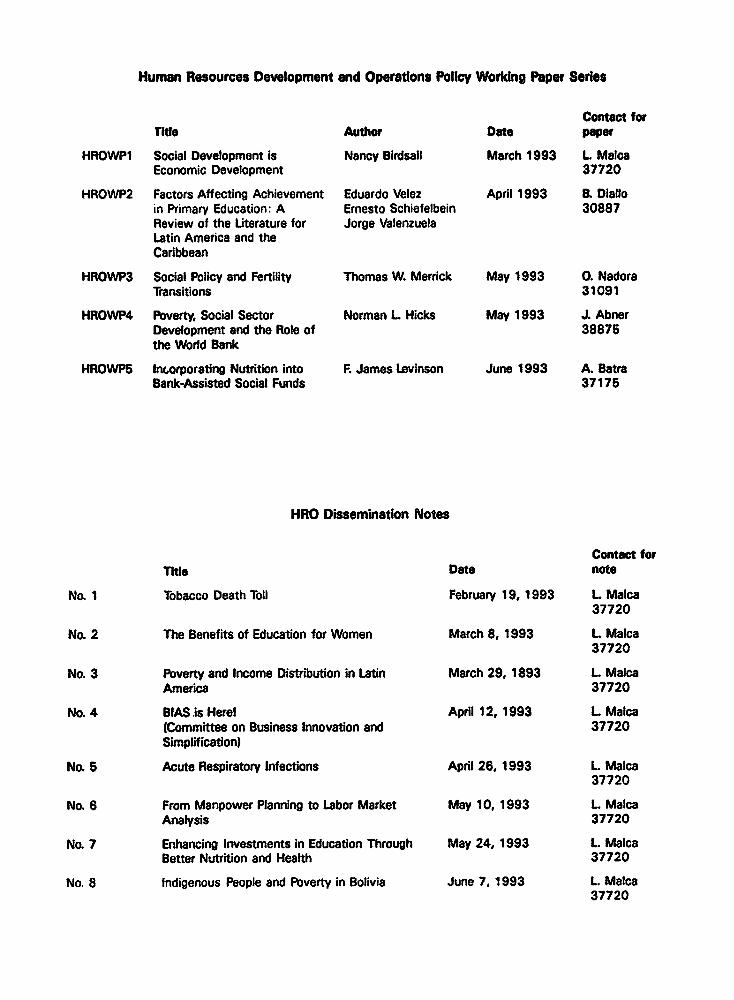
Human Resources Development and Operations Policy Working Paper Series
Contact forTitle Author Date paper
HROWP1 Social Development is Nancy Birdsall March 1993 L MalcaEconomic Development 37720
HROWP2 Factors Affecting Achievement Eduardo Velez April 1993 8. Dialloin Primary Education: A Ernesto Schiefelbein 30887Review of the Literature for Jorge ValenzuelaLatin America and theCaribbean
HROWP3 Social Policy and Fertility Thomas W. Merrick May 1993 0. NadoraTransitions 31091
HROWP4 Poverty, Social Sector Norman L Hicks May 1993 1 AbnerDevelopment and the Role of 38875the World Bank
HROWP5 Incorporating Nutrition into F. James Levinson June 1993 A. BatraBank-Assisted Social Funds 37175
HRO Dissemination Notes
Contact forTItle Date note
No. I Tobacco Death Toll February 19, 1993 L Malca37720
No. 2 The Benefits of Education for Women March 8, 1993 L Malca37720
No. 3 Poverty and Income Distribution in Latin March 29. 1893 L MalcaAmerica 37720
No. 4 BIAS is Herel April 12. 1993 L Malca(Committee on Business Innovation and 37720Simplification)
No. 5 Acute Respiratory Infections April 268 1993 L Malca37720
No. 6 From Manpower Planning to Labor Market May 10, 1993 L MalcaAnalysis 37720
No. 7 Enhancing Investments in Education Through May 24. 1993 L MalcaBetter Nutrition and Health 37720
No. 8 Indigenous People and Poverty in Bolivia June 7, 1993 L Malca37720


