Embed Size (px)
Citation preview
Carrie FarberowKevin Bailey
University of OklahomaMay 1, 2007
““““Green is Seen in FertilizersGreen is Seen in FertilizersGreen is Seen in FertilizersGreen is Seen in Fertilizers””””Municipal Solid Waste ManagementMunicipal Solid Waste ManagementMunicipal Solid Waste ManagementMunicipal Solid Waste Management

MSW Overview
EPA 2005 Facts and Figures
U.S. Waste Produced = 245.7 million ton

Municipal Solid Waste
� Composition is highly variable
� Poor quality fuel� Low heating value
� High moisture content
� Difficult to handle and feed to process equipment

Landfilling� Waste is deposited and buried
� Produces leachate� Groundwater pollutant
� Greenhouse gas emissions� Methane and CO2
� Costs cities $10 to $70 per ton
� Reduces nearby land property value
� 2005: Landfill Waste � 133.3 million tons

Municipal solid waste has steadily increased throughout the past 45 years.
The number of landfills has steadily decreased throughout the past 17 years.
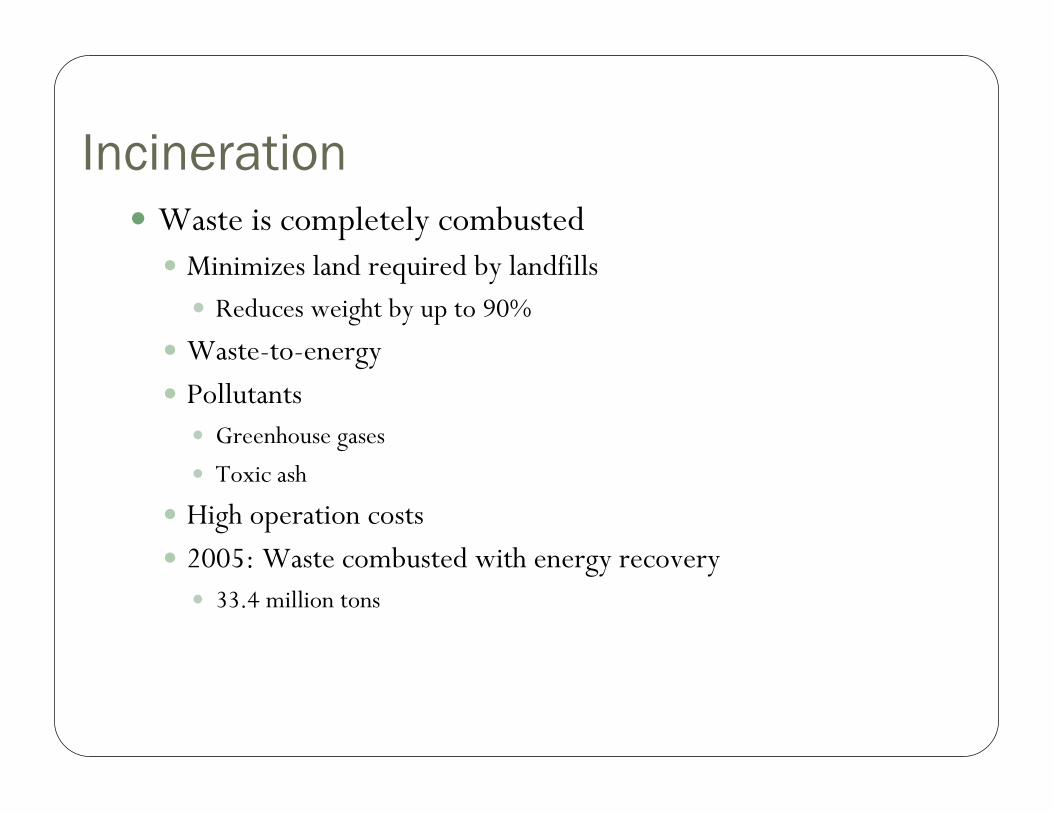
Incineration� Waste is completely combusted
� Minimizes land required by landfills� Reduces weight by up to 90%
� Waste-to-energy
� Pollutants� Greenhouse gases
� Toxic ash
� High operation costs
� 2005: Waste combusted with energy recovery � 33.4 million tons

Pyrolysis/Gasification
� Partial combustion
� Limited (less than stoichiometric) amount of oxygen
� Thermally self-sustaining
� Combust a small portion of the feed to generate heat for pyrolytic reactions
COCOC
HCOOHC
COOC
22
22
22
→++→+
→+
kmolMJH
kmolMJH
kmolMJH
/173
/131
/406
=∆=∆
−=∆

Benefits of Pyrolysis/Gasification
� Potential to be profitable
� Produce fuel or chemicals
� Reduce quantity and improve quality of solid discards
� Remedy municipal solid waste management problems

Pyrolysis Mass Balance

Pretreatment Processing� Shredding to reduce MSW particle size
� Air/density separator� Heavy fraction exits bottom
� 90% of ferrous removed in magnetic separator
� 66% of aluminum removed in eddy current aluminum separator
� Light fraction, mostly organic, exits the top� Cyclone removes particulates

Pyrolysis/Gasification� Exothermic reactions in oxidative zone
� High temperature endothermic reactions in the reduction zone� In the absence of oxygen
� Produces two products � synthetic gas
� slag

Synthesis Gas� Molar composition
� Carbon monoxide – 40%
� Hydrogen – 24%
� Carbon dioxide – 24%
� Other gases – 12%
� Typically produced from coal or hydrocarbons
� Syngas composition can be altered depending on desired end product

Product Options
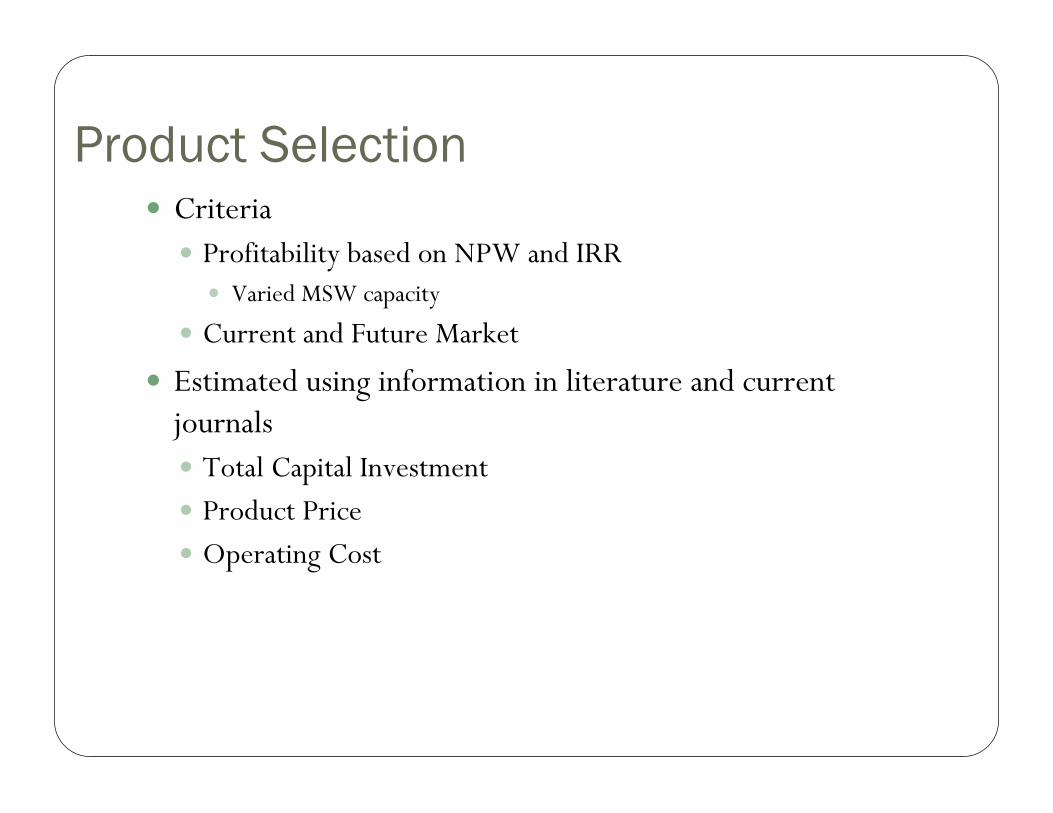
Product Selection� Criteria
� Profitability based on NPW and IRR� Varied MSW capacity
� Current and Future Market
� Estimated using information in literature and current journals� Total Capital Investment
� Product Price
� Operating Cost
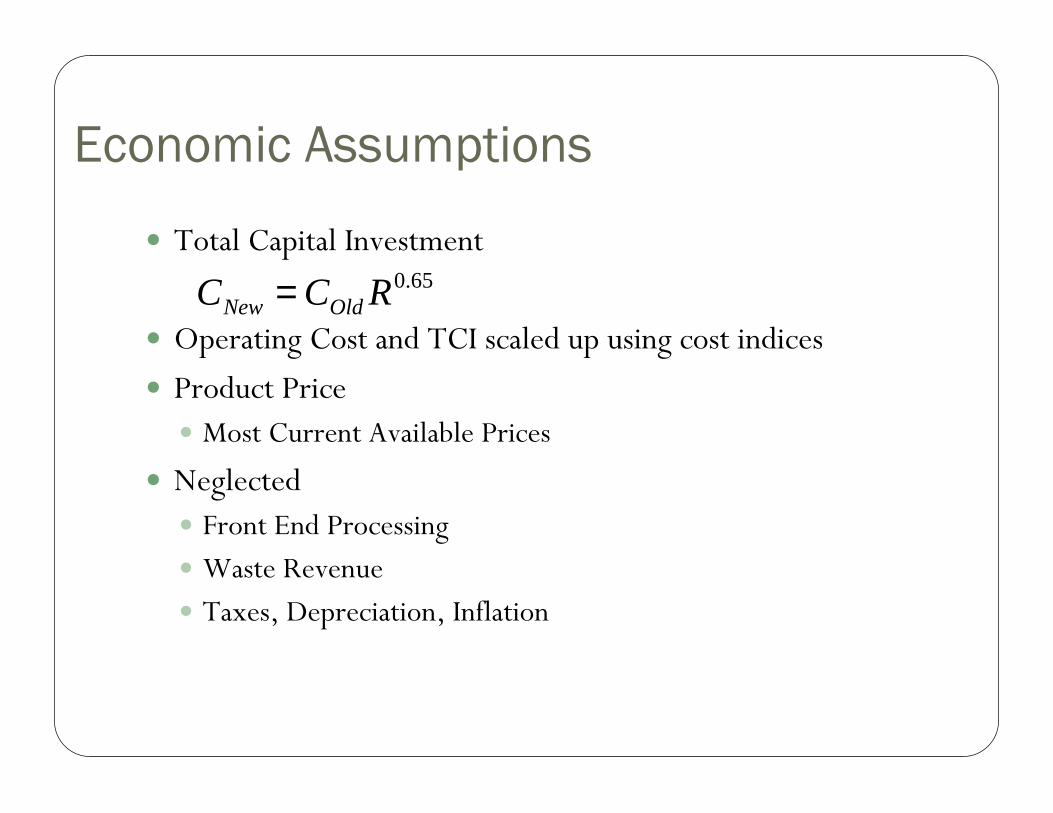
Economic Assumptions
� Total Capital Investment
� Operating Cost and TCI scaled up using cost indices
� Product Price� Most Current Available Prices
� Neglected� Front End Processing
� Waste Revenue
� Taxes, Depreciation, Inflation
65.0RCC OldNew =
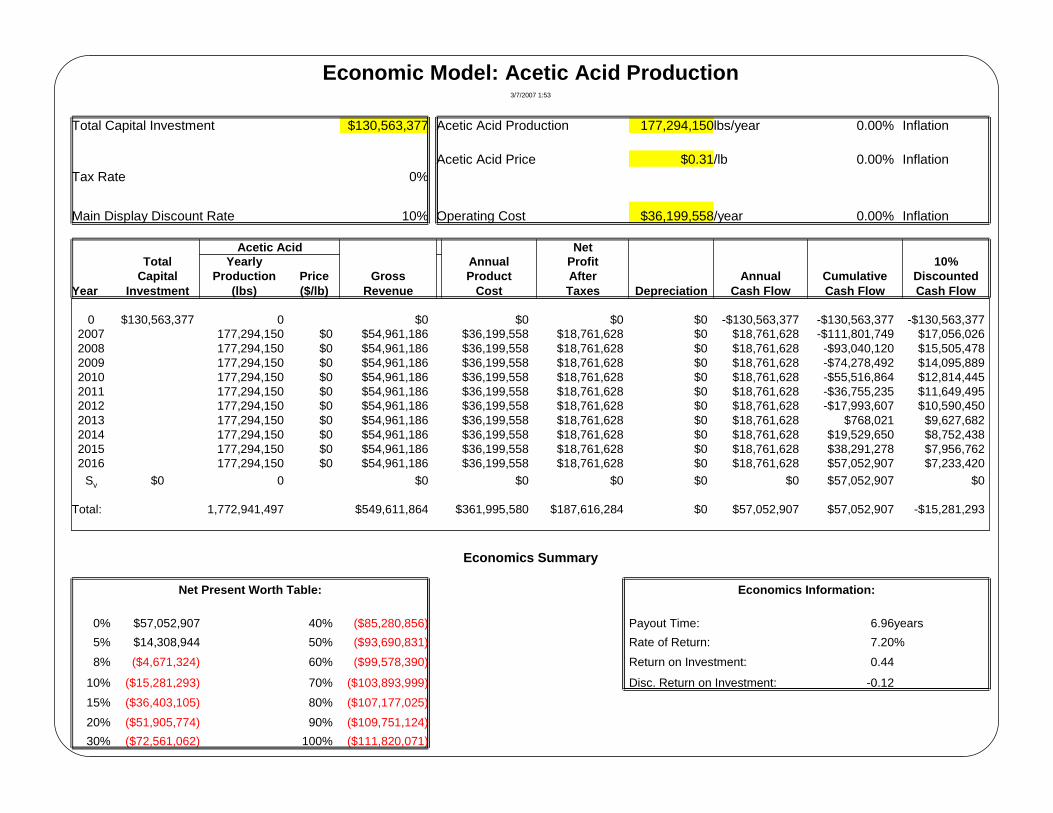
Economic Model: Acetic Acid Production3/7/2007 1:53
Total Capital Investment $130,563,377 Acetic Acid Production 177,294,150 lbs/year 0.00% Inflation
Acetic Acid Price $0.31/lb 0.00% InflationTax Rate 0%
Main Display Discount Rate 10% Operating Cost $36,199,558/year 0.00% Inflation
Acetic Acid NetTotal Yearly Annual Profit 10%
Capital Production Price Gross Product After Annual Cumulative Discounted Year Investment (lbs) ($/lb) Revenue Cost Taxes Depreciation Cash Flow Cash Flow Cash Flow
0 $130,563,377 0 $0 $0 $0 $0 -$130,563,377 -$130,563,377 -$130,563,3772007 177,294,150 $0 $54,961,186 $36,199,558 $18,761,628 $0 $18,761,628 -$111,801,749 $17,056,0262008 177,294,150 $0 $54,961,186 $36,199,558 $18,761,628 $0 $18,761,628 -$93,040,120 $15,505,4782009 177,294,150 $0 $54,961,186 $36,199,558 $18,761,628 $0 $18,761,628 -$74,278,492 $14,095,8892010 177,294,150 $0 $54,961,186 $36,199,558 $18,761,628 $0 $18,761,628 -$55,516,864 $12,814,4452011 177,294,150 $0 $54,961,186 $36,199,558 $18,761,628 $0 $18,761,628 -$36,755,235 $11,649,4952012 177,294,150 $0 $54,961,186 $36,199,558 $18,761,628 $0 $18,761,628 -$17,993,607 $10,590,4502013 177,294,150 $0 $54,961,186 $36,199,558 $18,761,628 $0 $18,761,628 $768,021 $9,627,6822014 177,294,150 $0 $54,961,186 $36,199,558 $18,761,628 $0 $18,761,628 $19,529,650 $8,752,4382015 177,294,150 $0 $54,961,186 $36,199,558 $18,761,628 $0 $18,761,628 $38,291,278 $7,956,7622016 177,294,150 $0 $54,961,186 $36,199,558 $18,761,628 $0 $18,761,628 $57,052,907 $7,233,420
Sv $0 0 $0 $0 $0 $0 $0 $57,052,907 $0
Total: 1,772,941,497 $549,611,864 $361,995,580 $187,616,284 $0 $57,052,907 $57,052,907 -$15,281,293
Economics Summary
Net Present Worth Table: Economics Information:
0% $57,052,907 40% ($85,280,856) Payout Time: 6.96years
5% $14,308,944 50% ($93,690,831) Rate of Return: 7.20%
8% ($4,671,324) 60% ($99,578,390) Return on Investment: 0.44
10% ($15,281,293) 70% ($103,893,999) Disc. Return on Investment: -0.12
15% ($36,403,105) 80% ($107,177,025)
20% ($51,905,774) 90% ($109,751,124)
30% ($72,561,062) 100% ($111,820,071)

Product Comparison – 1500 TPD
Product Production PriceOperating
CostNet Revenue Total Capital
InvestmentNet Present
Worth
(unit/day) ($/unit) ($/year) ($/year) $ $
Methanol (gal) 39,212 $1.02 $8,973,769 $5,555,679 $84,530,800 ($49,545,577)
Acetic Acid (lb) 485,737 $0.31 $36,199,558 $18,761,628 $141,194,727 ($30,523,926)
Formaldehyde (lb) 242,909 $0.21 $11,882,176 $6,736,810 $90,784,183 ($51,045,195)
Ammonia (ton) 277 $275 $7,204,301 $20,620,952 $107,435,351 $17,016,429
Urea (ton) 489 $223 $9,381,341 $30,437,687 $140,975,657 $42,261,195
Hydrogen (m3) 549,732 $0.08 $4,013,046 $11,877,158 $130,762,286 ($60,701,493)
Synthetic Fuel $5,207,041 $11,565,243 $93,765,169 ($22,701,754)
Diesel (gal) 16,312 $1.98
Naphtha (gal) 8,341 $1.63

Product NPW vs. MSW Capacity
($100)
$0
$100
$200
$300
$400
$500
0 1000 2000 3000 4000 5000 6000 7000
Capacity (tons MSW/day)
Net
Pre
sen
t W
ort
h (
$MM
) Urea
DME
Hydrogen
Acetic Acid
Ammonia
Synthetic Fuel
Methanol
Formaldehyde

Product IRR vs. MSW Capacity

Future Urea Market
� U.S. fertilizer usage to increase 10-15% in 2008
� Dependent on Crops� Corn – 41% of usage
U.S. Urea Demand
0
2
4
6
8
10
12
1999 2000 2001 2002 2003 2004 2005
Year
Dem
and
(M
Mto
ns)

Urea Production Reactions
OHCONHNHCOONHNHCONH
SynthesisUrea
NHNH
SynthesisAmmonia
HCOOHCO
ShiftGasWater
2224223
322
222
2
3
+→→+
→+
+→+

Syngas to Ammonia

Ammonia to Urea
Urea Reactor
Decomposition
and
Recirculation
Finishing Evaporation
Wastewater
Ammonia
1.09 x 10⁶ moles/unit time
From Ammonia Production Unit
Ammonia and Carbamate Recycle
Urea
5.44 x 10⁵ moles/unit time
P-13
Carbon Dioxide
3.11 x 10⁵ moles/unit time
From Ammonia Production Unit

Operating CostDirect Cost $/ton of UreaUtilities
steam (103-104 kPa), m3 12.84
cooling water, m3 13.95Labor, personnel shift ($28/h) 5.72Supervision 0.86Catalyst cost 2.31
Maintenance and Repairs 14.92Operating Supplies 2.24Laboratory Charges 0.86
Fixed CostInsurance 3.48 Property Taxes 9.95 Overhead 12.90
General CostAdministrative Costs 4.30Distribution and Marketing Costs 5.4
Total Operating Cost 89.74

Plant Location: New York City
� Generates about 25,000 TPD waste
� Contains no landfills, incinerators or resource recovery facilities
� All MSW is transferred out of the city
� About 70% is sent to out-of-state landfills
� Costs up to $70/ton
� Growing population

Waste Disposal Contracts
� Waste dropped at transfer station, then transported to landfillsor incineration facilities� 3 year contracts
� Option for two 1 year extensions
Available TPD from Expiring ContractsYear 2000 2001 2002 2003
Available Capacity (TPD) 1700 2500 3160 2350
Average 2428TPD
Standard Deviation 599TPD
Annual Expansion Opportunity 1800TPD

*Current Urea Demand: 11.6 MMtons/year

Urea Economics


Urea Profitability Sensitivity

Urea Regret Analysis
� Prices� 2006 average = $223/ton� 2000-2004 average = $121/ton� 2006 August Spot Price = $267/ton
� 2005 Urea Market� 1.4% (1200 TPD)
� 4.0% (3500 TPD)
� 6.8% (6000 TPD)
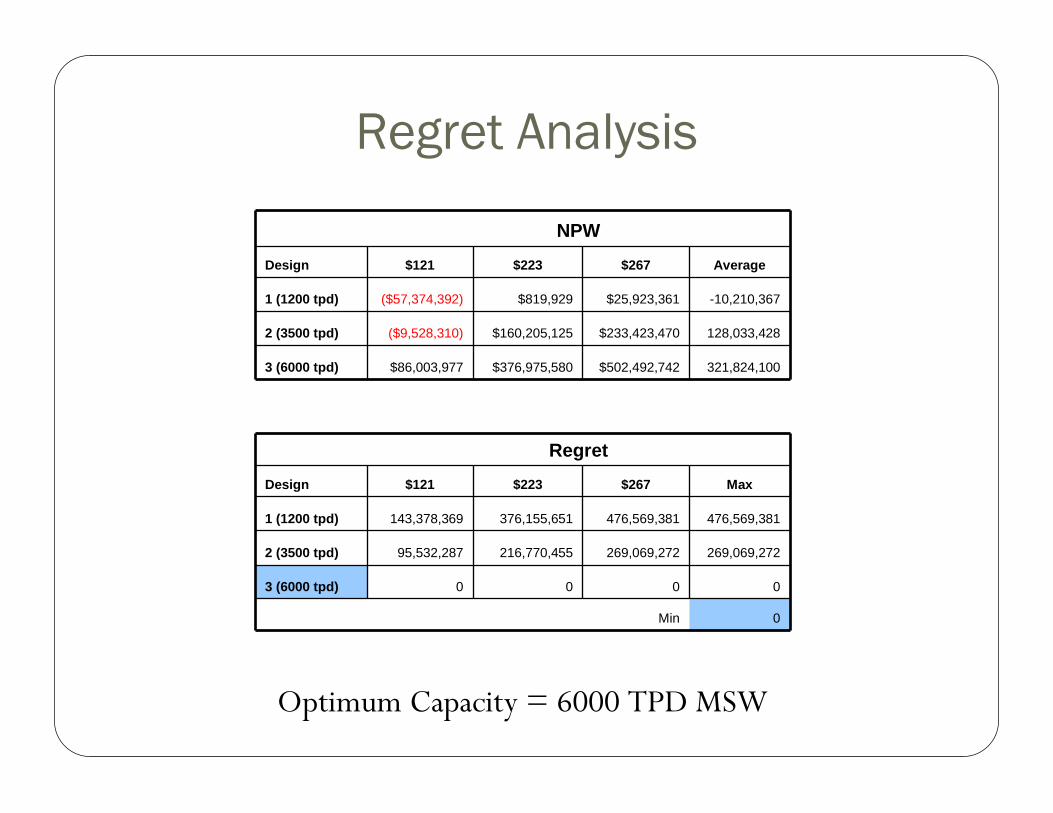
Regret Analysis
Optimum Capacity = 6000 TPD MSW
NPW
Design $121 $223 $267 Average
1 (1200 tpd) ($57,374,392) $819,929 $25,923,361 -10,210,367
2 (3500 tpd) ($9,528,310) $160,205,125 $233,423,470 128,033,428
3 (6000 tpd) $86,003,977 $376,975,580 $502,492,742 321,824,100
Regret
Design $121 $223 $267 Max
1 (1200 tpd) 143,378,369 376,155,651 476,569,381 476,569,381
2 (3500 tpd) 95,532,287 216,770,455 269,069,272 269,069,272
3 (6000 tpd) 0 0 0 0
Min 0

Economic Model: Urea Production3/7/2007 1:44
Total Capital Investment $417,978,064 Urea Production 1,957 tons/day
Fixed Capital Investment $355,246,112 Urea Price $223 /ton 0.00% InflationWorking Capital $62,731,952 Municipal Solid Waste 6,000 tons/day
MSW Charge $40 /tonTax Rate 35%Main Display Discount Rate 10% Operating Cost $85 /ton Urea 0.00% Inflation
Urea MSW NetTotal Yearly Yearly Annual Profit 10%
Capital Production Price Take Charge Gross Product After Annual Cumulative Discounted Year Investment (tons) ($/ton) (tons) ($/ton) Revenue Cost Taxes Cash Flow Cash Flow Cash Flow
0 $417,978,064 -$417,978,064 -$417,978,064 -$417,978,0642009 214,273 $223 657,000 $40 $74,062,879 $23,064,136 $35,014,070 $35,014,070 -$382,963,994 $31,830,9732010 428,546 $223 1,314,000 $40 $148,125,758 $39,949,318 $74,044,460 $74,044,460 -$308,919,534 $61,193,7692011 642,818 $223 1,971,000 $40 $222,188,414 $55,457,781 $114,591,718 $114,591,718 -$194,327,815 $86,094,4542012 714,243 $223 2,190,000 $40 $246,876,114 $60,441,455 $127,399,335 $127,399,335 -$66,928,480 $87,015,4602013 714,243 $223 2,190,000 $40 $246,876,114 $60,441,455 $127,399,335 $127,399,335 $60,470,855 $79,104,9642014 714,243 $223 2,190,000 $40 $246,876,114 $60,441,455 $127,399,335 $127,399,335 $187,870,190 $71,913,6032015 714,243 $223 2,190,000 $40 $246,876,114 $60,441,455 $127,399,335 $127,399,335 $315,269,525 $65,376,0032016 714,243 $223 2,190,000 $40 $246,876,114 $60,441,455 $127,399,335 $127,399,335 $442,668,860 $59,432,7302017 714,243 $223 2,190,000 $40 $246,876,114 $60,441,455 $127,399,335 $127,399,335 $570,068,195 $54,029,7552018 714,243 $223 2,190,000 $40 $246,876,114 $60,441,455 $127,399,335 $127,399,335 $697,467,530 $49,117,959
Sv $53,286,917 $53,286,917 $0 $34,636,496 $34,636,496 $732,104,026 $12,139,881
Total: 6,285,336 $2,225,796,764 $541,561,420 $1,150,082,090 $732,104,026 $732,104,026 $239,271,486
Economics Summary
Net Present Worth Table: Economics Information:
0% $732,104,026 40% ($207,514,262) Payout Time: 4.53 years5% $438,572,962 50% ($256,295,863) Rate of Return: 19.96 %8% $310,284,627 60% ($289,089,502) Return on Investment: 1.75
10% $239,271,486 70% ($312,193,777) Disc. Return on Investment: 0.5715% $99,754,422 80% ($329,109,814)20% ($649,784) 90% ($341,895,234)30% ($130,651,434) 100% ($351,818,533)

Economic Conclusion
� Plant Size = 6,000 tons MSW/day
� TCI = $418,000,000
� NPW = $239,000,000 @ 10% discount
� IRR = 20%
� Urea Break-even Price = $65/ton

Questions?

Pyrolysis Reactor� Vertical shaft reactor
� Solid waste enters through the top
� Purified oxygen from air separator fed through the bottom
� Solid waste dried by upward flowing gases at top of reactor� Exiting gas therefore cooled to between 93°C and 315°C
� Pyrolysis occurs in the middle zone at temperatures above 1500°C� Combustion of char in oxidative zone at the bottom of the reactor produces the heat necessary for the pyrolytic reactions
� Operates between 2100 and 2200psia

Gas Cleaning� Syngas flows through spraying water scrubber
� Electrostatic precipitator removes particulates and pyrolytic oils� These components are recycled back to the reactor
� Water removed in a shell and tube condenser

Operating Cost� Utilities, labor and catalyst costs estimated from data in the Encyclopedia of Chemical Technology
� Other operating costs estimated from reasonable percentages in Plant Design and Economics for Chemical Engineers� Supervision: 15% of labor� Maintenance and repairs: 3% of FCI� Operating supplies: 15% of maintenance and repairs� Laboratory charges: 15% of labor� Insurance: 0.7% of FCI� Property taxes: 2% of FCI� Overhead: 60% of labor, supervision, and maintenance and repair costs
� Distribution and marketing: 6% of total operating cost
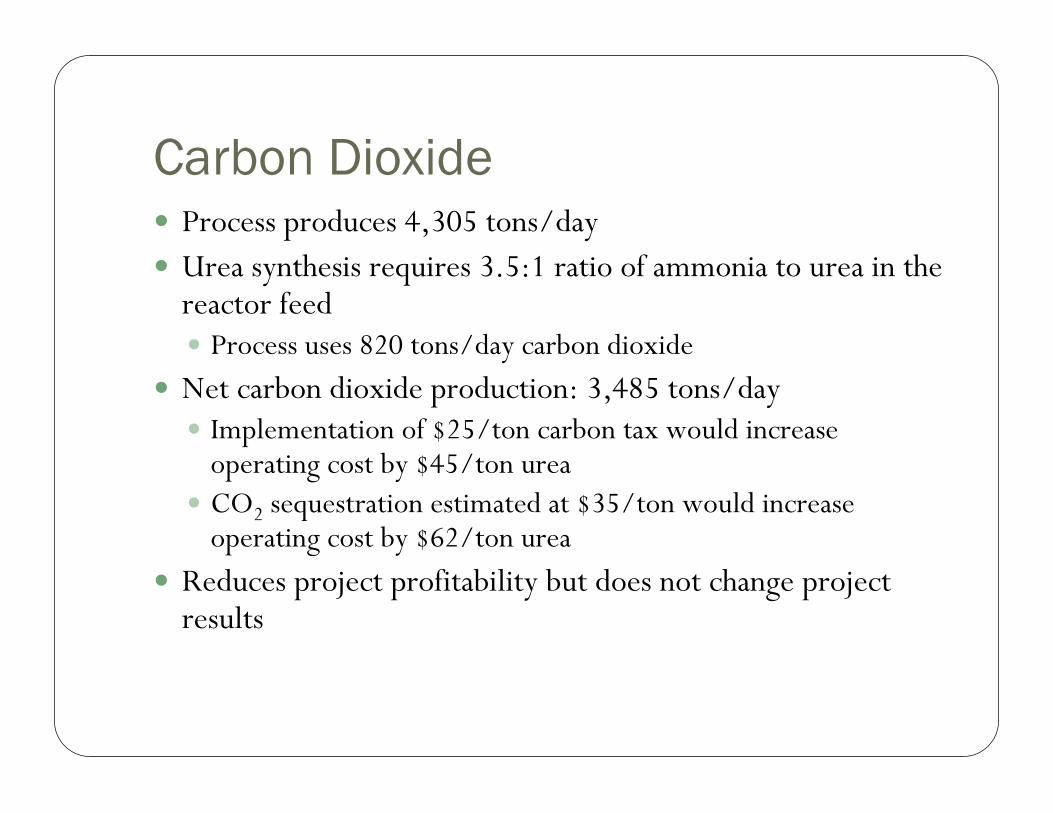
Carbon Dioxide� Process produces 4,305 tons/day� Urea synthesis requires 3.5:1 ratio of ammonia to urea in the reactor feed� Process uses 820 tons/day carbon dioxide
� Net carbon dioxide production: 3,485 tons/day� Implementation of $25/ton carbon tax would increase operating cost by $45/ton urea
� CO2 sequestration estimated at $35/ton would increase operating cost by $62/ton urea
� Reduces project profitability but does not change project results

Methanol
OHCHCOH 322 →+
� Reactant Ratio :
� Low Temperatures and High Pressures favor Methanol formation
� Methanol can be sold as a product or used as an intermediate to produce alternative products
OHOHCHCOH 23223 +→+1
32 2
2 =+ COCO
H

Ammonia
322 23 NHNH →+
� Reactant Ratio:
� Used in fertilizers and refrigeration
� Reaction occurs at high temperature and pressure
32
2 =N
H
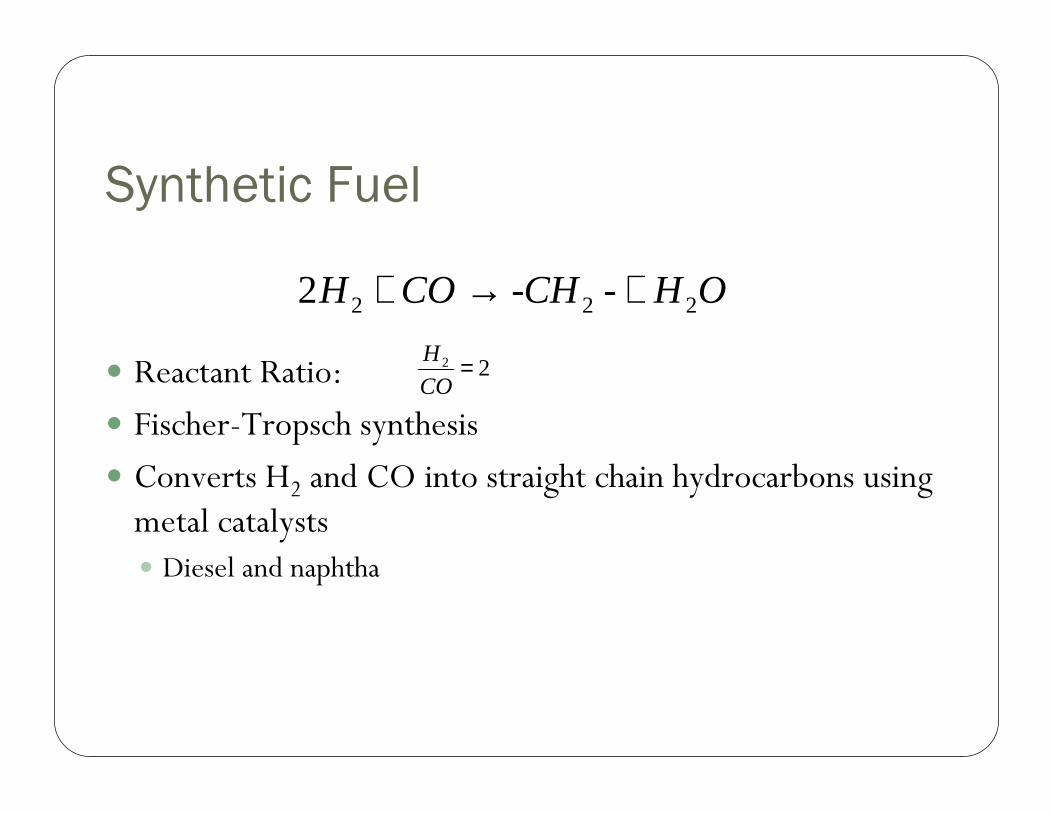
Synthetic Fuel
OHCHCOH 222 --2 +→+
� Reactant Ratio:
� Fischer-Tropsch synthesis
� Converts H2 and CO into straight chain hydrocarbons using metal catalysts � Diesel and naphtha
22 =CO
H

Hydrogen
COHCHOH +→+ 242 3)1(
� Reactant Ratio:
� Steam reformation (1) is used to convert methane into CO and H2
� Water gas shift reaction (2) is used to produce additional H2� Main fuel source for Hydrogen fuel cells
222)2( COHCOOH +→+1
4
2 =+ CHCO
OH

Economic Model: Urea Production3/6/2007
Total Capital Investment $169,751,842 Urea Production 489 tons/dayFixed Capital Investment $144,274,753 Urea Price $223 /ton 0.00% InflationWorking Capital $25,477,089 Municipal Solid Waste 1500 tons/day
MSW Charge $40 /tonTax Rate 35%Main Display Discount Rate 10% Operating Cost $112 /ton Urea 0.00% Inflation
Urea MSW NetTotal Yearly Yearly Annual Profit 10%
Capital Production Price Take Charge Gross Product After Annual Cumulative Discounted Year Investment (tons) ($/ton) (tons) ($/ton) Revenue Cost Taxes Cash Flow Cash Flow Cash Flow
0 $169,751,842 -$169,751,842 -$169,751,842 -$169,751,8422009 178,561 $223 547,500 $40 $61,719,028 $20,007,634 $29,637,214 $29,637,214 -$140,114,628 $26,942,9222010 178,561 $223 547,500 $40 $61,719,028 $20,007,634 $29,637,214 $29,637,214 -$110,477,414 $24,493,5652011 178,561 $223 547,500 $40 $61,719,028 $20,007,634 $29,637,214 $29,637,214 -$80,840,199 $22,266,8782012 178,561 $223 547,500 $40 $61,719,028 $20,007,634 $29,637,214 $29,637,214 -$51,202,985 $20,242,6162013 178,561 $223 547,500 $40 $61,719,028 $20,007,634 $29,637,214 $29,637,214 -$21,565,771 $18,402,3782014 178,561 $223 547,500 $40 $61,719,028 $20,007,634 $29,637,214 $29,637,214 $8,071,443 $16,729,4352015 178,561 $223 547,500 $40 $61,719,028 $20,007,634 $29,637,214 $29,637,214 $37,708,658 $15,208,5772016 178,561 $223 547,500 $40 $61,719,028 $20,007,634 $29,637,214 $29,637,214 $67,345,872 $13,825,9792017 178,561 $223 547,500 $40 $61,719,028 $20,007,634 $29,637,214 $29,637,214 $96,983,086 $12,569,0722018 178,561 $223 547,500 $40 $61,719,028 $20,007,634 $29,637,214 $29,637,214 $126,620,300 $11,426,429
Sv $21,641,213 $21,641,213 $0 $14,066,788 $14,066,788 $140,687,089 $4,930,324
Total: 1,785,607 $638,831,497 $200,076,345 $310,438,931 $140,687,089 $140,687,089 $17,286,333
Economics Summary
Net Present Worth Table: Economics Information:
0% $140,687,089 40% ($97,872,957) Payout Time: 5.73 years5% $67,323,430 50% ($111,342,696) Rate of Return: 12.24 %
8% $35,149,282 60% ($120,725,773) Return on Investment: 0.83
10% $17,286,333 70% ($127,581,935) Disc. Return on Investment: 0.10
15% ($17,985,960) 80% ($132,787,195)
20% ($43,605,428) 90% ($136,863,239)30% ($77,342,317) 100% ($140,136,702)