Embed Size (px)
Citation preview
Graduate School ETD Form 9 (Revised 12/07)
PURDUE UNIVERSITY GRADUATE SCHOOL
Thesis/Dissertation Acceptance
This is to certify that the thesis/dissertation prepared
By
Entitled
For the degree of
Is approved by the final examining committee:
Chair
To the best of my knowledge and as understood by the student in the Research Integrity and Copyright Disclaimer (Graduate School Form 20), this thesis/dissertation adheres to the provisions of Purdue University’s “Policy on Integrity in Research” and the use of copyrighted material.
Approved by Major Professor(s): ____________________________________
____________________________________
Approved by: Head of the Graduate Program Date
Scott D. Woodward
Studie in Pressurized Planar Electrochromatography
Master of Science
Barry Muhoberac
David Nurok
Rajesh Sardar
Barry Muhoberac
Martin O'Donnell 03/07/2011
Graduate School Form 20 (Revised 9/10)
PURDUE UNIVERSITY GRADUATE SCHOOL
Research Integrity and Copyright Disclaimer
Title of Thesis/Dissertation:
For the degree of Choose your degree
I certify that in the preparation of this thesis, I have observed the provisions of Purdue University Executive Memorandum No. C-22, September 6, 1991, Policy on Integrity in Research.*
Further, I certify that this work is free of plagiarism and all materials appearing in this thesis/dissertation have been properly quoted and attributed.
I certify that all copyrighted material incorporated into this thesis/dissertation is in compliance with the United States’ copyright law and that I have received written permission from the copyright owners for my use of their work, which is beyond the scope of the law. I agree to indemnify and save harmless Purdue University from any and all claims that may be asserted or that may arise from any copyright violation.
______________________________________ Printed Name and Signature of Candidate
______________________________________ Date (month/day/year)
*Located at http://www.purdue.edu/policies/pages/teach_res_outreach/c_22.html
Studies in Pressurized Planar Electrochromatography
Master of Science
Scott D. Woodward
03/03/2011
STUDIES IN PRESSURIZED PLANAR ELECTROCHROMATOGRAPHY
A Thesis
Submitted to the Faculty
of
Purdue University
by
Scott D. Woodward
In Partial Fulfillment of the
Requirements for the degree
of
Master of Science
May 2011
Purdue University
Indianapolis, Indiana
ii
ACKNOWLEDGMENTS
I would like to thank Dr. Nurok for his guidance and patience with me during the
research and writing of this thesis. I have learned much under your tutelage and look
forward to carrying on your reputation in the field of chromatography.
Dr. Barry Muhoberac and Dr. Rajesh Sardar are thanked for serving on my
academic committee.
Cary Prichard and Dr. Robert Santini are thanked for their efforts in designing,
building, modifying, and maintaining the different apparatuses used in this thesis.
Most of all I would like to thank my wife Amber and son Levi for their love,
patience and understanding. Without them, none of this would have been possible. I love
you both.
iii
TABLE OF CONTENTS
Page LIST OF TABLES ...............................................................................................................v LIST OF FIGURES ........................................................................................................... vi LIST OF ABBREVIATIONS ..............................................................................................x ABSTRACT ....................................................................................................................... xi CHAPTER ONE - INTRODUCTION.................................................................................1
Thin-Layer Chromatography ...................................................................................1 Forced Flow Techniques ..........................................................................................2 History of Planar Electrochromatography ...............................................................4 Reversed-Phase Planar Electrochromatography ......................................................6 Pressurized Planar Electrochromatography (PPEC) ................................................7
Attractive Features of PPEC ........................................................................9 CHAPTER TWO -THEORETICAL BACKGROUND ....................................................11
Metrics for Chromatographic Analysis ..................................................................11 Analyte Retention ......................................................................................11 Efficiency ...................................................................................................12
Forces That Effect Mobile Phase Flow ..................................................................15 Capillary Flow ...........................................................................................15 Electroosmotic Flow (EOF) .......................................................................16 Overlap of the Electrical Double Layer .....................................................19 Electrophoresis ...........................................................................................20 Resolution ..................................................................................................20
CHAPTER THREE - EXPERIMENTAL .........................................................................22 Apparatus ...............................................................................................................22 Regular TLC Plate Holder .....................................................................................26 Liquid-On-Top Holder ...........................................................................................26 Types of Sorbent Layers for PPEC ........................................................................31 Preparation of Monolith Plates for PPEC ..............................................................34 Preparation of Plates for PPEC ..............................................................................35 Plate Conditioning and Storage .............................................................................36 Sealants ..................................................................................................................36 Mobile Phase Preparation ......................................................................................36 Sample Preparation ................................................................................................37 Spotting Procedure .................................................................................................37 Dipping Method .....................................................................................................39
iv
Page Detection ................................................................................................................39 Variables that Effect Separation Quality in PPEC .................................................40
Previously Investigated Variables ..............................................................40 Variables Investigated in this Thesis .........................................................41
Effects of Dipping Time ................................................................41 Effects of Dipping Depth ...............................................................41 Effects of Sealant Thickness and Composition .............................42
CHAPTER FOUR - SHORT STUDIES ............................................................................44 PPEC Separations across a Temperature Gradient ................................................44 Separation of Steroids ............................................................................................46
CHAPTER FIVE - SEPARATION OF PEPTIDES ..........................................................52 Separation of Peptides and Proteins by PPEC .......................................................52 PPEC Separation of Peptides on Brij-35 Complexed Plates .................................53
Soak Concentration ....................................................................................57 Soak Duration ............................................................................................60 Buffer Solution...........................................................................................60 Nominal pH of Mobil Phase ......................................................................60 Concentration of Mobile Phase ..................................................................62 Bake Temperature ......................................................................................65 Duration of Baking ....................................................................................68 Run Temperature .......................................................................................68 Idle Time ....................................................................................................71 Spotting Volume ........................................................................................71 Pressure ......................................................................................................73 Visualization ..............................................................................................73 Humidity ....................................................................................................74
Separation of Peptides and Proteins on Monolith Plates .......................................74 Description of Monolith Plates Received ..................................................75 PPEC Separations on Neutral Monoliths ...................................................80
Visualization ..................................................................................86 Protein Separation ..........................................................................86 Optimum Conditions for Neutral Plates ........................................89
PPEC Separations on Charged Monoliths .................................................91 Optimum Conditions for Charged Plates .......................................92
CONCLUSIONS................................................................................................................95 REFERENCES ..................................................................................................................97
v
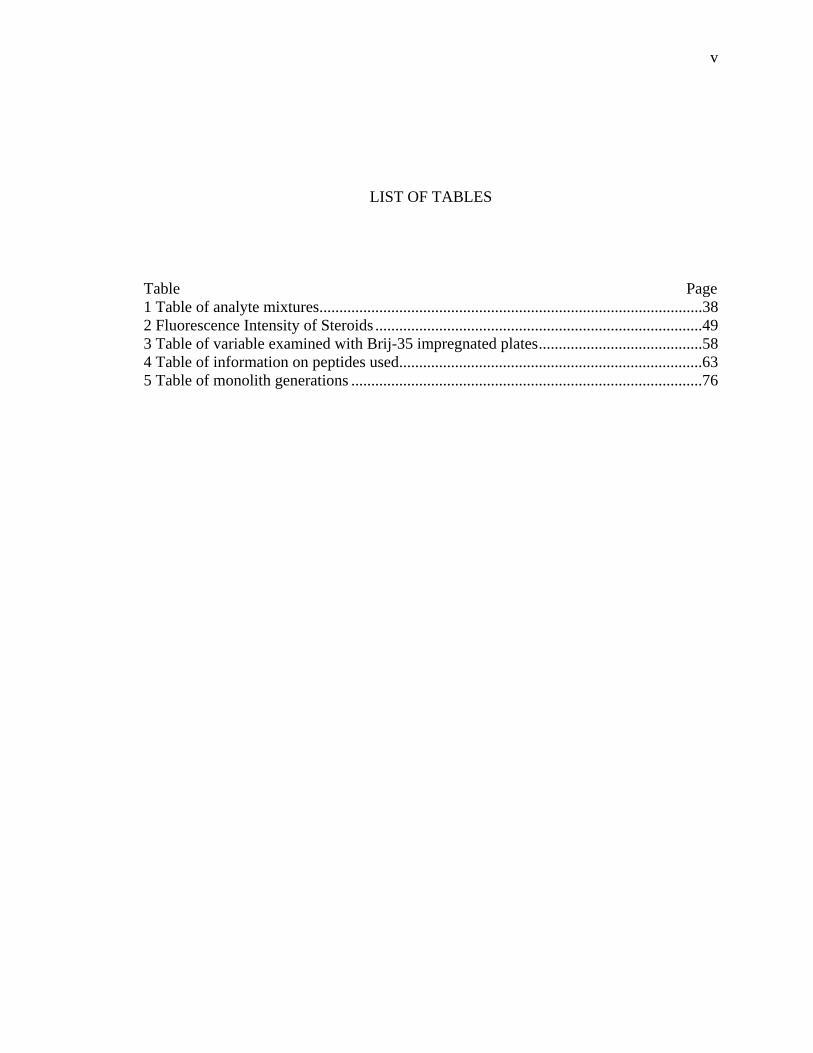
LIST OF TABLES
Table Page 1 Table of analyte mixtures ................................................................................................38 2 Fluorescence Intensity of Steroids ..................................................................................49 3 Table of variable examined with Brij-35 impregnated plates .........................................58 4 Table of information on peptides used ............................................................................63 5 Table of monolith generations ........................................................................................76
vi
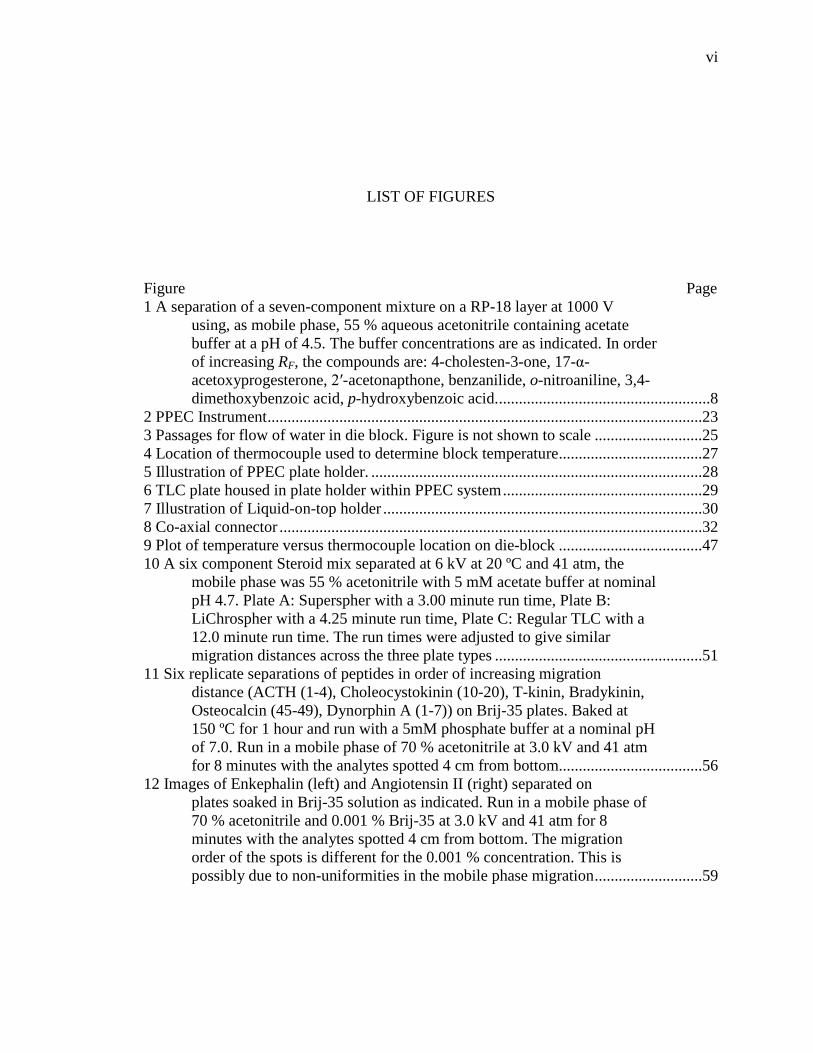
LIST OF FIGURES
Figure Page 1 A separation of a seven-component mixture on a RP-18 layer at 1000 V using, as mobile phase, 55 % aqueous acetonitrile containing acetate buffer at a pH of 4.5. The buffer concentrations are as indicated. In order of increasing RF, the compounds are: 4-cholesten-3-one, 17-α-
acetoxyprogesterone, 2′-acetonapthone, benzanilide, o-nitroaniline, 3,4-dimethoxybenzoic acid, p-hydroxybenzoic acid. .....................................................8
2 PPEC Instrument .............................................................................................................23 3 Passages for flow of water in die block. Figure is not shown to scale ...........................25 4 Location of thermocouple used to determine block temperature ....................................27 5 Illustration of PPEC plate holder. ...................................................................................28 6 TLC plate housed in plate holder within PPEC system ..................................................29 7 Illustration of Liquid-on-top holder ................................................................................30 8 Co-axial connector ..........................................................................................................32 9 Plot of temperature versus thermocouple location on die-block ....................................47 10 A six component Steroid mix separated at 6 kV at 20 ºC and 41 atm, the mobile phase was 55 % acetonitrile with 5 mM acetate buffer at nominal pH 4.7. Plate A: Superspher with a 3.00 minute run time, Plate B: LiChrospher with a 4.25 minute run time, Plate C: Regular TLC with a 12.0 minute run time. The run times were adjusted to give similar migration distances across the three plate types ....................................................51 11 Six replicate separations of peptides in order of increasing migration distance (ACTH (1-4), Choleocystokinin (10-20), T-kinin, Bradykinin,
Osteocalcin (45-49), Dynorphin A (1-7)) on Brij-35 plates. Baked at 150 ºC for 1 hour and run with a 5mM phosphate buffer at a nominal pH of 7.0. Run in a mobile phase of 70 % acetonitrile at 3.0 kV and 41 atm for 8 minutes with the analytes spotted 4 cm from bottom....................................56 12 Images of Enkephalin (left) and Angiotensin II (right) separated on plates soaked in Brij-35 solution as indicated. Run in a mobile phase of 70 % acetonitrile and 0.001 % Brij-35 at 3.0 kV and 41 atm for 8 minutes with the analytes spotted 4 cm from bottom. The migration order of the spots is different for the 0.001 % concentration. This is possibly due to non-uniformities in the mobile phase migration ...........................59
vii
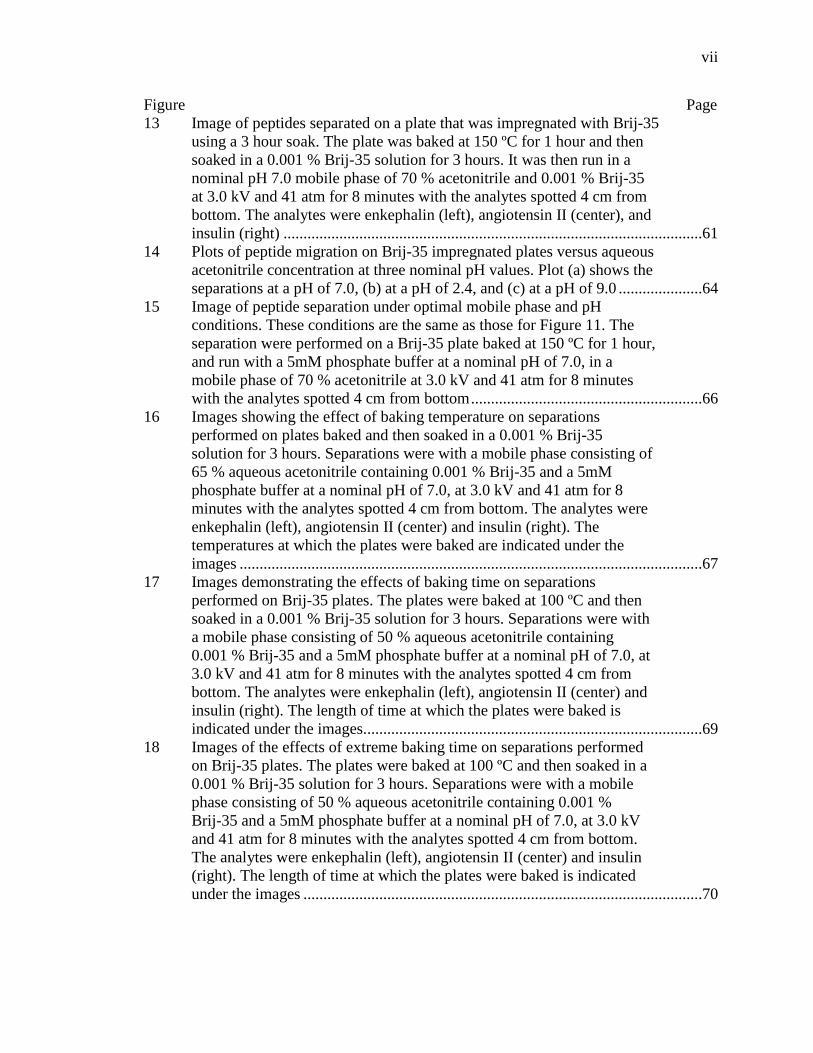
Figure Page 13 Image of peptides separated on a plate that was impregnated with Brij-35 using a 3 hour soak. The plate was baked at 150 ºC for 1 hour and then soaked in a 0.001 % Brij-35 solution for 3 hours. It was then run in a nominal pH 7.0 mobile phase of 70 % acetonitrile and 0.001 % Brij-35 at 3.0 kV and 41 atm for 8 minutes with the analytes spotted 4 cm from bottom. The analytes were enkephalin (left), angiotensin II (center), and insulin (right) .........................................................................................................61 14 Plots of peptide migration on Brij-35 impregnated plates versus aqueous
acetonitrile concentration at three nominal pH values. Plot (a) shows the separations at a pH of 7.0, (b) at a pH of 2.4, and (c) at a pH of 9.0 .....................64
15 Image of peptide separation under optimal mobile phase and pH conditions. These conditions are the same as those for Figure 11. The separation were performed on a Brij-35 plate baked at 150 ºC for 1 hour, and run with a 5mM phosphate buffer at a nominal pH of 7.0, in a mobile phase of 70 % acetonitrile at 3.0 kV and 41 atm for 8 minutes with the analytes spotted 4 cm from bottom ..........................................................66 16 Images showing the effect of baking temperature on separations performed on plates baked and then soaked in a 0.001 % Brij-35 solution for 3 hours. Separations were with a mobile phase consisting of 65 % aqueous acetonitrile containing 0.001 % Brij-35 and a 5mM phosphate buffer at a nominal pH of 7.0, at 3.0 kV and 41 atm for 8 minutes with the analytes spotted 4 cm from bottom. The analytes were
enkephalin (left), angiotensin II (center) and insulin (right). The temperatures at which the plates were baked are indicated under the images ....................................................................................................................67 17 Images demonstrating the effects of baking time on separations performed on Brij-35 plates. The plates were baked at 100 ºC and then soaked in a 0.001 % Brij-35 solution for 3 hours. Separations were with a mobile phase consisting of 50 % aqueous acetonitrile containing 0.001 % Brij-35 and a 5mM phosphate buffer at a nominal pH of 7.0, at 3.0 kV and 41 atm for 8 minutes with the analytes spotted 4 cm from bottom. The analytes were enkephalin (left), angiotensin II (center) and insulin (right). The length of time at which the plates were baked is indicated under the images. ....................................................................................69 18 Images of the effects of extreme baking time on separations performed on Brij-35 plates. The plates were baked at 100 ºC and then soaked in a 0.001 % Brij-35 solution for 3 hours. Separations were with a mobile phase consisting of 50 % aqueous acetonitrile containing 0.001 % Brij-35 and a 5mM phosphate buffer at a nominal pH of 7.0, at 3.0 kV and 41 atm for 8 minutes with the analytes spotted 4 cm from bottom. The analytes were enkephalin (left), angiotensin II (center) and insulin (right). The length of time at which the plates were baked is indicated under the images ....................................................................................................70
viii
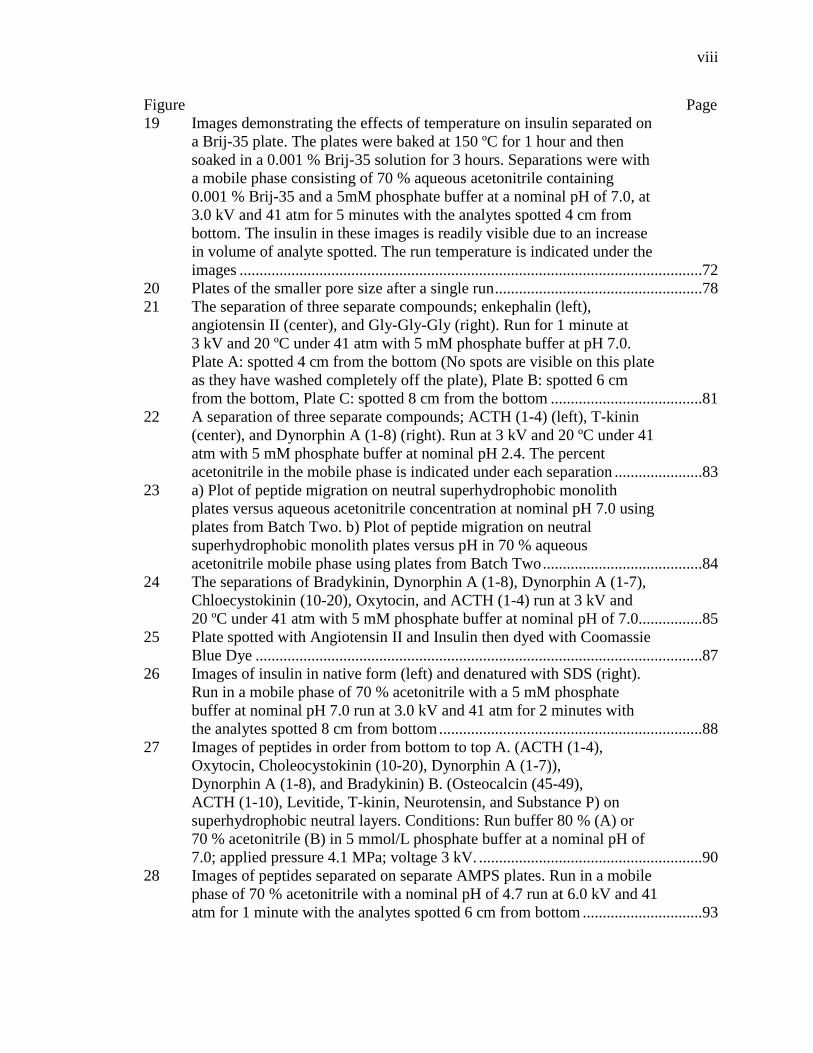
Figure Page 19 Images demonstrating the effects of temperature on insulin separated on a Brij-35 plate. The plates were baked at 150 ºC for 1 hour and then soaked in a 0.001 % Brij-35 solution for 3 hours. Separations were with a mobile phase consisting of 70 % aqueous acetonitrile containing 0.001 % Brij-35 and a 5mM phosphate buffer at a nominal pH of 7.0, at 3.0 kV and 41 atm for 5 minutes with the analytes spotted 4 cm from bottom. The insulin in these images is readily visible due to an increase in volume of analyte spotted. The run temperature is indicated under the images ....................................................................................................................72 20 Plates of the smaller pore size after a single run ....................................................78 21 The separation of three separate compounds; enkephalin (left), angiotensin II (center), and Gly-Gly-Gly (right). Run for 1 minute at 3 kV and 20 ºC under 41 atm with 5 mM phosphate buffer at pH 7.0. Plate A: spotted 4 cm from the bottom (No spots are visible on this plate as they have washed completely off the plate), Plate B: spotted 6 cm from the bottom, Plate C: spotted 8 cm from the bottom ......................................81 22 A separation of three separate compounds; ACTH (1-4) (left), T-kinin (center), and Dynorphin A (1-8) (right). Run at 3 kV and 20 ºC under 41 atm with 5 mM phosphate buffer at nominal pH 2.4. The percent acetonitrile in the mobile phase is indicated under each separation ......................83 23 a) Plot of peptide migration on neutral superhydrophobic monolith plates versus aqueous acetonitrile concentration at nominal pH 7.0 using plates from Batch Two. b) Plot of peptide migration on neutral superhydrophobic monolith plates versus pH in 70 % aqueous acetonitrile mobile phase using plates from Batch Two ........................................84 24 The separations of Bradykinin, Dynorphin A (1-8), Dynorphin A (1-7),
Chloecystokinin (10-20), Oxytocin, and ACTH (1-4) run at 3 kV and 20 ºC under 41 atm with 5 mM phosphate buffer at nominal pH of 7.0................85 25 Plate spotted with Angiotensin II and Insulin then dyed with Coomassie Blue Dye ................................................................................................................87 26 Images of insulin in native form (left) and denatured with SDS (right). Run in a mobile phase of 70 % acetonitrile with a 5 mM phosphate buffer at nominal pH 7.0 run at 3.0 kV and 41 atm for 2 minutes with the analytes spotted 8 cm from bottom ..................................................................88 27 Images of peptides in order from bottom to top A. (ACTH (1-4), Oxytocin, Choleocystokinin (10-20), Dynorphin A (1-7)), Dynorphin A (1-8), and Bradykinin) B. (Osteocalcin (45-49), ACTH (1-10), Levitide, T-kinin, Neurotensin, and Substance P) on
superhydrophobic neutral layers. Conditions: Run buffer 80 % (A) or 70 % acetonitrile (B) in 5 mmol/L phosphate buffer at a nominal pH of 7.0; applied pressure 4.1 MPa; voltage 3 kV. ........................................................90 28 Images of peptides separated on separate AMPS plates. Run in a mobile phase of 70 % acetonitrile with a nominal pH of 4.7 run at 6.0 kV and 41 atm for 1 minute with the analytes spotted 6 cm from bottom ..............................93
ix
Figure Page 29 Image of peptides in order of increasing migration distance (Osteocalcin (45-49), T-kinin, ACTH (1-10), Neurotensin, Substance P, and Levitide) on a monolith layer grafted with a mixture of AMPS and HEMA. Conditions: Run buffer 70 % acetonitrile in 5 mmol/L acetate buffer pH of 4.7; applied pressure 4.1 MPa; voltage 6 kV. ...................................94
x
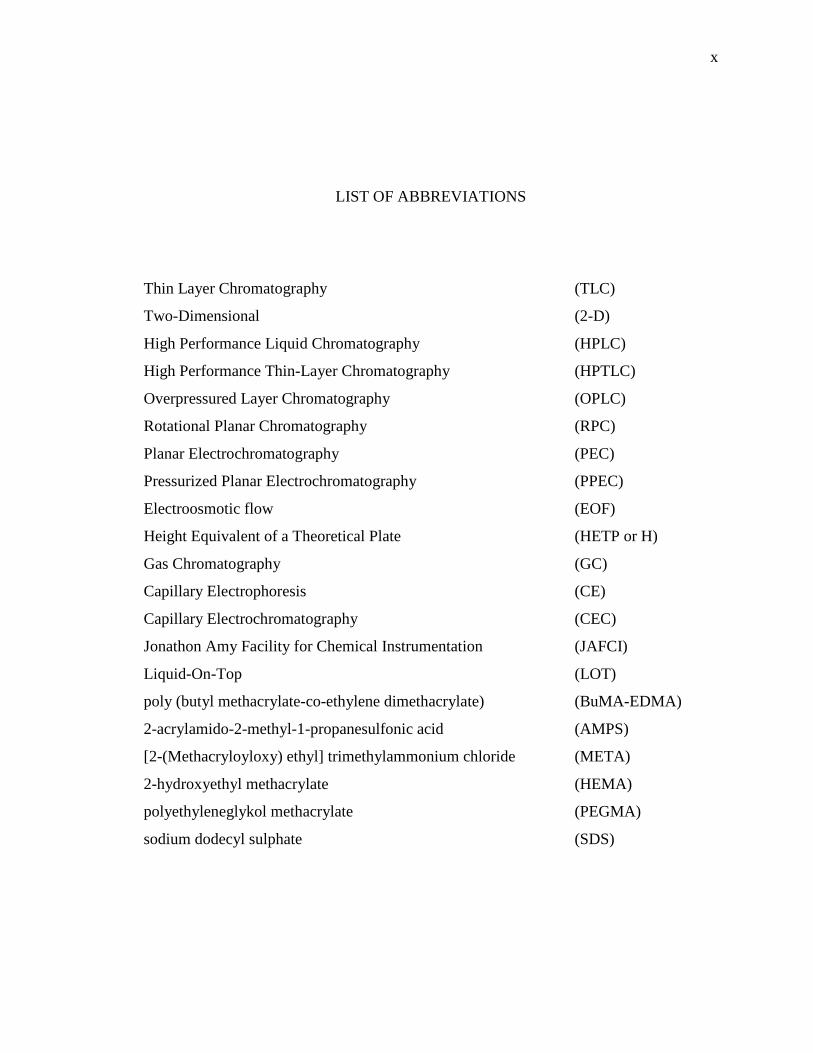
LIST OF ABBREVIATIONS
Thin Layer Chromatography (TLC)
Two-Dimensional (2-D)
High Performance Liquid Chromatography (HPLC)
High Performance Thin-Layer Chromatography (HPTLC)
Overpressured Layer Chromatography (OPLC)
Rotational Planar Chromatography (RPC)
Planar Electrochromatography (PEC)
Pressurized Planar Electrochromatography (PPEC)
Electroosmotic flow (EOF)
Height Equivalent of a Theoretical Plate (HETP or H)
Gas Chromatography (GC)
Capillary Electrophoresis (CE)
Capillary Electrochromatography (CEC)
Jonathon Amy Facility for Chemical Instrumentation (JAFCI)
Liquid-On-Top (LOT)
poly (butyl methacrylate-co-ethylene dimethacrylate) (BuMA-EDMA)
2-acrylamido-2-methyl-1-propanesulfonic acid (AMPS)
[2-(Methacryloyloxy) ethyl] trimethylammonium chloride (META)
2-hydroxyethyl methacrylate (HEMA)
polyethyleneglykol methacrylate (PEGMA)
sodium dodecyl sulphate (SDS)
xi
ABSTRACT
Woodward, Scott D., M.S. Purdue University, May 2011, Studies in Pressurized Planar Electrochromatography. Major Professor: Dr. Barry Muhoberac.
This thesis describes separations performed by Pressurized Planar
Electrochromatography (PPEC), which is a chromatographic method developed at
IUPUI. In PPEC the mobile phase is driven by electroosmotic flow, while the system is
pressurized to allow temperature control. This results in a highly efficient
chromatographic system that has several attractive attributes including the ability to
separate multiple samples simultaneously.
The first three chapters of the thesis describe the relationship of PPEC to other
forms of chromatography, the theoretical background of PPEC, the PPEC apparatus,
including the plate holders used, and the different manipulations involved in preparing a
plate for a PPEC run.
The fourth chapter describes two short studies. The first demonstrates that a very
fast separation of steroids on a high efficiency sorbent layer can be effected by PPEC.
This is illustrated by the separation of six steroids in three minutes on a Superspher layer,
with an efficiency of over 100,000 plates per meter. The second study attempted to
improve the efficiency of separation by imposing a temperature gradient. The study was
xii
not successful, possibly due to Joule heating within the layer overriding the temperature
gradient.
The final chapter of the thesis describes two different studies on separating
peptides by PPEC. The first study was performed on a bonded C18 sorbent layer that was
treated with Brij-35, which is a non-ionic surfactant that prevents irreversible adsorption
of the peptides to the sorbent surface while allowing electroosmotic flow. The variables
involved in preparing the plates by soaking in a Brij-35 solution were investigated as well
as the variables for PPEC (temperature, pressure, electrical potential, and mobile phase
composition and pH). It was possible to separate six peptides in eight minutes using this
approach.
The second study used monolithic sorbent layers prepared by Dr. Frantisek Svec
of Lawrence Berkeley National Laboratory. Separations were by conventional PPEC on
charged monoliths and by electrophoresis on neutral monoliths. The same variables for
PPEC, listed in the above paragraph, were investigated for the monolith study. It was
possible to separate six peptides in two minutes on neutral monoliths and in one minute
on negatively charged monoliths.
1
CHAPTER ONE - INTRODUCTON
Thin-Layer Chromatography
Thin Layer Chromatography (TLC), also called planar chromatography, is an
analytical technique that was introduced in 1938 [1] and is still widely used [2]. TLC has
many attractive attributes, such as the simplicity of the technique, the ability to
simultaneously run multiple samples on the same TLC plate, the fact that there is no need
to transport the separated compounds to a detector, and that sample cleanup is often not
necessary because TLC plates are not generally reused. In TLC the solvent is removed
after the separation is completed, thus preventing any possible interference with
detection, and high quality scanners are available for quantitation [3]. Other attractive
attributes are that a large number of spot visualization techniques are available [4], and it
is possible to separate complex mixtures in the two-dimensional (2-D) mode [1]. The
latter mode involves two sequential separations in orthogonal directions, with each
separation using a mobile phase/stationary phase combination of different selectivity.
TLC is used for quantitative analysis by relatively few laboratories as compared
to High Performance Liquid Chromatography (HPLC) [5] because of some unattractive
features. These are best discussed in conjunction with some key relationships. The main
disadvantage of TLC is low chromatographic efficiency due to the poor flow profile
2
caused by the mobile phase migration velocity decreasing as the solvent front progresses
through the sorbent layer. This relationship is given by equation 1:
Uf=κ/2Zf (1)
Where Uf is the velocity of the solvent front in cm/s, κ is the solvent velocity constant in
cm2/s, and Zf is the migration distance of the solvent front in cm. This diminution of the
mobile phase velocity can result in long analysis times, especially when working in the
reversed phase mode, which in this thesis refers to chromatography with a non-polar
stationary phase and a water-based mobile phase. It is not possible to control the mobile
phase velocity when using capillary mediated flow. Thus the efficiency of TLC is
inherently limited due to the inability to obtain an optimum mobile phase velocity.
TLC plates with very small particles are available and are referred to as High
Performance Thin-Layer Chromatography (HPTLC) plates [6]. These plates can yield
high efficiency, but only for short migration distances as discussed later in the thesis. For
long migration distances there is substantial diminution of mobile phase velocity due to
the relationship expressed in equations 1 and 15, and also a substantial loss of efficiency
[7]. This limits the number of compounds that can be separated.
There are several multi-development techniques, which sharpen peaks and
increase the number of analytes that can be separated, but these are very time consuming
and not often used.
Forced Flow Techniques
Forced flow techniques were introduced to improve the speed and efficiency of
planar chromatography. There are five forced flow techniques: Overpressured Layer
3
Chromatography (OPLC), Rotational Planar Chromatography (RPC), Shear-Driven
Liquid Chromatography, Planar Electrochromatography (PEC) and Pressurized Planar
Electrochromatography (PPEC).
In OPLC, an inflated bag pressurizes and seals the surface of the TLC plate. This
allows the mobile phase to be pumped through the sorbent layer [8], leading to a higher
linear mobile phase velocity that results in higher efficiency than obtainable by capillary
mediated flow. Problems that occur in OPLC are due to gradients caused by solvent de-
mixing, which will be discussed later in the thesis and the presence of the “disturbing
effect”. The latter refers to the presence of micro-bubbles in and near the solvent front
due to desorption of air from the sorbent particles. This leads to an irregular solvent front.
In RPC the plate is rotated at a high angular velocity causing the mobile phase to
be driven from the center to the edges by centrifugal force [9]. However, because the
mobile phase moves radially, the linear velocity diminishes as it moves outward, and the
optimum velocity cannot be obtained. In spite of these drawbacks, RPC technique results
in higher speed of separation and better efficiency than is attainable in classical TLC.
Both OPLC and RPC are well-established techniques for which apparatus is
commercially available.
Shear-Driven Liquid Chromatography is a newer technique that is still at the
proof-of-principle stage. In this technique the sorbent layer is coated onto the walls of a
channel, as small as 100 nm, which is filled with mobile phase [10]. A top wall is
moveable and as it is pulled across the channel, viscous drag causes the mobile phase to
flow. There are only a few research reports that mention this technique [11], but
preliminary results show that fast and efficient separations can be achieved.
4
In Planar Electrochromatography the mobile phase is driven by electroosmotic
flow (EOF) through the sorbent layer of a TLC plate. The advantages of using EOF are
that, theoretically, a flat flow profile of the mobile phase should be achieved in contrast
to the laminar flow observed in pressure-driven systems, and that EOF is independent of
particle diameter and the length of the sorbent bed [see equation 16].
PEC can be performed on either pre-wetted [12-17] or on initially dry [18-24]
TLC plates. Separations using initially dry layers are performed in a horizontal chamber
with each end of the plate contacting a solvent reservoir, which contains an electrode
through which the electric potential is applied. This technique yields little enhancement
to migration velocity and because the separations yield poor results this approach has
been abandoned in favor of using pre-wetted plates. Separation on pre-wetted plates is
discussed in the following section.
PPEC is a more efficient technique than PEC for the following reasons.
Pressurization overcomes mobile phase evaporation due to Joule heating or accumulation
of liquid on the layer surface, two effects that occur under different conditions as
discussed in the following section. The application of pressure also allows temperature
control of the separation through the pressurizing medium. PPEC is always performed on
pre-wetted TLC plates because this technique gives increased speed and efficiency.
History of Planar Electrochromatography
Thin layer electrophoresis was the first technique to use an electric field to
perform a separation in a planar mode [25]. The first use of EOF in chromatography was
reported by Pretorius and co-workers in 1974 [12]. This report describes the use of EOF
5
for both planar and column chromatography. The planar technique was called High
Speed Thin-Layer Chromatography (HSTLC), and was performed with a TLC plate
aligned vertically, with the base of the plate in a trough of solvent, located at the bottom
of the plate. The cathode was a wire positioned at the top of the plate and the anode was a
wire placed in the solvent trough. The report demonstrated the separation of four steroids
in 4 minutes, which was fifteen times faster than the corresponding separation by TLC.
The section on column chromatography had satisfactory detail, while the section on
planar chromatography contained few experimental details, and did not even state the
mobile phase used for the separation.
In an article discussing PEC in 1997, Poole and Wilson described Pretorius’ paper
in the following way [26]:
“It is unfortunately true that this is one of the most frustrating papers in modern
chromatography insofar as the lack of detail and experimental methodology given makes
repeating the work almost impossible” and “Had the technique been investigated further
the whole development of modern planar chromatography might have been different.”
After a hiatus of more than 20 years, Pukl and co-workers [19] reported the
separation of a mixture of six dyes on initially dry layers using an experimental setup
similar to that described by Pretorius. This was the first report to refer to the technique as
Planar Electrochromatography. There was an increase in the speed of separation of only
15 %, and the separation quality was poor. As discussed earlier, separations under
initially dry conditions yield poor results. The authors suggested that further investigation
into the technique would be important, due to a significant amount of research that could
be undertaken in the development and optimization of the method.
6
Reversed-Phase Planar Electrochromatography
While good separations in the reversed-phase mode can be achieved with PEC
when the appropriate conditions are chosen, the results described below reveal an
important drawback of electrochromatography at atmospheric pressure [27]. The major
disadvantage of PEC is the fact that while the major component of electroosmotic flow is
in the axial direction, there is also flow to the surface of the TLC layer, which results in
the formation of a film of liquid, which can degrade the quality of separation. This
problem is offset by evaporation of the mobile phase caused by Joule heating, which is
controlled by buffer concentration, pH, and applied voltage. Under conditions, which
produce large amounts of Joule heating, excessive drying can occur, which can also
lower the separation quality. A careful balance between these two phenomena results in
good separations.
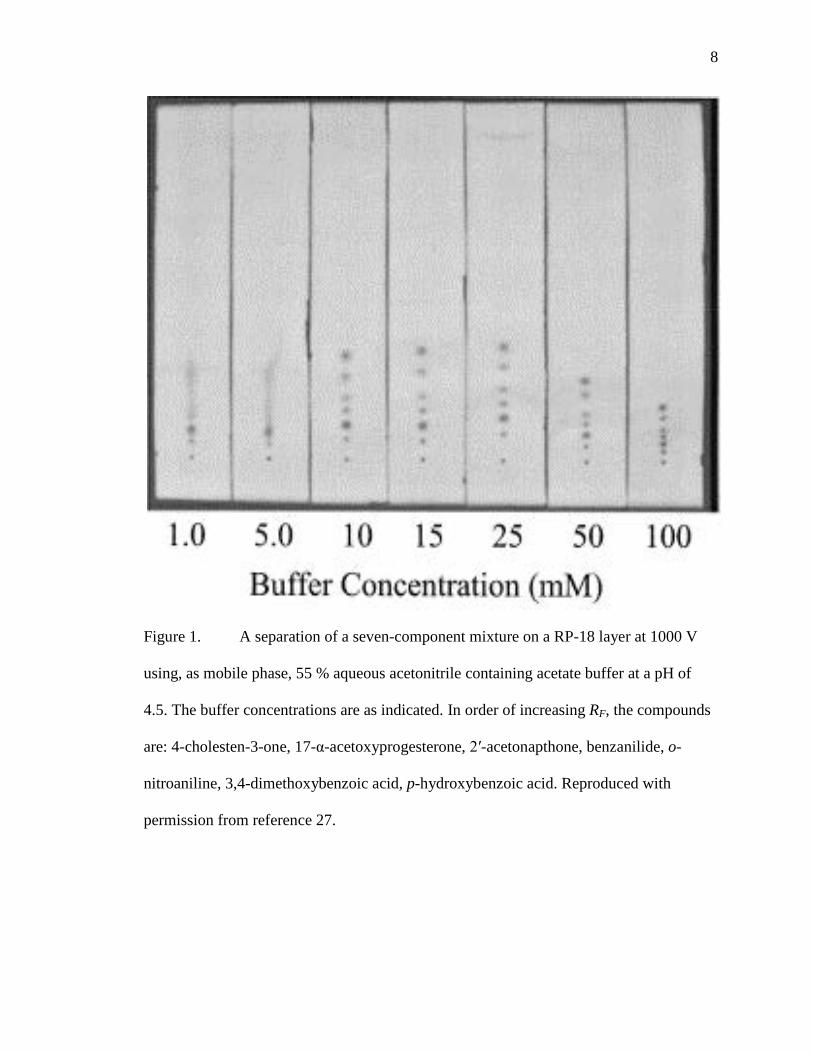
The following study reported by Nurok and co-workers, illustrated the balance
between liquid evaporating from the layer surface and liquid being driven to the layer
surface [29]. A set of PEC experiments were performed in which the concentration of
acetate buffer in the mobile phase was varied. The reported separations were performed
on bonded C18 layers at a constant applied voltage of 1 kV using 55 % aqueous
acetonitrile containing various concentrations of acetate buffer, ranging from 1mM to 100
mM, at pH 4.5 for 10 minutes [30]. At the two lowest buffer concentrations (1 mM and 5
mM) there is clear evidence of streaking due to accumulation of liquid on the layer
surface, as a result of insufficient evaporation of liquid. At buffer concentrations between
10 mM and 25 mM, better quality separations occurred with all analytes being
completely separated due to a balance between liquid flowing to, and evaporation from,
7
the surface. Separations at buffer concentrations of 50 mM and 100 mM, dried at 4
minutes and 2 minutes respectively [see Figure 1].
Nurok and co-workers [27] offered the following explanation as to why liquid is
driven to the surface. In a packed bed there is a distribution in the size of the channels
through which the liquid flows. Under certain conditions, the flux of liquid from one
channel to the next may be substantially different, and in a packed tube the channels of
lower flux control the overall EOF. However, in an open system such as PEC when a
channel of higher flux leads to a channel of lower flux the excess liquid can migrate
towards the surface since there is no constraining pressure. If this effect is large enough,
liquid may accumulate on the surface of the layer. An alternative explanation, reported by
Dzido and co-workers, suggests that liquid on the surface may be due to an excessive
flow of the mobile phase along the layer surface from the reservoir on the anode side of
the plate [28]. Dzido and co-workers, however, have not referred to this latter
interpretation in their more recent publications [31].
In summary, separations by PEC can be faster and more efficient than those by
classical TLC. The major limitations of the technique are that either the layer dries under
conditions where a large amount of Joule heating is generated, or that spot streaking
occurs, under conditions where liquid accumulates on the layer surface due to a low
degree of Joule heating.
Pressurized Planar Electrochromatography (PPEC)
PPEC is a new separation technique developed at Indiana University-Purdue
University Indianapolis (IUPUI) that overcomes the problems associated with PEC at
8
Figure 1. A separation of a seven-component mixture on a RP-18 layer at 1000 V
using, as mobile phase, 55 % aqueous acetonitrile containing acetate buffer at a pH of
4.5. The buffer concentrations are as indicated. In order of increasing RF, the compounds
are: 4-cholesten-3-one, 17-α-acetoxyprogesterone, 2′-acetonapthone, benzanilide, o-
nitroaniline, 3,4-dimethoxybenzoic acid, p-hydroxybenzoic acid. Reproduced with
permission from reference 27.
9
atmospheric pressure. In PPEC the mobile phase is driven by electroosmotic flow while
the sorbent layer is pressurized by contact with two temperature-controlled die blocks.
This prevents both mobile phase evaporation and accumulation of liquid on the layer
surface. PPEC can be considered a form of column electrochromatography in a planar
format.
Attractive Features of PPEC
PPEC is substantially faster and more efficient than conventional TLC. This was
illustrated by Novotny [30] comparing a classical TLC and a PPEC separation of a five-
component mixture of small molecules on LiChrospher plates. The TLC separation was
performed for 24 minutes after allowing the plate to be fully saturated with mobile phase
prior to TLC. The PPEC separation was performed for 3 minutes at 9kV and 41 atm.
Both separations were performed using a mobile phase of 55 % aqueous acetonitrile
containing 5mM acetate buffer at pH 4.7. A 24-fold enhancement in the speed of
separation between PPEC and TLC was obtained. In addition to the enhanced speed of
separation, efficiencies for PPEC separations have been reported as high as 100,000
plates per meter [30].
Both Regular and LiChrospher plates yield rather similar results when used to
separate the five-component mixture by conventional TLC. When the plates were run by
PPEC to a development distance of 9.0 cm using a mobile phase of 55 % aqueous
acetonitrile containing 5 mM acetate buffer at pH 4.7 Novotny demonstrated that the
LiChrospher plates yielded dramatically better results than the regular plates. The faster
separation on the LiChrospher plates was interpreted as being due to the lower carbon
10
load of the silica surface. This should expose more of the silica surface and, therefore, a
larger concentration of silanol groups to the mobile phase. The excellent peak shape is
interpreted as being due to the fact that the layer consists of spherical particles of a
narrow size distribution. The properties of these plates are discussed in the Types of
Sorbent Layers for PPEC section.
PPEC is well suited to the simultaneous separation of multiple samples. In
addition to spotting the samples along a line parallel to the mobile phase origin, the
samples can also be spotted as a 2-dimensional array. This approach has been used by
Novotny to separate nine samples of the five-component mixture in 1 minute [30]. This is
possible because the plate is pre-wetted with mobile phase before PPEC, and the
separation of all samples commences simultaneously. A complete dip is used to pre-wet
the plate, but this is not good for quantitative analysis. An alternative procedure would be
to wet strips of filter paper with mobile phase and press these strips onto the TLC plate
between analyte spots. The remaining dry areas will be wetted by capillary action.
Novotny also demonstrated that the sample throughput can be doubled by using
two plates that are inserted back-to-back (glass backing together) into the apparatus [30].
Such a separation was performed using a separate electrode for each TLC plate. With an
appropriate electrode setup, multiple plates could be stacked, which would further
increase the number of samples that can be separated simultaneously. Temperature
control could be obtained by placing metal blocks with liquid circulation channels
between the plates. This configuration, together with the ability of PPEC to separate a
two-dimensional array of samples, should provide a substantial advantage for high-
throughput separations, as the method is refined in the future.
11
CHAPTER TWO - THEORETICAL BACKGROUND
Metrics for Chromatographic Analysis
The following discussions and equations are specific for TLC but some are more
general and apply to all forms of chromatography.
Analyte Retention
The basis for chromatography is that compounds are separated by distribution
between the stationary phase and the mobile phase. This section discusses general
concepts, focusing on planar chromatography. Other modes of chromatography are
briefly discussed where relevant.
The retention factor (k), also referred to as the capacity factor or the partition
ratio, measures the relative affinity of a compound for the stationary and mobile phases,
and is defined as:
k=ms/mm (2)
where ms, and mm are the mass of the analyte in the stationary and mobile phase
respectively.
In planar chromatography the parameter for retention is the retardation factor (Rf),
which decreases with increasing affinity of the solute for the stationary phase, relative to
the mobile phase. Rf is defined as:
12
Rf=MD/Zf (3)
where MD is the migration distance of the analyte and Zf is the distance migrated by the
solvent front.
Rf and k are related by the following equation under conditions of full vapor
saturation:
Rf=1/(1+k) (4)
The separation factor, α, is a measure of separation between two analytes and is
defined as:
α=kb/ka (5)
where analyte b is the more retained compound. Thus α is always greater than or equal to
unity. The separation factor is related to Rf by the following equation:
α= Rf,a(1-Rf,b)/ Rf,b(1-Rf,a) (6)
Efficiency
In chromatography it is important to obtain sharp symmetrical peaks, which
increase the probability that analytes will be separated. The efficiency of a separation, a
measure of the sharpness of the peaks, can be defined by several different parameters.
One such parameter is the number of theoretical plates, N. This is defined as:
N=(MD/σ)2 (7)
where MD is the migration distance of the analyte and the σ is the standard deviation of
the peak about its mean position. The number of theoretical plates can be conveniently
measured by the following equation where the width at half height is equal to 2.354σ
assuming a Gaussian distribution:
13
N=5.54(MD/W1/2)2 (8)
where MD is the migration distance of the analyte and W1/2 is the width of the peak at half
height.
An important chromatographic variable is the Height Equivalent of a Theoretical
Plate (HETP or H), which for planar chromatography is defined by the following
equation:
H=MD/N (9)
Based on this equation, the height of a theoretical plate decreases with decreasing peak
width for a given migration distance. Efficiency can be reported as the number of
theoretical plates per meter.
In PPEC the peak width of the initial spot makes a significant contribution to the
final spot width. Because of this it is of interest to predict the efficiency of a separation in
which a very small initial spot is used. In order to do this a theoretical width at half
height, W1/2,a is calculated by the following equation [29]:
W1/2,a=Wd+(Wf-Wi) (10)
where Wd, is an ideal spot width that is small enough not to have a meaningful
contribution to the final spot width, Wf is the width at half height for the final peak, and
Wi is the width at half height of the initial spot. Wf and Wi are experimental values could
be determined by scanning the TLC plate. W1/2,a can be used to calculate the ideal
number of theoretical plates, Nd, and the ideal plate height, Hd.
The relationship between the height of a theoretical plate and the velocity of the
mobile phase is given by the van Deemter equation:
H=A+(B/u)+CSu+CMu (11)
14
where u is the mobile phase velocity, A is the eddy diffusion term, B is the longitudinal
molecular diffusion term, and CS and CM are the resistance to mass transfer terms. This is
a simplified version of the equation with the A, B, and C terms defined below. A plot of
the height of a theoretical plate versus mobile phase velocity is termed a van Deemter
plot.
The A term represents the contribution of eddy diffusion to the overall band
broadening:
A=2λdp (12)
The term A is a function of the multiple paths in the sorbent layer available for an analyte
to travel. It is dependent on the size of the particles (dp) and a geometrical packing factor
(λ). The A term is minimized by using stationary phases composed of small uniformly
packed particles [32].
The B term, which accounts for diffusion in all directions, arises from diffusion of
analytes in the mobile phase:
B=2ψDm (13)
This variable is proportional to the obstruction factor (ψ), which allows for the nature of a
packed bed, and the diffusion coefficient (Dm) of the analyte in the mobile phase [32].
The latter is dependent on the temperature and pressure of the mobile phase, and the
diffusion rate is low under conditions of low temperature and high pressure. As the
migration distance increases in classical TLC, the velocity of the mobile phase decreases
while the diffusion of the spots continues to increase. After a certain migration distance
no improvement in resolution is obtained due to excessive diffusion. This limitation does
not apply to PPEC.
15
The C term represents the contribution of resistance to mass transfer to the overall
band broadening. In Gas Chromatography (GC) and HPLC this is considered the most
important contribution to band broadening, and arises from separations being performed
under non-equilibrium conditions. Analytes do not fully equilibrate between the
stationary and mobile phases, due to the flow of mobile phase. The result is that some
analyte molecules spend more time in the mobile phase and travel faster than the overall
population of molecules. Other analyte molecules spend more time in the stationary
phase resulting in slower migration than the population of molecules. Resistance to mass
transfer increases with the velocity of the mobile phase. Lower mobile phase velocities
result in lower values for the C term, but this is undesirable because lower velocities
increase the separation time and results in substantial spot broadening due to increased
diffusion.
In a description of the C terms:
CS=f(k)(df2/Ds) (14a)
CM=f(k)(dp2/Dm) (14b)
the magnitude of CS is dependent on the average film thickness (df) and the diffusion
coefficient (Ds), while the magnitude of CM is dependent on the particle diameter (dp) and
the diffusion coefficient (Dm) [32].
Forces that Effect Mobile Phase Flow
Capillary Flow
In classical TLC the mobile phase is driven by capillary action. The mobile phase
velocity is inversely proportional to the distance traveled by the solvent front [see
16
equation 1]. Because of this, the solvent front travels progressively more slowly as it
moves along the plate and this can result in lengthy and inefficient separations. This is the
most unattractive feature of TLC.
The mobile phase velocity is proportional to, κ, the solvent velocity constant and
is related to important variables by the following equation [33]:
κ=2k0dp(γ/η)cosθ (15)
where k0 is the permeability constant of the layer (dimensionless), dp is the diameter of
the particles in the layer in cm, γ is the surface tension in N cm-1, η is the viscosity of the
mobile phase in N s cm-2, and θ is the contact angle of the mobile phase.
Inspection of equations 1 and 15 shows that the mobile phase velocity depends on
the diameter of the particles in the stationary phase, with smaller particles resulting in
slower migration. Because of this relationship, high-performance TLC plates, which are
composed of smaller particles, yield the most efficient separations only for very short
mobile phase migration distances [34]. The diminution of migration velocity is
substantial at greater distances, and this can result in time-consuming separations. This in
turn results in the separation efficiency and resolution being limited by diffusion in
classical TLC.
Electroosmotic Flow (EOF)
This discussion of electroosmotic flow refers to separations in the reversed phase
mode. EOF occurs due to the formation of an electrical double layer at the interface
between the stationary and mobile phases. A double layer forms when an insulator is
immersed in an electrolyte solution. Adsorption of ions from solution, or dissociation of
17
functional groups on the insulator surface are responsible for the formation of a charged
surface. If the insulator is a silica-based stationary phase, then silanol groups on the
surface begin to deprotonate when the pH of the mobile phase is greater than 3.0 (the pKa
of unreacted silanol groups on the surface of C18 derivatized silica is approximately 4.0).
The mobile phase consists of a bulk liquid with an appropriate buffer salt. At the interface
between the silica surface and the mobile phase, positive charged ions from the mobile
phase are attracted to the fixed negative charges of the silanol groups. The layer of
positive charge closest to the stationary phase is held tightly in place by electrostatic
attraction and is referred to as the fixed layer. This layer does not have sufficient
positively charged ions to completely neutralize the negative surface charge and as a
result, a second layer of net positive charge forms adjacent to the fixed layer. The second
layer is not held as tightly as the fixed layer and is referred to as the mobile layer. The
concentration of positive charge decays exponentially from the surface of the layer to
some point in the bulk solvent.
The boundary between the fixed layer and the mobile layer is called the plane of
sheer. A potential forms between the charged surface and the plane of shear is known
as the zeta potential. The cations in the mobile phase migrate toward the cathode due to
the applied electric field. The velocity of electroosmotic flow is given by:
veo=εoεζE/η (16)
where εo is the permittivity in a vacuum in C2J-1m-1, ε is the solution dielectric constant
in C2J-1m-1, ζ is the zeta potential in V, E is the applied electric field in V m-1, and η is
the viscosity of the mobile phase. The derivation of equation 16 assumes that the size of
18
the channel in which flow occurs is large compared to the size of the electrical double
layer.
This relationship allows the mobile phase velocity to be optimized by
controlling the electric field. In this thesis, the applied potential is reported rather than
the electric field since all PPEC separations, regardless of plate type, were performed
on plates where the distance between electrodes is 11 cm.
Equation 16 predicts that the velocity of EOF is independent of the particle size
in the stationary phase, and also independent of the separation path length. Therefore,
when using EOF to drive the mobile phase in planar chromatography, it is possible to
take advantage of the higher efficiencies obtained by using high-performance TLC
plates over longer migration distances. Small and uniformly shaped particles contribute
to this high efficiency.
The velocity of EOF is directly proportional to the zeta potential which is
defined by the following equation:
ζ=σδ/εoε (17)
where σ is the charge density at the surface of sheer in C m-2 and δ is the electrical
double layer thickness. The thickness of the electrical double layer is described [35] by
the following equation:
δ=( εoεRT/2cF2)1/2 (18)
where R is the universal gas constant in J mol-1 K-1, T is the absolute temperature in K,
c is the molar concentration of the buffer, and F is the Faraday constant in C mol-1. An
increase in temperature causes an increase in the zeta potential and a decrease in
viscosity. These changes result in an increase in mobile phase flow rate.
19
Overlap of the Electrical Double Layer
Equation 18 states that the size of the electrical double layer depends on both
the temperature of the separation and on buffer concentration. Thus it should follow
that an increase in electrolyte concentration would cause a decrease in the velocity of
EOF.
This was proven to be true in Capillary Electrophoresis (CE) and a diminution
in mobile phase flow rate has also been observed in Capillary Electrochromatography
(CEC) for all or part of the electrolyte concentration ranges studied, and has been
investigated for both open tubular columns and packed columns. Choudhary and co-
workers [35] and Crego and co-authors [36] both reported a decrease in the velocity of
electroosmotic flow in CEC with increasing buffer concentration. Banholczer and co-
workers [37] and Knox and co-workers [38] reported an initial rise in the velocity of
electroosmotic flow followed by a steady decrease, with increasing buffer
concentration.
The opposite effect has been observed in PEC and PPEC, where an increase in
electroosmotic flow is observed with increasing buffer concentration. This has been
explained by Nurok and co-workers [39] in terms of an overlap of the electrical double
layer as reported by Wan [40, 41]. At low buffer concentrations, the electrical double
layer becomes larger, and an overlap of the electrical double layers on adjacent
particles may occur causing a reduction in the velocity of EOF. The reduction becomes
smaller with increasing buffer concentration leading to an increase in the velocity of
EOF.
20
Electrophoresis
Electrophoresis is the motion of dispersed particles relative to a fluid under the
influence of a uniform electric field. It is due to the presence of a charged interface
between the particle surface and surrounding fluid. The dispersed particles have an
electric surface charge, on which an external electric field exerts an electrostatic force
which is known as, electrophoretic mobility and is defined as:
μEP=q/(6πηr) (19)
where μEP is the electrophoretic mobility, q is the charge of the ionized solute, η is the
buffer viscosity and r is the solute radius. The electrophoretic mobility is similar to the
electroosmotic mobility and has the same units. As can be seen in the above equation
there is a direct relationship between the mobility and the charge-to-size ratio. The
higher this ratio the faster the solute will move.
Resolution
The resolution, Rs, is the most practical and widely used parameter to quantify the
separation between a pair of peaks. It is defined by:
Rs=(MD,b-MD,a)/(0.5(Wb,a+Wb,b)) (20)
where a and b refer to the peak identities, MD is the migration distance, and Wb is the
width at the base of the peak for the respective analytes. The following equation is used
to predict the resolution of two adjacent peaks in column chromatography. It combines
equations that define efficiency, separation factor, and retention factor.
Rs=(N/4)1/2((α-1)/α)(kb/(1+kb)) (21)
21
where N is the number of theoretical plates generated, α is the separation factor, and kb is
the retention factor of the more highly retained analyte. This equation assumes that,
because the peaks are adjacent, N is similar for both analytes.
The above equation requires modification for planar chromatography because the
migration distance depends on the identity of an analyte. This can be adapted by making
the following two changes. First the term √ is changed to ∗ to allow for the fact
that the number of theoretical plates for a given solute will be approximately proportional
to its migration distance relative to the solvent front. N is considered the number of
theoretical plates for a hypothetical compound that migrates with the solvent front.
Secondly, the average of Rf is substituted for k [using equation 4]. Thus, the new
resolution equation becomes:
Rs=((N*Rf)/4)1/2((α-1)/α)(1- Rf) (22)
The equation predicts that resolution approaches to zero as Rf approaches either zero or
unity.
22
CHAPTER THREE - EXPERIMENTAL
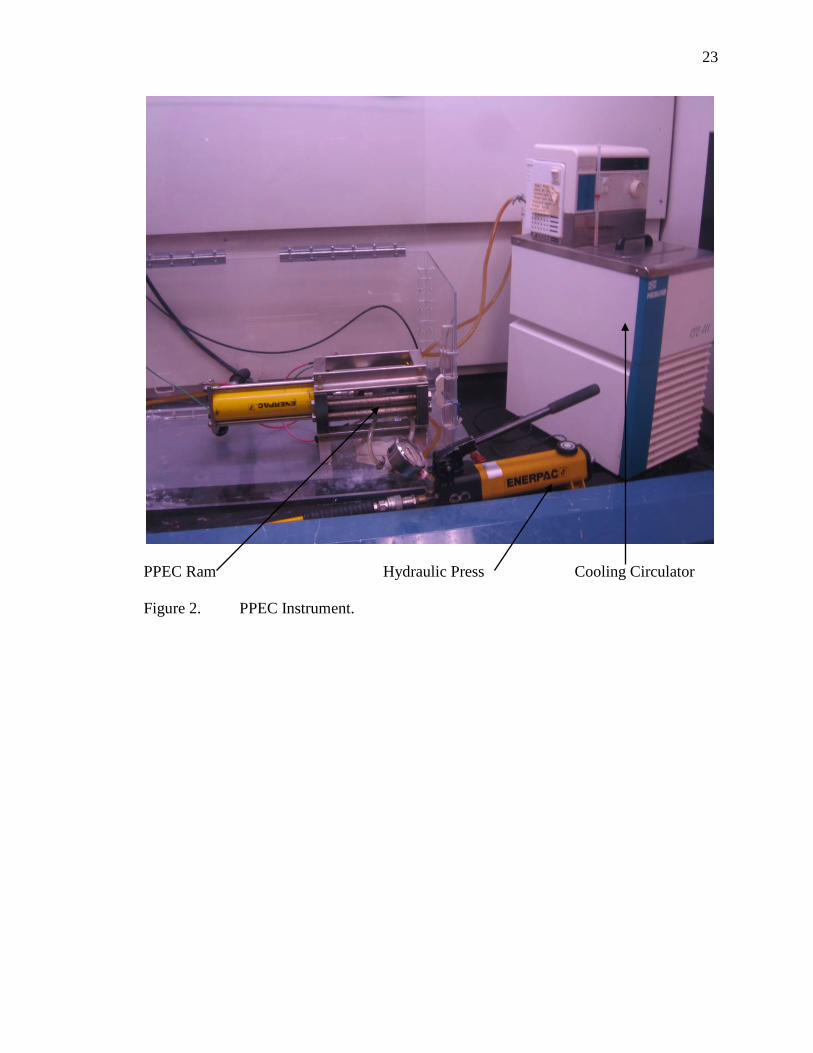
Apparatus
The apparatus [29] was designed in collaboration with, and built by, the Jonathon
Amy Facility for Chemical Instrumentation (JAFCI) at Purdue University under the
direction of Dr. Robert Santini. As you can see in Figure 2 the instrument consists of a
hydraulic cylinder, which was connected with flexible tubing to a hand operated pump,
and attached to a support block. The ram extends from the cylinder and contacts the
movable metal die block via a ball and socket joint that is aligned using witness marks on
both the ball and socket. The die block then presses the plate, which is housed in the
holder, against the stationary die block. Four brackets and support rods are attached to the
end blocks to prevent the instrument from bowing when the metal die blocks are
pressurized. Pressure was applied to an area of 2.5 cm x 10 cm of the TLC layer. Any
change in the alignment of these components could affect the direction in which the
mobile phase flowed. Therefore, every time a part was removed or cleaned the apparatus
needed to be realigned to apply even pressure to ensure that the separation ran straight up
the center of the plate.
The instrument is housed in a Plexiglas box within a hood containing two sets of
safety switches. When the door to the box or the hood is opened, one set of switches
disables the power supply and the second activates a circuit that allows any residual
23
PPEC Ram Hydraulic Press Cooling Circulator
Figure 2. PPEC Instrument.
24
charge to drain to earth. The operator also stands on an insulating mat, and as an
additional precaution removes all metal jewelry.
The electrical potential is applied from an external power source (Glassman,
Series EW). The plate rests in a Delrin solvent reservoir mounted under the stationary die
block. The reservoir is easily removed for cleaning or when the Liquid-On-Top (LOT)
holder is used. The anode is a platinum wire that rests at the bottom of this reservoir and
is connected to the ground lead from the power source. The cathode, which contacts the
sorbent layer, is a 0.25 mm thick rectangular piece of platinum welded to a platinum
wire. An alligator clip is used to connect the cathode to the power source. The placement
of the cathode in the LOT holder is different.
The temperature of a separation is controlled by circulating liquid of the desired
temperature through both metal die blocks. Liquid is circulated from an external
temperature controlled circulator (Neslab, RTE-111) through both die blocks that are
connected in series with flexible tubing. The path of the circulation channels in the die
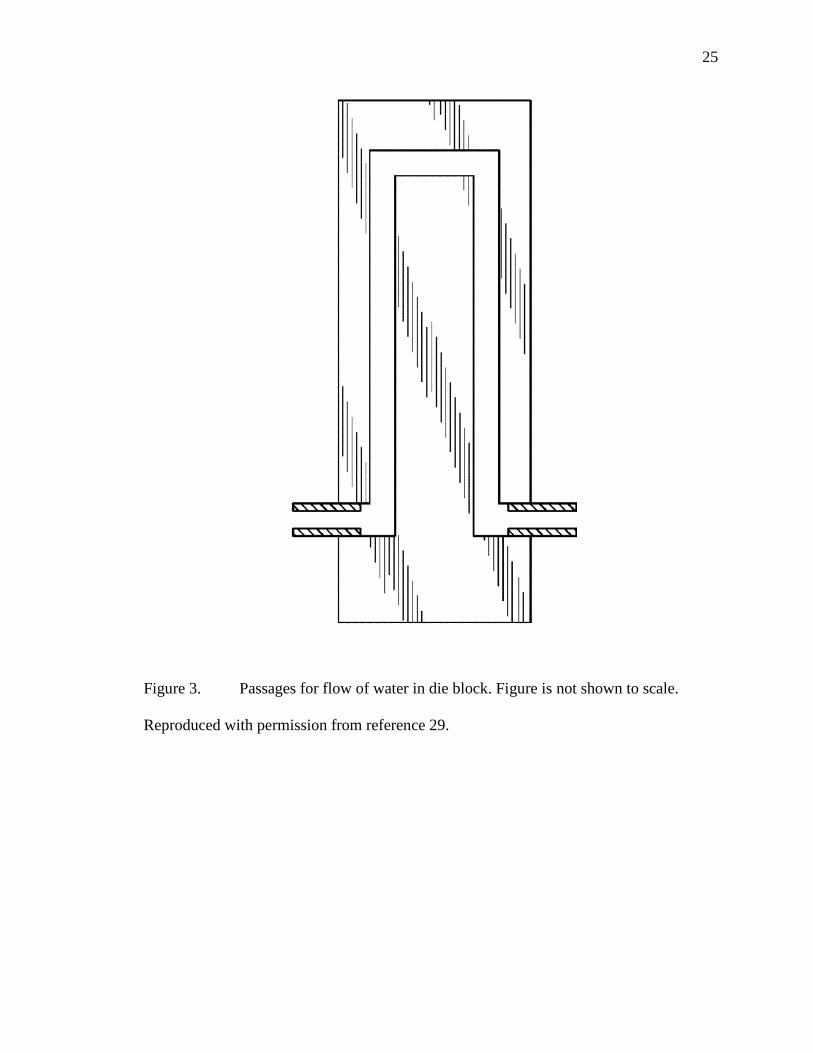
blocks are in an inverter “U”, [see Figure 3]. It is possible that the center section of the
die block may be of a different temperature than that of the area surrounding the
channels, because of the path of circulation. There is, however, no evidence of
temperature non-uniformity, and if a temperature gradient does exist, it is not large
enough to significantly affect the retention behavior of analytes.
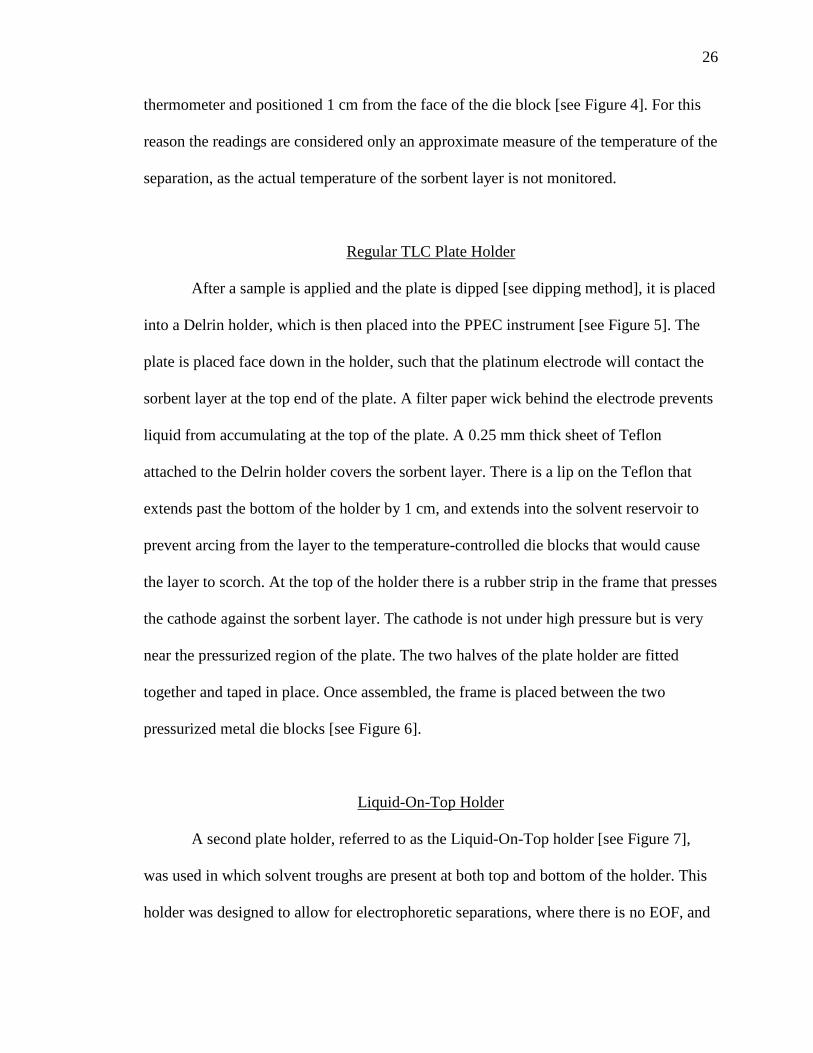
Separation temperature is monitored using a thermocouple positioned in a small
hole in the top of the stationary die block. The thermocouple is connected to a digital
25
Figure 3. Passages for flow of water in die block. Figure is not shown to scale.
Reproduced with permission from reference 29.
26
thermometer and positioned 1 cm from the face of the die block [see Figure 4]. For this
reason the readings are considered only an approximate measure of the temperature of the
separation, as the actual temperature of the sorbent layer is not monitored.
Regular TLC Plate Holder
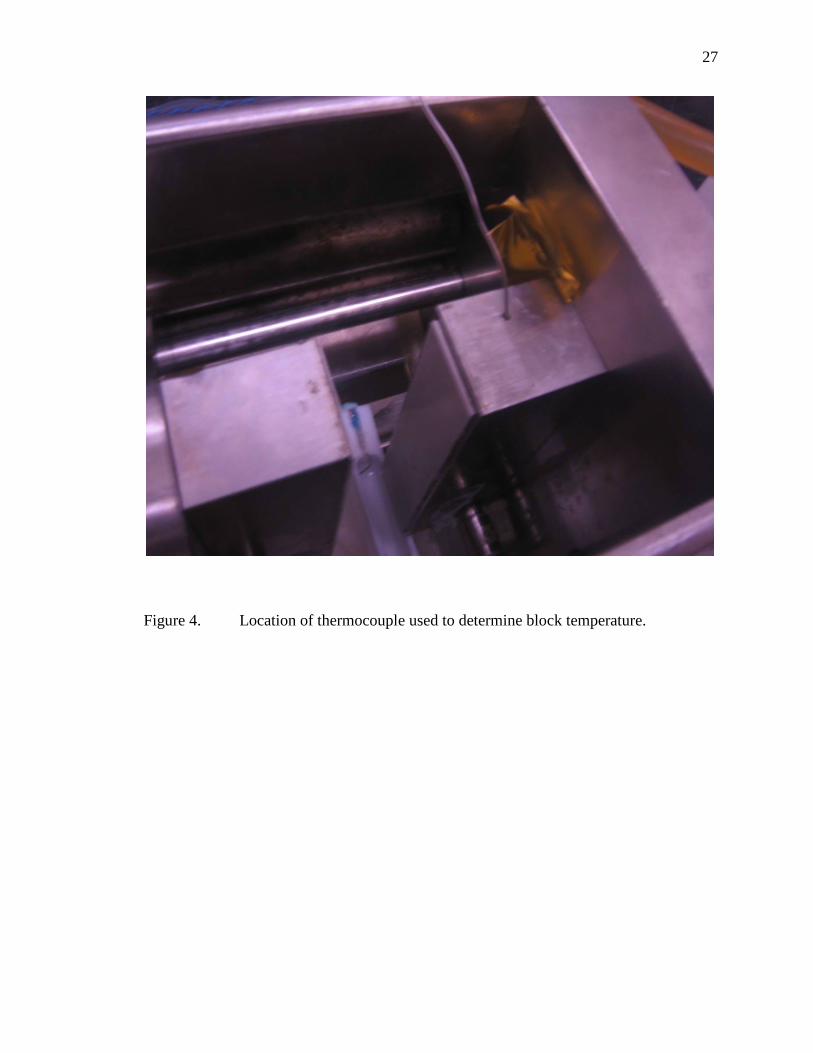
After a sample is applied and the plate is dipped [see dipping method], it is placed
into a Delrin holder, which is then placed into the PPEC instrument [see Figure 5]. The
plate is placed face down in the holder, such that the platinum electrode will contact the
sorbent layer at the top end of the plate. A filter paper wick behind the electrode prevents
liquid from accumulating at the top of the plate. A 0.25 mm thick sheet of Teflon
attached to the Delrin holder covers the sorbent layer. There is a lip on the Teflon that
extends past the bottom of the holder by 1 cm, and extends into the solvent reservoir to
prevent arcing from the layer to the temperature-controlled die blocks that would cause
the layer to scorch. At the top of the holder there is a rubber strip in the frame that presses
the cathode against the sorbent layer. The cathode is not under high pressure but is very
near the pressurized region of the plate. The two halves of the plate holder are fitted
together and taped in place. Once assembled, the frame is placed between the two
pressurized metal die blocks [see Figure 6].
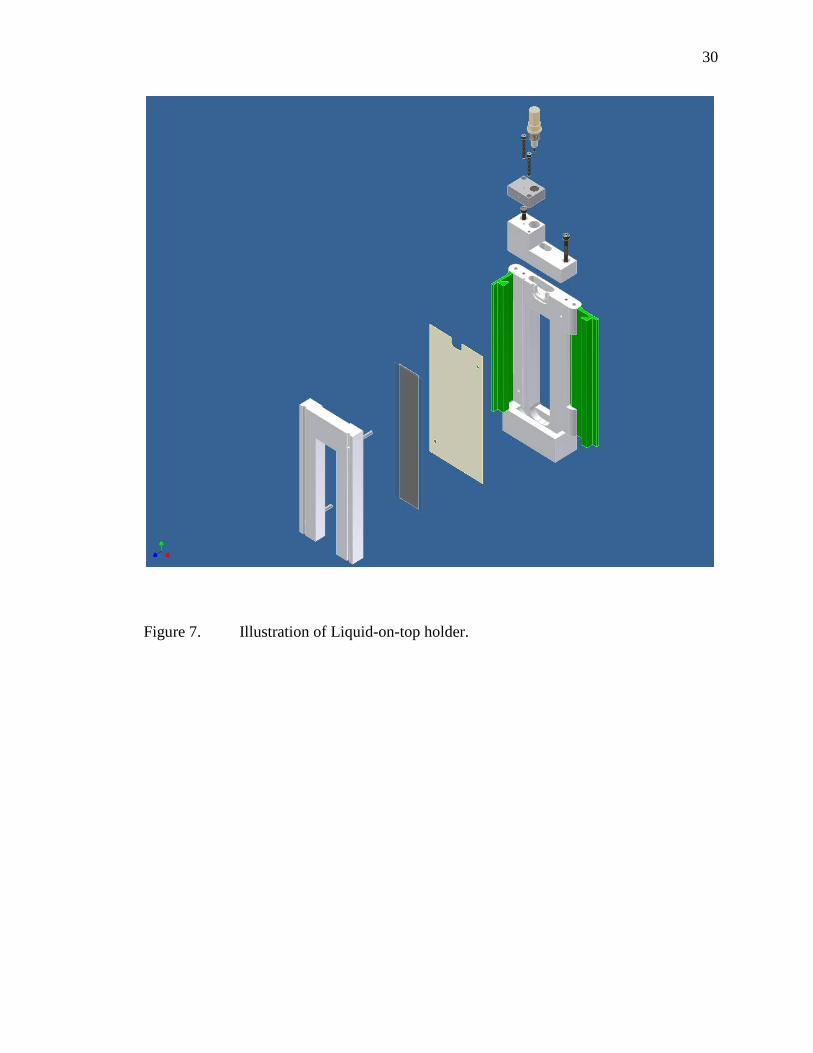
Liquid-On-Top Holder
A second plate holder, referred to as the Liquid-On-Top holder [see Figure 7],
was used in which solvent troughs are present at both top and bottom of the holder. This
holder was designed to allow for electrophoretic separations, where there is no EOF, and
27
Figure 4. Location of thermocouple used to determine block temperature.
28
Figure 5. Illustration of PPEC plate holder. Reproduced with permission from
reference 39.
29
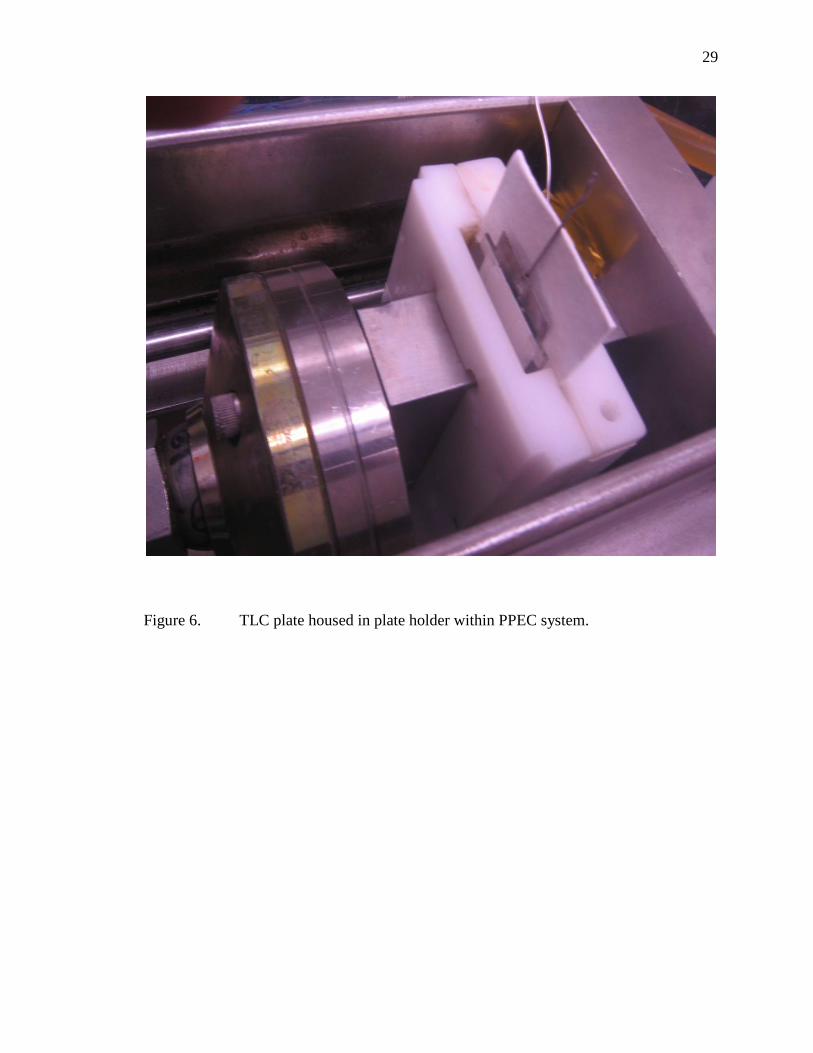
Figure 6. TLC plate housed in plate holder within PPEC system.
30
Figure 7. Illustration of Liquid-on-top holder.
31
where the sorbent layer would dry due to Joule heating. The sorbent layer is protected by
a 0.25 mm thick sheet of Teflon that prevents any contact between the sorbent layer and
the metal die blocks. There is a lip on the Teflon that extends past the end of the holder
by 1 cm, and extends into the solvent reservoir on the bottom of the plate. The frame is
held together by locking cuffs made of Delrin. After the sample is applied and the plate is
dipped into the mobile phase, it is placed into a Delrin frame, which is then placed into
the PPEC instrument. The plate is placed face down, such that the sorbent layer at the top
end of the plate presses against an O-ring around the opening to the top trough. Once
assembled, the frame is placed between the two pressurized metal die blocks. Both
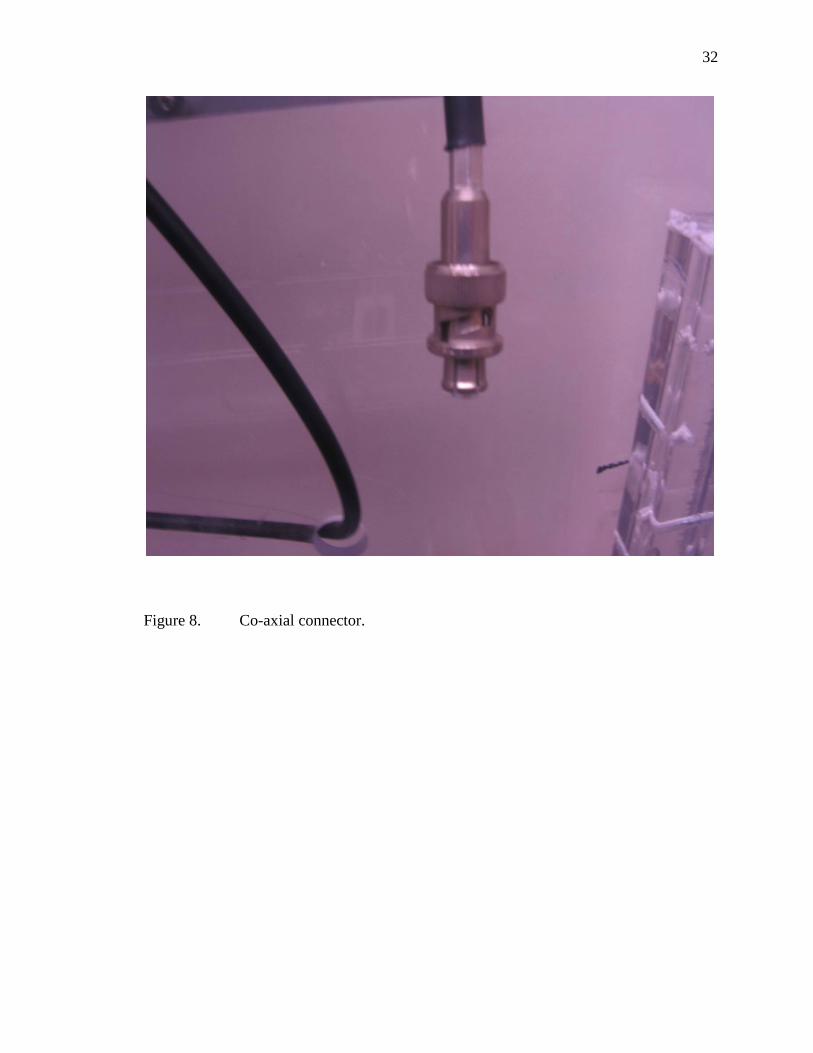
reservoirs are filled with mobile phase solution. Both of the reservoirs contain a platinum
wire that rests at the bottom of the reservoir and that is connected to the power source
through the use of a co-axial connector [see Figure 8].
Types of Sorbent Layers for PPEC
Two different classes of sorbent layers were investigated in this thesis. The first
are silica based where the silica particles are held in place with a binder and the resultant
layer is supported on glass, aluminum, or plastic, but in this thesis only glass supports
were used. The separations not performed on monolith plates were performed on bonded
phase layers, in which the silica particles have been derivatized with hydrophobic groups
most commonly C18 chains. The second are monolith plates and are discussed below.
The following three types of bonded phase plates were used: (a) Merck
LiChrospher RP-18 WF254s (Catalog No. 1.05646.0001), (b) Merck RP-18 F254s
(Catalog No. 15389.0001), and (c) Merck Superspher RP-18 WF254s. These plates are
32
Figure 8. Co-axial connector.
33
referred to as LiChrospher, Regular and Superspher respectively. LiChrospher and
regular plates were purchased from VWR International. The Superspher plates are not
commercially available and were received as a gift from Merck KgaA. The main
difference between the regular and the LiChrospher/Superspher plates is that the sorbent
layer of the latter consists of very small spherical particles and the carbon load is lower.
Monolithic materials are used in chromatography as separation media and
supports, and were developed to overcome the disadvantages of particulate stationary
phases [42]. Columns packed with particulate phases typically have large void volumes
and often more than 30 % of the column volume is interstitial voids [42]. Liquid flows
readily through the interstitial voids between particles, but remains stagnant inside pores
in the particles. The relatively slow diffusion of analyte in and out of these pores causes
band broadening due to the resistance to mass transfer. This behavior becomes
problematic when the mass transfer properties of a stationary phase limit the overall
separation rate. The obvious solution to this problem is to reduce the particle size.
However, this result in reduced permeability and increased backpressure with techniques
in which mobile phase is delivered with a pump.
Monoliths, which have been described as a continuous phase of porous material
[42], allow the magnitude of the flow through channels and the size of the pores to be
optimized independently. Therefore, monolithic phases can be made with high
permeability, and for a given backpressure, separations on monolithic phases have been
shown to have higher efficiency [43]. Another important feature of monoliths is their
high porosity, which can be as high as 80 % (only about 20 % of the volume is occupied
by stationary phase). The resistance to flow is much lower and the diffusion into and out
34
of the pores is much faster for these phases than for particulate phases. A simplified way
to view this is that analyte is delivered to pores by flow and not by diffusion [42]. This
leads to faster and more efficient separations when using monolithic stationary phases.
Monoliths have gained much attention in recent years due to their simplicity of
preparation, and a large number of stationary phase chemistries have been developed.
Some concern has been expressed about the column-to-column reproducibility, and it is a
common perception that monolith columns are prepared one at a time. Standard
chromatography columns are packed with particles that are prepared in large batches. The
procedure for preparing monolith columns is not dissimilar since the polymerization
mixture can be prepared in large batches and used to fill several columns. It has been
demonstrated that column-to-column reproducibility is no worse for monoliths than for
packed columns [44].
In this thesis monolith plates were used for peptide and protein separations. All
monolith plates were prepared at Lawrence Berkeley National Laboratory by Dr. Svec’s
group.
Preparation of Monolith Plates for PPEC
The following section is an overview of how these monolith plates were prepared
in Dr. Svec’s Laboratory. The first step was to construct a mold by placing Teflon
spacers of the desired layer thickness between two sheets of glass. The glass that is to
serve as the support for the stationary phase is activated by immersion in a solution of 3-
(trimethoxysilyl) propyl methacrylate adjusted to pH 5 using acetic acid. This allows the
monolith to be covalently attached to the glass backing.
35
The uncharged monoliths were prepared from a polymerization mixture
containing butyl methacrylate, ethylene dimethacrylate, 1-decanol, cyclohexanol, and
2,2-dimethoxy-2-phenylacetophenone. In this mixture 1-decanol and cyclohexanol are
the porogens, and 2, 2-dimethoxy-2-phenylacetophenone is the free radical photoinitiator.
The mixture was de-aerated by purging with nitrogen for 5 minutes, inserted into the
plate mold using a syringe, and then exposed to UV radiation for 15 minutes. This creates
the neutral monolith poly (butyl methacrylate-co-ethylene dimethacrylate) referred to as
BuMA-EDMA.
Charged monoliths were prepared by grafting either an anionic functionality 2-
acrylamido-2-methyl-1-propanesulfonic acid (AMPS) or a cationic functionality [2-
(Methacryloyloxy) ethyl] trimethylammonium chloride (META) onto the neutral layer
after polymerization. This involves the preparation of a photo-grafting solution which
contains the charged monomer along with a photo-initiator that promotes the grafting
reaction. BuMA-EDMA plates were soaked in the photo-grafting solution to ensure that
all the pores were filled. The plate was then placed under a UV lamp and covered with a
quartz plate to prevent oxygen diffusion into the monolith film. Oxygen scavenges free
radicals, which would inhibit the grafting reaction. Finally, the plates were soaked in de-
ionized water overnight to remove most of the unreacted monomer and solvent.
Preparation of Plates for PPEC
TLC plates were cut into 3.3 cm x 12 cm sections to fit into the TLC plate holder.
A 5 mm section of silica was scraped from each of the long edges and these exposed
glass surfaces were then coated with a sealant. The monolith plates used in the Liquid-
36
On-Top holder are 3.3 cm x 13 cm and only need to be sealed, since they come ready to
be run, and are prepared with 5 mm exposed glass on the long edges ready for sealing.
Plate Conditioning and Storage
Bonded C18 plates must be baked in an oven prior to use in order to activate the
binder that holds the particles together. Unless otherwise indicated all reverse phase
plates were conditioned at 160 ºC for 20 minutes in a microprocessor-controlled oven
(VWR, 1330 FM). The plates were then immediately removed from the oven, placed in a
desiccator over silica gel, and used within 24 hours.
Sealants
A silicone sealant is used to seal the edges of all plates run by PPEC. This sealant
is formed by combining one part Flowable Silicon Sealant (Dow-Corning, 734 flowable
silicon sealant) with 2 parts toluene. After the sealant is completely mixed, it is applied
with a paintbrush to the edges of the plates overlapping the sorbent layer by
approximately 1 mm. The sealant must be allowed to cure for at least 30 minutes, at
which point it is dry to the touch, and can be conditioned in an oven, to activate both the
binding agent and the sorbent layer. This activation is evident by increased run speed and
layer stability. The plates are then stored in the desiccator over activated silica.
Mobile Phase Preparation
Solvent mixtures are reported as volume ratios. Buffer solutions of known
molarity and pH were prepared. The concentration of the solution was then adjusted such
37
that, when mixed with organic modifiers and additional water, the mobile phase was at
the desired molarity and pH. The Water was filtered through a Milli-Q purification
system. The reported pH of the mobile phase is a nominal value and refers to the value of
the buffer solution before mixing with acetonitrile, and for this reason is referred to as
being nominal.
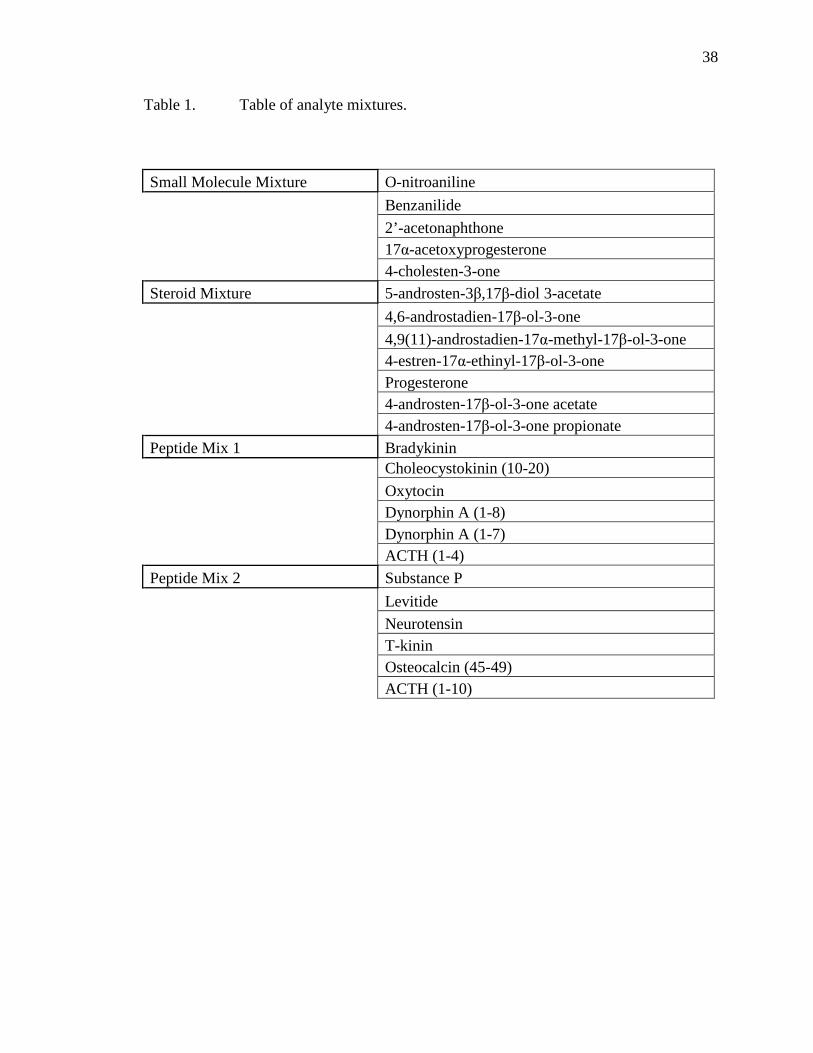
Sample Preparation
Four standard mixtures were used in this research, a five-component small
molecule mixture, a seven-component steroid mixture, and two six-component oligo-
peptide mixtures. The small molecule mixture and the steroid mixture were prepared in
methanol, while the peptide mixtures were prepared in water. The mixtures are listed in
Table 1. The peptide mixtures were combined with equal parts fluorescamine solution
(3mg/mL in acetone) for visualization, and left to react for 5 minutes before spotting. The
fluorescamine solution was stored at 4 ºC before use. The plates were run immediately
after the spotting solution had dried.
Spotting Procedure
Sample spots were applied 4 cm from the bottom of the plate, except on
monoliths where they were applied 6 cm from the bottom of the plate. The spotting
device was a 0.5 μL Hamilton syringe (Reno, NV). The standard spotting volume for the
five-component mixture was 10 nL. Samples containing analytes of lower solubility were
less concentrated (such as the steroid and peptide mixtures); these samples require a
larger spotting volume (0.3-.5 μL), and were applied in volume increments (0.1 μL) to
38
Table 1. Table of analyte mixtures.
Small Molecule Mixture O-nitroaniline Benzanilide 2’-acetonaphthone 17α-acetoxyprogesterone 4-cholesten-3-one Steroid Mixture 5-androsten-3β,17β-diol 3-acetate 4,6-androstadien-17β-ol-3-one 4,9(11)-androstadien-17α-methyl-17β-ol-3-one 4-estren-17α-ethinyl-17β-ol-3-one Progesterone 4-androsten-17β-ol-3-one acetate 4-androsten-17β-ol-3-one propionate Peptide Mix 1 Bradykinin Choleocystokinin (10-20) Oxytocin Dynorphin A (1-8) Dynorphin A (1-7) ACTH (1-4) Peptide Mix 2 Substance P Levitide Neurotensin T-kinin Osteocalcin (45-49) ACTH (1-10)
39
reduce the size of the final sample spot. The sample spot was allowed to dry between
increments.
When performing PPEC studies that evaluate the effect of a variable on
efficiency, it is important that the spot volume be very reproducible. To ensure that the
same amount of sample is applied to each of the plates used in the study, a procedure was
adopted in which the spot is applied to the TLC plate and then scanned. If the initial spot
has a width at half height outside the range of 0.40-0.58 mm, the plate was not used. This
procedure was used for all studies in which the efficiency of a separation is measured.
Dipping Method
The analyte is spotted on a dry plate, and once the spot has dried, the plate is
dipped for five seconds to within 2 mm of the analyte spot, quickly removed and blotted,
rotated 180º, and dipped in the other direction for five seconds to within 2 mm of the
analyte spot, after which the back of the plate is dried by wiping it with a paper towel. It
is assumed that mobile phase travels by capillary action up to the analyte spot before
PPEC is begun. This is considered the standard procedure since good spot shape is
obtained and no analyte is lost while dipping.
Detection
After PPEC, the plates are allowed to dry and are then viewed in a light box at
254 nm, and later scanned at the same wavelength with a Camag TLC Scanner II
(Wilmington, NC). A Bio-Rad molecular imager (Hercules, CA) was used for visualizing
the monolith plates at 365 nm.
40
Variables that Effect Separation Quality in PPEC
The quality of a PPEC separation is affected by many variables including the
separation temperature, applied pressure, baking temperature of the TLC plates, and
applied voltage. The investigation of how those variables and several others affect the
migration distance and efficiency of analytes is the subject of this chapter.
Previously Investigated Variables
Novotny [30] examined many of the variables affecting PPEC separations. She
demonstrated that a longer separation time and/or a higher applied voltage results in a
longer migration distance, and this longer migration distance in turn results in a higher
efficiency, as shown by an increase in the number of theoretical plates. Increasing the
temperature and/or time of conditioning in the oven has also been shown to increase
migration distance, though under conditions of very high temperature or prolonged
conditioning the sorbent layer discolors. Two other ways to increase the migration
distance are to increase the percent of organic modifier present and to increase the
separation temperature. Novotny [30] demonstrated that increasing the separation
temperature up to 26 ºC for a specific set of compounds increases the efficiency of the
separation under the conditions used, but beyond that point the efficiency begins to
diminish. Two other variables that have been examined are applied pressure and buffer
concentration. Increasing the applied pressure decreases the migration distance but
improves the efficiency of the separation up to 59 atm, after which efficiency begins to
diminish. It was found that increasing the buffer concentration increased the migration
distance and efficiency but also resulted in increased Joule heating.
41
Variables Investigated in this Thesis
The variables investigated are the effects of dipping time, how close the solvent is
dipped to the initial spot, and the sealant thickness. The following is the investigation of
how those variables affect the migration distance travelled by the analytes.
Effects of Dipping Time
A set of experiments were performed to determine the relationship between
migration distance and dipping time. PPEC separations on both LiChrospher and Regular
plates were run at 9kV and 41 atm, for 3 and 5 minutes, respectively, with dipping times
varied from 1 to 12 seconds for each end of the plate. The dipping solution is the same as
the mobile phase. The plates were run at a controlled temperature of 23 ºC with a 5 mM
acetate buffer at nominal pH 4.7 in a 65 % aqueous acetonitrile mobile phase. For each
plate the dipping time was kept the same for opposite ends, with the time measured from
when the plate enters the dipping solution until it is removed. Migration distance varies
with dipping time and a minimum migration distance occurs at the 5 second dipping time.
The best reproducibility was found at this dipping time, even though this results in a
lower migration distance.
Effects of Dipping Depth
The following experiments were performed in order to determine if the closest
distance between the surface of the dipping solution and the analyte spot, could affect the
migration distance. PPEC separations on LiChrospher plates were run at 9kV and 41 atm,
for 2 minutes with dipping distances of 1 through 4 mm from the analyte spot. For each
42
plate the distance was kept the same for opposite ends, and dipped for five seconds for
each end. It was found that there was an increase in migration distance and an
improvement in efficiency when the distance was increased to 2 mm, but greater increase
in distance showed no further improvement. Once the distance was enlarged to 4 mm or
larger capillary action could not completely wet the dry surface, and the plates no longer
ran. The plates were run at a controlled temperature of 23 ºC with a 5 mM acetate buffer
at nominal pH 4.7 in a 55 % aqueous acetonitrile mobile phase.
Effects of Sealant Thickness and Composition
A marked difference in spot shape and migration distance was observed in
nominally identical runs on several occasions, and it was posited that if the sealant on the
edges of the plates were too thick, it might cause a low pressure channel between the two
raised sealant strips. If a low pressure channel were to form, it would allow a film of
liquid to be driven to the surface causing spot smearing, and irregular migration. A set of
experiments was performed to determine the effects of different sealant thicknesses on
migration distance and spot shape. PPEC separations of the standard five-component
mixture were performed on LiChrospher plates at 9kV with sealant composition ranging
from a ratio of 1:2, silicone sealant to toluene, to a ratio of 1:10. The plates were run at a
controlled temperature of 20 ºC in a 55 % aqueous acetonitrile solution with 5mM acetate
buffer at nominal pH 4.7. Two different pressures and times were tested, to determine if
the pressure exerted on the sealant would affect the sealants stability. Under both
conditions as the total amount of sealant in the mixture decreased there was a decrease in
the migration distance and an improvement in the spot shape. This observed decrease in
43
migration distance may be due to mobile phase leakage through the sealant layer under
the pressures and forces exerted during a PPEC run. The ratio 1:4 (sealant to toluene) was
found to offer the best compromise between spot shape and reduction in migration
distance, and was used for all future work.
44
CHAPTER FOUR - SHORT STUDIES
PPEC Separation Across a Temperature Gradient
In PPEC, migration of analytes through a sorbent layer is affected by the
temperature of the layer. As the temperature increases the migration velocity increases,
but the spot shape can degrade. The inverse can be true at lower temperatures. If a
temperature gradient would be imposed across the sorbent surface, in which the higher
temperature was at the bottom of a vertical plate, improved resolution and peak
sharpening should occur. This would be due to a differential in migration velocity within
the analyte spot. The negative gradient should cause the tail end of the analyte spot to
migrate at a higher velocity than the leading edge, preventing tailing. The following
section of this thesis describes an attempt to confirm this theory.
Separations of the five component standard were attempted by PPEC across a
temperature gradient, such that the areas of the plate outside the pressurized area are also
outside the temperature gradient. For obvious reasons, any significant amount of Joule
heating could alter the gradient within the sorbent layer in a manner that is difficult to
observe. In order to minimize the amount of Joule heating, the plates were run in a
mobile phase containing a very low molarity of buffer and at low voltages. To create the
temperature gradient a special pair of die blocks were constructed at the JAFCI at Purdue
45
University under the direction of Dr. Robert Santini. The gradient blocks are not
described in order to protect future patentability.
Runs were performed under standard conditions at 9 kV, 20 ºC and 41 atm using a
mobile phase of 55 % aqueous acetonitrile containing 5 mM acetate buffer at nominal pH
4.7. All plates were run in the normal holder after being conditioned in an oven at 160 ºC
for 20 minutes. These runs were then compared to runs performed under the same
conditions but with the lower buffer concentration and voltage. This change in buffer
concentration and voltage was used to determine the magnitude of the effects of Joule
heating on the separations. These runs gave similar results except for the longer
separation times required to compensate for mild conditions. In order to obtain baseline
information, runs were performed in the normal holder at both the highest (50 ºC) and
lowest (-2 ºC) temperatures that would be used in a gradient. As would be expected, the
higher temperature yields a substantially greater migration distance and a larger spot
diameter. Based on these results it was determined that a 15 minute separation on
LiChrospher plates would yield the greatest migration of solute across the gradient
without the possibility of the analyte spots washing off of the plate.
The plates were then run across a gradient of 50 ºC to -2 ºC using 55 % aqueous
acetonitrile containing 1 mM phosphate buffer at nominal pH 4.7 at 41 atm and 2 kV.
The spot shape was large but round with reduced migration distance when compared to
that found with 50 ºC runs without any gradient. This result was surprising since this
gradient should have caused spot sharpening (i.e. a diminution of distance between the
leading and trailing edge of a spot).
46
The gradient was checked by measuring the surface temperature of the die-blocks
with a thermocouple every centimeter after allowing the temperature gradient to stabilize.
A plot of the temperature vs. the position on the die block is shown in Figure 9. In order
to check if the location of the initial spot affects the final spot shape, four plates were run
with the mixture spotted at 4.0 cm, 5.0 cm, 6.0 cm and 7.0 cm respectively, from the
bottom. The final spot shape was the same for all four plates.
During the previous experiment it was noticed that though the spots were not
sharpening. They did appear to be closer together than in an isothermal run. To test this,
pairs of spots at 1.0 cm intervals were spotted vertically and run. The resulting spot shape
was very poor, but the spacing between the spots decreased by between 1.0 - 3.0 mm.
The reason that there was no sharpening of spots is probably due to Joule heating
preventing thermal equilibration between the sorbent layer and the gradient blocks.
Further work should be performed on the possible uses of thermal gradients in PPEC to
explain this lack of sharpening. Once determined, the cause could be rectified, opening a
new area of study.
Separation of Steroids
Steroids have a controversial place in society. When used correctly and under medical
supervision, steroids are beneficial medications. Steroids can be used to help manage
symptoms of cancer and AIDS, and to treat other conditions including osteoporosis,
delayed puberty and low libido [45]. But used incorrectly steroids offer an unfair and
illegal boost to athletes. To combat and control these illegal usages, more methods of
detection and identification must be developed. PPEC would be an attractive addition to
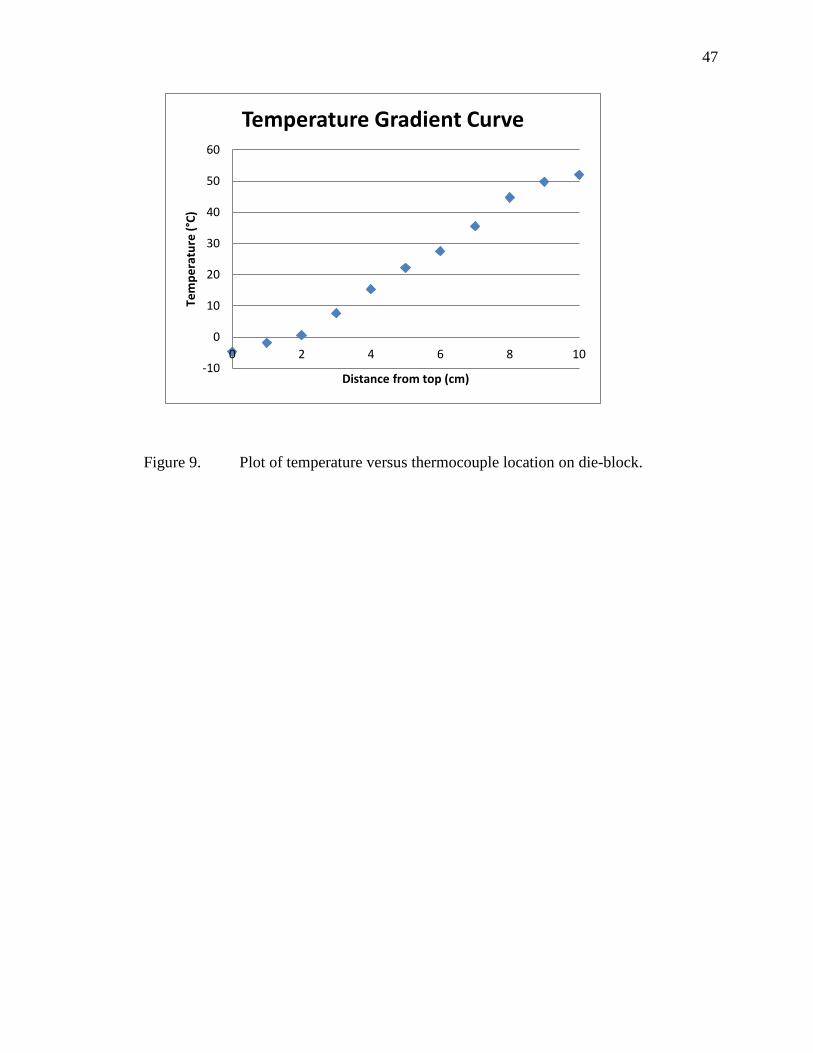
47
Figure 9. Plot of temperature versus thermocouple location on die-block.
-10
0
10
20
30
40
50
60
0 2 4 6 8 10
Tem
pera
ture
(°C)
Distance from top (cm)
Temperature Gradient Curve
48
the current detection methods, as it can separate multiple samples simultaneously. The
following section of this thesis describes a short investigation of separating steroids by
PPEC.
The initial step was to determine the Rf values of the steroids available in our
laboratory and to investigate the feasibility of detection by fluorescence shadowing [see
table 2]. The steroids examined were derivatives of estrogen, androgen, or testosterone.
The steroids were initially spotted individually 1 cm from the bottom of a 10 x 20 cm RP-
18 F254s plate. The mobile phase was composed of 55 % acetonitrile with a 5 mM
acetate buffer at nominal pH 4.7. The twin trough chamber was pre-equilibrated for 30
min. TLC was then performed for 30 minutes, during which the solvent front migrated
9.5 cm.
Those compounds that were readily visible were then run by PPEC to determine
their relative migration distances. It was found that some of the steroids migrated
differently under PPEC conditions than under those used for TLC. The purpose of
performing TLC first was as a preliminary screen to remove those compounds that were
not readily visible and to perform this screen both quickly and simultaneously, which
TLC permitted due to the larger available plate size. The runs were performed under the
following conditions: 9 kV, 41 atm, 8 minutes, 55 % acetonitrile, and 5 mM acetate
buffer at nominal pH 4.7. The analytes were spotted 4 cm from the bottom on regular
plates that had been sealed and then conditioned for 20 minutes at 160 ºC. This data was
used to determine which steroids would provide a separation mixture that would yield
complete resolution. The final mixture consisted of the following steroids listed in order
of decreasing Rf: 5-androsten-3β-ol-16,17-dione; 4,6-androstadien-17β-ol-3-one; 4,9(11)-
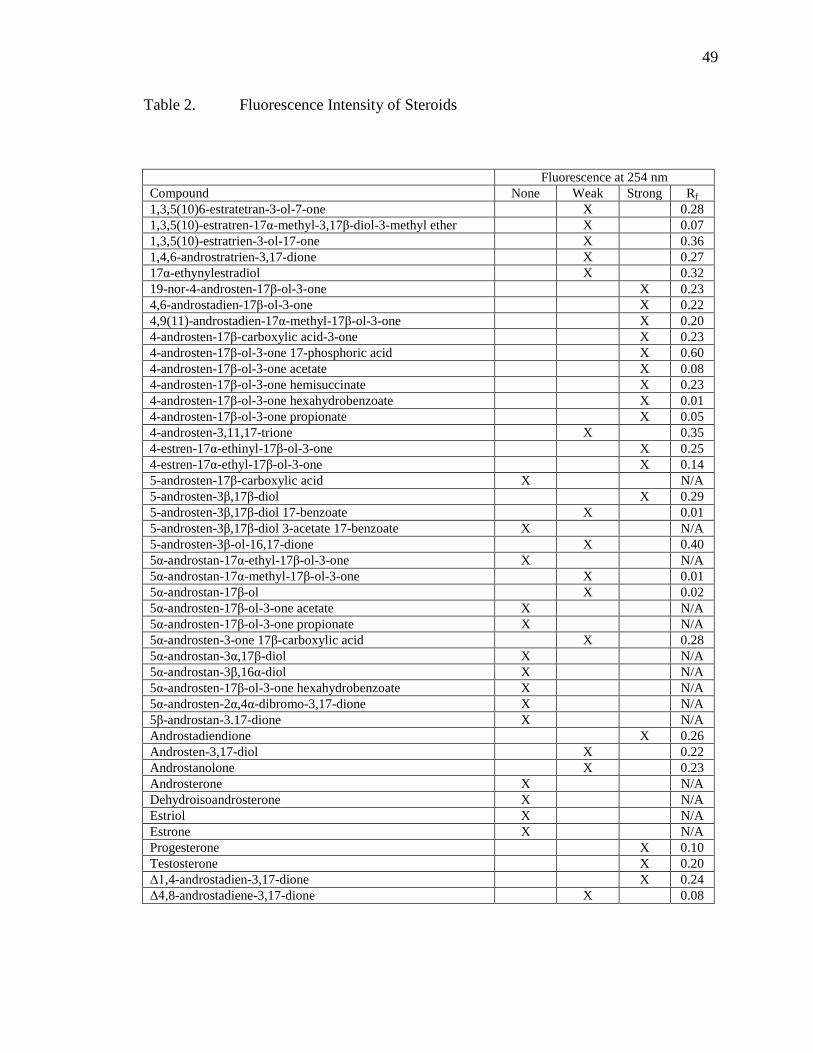
49
Table 2. Fluorescence Intensity of Steroids
Fluorescence at 254 nm Compound None Weak Strong Rf 1,3,5(10)6-estratetran-3-ol-7-one X 0.28 1,3,5(10)-estratren-17α-methyl-3,17β-diol-3-methyl ether X 0.07 1,3,5(10)-estratrien-3-ol-17-one X 0.36 1,4,6-androstratrien-3,17-dione X 0.27 17α-ethynylestradiol X 0.32 19-nor-4-androsten-17β-ol-3-one X 0.23 4,6-androstadien-17β-ol-3-one X 0.22 4,9(11)-androstadien-17α-methyl-17β-ol-3-one X 0.20 4-androsten-17β-carboxylic acid-3-one X 0.23 4-androsten-17β-ol-3-one 17-phosphoric acid X 0.60 4-androsten-17β-ol-3-one acetate X 0.08 4-androsten-17β-ol-3-one hemisuccinate X 0.23 4-androsten-17β-ol-3-one hexahydrobenzoate X 0.01 4-androsten-17β-ol-3-one propionate X 0.05 4-androsten-3,11,17-trione X 0.35 4-estren-17α-ethinyl-17β-ol-3-one X 0.25 4-estren-17α-ethyl-17β-ol-3-one X 0.14 5-androsten-17β-carboxylic acid X N/A 5-androsten-3β,17β-diol X 0.29 5-androsten-3β,17β-diol 17-benzoate X 0.01 5-androsten-3β,17β-diol 3-acetate 17-benzoate X N/A 5-androsten-3β-ol-16,17-dione X 0.40 5α-androstan-17α-ethyl-17β-ol-3-one X N/A 5α-androstan-17α-methyl-17β-ol-3-one X 0.01 5α-androstan-17β-ol X 0.02 5α-androsten-17β-ol-3-one acetate X N/A 5α-androsten-17β-ol-3-one propionate X N/A 5α-androsten-3-one 17β-carboxylic acid X 0.28 5α-androstan-3α,17β-diol X N/A 5α-androstan-3β,16α-diol X N/A 5α-androsten-17β-ol-3-one hexahydrobenzoate X N/A 5α-androsten-2α,4α-dibromo-3,17-dione X N/A 5β-androstan-3.17-dione X N/A Androstadiendione X 0.26 Androsten-3,17-diol X 0.22 Androstanolone X 0.23 Androsterone X N/A Dehydroisoandrosterone X N/A Estriol X N/A Estrone X N/A Progesterone X 0.10 Testosterone X 0.20 Δ1,4-androstadien-3,17-dione X 0.24 Δ4,8-androstadiene-3,17-dione X 0.08
50
androstadien-17α-methyl-17β-ol-3-one; 4-estren-17α-ethyl-17β-ol-3-one; progesterone;
4-androsten-17β-ol-3-one acetate; and 4-androsten-17β-ol-3-one propionate.
The experimental conditions used for identifying the final mixture yielded
moderately good separations, which were improved by optimizing the acetonitrile
concentration and applied voltage. The analytes were spotted 4 cm from the bottom on
LiChrospher RP-18 WF254s plates that had been sealed and then conditioned for 20
minutes at 160 ºC. The optimal conditions for separation were at 6 kV and 41 atm for 8
minutes with a mobile phase consisting of 55 % aqueous acetonitrile containing a 5mM
acetate buffer at nominal pH 4.7.
Once the optimal conditions were found, the separation of steroids was performed
on Superspher, LiChrospher and regular TLC plates (see Figure 10). The highest quality
separations were on the Superspher plates. This study clearly shows the advantage of
working with the Superspher plates that have a sorbent layer consisting of small
(nominally 4 μm) particles, compared to the LiChrospher plates (spherical particles 4-7
μm) and the regular plates (irregular particles, 5-20 μm). The Superspher plates yield a
faster separation and a substantially higher number of theoretical plates. As an example,
the number of theoretical plates for the spot with the third highest Rf is 236,000 plates
per meter for the Superspher, 75,000 for the LiChrospher, and 45,000 for the regular. The
separations on the Superspher plates were taken to Prosolia for scanning by DESI-MS
(Desorption Electrospray Ionization - Mass Spectroscopy). The steroids were not
detected in the scans, possibly due to being poorly ionized. This study demonstrates that
PPEC is a useful technique for separating steroids, and that there are substantial
advantages to working with highly efficient sorbent layers.
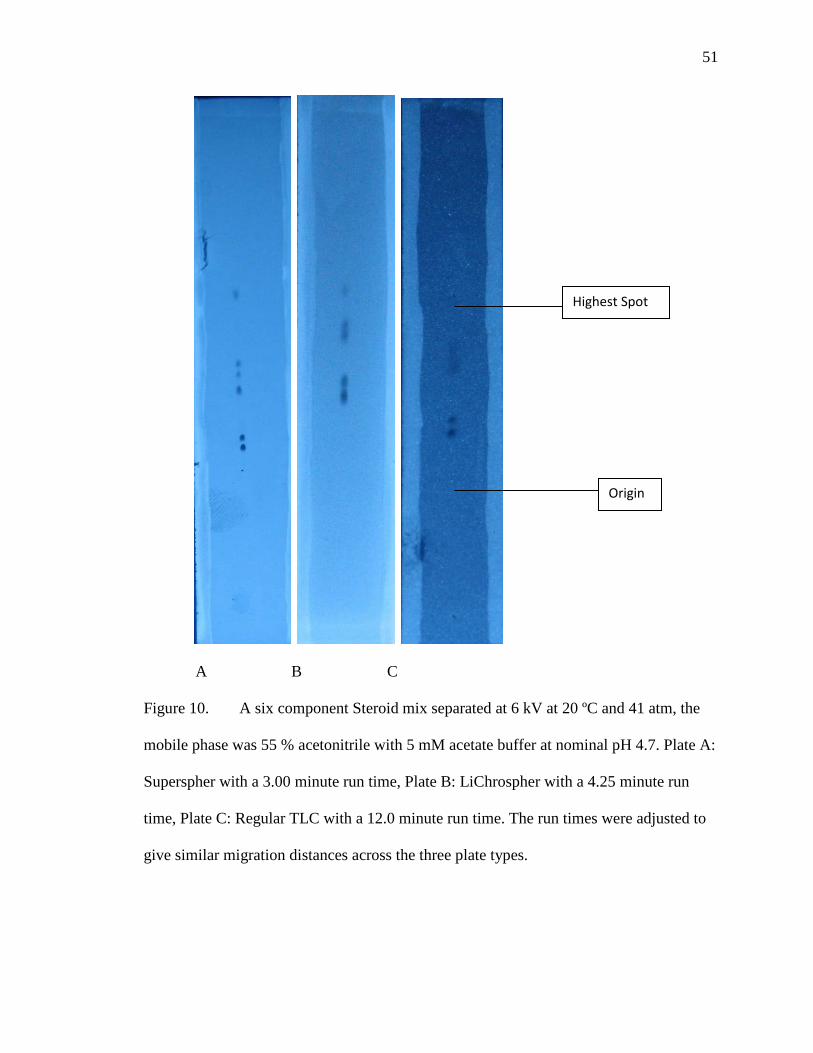
51
A B C
Figure 10. A six component Steroid mix separated at 6 kV at 20 ºC and 41 atm, the
mobile phase was 55 % acetonitrile with 5 mM acetate buffer at nominal pH 4.7. Plate A:
Superspher with a 3.00 minute run time, Plate B: LiChrospher with a 4.25 minute run
time, Plate C: Regular TLC with a 12.0 minute run time. The run times were adjusted to
give similar migration distances across the three plate types.
Highest Spot
Origin
52
CHAPTER FIVE - SEPARATION OF PEPTIDES
Separation of Peptides and Proteins by PPEC
With the expansion of the field of proteomics, peptides have become a topic of
great interest. These small bio-molecules are the building blocks of proteins, and as such
can be used to identify and quantify the parent protein once it has been digested and the
constituent peptides identified and quantified. The classic methods of separating peptides
are by HPLC or gel electrophoresis [46-48]. These methods can be time consuming, and
there is always a search for alternative approaches of separating these compounds.
Successful separations of peptides and proteins have also been performed using
High Performance Thin Layer Chromatography (HPTLC) [49]. This method of
chromatography, when used in conjunction with DESI-MS has been used to identify
peptides in a tryptic protein digest [50]. These reports suggest that separations of peptides
and proteins using PPEC would also be successful.
Proteins and peptides provide a special challenge for electro-chromatographic
separation due to their charged nature. These macromolecules exhibit electrophoretic
mobility in the presence of an electric field and can migrate with or against EOF
depending on their net charge, the pH of the mobile phase, and the velocity of EOF. The
biggest problem, however, is the possible electrostatic interactions of the
peptides/proteins with the charged functionalities of the stationary phase. These
53
electrostatic interactions are very likely to occur due to the low buffer concentrations
typically used in PPEC. Stationary phase charges cannot be eliminated, as these are
required to generate EOF.
To minimize these interactions the pH of the mobile phase should be adjusted so
that analyte molecules have the same net charge as those on the stationary phase.
Therefore, it is desirable to use a mobile phase of low pH when working with a positively
charged stationary phase and vice versa. This approach seems logical, and separations of
peptides or proteins have been reported in both the HPLC and CEC literature, using
charged monoliths [51, 52].
This thesis investigates two methods for performing these separations. The first
method focuses on chromatographic separations in the reversed phase mode on silica
based plates. The second method focuses on the use of monolithic layers to perform the
chromatographic separation.
PPEC Separation of Peptides on Brij-35 Complexed Plates
When proteins or peptides are separated by conventional reversed phase
chromatography, the analytes denature and adsorb onto the layer resulting in a decrease
in the quality of the peak shape, an increase in tailing, and a diminution in separation
quality. To prevent or reduce these interactions, different approaches to sorbent
modification have been investigated, including the derivitization of the sorbent layer with
ionic surfactants [53], inclusion of organic additives in the mobile phase [54], and
nonionic surfactant intercalation of the sorbent layer [55]. The latter method, suggested
by Regnier and Towns, is easily adapted to planar chromatography and for this reason
54
was investigated by our group. This approach allows for the separation of charged
analytes over a large range of usable pH values, in contrast to other methods, which
require the use of limited pH ranges to maintain an appropriate charge on the analytes.
The surfactants bind to the C18 bonded stationary phase, and create a semi-permeable
hydrophilic layer that allows electroosmotic flow while preventing the adsorption of
analyte. This layer is formed by the hydrocarbon tails of the surfactants intercalating
between the octadecyl groups of the bonded stationary phase.
The goal of the project was to perform peptide and protein separations using Brij-
35 complexed plates, prepared in our laboratory. Brij-35 (Polyoxyethyleneglycol dodecyl
ether) is a non-ionic polyoxyethylene surfactant used in cell lysis buffers or in various
HPLC applications. The following section of this thesis describes the attempts to perform
PPEC separation of peptides and proteins on these plates.
Peptide and protein separations were performed by PPEC on LiChrospher plates
impregnated with Brij-35. Regular plates were not used, as the layer on these
disintegrated when soaked in the Brij-35 solution. The LiChrospher plates that were
treated support EOF, and can be run in the standard plate holder.
The initial runs used plates that were baked at 160 ºC for 20 minutes, soaked for 3
hours in a 0.001 % aqueous Brij-35 solution and then left to dry before spotting, dipping
and running at 3kV and 41 atm for 8 minutes. The peptides were derivatized with
fluorescamine before spotting [see next paragraph]. The dipping times took 5.0 seconds
for each end of the plate. The runs were performed at a controlled temperature of 20 ºC in
a 70 % aqueous acetonitrile mobile phase containing 5.0 mM acetate buffer at a nominal
pH 4.7 and 0.001 % Brij-35. These conditions are referred to as the initial standard
55
conditions for this study. These runs exhibited poor visibility of the spots and decent spot
shape but moderate reproducibility, see Figure 11. The large spotting volumes (2 μL)
needed for detection were considered to be the cause of the smeared spots. The following
study was performed to investigate if this was indeed the reason.
Fluorescamine was used to visualize the peptides under UV radiation, and the
following three different methods of reacting the peptides with fluorescamine were
tested. The first method was to spray the plate with fluorescamine before spotting. This
yielded either very little fluorescence or no fluorescence. The second method was to mix
the fluorescamine with the protein or peptide prior to spotting, which gave very strong
fluorescence but can yield multiple products if there is more than one primary amino
group present in a peptide. The third method was to spray the plate with fluorescamine
after the run to allow the analytes to separate in their native state before reacting with the
fluorescamine. This method caused the entire plate to fluoresce causing the background
to overwhelm the fluorescence of the analytes. Based on these results all further
visualization was performed by mixing the fluorescamine with the analytes prior to
spotting on the plate. To optimize this method of applying fluorescence, different
volumes of analyte and different ratios of fluorescamine to analyte were used. The best
spotting solution was found to be 0.15 μL of the analyte mixture made up of 1mg/mL
peptide solutions. Immediately before spotting the analyte mixture was reacted at a 1:1
ratio with a fluorescamine solution in acetone that has a concentration of 3 mg/mL. There
is a possibility that fluorescamine labeling of a compound with more than one primary
amino group would result in multiple spots on separation. Another cause of multiple
spots would be decomposition of the analyte during PPEC. This would be evidenced by a
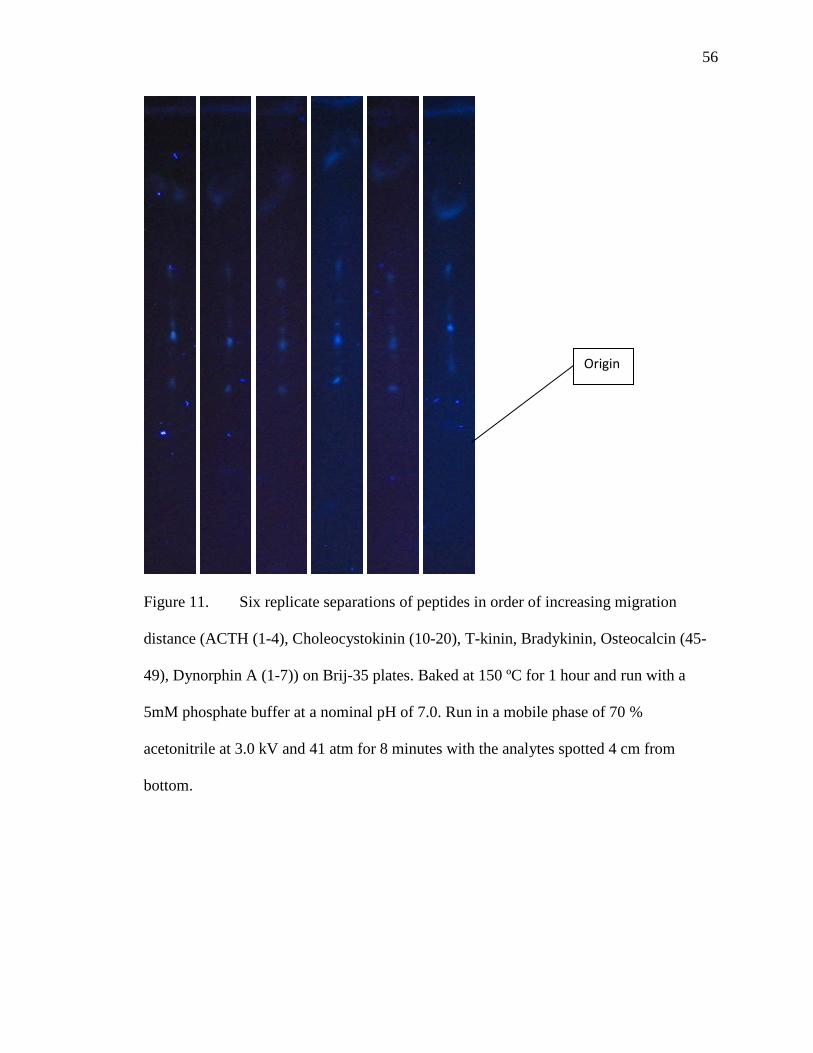
56
Figure 11. Six replicate separations of peptides in order of increasing migration
distance (ACTH (1-4), Choleocystokinin (10-20), T-kinin, Bradykinin, Osteocalcin (45-
49), Dynorphin A (1-7)) on Brij-35 plates. Baked at 150 ºC for 1 hour and run with a
5mM phosphate buffer at a nominal pH of 7.0. Run in a mobile phase of 70 %
acetonitrile at 3.0 kV and 41 atm for 8 minutes with the analytes spotted 4 cm from
bottom.
Origin
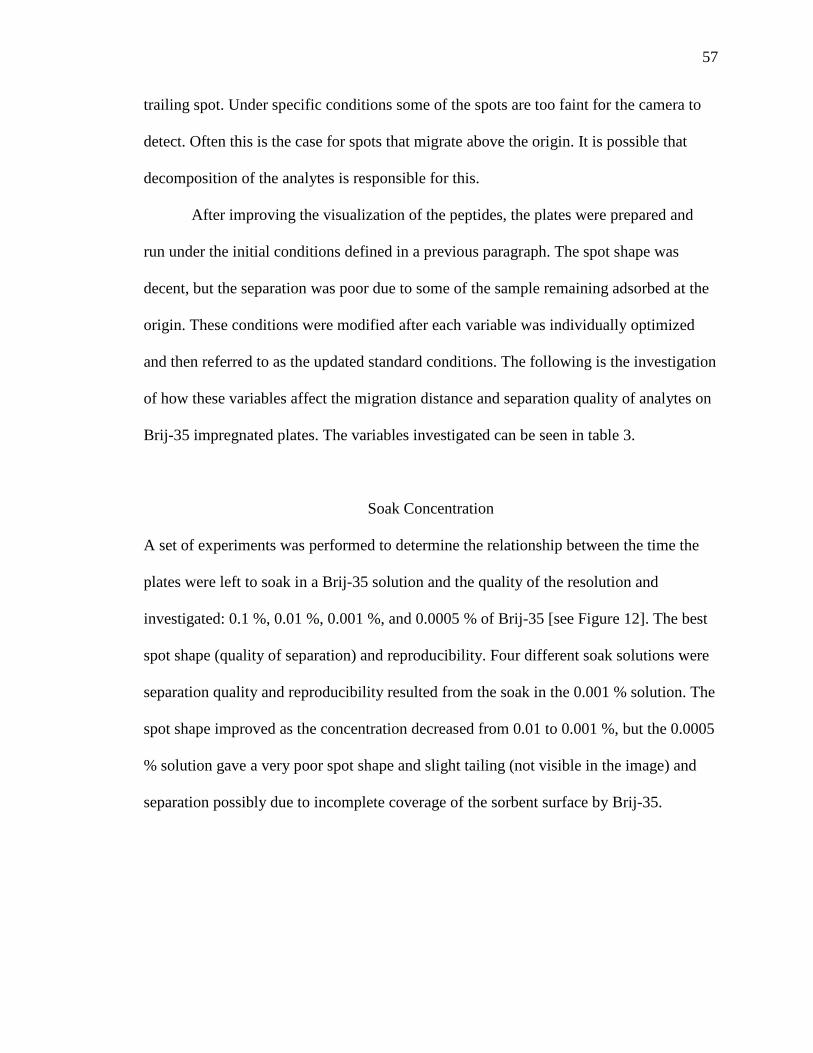
57
trailing spot. Under specific conditions some of the spots are too faint for the camera to
detect. Often this is the case for spots that migrate above the origin. It is possible that
decomposition of the analytes is responsible for this.
After improving the visualization of the peptides, the plates were prepared and
run under the initial conditions defined in a previous paragraph. The spot shape was
decent, but the separation was poor due to some of the sample remaining adsorbed at the
origin. These conditions were modified after each variable was individually optimized
and then referred to as the updated standard conditions. The following is the investigation
of how these variables affect the migration distance and separation quality of analytes on
Brij-35 impregnated plates. The variables investigated can be seen in table 3.
Soak Concentration
A set of experiments was performed to determine the relationship between the time the
plates were left to soak in a Brij-35 solution and the quality of the resolution and
investigated: 0.1 %, 0.01 %, 0.001 %, and 0.0005 % of Brij-35 [see Figure 12]. The best
spot shape (quality of separation) and reproducibility. Four different soak solutions were
separation quality and reproducibility resulted from the soak in the 0.001 % solution. The
spot shape improved as the concentration decreased from 0.01 to 0.001 %, but the 0.0005
% solution gave a very poor spot shape and slight tailing (not visible in the image) and
separation possibly due to incomplete coverage of the sorbent surface by Brij-35.
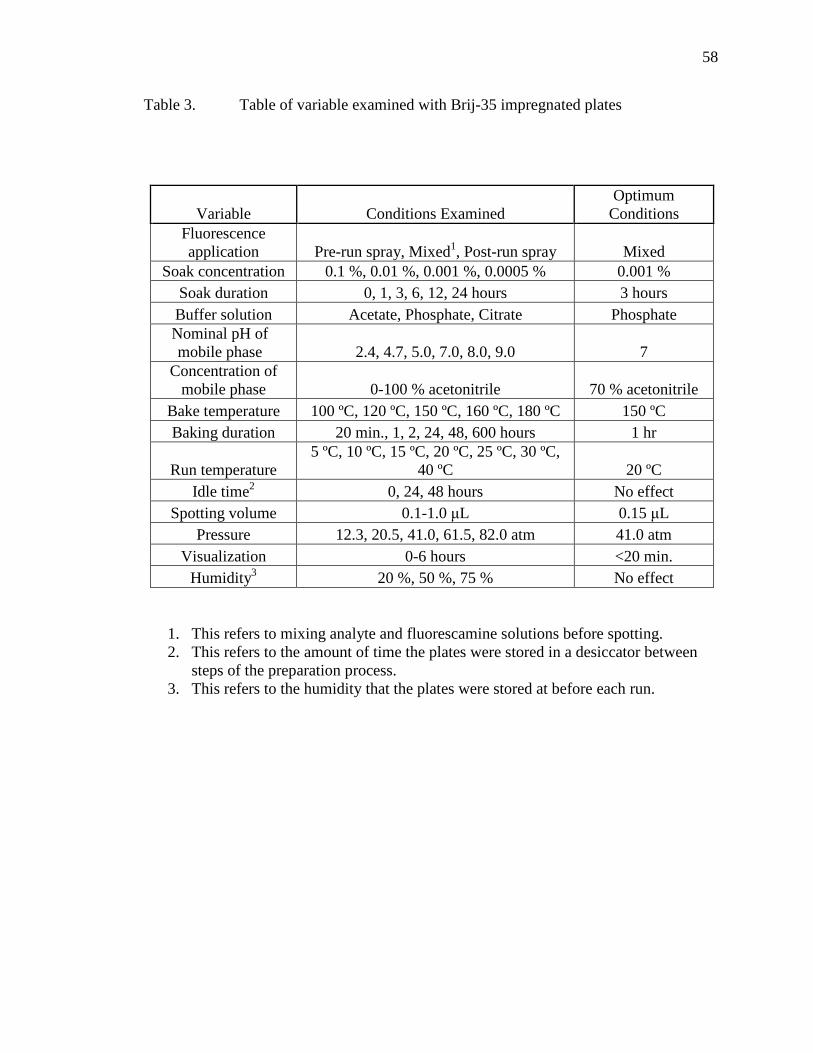
58
Table 3. Table of variable examined with Brij-35 impregnated plates
1. This refers to mixing analyte and fluorescamine solutions before spotting. 2. This refers to the amount of time the plates were stored in a desiccator between
steps of the preparation process. 3. This refers to the humidity that the plates were stored at before each run.
Variable Conditions Examined Optimum
Conditions Fluorescence application Pre-run spray, Mixed1, Post-run spray Mixed
Soak concentration 0.1 %, 0.01 %, 0.001 %, 0.0005 % 0.001 % Soak duration 0, 1, 3, 6, 12, 24 hours 3 hours Buffer solution Acetate, Phosphate, Citrate Phosphate Nominal pH of mobile phase 2.4, 4.7, 5.0, 7.0, 8.0, 9.0 7
Concentration of mobile phase 0-100 % acetonitrile 70 % acetonitrile
Bake temperature 100 ºC, 120 ºC, 150 ºC, 160 ºC, 180 ºC 150 ºC Baking duration 20 min., 1, 2, 24, 48, 600 hours 1 hr
Run temperature 5 ºC, 10 ºC, 15 ºC, 20 ºC, 25 ºC, 30 ºC,
40 ºC 20 ºC Idle time2 0, 24, 48 hours No effect
Spotting volume 0.1-1.0 μL 0.15 μL Pressure 12.3, 20.5, 41.0, 61.5, 82.0 atm 41.0 atm
Visualization 0-6 hours <20 min. Humidity3 20 %, 50 %, 75 % No effect
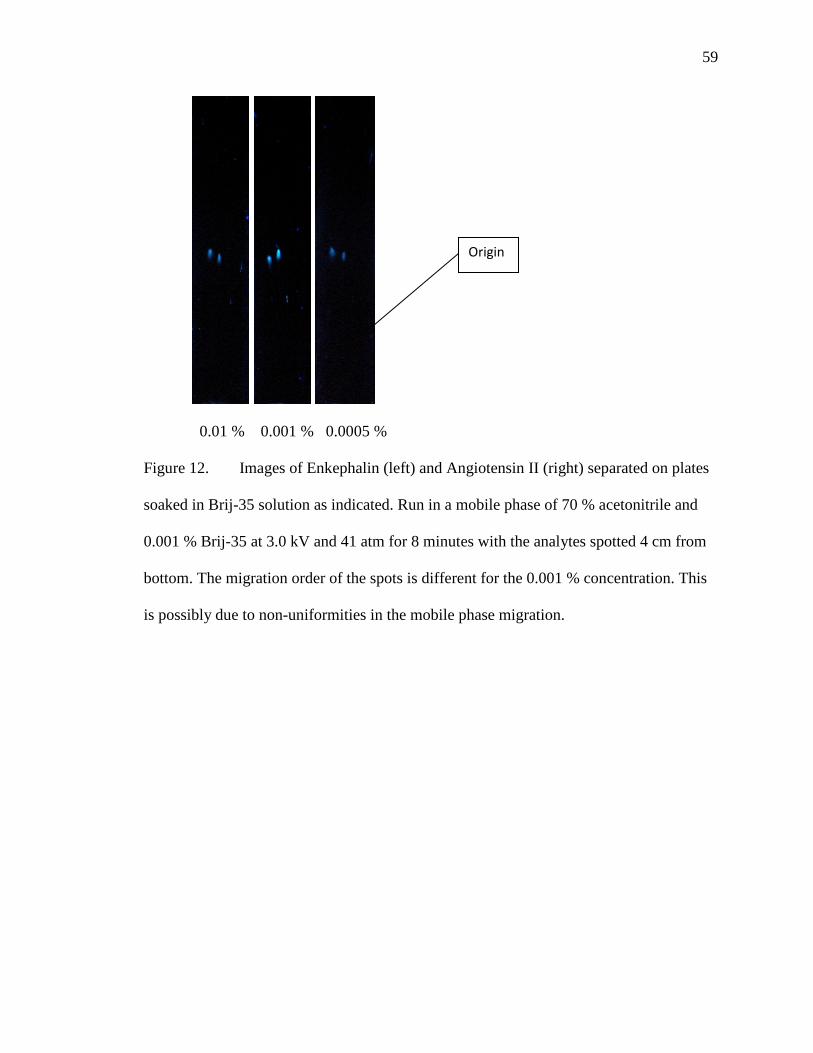
59
0.01 % 0.001 % 0.0005 %
Figure 12. Images of Enkephalin (left) and Angiotensin II (right) separated on plates
soaked in Brij-35 solution as indicated. Run in a mobile phase of 70 % acetonitrile and
0.001 % Brij-35 at 3.0 kV and 41 atm for 8 minutes with the analytes spotted 4 cm from
bottom. The migration order of the spots is different for the 0.001 % concentration. This
is possibly due to non-uniformities in the mobile phase migration.
Origin
60
Soak Duration
The next set of experiments was performed to determine the relationship between
the soak duration and the resultant quality of separation. PPEC separations were
performed under the updated standard conditions. The plates were soaked in the 0.001 %
Brij-35 soak solution for 0, 1, 3, 6, 12 or 24 hours. There was an improvement in the
quality of the separation as the soak time increased from 0 to 3 hours. A 3 hour soak can
be seen in Figure 13. Longer soak times gave poorer spot shape and separation possibly
due to either damage to the sorbent layer or degradation of the binding agent.
Buffer Solution
The next set of experiments was performed to determine the relationship between the
identity of run buffer used in the mobile phase and the quality of the separation under
updated standard conditions. Three different buffers were tested: acetate, citrate and
phosphate. It was found that both acetate and phosphate yielded almost identical results
for comparable pH (4.7), while the citrate buffer yielded no migration or separation, but
destroyed the sorbent layers of the plates. The phosphate buffer was selected for
subsequent separations due to its larger effective pH range (2.4 - 9.0) but the acetate
buffer was used for separations at a nominal pH of 4.7.
Nominal pH of Mobile Phase
The next set of experiments was performed to determine the specific pH that
yields the highest separation quality. To determine the optimum pH, PPEC separations
were performed under updated standard conditions. Both phosphate and acetate buffers
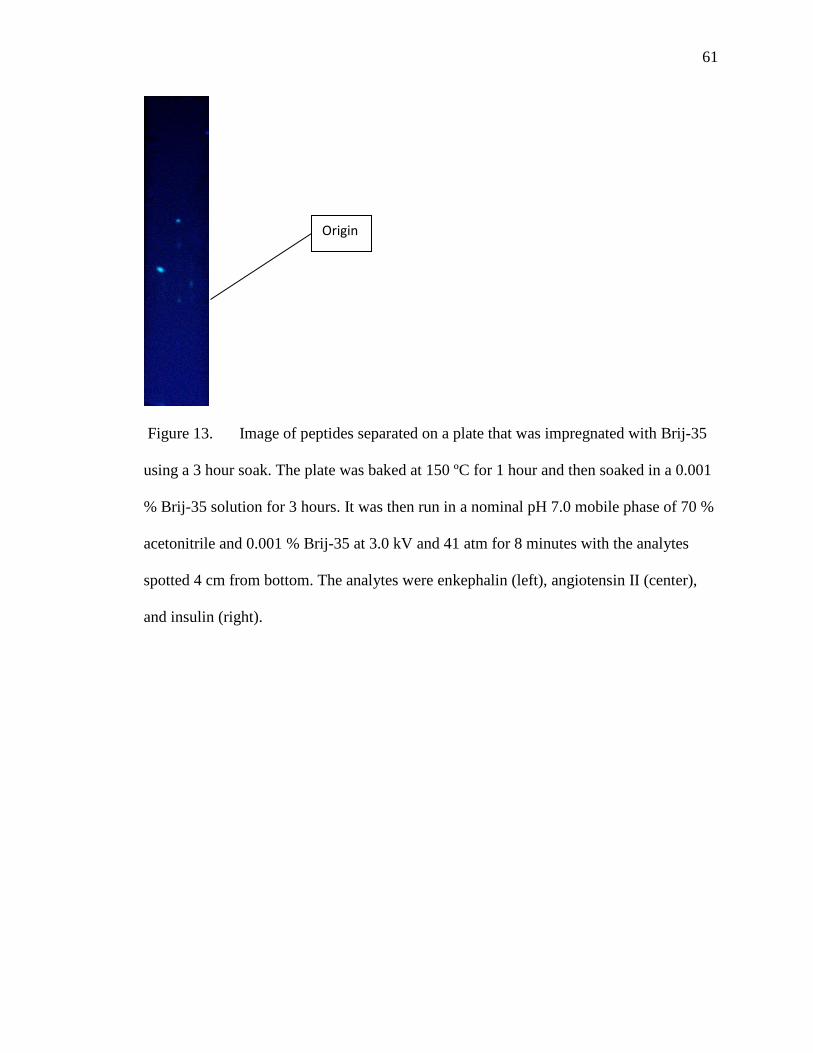
61
Figure 13. Image of peptides separated on a plate that was impregnated with Brij-35
using a 3 hour soak. The plate was baked at 150 ºC for 1 hour and then soaked in a 0.001
% Brij-35 solution for 3 hours. It was then run in a nominal pH 7.0 mobile phase of 70 %
acetonitrile and 0.001 % Brij-35 at 3.0 kV and 41 atm for 8 minutes with the analytes
spotted 4 cm from bottom. The analytes were enkephalin (left), angiotensin II (center),
and insulin (right).
Origin
62
were tested. The phosphate buffers had nominal pH values of 2.4, 5.0, 7.0, 8.0, 9.0 and
the acetate buffer had a nominal pH of 4.7. Since the specific analytes being tested have
different charges, and therefore migrate differently under different pH values, this step
was optimized for the two mixtures (vide infra) containing the peptides listed in Table 4.
For these mixtures it was found that as the pH value approached 7.0 the migration
distances increased, as did the resolution of the analyte spots. As the pH is increased
above a pH of 7 the quality of separation and spot shape begins to diminish.
Concentration of Mobile Phase
After determining that a phosphate buffer of nominal pH 7.0 was the optimal
buffer solution, the next step was to determine the optimum concentration of acetonitrile
in the mobile phase. PPEC separations were performed under the updated standard
conditions. Acetonitrile concentrations from 0 % to 100 % were tested in an aqueous
mobile phase containing 0.001 % Brij-35. The mobile phases were tested in 10 %
increments from 40 % to 90 %. No separation was obtained when using either pure
acetonitrile as the mobile phase or acetonitrile at concentrations below 40 %, presumably
due to solubility issues at these concentrations. The best separations were found at
acetonitrile concentrations between 50 % and 70 %. The range 60 % to 80 % was then
tested in 5 % increments and the results for three pH values are shown in Figure 14. It
was found that the separation quality improved slightly as the acetonitrile concentration
was increased to 70 %, but degraded dramatically at higher concentration. An image of a
peptide separation at the optimum mobile phase concentration (70 % aqueous
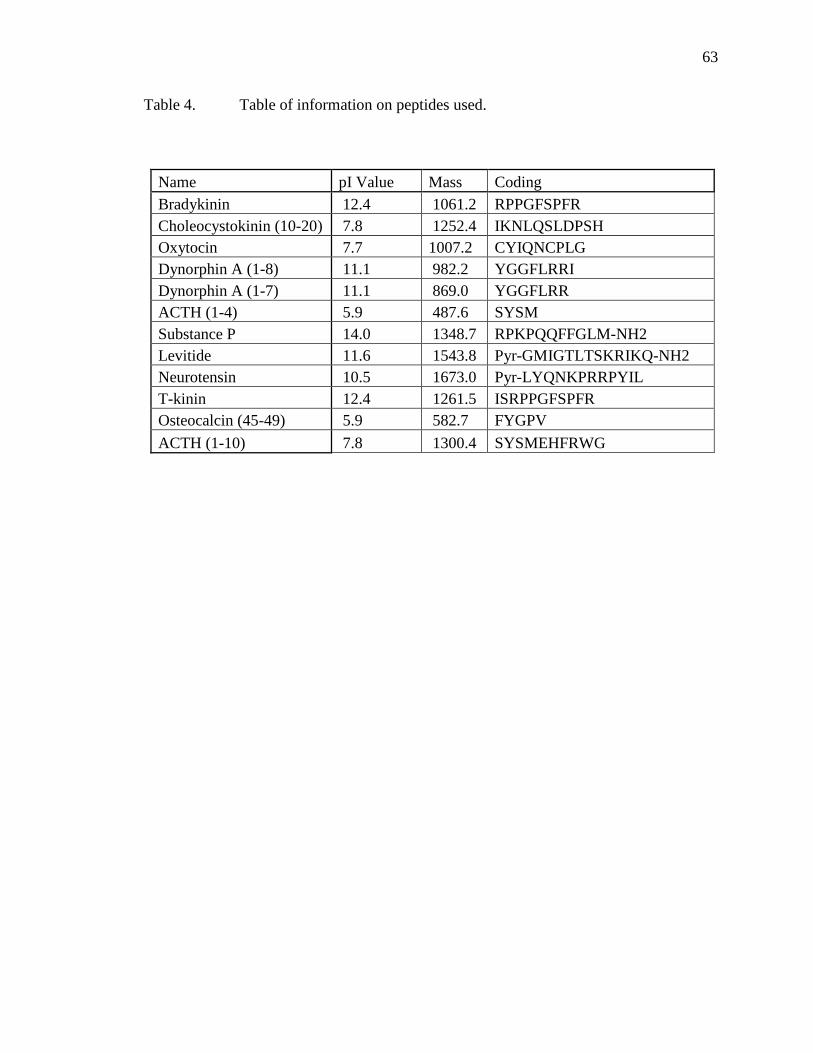
63
Table 4. Table of information on peptides used.
Name pI Value Mass Coding Bradykinin 12.4 1061.2 RPPGFSPFR Choleocystokinin (10-20) 7.8 1252.4 IKNLQSLDPSH Oxytocin 7.7 1007.2 CYIQNCPLG Dynorphin A (1-8) 11.1 982.2 YGGFLRRI Dynorphin A (1-7) 11.1 869.0 YGGFLRR ACTH (1-4) 5.9 487.6 SYSM Substance P 14.0 1348.7 RPKPQQFFGLM-NH2 Levitide 11.6 1543.8 Pyr-GMIGTLTSKRIKQ-NH2 Neurotensin 10.5 1673.0 Pyr-LYQNKPRRPYIL T-kinin 12.4 1261.5 ISRPPGFSPFR Osteocalcin (45-49) 5.9 582.7 FYGPV ACTH (1-10) 7.8 1300.4 SYSMEHFRWG
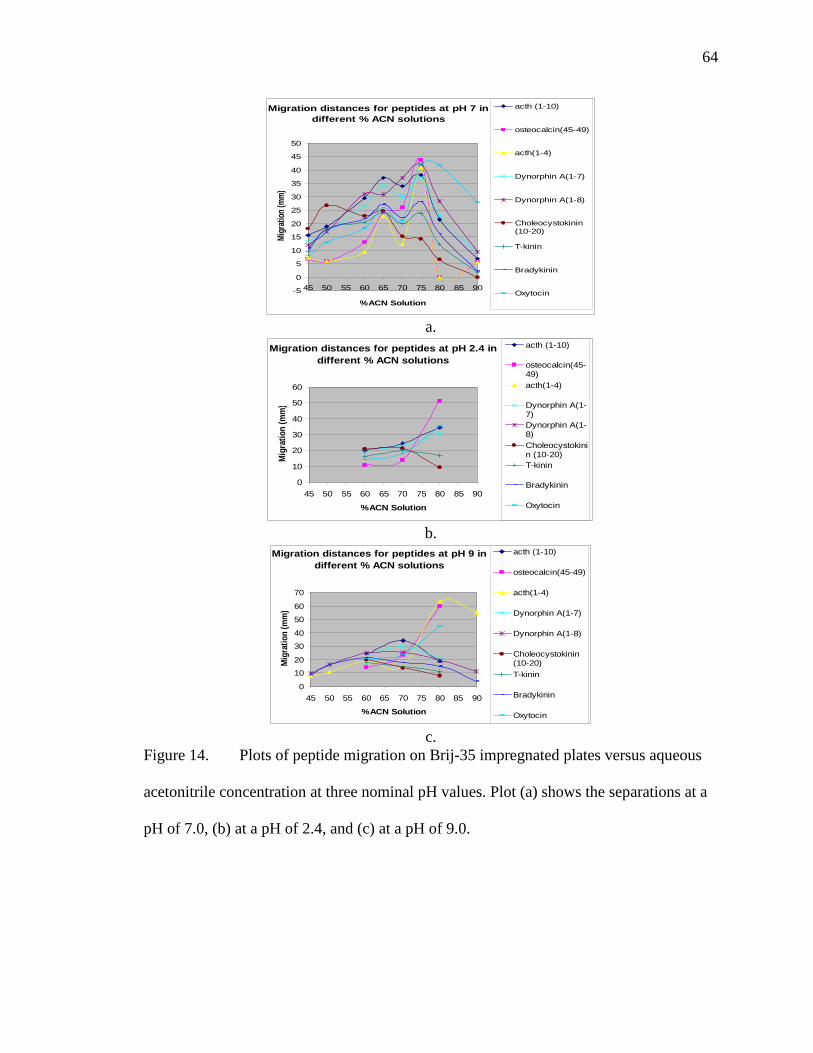
64
a.
b.
c.
Figure 14. Plots of peptide migration on Brij-35 impregnated plates versus aqueous
acetonitrile concentration at three nominal pH values. Plot (a) shows the separations at a
pH of 7.0, (b) at a pH of 2.4, and (c) at a pH of 9.0.
Migration distances for peptides at pH 7 in different % ACN solutions
-5
0
5
10
15
20
25
30
35
40
45
50
45 50 55 60 65 70 75 80 85 90
%ACN Solution
Migr
ation
(mm)
acth (1-10)
osteocalcin(45-49)
acth(1-4)
Dynorphin A(1-7)
Dynorphin A(1-8)
Choleocystokinin(10-20)
T-kinin
Bradykinin
Oxytocin
Migration distances for peptides at pH 2.4 in different % ACN solutions
0
10
20
30
40
50
60
45 50 55 60 65 70 75 80 85 90
%ACN Solution
Mig
ratio
n (m
m)
acth (1-10)
osteocalcin(45-49)acth(1-4)
Dynorphin A(1-7)Dynorphin A(1-8)Choleocystokinin (10-20)T-kinin
Bradykinin
Oxytocin
Migration distances for peptides at pH 9 in different % ACN solutions
0
10
20
30
40
50
60
70
45 50 55 60 65 70 75 80 85 90
%ACN Solution
Mig
ratio
n (m
m)
acth (1-10)
osteocalcin(45-49)
acth(1-4)
Dynorphin A(1-7)
Dynorphin A(1-8)
Choleocystokinin(10-20)T-kinin
Bradykinin
Oxytocin
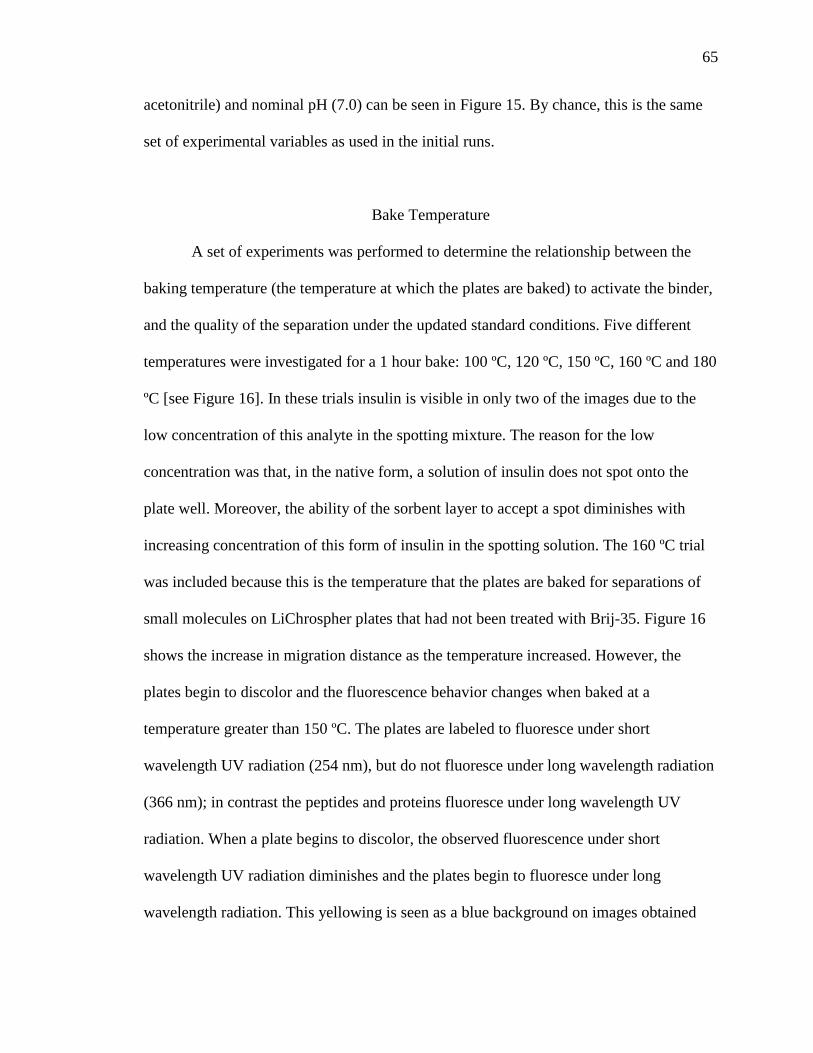
65
acetonitrile) and nominal pH (7.0) can be seen in Figure 15. By chance, this is the same
set of experimental variables as used in the initial runs.
Bake Temperature
A set of experiments was performed to determine the relationship between the
baking temperature (the temperature at which the plates are baked) to activate the binder,
and the quality of the separation under the updated standard conditions. Five different
temperatures were investigated for a 1 hour bake: 100 ºC, 120 ºC, 150 ºC, 160 ºC and 180
ºC [see Figure 16]. In these trials insulin is visible in only two of the images due to the
low concentration of this analyte in the spotting mixture. The reason for the low
concentration was that, in the native form, a solution of insulin does not spot onto the
plate well. Moreover, the ability of the sorbent layer to accept a spot diminishes with
increasing concentration of this form of insulin in the spotting solution. The 160 ºC trial
was included because this is the temperature that the plates are baked for separations of
small molecules on LiChrospher plates that had not been treated with Brij-35. Figure 16
shows the increase in migration distance as the temperature increased. However, the
plates begin to discolor and the fluorescence behavior changes when baked at a
temperature greater than 150 ºC. The plates are labeled to fluoresce under short
wavelength UV radiation (254 nm), but do not fluoresce under long wavelength radiation
(366 nm); in contrast the peptides and proteins fluoresce under long wavelength UV
radiation. When a plate begins to discolor, the observed fluorescence under short
wavelength UV radiation diminishes and the plates begin to fluoresce under long
wavelength radiation. This yellowing is seen as a blue background on images obtained
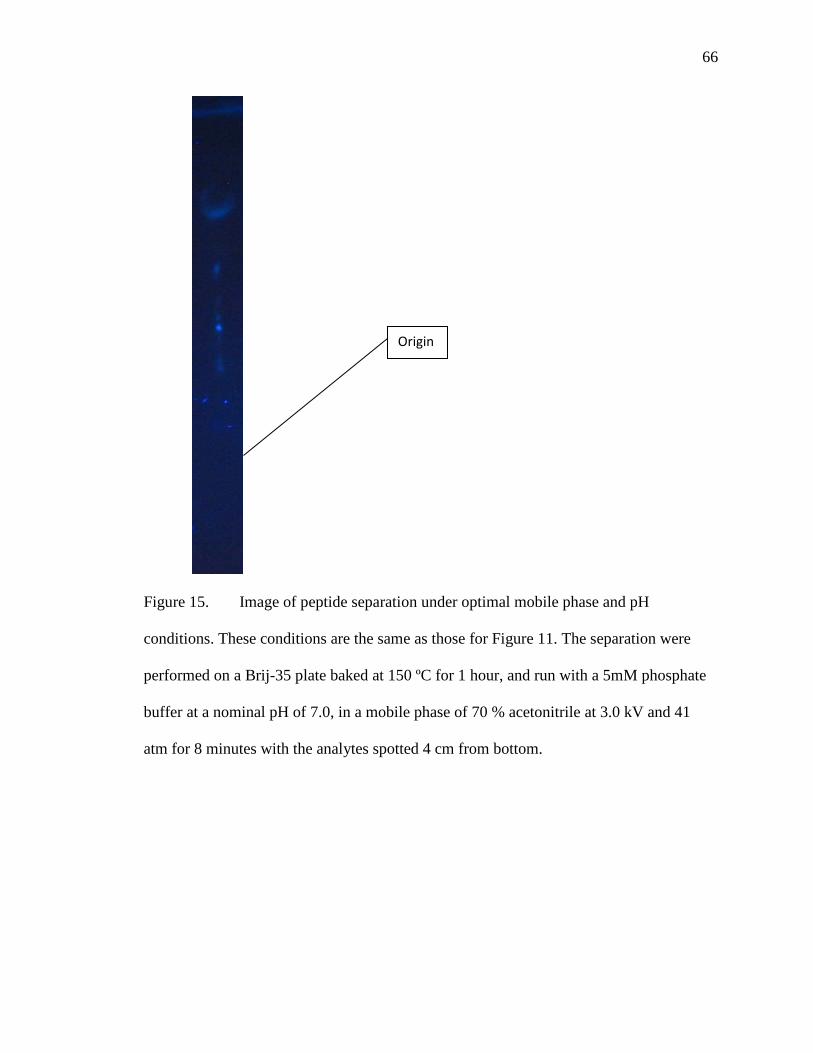
66
Figure 15. Image of peptide separation under optimal mobile phase and pH
conditions. These conditions are the same as those for Figure 11. The separation were
performed on a Brij-35 plate baked at 150 ºC for 1 hour, and run with a 5mM phosphate
buffer at a nominal pH of 7.0, in a mobile phase of 70 % acetonitrile at 3.0 kV and 41
atm for 8 minutes with the analytes spotted 4 cm from bottom.
Origin
67
100 ºC 120 ºC 150 ºC 160 ºC 180 ºC
Figure 16. Images showing the effect of baking temperature on separations
performed on plates baked and then soaked in a 0.001 % Brij-35 solution for 3 hours.
Separations were with a mobile phase consisting of 65 % aqueous acetonitrile containing
0.001 % Brij-35 and a 5mM phosphate buffer at a nominal pH of 7.0, at 3.0 kV and 41
atm for 8 minutes with the analytes spotted 4 cm from bottom. The analytes were
enkephalin (left), angiotensin II (center) and insulin (right). The temperatures at which
the plates were baked are indicated under the images.
Origin
68
under UV radiation, which causes higher background noise eventually masking the
fluorescence of the peptides. The highest temperature that did not cause yellowing was
found to be 150 ºC.
Duration of Baking
After the preceding experiment it was considered that, aside from the baking
temperature, it was likely the duration of the bake could affect the separation quality. A
set of experiments was performed to determine the relationship between the bake
duration and the quality of separation. PPEC separations were performed under the
updated standard conditions. The plates were heated at 150 ºC for 20 minutes, 1 hour, or
2 hours [see Figure 17] and at 100 ºC for 2 hours, 24 hours, 48 hours or 600 hours. It was
found that the quality of the separation improved as the duration of baking was increased.
The 20 minute bake had slight tailing (not visible in the image). However, similar to
baking at higher temperatures, extended baking times caused the plates to begin to
discolor, as seen in Figure 18 (comparison of a non-yellowed and a yellowed plate). At
150 ºC the plates started to yellow after 1 hour, and for the 100 ºC bake times yellowing
was after 48 hours. The 1 hour bake at 150 ºC offered the best compromise between the
quality of separation and the quality of visualization.
Run Temperature
PPEC separations were performed under the updated standard conditions at run
temperatures of 5 ºC, 15 ºC, 25 ºC and 35 ºC. All of the runs were performed for 5
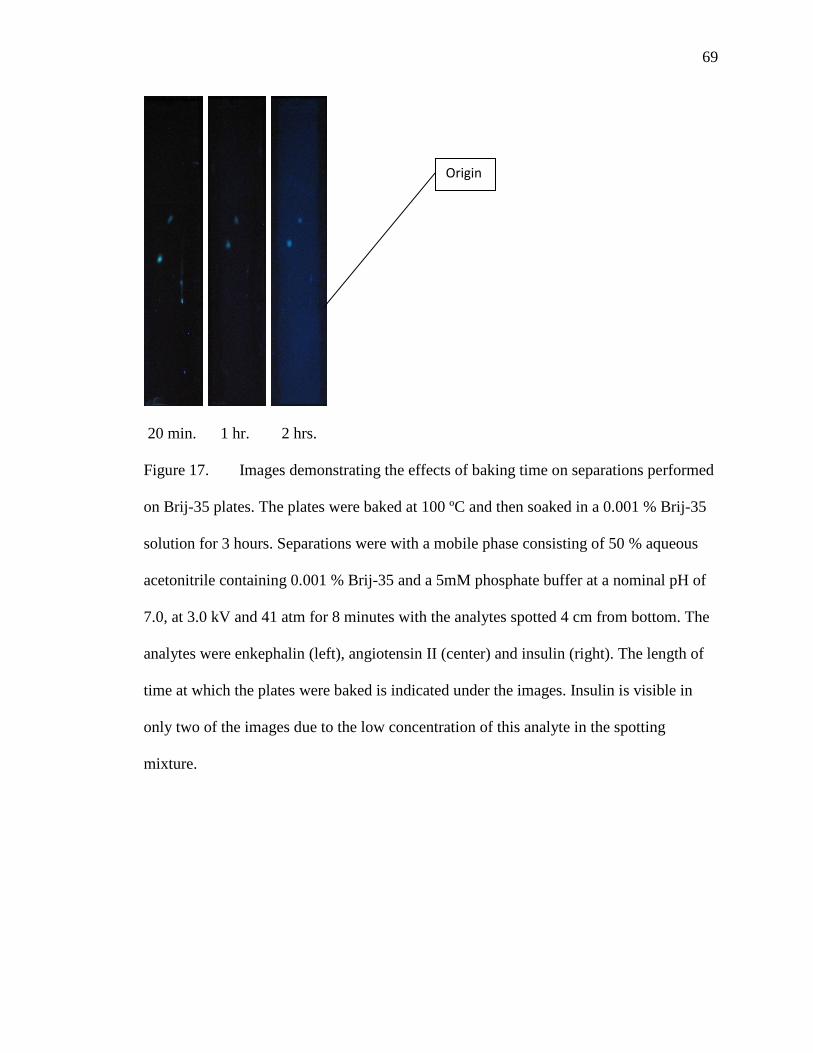
69
20 min. 1 hr. 2 hrs.
Figure 17. Images demonstrating the effects of baking time on separations performed
on Brij-35 plates. The plates were baked at 100 ºC and then soaked in a 0.001 % Brij-35
solution for 3 hours. Separations were with a mobile phase consisting of 50 % aqueous
acetonitrile containing 0.001 % Brij-35 and a 5mM phosphate buffer at a nominal pH of
7.0, at 3.0 kV and 41 atm for 8 minutes with the analytes spotted 4 cm from bottom. The
analytes were enkephalin (left), angiotensin II (center) and insulin (right). The length of
time at which the plates were baked is indicated under the images. Insulin is visible in
only two of the images due to the low concentration of this analyte in the spotting
mixture.
Origin
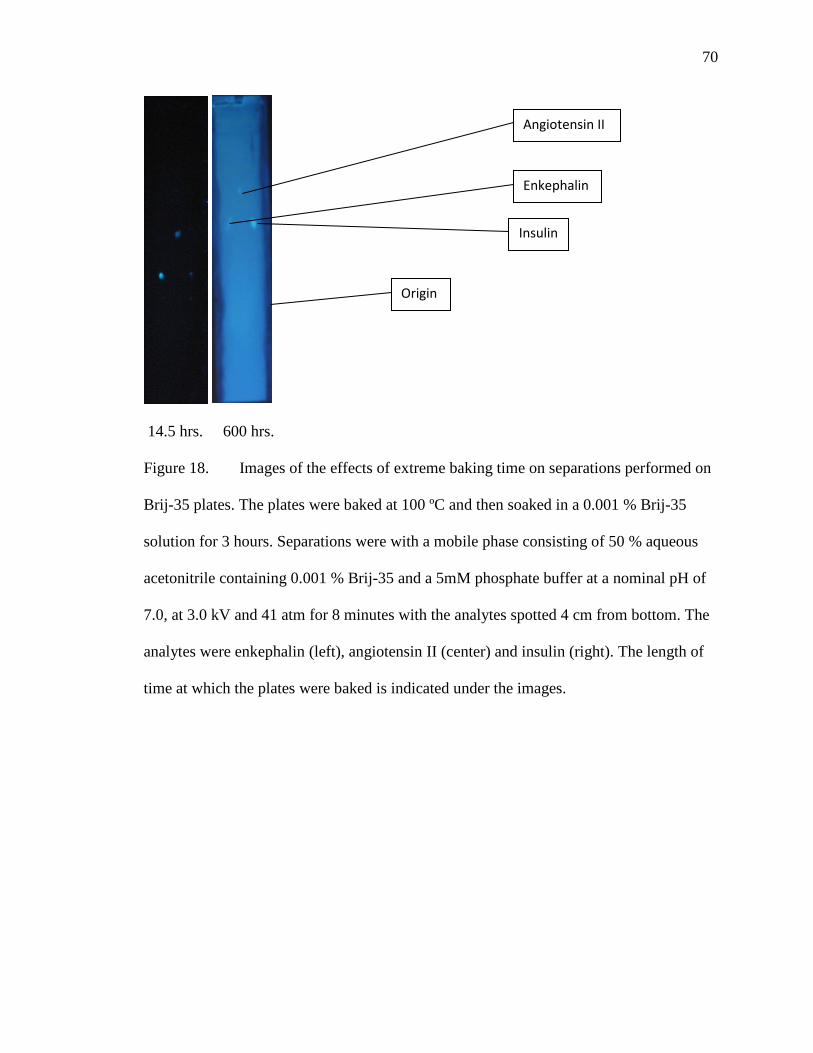
70
14.5 hrs. 600 hrs.
Figure 18. Images of the effects of extreme baking time on separations performed on
Brij-35 plates. The plates were baked at 100 ºC and then soaked in a 0.001 % Brij-35
solution for 3 hours. Separations were with a mobile phase consisting of 50 % aqueous
acetonitrile containing 0.001 % Brij-35 and a 5mM phosphate buffer at a nominal pH of
7.0, at 3.0 kV and 41 atm for 8 minutes with the analytes spotted 4 cm from bottom. The
analytes were enkephalin (left), angiotensin II (center) and insulin (right). The length of
time at which the plates were baked is indicated under the images.
Enkephalin
Angiotensin II
Insulin
Origin
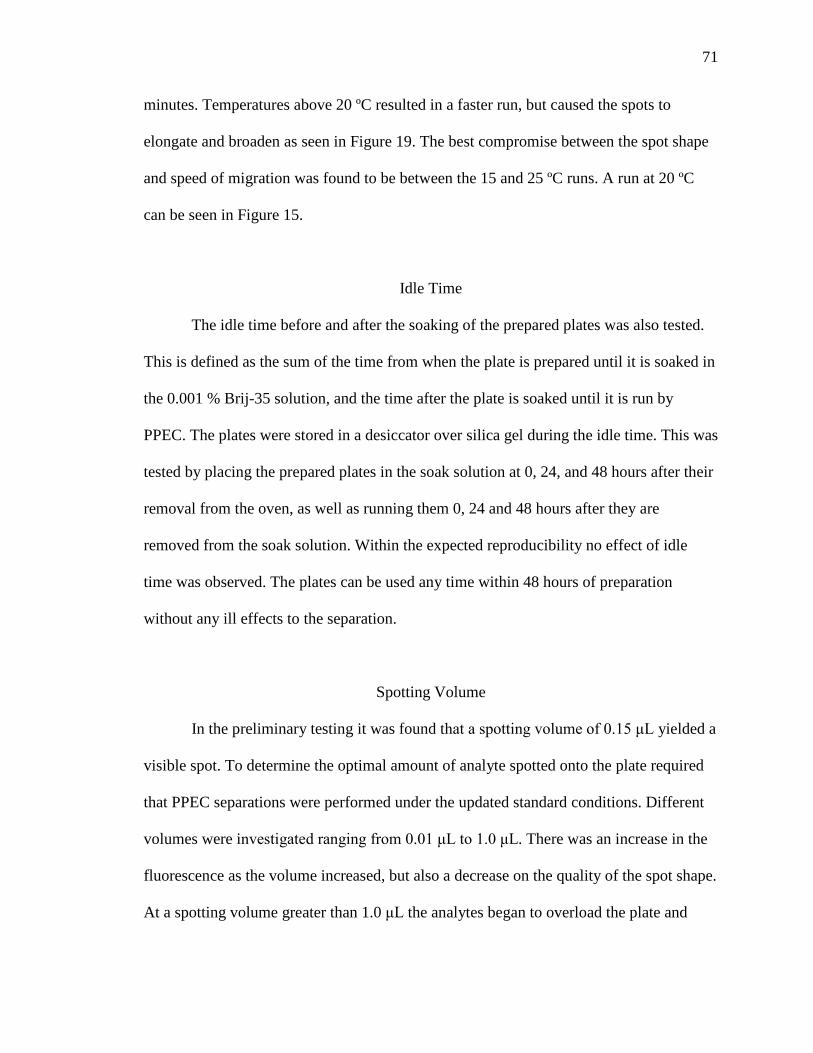
71
minutes. Temperatures above 20 ºC resulted in a faster run, but caused the spots to
elongate and broaden as seen in Figure 19. The best compromise between the spot shape
and speed of migration was found to be between the 15 and 25 ºC runs. A run at 20 ºC
can be seen in Figure 15.
Idle Time
The idle time before and after the soaking of the prepared plates was also tested.
This is defined as the sum of the time from when the plate is prepared until it is soaked in
the 0.001 % Brij-35 solution, and the time after the plate is soaked until it is run by
PPEC. The plates were stored in a desiccator over silica gel during the idle time. This was
tested by placing the prepared plates in the soak solution at 0, 24, and 48 hours after their
removal from the oven, as well as running them 0, 24 and 48 hours after they are
removed from the soak solution. Within the expected reproducibility no effect of idle
time was observed. The plates can be used any time within 48 hours of preparation
without any ill effects to the separation.
Spotting Volume
In the preliminary testing it was found that a spotting volume of 0.15 μL yielded a
visible spot. To determine the optimal amount of analyte spotted onto the plate required
that PPEC separations were performed under the updated standard conditions. Different
volumes were investigated ranging from 0.01 μL to 1.0 μL. There was an increase in the
fluorescence as the volume increased, but also a decrease on the quality of the spot shape.
At a spotting volume greater than 1.0 μL the analytes began to overload the plate and
72
5 ºC 15 ºC 25 ºC 35 ºC
Figure 19. Images demonstrating the effects of temperature on insulin separated on a
Brij-35 plate. The plates were baked at 150 ºC for 1 hour and then soaked in a 0.001 %
Brij-35 solution for 3 hours. Separations were with a mobile phase consisting of 70 %
aqueous acetonitrile containing 0.001 % Brij-35 and a 5mM phosphate buffer at a
nominal pH of 7.0, at 3.0 kV and 41 atm for 5 minutes with the analytes spotted 4 cm
from bottom. The insulin in these images is readily visible due to an increase in volume
of analyte spotted. The run temperature is indicated under the images.
Origin
73
smear, resulting in a decreased resolution. The best spot shape while still being able to
observe the analytes was found using a spotting volume of 0.15 μL.
Pressure
Throughout the preliminary experiments, different run pressures were examined
to determine the influence of pressure on the quality of separation. Five different
pressures were investigated: 12.3 atm, 20.5 atm, 41.0 atm, 61.5, and 82.0 atm. The best
quality of separation was at 41.0 atm with substantially poorer separations at both higher
and lower pressures. The loss of quality at the lower pressures is probably caused by
liquid driven to the surface where it could flow both across the layer and through it.
Pressures higher than 41.0 atm inhibited the flow of mobile phase through the sorbent
and decreased both migration distance and the quality of the spot shape.
Visualization
Plates were observed periodically for 6 hours after their removal from the holder
to gauge the effect of time on the level of fluorescence. The analytes were easily visible
for about an hour after being run. There was a noticeable drop in the intensity after 20
minutes, with the intensity continuing to decline until observations were stopped at 6
hours. The plates were inspected again after 24 hours and the spots were no longer
visible.
74
Humidity
In order to investigate if humidity was a variable, plates were stored at controlled
humidity. Three different humidities were investigated: 45 %, 60 %, and 75 %. Plates
were placed in a desiccator over aqueous sulfuric acid solutions set to these humidities
for 14 hours before being used immediately. There was no difference in the spot shape
caused by any differences in humidity.
Separation of Peptides and Proteins on Monolith Plates
The initial report of a successful separation by CEC, using a monolith, was of four
peptides in less than 5 minutes at 900 V/cm [56]. The authors noted that the elution
pattern and efficiency of the separations depended strongly on both the percentage of
acetonitrile and the pH of the mobile phase. Several other successful peptide [57-59] and
protein [57, 60-64] separations on monoliths have since been performed by CEC.
After using Brij-35 derivatized plates our group became interested in using
monolithic thin-layer chromatography plates for PPEC separations of peptides. We
established a collaboration with Dr. Svec’s group at Lawrence Berkeley National
Laboratory. The goal of the project was to perform peptide and protein separations at
IUPUI using monolith TLC plates prepared in Dr. Svec’s laboratory. This project was
begun by Allyson Novotny, who received several batches of plates. These plates were
tested and gave variable and unrepeatable results. The work described below on the
separation of peptides and proteins on negatively charged, positively charged, and neutral
superhydrophobic monoliths was performed as part of my thesis research.
75
Description of the Monolith Plates Recieved
The monolith plates supplied by Dr. Svec’s group at Lawrence Berkeley National
Laboratory were supplied in seven batches of neutral superhydrophobic plates and four
batches of charged plates. On the charged layers, separation occurs primarily because of
electroosmotic flow of the mobile phase. Separation occurs entirely by electrophoresis on
the neutral plates, due to the absence of electroosmotic flow on an uncharged layer.
Changes were made in the preparation of each of these batches, based on results obtained
with the previous batch. Table 5 lists the properties of each batch.
Batch One was composed of neutral superhydrophobic monolith plates that were
physically weak and crumbled after a single run in the PPEC apparatus. These plates had
layers that were 50 μm thick with an unknown pore size. These plates were tested both by
Novotny [30] and the writer of this thesis, and found to give variable and unrepeatable
results.
Batch Two was composed of two types of charged plates that were based on the
neutral superhydrophobic plates from Batch One, and were 50 μm thick with an unknown
pore size. These were plates grafted with 15 wt % 2-acrylamido-2-methyl-1-
propanesulfonic acid (AMPS) or with 15 wt % [2-(Methacryloyloxy) ethyl]
trimethylammonium chloride (META) (in the future these will be referred to as %
AMPS, and % META). The remainder of the grafting solution is made of 0.25 wt %
benzophenone in a 3:1 (v/v) tert-butanol-water mixture. Adequate protein or peptide
separations were not achieved with either of these chemistries.
Batch Three was also composed of charged plates that were 7.5 % AMPS and 7.5
% 2-hydroxyethyl methacrylate (HEMA) with an unknown pore size. These plates
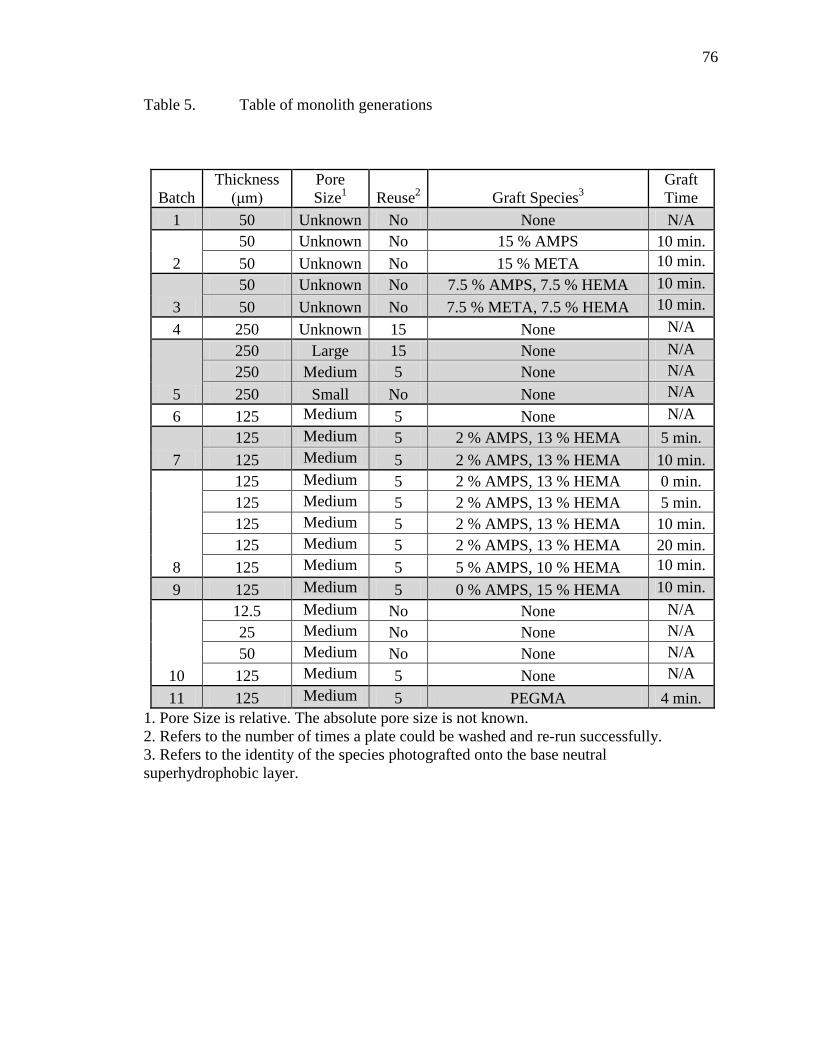
76
Table 5. Table of monolith generations
Batch Thickness
(μm) Pore Size1 Reuse2 Graft Species3
Graft Time
1 50 Unknown No None N/A
2 50 Unknown No 15 % AMPS 10 min. 50 Unknown No 15 % META 10 min.
3 50 Unknown No 7.5 % AMPS, 7.5 % HEMA 10 min. 50 Unknown No 7.5 % META, 7.5 % HEMA 10 min.
4 250 Unknown 15 None N/A
5
250 Large 15 None N/A 250 Medium 5 None N/A 250 Small No None N/A
6 125 Medium 5 None N/A
7 125 Medium 5 2 % AMPS, 13 % HEMA 5 min. 125 Medium 5 2 % AMPS, 13 % HEMA 10 min.
8
125 Medium 5 2 % AMPS, 13 % HEMA 0 min. 125 Medium 5 2 % AMPS, 13 % HEMA 5 min. 125 Medium 5 2 % AMPS, 13 % HEMA 10 min. 125 Medium 5 2 % AMPS, 13 % HEMA 20 min. 125 Medium 5 5 % AMPS, 10 % HEMA 10 min.
9 125 Medium 5 0 % AMPS, 15 % HEMA 10 min.
10
12.5 Medium No None N/A 25 Medium No None N/A 50 Medium No None N/A 125 Medium 5 None N/A
11 125 Medium 5 PEGMA 4 min. 1. Pore Size is relative. The absolute pore size is not known. 2. Refers to the number of times a plate could be washed and re-run successfully. 3. Refers to the identity of the species photografted onto the base neutral superhydrophobic layer.
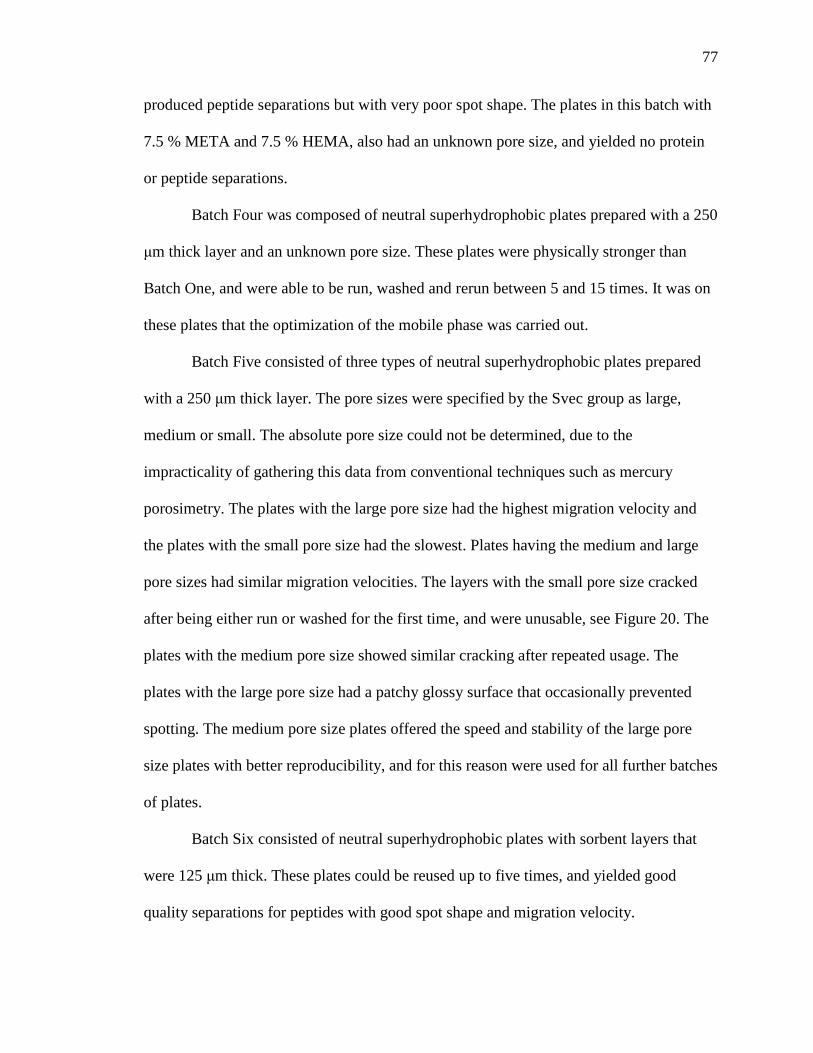
77
produced peptide separations but with very poor spot shape. The plates in this batch with
7.5 % META and 7.5 % HEMA, also had an unknown pore size, and yielded no protein
or peptide separations.
Batch Four was composed of neutral superhydrophobic plates prepared with a 250
μm thick layer and an unknown pore size. These plates were physically stronger than
Batch One, and were able to be run, washed and rerun between 5 and 15 times. It was on
these plates that the optimization of the mobile phase was carried out.
Batch Five consisted of three types of neutral superhydrophobic plates prepared
with a 250 μm thick layer. The pore sizes were specified by the Svec group as large,
medium or small. The absolute pore size could not be determined, due to the
impracticality of gathering this data from conventional techniques such as mercury
porosimetry. The plates with the large pore size had the highest migration velocity and
the plates with the small pore size had the slowest. Plates having the medium and large
pore sizes had similar migration velocities. The layers with the small pore size cracked
after being either run or washed for the first time, and were unusable, see Figure 20. The
plates with the medium pore size showed similar cracking after repeated usage. The
plates with the large pore size had a patchy glossy surface that occasionally prevented
spotting. The medium pore size plates offered the speed and stability of the large pore
size plates with better reproducibility, and for this reason were used for all further batches
of plates.
Batch Six consisted of neutral superhydrophobic plates with sorbent layers that
were 125 μm thick. These plates could be reused up to five times, and yielded good
quality separations for peptides with good spot shape and migration velocity.
78
Figure 20. Plates of the smaller pore size after a single run.
79
Batch Seven consisted of charged plates with a layer thickness of 125 μm. These
plates were prepared by grafting neutral superhydrophobic plates with a mixture
containing 2 % AMPS and 13 % HEMA. These plates were prepared with grafting times
of either 5 or 10 minutes. These plates could be reused, up to five times, and gave good
quality separations as well as good spot shape and migration velocity but marginal
reproducibility. The plates with the 10 minute graft time yielded the best separation
quality.
Batch Eight also consisted of charged plates and came in two grafting
concentrations of 2 % or 5 % AMPS. Those with 2 % AMPS and 13 % HEMA were
grafted at times of 0, 5, 10, and 20 minutes. The 5 % AMPS and 10 % HEMA had a
grafting time of 10 minutes. The 2 % AMPS plates with a 10 minute graft time yielded
the best separation quality, but the difference in quality across the different graft times
was marginal. The 5 % AMPS gave very poor separation and spot shape.
Batch Nine consisted of neutral plates, but unlike previous neutral plates these
had been photografted with 15 % HEMA over a 10 minute graft time. These plates
yielded similar results to the neutral superhydrophobic plates from Batch Six that did not
contain HEMA, giving good spot shape and separation quality.
Batch Ten consisted of neutral superhydrophobic plates with different thickness
of the sorbent layer: 12.5 μm, 25 μm, 50 μm and 125 μm. Layers of 12.5 μm and 50 μm
yielded no separations, while the 125 μm yielded good quality separations. The layers
that were less than 125 μm thick could not be reused, and the 12.5 μm sorbent layer
fractured in the holder and was too weak to be successfully run.
80
Batch Eleven consisted of neutral superhydrophobic plates with a monolith
thickness of 125 μm. These plates were photografted with a solution of 0.1 mol/L
polyethyleneglycol methacrylate (PEGMA). This value is reported in mol/L due to the
unknown molecular weight of the polyethyleneglycol grafted. These plates could be
reused up to five times, and yielded good quality separations for peptides with good spot
shape and migration velocity similar to Batch Six.
PPEC Separations on Neutral Monoliths
Peptide and protein separations were attempted by PPEC on the BuMA-EDMA
monoliths also referred to as neutral superhydrophobic plates. Since the monoliths are not
charged, no EOF occurs and analyte movement is due only to electrophoretic migration.
When performing PPEC using the conventional plate holder, the areas of the plate outside
the pressurized area will dry due to evaporation caused by Joule heating. To overcome
this, the Liquid-On-Top holder was used. This holder, which is used in a vertical position,
has a solvent reservoir at both the anode and the cathode. The unpressurized portions of
the plate extend into these reservoirs, preventing drying of the plate.
Initial experiments were performed with the peptides spotted 4 cm from the
bottom of the plate, and yielded poor results. It was found that the problem was not due
to the run conditions, but that the spotting position resulted in the spots smearing and
appearing to wash off of the plate. The appropriate spotting position was found to be in
the range of 6 to 8 cm from the bottom of the plate, see Figure 21. The three spots visible
for angiotensin II were an unexplained phenomena. Using the same sample and
conditions there would sometimes be only one spot, even when using the purest samples.
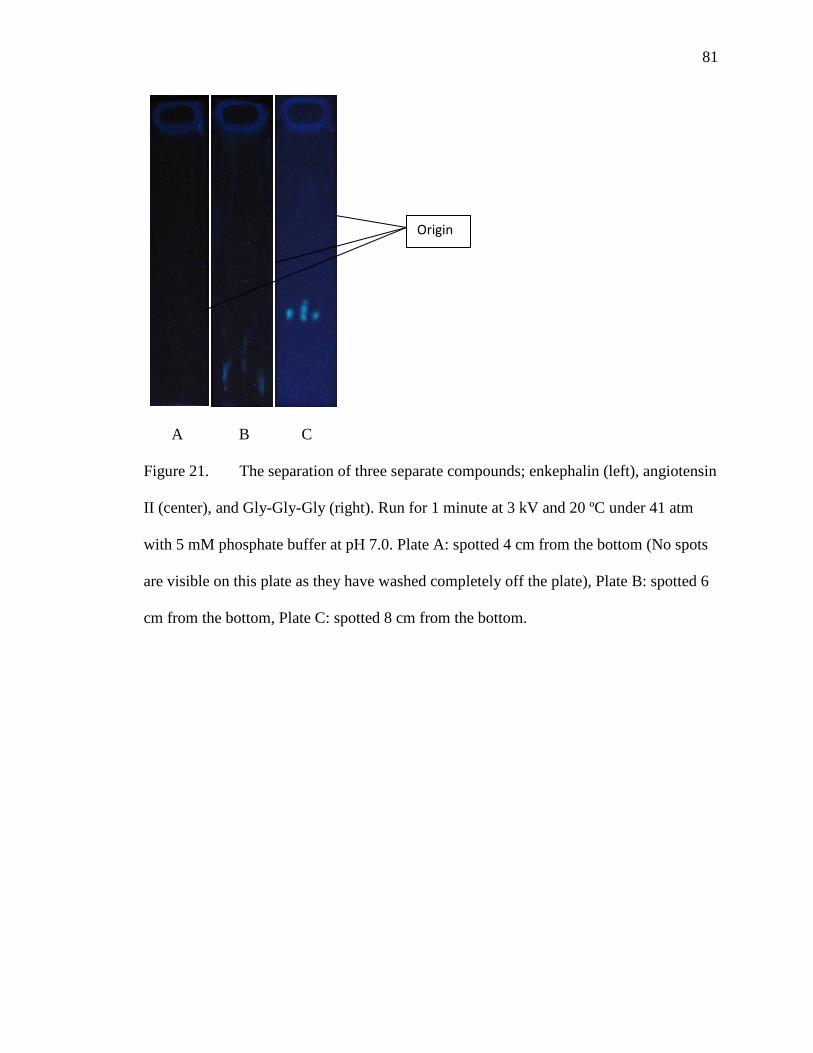
81
A B C
Figure 21. The separation of three separate compounds; enkephalin (left), angiotensin
II (center), and Gly-Gly-Gly (right). Run for 1 minute at 3 kV and 20 ºC under 41 atm
with 5 mM phosphate buffer at pH 7.0. Plate A: spotted 4 cm from the bottom (No spots
are visible on this plate as they have washed completely off the plate), Plate B: spotted 6
cm from the bottom, Plate C: spotted 8 cm from the bottom.
Origin
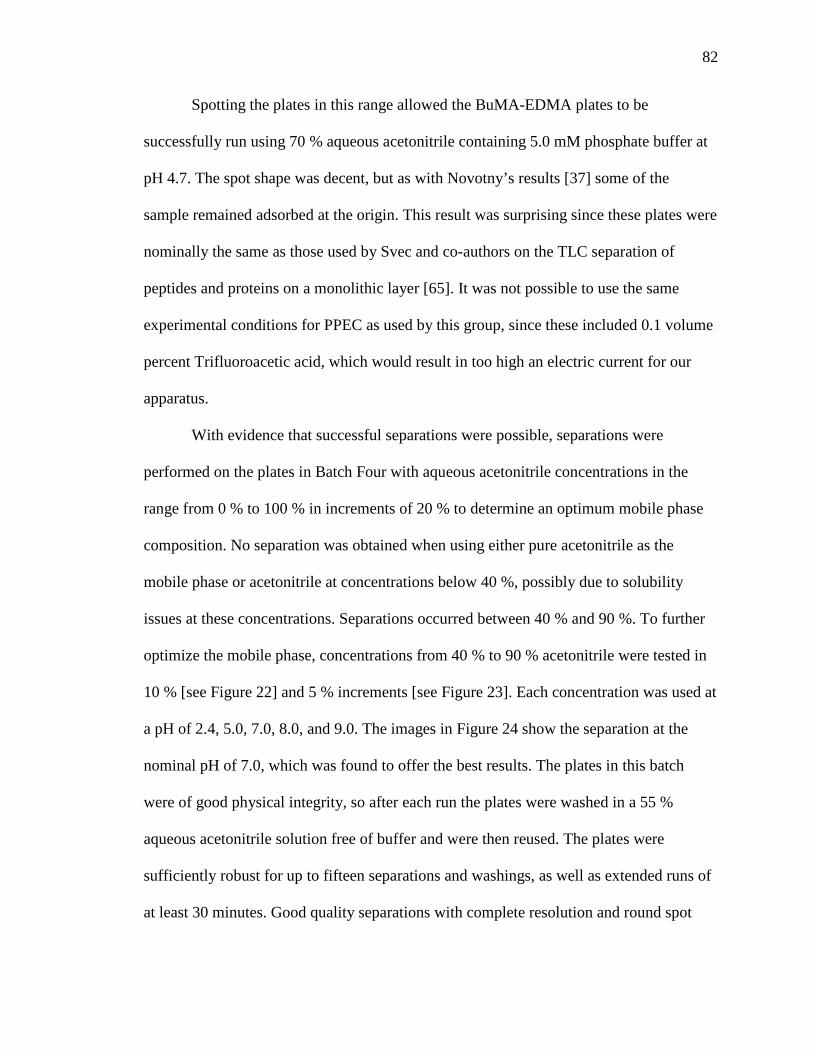
82
Spotting the plates in this range allowed the BuMA-EDMA plates to be
successfully run using 70 % aqueous acetonitrile containing 5.0 mM phosphate buffer at
pH 4.7. The spot shape was decent, but as with Novotny’s results [37] some of the
sample remained adsorbed at the origin. This result was surprising since these plates were
nominally the same as those used by Svec and co-authors on the TLC separation of
peptides and proteins on a monolithic layer [65]. It was not possible to use the same
experimental conditions for PPEC as used by this group, since these included 0.1 volume
percent Trifluoroacetic acid, which would result in too high an electric current for our
apparatus.
With evidence that successful separations were possible, separations were
performed on the plates in Batch Four with aqueous acetonitrile concentrations in the
range from 0 % to 100 % in increments of 20 % to determine an optimum mobile phase
composition. No separation was obtained when using either pure acetonitrile as the
mobile phase or acetonitrile at concentrations below 40 %, possibly due to solubility
issues at these concentrations. Separations occurred between 40 % and 90 %. To further
optimize the mobile phase, concentrations from 40 % to 90 % acetonitrile were tested in
10 % [see Figure 22] and 5 % increments [see Figure 23]. Each concentration was used at
a pH of 2.4, 5.0, 7.0, 8.0, and 9.0. The images in Figure 24 show the separation at the
nominal pH of 7.0, which was found to offer the best results. The plates in this batch
were of good physical integrity, so after each run the plates were washed in a 55 %
aqueous acetonitrile solution free of buffer and were then reused. The plates were
sufficiently robust for up to fifteen separations and washings, as well as extended runs of
at least 30 minutes. Good quality separations with complete resolution and round spot
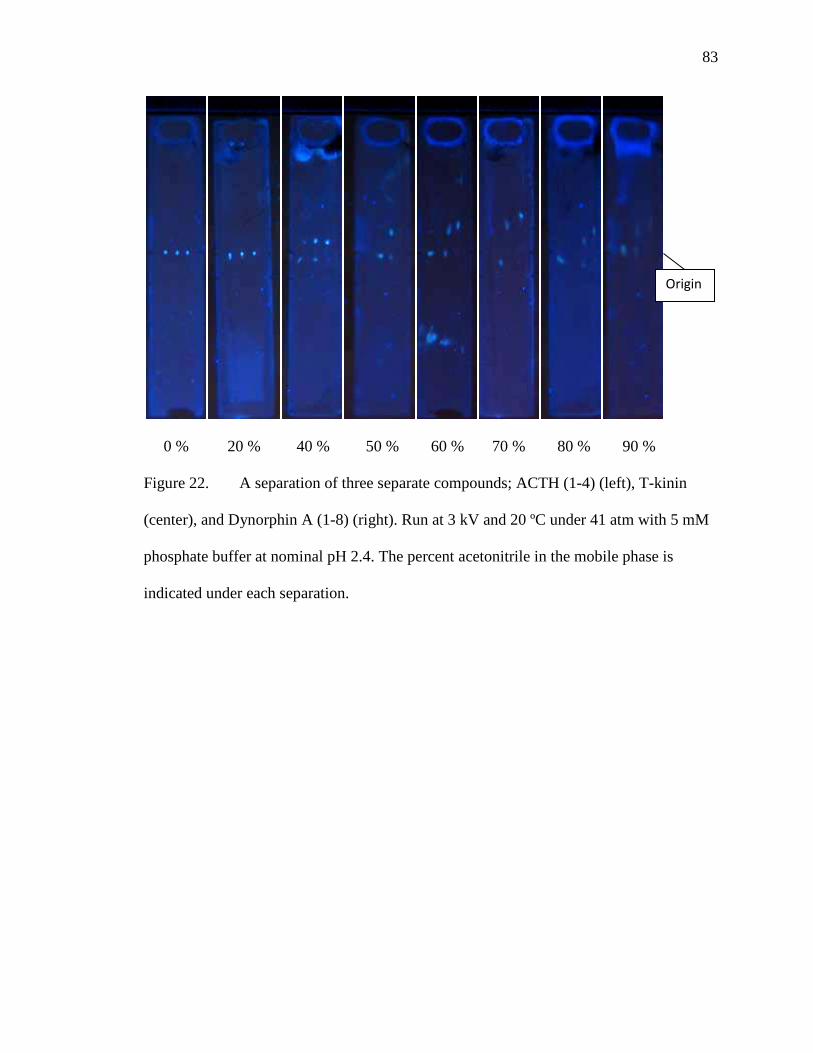
83
0 % 20 % 40 % 50 % 60 % 70 % 80 % 90 %
Figure 22. A separation of three separate compounds; ACTH (1-4) (left), T-kinin
(center), and Dynorphin A (1-8) (right). Run at 3 kV and 20 ºC under 41 atm with 5 mM
phosphate buffer at nominal pH 2.4. The percent acetonitrile in the mobile phase is
indicated under each separation.
Origin
84
Figure 23. a) Plot of peptide migration on neutral superhydrophobic monolith plates
versus aqueous acetonitrile concentration at nominal pH 7.0 using plates from Batch
Two. b) Plot of peptide migration on neutral superhydrophobic monolith plates versus pH
in 70 % aqueous acetonitrile mobile phase using plates from Batch Two.
Migration vs. ACN Concentration
-60
-50
-40
-30
-20
-10
0
10
20
30
40
30 35 40 45 50 55 60 65 70 75 80 85 90 95
% ACN
mm
BradykininDynorphin A (1-8)Dynorphin A (1-7)Chloecystokinin (10-20)OxytocinACTH (1-4)
Migration vs. pH
-60-50-40-30-20-10
010203040
4 6 8 10
pH
mm
BradykininDynorphin A (1-8)Dynorphin A (1-7)Chloecystokinin (10-20)OxytocinACTH (1-4)
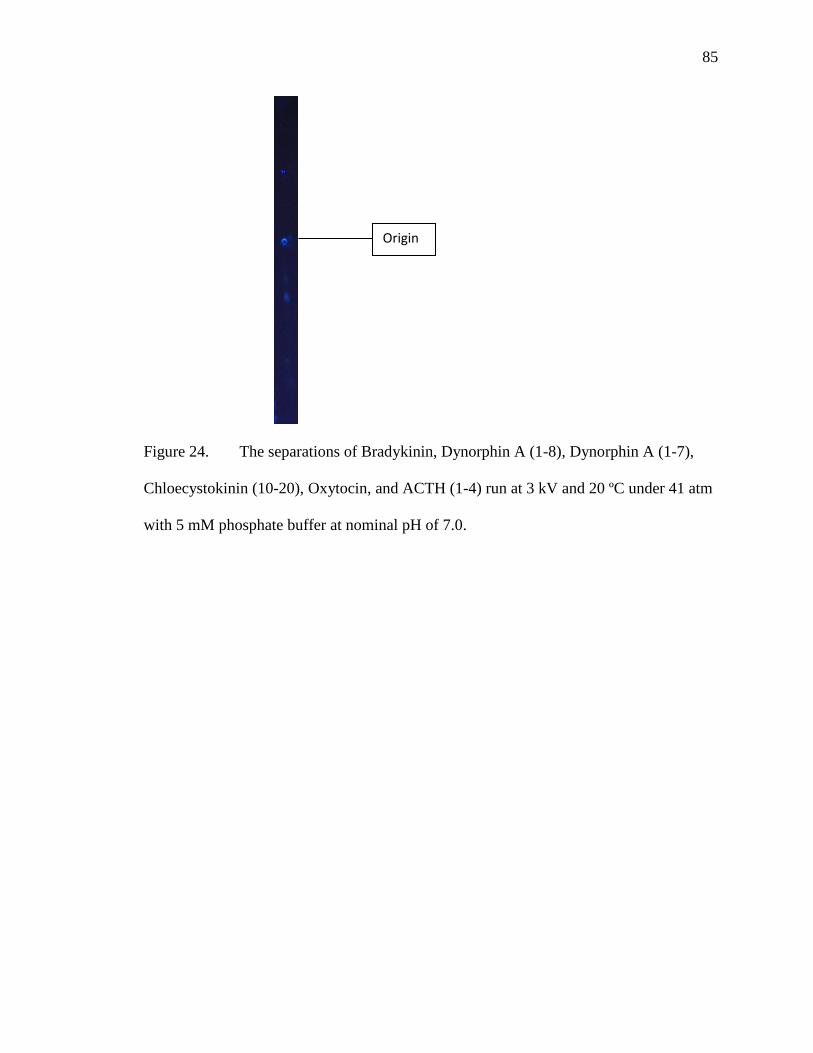
85
Figure 24. The separations of Bradykinin, Dynorphin A (1-8), Dynorphin A (1-7),
Chloecystokinin (10-20), Oxytocin, and ACTH (1-4) run at 3 kV and 20 ºC under 41 atm
with 5 mM phosphate buffer at nominal pH of 7.0.
Origin
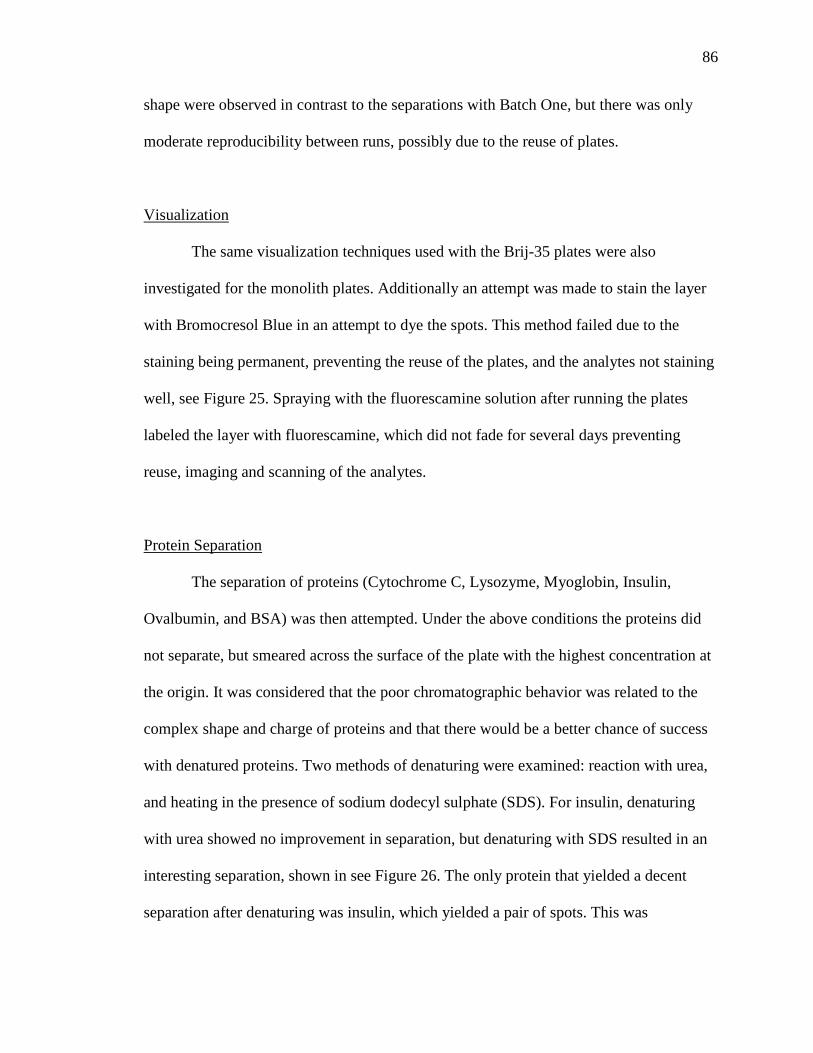
86
shape were observed in contrast to the separations with Batch One, but there was only
moderate reproducibility between runs, possibly due to the reuse of plates.
Visualization
The same visualization techniques used with the Brij-35 plates were also
investigated for the monolith plates. Additionally an attempt was made to stain the layer
with Bromocresol Blue in an attempt to dye the spots. This method failed due to the
staining being permanent, preventing the reuse of the plates, and the analytes not staining
well, see Figure 25. Spraying with the fluorescamine solution after running the plates
labeled the layer with fluorescamine, which did not fade for several days preventing
reuse, imaging and scanning of the analytes.
Protein Separation
The separation of proteins (Cytochrome C, Lysozyme, Myoglobin, Insulin,
Ovalbumin, and BSA) was then attempted. Under the above conditions the proteins did
not separate, but smeared across the surface of the plate with the highest concentration at
the origin. It was considered that the poor chromatographic behavior was related to the
complex shape and charge of proteins and that there would be a better chance of success
with denatured proteins. Two methods of denaturing were examined: reaction with urea,
and heating in the presence of sodium dodecyl sulphate (SDS). For insulin, denaturing
with urea showed no improvement in separation, but denaturing with SDS resulted in an
interesting separation, shown in see Figure 26. The only protein that yielded a decent
separation after denaturing was insulin, which yielded a pair of spots. This was
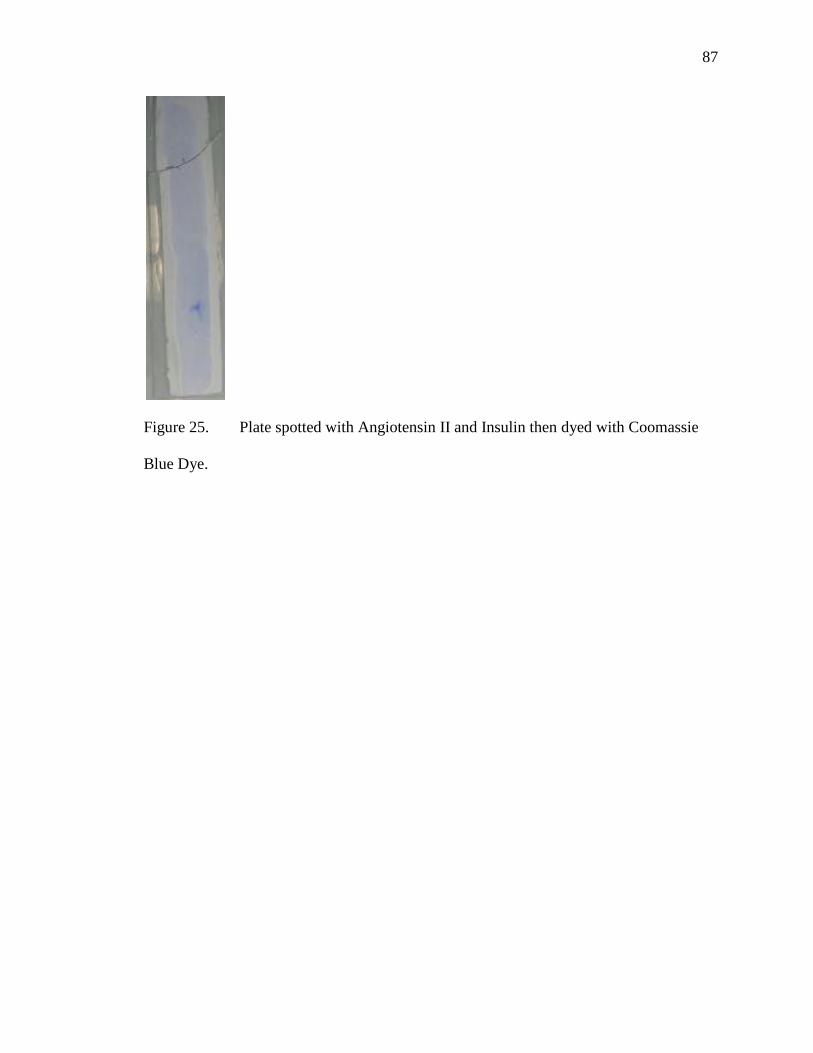
87
Figure 25. Plate spotted with Angiotensin II and Insulin then dyed with Coomassie
Blue Dye.
88
Figure 26. Images of insulin in native form (left) and denatured with SDS (right).
Run in a mobile phase of 70 % acetonitrile with a 5 mM phosphate buffer at nominal pH
7.0 run at 3.0 kV and 41 atm for 2 minutes with the analytes spotted 8 cm from bottom.
Origin
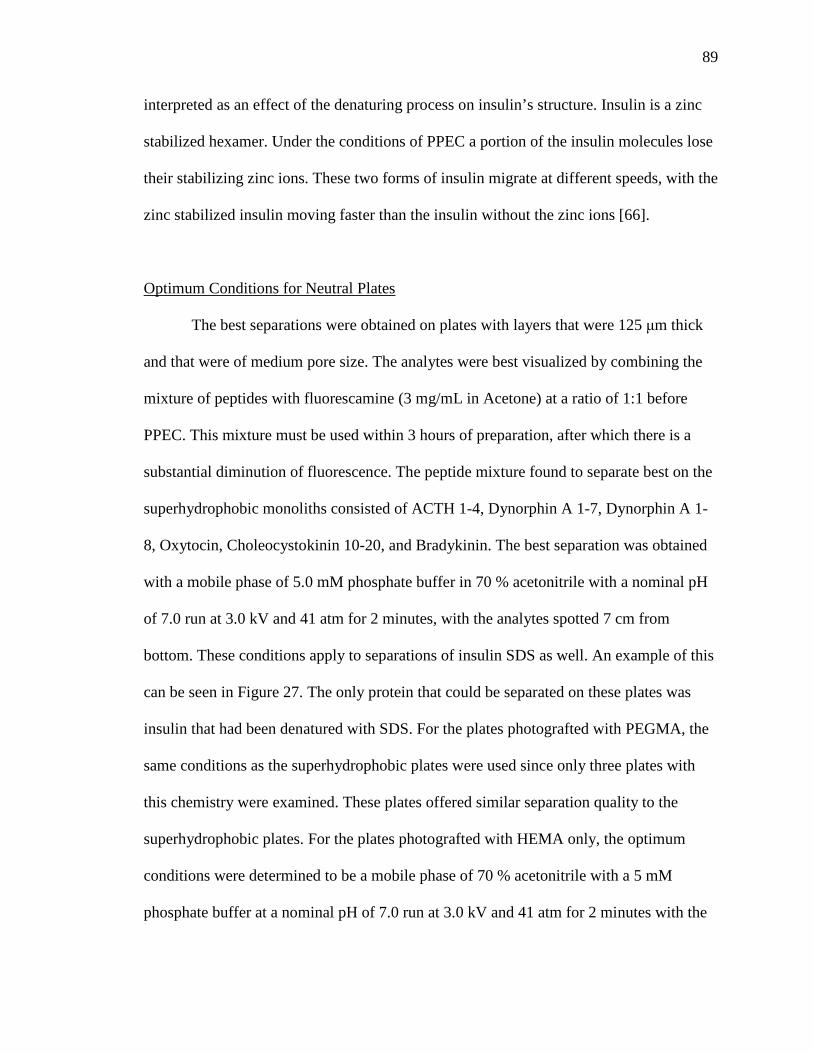
89
interpreted as an effect of the denaturing process on insulin’s structure. Insulin is a zinc
stabilized hexamer. Under the conditions of PPEC a portion of the insulin molecules lose
their stabilizing zinc ions. These two forms of insulin migrate at different speeds, with the
zinc stabilized insulin moving faster than the insulin without the zinc ions [66].
Optimum Conditions for Neutral Plates
The best separations were obtained on plates with layers that were 125 μm thick
and that were of medium pore size. The analytes were best visualized by combining the
mixture of peptides with fluorescamine (3 mg/mL in Acetone) at a ratio of 1:1 before
PPEC. This mixture must be used within 3 hours of preparation, after which there is a
substantial diminution of fluorescence. The peptide mixture found to separate best on the
superhydrophobic monoliths consisted of ACTH 1-4, Dynorphin A 1-7, Dynorphin A 1-
8, Oxytocin, Choleocystokinin 10-20, and Bradykinin. The best separation was obtained
with a mobile phase of 5.0 mM phosphate buffer in 70 % acetonitrile with a nominal pH
of 7.0 run at 3.0 kV and 41 atm for 2 minutes, with the analytes spotted 7 cm from
bottom. These conditions apply to separations of insulin SDS as well. An example of this
can be seen in Figure 27. The only protein that could be separated on these plates was
insulin that had been denatured with SDS. For the plates photografted with PEGMA, the
same conditions as the superhydrophobic plates were used since only three plates with
this chemistry were examined. These plates offered similar separation quality to the
superhydrophobic plates. For the plates photografted with HEMA only, the optimum
conditions were determined to be a mobile phase of 70 % acetonitrile with a 5 mM
phosphate buffer at a nominal pH of 7.0 run at 3.0 kV and 41 atm for 2 minutes with the
90
A B
Figure 27. Images of peptides in order from bottom to top A. (ACTH (1-4),
Oxytocin, Choleocystokinin (10-20), Dynorphin A (1-7)), Dynorphin A (1-8), and
Bradykinin) B. (Osteocalcin (45-49), ACTH (1-10), Levitide, T-kinin, Neurotensin, and
Substance P) on superhydrophobic neutral layers. Conditions: Run buffer 80 % (A) or 70
% acetonitrile (B) in 5 mmol/L phosphate buffer at a nominal pH of 7.0; applied pressure
4.1 MPa; voltage 3 kV. Reproduced with permission from reference 67.
Origin Origin
91
analytes spotted 8 cm from bottom. These separation conditions produced complete
separation, with good spot shape, of a mixture of six peptides.
PPEC Separations on Charged Monoliths
Two different types of charged monoliths were used for the PPEC separation of
peptides and proteins. These were an anionic charged monolith with the functionality 2-
acrylamido-2-methyl-1-propanesulfonic acid (AMPS) and a cationic charged monolith
with the functionality [2-(Methacryloyloxy) ethyl] trimethylammonium chloride
(META). These two functionalities are photografted onto superhydrophobic monoliths.
These charged layers support EOF, and for this reason the regular holder could be used,
as the layers do not become dry during a separation.
Initial experiments with plates, where only a charged species was grafted, yielded
no separation and terrible smearing. The Svec group [68] found that the concentration of
the sulfonate groups needed to be decreased in the monolith layer by the addition of 2-
hydroxyethyl methacrylate (HEMA) groups. This was achieved by changing the
composition of the grafting solution to contain 2 % charged species 13 % HEMA.
Migration of peptides was achieved on the AMPS grafted plates but not on the META
grafted plates when using a mobile phase consisting of 70 % aqueous acetonitrile
containing 5 mM phosphate buffer at nominal pH 4.7. Other acetonitrile concentrations
from 0 % to 90 % and nominal pH values from 2 to 9 were tried for the META plates
with no success.
In order to optimize the separation AMPS plates was initially run with a series of
aqueous acetonitrile mobile phases with concentrations from 40 % to 80 %. The 70 %
92
acetonitrile concentration yielded the best separation and this concentration was then
used at a nominal pH of 2.4, 5.0, 7.0, 8.0, and 9.0. The best separations were found using
a mobile phase of 70 % aqueous acetonitrile with a nominal pH of 4.7 run at 6.0 kV and
41 atm for one minute. After each run the plates were washed in a 55 % aqueous
acetonitrile solution free of buffer and could then be reused. The plates were sufficiently
stable for between four to seven repeated run and washing cycles. Good separations were
observed, but there was poor reproducibility from plate to plate or even on the same plate
that had been washed and reused, see Figure 28. For this reason, the conclusions in the
following paragraph should be treated as tentative.
Optimum Conditions for Charged Plates
Based on these experiments and the experiments conducted on the neutral plates,
it was determined that the best plates had layers that were 125 um thick with medium
pore size and treated with fluorescamine as described in the visualization section. For the
2 % AMPS plates the optimum conditions were determined to be a mobile phase of 70 %
acetonitrile with a nominal pH of 4.7 run at 6.0 kV and 41 atm for 1 minute with the
analytes spotted 6 cm from bottom. An example of this can be seen in Figure 29.
In this thesis we have demonstrated the first use of monoliths in PPEC. These
plates can be used for separating peptides but have not been able to separate proteins,
apart from SDS insulin. The separations are fast, but reproducibility needs to be
improved.
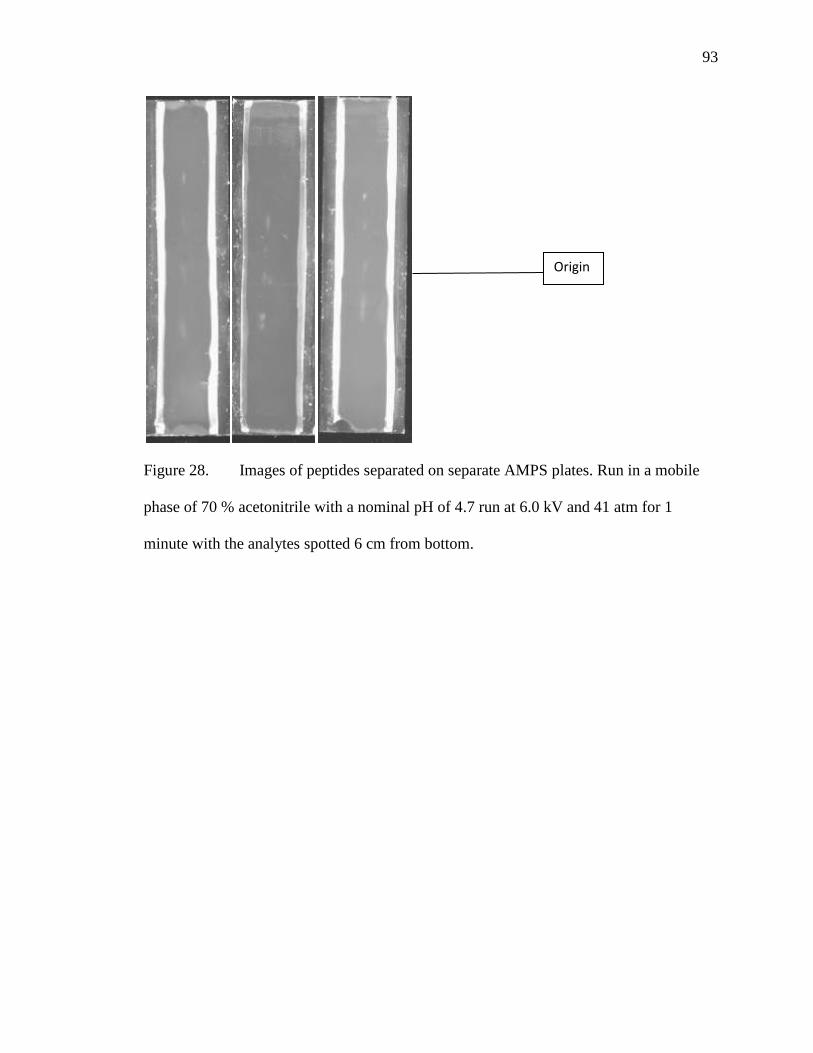
93
Figure 28. Images of peptides separated on separate AMPS plates. Run in a mobile
phase of 70 % acetonitrile with a nominal pH of 4.7 run at 6.0 kV and 41 atm for 1
minute with the analytes spotted 6 cm from bottom.
Origin
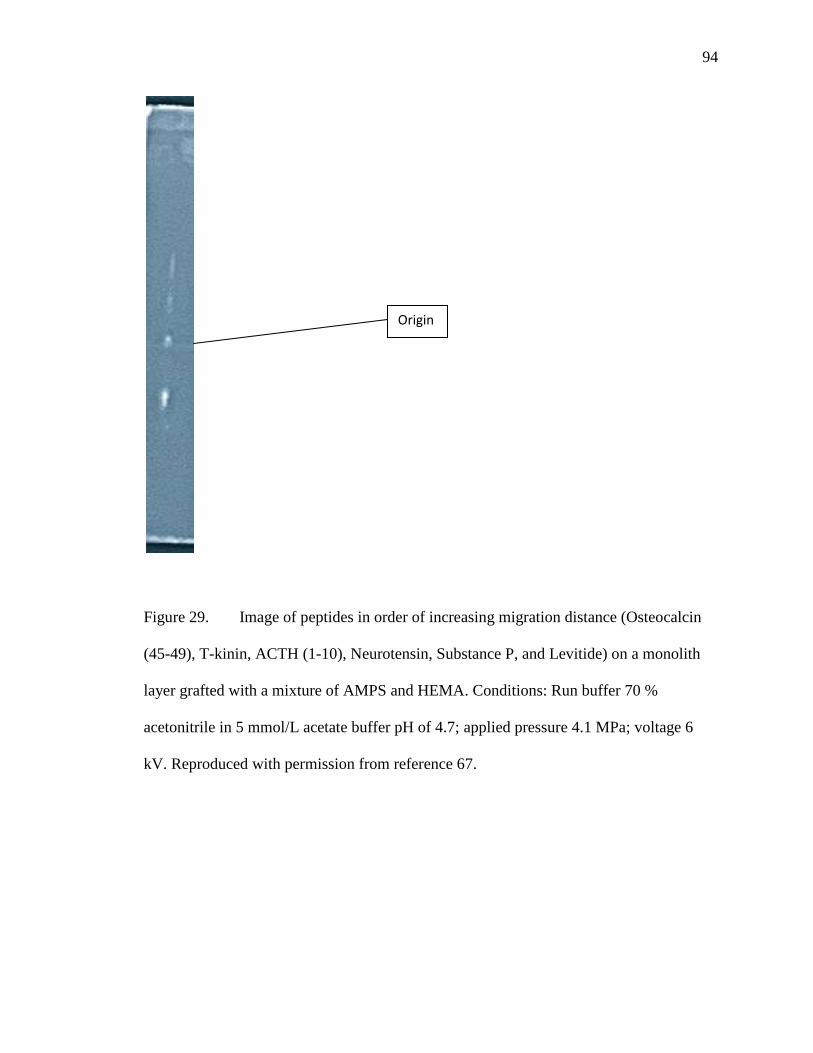
94
Figure 29. Image of peptides in order of increasing migration distance (Osteocalcin
(45-49), T-kinin, ACTH (1-10), Neurotensin, Substance P, and Levitide) on a monolith
layer grafted with a mixture of AMPS and HEMA. Conditions: Run buffer 70 %
acetonitrile in 5 mmol/L acetate buffer pH of 4.7; applied pressure 4.1 MPa; voltage 6
kV. Reproduced with permission from reference 67.
Origin
95
CONCLUSIONS
The thesis demonstrated the feasibility of using PPEC for separating steroids on
conventional bonded C18 sorbent layers, and of separating peptides on either bonded C18
sorbent layers impregnated with Brij -35, a non-ionic surfactant, or on monolithic sorbent
layers.
The steroid study demonstrated that for the three C18 sorbent layers used, speed
and separation quality were inversely related to the particle size of the sorbent layer. On
the Superspher layer six steroids could be completely separated in three minutes with a
chromatographic efficiency of over 100,000 plates per meter, whereas the other two
layers yielded substantially poorer separations. The fact that separation speed does not
diminish with particle size is a very attractive feature of PPEC, because chromatographic
efficiency is inversely related to particle size.
The Brij-35 impregnated plates demonstrated a method of separating peptides that
should be accessible to any laboratory. This is important, as there are very few reports of
successful peptide separations by conventional planar chromatography. The quality of
separation is very dependent on the following variables: soak concentration, soak
duration, pH of mobile phase, mobile phase concentration, bake temperature, bake
duration, run temperature, and pressure. It is possible to separate six peptides in eight
96
minutes on a Brij-35 impregnated sorbent. The method is extremely sensitive to the
variables noted above, and further work is needed in order to standardize the method.
The monolithic plates yielded rapid and efficient separations of peptides, with a
complete separation of six peptides in one minute on a negatively charged layer by
conventional PPEC, and in two minutes on a neutral layer by electrophoresis under
pressure. The thickness of the monolithic layer is an important variable, and the best
separations were on layers that were 125 μm thick with a medium pore size. An attractive
feature of the 125 μm layers is that these could be washed after a separation and then
reused. There was unfortunately considerable batch-to-batch variation in the plates, and
the preparation of the plates needs to be further standardized.
An attempt to use a negative temperature gradient to improve separation quality
was also investigated but was not successful. It was demonstrated that a suitable gradient
could be imposed on the surface of the specially constructed die blocks. Using these die
blocks, however, did not result in the desired improvement in separation, possibly due to
Joule heating overriding the gradient.

REFERENCES
97
REFERENCES
1. Kirchner, J. G. Thin-Layer Chromatography, 2nd Ed., Wiley, New York, 1978. 2. Guichon, G.; Siouffi, A. J. Chromatogr. Sci. 1978, 16, 598. 3. Botz, L.; Nagy, S.; Kocsis, B. In Planar Chromatography: A Retrospective View
for the Third Millennium, Nyiredy, Sz., Ed.; Springer Scientific, Budapest, Hungary, 2001.
4. Jork, H.; Funk, W.; Fischer, W.; Wimmer, H. Thin-Layer Chromatography Reagents and Detection Methods, VCH, Weinheim, 1990.
5. Dammertz, W.; Reich, E. In Planar Chromatography: A Retrospective View of the Third Millennium, Nyiredy, Sz., Ed.; Springer Scientific, Budapest, Hungary, 2001.
6. Zlatkis, A.; Kaiser, R. E. HPTLC, high performance thin-Layer chromatography, Elsevier Scientific Publishing Company, Amsterdam, 1977.
7. Ebel, S. In Planar Chromatography: A Retrospective View of the Third Millennium, Nyiredy, Sz., Ed.; Springer Scientific, Budapest, Hungary, 2001.
8. Tyihak, E.; Mincsovics, E. In Planar Chromatography: A Retrospective View of the Third Millennium, Nyiredy, Sz., Ed.; Springer Scientific, Budapest, Hungary, 2001.
9. Nyiredy, Sz. In Planar Chromatography: A Retrospective View of the Third Millennium, Nyiredy, Sz., Ed.; Springer Scientific, Budapest, Hungary, 2001.
10. Vervoort, N.; Clicq, D.; Baron, G. V.; Desmet, G. J. Chromatog. A 2003, 987, 39. 11. SciFinder. December 2010. American Chemical Society. 8 November 2010 <
https://scifinder.cas.org>. 12. Pretorius, V.; Hopkins, B. J.; Schieke, J. D. J. Chromatog. A 1974, 99, 23. 13. Nurok, D.; Frost, M. C.; Pritchard, C. L.; Chenoweth, D. M. J Chromatogr. 1998,
11, 244. 14. Howard, A. G.; Shafik, T.; Moffatt, F.; Wilson, I. D. J. Chromatogr. A 2000, 903,
211. 15. Nurok, D.; Frost, M. C.; Chenoweth, D. M. J. Chromatogr. A 2000, 903, 211. 16. Nurok, D.; Koers, J. M.; Nyman, D. A.; Liao, W.-M. J. Planar Chromatogr. 2001,
14, 409. 17. Nurok, D.; Koers, J. M.; Carmichael, M. A.; Dzido, T. H. J. Chromatogr. 2003, 15,
320. 18. Dzido, T. H.; Majewski, R.; Polak, B.; Golkiewicz, W.; Soczewinski, E. J. Planar
Chromatog. 2003, 16, 176. 19. Pukl, M.; Prosek, M.; Kaiser, R. E. Chromatographia 1994, 38, 83. 20. Malinowska, I.; Rozylo, J. K. J. Planar Chromatogr. 1998, 11, 411. 21. Malinowska, I. J. Planar Chromatogr. 1999, 12, 408.
98
22. Malinowska, I. J. Planar Chromatogr. 2000, 13, 307. 23. Malinowska, I. Acta Chromatographica 2001, 11, 204. 24. Malinowska, I.; Rozylo, J. K. J. Planar Chromatogr. 2002, 15, 418. 25. Consden, R.; Gordon, A. H.; Martin, A. J. P. J. Biochem. 1946, 40, 33. 26. Poole, C. F.; Wilson, I. D. J. Planar Chromatogr.1997, 10, 332. 27. Nurok, D.; Koers, J. M.; Carmichael, M. A. J. Chromatogr. A 2003, 983, 247. 28. Dzido, T. H.; Majewski, R. International Symposium on Planar Separations,
Budapest, 2003, 129. 29. Nurok, D.; Novotny, A. L.; Santini, R. E.; Replogle, R. W.; Hawkins, G. L. Anal.
Chem. 2006, 78, 2823-2831. 30. Novotny, A. L. Ph. D. Thesis, Purdue University, Indianapolis, IN, 2008. 31. Chomicki, A.; Kloc, K.; Dzido, T. H. J. Planar Chromatogr. Modern TLC, 2011,
24, 6-9. 32. Braithwaite, A.; Smith, F. J. Chromatographic Methods, 5th Ed. Springer, New
York, 1996. 33. Markowski, W. In Encyclopedia of Chromatography, 2004 Update Supplement,
Cazes, J., Ed.; Marcel Dekker, New York, New York, 2004. 34. Poole, C. F.; Poole, S. K. J. Chromatogr. A 1995, 703, 573. 35. Choudhary, G.; Horvath, C. J. Chromatogr. A 1997, 781, 161-183. 36. Crego, A. L.; Martinez, J.; Marina, M. L. J. Chromatogr. A 2000, 869, 329-337. 37. Banholczer, A.; Pyell, U. J. Chromatogr. A 2000, 869, 363-374. 38. Knox, J. H.; Grant, I. H. Chromatographia 1987, 24, 135-143. 39. Nurok, D.; Koers, J.; Novotny, A.; Carmichael, M. A.; Kosiba, J.; Santini, R. E.;
Hawkins, G. L.; Replogle, R. W. Anal. Chem. 2004, 76, 1690-1695. 40. Wan, Q.-H. Anal. Chem. 1997, 69, 361-363. 41. Wan, Q.-H. J. Chromatogr. A 1997, 782, 181-189. 42. Svec, F.; Huber, C. G. Anal. Chem. 2006, 78, 2101-2107. 43. Svec, F.; Peters, E. C.; Sykora, D.; Frechet, J. M. J. J. Chromatogr. 2000, 887,3-29. 44. Hilder, E. F.; Svec, F.; Frechet, J. M. J. J. Chromatogr. 2004, 1044, 3-22. 45. NIDA InfoFacts: Steroids (Anabolic-Androgenic). July 2009. National Institute on
Drug Abuse. 13 September 2009 < http://www.drugabuse.gov/infofacts/steroids.html>.
46. Imoto, T.; Yamada, H. Molecular and Cellular Biochemistry. 2004, 51, 111-121. 47. Judd, R. The Protein Protocols Handbook. 2002, Part II. 73-79. 48. Gonzalez de Llano, D.; Herriaz, T.; Polo, C. As referenced in: Nollet, L. M. L.
Handbook of food analysis, 2nd Ed., Marcel Dekker, New York, 2004, 125-166. 49. Pasilis, S. P.; Kertesz, V.; Van Berkel, G. J.; Schulz, M.; Schorcht, S. J. Mass
Spectrom., 2008, 43, 1627-1635. 50. Pasilis, S. P.; Kertesz, V.; Van Berkel, G. J.; Schulz, M.; Schorcht, S. Anal.
Bioanal. Chem., 2008, 391, 317-324. 51. Jiang, Z.; Smith, N.; Ferguson, P.; Taylor, M. J. Sep. Sci., 2008, 31, 2774-2783. 52. Lammerhofer, M.; Lindner, W. As referenced in: Svec, F.; Tennikova, T.; Deyl, Z.
Monolithic materials: Preperations, Properties and Applications, Elsevier Science b. V., Amsterdam, The Netherlands, 2003, 489-559.
53. Wang, B. MS Thesis, Georgia State University, Atlanta, GA, 2009.
99
54. Liu, B.; Liu, L.; Chen, H.; Cheng, J. Analytica Chimica Acta. 2001, 434, 309-313. 55. Towns, J. K.; Regnier, F. E. Anal. Chem. 1991, 63, 1126-1132. 56. Walhagen, K.; Unger, K. K.; Hearn, M. T. W. Anal. Chem. 2001, 73, 4924. 57. Szumski, M.; Buszewski, B. J. Sep. Sci. 2007, 30, 55-66. 58. Ericson, C.; Liao, J. L.; Nakazato, K.; Hjerten, S. J. Chromatogr. 1997, 767, 33. 59. Palm, A.; Novotny, M. V. Anal. Chem. 1997, 69, 4499. 60. Bandilla, D.; Skinner, C. D. J. Chromatogr. 2003, 1004, 167-179. 61. Bedair, M.; El Rassi, Z. J. Chromatogr. 2003, 1013, 47-56. 62. Ericson, C.; Hjerten, S. Anal. Chem. 1999, 71, 1621. 63. Josic, D.; Clifton, J. G. J. Chromatogr. 2007, 1144, 2-13. 64. Mistry, K.; Krull, I.; Grinberg, N. J. Sep. Sci. 2002, 25, 935-958. 65. Bakry, R.; Bonn, G. K.; Mair, D.; Svec, F. Anal. Chem. 2007, 79, 486-493. 66. Tantipolphan, R.; Romeijn, S.; Engelsman, J.; Torosantucci, R.; Rasmussen, T.;
Jiskoot, W. Journal of Pharmaceutical and Biomedical Analysis 2010, 52, 195-202. 67. Woodward, S. D.; Urbanova, I.; Nurok, D.; Svec, F. Anal. Chem. 2010, 82, 3445-
3448. 68. Han, Y.; Levkin, P.; Abarientos, I.; Liu, H.; Svec, F.; Frechet, J. M. J. Anal. Chem.
2010, 82, 2520-2528.