Embed Size (px)
Citation preview

Graduate School ETD Form 9 (Revised 12/07)
PURDUE UNIVERSITY GRADUATE SCHOOL
Thesis/Dissertation Acceptance
This is to certify that the thesis/dissertation prepared
By
Entitled
For the degree of
Is approved by the final examining committee:
Chair
To the best of my knowledge and as understood by the student in the Research Integrity and Copyright Disclaimer (Graduate School Form 20), this thesis/dissertation adheres to the provisions of Purdue University’s “Policy on Integrity in Research” and the use of copyrighted material.
Approved by Major Professor(s): ____________________________________
____________________________________
Approved by: Head of the Graduate Program Date
Lindsey R. Crawley
NITROGEN AND OXYGEN ISOTOPE-RATIO ANALYSIS OF NITRATE BY THEDENITRIFIER METHOD USING CONTINUOUS FLOW ISOTOPE-RATIO MASSSPECTROMETRY
Master of Science
Greg Michalski
Paul B. Shepson
Timothy Filley
Greg Michalski
R. E. Wild 10/11/2010

Graduate School Form 20 (Revised 10/07)
PURDUE UNIVERSITY GRADUATE SCHOOL
Research Integrity and Copyright Disclaimer
Title of Thesis/Dissertation:
For the degree of ________________________________________________________________
I certify that in the preparation of this thesis, I have observed the provisions of Purdue University Executive Memorandum No. C-22, September 6, 1991, Policy on Integrity in Research.*
Further, I certify that this work is free of plagiarism and all materials appearing in this thesis/dissertation have been properly quoted and attributed.
I certify that all copyrighted material incorporated into this thesis/dissertation is in compliance with the United States’ copyright law and that I have received written permission from the copyright owners for my use of their work, which is beyond the scope of the law. I agree to indemnify and save harmless Purdue University from any and all claims that may be asserted or that may arise from any copyright violation.
________________________________Signature of Candidate
________________________________Date
*Located at http://www.purdue.edu/policies/pages/teach_res_outreach/c_22.html
NITROGEN AND OXYGEN ISOTOPE-RATIO ANALYSIS OF NITRATE BY THE DENITRIFIER METHOD USING CONTINUOUS FLOW ISOTOPE-RATIO MASS SPECTROMETRY
Master of Science
10/13/2010
Lindsey R. Crawley

NITROGEN AND OXYGEN ISOTOPE-RATIO ANALYSIS OF NITRATE BY THE
DENITRIFIER METHOD USING CONTINUOUS FLOW ISOTOPE-RATIO MASS
SPECTROMETRY
A Thesis
Submitted to the Faculty
of
Purdue University
by
Lindsey R. Crawley
In Partial Fulfillment of the
Requirements for the Degree
of
Master of Science
Purdue University
West Lafayette, Indiana
bbbDecember, 2010

ii
To my parents & my husband
for giving me all of the love and support one could ever need.

iii
ACKNOWLEDGMENTS
I am forever grateful to my supervisor, Dr. Greg Michalski, whose
encouragement, guidance, support and patience from the initial to the final level
enabled me to develop an understanding of the subject.
I would like to express my great respect for all of those who supported me
in any respect during the completion of this project, including, but not limited to
my committee members Drs. Paul Shepson and Tim Filley and faculty member
Dr. Gabriel Bowen, for their valuable insight and discussion.
In addition, I would like to thank Sergey Oleynik for access to his years of
laboratory experience and his patience while allowing me to learn from him.
I offer my regards and blessings to my fellow lab mates and other Purdue
Stable Isotope group members.
And finally, I would like to thank my family & friends for all of their
encouragement and support given to me throughout the years.
Lindsey

iv
TABLE OF CONTENTS
Page LIST OF TABLES ................................................................................................. vi
LIST OF FIGURES .............................................................................................. vii
ABBREVIATIONS................................................................................................. xi
ABSTRACT .......................................................................................................... xi
CHAPTER 1: INTRODUCTION ............................................................................ 1
1.1 Nitrate and the Nitrogen Cycle .................................................................... 1
1.2 Stable Isotopes of Nitrogen and Oxygen .................................................... 2 1.2.1 Isotopes in Nitrate ................................................................................ 2 1.2.2 Tracing Sources and Cycling of N and O Using Stable Isotopes ......... 3 ���������1.2.3 �15N and �18O in the Nitrogen Cycle .................................................... 6 1.2.4 Denitrification in the Nitrogen Cycle ................................................... 11 CHAPTER 2: NITROGEN AND OXYGEN ISOTOPE-RATIO ANALYSIS OF NITRATE BY THE DENITRIFIER METHOD USING CONTINUOUS FLOW ISOTOPE-RATIO MASS SPECTROMETRY...................................................... 14 2.1 Experimental Section ................................................................................. 14 2.1.1 Denitrifier Strain ................................................................................. 15 2.1.2 Conversion of Sample to Nitrous Oxide ............................................. 17 2.1.3 Extraction and Isotopic Analysis of Nitrous Oxide.............................. 19 2.1.4. Isotopic References/Standardization ................................................ 26 2.2 Results and Discussion ............................................................................. 31 2.2.1 Precision Limits of the Mass Spectrometer ........................................ 32 2.2.2 Introducing a Secondary Source of N2O for Analysis: Headspace Extraction................................................................................ 35 2.2.3 Blank Signal ....................................................................................... 37 2.2.4 Blank from Bacterial Growth and Preparation .................................... 38 2.2.5 Sample Conversion ........................................................................... 42

v
Page 2.2.6 Results of Standard Analyses ............................................................ 43 2.2.7 Background Signal............................................................................. 47 2.2.8 Impact of pH and Pre-Concentration on �15N and �18O ..................... 50 2.2.9 �15N and �18O Analyses of Precipitation Samples ............................. 56 2.3 Conclusion ................................................................................................ 57
LIST OF REFERENCES .................................................................................... 59
APPENDICES Appendix A: Tables of Related Data ............................................................. 63 Appendix B: Studies of Bacillus Halodenitrificans as a Potential Substitute for Pseudomonas Aureofaciens Using the Denitrifier Method ....................... 71 Appendix C: Studies of Δ17O of O2 Generated from Gold Disproportionation of N2O from P. Aureofaciens ........................................................................ 73
Appendix D: Nitrogen and Oxygen Isotope-ratio Analysis of Nitrate by the Denitrifier Method Using Continuous Flow Isotope-ratio Mass Spectrometry. 75
vi
LIST OF TABLES
Table Page Table 1.1: Global production and distribution rates of reactive nitrogen ............... 8 Table 2.1: Abundances of N2O isotopes and isotopologues ............................... 26
Table 2.2: N and O Isotopic Ratios for References and Standards Used .......... 30 Table 2.3: Example of typical isotopic values (‰) for calibrated standards ... 30,45
Appendix Table
Table A.1: 100ppm N2O standard deviation <1 .................................................. 63
Table A.2: Water blanks before helium purging .................................................. 64 Table A.3: Water blanks after helium purging ..................................................... 65 Table A.4: Peak areas and standard deviations before and after sitting overnight under helium headspace ..................................................................... 65 Table A.5: Example nitrate standard analysis results ......................................... 67 Table A.6: Example of good standard run for isotopic value correction .............. 67 Table A.7: Successful IC separation of NO3- ...................................................... 68 Table A.8: Hong Kong rainwater δ15N and δ18O analysis ................................... 68

vii
LIST OF FIGURES
Figure Page Figure 1.1: Nitrogen Cycle .................................................................................... 1 Figure 1.2: Ranges of �15N values of some major sources of N ........................... 9 Figure 1.3: Typical ranges of �18O and �15N of nitrate from various source… .... 12 Figure 1.4: �15N values of residual nitrate and product nitrogen as a function of reaction time from denitrification…………………………….................................. 13 Figure 2.1: Autosampler needle extracting gas from sample vial. ...................... 20 Figure 2.2: IRMS off-line extraction system ………………… .............................. 22 Figure 2.3: Inject 2-3 configuration. .................................................................... 24 Figure 2.4: Load 1-2 configuration ...................................................................... 24 Figure 2.5: Example of a typical calibration curve .............................................. 31 Figure 2.6: Open split tube ................................................................................. 32 Figure 2.7: Schematic of an isotope-ratio mass spectrometer with triple collector cup system ......................................................................................................... 33 Figure 2.8: N2O reference gas “on-off” test ......................................................... 34 Figure 2.9: 100ppm N2O peak preceded by reference peaks ............................. 36 Figure 2.10: Blank size of P.Aur. and water versus helium purging time ............ 39 Figure 2.11: Peak areas of bacterial blanks from different scenarios ................. 41

viii
Figure Page Figure 2.12: Rayleigh plot based on inoculation time of N2O by P. Aureofaciens....................................................................................................... 42 Figure 2.13: Example chromatograph of 20Hoff nitrate standard ....................... 44 Figure 2.14: Change in �18O when nitrate concentration increases .................... 45 Figure 2.15: �18O and �15N of example standard analysis .................................. 46 Figure 2.16: Stable Backgrounds Give Isotopic Values with Low Standard Deviations ........................................................................................................... 48 Figure 2.17: Unstable Backgrounds Produce Unreliable Isotopic Value ............. 48 Figure 2.18: High, unstable background levels when the GC column is baked prior to each batch of sample analyses .............................................................. 49 Figure 2.19: Figure 8: Reduced background levels with the addition of a -80�C Coldtrap .............................................................................................................. 49 Figure 2.20: Low, stable backgrounds as a result of backing out the GC column during each sample vial analysis and using the -80�C coldtrap .......................... 50 Figure 2.21: Peak area versus pH ...................................................................... 52 Figure 2.22: �15N of N2O versus pH of nitrate solutions evaporated to dryness . 52 Figure 2.23: �18O of N2O versus pH of nitrate solutions evaporated to dryness . 53 Figure 2.24: Peak area after pre-concentration of nitrate standards................... 54 Figure 2.25: Ion chromatography used to separate NO3
- from other anions ....... 55 Figure 2.26: �18O of nitrate in Hong Kong rainwater ........................................... 57 Figure 2.27: �15N of nitrate in Hong Kong rainwater ........................................... 57

ix
Appendix Figure Page Figure B.1: Bacillus Halodenitrificans as a potential substitute in the denitrifier method ............................................................................................................... 71 Figure C.1: �17O values of N2 and O2 generated by the disproportionation of bacterial produced N2O ...................................................................................... 74

x
ABBREVIATIONS
CF-IRMS = Continuous Flow Isotope-ratio Mass Spectrometer
Delta, � = [(Rx-Rref)/Rref]*1000‰
EA = Elemental Analyzer
GC = Gas Chromatograph
IRMS= Isotope-ratio Mass Spectrometer
LN2= Liquid Nitrogen
MS = Mass Spectrometer
Per mil, ‰ = 1/1000th
RT= Room Temperature
SOP = Standard Operating Procedure
TSA = Tryptic Soy Agar
TSB = Tryptic Soy Broth
VSMOW = Vienna Standard Mean Ocean Water

xi
ABSTRACT
Crawley, Lindsey R., M.S., Purdue University, December 2010. Nitrogen and Oxygen Isotope-ratio Analysis of Nitrate by the Denitrifier Method Using Continuous Flow Isotope-ratio Mass Spectrometry. Major Professor: Greg Michalski. The total isotopic composition of nitrate is used for identifying the origin
and fate of nitrate in atmospheric, terrestrial and aquatic systems. The analysis of
δ18O and δ15N values each give important and unique information about the
sources and sinks of nitrate in these systems. This denitrifier method is based on
the isotope ratio analysis of nitrous oxide generated through reduction of nitrate
by cultured denitrifying bacteria. Here, preliminary data is presented on δ15N and
δ18O generated by the bacterial production of N2O from NO3-.
During the process of denitrification, nitrates are converted to nitrogen gas
via a series of intermediate gaseous nitrogen oxide compounds. Denitrification
occurs due to the presence of heterotrophic bacteria or autotrophic denitrifier
pathways in select bacteria. Thus, we have chosen a distinct bacterium for the
investigation of nitrate reduction for this study. Pseudomonas aureofaciens
contains the copper-containing nitrite reductase necessary for the reduction of
nitrate. Our efforts focus on the conversion of NO3 to N2O using techniques
adapted from Cascotti22. In this study, a customized headspace extraction
system was built in order to analyze δ18O and δ15N of N2O from NO3-. Successful
purification of Pseudomonas aureofaciens, conversion of NO3- to N2O, and the
standardization of nitrate was the result of many experiments. Tests of the impact
on isotopic composition by pre-concentration methods have been performed
including freeze-drying/evaporation and ion chromatography. The denitrifier

xii
method has been implemented in the Michalski Stable Isotope Lab in order to
simultaneously detect the stable isotope composition of oxygen and nitrogen in
nitrate samples.

1
Chapter 1: INTRODUCTION
1.1 Nitrate and the Nitrogen Cycle
Nitrogen (N) is a key element in biological systems as amino acids are the
building blocks of life. The most abundant source of nitrogen available to life on
Earth is atmospheric N2, which makes up approximately 78% of the atmosphere.
Nitrogen gas in its molecular form (N2), has a strong triple bond (ΔH= 226 kcal
mol-1) rendering N2 inert in most biological systems1. Therefore, unique chemical
or biological mechanisms have evolved to convert N2 into more functional forms
Figure 1.1: Nitrogen Cycle

2
of N, such as nitrates, nitrites, and ammonium, in order for biological systems to
maintain functionality. These trace nitrogen compounds, in various reduction or
oxidation states, exist throughout the environment and cycle through the
biosphere via five main processes2: nitrogen fixation, nitrogen uptake,
ammonification, nitrification, and denitrification (Figure 1.1). These processes are
used to explain how atmospheric nitrogen gas can be exploited for use by
organisms and for the recycling of N in the biosphere.
1.2 Stable Isotopes of Nitrogen and Oxygen
Stable isotopes can be used as an indicator of environmental change in
natural systems including the nitrogen cycle. Isotopes are defined as atoms of
the same element with differing numbers of neutrons3 and noted as
A
ZX (i.e. 147N, or nitrogen-14)
where X stands for the chemical element or elemental symbol, A is the atomic
mass number (the total number of protons and neutrons in the nucleus), and Z is
the atomic number (number of protons in the nucleus). It is common in
biogeochemistry to omit the proton subscript for simplicity. Stable isotopes do not
radioactively decay; however, their abundances in nature do vary due to small
differences in the thermodynamic properties of isotopically substituted molecules.
Oxygen, hydrogen, carbon, nitrogen, and sulfur are the main elements in
biogeochemical systems and variations in their isotopic abundances in different
compounds can be used to trace processes such as metabolism, phase
changes, and reaction rates in the C, N, S and water cycles.
1.2.1 Isotopes in Nitrate
In this study, the nitrogen and oxygen isotopes, 14N, 15N, 16O, and 18O, in
nitrate are of interest. Their respective isotopic abundances are: 0.996337,

3
0.003663, 0.9976206, and 0.0020004 relative to N2-Air and Standard Mean
Ocean Water (SMOW)4. All isotopic measurements are made in comparison to
these reference abundances. Isotopic enrichments or depletions are then
calculated relative to the accepted standard and reported as “delta” in units of
parts per thousand, or per mil (‰):
��(‰)= (Rsample/Rstandard -1) *1000
The amount of rare isotope is usually expressed as a ratio, R, of the rare isotope
relative to the abundant isotope, such as 15N/14N. Delta (�) notation is a way of
making comparisons between the isotopic ratios of two materials. � values can
be used to compare 1) high vs. low values, 2) more/less positive vs. more/less
negative (e.g. -10‰ is more positive than -20‰), and 3) heavier vs. lighter (the
“heavy” material is the one with the higher � value)1. These small changes in
isotopic abundance are important ways of tracing changes in biogeochemical
systems such as the nitrogen cycle.
1.2.2 Tracing Sources and Cycling of N and O Using Stable Isotopes
Isotopologues of nitrate can be valuable in tracing sources and cycling of
nitrate within the nitrogen cycle. Isotopologues are molecules that have the same
chemical formula but different masses and this difference in mass results in
isotopologues having different thermodynamic properties. Changes in reaction
rates are dependent upon the differences in vibrational energies of the
isotopologues and leads to isotopic fractionation. Isotopic fractionation is the
partial separation of a light isotope from a heavy isotope during a chemical
reaction or physical processes. Isotope fractionations can occur during
equilibrium reactions or unidirectional kinetic reactions. Equilibrium fractionations
occur when there is an exchange of two isotopes of the same element between
molecules in a chemical equilibrium:

4
AaX + BbX � AbX + BaX
In this reaction, isotopic fractionation of compound A relative to compound B can
be expressed as a fractionation factor, which is equivalent to the equilibrium
constant:
�A-B= RA/RB
where A and B are different phases such as H2O(g), H2O(liq). For example, the
exchange of 18O between nitrate and water can be written as
OONO + H218O �� OON18O +H2O
�NO3-H2O= (OON18O/OONO) / (H218O/H2O).
During equilibrium reactions, the species with the higher oxidation state tends to
become enriched (accumulates the heavier isotope) while the species of lower
oxidation state is depleted1. � values can be related to fractionation factors using
the following equation5:
�A-B= (1000 + �A)/(1000 + �B)
The fractionation factor is also related to the isotopic enrichment factor, �:
�
��= (�� -1)*1000,
For small values of ����� �A - �B) is simplified as

5
�� �A - �B 1000ln�A-B.
Kinetic isotope effects (KIE) also lead to fractionation due to the mass
difference of isotopologues in unidirectional kinetic reactions. Here, light isotopes
typically react faster than heavy isotopes because the bonds of lighter isotopes
are broken more easily than equivalent bonds of heavier isotopes1. This leads to
the heavier isotopes becoming enriched in the reactants, while the products are
depleted (lower � value). The kinetic fractionation factor is expressed as:
�P-S= RP/RS,
where P�product and S�substrate (reactant), and the isotopic enrichment factor,
�, is:
�P-S= (�P-S -1)*1000,
If fractionations are small and the reactant concentration is large,
�P-S= �P -�S.
In both equilibrium and kinetic processes, the Rayleigh equation is used to
calculate the change of isotopic composition of the residual substrate as a
function of the initial isotopic composition of the substrate (�0), the remaining
fraction of the substrate (f), and the enrichment factor �P-S<>0:
�� �0 + �P-S lnf.

6
1.2.3 �15N and �18O in the Nitrogen Cycle
Nitrogen containing compounds cycle through the biosphere via five main
processes known as the nitrogen cycle: nitrogen fixation, nitrogen uptake,
ammonification, nitrification, and denitrification6 and stable isotope variations can
help understand the cycling process. Nitrogen fixation is a process in which un-
reactive N2 is converted into a nonzero oxidation state, most often as
ammonium2. Fixation can occur via industrial fixation, lightning, or biological
fixation, all of which require intense amounts of energy. Depending on the
nitrogen fixation process, the fractionation factor can be greater or less than 1
(�=0.998-1.0027). Artificial fertilizer production is the largest source of
anthropogenic fixed nitrogen on Earth. In industrial nitrogen fixation, the Haber-
Bosch process uses an enriched iron or ruthenium catalyst to form ammonia
from atmospheric N2 and hydrogen at high temperature and pressure8: N2 +
3H2� 2NH3 . Nitrogen is fixed by industry for use as fertilizer and as feedstock
for nitric acid production through O2 oxidation of NH3 (Ostwald Process).
Industrial nitrogen fixation provides about 80 Tg N per year to the nitrogen cycle9.
The �15N values in ammonium from fertilizer are significantly different when
compared to �15N in nitrate from fertilizer (Figure 1.2). The �18O of synthetic
nitrate is ~ 20‰ and reflects a mixture of air O2 (�18O ~ +23‰10) and water (�18O
~ -5‰10) that is used in its production. This �18O value is significantly different
than microbial nitrate (see below) and this difference can be used to trace the
amount of synthetic fertilizer in ecosystems perturbed by humans.
Nitrogen fixation can also occur as a result of lightning strikes. In this form
of nitrogen fixation, electrical energy breaks the N�N, allowing N2 to combine with
atmospheric O2, forming nitrogen oxides11: N2 + O2 + energy� 2NOx. NOx is
ultimately oxidized to nitric acid (HNO3), which is highly soluble, and falls to the
ground when it dissolves into rainwater. Studies of acid rain are also of great
interest to the stable isotope community; 15N isotopic studies have successfully
distinguished sources of NOx emitted from coal combustion (+6 to +9‰) than
from automobiles (-13 to -2‰) at a study site in South Africa12. Recently, Elliott et

7
al.13 have also suggested that nitrate �15N values can be used to distinguish NOx
sources. The �18O values in atmospherically fixed nitrate are highly elevated
spanning 60-90‰ and these high values have been used to trace the deposition
of atmospheric nitrate to terrestrial ecosystems.

8
Table 1.1: Global production and distribution rates of reactive nitrogen
Nr (Tg N/yr)9 Natural Nr creation Terrestrial BNF 100 Marine BNF 15 Total Lightning 5 Anthropogenic Nr Creation Haber-Bosch 80 BNF, cultivation 40 Fossil-fuel combustion 24 Total Terrestrial 249 Total Global 264 Atmospheric emission NOx, fossil-fuel combustion 24
NOx, other 24
Terrestrial NH3 62
Marine NH3 13
Total Emissions 123 Atmospheric Deposition Terrestrial NOy 30
Marine NOy 14
Terrestrial NHx 40
Marine NHx 16
Organic N Total Deposition 100 Denitrification Continental N2O 11.7
Marine N2O 4
Continental N2 13-233
Marine N2 110
Total Denitrification 249

9
Biological nitrogen fixation converts atmospheric nitrogen to ammonia
(NH3) using microbes that contain the nitrogenase enzyme8: N2 + 6 H+ + 6 e− →
2 NH3. The nitrogenase enzyme often produces organic materials with �15N
values slightly less than 0‰14. Lower isotopic values in organic matter, when
compared to higher values produced by other mechanisms, is often cited as
evidence of N2 fixation1. Common isotopic methods for quantifying biological
fixation include the 15N tracer dilution method15,16 and the 15N natural abundance
method 17.
The process of ammonium conversion into organic nitrogen is known as
nitrogen uptake, or ammonia assimilation. In biological reactions such as
assimilation, organisms tend to favor lighter isotopes over heavier isotopes
during incorporation of ammonium into their biomass181. This may result in
leaving behind an enriched 15N in the ammonium pool while producing depleted
amino acids. Fractionation factors of assimilation are in the range of �=1.000-
1.0207. Changes in �15N might be used to infer the degree of assimilation in
certain ecosystems.
Figure 1.2: Ranges of �15N values of some major sources of N1

10
Ammonification, also known as nitrogen mineralization, is a microbial
process that converts organic N into ammonium. When an organism expires,
heterotrophic microbes consume and decompose the organic matter to acquire
energy; residual nitrogen compounds are excreted or left behind18. During
ammonification, N isotope fractionation is very small (�� 1.000); the isotopic
value of product N in NH4+ differs very little, if at all, from the initial �15N of
organic N7. Soil ammonium �15N is typically found to be within a few permil of the
organic N composition in the soil1.
Nitrification is a multi-step oxidation process involving autotrophic
organisms for the purpose of gaining metabolic energy. In this aerobic process,
bacteria consume ammonium via oxidation in order to gain energy. In nitrification,
one particular group of bacteria (e.g. Nitrosomonas), oxidize ammonium to nitrite:
2NH4+ + 3O2 � 2NO2
- + 2H2O + 4H+
followed by the oxidation of nitrite to nitrate by a second set of bacteria (e.g.
Nitrobactor):
2NO2- + O2 � 2NO3
-
The resulting nitrate product can be found in soil profiles and surface and
groundwater 17 and is found to have a fairly large 15N fractionation factor of
1.015-1.0357. This is attributed to bacterial oxidation in the first step of the
process, leaving NO2- depleted in 15N relative to NH4
+. Oxygen incorporated into
the product nitrate is believed to come from air O2 and water in a 1/3 to 2/3
proportion. Air O2 has a �18O value of +23‰10 and is essentially constant in time
and space in the troposphere. On the other hand, the �18O of water in soil is a
function of precipitation �18O values and enrichment from evapotranspiration,
which is variable. Precipitation �18O values vary as a function of water vapor
source and temperature (location, season, and altitude) and typically spans -20
to +5‰19. Enrichment of residual soil water by evaporation is a function of

11
temperature and the degree of evaporation (Rayleigh process). Therefore, the
�18O variations resulting from nitrification can range from roughly -10 to +10‰
depending on location and temperature. These values are very different when
compared to synthetic and atmospheric nitrates and they could be used to trace
nitrate sources in soil and water systems.
1.2.4 Denitrification in the Nitrogen Cycle
Denitrification is critical for understanding life processes on Earth; it is the
sole process occurring in the nitrogen cycle that is a net return of N2 to the
atmosphere8. Denitrification is the biological reduction of nitrate (NO3-) to nitrogen
gas (N2) via heterotrophic bacteria under anaerobic conditions18:
5CH2O + 4H+ + 4NO3- � 2N2 + 5CO2 + 7H2O
Heterotrophic bacteria are those that are unable to synthesize their own organic
compounds20. Denitrification takes place when oxygen levels are depleted and
nitrate serves as an alternative to oxygen as the final electron acceptor in the
respiration process. The reduction of nitrate, thus completes the nitrogen cycle
by returning fixed nitrogen to the atmosphere as N2, NO, and N2O. Isotopic
fractionation of nitrogen and oxygen isotopes occurs during bacterial
denitrification. Denitrification depletes N2O in comparison to the reactant NO3-
(�=1.000-1.0337). In systems where denitrification occurs over time, the residual
nitrate becomes enriched and follows Rayleigh distillation type behavior (Figure
1.3). In these cases, changes in the �15N (or �18O) may be a way of assessing
the degree of denitrification occurring in closed systems such as septic tanks,
groundwater, and ocean sediments.
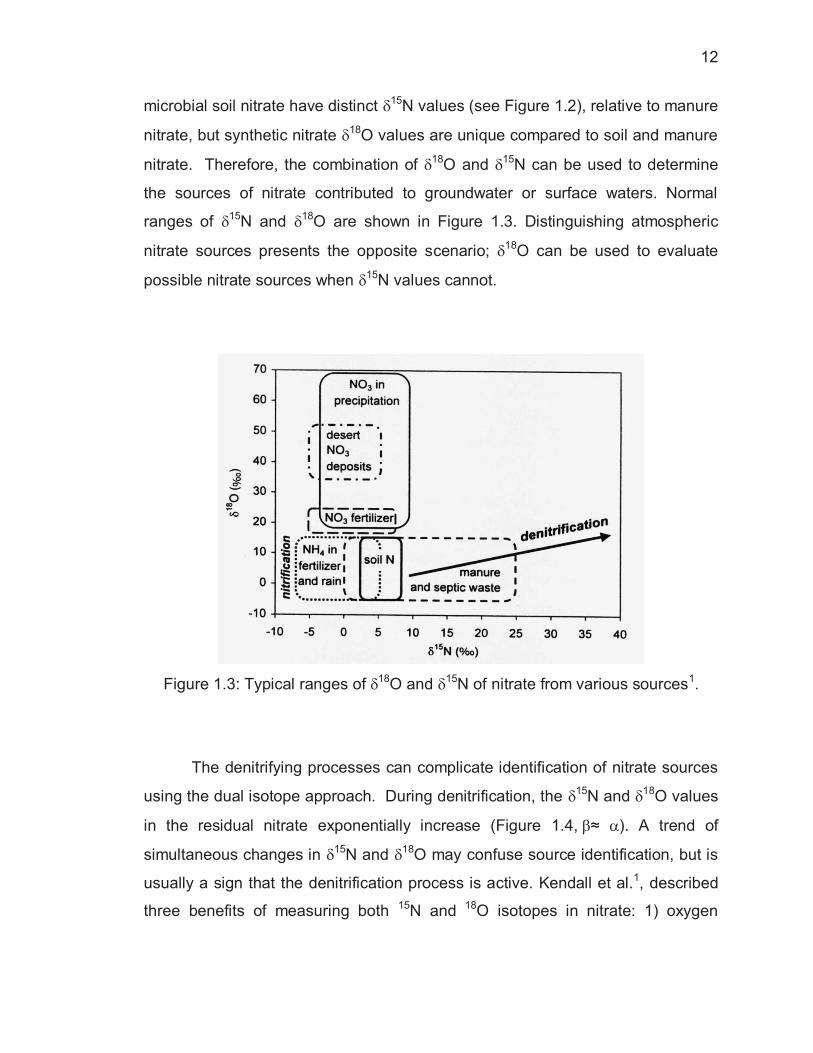
The combination of �18O and �15N values in nitrate, sometimes called the
dual isotope approach, has been used to help distinguish between sources and
processes in the nitrate cycle. For example, synthetic nitrate fertilizer and
12
microbial soil nitrate have distinct �15N values (see Figure 1.2), relative to manure
nitrate, but synthetic nitrate �18O values are unique compared to soil and manure
nitrate. Therefore, the combination of �18O and �15N can be used to determine
the sources of nitrate contributed to groundwater or surface waters. Normal
ranges of �15N and �18O are shown in Figure 1.3. Distinguishing atmospheric
nitrate sources presents the opposite scenario; �18O can be used to evaluate
possible nitrate sources when �15N values cannot.
Figure 1.3: Typical ranges of �18O and �15N of nitrate from various sources1.
The denitrifying processes can complicate identification of nitrate sources
using the dual isotope approach. During denitrification, the �15N and �18O values
in the residual nitrate exponentially increase (Figure 1.4,��≈ �). A trend of
simultaneous changes in �15N and �18O may confuse source identification, but is
usually a sign that the denitrification process is active. Kendall et al.1, described
three benefits of measuring both 15N and 18O isotopes in nitrate: 1) oxygen

13
isotopic separation of some sources is greater than when compared to the
nitrogen isotopes, allowing better source resolution by having two tracers, (2)
some nitrate sources that are presently indistinguishable with �15N alone (e.g.,
fertilizer vs. soil nitrate, or atmospheric vs. soil nitrate) may be identified only
when the �18O of nitrate is analyzed, and (3) oxygen isotopic compositions of
nitrate vary systematically with nitrogen isotopic compositions during
denitrification1.
Figure 1.4: �15N values of residual nitrate and product nitrogen as a function of
reaction time from denitrification1.
14
CHAPTER 2: NITROGEN AND OXYGEN ISOTOPE-RATIO ANALYSIS OF NITRATE BY THE DENITRIFIER METHOD USING CONTINOUS FLOW
ISOTOPE-RATIO MASS SPECTROMETRY
2.1 Experimental Section
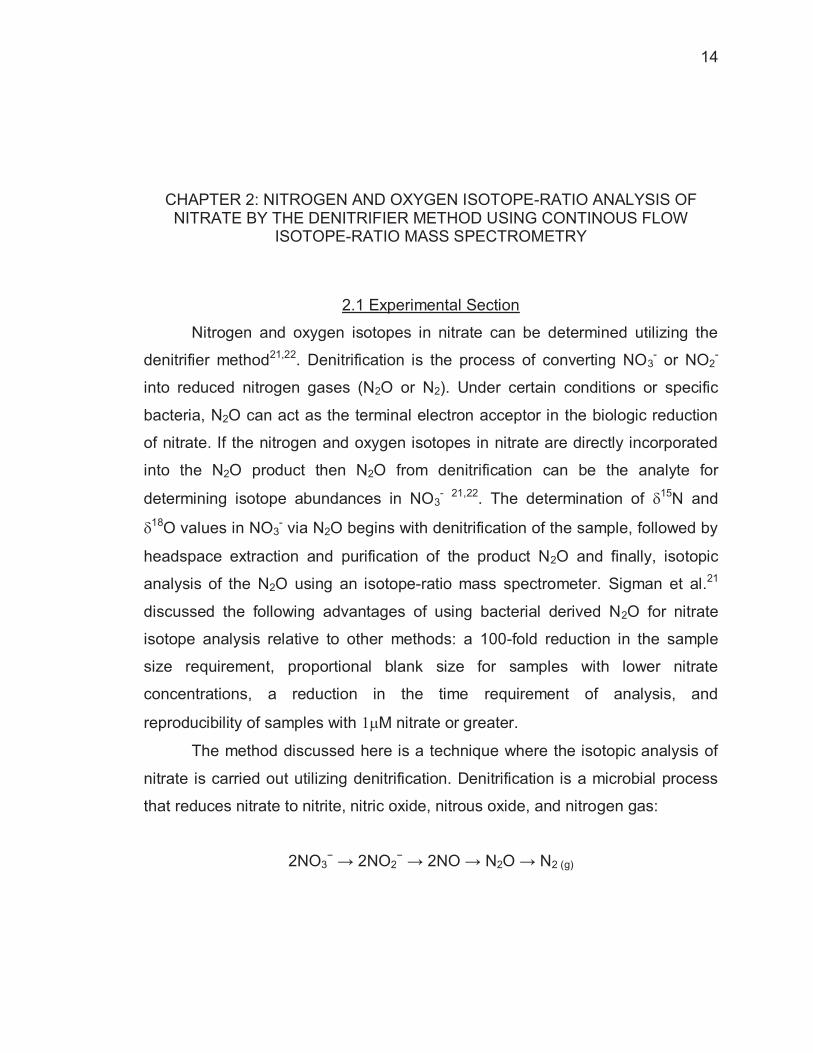
Nitrogen and oxygen isotopes in nitrate can be determined utilizing the
denitrifier method21,22. Denitrification is the process of converting NO3- or NO2
-
into reduced nitrogen gases (N2O or N2). Under certain conditions or specific
bacteria, N2O can act as the terminal electron acceptor in the biologic reduction
of nitrate. If the nitrogen and oxygen isotopes in nitrate are directly incorporated
into the N2O product then N2O from denitrification can be the analyte for
determining isotope abundances in NO3- 21,22. The determination of �15N and
�18O values in NO3- via N2O begins with denitrification of the sample, followed by
headspace extraction and purification of the product N2O and finally, isotopic
analysis of the N2O using an isotope-ratio mass spectrometer. Sigman et al.21
discussed the following advantages of using bacterial derived N2O for nitrate
isotope analysis relative to other methods: a 100-fold reduction in the sample
size requirement, proportional blank size for samples with lower nitrate
concentrations, a reduction in the time requirement of analysis, and
reproducibility of samples with ��M nitrate or greater.
The method discussed here is a technique where the isotopic analysis of
nitrate is carried out utilizing denitrification. Denitrification is a microbial process
that reduces nitrate to nitrite, nitric oxide, nitrous oxide, and nitrogen gas:
2NO3− → 2NO2
− → 2NO → N2O → N2 (g)

15
Specific nitrase reductase enzymes contained within the denitrifying bacteria
each facilitate a step in the reduction of nitrate to nitrogen gas. The denitrifier
method takes advantage of the fact that some bacterial halt the reduction after
the nitrous oxide production step21,22, which allows incorporation of both the
nitrogen and oxygen isotopes into the product N2O. If complete denitrification
were to occur the oxygen would be lost (converted to water) and isotope analysis
of the N2 gas would be challenging because the large background signal of N2
originating from air N2. Therefore, it is imperative that the denitrifying bacteria
selected for this study lack the active N2O-reductase enzyme (if present, this
reductase would further reduce N2O to N2 23 and isotopic analysis of �18O in N2O
would no longer be possible (see section 2.1.1)). It is also important that only the
oxygen from NO3- be incorporated into N2O, because 18O exchange between
NO2- (or NO) and H2O during the reduction may erase the original nitrate �18O
value.
2.1.1 Denitrifier Strain
One bacterium that meets the above criteria is Pseudomonas
Aureofaciens (P. Aureofaciens). This denitrifying strain is an aerobic bacterium,
golden-yellow in color, and was isolated from Maas River clay24. Glockner et al.
showed that the Cu-containing nitrite reductase in P. Aureofaciens incorporates
relatively little oxygen from water during converting NO into N2O. During the
denitrification process (2NO3- � N2O) only one of six oxygen atoms in NO3
- is
incorporated into N2O. This loss of oxygen is likely to be accompanied by a
kinetic isotope effect, common for biologic oxidation/reduction reactions, and
alter the �18O of the product N2O relative to the NO3- substrate. In order for the
�18O of nitrate to be determined through the isotopic analysis of N2O, this biologic
isotopic fractionation must be consistent. Fortunately, prior research has
demonstrated that N atoms are conserved during the reduction, no external N
source is available for isotopic exchange and the produce N2O can be used to

16
determine the �15N in nitrate22. Therefore, N2O produced by P. Aureofaciens
reduction of nitrate allows for the determination of the nitrogen isotopic
composition of nitrate (14N and 15N) as well as oxygen isotopic composition (16O
and 18O).
Preparation of P. Aureofaciens used in the NO3- isotopic analysis begins
with culturing pure strains of the bacteria, preparing a growth media, inoculation
of a growth media with the purified strains, and then harvesting the bacteria that
are then used to reduce nitrate to nitrous oxide. Single colonies of bacteria act
as a clone of the original source, yet are free of impurities, and the appearance of
single colonies helps to visually distinguish pure bacteria from possible
contaminants. Purifying the bacteria begins with obtaining freeze-dried P.
Aureofaciens from ATCC biological resource center (http://www.atcc.org) and
making cultures. The bacteria are cultivated on tryptic soy agar plates amended
with potassium nitrate at room temperature (details in Appendix D). Using a
flamed inoculating loop, an agar plate (Plate #1) is streaked from the frozen pure
P. Aureofaciens stock and is allowed to grow for 2-3 days until the streaks
appear with a yellow-orangish color. A second agar plate (Plate #2) is then
streaked using single colonies on Plate #1, and after two or more days, Plate #3
is streaked using single colonies from Plate #2. The purpose of streaking from
the freezer source then using three sequential plates is for the stepwise
purification of bacterial colonies, which results in single colony growth. After three
consecutive plates, single colonies are selected from plate #3 for inoculating the
growth media, which is used to produce a large amount of bacteria.
Tryptic soy broth (TSB) serves as a quality medium for bacteria growth,
but this particular denitrifying bacterium requires supplementary nutrients prior to
inoculation. Three additional ingredients are added to modify the store-bought
supply of TSB for optimum growth conditions of P. Aureofaciens: potassium
nitrate (10 mM), ammonium sulfate (3.8 mM), and potassium phosphate (36
mM). Nitrogen compounds within the stock TSB, as well as the addition of
(NH4)2SO4 to the culture medium provides the nitrogen necessary for

17
assimilation, which limits any nitrate from the sample from being incorporated
into bacterial biomass21. Although Greenberg et al. 23 and Christensen et al. 25
noted that a similar bacteria, Pseudomonas Chloroaphis, matured without the
addition of ammonium, like Sigman21, the NH4+ addition is purely precautionary
(P. Aureofaciens was recently reclassified as a strain of P. Chloroaphis26). The
nutrient media is distributed into four 250 mL polycarbonate centrifuge bottles
(VWR), then capped and autoclaved. After the solution cools to room
temperature, the media is inoculated from an individual colony picked from Plate
#3, re-capped and allowed to develop for 5-9 days. This incubation time allows
for the complete consumption of the O2 in the headspace making the solution
anaerobic, after which the reduction of NO3- can take place. At any time past the
5 day incubation point, the solution is tested for incomplete conversion of nitrate
with an Aqua Chek nitrate/nitrite test strip (Hach). A positive result (pink)
indicates the presence of nitrate and nitrite and the bottle should be allowed to
react longer, up until the 9 day mark. A negative result (off-white) indicates
complete conversion of nitrate and the bacteria may then be harvested and used
in nitrate isotope analysis.
2.1.2 Conversion of Sample to Nitrous Oxide
Complete conversion of any nitrate sample (or standard) to nitrous oxide
requires concentration and purification of the bulk bacteria solution, reacting
sample nitrate with the bacteria, extracting N2O from the vial headspace, and
analysis on an isotope-ratio mass spectrometer. The bacteria are harvested by
centrifugation of the inoculated bottle(s) that have tested negative for
nitrate/nitrite. Two bottles are centrifuged (Damon-IEC, model IEC CU-5000) for
10 minutes at 3000rpm. After the first round of centrifugation, the solutions are
separately decanted, leaving behind two bacterial pellets. The first bacterial pellet
is re-suspended with 50mL of a nitrate-free growth medium (rinse) solution and
shaken. The rinse solution consists of a nitrate-free growth medium with the

18
addition of one drop of an anti-foaming agent (J.T. Baker Antifoam-B Silicone
Emulsion Agent; see Appendix D for reagents) added just before the solution is
used to rinse bacteria pellets during pelletization. The re-suspended pellet is then
poured into the bottle containing the second bacteria pellet. These combined
pellets are capped, shaken, centrifuged, and decanted a second time. The rinse
solution dilutes any NO3- that may still be present in the growth medium as well
as any N2O that may be dissolved in the original growth medium. The combined
solution is rinsed with a second 50mL aliquot of the rinse solution. After a third
and final centrifuging of the solution, the bacterial pellet is re-suspended in 125
mL of rinse solution, leading to a 4-fold concentration of bacteria. Helium gas is
purged through the bacteria solution for 2 hours using a gas bubbler; the helium
serves to degas any remaining nitrous oxide that was produced by NO3-
reduction in the original growth medium. Flushing with helium at this step also
helps to reduce the signal of the blank. The solution is transferred to a sterile
125mL glass bottle and capped with a septum seal. The headspace is purged
with helium gas and the solution is allowed to sit overnight. Promoting an
anaerobic environment ensures that the bacteria are no longer able to reproduce,
yet they will still be able to complete the NO3- conversion on the following day.
On the following day, the bacteria solution is aliquoted, re-flushed,
inoculated with a nitrate-containing solution (either reference nitrates or
samples), and incubated to convert nitrate to N2O. 1 mL of the bacteria media is
pipeted into individual 12mL sample vials (LabCo, Ltd.), sealed with septum
caps, and flushed on a gas rack with helium at a rate of 40mL/min for 5 minutes
(16 vial volumes). Flushing with an inert gas dispels any air within the vial and
removes any N2O that may have been adsorbed onto the bacteria during the
overnight incubation. The purging gas enters through a disposable needle and
exits through a second disposable needle that are inserted above the liquid level
in the vial and discarded after use to avoid cross contamination. At this point, the
vials contain only the denitrifying bacteria and a headspace of helium. Nitrate
samples (or reference nitrates) are then added to the helium-flushed bacteria

19
vials where NO3- is converted to N2O. The samples containing nitrate for analysis
should be concentrated to the optimal 100 nmol NO3- per mL before they are
inoculated into the bacterial solution. 100 nmol NO3- is optimal, because the
50nmol of N2O produced (stoichiometry of the bacterial denitrification) is the
amount of gas needed to keep the analytical blank below 1% (see section 2.2.4).
Using a disposable syringe and needle, 1mL of each nitrate solution is added to
an individual vial and incubated. (see section 2.2.6). After 60 minutes, 0.5 mL of
1% NaOH solution is added to each vial to scavenge any CO2 and lyses the
bacteria, which stops the bacterial reduction and releases any cell bound nitrous
oxide into the solution. The sample vials are then ready to be loaded into the
headspace extraction system for IRMS analysis.
2.1.3 Extraction and Isotopic Analysis of Nitrous Oxide
N2O produced from NO3- denitrification in the sample vial is extracted from
the headspace, cryogenically collected, and purified, before entering the isotope
ratio mass spectrometer. The customized headspace extraction set-up has an
autosampler (Gilson 221 XL Liquid Handler), six independent purification traps, a
gas chromatography system and two cryogenic loops. The system is fully
automated using a combination of Isodat and Peak Simple software (see
Appendix D). After the N2O is extracted from headspace vials, it is injected into
the IRMS via a custom made open split interface.

20
Figure 2.1: Autosampler needle extracting gas from sample vial.
Each sample vial undergoes the same headspace extraction procedure
(Figure 2.2). The vial is purged with a helium carrier gas (99.99% pure, Airgas) at
30 mL/min for 12 minutes, which flushes the 12 mL glass vials roughly 30 times.
Flushing is carried out using a double needle (Figure 2.1) (SerCon). The inside
needle supplies the helium carrier gas down through the sample vial into the
liquid causing vigorous bubbling. A hole in the outside needle permits the sample
gas to exit to the purification and collection traps. It is important that the liquid
volume must be <4 mL or less in the 12 mL vial or else the liquid may flow up
and out through the exit hole of the outer needle, risking contamination of the
extraction system.
The sample N2O gas is sent through a series of five purification traps. The
first trap is a dry 12mL headspace vial (LabCo) paired with a second autosampler
needle (SerCon) and is positioned so that if any liquid leaves the sampling
vial it will be isolated and not contaminate the subsequent traps The second trap
is a Nafion drier (PermaPure, Inc., MD-050-72S-1) removes moisture from the
sample gas stream by allowing water molecules to migrate through the Nafion
membrane into a helium counter current that carries the moisture away. The next
21
purification step uses 7mL of solid Carbosorb (SerCon, granular 6-12 mesh) to
remove CO2 from the gas stream. The fourth trap in the series is filled with 7mL
of solid magnesium perchlorate (CosTech Analytical Technologies, Inc.) that
absorbs trace water from the helium purge gas that may have bypassed the
Nafion drier. Both the Carbosorb and magnesium perchlorate solids are
separately enclosed in 4.3”x0.32” glass tubing. The fifth trap in the series is a
Supelco Type F hydrocarbon purge trap (12” in length and 0.125” in diameter)
that filters out volatile organic compounds (VOCs). VOCs are produced during
the incubation step and if not removed, the hydrocarbons can interfere with the
mass 45 signal by producing hydrogen atoms (1 amu) that can recombine with
mass 44 N2O in the IRMS ion source, producing a signal at mass 45.

22
Fi
gure
2.2
: IR
MS
onlin
e ex
tract
ion
syst
em
22
23
After passing through the five purification traps, the sample gas is
preconcentrated in two cryogenic loops. The first cryogenic trap is immersed in
liquid nitrogen (-196�C) and collects headspace N2O for 10.5 minutes while the
previous sample is being processed by the GC (see below). The N2O collected
in the first trap is the transferred to a second loop (focus loop) by lifting the trap
out of the liquid nitrogen using a pneumatic lifter. In between the first cryogenic
trap and the focus trap is an ethanol slush trap (-80�C) used as a final filter to
reduce water and VOCs in the sample gas, before the N2O is collected in the
focus loop that is immersed in liquid nitrogen. After complete transfer of the N2O,
the focus loop is thawed and the helium flow carries the N2O through a HP-Plot-
Q column (Agilent) where it is separated from any other gases such as CO2.
Finally, the sample gas is injected into a custom open-split interface and
analyzed in the IRMS.
During the on-line extraction of N2O from sample vials, there are two
configurations of sample collection: Inject or Load. While in Inject mode (Figure
2.3) , the 10-port valve is aligned so that focus trap raises up from the liquid N2,
sending the sample collected from the previous sample through the ethanol slush
trap and into the Plot-Q column using 10-port valves where it reaches the IRMS.
Simultaneously, a new isotopic analysis begins (T= 0 min) and the autosampler
needle is lowered into the next vial, flushing the sample gas from the vial using a
helium carrier gas. The sample gas is transported from the vial, through the
Nafion drier, Carbosorb trap, and Mg(ClO4)2 trap, and finally into the collect trap
submerged in liquid N2. At approximately 3.5 minutes into collection, the focus
trap is lowered into liquid N2 and allowed to cool.
After 5 minutes of sample collection from one vial, the 10-port valve rotates
to Load mode (Figure 2.4). At the 10 minute mark, the collect trap is raised above
the liquid N2 level and allowed to warm to room temperature, transferring the
collected gas to the focus trap. At 12 minutes, the autosampler needle is moved
to a vial containing only helium; this ensures that gases from one vial do not
come
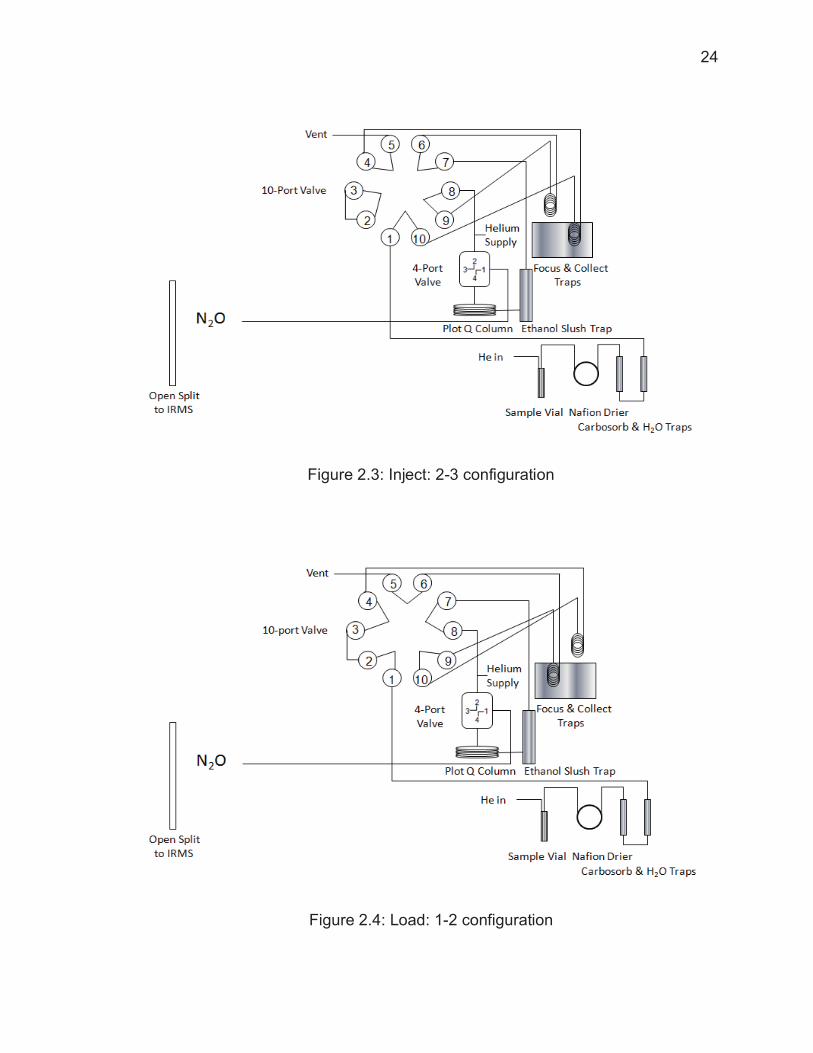
24
Figure 2.3: Inject: 2-3 configuration
Figure 2.4: Load: 1-2 configuration

25
come into contact with gases in the next vial. Just before the 15 minute sampling
time expires, the 10-port valve rotates to Inject mode where the previous focused
gas is analyzed as mentioned above.
The Delta-V Plus isotope-ratio mass spectrometer (Thermo Electron
Corporation) is ideal for nitrogen and oxygen isotope analysis of nitrous oxide
because it is equipped with an 11-cup collector configuration which allows for N
and O isotopes to be measured without peak jumping (magnet adjustment). The
electron impact ion source is controlled with a computer and supplementary
software and is self-aligning and is able to provide high sensitivity and linearity.
This IRMS has the sensitivity to detect one ion per 1100 molecules in Continuous
Flow mode and the flexibility to cover a mass range up to m/z 96 (FisherSci). The
automated N2O system is capable of running approximately 75 samples during
an overnight run and up to 96 samples in a 24-hour time period.
In order to determine the ratio of N and O isotopes in N2O, masses 44, 45,
and 46 amu are monitored. The most common isotopologue of N2O has a mass
of 44 amu: 14N14N16O; the abundance of the minor isotopologues of N2O have
masses of 45 and 46 amu (available in Table 2.1) and were calculated based on
the natural abundance of N and O isotopes relative to N2-Air and SMOW,
respectively. The likelihood of isotopologues 14N15N17O, 15N14N17O, and 15N15N16O influencing the signal is very low and is ignored. This can be justified
by determining the change permil values as affected by a change in isotopic
abundance. For the mass 46 signal, a 10‰ change in the 15N and 17N in an
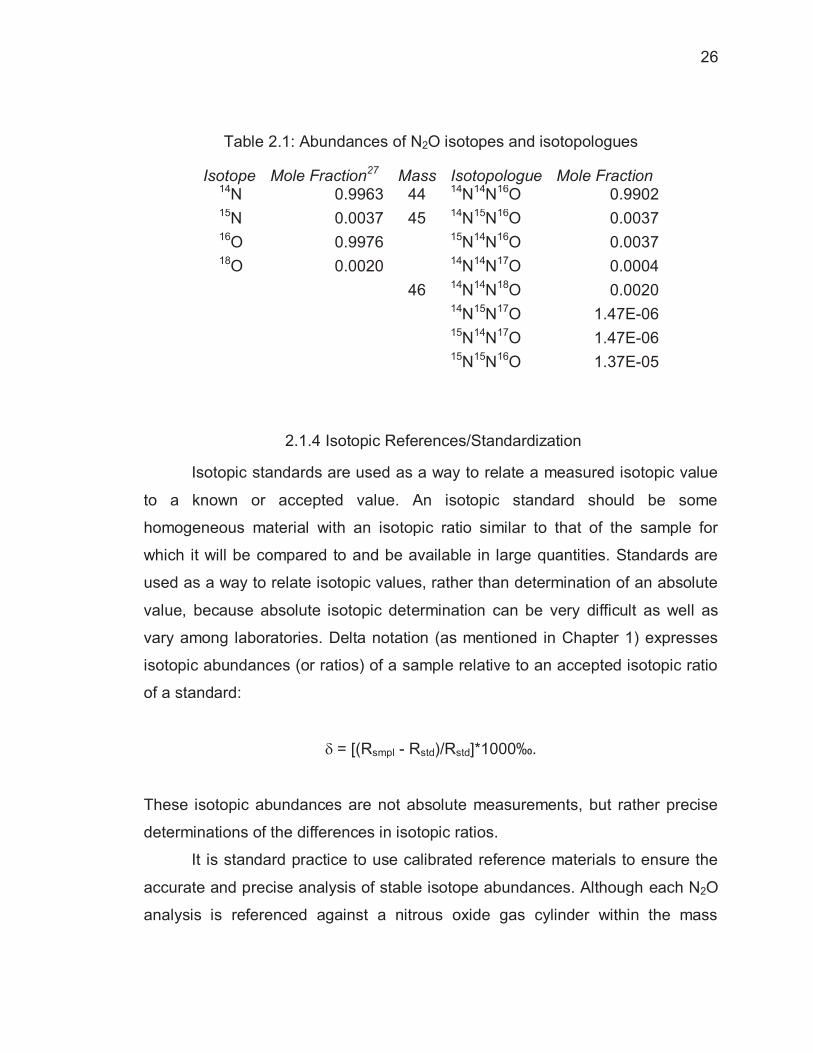
isotopologue (14N15N17O, 15N14N17O, or 15N15N16O) only changes 18O signal in 14N14N18O by less than 0.1‰. Therefore, isotopologues 14N14N16O, 14N15N16O, 15N14N16O, 14N14N17O and 14N14N18O are of importance in this study.
Since the vapor pressure of N2O and CO2 are comparable and have the
identical molecular masses of 44, 45, and 46, a Plot-Q GC column is used to
separate N2O and CO2 peaks. Some small CO2 peaks may appear on the
spectrographs, but they are easy to differentiate from N2O peaks based on peak
size.
26
Table 2.1: Abundances of N2O isotopes and isotopologues
Isotope Mole Fraction27 Mass Isotopologue Mole Fraction 14N 0.9963 44 14N14N16O 0.9902 15N 0.0037 45 14N15N16O 0.0037 16O 0.9976 15N14N16O 0.0037 18O 0.0020 14N14N17O 0.0004
46 14N14N18O 0.0020
14N15N17O 1.47E-06
15N14N17O 1.47E-06
15N15N16O 1.37E-05
2.1.4 Isotopic References/Standardization
Isotopic standards are used as a way to relate a measured isotopic value
to a known or accepted value. An isotopic standard should be some
homogeneous material with an isotopic ratio similar to that of the sample for
which it will be compared to and be available in large quantities. Standards are
used as a way to relate isotopic values, rather than determination of an absolute
value, because absolute isotopic determination can be very difficult as well as
vary among laboratories. Delta notation (as mentioned in Chapter 1) expresses
isotopic abundances (or ratios) of a sample relative to an accepted isotopic ratio
of a standard:
� = [(Rsmpl - Rstd)/Rstd]*1000‰.
These isotopic abundances are not absolute measurements, but rather precise
determinations of the differences in isotopic ratios.
It is standard practice to use calibrated reference materials to ensure the
accurate and precise analysis of stable isotope abundances. Although each N2O
analysis is referenced against a nitrous oxide gas cylinder within the mass

27
spectrometer, the N2O gas is not the absolute reference. Nitrate standards are
preferred over a nitrous oxide reference gas. Within each batch of samples,
nitrate standards are prepared in the same fashion as nitrate samples and then
analyzed in the mass spectrometer, following the “identical treatment” principle.
In doing so, it is possible to obtain accurate and precise isotopic measurements
and it also serves as one way to recognize or identify any possible changes in
the system or analysis that can occur on a day-to-day basis.
There are a number of nitrate reference materials that have a range of
accepted �15N and �18O values relative to air N2 and VSMOW respectively.
Internationally recognized nitrate standards include USGS32 potassium nitrate
and USGS35 sodium nitrate. USGS35 has a �15N value of +2.7‰ relative to N2-
Air28 and a �18O value of +57.5‰ relative to VSMOW28 and USGS32 has a �15N
value of +180.0‰ relative to N2-Air28 and a �18O value of +25.7‰ relative to
VSMOW28. These international standards are available at a very limited supply
therefore secondary standards were calibrated relative to the international
reference materials and in turn relative to air N2 and VSMOW.
Two secondary nitrate reference salts were prepared and calibrated and
then three subsequent mixtures of these references salts resulted in a set of four
secondary “working standards”. Secondary standards used in this study are
Hoffman nitrate fertilizer (20Hoff) and North Carolina State University (NCSU)
Potassium Nitrate (William Showers, personal communication). Hoffman brand
nitrate is a sodium nitrate mined from ore deposits in the Atacama Desert in
Northern Chile and exported as fertilizer. The Hoffman secondary nitrate
standard was calibrated relative SMOW using USGS35 as the reference by
converting the nitrates to O2 using the silver decomposition method33.
Converting the delta value of a sample (s) measured relative to a working
standard (ws) into a delta relative to the absolute standard (as) uses the following
equation:
�s-as (‰)=�s-ws + �ws-as + 1/1000(�s-ws•�ws-as)

28
During standardization of oxygen isotopes, the “sample” is the secondary
standard Hoffman, the working standard is USGS35, and absolute standard is
VSMOW yielding the conversion identity of:
�18O20Hoff-VSMOW = �18O20Hoff-USGS35 + �18OUSGS35-VSMOW + (�18O20Hoff-USGS35 +
�18OUSGS35-VSMOW / 1000).
A set of ten analyses of Hoffman relative to USGS35 yielded a �18O= -3.2‰
which gives a Hoffman values relative to SMOW �18O= +54.4‰. The �18O of
NCSU was determined by thermal conversion elemental analysis at North
Carolina State University and was found to be -23.6 +/- 0.2‰ (William Showers,
personal communication). The �15N of Hoffman and NCSU was determined by
converting it to N2 using elemental analysis and comparing it to USGS32,
USGS35 using the following equation:
�
�15N20Hoff-N2 =�15N20Hoff-USGS35 + �15NUSGS35-N2 + (�15N20Hoff-USGS35 + �15NUSGS35-N2/
1000)
The �15N of Hoffman and NCSU is found to be +3.2‰ and -2.2‰, respectively,
relative to air N2 .
Mass balance equations were used to make additional secondary
standards with isotopic compositions that are similar to the composition of
samples being studied. This technique is used frequently in order to preserve
expensive international standards available in limited quantities by mixing with
other readily available standards. The desired isotopic value of a mixed standard
from the masses and isotopic values of the individual standards:
�15NStd Mix= �15NStd A*x +��15NStd B*[1-x],

29
where x, mole fraction of standard= massStdA/ (massStdA + massStdB), assuming
both standards have the same molecular formula.
A working standard nicknamed NC32 is a combination of USGS32 and
NCSU nitrate standards. Since �18O20Hoff-USGS35, �15N20Hoff-USGS35, and �15NNC32-
VSMOW were measured during elemental analysis �15N of NC32 can be calculated.
The �15N isotopic value of working standard NC32 was calculated to be �15N =
+15.3‰ using �15NNCSU= -2.2‰, both relative to N2-Air, and x= massNCSU/
(massNCSU + massUSGS32)=0.90388.
Working standards are prepared from the aforementioned standards to
provide a range of δ15N and δ18O values. �18O and �15N values of the working
standards “10Hoff” and “1Hoff” are also calculated based on mass balance
mixtures of working standards 20Hoff and NC32 (by mole fraction). The working
standards 20Hoff, 10Hoff, 1Hoff, and NC32, all used on a regular basis, have a
set of known values based on the mass balance calculation (Table 2.2). These
standards span a range of values that is known to shift on a daily basis. For δ18O
the range is roughly 60 permil and the δ15N range is about 15 permil and the day
to day shift is +/- 1.0‰, which is tolerable. For example, the spread between
20Hoffman and NC32 might be �18O= -28 to +40‰ one day then �18O= -30 to +
39‰ on the following day’s analysis, but the span of values remains unchanged
(~67-69‰ difference).
A calibration curve is plotted graphing the actual known isotopic values
versus the measured isotopic values of the standards to correct for this shift in
isotopic values. Using the equation of the line, the measured sample values, not
standards, are then corrected to represent true δ15N and δ18O values. Table 2.2
represents of typical measurements of �15N and �18O using calibrated standards.
30
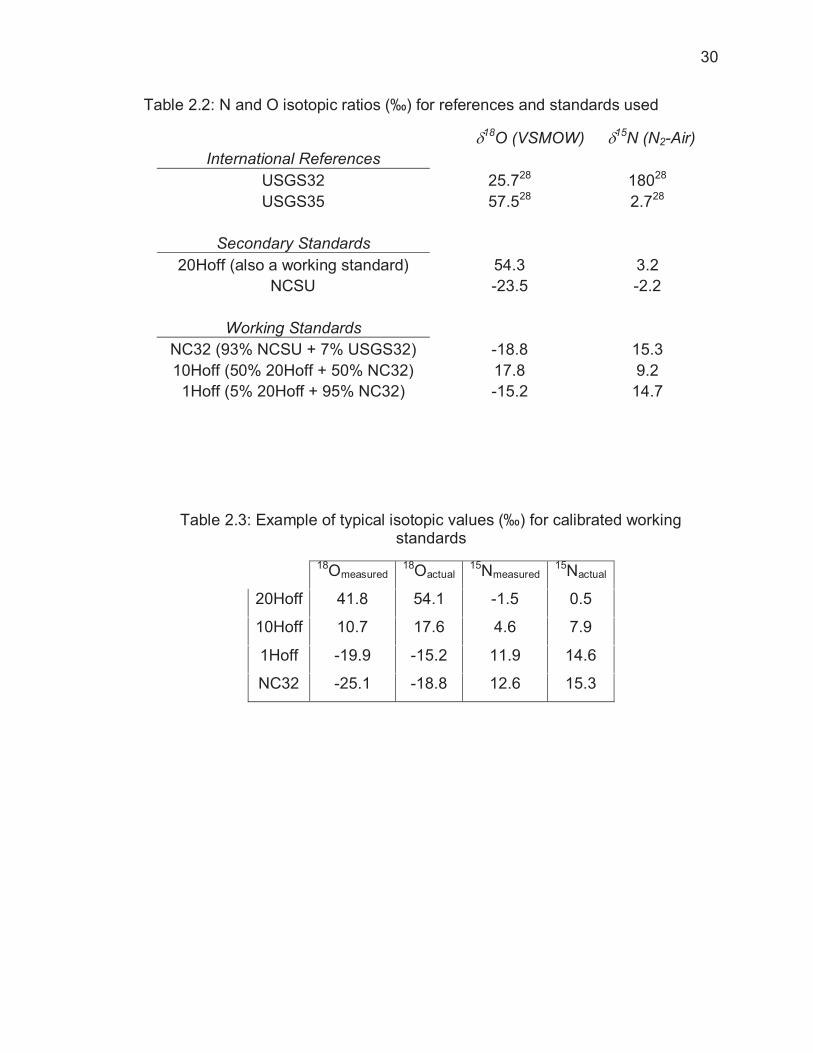
Table 2.2: N and O isotopic ratios (‰) for references and standards used
���������18O (VSMOW) ���15N (N2-Air) International References
USGS32 25.728 18028 USGS35 57.528 2.728
Secondary Standards
20Hoff (also a working standard) 54.3 3.2 NCSU -23.5 -2.2
Working Standards
NC32 (93% NCSU + 7% USGS32) -18.8 15.3 10Hoff (50% 20Hoff + 50% NC32) 17.8 9.2
1Hoff (5% 20Hoff + 95% NC32) -15.2 14.7
Table 2.3: Example of typical isotopic values (‰) for calibrated working standards
18Omeasured 18Oactual 15Nmeasured 15Nactual
20Hoff 41.8 54.1 -1.5 0.5
10Hoff 10.7 17.6 4.6 7.9
1Hoff -19.9 -15.2 11.9 14.6
NC32 -25.1 -18.8 12.6 15.3

31
Figure 2.5: Example of a typical calibration curve
2.2 Results and Discussion
In order to understand the denitrification method’s capability of
determining precise and accurate isotope ratios of oxygen and nitrogen in nitrate,
a series of control and test experiments were carried out. The precision and
accuracy capabilities of the isotope-ratio mass spectrometer were first tested.
Then, various tests were performed in order to reduce the size of the blanks. The
impact of bacterial growth conditions and preparation on isotope precision and
accuracy were also examined. Additionally, standardization tests were
performed, followed by sample preparation and other miscellaneous
improvements.

32
2.2.1 Precision Limits of the Mass Spectrometer
In order to test instrument’s accuracy and precision of the IRMS (i.e.
without sample manipulation or conversion) an “on-off” test was performed.
During the ”on-off” test, the reference N2O gas is measure relative to itself (i.e. a
zero test) by lowering and raising the N2O reference capillary into the open split
(Figure 2.6).
Figure 2.6: Open split tube
When the reference gas capillary is lowered into the open split, the resulting
IRMS signal (in mV) is a function of the reference gas pressure, the ion source
settings, and proper alignment of the electromagnet cups (Figure 2.7). The
software will only be able to analyze N2O isotope ratios precisely and accurately
if the IRMS is “tuned”. Improper tuning of the mass spectrometer will lead to
useless data. The ion source parameters must be able to attain a focused,
intense and stable ion beam. The software interface allows the user to fine tune
the accelerating voltage, magnet, electron trap, and box current. The maximum
number of ions produced is attained by adjusting the ion current, electron energy,
high voltage (ion acceleration), box, and trap currents. Focusing the ion beam is
achieved by balancing the X-Focus, X-Deflection, Y-Deflection, SE-Suppressing,

33
and Focus Quad. Each of these parameters can be manually optimized or
autofocused using the software. It is important that peak centering and
autofocusing of these parameters be completed daily to ensure optimal signal-to-
noise conditions in the IRMS. Once tuned, lowering the N2O reference gas
capillary into the open split generates an ion signal is plotted versus time, a
square shaped peak is produced (Figure 2.9).
Figure 2.7: Schematic of an IRMS with triple collector cup system
The signal generated by gases entering the IRMS from the open split is a
function of the gas pressures and dilutions. The N2O reference gas (Air Products
and Chemicals, Inc.) is supplied by a 196 cubic foot tank with an outflow of
200psi. The gas is connected to the open split interface, where the reference
gas is delivered at a pressure of ~2psi through a silica capillary line into an open

34
split tube. A helium purge gas (37psi) is also directing the flow into the split tube
where there is a silica capillary “sniffing” tube (100 �m I.D.). The sniffing line
sends gas to the ion source through a pressure differential (~ 2 bar versus 10-6
mbar inside the IRMS). The purge pressure of the helium must be higher than
atmospheric pressure to keep atmospheric air from mixing in the tube. The
sample open split tube also has a capillary delivering a helium purge gas, a
second sniffing capillary (100��m I.D.) and a GC column capillary that brings the
headspace extraction to the MS. The sample capillary is controlled by a
pneumatic piston plunger, and is lowered below the helium and sniffing
capillaries just before the sample leaves the GC column.
Figure 2.8: N2O reference gas “on-off” test
The purpose of the on-off test was to determine the best precision that can
be expected from any conflo analysis. An arbitrary N2O pulse is selected as the

35
reference peak (Second pulse, Figure 2.9) and the ion current of the other N2O
pulses are measured relative to this reference pulse. The software calculates the
� value of the each N2O pulse relative to the reference pulse integrating the
areas under 44, 45, and 46 amu voltage versus time (V/s):
�smpl-ref= [(45/44smpl – 45/44ref)/(45/44ref)]*1000
�smpl-ref= [(46/44smpl – 46/44ref)/(46/44ref)]*1000
Since the reference N2O gas has already been calculated relative to SMOW
using:
�ref-SMOW= [(45/44ref – 45/44SMOW)/(45/44SMOW)]*1000
�ref-SMOW= [(46/44ref – 46/44SMOW)/(46/44SMOW)]*1000
then,
�smpl-SMOW = �smpl-ref+�ref-SMOW+1/1000*�ref-SMOW+�smpl-ref.
On-off tests resulted in a peak area of 34.9 +/- 0.3 mV which is a deviation
of less than 0.75% for each pulse. The �18O values of the test pulse relative to
the reference pulse was -0.024 +/- 0.1 indicating both good accuracy (0 is the
expected value) and good precision. Similarly, the �15N values of the pulses
were -0.012 +/- 0.1‰ relative to the reference pulse value showing oxygen and
nitrogen isotopes can be measure with equal accuracy and a precision of +/-
0.1‰ by the IRMS.
2.2.2 Introducing a Secondary Source of N2O for Analysis: Headspace Extraction
The precision of the on-line extraction system coupled to the IRMS was
tested by analysis of vials containing N2O. The 12mL glass vials capped with

36
rubber septa (LabCo) were filled with N2O on a custom gas flushing rack using a
tank of 100ppm (+/- 2%) N2O in helium (Airgas). This is roughly equal to the
amount of N2O produced from100nmol nitrate solutions. Vials were flushed for 5
minutes at a flow rate of 40mL/min, which purges the headspace approximately
16 times (refer to Appendix D for full details). The N2O is extracted from the vial
headspace, passing through all purification traps, before being concentrated in
the focus loop as discussed in section 2.2.3. The N2O then passes through the
GC column and into a second open split capillary (0.68 mm diameter) while the
sample gas enters the IRMS via a second sniffing capillary (0.50mm diameter).
The position of the GC capillary is controlled by a pneumatic piston plunger, and
is lowered below the helium and sniffing capillaries just before the sample leaves
the GC column and raised thereafter. The N2O sample peak eluting from the GC
produces a Gaussian shape peak (Figure 2.9), but it can still be integrated and
compared against the areas of square N2O reference peak.
Figure 2.9: 100ppm N2O peak preceded by reference peaks

37
The width and elution time of this peak is a function of the flow rate out of the GC
column, which is a result of the GC helium pressure. If the flow from the helium
carrier gas is increased, the sample peaks will elute sooner, but decreases the
separation of gases that can cause interferences with the N2O analysis such as
CO2, which is an isobar of N2O (i.e. mass 44, 45, 46). The ideal helium pressure
to minimize retention time (~3 min) but still achieve good separation of CO2 is 12-
15 psi. The results of one particular analysis of 100ppm N2O flushed vials (n=52)
gives a peak area of 25.5 +/- 0.6 mV, which is a deviations of less than 2.5% of
each pulse. The standard deviation of �18O values of the N2O pulse relative to
the reference pulse was +/- 0.6. Likewise, �15N standard deviation was +/- 0.3.
These precisions have been achieved on a regular basis and reflect the best
precision possible for sample extraction and analysis.
2.2.3 Blank Signal
The investigation of the blank (nitrous oxide signal that originates from
sources other than denitrification of the sample nitrate), is important because if
the blank size in a given batch of samples is not small and reproducible it will
affect the isotopes measured from N2O. The N2O blank was thoroughly
investigated under many different scenarios: helium blanks, water blanks,
reagent blanks, prepared bacterial solution blanks, and method blanks. All of
these are considered to be ‘blanks’, as they do not contain any supplementary
NO3- which could be converted to N2O.
The first blank tests were on the helium purged vials and water. Since a
large amount of helium gas is used as the online extraction carrier gas, trace
amounts of N2O in the helium could contribute to the overall blank. Using the
headspace extraction protocol, extraction of helium purged vials did not produce
any observable N2O signal, showing the high purity helium purge gas is free of
detectable N2O. If the initial atmospheric air in vials was not flushed out and
replaced with helium, the N2O found as a trace gas in the atmosphere

38
(315ppb15), would be an additional blank in the headspace extraction. Based on
the 12ml vial volume and 315 ppb mixing ratio, the blank from air would be 0.155
nmol. The absence of any detectable N2O in the helium vials demonstrates that
N2O from air has been largely eliminated during the helium flushing procedure.
When nitrate is added to the bacteria during normal sample analysis, it is
dissolved in 1-2 ml of water. This water is saturated with N2O according to
Henry’s Law29,
[N2O(aq)] = kH-N2O *pN2O
where kH-N2O is the Henry’s Law constant of N2O and pN2O is the partial pressure
of N2O in air, which yields a saturation concentration of N2O in water of 7.8
nmol/L. Therefore, if 1mL of water is added to a flushed vial, only 7.8�picomoles
of N2O have been introduced, which is negligible. This solution blank was tested
using vials containing only water and only broth (un-inoculated TSB). 1mL of
solution was added to multiple vials that were capped and flushed with helium to
dispel any air in the vial. Headspace extraction and IRMS analysis of both tests
showed no detectable N2O from either the water only or the broth only blank
vials.
2.2.4 Blank from Bacterial Growth and Preparation
The blank size as a result of the prepared P. Aureofaciens growth solution
(method blank) was also investigated. In this situation, the bacteria were grown
in a media solution containing a large amount of nitrate. This nitrate should be
completely reduced to N2O during the growth period; failure to remove
unreduced nitrate by rinsing or N2O that is saturated in the solution could be a
significant blank. After the bacteria were grown in large batches, vials were
prepared by adding 1mL of water, flushing on the gas rack, and then injecting
1mL of the prepared P. Aureofaciens solution through the septa. The mixture

39
was allowed to sit for 1 hr, after which the bacteria were lysed by adding with
NaOH. This procedure simulated the complete sample handling protocol (with no
added NO3-). A peak area of roughly 0.8 V/s was observed when the pelletized
bacteria solution was reacted with water, but without any purging of helium
(Figure 2.10). Time trials of 1,2, and 3 hours bubbling with helium in a gas
bubbler before inoculation showed that 2 hours of helium purging sufficiently
reduces the method blank (Figure 2.10). These results prompted further testing
of peak area reduction in greater detail.
Figure 2.10: Blank size of P. Aureofaciens and water versus helium purging time
Using the bacterial growth solution, without pelletizing the bacteria or any
further preparation step, resulted in an massive blank signal of 15.7 (Scenario 1,
Figure 2.11). The second scenario (Figure 2.11) involved rinsing the bacterial
solution with a nitrate-free medium. Peak areas were reduced to 1.2 +/- 0.1.
Additional tests revealed that purging the growth solution with helium for 2 hrs
immediately following centrifugation, but before allowing the bacterial solution to
react with any other reagent, resulted in peak area of 0.1 +/- 0.04 (Scenario 3,

40
Figure 2.11), a factor of 10 less in both the average signal and standard deviation
when compared to a solution that was not purged (Table A.3). Table A.4 shows
the results of the peak area of bacteria and water blanks (1mL each of bacteria
and water only in a vial, no NO3-), averaging 1.3 +/- 1.5 (Scenario 4, Figure 2.11)
when the solution was stored overnight in the original polycarbonate bottle under
air headspace. Once the prepared bacterial solution has been bubbled, it is
important to store the solution under helium until the next day. Later tests
showed that by replacing the air headspace with helium reduces the blank by a
factor of 10 to 0.2 +/- 0.08. (Scenario 5, Figure 2.11). A final blank test revealed
that by rinsing the bacterial solution, purging for 2 hr., storing under helium
headspace overnight, and repeating the 2 hr purge the following day eliminated
the blank signal altogether (Scenario 7, Figure 2.11) when compared to the peak
area of 0.4 +/- 0.05 when rinsing, purging, sitting overnight under helium
headspace, and inoculating without a second purge (Scenario 6, Figure 2.11).
This means that not only does the helium serve to make the headspace
anaerobic, but it also helps to reduce the signal of the blanks. Since the bottles
used for growth have a wide plastic cap, the use of the 125mL glass bottle with a
septum seal cap made helium flushing much easier and less uncertain that air
would be able to mix. The glass bottles are also sterilized in an autoclave before
use to avoid contaminants. A prepared bacteria solution sitting overnight under
helium headspace must be used the following day; it cannot sit for 2 nights and
then be used on the third day.
Tests of the method blank peak size based on the number of purging
hours shows that a 2hr purge of helium, using a 250mL gas washing bottle with a
fritted disk (Ace Glass, Inc.), is sufficient and greatly reduces the size of the blank
(Tables A.3 and A.4). Tests were then conducted to see if the blank could be
reduced by reversing the procedure (Scenario 7, Figure 2.11); by first adding
bacteria to the vials, conducting a second helium flush of individual vials and then
adding water. This resulted in elimination of blank peak areas.

41
The second flushing the bacteria removes any leftover nitrous oxide that
may have been produced overnight as well as any excess nitrate in the growth
solution. This blank has been associated with the growth media (or bacteria
within) as it can vary between different batches of media, but has not shown to
vary significantly within samples prepared by a single batch. Therefore, a blank
is measured and can be applied as a constant correction to all of the samples
within a run. The sample blank size (Peak Area= <0.3 V/s) is and should be a
very low percentage of the sample. A small blank size has been found to be
reproducible on a daily basis due to the bacterial solution purging with helium gas
multiple times throughout the preparation process. The peak area of the method
blank has been shown to be reproducible amongst a batch of samples; therefore,
an offset correction can be made for the isotopic fractionation22.
Figure 2.11: Peak areas of bacterial blanks from different scenarios:
1) No rinse, no purge, 2) Rinse, no purge, 3) Rinse, then 2 hr purge, 4) Rinse, sit overnight in air headspace,
5) Rinse, sit overnight in helium headspace, 6) Rinse, 2 hr purge, sit overnight in helium headspace, and
7) Rinse, 2 hr purge, sit overnight in helium headspace, 2 hr purge.
42
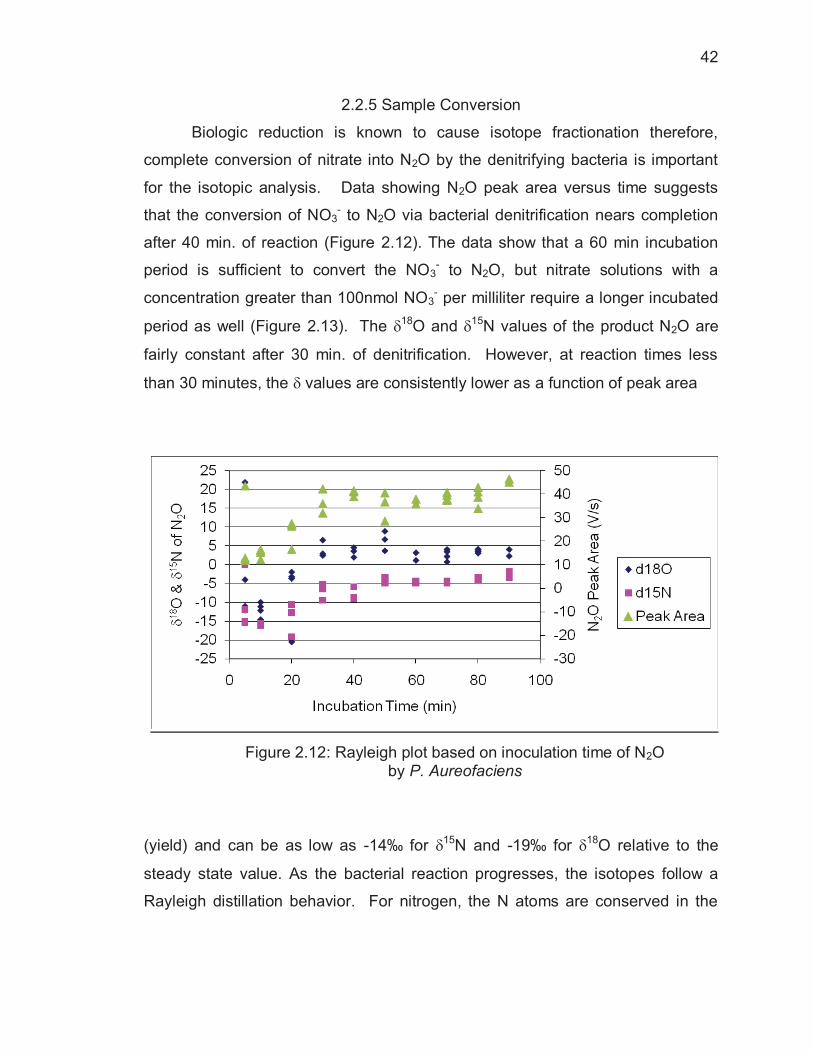
2.2.5 Sample Conversion
Biologic reduction is known to cause isotope fractionation therefore,
complete conversion of nitrate into N2O by the denitrifying bacteria is important
for the isotopic analysis. Data showing N2O peak area versus time suggests
that the conversion of NO3- to N2O via bacterial denitrification nears completion
after 40 min. of reaction (Figure 2.12). The data show that a 60 min incubation
period is sufficient to convert the NO3- to N2O, but nitrate solutions with a
concentration greater than 100nmol NO3- per milliliter require a longer incubated
period as well (Figure 2.13). The �18O and �15N values of the product N2O are
fairly constant after 30 min. of denitrification. However, at reaction times less
than 30 minutes, the � values are consistently lower as a function of peak area
Figure 2.12: Rayleigh plot based on inoculation time of N2O by P. Aureofaciens
(yield) and can be as low as -14‰ for �15N and -19‰ for �18O relative to the
steady state value. As the bacterial reaction progresses, the isotopes follow a
Rayleigh distillation behavior. For nitrogen, the N atoms are conserved in the

43
2NO3-�N2O reaction, so the Rayleigh fractionation will be a function of the
reaction progress. A Rayleigh plot, shown below, was plotted to show the effect
of isotopic fractionation on �18O and �15N values. This figure shows that isotopic
fractionation between NO3- and product N2O is somewhat large. At 100%
conversion, the �15N value in N2O will be the same as the �15N in the starting
NO3-. For oxygen, kinetics will control the isotopic effects because there is a loss
of five of the six nitrate’s oxygen atoms during the conversion to N2O. This kinetic
isotope effect (KIE) causes the N2O to be enriched in 18O compared to initial
nitrate, even at 100% conversion. However, the data show that when >90%
yields are achieved the �18O value is consistent and the actual �18O value of the
nitrate can be determined using reference materials because the KIE will be the
same. The �18O and �15N values are fairly constant after 30 min, while the range
of � values is ~14 for �15N and ~19 for �18O over the same time period. If the
bacterial reaction doesn’t go to completion, the Rayleigh process is shut down
and this will not be true.
2.2.6 Results of Standard Analyses
The resulting precision and accuracy of the complete method was
assessed using a large number of analyses of our nitrate standards (Table A.5).
A typical voltage to time plot of one nitrate analysis is shown in Figure 2.13. The
main visual difference between the 100ppm N2O or blank analysis is the
presence of CO2 (an isobar of N2O) that appears as a small peak just before the
N2O peak. The software “interprets” this peak as N2O and the high natural
abundance of 13C relative to 15N results in high �15N and �18O values (100’s of ‰)
for this “N2O”, which is actually CO2. This highlights why the Plot-Q column
needs to effectively separate CO2 and N2O; even a 1% contribution from CO2
could change the N2O values by 10‰ (using isotope mass balance). Over the
course of one batch of standards, N2O peaks consistently appear on the
chromatogram at the 3 minute mark (+/- 3 sec.) when the helium flow is 15psi.
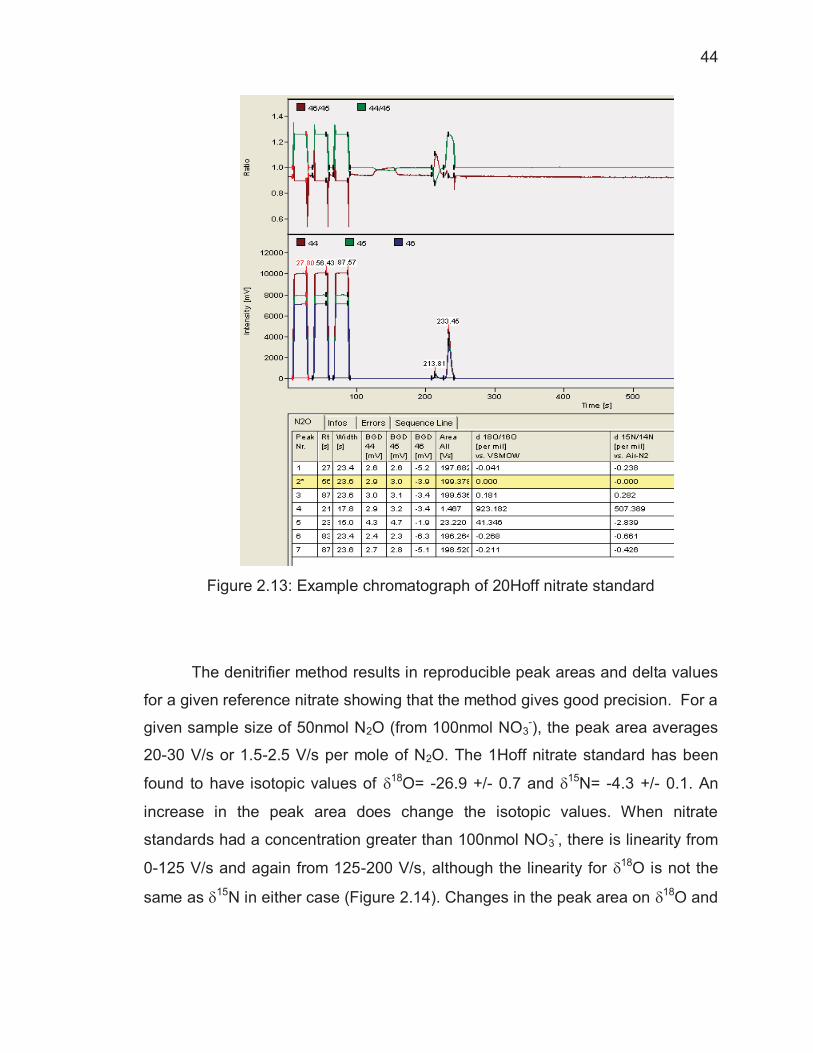
44
Figure 2.13: Example chromatograph of 20Hoff nitrate standard
The denitrifier method results in reproducible peak areas and delta values
for a given reference nitrate showing that the method gives good precision. For a
given sample size of 50nmol N2O (from 100nmol NO3-), the peak area averages
20-30 V/s or 1.5-2.5 V/s per mole of N2O. The 1Hoff nitrate standard has been
found to have isotopic values of �18O= -26.9 +/- 0.7 and �15N= -4.3 +/- 0.1. An
increase in the peak area does change the isotopic values. When nitrate
standards had a concentration greater than 100nmol NO3-, there is linearity from
0-125 V/s and again from 125-200 V/s, although the linearity for �18O is not the
same as �15N in either case (Figure 2.14). Changes in the peak area on �18O and

45
�15N can be corrected for using the equation of the line when ��is plotted versus
peak area, using the line from the appropriate set of peak area linearity.
Figure 2.14: Change in �18O when nitrate concentration increases
A large number of analyses of the four working reference nitrates were
conducted as a measure of the accuracy of the method. IRMS analyses resulted
in the isotopic values in the following table, relative to VSMOW and N2-Air,
respectively:
Table 2.3: Example of typical isotopic values (‰) for calibrated standards
18Omeasured 18Oactual 15Nmeasured 15Nactual
20Hoff 41.8 54.1 -1.5 0.5
10Hoff 10.7 17.6 4.6 7.9
1Hoff -19.9 -15.2 11.9 14.6
NC32 -25.1 -18.8 12.6 15.3

46
Figure 2.15: �18O and �15N of example standard analysis
The measured �18O and �15N are the isotopic values measured by the
IRMS relative to the tank N2O reference gas. The expected values have been
determined based on reference calculations (section 2.1.4). The difference
between the measured and actual (calculated) �15N isotopic values can be
attributed to the difference in the N2O reference tank, whereas the same
differences in �18O are caused by fractionation during nitrate reduction as well as
the tank. A calibration curve is constructed using the accepted isotopic values
(based on calculation or prior calibration measurements) and the measured
isotopic values of the standards. The equation of the line can be used to
transform the measured δ15N and δ18O values into the correct values relative to
N2-Air and SMOW.

47
2.2.7 Background Signal
A large number of analyses led to the conclusion that in order to achieve
reliable results, it is very important that the background levels of masses 44, 45,
and 46 be low (<10 mV) and stable (Figure 2.16). Figure 2.17 shows the poor
precision of isotopic values when the background is unstable. In an attempt to
control the stability of background levels, a number of treatments were tested to
observe how background levels affected the precision of isotopic values: sample
capillary in the open split, GC column heating, and using a coldtrap. Initially, the
sample capillary coming from the GC column into the open split was always left
below the sniffer capillary and the IRMS was exposed to all gases eluting from
the column over time. The procedure was adjusted so that the sample capillary
is lowered into the open split just before the sample N2O gas leaves the GC
column and is again raised just after the entire N2O peak has eluted. The
hypothesis was that compounds such as water and VOCs might build up in the
Plot-Q column and then bleed out over time causing isobaric inferences. Initially,
the GC column was baked out daily at 280�C to purge any gases that might
slowly elute and contribute to background isobaric interferences (e.g H2O).
Monitoring the background over a 48 hour period showed the background signal
peaks and valleys every 12 analyses (3 hours), supporting the hypothesis that
some compound with a long retention time was eluting and introducing a
prolonged isobaric interference (Figure 2.18). To help limit the build up of these
contaminating gases, a -80�C ethanol slush coldtrap was added to the extraction
lines following the GC to trap any remaining water or low vapor pressure VOCs
that may have made its way through the extraction system. Figure 2.19 shows
that although the coldtrap reduced the background signal, there is still a jump in
the values every 10 analyses or so. Reproducible low and stable background
levels were achieved (Figure 2.20) by altering the procedure so that the after
N2O has eluted, the Plot-Q column is baked at 380�C for 10 minutes, followed by
a 3 minute cool down that brings the column back to ambient temperatures
before the next analysis. Having a low stable background at 44, 45, and 46 amu

48
improved standard deviations of nitrate standard analyses considerably from +/-
5‰ before these new procedures to an acceptable +/- 0.5‰ in most runs after
the new treatments were implemented.
Figure 2.16: Stable backgrounds give isotopic values with low standard
deviations
Figure 2.17: Unstable backgrounds produce unreliable isotopic values

49
Figure 2.18: High, unstable background levels when the GC column is baked
prior to each batch of sample analyses.
Figure 2.19: Reduced background levels with the addition of a -80�C Coldtrap.

50
Figure 2.20: Low, stable backgrounds as a result of backing out the GC column
during each sample vial analysis and using the -80�C cold trap.
2.2.8 Impact of pH and Pre-Concentration on �15N and �18O
The ideal nitrate sample size and concentration for this method is based
on the blank size and limitations of the extraction system. Ideally, a blank signal
with a peak area of 1% or less of the sample area will give good precision and
accuracy. Since the procedural blank results in a signal area of 0.3 V/s or less
(see section 2.2.4), a sample peak area over 30 V/s is desirable. Analysis of the
100 ppm N2O tank (50 nmol per 12ml vial) yields peak areas of ~35 V/s. Nitrate
samples/references should then be measured out at 100nmol of NO3-, which
would result in 50 nmol N2O to achieve good precision/accuracy. In terms of
liquid samples, injecting 1 ml of sample solution is easy to handle, so to achieve
the 100 nmol requirement, the nitrate concentration of the sample needs to be
6.3mg/L. Samples with higher concentrations can be diluted or a smaller volume
injected. If the nitrate concentration is less than 6.3 mg/L, the method is limited
by the volume that the 12ml vial can hold. A maximum of 3 mL of sample

51
solution can be added before the total volume (sample plus the volume of the
bacteria reagents) begins to rise to a level that the helium purge may force liquid
out the exit hole of the double needle. Therefore, the low limit is ~2 mg/L of
nitrate; this ensures sufficient nitrate for analysis but also allows for efficient
headspace extraction. Many environmental samples often have nitrate
concentrations below this level. For example, nitrate is 35 �g/L in Lake Tahoe’s
water column30. Soil extracts and aerosol filters may also be in the ug/L level. In
these instances, the sample must be pre-concentrated.
Little research has been published on the impact of pre-concentration
methods on isotopic composition of nitrate. Three pre-concentration techniques
were tested: freeze-drying, evaporation, and ion chromatography. In each test,
standards were tested for their isotopic composition after pre-concentration.
Approximately 1mL of a 100ppm liquid nitrate standard was added to a 15mL
plastic centrifuge tube (FisherSci) and amended with a 14mL acidic (100, 10, or
1�M H2SO4) or basic (0.1M Na2CO3) solution to a specific pH to simulate
samples that are not neutral, such as rainwaters. After preparation, both sets of
samples were evaporated in an oven at 80�C for up to two days or freeze-dried
on a centrifuge for ~6-8 hrs. When the pH of a nitrate solution is of a value other
than 7, peak areas and �15N and �18O values are negatively affected. At pH <7,
the peak area decreases dramatically when the acidity increases (Figure 2.21).
As shown in Figures 2.22 and 2.23, the isotopic values from acidic nitrate
samples are very unreliable.
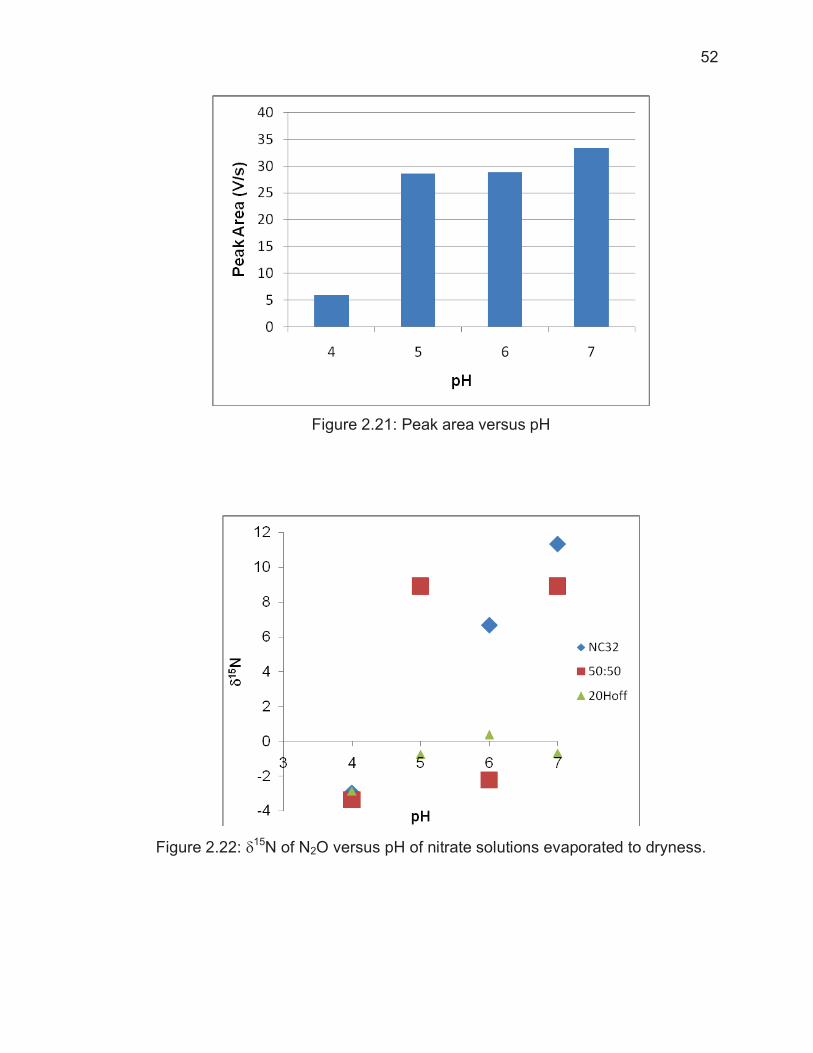
52
Figure 2.21: Peak area versus pH
Figure 2.22: �15N of N2O versus pH of nitrate solutions evaporated to dryness.

53
Figure 2.23: �18O N2O versus pH of nitrate solutions evaporated to dryness.
Although it is easier to let nitrate samples evaporate to dryness during pre-
concentration, samples must be evaporated only until the volume is just less than
or equal to 2mL. (Evaporation to dryness greatly increases the risk of vaporizing
off NO3- as HNO3, which in turn has an isotope effect.) This also results in the
production of nitric acid and subsequent volatilization or exchange with water at
low pH levels:
H+ + NO3- � HNO3(aq) � HNO3(g)
keq= [H+][NO3-]/[HNO3]
When NO3- is lost, the change in isotopes left in solution is exhibited in the
decreasing yields (Figure 2.21). At low pH, isotope fractionation appears to be
happening via volatilization because both �15N and �18O are impacted while
exchange with H2O would only impact �18O (Figures 2.22 and 2.23). What seems
to be happening is that the NO3- is volatilizing off as HNO3.
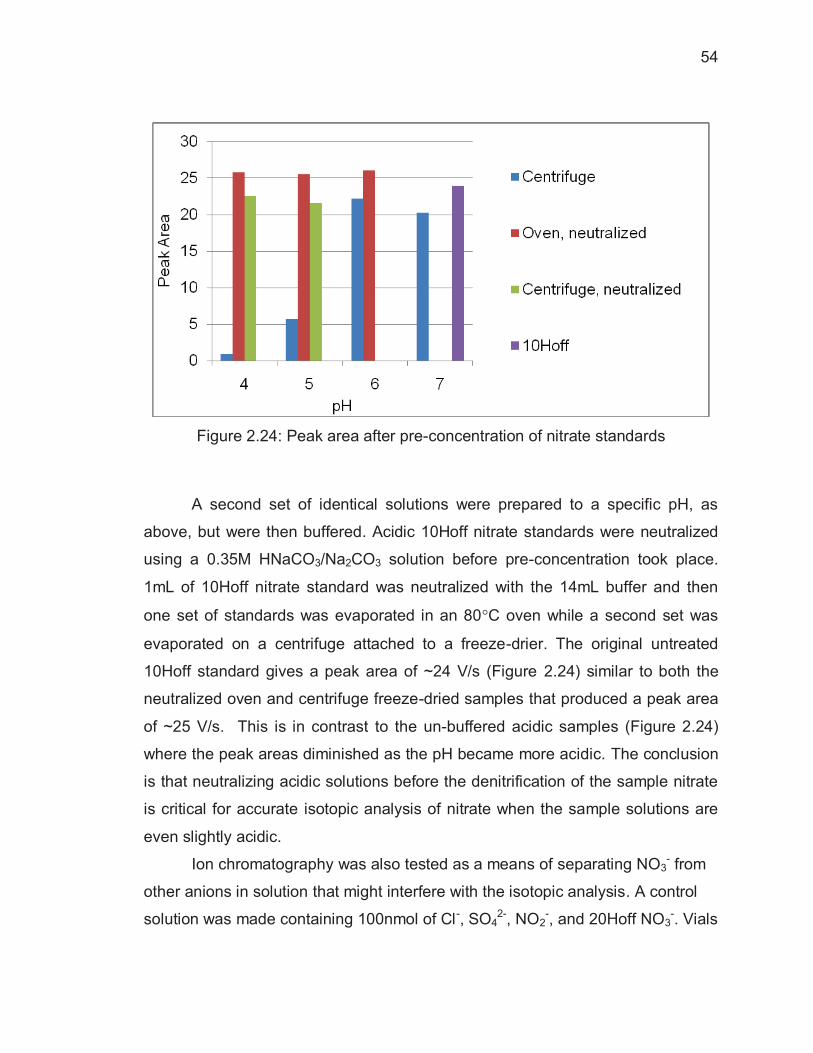
54
Figure 2.24: Peak area after pre-concentration of nitrate standards
A second set of identical solutions were prepared to a specific pH, as
above, but were then buffered. Acidic 10Hoff nitrate standards were neutralized
using a 0.35M HNaCO3/Na2CO3 solution before pre-concentration took place.
1mL of 10Hoff nitrate standard was neutralized with the 14mL buffer and then
one set of standards was evaporated in an 80�C oven while a second set was
evaporated on a centrifuge attached to a freeze-drier. The original untreated
10Hoff standard gives a peak area of ~24 V/s (Figure 2.24) similar to both the
neutralized oven and centrifuge freeze-dried samples that produced a peak area
of ~25 V/s. This is in contrast to the un-buffered acidic samples (Figure 2.24)
where the peak areas diminished as the pH became more acidic. The conclusion
is that neutralizing acidic solutions before the denitrification of the sample nitrate
is critical for accurate isotopic analysis of nitrate when the sample solutions are
even slightly acidic.
Ion chromatography was also tested as a means of separating NO3- from
other anions in solution that might interfere with the isotopic analysis. A control
solution was made containing 100nmol of Cl-, SO42-, NO2
-, and 20Hoff NO3-. Vials

55
were aliquoted with 0.75mL of the anion solution into a 15mL centrifuge tube
using a pipet and diluted with 14.25 mL of water. The “separation method” uses
the ion chromatography as a preparative device (as opposed to analytical device)
and the entire 15mL is pumped onto the column. Once loaded onto the column,
the anions are eluted using a Na2CO3/NaHCO3 eluent as the mobile phase. Initial
separations did not completely separate NO2- from NO3
- (Figure 2.25a). The
pump speed and mobile phase solution strengths were modified and NO3- can
successfully be separated from Cl- and SO42- in the same samples (Figure
2.25b). Volumes of the eluted nitrate peaks are ~ 2-3 ml and still have trace
bicarbonate and therefore can be further freeze dried without risk of isotopic
alteration. The denitrifier method was used to determine the isotopic values of
the separated 20Hoff NO3- solutions and standard deviations were low and less
than 0.7‰.
Figure 2.25: Ion chromatography used to separate NO3- from other anions:
a) initially, NO2- and NO3
- were not fully separated (left), but b) NO3
- successfully separated from NO2- and other ions.

56
2.2.9 �15N and �18O Analyses of Precipitation Samples
The denitrifier method, as described in this thesis, was used to collect data
on the �18O and �15N of nitrate extracted from rainwater at collected from two
regions. The first region was precipitation samples from Hong Kong, China
provided by the Global Network of Isotopes in Precipitation (GNIP) as part of the
International Atomic Energy Agency (IAEA)/World Meteorological Organization
(WMO) Isotopes-in-Precipitation Network project. The second set was rainwater
collected weekly over three years at three sites in Indiana and Illinois (details can
be found in Masters Thesis of David F. Mase). Nitrate in monthly rainwater in
Hong Kong had a range of �18O= +26.7 to +66.5‰ and �15N= -19.2 to +1.9‰
(Figures 2.26 and 2.27). The Midwestern sites had a range of �18O= +63.6 to
+87.0‰ and �15N= -16.3 to +20‰. Both sites exhibit a range of �18O that has
been published in recent studies and some seasonal variations are
observed35,36,37. The �15N range is typically within the values observed in
atmospheric nitrate, but there are clear instances of �15N above 10‰ and below -
10‰ which is atypical of atmospheric nitrate �15N values published in the existing
literature36,38,39,40. A full description and interpretation of the meaning of the �18O
and �15N values in these precipitation nitrates is beyond the scope of this thesis,
which is based on developing the analytical method, but will be discussed in
forthcoming publications by David Mase, Greg Michalski, and Lindsey Crawley.

57
Figure 2.26: �18O of Nitrate in Hong Kong Rainwater
Figure 2.27: �15N of Nitrate in Hong Kong Rainwater
2.3 Conclusion
The denitrifier method has shown to be a fully compatible method for the
simultaneous measurements of 18O/16O and 15N/14N of nitrate. Pre-concentration
of nitrate samples using evaporation methods has been proven to reflect the
original isotopic signature of samples provided that the solution is neutralized
prior to denitrification. We are proud to report that the denitrifier method has been

58
successfully implemented into the Michalski Stable Isotope Lab as a fully
operational method for the nitrogen and oxygen isotopic analysis of nitrate. The
denitrifier method has been used to determine the nitrogen and oxygen
composition of rainwater sample from the Midwestern United States and Hong
Kong, China. Continued work for the triple oxygen isotope composition of nitrate
using thermal decomposition by fellow labmates is expected to ensue in the near
future.

59
LIST OF REFERENCES
1. Kendall, C. Tracing Nitrogen Sources and Cycling in Catchments. In Isotope Tracers in Catchment Hydrology, Kendall, C., McDonnell, J. J., Eds.; Elsevier Science: Amsterdam, 1998; pp 519-576.
2. Galloway, J. N.; Schlesinger, W. H.; Levy, H., II; Michaels, A.; Schnoor, J. L. Nitrogen fixation: anthropogenic enhancement-environmental response. Global Biogeochem. Cycles 1995, 9 (2), 235-252.
3. Criss, R. E. Principles of stable isotope distribution /; Oxford University Press, New York, 1999.
4. Coplen, T. B.; Hopple, J. A.; Bohlke, J. K.; Peiser, H. S.; Rieder, S. E.; Krouse, H. R.; Rosman, K. J. R.; Ding, T.; Vocke, Jr. R. D.; Revesz, K.; Lamberty, A.; Taylor, P.; De Bievre, P. Compilation of Minimum and Maximum Isotope Ratios of Selected Elements in Naturally Occurring Terrestrial Materials and Reagents; U.S. Geological Survey; U.S. Department of the Interior: Jun, 02.
5. Criss, R. E. Principles of stable isotope distribution; Oxford University Press, New York, 1999.
6. Postgate, J. R. Nitrogen Fixation; E. Arnold: London, 1978.pp. 1-67.
7. Hogberg, P. Tansley review No 95 - N-15 natural abundance in soil-plant systems. New Phytologist 1997, 137 (2), 179-203.
8. Galloway, J. N.; Dentener, F. J.; Capone, D. G.; Boyer, E. W.; Howarth, R. W.; Seitzinger, S. P.; Asner, G. P.; Cleveland, C. C.; Green, P. A.; Holland, E. A.; Karl, D. M.; Michaels, A. F.; Porter, J. H.; Townsend, A. R.; Vorosmarty, C. J. Nitrogen cycles: past, present, and future. Biogeochemistry 2004, 70 (2), 153-226.
9. Russell, K. M.; Galloway, J. N.; Macko, S. A.; Moody, J. L.; Scudlark, J. R. Sources of nitrogen in wet deposition to the Chesapeake Bay region. Atm. Envir. 1998, 32 (14-15), 2453-2465.

60
10. Luz, B.; Barkan, E. The isotopic ratios 17O/16O and 18O/16O in molecular oxygen and their significance in biogeochemistry. Geochim. Cosmochim. Acta 2005, 69 (5), 1099-1110.
11. Kawakami, S.; Kondo, Y.; Koike, M.; Nakajima, H.; Gregory, G. L.; Sachse, G. W.; Newell, R. E.; Browell, E. V.; Blake, D. R.; Rodriguez, J. M.; Merrill, J. T. Impact of lightning and convection on reactive nitrogen in the tropical free troposphere. J. Geophys. Res. 1997, 102 (D23), 28367-28384.
12. Heaton, T. H. E. Nitrogen-15/nitrogen-14 ratios of nitrate and ammonium in rain at Pretoria, South Africa. Atm. Envir. 1987, 21 (4), 843-852.
13. Elliott, E. M.; Kendall, C.; Wankel, S. D.; Burns, D. A.; Boyer, E. W.; Harlin, K.; Bain, D. J.; Butler, T. J. Nitrogen isotopes as indicators of NOx source contributions to atmospheric nitrate deposition across the Midwestern and northeastern United States. Envir. Sci. Tech. 2007, 41 (22), 7661-7667.
14. Heaton, T. H. E. Isotopic studies of nitrogen pollution in the hydrosphere and atmosphere: A review. Chem. Geol. 1986, 59 (1), 87-102.
15. Nevison, C. D.; Mahowald, N. M.; Weiss, R. F.; Prinn, R. G. Interannual and seasonal variability in atmospheric N2O. Global Biogeochemical Cycles 2007, 21 (3).
16. Russow, R.; Knappe, S.; Ritzkowski, E. M. Estimating plant-available N-15 and its impact on the N-15 dilution measurement of the symbiotic biological nitrogen fixation of red clover grown on different soils. Isoto. Envir. Health Stud. 1997, 33 (4), 337-348.
17. Shearer, G.; Kohl, D. H.; Chien, S. H. N-15 Abundance in A Wide Variety of Soils. Soil Science Society of America Journal 1978, 42 (6), 899-902.
18. Galloway, J. N. The global nitrogen cycle: changes and consequences. Environmental Pollution 1998, 102 (Suppl. 1), 15-24.
19. Gat, J. R. Oxygen and hydrogen isotopes in the hydrologic cycle. Ann. Rev. Earth Plan. Sci. 1996, 24, 225-262.
20. Wrage, N.; Velthof, G. L.; van Beusichem, M. L.; Oenema, O. Role of nitrifier denitrification in the production of nitrous oxide. Soil Biology & Biochemistry 2001, 33 (12-13), 1723-1732.
21. Sigman, D. M.; Casciotti, K. L.; Andreani, M.; Barford, C.; Galanter, M.; Böhlke, J. K. A Bacterial Method for the Nitrogen Isotopic Analysis of Nitrate in Seawater and Freshwater. Anal. Chem. 2001, 73 (17), 4145-4153.

61
22. Casciotti, K. L.; Sigman, D. M.; Hastings, M. G.; Böhlke, J. K.; Hilkert, A. Measurement of the oxygen isotopic composition of nitrate in seawater and freshwater using the denitrifier method. Anal. Chem. 2002, 74 (19), 4905-4912.
23. Greenberg, E. P.; Becker, G. E. Nitrous-Oxide As End Product of Denitrification by Strains of Fluorescent Pseudomonads. Canadian Journal of Microbiology 1977, 23 (7), 903-907.
24. Glockner, A. B.; Jungst, A.; Zumft, W. G. Copper-Containing Nitrite Reductase from Pseudomonas-Aureofaciens Is Functional in A Mutationally Cytochrome-Cd(1)-Free Background (Nirs-) of Pseudomonas-Stutzeri. Archives of Microbiology 1993, 160 (1), 18-26.
25. Christensen, S.; Tiedje, J. M. Sub-Parts-Per-Billion Nitrate Method - Use of An N2O-Producing Denitrifier to Convert NO3- Or (NO3-)-N-15 to N2O. Applied and Environmental Microbiology 1988, 54 (6), 1409-1413.
26. Peix, A.; Valverde, A.; Rivas, R.; Igual, J. M.; Ramirez-Bahena, M. H.; Mateos, P. F.; Santa-Regina, I.; Rodriguez-Barrueco, C.; Martinez-Molina, E.; Velazquez, E. Reclassification of Pseudomonas aurantiaca as a synonym of Pseudomonas chlororaphis and proposal of three subspecies, P-chlororaphis subsp chlororaphis subsp nov., P-chlororaphis subsp aureofaciens subsp nov., comb. nov and P-chlororaphis subsp aurantiaca subsp nov., comb. nov. International Journal of Systematic and Evolutionary Microbiology 2007, 57, 1286-1290.
27. CRC Handbook of Chemistry and hysics: A Ready-Reference Book of Chemical and Physical Data. 85. 2004. Boca Raton, FL, CRC Press. 28. Böhlke J.K.; Mroczkowski, S. J.; Coplen, T. B. Oxygen isotopes in nitrate: new reference materials for 18O:17O:16O measurements and observations on nitrate-water equilibration. Rapid Comm. Mass Spec. 2003, 17, 1835-1846.
29. Seinfeld, J. H.; Pandis, S. N. Atmospheric chemistry and physics : from air pollution to climate change; 1 ed.; New York : Wiley: 1998.pp. -1326 p.
30. Goldman, C. R.; Carter, R. C. An investigation by rapid 14C bioassay of factors affecting the cultural eutrophication of Lake Tahoe, California-Nevada. Water Pollution Control Federation 37[7], 1044-1059. 1965. 31. Showers, W.J. Department of Marine, Earth, & Atmospheric Sciences, North Carolina State University, Raleigh-Durham, NC. Personal communication, 2009. 32. Ostwald, W. Improvements in the Manufacture of Nitric Acid and Nitrogen Oxides. G.B. Patent 190200698, Jan. 09, 1902.

62
33. Michalski, G.; Savarino, J.; Böhlke J.K.; Thiemens, M. Determination of the Total Oxygen Isotopic Composition of Nitrate and the Calibration of a D17O Nitrate Reference Material. Anal. Chem. 2002, 74, 4989-4993.
34. Kaiser, J.; Hastings, M. G.; Houlton, B. Z.; Röckmann, T.; Sigman, D. M. Triple oxygen isotope analysis of nitrate using the denitrifier method and thermal decomposition of N2O. Anal. Chem., 2007, 79 (2), 599–607.
35. Burns, D.A.; Kendall, C. Analysis of delta N-15 and delta O-18 to differentiate NO3- sources in runoff at two watersheds in the Catskill Mountains of New York. Water Resources Res., 2002, 38 (5).
36. Hastings, M.G.; Sigman, D.M.; Lipschultz, F. Isotopic evidence for source changes of nitrate in rain at Bermuda. J. Geophys. Res, 2003, 108 (24).
37. Spoelstra, J.; Schiff, S.L., Elgood, R.J.; Semkin, R.G.; Jeffries, D.S. Tracing the sources of exported nitrate in the turkey lakes watershed using N-15/N-14 and O-18/O-16 isotopic ratios. Ecosystems, 2001, 4 (6), 536-544.
38. Elliott, E. M.; Kendall, C.; Burns, D. A.; Boyer, E. W.; Lear, G. G.; Golden, H. E.; Harlin, K.; Bytnerowicz, A.; Butler, T. J.; Glatz, R. Dual nitrate isotopes in dry deposition: Utility for partitioning NOx source contributions to landscape nitrogen deposition. J. Geophys. Res.-Biogeosci, 2009, 114.
39. Savarino, J.; Kaiser, J.; Morin, S.; Sigman, D.M., Thiemens, M.H. Nitrogen and oxygen isotopic constraints on the origin of atmospheric nitrate in coastal Antarctica Atmos. Chem. Phys., 2007, 7 (8), 1925-1945.
40. Moravec, B.G.; Keller, C.K.; Smith, J.L.; Allen-King, R.M.; Goodwin, A.J.; Fairley, J.P.; Larson, P.B. Oxygen-18 dynamics in precipitation and streamflow in a semi-arid agricultural watershed, Eastern Washington, USA. Hydrol. Process, 2010, 24 (4), 446-460.

63
Appendix A: Tables of Related Data
Table A.1: 100ppm N2O standard deviation <1
Identifier Peak Area (mV/s) 100ppm N2O 26.129 100ppm N2O 24.992 100ppm N2O 26.292 100ppm N2O 25.998 100ppm N2O 25.715 100ppm N2O 25.738 100ppm N2O 25.834 100ppm N2O 26.081 100ppm N2O 26.276 100ppm N2O 25.864 100ppm N2O 26.288 100ppm N2O 25.935 100ppm N2O 26.219 100ppm N2O 26.323 100ppm N2O 26.077 100ppm N2O 26.280 100ppm N2O 26.035 100ppm N2O 25.752 100ppm N2O 25.444 100ppm N2O 23.945 100ppm N2O 24.547 100ppm N2O 25.323 100ppm N2O 25.538 100ppm N2O 25.471 100ppm N2O 25.510 100ppm N2O 25.521 100ppm N2O 25.546 100ppm N2O 25.566 100ppm N2O 25.556 100ppm N2O 25.447 100ppm N2O 23.584 100ppm N2O 24.625 100ppm N2O 24.978 100ppm N2O 25.360 100ppm N2O 25.418 100ppm N2O 25.868 100ppm N2O 25.496 100ppm N2O 25.316

64
100ppm N2O 25.537 100ppm N2O 25.552 100ppm N2O 25.389 100ppm N2O 25.582 100ppm N2O 24.274 100ppm N2O 24.561 100ppm N2O 24.949 100ppm N2O 25.025 100ppm N2O 25.831 100ppm N2O 24.297 100ppm N2O 25.563 100ppm N2O 25.235 100ppm N2O 25.089 100ppm N2O 24.711 25.5 Avg 0.6 Std Dev
Table A.2: Water blanks before helium purging
Identifier Peak Area (mV/s) PAur & Water 1.356 PAur & Water 1.069 PAur & Water 1.177 PAur & Water 1.162 PAur & Water 1.022 PAur & Water 1.045 PAur & Water 1.246 PAur & Water 1.213 PAur & Water 1.065 1.2 Avg 0.1 Std Dev

65
Table A.3: Water blanks after helium purging
Identifier Peak Area (mV/s) PAur & Water with Purging 0.277 PAur & Water with Purging 0.211 PAur & Water with Purging 0.168 PAur & Water with Purging 0.135 PAur & Water with Purging 0.115 PAur & Water with Purging 0.107 PAur & Water with Purging 0.269 PAur & Water with Purging 0.186 PAur & Water with Purging 0.161 PAur & Water with Purging 0.153 PAur & Water with Purging 0.144 PAur & Water with Purging 0.139 PAur & Water with Purging 0.117 PAur & Water with Purging 0.121 PAur & Water with Purging 0.119 PAur & Water with Purging 0.128 PAur & Water with Purging 0.127 PAur & Water with Purging 0.126 PAur & Water with Purging 0.136 PAur & Water with Purging 0.159 PAur & Water with Purging 0.135 PAur & Water with Purging 0.134 PAur & Water with Purging 0.120 PAur & Water with Purging 0.124 0.150 Avg 0.044 Std Dev
Table A.4: Peak areas and standard deviations before and after sitting overnight under helium headspace.
Identifier 1 Area All Bac in plastic, air headspace 5.528 Bac in plastic, air headspace 1.146 Bac in plastic, air headspace 1.079 Bac in plastic, air headspace 0.717 Bac in plastic, air headspace 0.740 Bac in plastic, air headspace 1.067 Bac in plastic, air headspace 0.875 Bac in plastic, air headspace 0.761 Bac in plastic, air headspace 0.480 Bac in plastic, air headspace 0.878 Bac in plastic, air headspace 1.172 Bac in plastic, air headspace 0.684

66
Bac in plastic, air headspace 6.844 Bac in plastic, air headspace 1.152 Bac in plastic, air headspace 0.711 Bac in plastic, air headspace 0.992 Bac in plastic, air headspace 0.857 Bac in plastic, air headspace 1.228 Bac in plastic, air headspace 0.910 Bac in plastic, air headspace 0.965 Bac in plastic, air headspace 1.221 Bac in plastic, air headspace 0.969 Bac in plastic, air headspace 1.087 Bac in plastic, air headspace 0.929 1.374 Avg 1.507 Std Dev Bac in autoclaved btl, flushed 0.249 Bac in autoclaved btl, flushed 0.141 Bac in autoclaved btl, flushed 0.122 Bac in autoclaved btl, flushed 0.140 Bac in autoclaved btl, flushed 0.205 Bac in autoclaved btl, flushed 0.206 Bac in autoclaved btl, flushed 0.149 Bac in autoclaved btl, flushed 0.195 Bac in autoclaved btl, flushed 0.160 Bac in autoclaved btl, flushed 0.131 Bac in autoclaved btl, flushed 0.137 Bac in autoclaved btl, flushed 0.487 Bac in autoclaved btl, flushed 0.206 Bac in autoclaved btl, flushed 0.200 Bac in autoclaved btl, flushed 0.282 Bac in autoclaved btl, flushed 0.211 Bac in autoclaved btl, flushed 0.171 Bac in autoclaved btl, flushed 0.154 Bac in autoclaved btl, flushed 0.149 Bac in autoclaved btl, flushed 0.160 Bac in autoclaved btl, flushed 0.230 Bac in autoclaved btl, flushed 0.155 Bac in autoclaved btl, flushed 0.275 0.196 Avg 0.078 Std Dev

67
Table A.5: Example nitrate standard analysis results
Identifier Peak Area BGD 44 BGD 45 BGD 46 �18O �15N 10Hoff 21.214 2.20 2.20 -8.90 18.278 -2.020 10Hoff 22.363 2.10 2.10 -8.70 18.860 -1.287 10Hoff 21.208 2.20 2.20 -8.50 19.726 -0.536 21.595 18.955 -1.281 Avg 0.665 0.729 0.742 Std Dev 20Hoff 27.580 2.20 2.10 -8.70 48.488 -6.875 20Hoff 27.495 2.10 2.00 -8.50 49.917 -7.184 20Hoff 28.562 2.10 2.00 -8.70 48.708 -8.309 27.879 49.038 -7.456 Avg 0.593 0.769 0.755 Std Dev NC32 20.867 2.20 2.20 -9.00 -16.487 5.148 NC32 18.531 2.20 2.10 -8.50 -16.664 5.416 NC32 19.740 2.10 2.00 -8.80 -16.536 4.563 19.713 -16.562 5.042 Avg 1.168 0.091 0.436 Std Dev
Table A.6: Example of good standard run for isotopic value correction
Identifier Peak Area BGD 44 BGD 45 BGD 46 �18O� �15N�
NC32 20.867 2.2 2.2 -9.0 -16.487 5.148 NC32 18.531 2.2 2.1 -8.5 -16.664 5.416 NC32 19.740 2.1 2.0 -8.8 -16.536 4.563 19.713 -16.562 5.042 Avg 1.168 0.091 0.436 Std Dev 10Hoff 21.214 2.2 2.2 -8.9 18.278 -2.020 10Hoff 22.363 2.1 2.1 -8.7 18.860 -1.287 10Hoff 21.208 2.2 2.2 -8.5 19.726 -0.536 21.595 18.955 -1.281 Avg 0.665 0.729 0.742 Std Dev 20Hoff 27.580 2.2 2.1 -8.7 48.488 -6.875 20Hoff 27.495 2.1 2.0 -8.5 49.917 -7.184 20Hoff 28.562 2.1 2.0 -8.7 48.708 -8.309 27.879 49.038 -7.456 Avg 0.593 0.769 0.755 Std Dev

68
Table A.7: Successful IC separation of NO3-
Identifier Peak Area �18O �15N
NO3- separation by IC 29.916 50.041 -3.069
NO3- separation by IC 27.068 50.639 -2.098
NO3- separation by IC 25.231 50.366 -2.518
NO3- separation by IC 23.548 49.629 -2.931
NO3- separation by IC 21.056 49.925 -3.036
NO3- separation by IC 21.182 50.680 -3.009
NO3- separation by IC 18.841 49.036 -3.999
NO3- separation by IC 18.695 49.604 -3.437
NO3- separation by IC 20.377 48.260 -4.866
NO3- separation by IC 24.726 50.023 -3.188
NO3- separation by IC 26.825 50.502 -2.513
NO3- separation by IC 29.453 49.779 -3.886
NO3- separation by IC 30.467 50.269 -2.930
NO3- separation by IC 30.809 49.705 -3.464
NO3- separation by IC 28.025 50.134 -2.987
25.081 49.906 -3.195 Avg 4.274 0.633 0.678 Std Dev
Table A.8: Hong Kong rainwater δ15N and δ18O analysis
Date (MM-YY) Sample ID �18O(‰) �15N (‰) Sep-92 Hong Kong 9209 930223 58.467 -1.161 Oct-92 Hong Kong 9210 931666 57.504 -0.752 Jan-93 Hong Kong 9301 932208 59.977 -13.568 Mar-93 Hong Kong 9303 932209 61.700 -1.821 Feb-94 Hong Kong 9402 942535 39.185 -2.828 Mar-94 Hong Kong 9403 942536 55.638 0.502 Jul-94 Hong Kong 9407 950211 44.130 1.543 Sep-94 Hong Kong 9409 950209 65.374 -0.004 Dec-94 Hong Kong 9412 950861 54.468 3.149 Feb-95 Hong Kong 9502 951707 62.782 1.259 Mar-95 Hong Kong 9503 951708 60.365 -0.516

69
Jul-95 Hong Kong 9507 960380 43.051 -9.167 Sep-95 Hong Kong 9509 960379 51.391 4.327 Mar-96 Hong Kong 9603 962593 52.318 0.995 Apr-96 Hong Kong 9604 962741 61.760 0.789 May-96 Hong Kong 9605 962742 38.538 -7.687 Jun-96 Hong Kong 9606 962743 41.098 -14.639 Jul-96 Hong Kong 9607 970429 50.240 -8.840 Aug-96 Hong Kong 9608 970430 54.306 -15.544 Sep-96 Hong Kong 9609 970431 64.698 -7.663 Oct-96 Hong Kong 9610 970868 47.130 -19.324 Nov-96 Hong Kong 9611 970867 60.257 -1.582 Jan-97 Hong Kong 9701 971403 50.961 -13.778 Feb-97 Hong Kong 9702 971404 57.177 0.632 Mar-97 Hong Kong 9703 971405 56.052 -18.404 Apr-97 Hong Kong 9704 971374 47.056 -12.563 May-97 Hong Kong 9705 971375 46.850 -12.368 Jun-97 Hong Kong 9706 971376 47.160 -6.539 Jun-97 Hong Kong 9706 980088 27.547 -3.590 Sep-97 Hong Kong 9709 980089 59.496 -15.993 Oct-97 Hong Kong 9710 986739 66.484 -1.298 Jan-98 Hong Kong 9801 981531 46.552 -10.628 Feb-98 Hong Kong 9802 981532 52.819 -7.577 Mar-98 Hong Kong 9803 981533 52.240 -12.402 Apr-98 Hong Kong 9804 981886 50.412 -11.665 May-98 Hong Kong 9805 981887 38.465 -11.030 Aug-98 Hong Kong 9808 990006 45.762 -18.534 Nov-98 Hong Kong 9811 990611 64.129 -12.181 Dec-98 Hong Kong 9812 990612 59.476 -3.805 Jan-99 Hong Kong 9901 991532 62.605 -3.802 Jul-99 Hong Kong 9907 700077 56.323 -5.242 Nov-99 Hong Kong 9911 700406 54.077 0.518 Mar-00 Hong Kong 0003 701365 50.096 2.349 Apr-00 Hong Kong 0004 702028 53.653 1.915 Jun-00 Hong Kong 0006 702030 26.715 -1.972 Jul-00 Hong Kong 0007 710011 49.426 -0.137 Aug-00 Hong Kong 0008 710012 52.274 2.291 Nov-00 Hong Kong 0011 710231 57.203 -0.235 Jan-10 Hong Kong 0101 710884 56.463 0.062 Feb-10 Hong Kong 0102 710885 67.177 0.889 Mar-10 Hong Kong 0103 710886 63.946 -0.020 Apr-10 Hong Kong 0104 711797 64.184 -0.603 May-10 Hong Kong 0005 702029 38.063 -8.444 Oct-10 Hong Kong 0010 710230 59.642 0.947

70
Oct-10 Hong Kong 0110 721434 63.222 -0.501 Nov-10 Hong Kong 0111 721418 64.579 -0.313 Dec-10 Hong Kong 0112 721419 57.539 0.645

71
Appendix B: Studies of Bacillus Halodenitrificans as a Potential Substitute for Pseudomonas Aureofaciens Using the Denitrifier Method
Figure B.1: Bacillus Halodenitrificans as a potential substitute in the denitrifier
method.
Additional investigations also focused on Bacillus halodenitrificans as a
substitute for Pseudomonas Aureofaciens using the denitrifier method. This
bacteria also contains the copper-containing nitrite reductase (which minimizes
the exchange) necessary for the catalyzation of nitrate, but still lacks the nitrous
oxide reductase, therefore conversion halts at N2O. B. halodenitrificans has the
advantage of being an anaerobic halotolerant (salt-tolerant) denitrifier. Many of
our samples have a high saline content; also pre-concentration techniques using
anion resin require elution using high ionic strength solutions. Further, high saline
growth solutions limit contamination from other bacteria or organisms. Some data
suggested that B. halodenitrificans worked but there were often inconsistent
results (N2O was not always produced). Initial results suggested that B.

72
halodenitrificans has the potential to replace P. Aureofaciens as the denitrifying
bacteria in the denitrifier method. This halotolerant bacterium is more precise in
�17O measurements and appears to be less prone to O2 exchange when
compared to P. Aureofaciens.

73
Appendix C: Studies of Δ17O of O2 Generated from Gold Disproportionation of N2O from P. Aureofaciens.
For a short time, research efforts also focused on the conversion of N2O
over a gold tube into both O2 and N2 using techniques adapted from Cascotti22
Kaiser34, and Michalski33. Currently, there is no published method that allows for
the simultaneous determination of δ18O, �15N, and �17O of nitrate. Some
preliminary data on �15N, �18O, �17O values of N2 and O2 generated by the
disproportionation of bacterial produced N2O by P. Aureofaciens has been
achieved (Figure 2.29). The yellow boxes in Figure 2.29 are the �17O values
(�17O≈0.52*�18O) of working standards based on their thermal decomposition
values. High �17O values are underestimated by 20-30%, partially due to
exchange blank and linearity. Detection limits are roughly 2‰. Unfortunately,
collapse of P. Aureofaciens around January 2010 limited further exploration of
the denitrifier method coupled to gold disproportionation and research was
refocused on the optimal growth of P. Aureofaciens.

74
Figure C.1: �17O values of N2 and O2 generated by the disproportionation of bacterial produced N2O.
75
Appendix D:
Nitrogen and Oxygen Isotope-ratio Analysis of Nitrate
by the Denitrifier Method Using Continuous Flow
Isotope-ratio Mass Spectrometry
Standard Operating Procedure (SOP)
Lindsey Crawley
09/01/2010

76
Step-by-Step Preparation for Isotopic Analyses
of Nitrate by Bacterial Denitrification
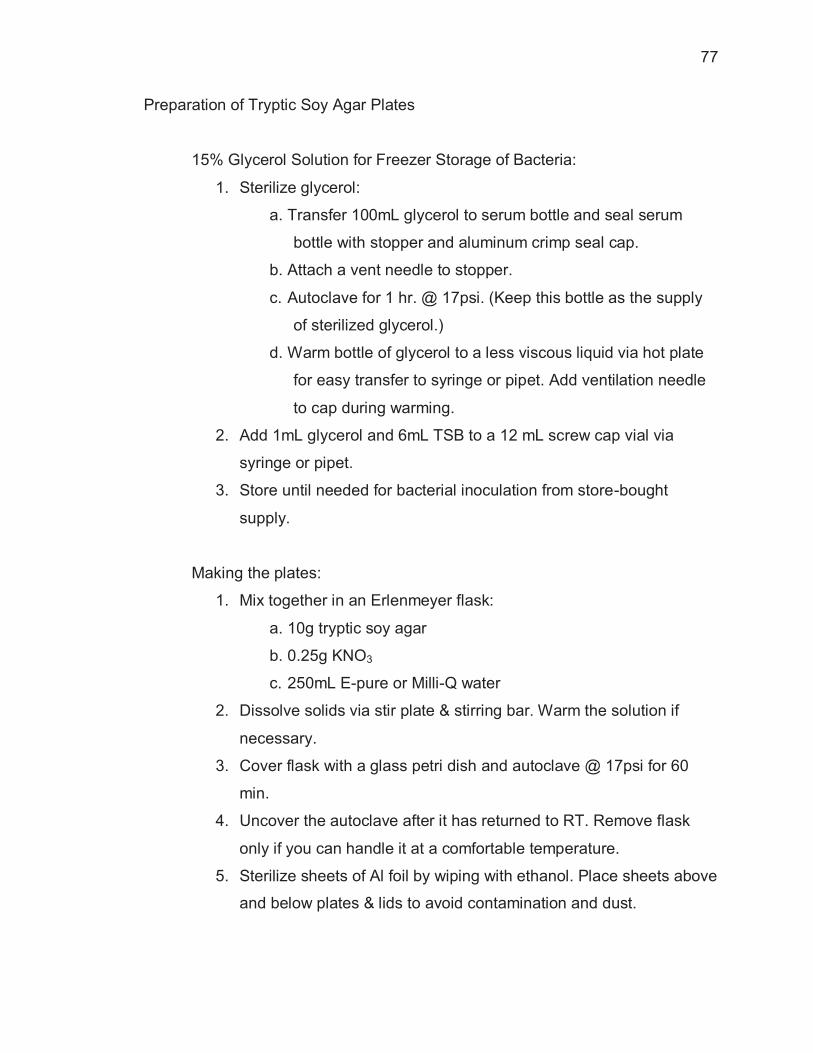
77
Preparation of Tryptic Soy Agar Plates
15% Glycerol Solution for Freezer Storage of Bacteria:
1. Sterilize glycerol:
a. Transfer 100mL glycerol to serum bottle and seal serum
bottle with stopper and aluminum crimp seal cap.
b. Attach a vent needle to stopper.
c. Autoclave for 1 hr. @ 17psi. (Keep this bottle as the supply
of sterilized glycerol.)
d. Warm bottle of glycerol to a less viscous liquid via hot plate
for easy transfer to syringe or pipet. Add ventilation needle
to cap during warming.
2. Add 1mL glycerol and 6mL TSB to a 12 mL screw cap vial via
syringe or pipet.
3. Store until needed for bacterial inoculation from store-bought
supply.
Making the plates:
1. Mix together in an Erlenmeyer flask:
a. 10g tryptic soy agar
b. 0.25g KNO3
c. 250mL E-pure or Milli-Q water
2. Dissolve solids via stir plate & stirring bar. Warm the solution if
necessary.
3. Cover flask with a glass petri dish and autoclave @ 17psi for 60
min.
4. Uncover the autoclave after it has returned to RT. Remove flask
only if you can handle it at a comfortable temperature.
5. Sterilize sheets of Al foil by wiping with ethanol. Place sheets above
and below plates & lids to avoid contamination and dust.

78
6. Pour agar into sterile petri dishes just so that the bottom is covered
but no more than half full, flaming the lip of the flask every 3-4
plates (250mL should make ~10 100x15 plates), leave the lids off
but cover dishes and lids sheets of ethanol-wiped aluminum foil to
avoid dust. Allow to solidify overnight.
7. Place covered petri dishes on top of one another into a Ziploc
freezer bag. Place one uncovered dish filled with Drierite in bottom
of bag.
a. Label the bag with the date that plates were poured.
Preparation of Bacterial Growth Solution from Colonies
1. Streaking the bacteria:
a. Locate the freezer stock of P. aureofaciens or desired
bacteria.
b. Flame the inoculating loop until the coil turns orange to kill
any bacteria. Touch the hot loop to an un-streaked portion
of the plate to cool the loop.
c. Dip the sterilized loop into the frozen stock of bacteria and
gently streak the bacteria across the width of the top 1/3 of
the plate in a back-and-forth S-shape motion.
d. Repeat step b.
e. Touch the loop to the medium just above the end of the last
streak and repeat S-shape motion in a perpendicular
direction from the first streak.
f. Repeat steps b & e for a third streak.

79
g. To make new plates from existing plates, pick a single
colony and proceed to streaking new plates using the flame
and streak steps above.
h. Plate numbering:
i. #1: Plate streaked from freezer stock
ii. #2: Plate streaked from Plate #1
iii. #3: Plate streaked from Plate #2
i. Plate identification:
i. Include: Strain (P. Aureofaciens would be appropriate
here)
ii. Plate #
iii. Date
j. Plates typically take 2-3 days to grow and should be left out
at RT.
k. After plates are spent, secure the lid in place with a strip of
Parafilm and place plates in the biohazard bag for disposal.
Contact REM for pick up when the box becomes full.
2. Inoculation of Bacteria:
a. Choose a colony of bacteria from a fully grown plate #2 or #3
using a sterilized inoculating loop then dip and swirl into one
250mL plastic bottle containing TSB.
b. 5-9 days growth time is optimal. The color will appear to be a
dark yellow-orange.
c. Test for incomplete conversion of nitrate by dipping one test
strip of Aqua Chek nitrate/nitrite test strips into each bottle
to be used. A negative result (pink) indicates proper
conversion of nitrate and the bottle may then be pelletized.
A positive result (off-white) indicates the presence of nitrate
and nitrate and may be re-capped and allowed to incubate
longer, up until the 9 day mark.
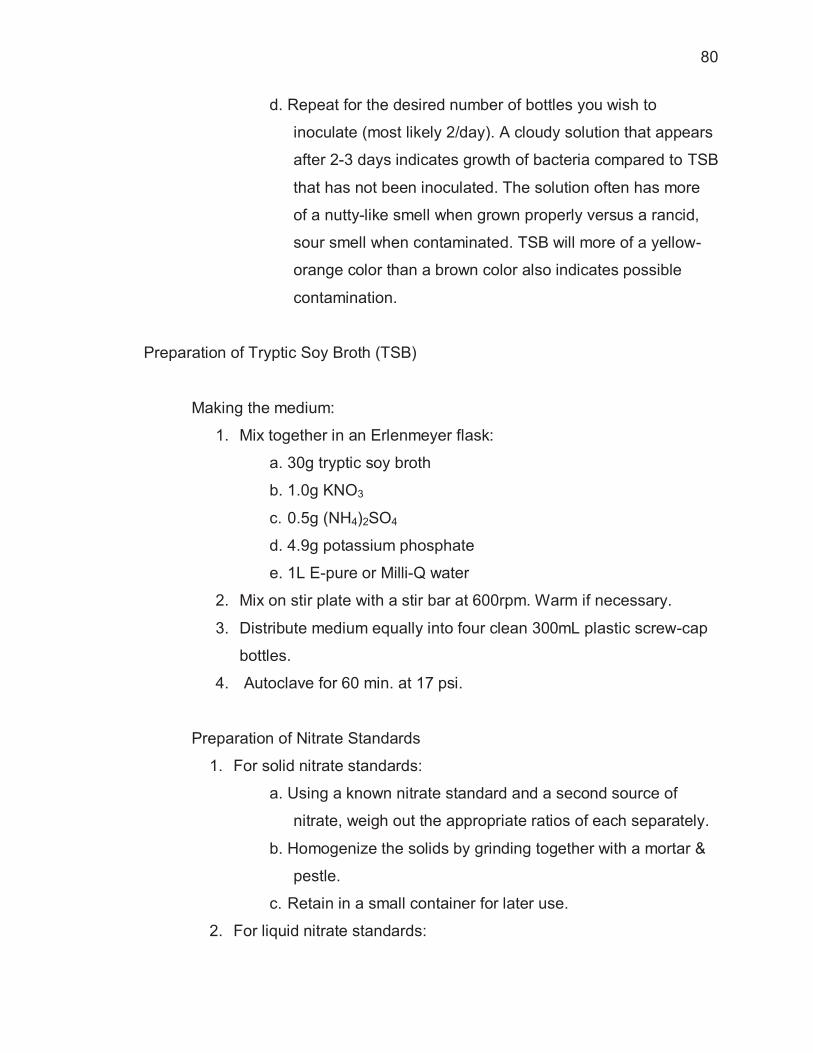
80
d. Repeat for the desired number of bottles you wish to
inoculate (most likely 2/day). A cloudy solution that appears
after 2-3 days indicates growth of bacteria compared to TSB
that has not been inoculated. The solution often has more
of a nutty-like smell when grown properly versus a rancid,
sour smell when contaminated. TSB will more of a yellow-
orange color than a brown color also indicates possible
contamination.
Preparation of Tryptic Soy Broth (TSB)
Making the medium:
1. Mix together in an Erlenmeyer flask:
a. 30g tryptic soy broth
b. 1.0g KNO3
c. 0.5g (NH4)2SO4
d. 4.9g potassium phosphate
e. 1L E-pure or Milli-Q water
2. Mix on stir plate with a stir bar at 600rpm. Warm if necessary.
3. Distribute medium equally into four clean 300mL plastic screw-cap
bottles.
4. Autoclave for 60 min. at 17 psi.
Preparation of Nitrate Standards
1. For solid nitrate standards:
a. Using a known nitrate standard and a second source of
nitrate, weigh out the appropriate ratios of each separately.
b. Homogenize the solids by grinding together with a mortar &
pestle.
c. Retain in a small container for later use.
2. For liquid nitrate standards:

81
d. Measure out 840�g (0.84mg) of a 100nmol NO3- standard on
a microbalance from the solid stock container prepared
above.
e. Deliver to a 100mL volumetric flask, add water to the mark,
cover with Parafilm, and invert solution many times to mix &
dissolve.
f. Aliquot into single-use (daily) containers and label
appropriately. 15mL centrifuge tubes work well for this.
Harvesting Tryptic Soy Broth for Analysis
1. Concentrating Culture by Centrifugation:
a. Centrifuge the fully grown inoculated solutions from two
plastic screw-cap bottles for 7 min. at 3000rpm, forming a
pellet of bacteria on the bottom of the bottle.
b. Decant off supernatant liquid from each of the two bottles
into a waste jar to be autoclaved and disposed.
c. Add 1 drop of Antifoam B to a bottle of TSB Rinse (prepared
without KNO3).
d. Add 50mL TSB Rinse to first centrifuged bottle, cap, and
shake vigorously until pellet has redissolved.
e. Transfer resuspension liquid from the first shaken bottle into
the second bottle (which has also been decanted) and re-
dissolve bacterial growth again by shaking.
g. To the first bottle, add 50mL water to balance out the
centrifuge.
h. Centrifuge remaining bottle for 7 min. at 3000rpm.
i. Decant off supernatant into waste jar.
j. Repeat steps d, e & g for a second rinse.
k. Refill to bottle with remaining TSB Rinse and shake to re-
suspend solution. Add more TSB Rinse from a second
bottle if a larger volume is desired.

82
l. Purge with helium in glass bubbler for 2 hrs.
m.Pour remaining solution into a sterile125mL glass bottle and
cap with septum. Flush for 5 min. with helium. Let set
overnight.
2. Addition of Nitrate Standards to Bacteria:
a. Add 1 mL prepared bacteria solution to the desired number
of 12 mL vials (via pipet) then cap with septum screw-caps.
b. Flush vials for 5min. with helium gas at ~40mL/min.
c. Aliquot 1mL of nitrate standards into bacteria vials for
analysis (via 3mL disposable syringe and needle).
d. Let bacteria and nitrate react for 60 minutes. More
concentrated standards will need to react longer (i.e. 2
hours).
e. Lyse the bacteria by aliquoting 0.5 mL 1% NaOH to each vial
via disposable syringe (without removing the cap).

83
Step-by-Step Preparation for Isotopic Analyses
of Nitrate via Headspace Extraction

84
Peak Simple 388-32bit Program Instructions
Open Peak Simple Program from the Desktop.
Click OK if the intro. window pops up.
Click File, Open Ctrl File, then select appropriate file
(usually headspace with heat.con), Open.
Click File, Save all.
Click Edit, Channels, Channel 1: Events, to ensure
the appropriate event has loaded (usually
headspace N2O.evt). Click OK to exit.
Click Channel 1: Details,
confirming the appropriate end
time. Click OK to exit.
Click View,
Relays/PumpWindow.
The focus and collect traps
should be raised so that both A
& B boxes are white.
Click box C as necessary to
connect the 4-port valve to the
appropriate ports: 1-2 & 3-4 or 1-4 & 2-3. This is written
on the side of the valve. (For headspace N2O, box C is
set to black at start.)
Click box G to black.

85
Peak Simple Instructions cont.
Click View, Autosampler, Add,
select the appropriate control file
(usually headspace with heat.con).
Verify proper files are loaded. Click
OK.
The Batch reprocessing mode box
should be left un-checked.
Select Wait for remote start and
Restart at end box. Click Start.
Summary of Event file: C:\Peak388-32bit\headspace N2O.evt:
Time(min) Event Detail 0.050 B ON (collect trap) Collect trap lowers into liquid N2 0.100 D ON (autosampler) Autosampler needle moves, inserted in next
vial 0.130 D OFF (autosampler) Stops autosampler needle movement,
remains in vial 3.400 A ON (focus trap) Focus trap lowers into liquid N2, cools,
collects sample gas
5.300 G OFF (Valve10 load(w)) Connects valves 2-3, 4-5, 6-7, 8-9, 1-10 10.500 B OFF (collect trap) Collect traps raises, warms, sends collected
gas to focus trap 12.000 D ON (autosampler) Autosampler needle moves to vial in rack
position #1 12.300 D ON (autosampler) Stops autosampler needle movement,
remains in vial 14.800 G ON (Valve10 inject(b)) Connects valves 1-2, 3-4, 5-6, 7-8, 9-10 14.900 A OFF (focus trap) Focus trap raises, warms, sends gases to
GC, Coldtrap, IRMS

86
Instructions for Gilson Autosampler 222XL Liquid Handler
Beginning from the top left of the Autosampler
rack (with the handle facing you), place two
100ppm N2O flushed vials in positions 1 & 2
(position 2 is below position 1, not to the right
of 1).
Place vials to be analyzed from positions 3 & on.
Place two 100ppm N2O flushed vials in the
following two slots after all others have
been positioned.
To set the Autosampler:
Using File 2, press Run.
First vial? 1 Press enter if starting with
vial in position #1 on rack. Otherwise,
type in starting position.
Nb vials? 132 – Leave this as is – Press
enter.
Press stop at any time to cancel automation.
Instructions for Physical Set-up of IRMS
Plug in the liquid N2 supply dewar white cord to outlet via timer.
Set timer.
For instructions, see manual provided with timer.

87
Instructions for Physical Set-up of IRMS cont.
Disconnect autosampler needle, rinse with water daily
(scrub with toothbrush if needed).
Wipe the holder with ethanol & WD-40 weekly.
Reconnect needle with reverse connections and
purge with He at 100mL/min for 3-5 min. Connect
properly & adjust to appropriate height, use
Autosampler commands to insert into a vial, wait
for He flow to equilibrate.
Set the flow of He gas in to 30mL/min.
Absorb excess H2O from empty dewar (daily, if possible,
but at least once a week).
Replace water drip vial if wet (daily). Disconnect
Carbosorb & Mg(ClO4)2 traps (weekly), remove wet
solids, and replace with dry as needed.
Adjust valve as necessary to direct flow to proper
place (normally turned to headspace).

88
Instructions for Physical Set-up of IRMS cont.
Connect proper capillary (N2O or
N2/O2) to Open Split.
Set system pressure to P=12-15psi
(N2O) or
P=24 (N2/O2).
Rotate the conflo inlet L-valve
counterclockwise to allow sample
to flow from Open Split to IRMS.
(Vacuum should read 10-6 not 10-8)
Fill main supply liquid N2 dewar as needed
(M-Th 9a, F 9a & 2p).
Connect liquid N2 union to tank, open blue valve
one full turn.
Use on/off switches to control flow to cryofocus
traps (dewar) and -80�C coldtrap.

89
Isodat Acquisition Instructions
Open Isodat Acquisition Program from the
Desktop.
At the very bottom left-hand corner, select
desired interface and gas configurations from
the drop-down windows (commonly Split Test2
and N2O).
Check source (Voltage & Emission lights on
front of MS should be green). If the values for
Box and Trap read zero, the source is not on.
Click the red laser under to enable the ion
source.
Open the L-valve located on the top of the MS.
(You should see the vacuum pressure lower
from 10-8 to 10-6.)
In the Greg Split window, lower the N2O
reference gas by clicking the top purple bar so
that it disappears.
Open the Focus Delta window by clicking the
down arrow. Right-click in the Focus Delta
window, select Autofocus to tune the beam,
click OK, and wait to finish. Right-click in the
same window again, and select, Pass to Gas
configuration. (This should be done daily.)

90
Isodat Acquisition Instructions cont. Under the File Browser mini-window, click Method tab, and choose the desired
method (N2O bacteria.met). Next, click Sequence tab, and choose the desired
sequence (headspace bacteria.seq).
Begin by inserting or deleting the appropriate number of rows based on the
number of samples to be run. To add more, click Insert and add the desired
number to be added into the count box and click OK. If there are excess,
highlight the desired number of rows and click Delete.
Starting with Row 1, type the appropriate name and any other designating
information under the Identifier 1, Comment, Preparation, and Method columns. It
is only necessary to type in this information once all samples are the same.
When finished, click once on the text for the Identifier 1 box in Row 2 to highlight.
Next, right-click the Identifier 1 tan box and select Fill Grid with Data. (This
automatically fills in the desired information). If more sample identifiers are
needed, manually name each box under the column separately or select multiple,
separate boxes. If you wish to name a block of rows with the same name,
highlight the desired rows, right-click, select Fill Grid with Data. Repeat as
necessary. Check that all samples in racks match up with the row number on
screen. If correct, click and highlight Row 1, click Insert, Top of Selection, type in
1, OK. Type VOID into Identifier 1 column. Click once on the comment box to
highlight entire column and right-click to select Fill Grid with Data. Repeat for
Preparation and Method columns.
Click once in the tan Row box in the top left corner to highlight all samples. Next,
click the green Start arrow when ready to run samples. (See other instructions
before clicking Start.)

91
Isodat Workspace Data Access Instructions
Open Isodat Workspace to see individual scans of each sample when they are
finished. As with Acquisition, the appropriate interfaces (i.e. Split Test and N2O)
must be selected.
Under the File Browser window, click the Results tab. You may need to double-
click the return arrow (�) and scroll down to select the folder that you entered into
File Name. Double-click the file name and select the data you wish to view.
When the entire run is complete, click on the Results tab in the File Browser to
analyze data using Excel. Double-click the folder name of the chosen file and the
right-click on the Excel folder and select Launch Explorer. Select the name of the
chosen Excel file you wish to view.
Data Processing Instructions in Excel
With the spreadsheet open, highlight all columns starting with Column C and
continuing to the right and down, selecting all data from this point. Locate the
yellow exclamation point, click Convert to Number.
Select All, click Data, Sort, Rt, and delete the first reference peaks, 1, 2, and 3,
based on their respective retention times and the last two reference peaks as
well, usually peaks 6-7, but choose this based on retention times as well
(Rt~800-900s).
Select All, click Data, Sort, d18O/16O, and delete O2 peaks that can by identified
by unusually large (3 digit) values.
Select All, click Data, Sort, Identifier and Row. Then, arrange data as you wish.